loxley-opp day q2'12 20 aug v3€¢the 400 ton per day integrated municipal solid waste...
TRANSCRIPT

Opportunity DayQ2’2012
LOXLEY PUBLIC COMPANY LIMITED
August 20, 2012
"Inspired Choice for Customers, Business Partners and Investors"
August 20, 2012

1. Business and Revenue Structure
2. Financial Highlights Q2’2012 and Overview Y2012
3. Order Backlog and Project Highlights
2

•Established in 1939
•Loxley Group : about 30 activecompanies
•Listed company in SET100
•Last 5-year revenues : THB10,000-14,000 million/Year
“LOXLEY”
3
ICT & Project
Trading Business
Joint Venture Business
Service Business

Conglomerate Business
Diversification can generate a business
balance
73 Years experience
with
Jewel InvestmentsStrong and stable
Loxley’s
LOXLEY’s Key Drivers
4
with
Respect customers and business partners
Network
Synergy
Loxley’s Group
Strong Financial Leverage
Matching source and use of fund
Strong and stable contributions from
“JV”Loxley’s
Key Drivers

ICT & Project (Project Base) Trading
CO. & Subsidiaries
Technology
Service
Associates
Business and Organization Structure
ICT Project
5
MVNO
Loxley Global (LPC 51%)
Loxley Gtech(LPC 18%)
25% 40% 50% 40% 30% 45% 51%
33%
Start COD :
Dec 2011
PCC

ICT & Project
Trading Business
Business Overview
Transmission Line 3G NetworkElectronic Toll
Collection
Cable Submarine Network
Broadcast
Power Substation
6
Project Business
Joint Venture Business
Service BusinessLocomotive
Dipping Sonar System
Security Solution Services

Revenue Structure (2007-2011)
ICT &
Project,
62%
Trading,
33%
Service,
6%
2011’s Revenue Structure
ICT Trading
Service
Annual Revenue
5,766 5,122 5,241 5,310
8,730
4,320 4,482 4,224 4,303 4,617
547 554 611 668 780
10,633 10,158 10,076 10,281
14,127
37%
THB’Million
7
ICT Trading
Service
JV
2007 2008 2009 2010 2011
ICT & Project Trading Service Total
Equity Profit from AssociatesTHB’Million
1,192 1,086
996 1,173 1,215
268 208
314 357 376
21,287
22,803
14,834
16,646
20,279
-
5,000
10,000
15,000
20,000
-
200
400
600
800
1,000
1,200
1,400
1,600
2007 2008 2009 2010 2011
Revenue
Equity profit
Profit
2011’s Equity Profit Structure
BP Castrol,51%
Blue Scope Steel, 37%
Oriental Post, 7%
Blue Scope Lysaght, 3%
Others, 2%
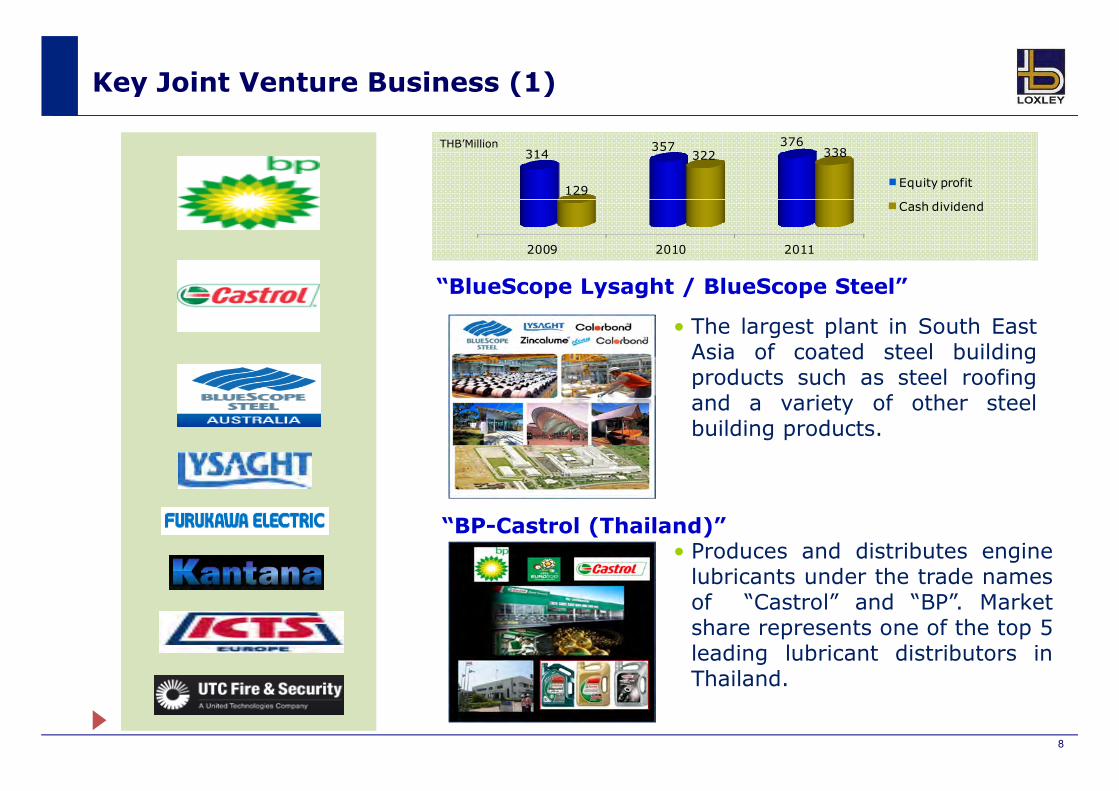
“BlueScope Lysaght / BlueScope Steel”
• The largest plant in South EastAsia of coated steel buildingproducts such as steel roofingand a variety of other steel
Key Joint Venture Business (1)
Equity profit
Cash dividend
THB’Million
2009 2010 2011
314357 376
129
322 338
8
and a variety of other steelbuilding products.
“BP-Castrol (Thailand)”• Produces and distributes enginelubricants under the trade namesof “Castrol” and “BP”. Marketshare represents one of the top 5leading lubricant distributors inThailand.

Background
• Manufacturing steel since 1915
• Headquartered in Melbourne, Australia
• World’s largest manufacturer of ZINCALUME steel with strong brands
Capacity
• Cold rolling facility of 400,000 tonnes
Key Joint Venture Business (2)
“BlueScope Lysaght / BlueScope Steel”
9
• Cold rolling facility of 400,000 tonnes
• Two metallic coating lines of 375,000 tonnes
• Painting operating of 90,000 tonnes

1. Business and Revenue Structure
2. Financial Highlights Q2’2012 and
Overview Y2012
3. Order Backlog and Project Highlights
10

Financial Highlights – 2Q12 and 1H12
THB Million 2Q11 1Q12 2Q12 1H11 1H12Sales 3,402 3,448 3,399 5,955 6,847
Costs 2,871 2,963 2,915 5,026 5,878
Gross profit 531 485 484 929 969
Selling & admin expenses 443 455 508 871 955
EBIT before Equity profit 112 83 (1) 109 83
Equity profit from associate 90 157 153 285 310
EBIT 202 240 152 394 393
“1H12, Continuing increase in sales but also increase in expenses due to business development activities”
11
EBIT 202 240 152 394 393
Finance cost 35 49 65 67 114
Income tax 44 30 18 55 48 Net Profit 111 165 67 254 232
Key Financial Ratio
% Gross Margin 16% 14% 14% 16% 14%
% SG&A/Sales 13% 13% 15% 15% 14%
% Net Margin 3% 5% 2% 4% 3%

Revenue
1Q12 VS 2Q12
• Slightly decreased due to a progressivedecline in 3G network installment
1H11 VS 1H12
• Significantly increased due to 2 megaprojects i.e. 3G and CSN
1%
15%
Revenue and EBIT – 2Q12 and 1H12
3,402 3,448 3,399
5,955
6,847
2Q11 1Q12 2Q12 1H11 1H12
Revenue
THB’Million
12
EBITEBIT
1Q12 VS 2Q12
• Decreased due to
– a drop in sales as 3G’s revenue wasunder target by 30% and,
– a hike in SG&A caused by new businessunit and new project developments
1H11 VS 1H12
• Slightly decreased as SG&A was up
36%
0.3%
2Q11 1Q12 2Q12 1H11 1H12
202 240
153
394 393
2Q11 1Q12 2Q12 1H11 1H12
THB’Million

Equity profit
2Q11 VS 2Q12
• Significantly increased due to the improvedperformances of BP Castrol and BlueScope Steel
• Associates’ ability to maintain the profit in bothQ1 and Q2 of 2012 of more than THB 150million.
1H11 VS 1H12
• Increased due to the improved performances of
70%
9%
Equity Profit and Net Profit – 2Q12 and 1H12
Equity Profit
90
157 153
285 310
2Q11 1Q12 2Q12 1H11 1H12
THB’Million
13
• Increased due to the improved performances ofBP Castrol and BlueScope Steel
• Also, L-Solar One commenced a full operationand its performance achieved target
Net profit
• Both quarterly and half yearly net profitdecreased as some parts of revenue recognitionwere inevitably postponed when there was aprogressive decline in 3G installment.
Net Profit
111
165
67
254 232
2Q11 1Q12 2Q12 1H11 1H12
THB’Million

Consolidated Balance Sheet•Cyclical incremental inworking capital both inassets and liabilities
oCommencement of 2 megaprojects
oPile-up A/Rs and inventories
oAdditional project financeand short-term loans
Temporary increase in D/E
4,502 4,405
1,6611,604
7,807 6,185
5,084 4,962
8,885 7,233
Assets Liabilities &Equity
Assets Liabilities &Equity
1H2012 Y2011
Financial Status – 2Q12 and 1H12
14
oTemporary increase in D/Eratio
1H2012 Y2011
Shareholders' equity Non current liabilities Current liabilities
Non current assets Current assets
1H2012 Y2011 Change
Current assets 8,885 7,233
Non current assets 5,084 4,962
Total assets 13,970 12,194 15%
Current liabilities 7,807 6,185
Non current liabilities 1,661 1,604
Total liabilities 9,468 7,789 22%
Shareholders' equity 4,502 4,405 2%
Current ratio 1.1 1.2
D/E ratio 2.1 1.8
BV per share (THB) 2.3 2.2
Return on Equity 6% 7%
THB Million Consolidated

4,648
1,838
ICT & Project
Trading
Core Business
•Current backlog 8,159 MB (45 % will be 2H12 revenue)
•New project (high potential)
1H12 Revenue 2H12 “Key Drivers”Expected growth
•“Strong Client Base” in consumer and chemical products
•Construction material group: “Roof work for station start”
•New Business “Food”: Full operation from 5 branches
Outlook Y2012
15
•Strong performance of key associates (BST & BP)
•Continuing income (Equity profit) from renewable business, “L Solar 1”
310
Service
Expected growth 10-1
2%
Expected
growth
35-4
0%Joint
venture
1H12 Equity profit
•New Business “Food”: Full operation from 5 branches
361 •Strong revenue base from “Contract with AOT”
•New customer base from “Airline and Cargo”

1. Business and Revenue Structure
2. Financial Highlights Q2’2012 and Overview Y2012
3. Order Backlog and Project Highlights
16

Order Backlog
Backlog Summary THB Million
Backlog - 31/12/11 9,797
New Backlog (Jan-Jun 2012) 2,277
Less Invoicing (Jan-Jun) 3,915
Current Backlog 8,159
Major Projects
NorthNortheast
“3G” “CSN” “NEdNet”
17
Central
South
Construction and installation of 3G “TOT”
5,600 MB.
May 2011- Dec 2012
Y2011-39%Y2012-61% or 3,400 MB
Design, Supply and Installation of Optical Fiber Cable 1,340 km.
2,527 MB.
Aug 2011 – Sept 2012
Y2011-17%Y2012-83% or 2,200 MB
Installation of Optical Fiber Cable-MOE
1,036 MB.
Jan 2012 – Sept 2013
Y2012-22%Y2013-78%
Type
Project Value
Project Period
ProjectStatus

New Backlog 1H12
Optical Installation for 3G Purple Line - Lysaght HW / SW Applications
659MB
384 301
NEW BACKLOG 2,277 MB.
MB MB
“Continuous awarded projects in the pipeline with 2,277 MB new backlog in 1H12”
18
ADM / ATM Geographic Application Substation
Replacement Radio Transmission 7 Networks
Water Installation & PipeWorks
Other Projects
286 158 120
115 93 184
MB MB MB
MB MB MB

High Potential Projects
•Concession for electricity dam construction in Laos
•2 projects of transmission line in Laos with capacity of 230-115 and 500 kV
Dam Construction Transmission Line
“High potential projects to stimulate further revenue 2H12 and 2013”
19
High Potential
13,000 MB.
construction in Laos
•Small and large dam with capacity of 3-10 MW and
50-60 MW
line in Laos with capacity of 230-115 and 500 kV
•On process to final deal
•Substation project for PEA and MEA, 115 kV and 115-24 kV
•Status-waiting for E-Auction
•The 400 ton per day integrated municipal solid waste management project
•On process to final deal
Substation Kompogas

Project Highlights-Online Lottery (1)
เดลนิิวส์ 14 สค. 55 Primary Data Center
Less than 8 seconds
Terminal
20
ขา่วหุ้น 16 สค. 55
โพสตท์เูดย ์ 14 สค. 55
• 6,700 terminals had been already installed through all provinces, testing process (3 times of Soft launch) was done.
• Current Status : On the process of Terminal, Software and Network review
Back up Data Center

Project Highlights-Online Lottery (2)
Lottery operated by GLO
• Purchase/round (2 round a month) 2,800-3,200 MB. or 70-80 million bets/round
• LGT’s revenue 0.75 Baht per bet, or revenue at 1,200-1,500 million/year
• Contract period : 5 years
Financial Forecast
21
906
1,362
1,607
2,025
2,829
Y2003 Y2004 Y2005 Y2006 Y2007
Purchase/Round
• Contract period : 5 years starting from the operation date (Able to extend for 3 years ( 3 times, 1 year/time)
Purchase/Round :THB Million

Thank you
22
Investor RelationsContact Person : Boonlert JaimunTel: 66 (0) 2348-8141 Fax: 66 (0) 2348-8614E-mail: [email protected]
Loxley Public Company Limited102 Na Ranong Road, KlongToeyBangkok 10110, Thailandwww.loxley.co.th