mac - ibm · chairman’s letter ibm’s gross profit margin rose for the third consecutive year...
TRANSCRIPT

cyan mag yelo black
MAC
Dear IBM Investor: I am happy to report to you on a very strong year for our company. In my letter last year, I said that we believed we had positioned ourselves to capture the most attractive growth and profit opportunities in our industry. In 2006 we did just that, setting new records in profit, earnings per share and cash performance.
What our numbers do not reveal — and what is perhaps IBM’s most notable accomplishment during this period — is that we achieved these results while fundamentally reshaping our company. Whether you look at our technology, strategy, business model, processes or culture, IBM is a very different enterprise today than it was at the beginning of the decade. We have prepared the company for growth and leadership in a radically different future — while continuing to deliver steady results.

black match blue CG10
MAC

�
Chairman’s Letter
IBM’s gross profit margin rose for the third consecutive year — to 41.9 percent, an increase of 1.8 points in 2006, up more than five points since 2003. Our pretax income margin rose to 14.6 percent, an increase of 1.2 points. Both margins are at their highest in the past 10 years. Significantly, as I will discuss, they were achieved primarily by remixing our business to higher-value segments and by driving efficiency through global integration.
In many respects, IBM is a “higher-torque” engine today. With revenue growth that matches our segments of the industry, we have been able to generate strong profit and cash. In 2006 we generated net cash from operations, excluding a year-to-year change in Global Financing receivables, of $15.3 billion — an increase of $2.2 billion from last year and our highest on record. In addition, net cash generated from every dollar of revenue has increased 18 percent since 2003. IBM ended 2006 with $10.7 billion
of cash and marketable securities. And of course, stronger earnings and cash give us more flexibility to increase returns to you and to invest in future sources of growth.
Our net 2006 cash investment of $3.8 billion for 13 acquisitions — nine of them in key strategic areas of software — was up $2.3 billion year to year. After investing $6.1 billion in R&D and $4.7 billion in net capital expenditures, we were able to return a record of nearly $9.8 billion to you — $8.1 billion through share repurchase and $1.7 billion through dividends — or more than 100 percent of our net earnings. In April 2006 we announced a 50-percent increase in our quarterly dividend, the largest percentage increase in IBM history and the 362nd consecutive dividend paid by IBM. This was the 11th year in a row in which we have increased our dividend. Our balance sheet remains strong, and the company is well positioned to take advantage of new strategic opportunities.
IBM had a strong year in 2006. Revenue as reported was $91.4 billion, up 4 percent, excluding PCs from our 2005 results. Pretax earnings from continuing operations were $13.3 billion, an increase of 9 percent. Diluted earnings per share from continuing operations were $6.06, up 23 percent, marking 16 straight quarters of growth. IBM has consistently generated return on invested capital significantly above the average for the S&P 500 over the past several years, and we did so again in 2006, with ROIC of 34 percent, excluding our Global Financing business.
cyan mag yelo black
MAC

� 2006 Annual Report
Strategic choiceSIn order to understand how we achieved these results, I think it is helpful to look back to the major strategic choices we made several years ago. They were by no means obvious at the time, and most IT companies chose different paths. But as we entered the new century, we were convinced that three developments would be of paramount importance to IBM and our clients:
1. We believed that our clients would place a premium on innovation. What technology company doesn’t say it’s all about innovation? But if you really take this seriously, then you have to commit your company to continuous adaptation and change. Such is the nature of our industry, and many IT companies learn that lesson the hard way. Today, it’s clear that computing is radically changing — from the data center and the network to the proliferation of technology into the home, appliances, vehicles and the infrastructure of the planet. And it’s equally clear that businesses and institutions worldwide now look to innovation as their key to competitive differentiation and growth.
To capture the most valuable opportunities, we’ve had to change our mix of products, services, skills and technologies. This is why we’ve exited businesses like PCs and hard disk drives, and why, through a combination of internal R&D shifts and acquisitions, we have substantially strengthened our position in emerging, higher-value spaces, such as service-oriented architecture (SOA), information on demand, business process services and open, modular systems for businesses of all sizes.
2. We believed that both our industry and our clients would seek to reintegrate. But it would not be integration as in the past — product bundling, “turnkey” solutions or consolidation of industry segments. Instead, businesses would increasingly seek to integrate advanced technology with their business processes and operations, even their core business model. Why? Because this kind of integration would make them both more productive and more innovative. It would give them differentiation and com-petitive advantages they could not get from off-the-shelf technology and solutions. Conceptually, this is an ideal role for IBM to play — the “innovators’ innovator.” But since this kind of integration requires intimate knowledge
of each client, it cannot be done in the lab or on the plant floor, and it certainly can’t be done in headquarters. It has meant an ongoing effort to change our processes and structures to push decision making close to the marketplace — what we internally call “lowering the center of gravity” of IBM.
3. We believed that globalization would fundamentally change business. Because of free trade policies, the Internet and the emergence of highly skilled populations, we believed that globalization would arrive in full force — and with it the reality that anyone could capitalize on expertise and market conditions everywhere in the world. We believed this opportunity would soon become an economic imperative: Businesses, institutions, industries and societies would need to adapt to the changing environment. One important aspect of this was a change in the form of the corporation itself. The “multinational” of the 20th century was evolving into a new kind of institution, the globally integrated enterprise — which locates its operations and functions anywhere in the world based on the right cost, the right skills and the right business environment. We committed ourselves to becoming a model of this new form, and we have begun transforming IBM’s operations accordingly, tapping into skills and expertise available all over the world and integrating our operations globally. We have also begun a promising dialogue with our clients and with government, business and academic leaders around the world to explore the potential of global integration for economic and societal progress.
As a result of these strategic choices and actions, IBM’s business model today is not only more aligned with our clients’ needs, but is also a stronger engine of financial performance. That was evident in 2006. Our innovation-driven strategy and financial model are also putting us in a favorable position relative to our competitors within each area of our business mix.
BuSineSS Mix and reSultSSome of IBM’s competitors — those who are not as focused, do not have the financial capacity to invest, or are trying to straddle commodity and higher-value businesses — are struggling to deal with the changes underway today. As we
Chairman’s Letter
black
MAC
2718

�
Samuel J. Palmisano — Chairman, President and Chief Executive Officer
cyan mag yelo black
MAC

� 2006 Annual Report
results from continuing operations
revenue(Dollars in billions)
income(Dollars in billions)
2005 performance includes results from four months of the IBM PC business, which was divested on April 30, 2005.
0
81.2
02
89.1
03
96.3
04
91.1
05
91.4
06
20
40
60
80
$100
have learned, it’s better to be in businesses that are truly differentiating in the eyes of the client than to go simply for size, volume and thin margins — where the client doesn’t receive unique value, and the investor doesn’t benefit.
This is why we have entered new, more attractive spaces, through acquisition and by redirecting our R&D investments. Let me describe how these shifts are impacting each of our major businesses.
• Software: In the world of software, we are witnessing a shift toward new architectures and the componentization of applications. This new model, inherently networked and based upon open standards, enables different business designs and the horizontal integration of business processes. Within the enterprise, its main impact is occurring at the level of middleware. Because we began years ago to build a position as the worldwide leader in middleware, IBM is now uniquely able to capitalize on it.
IBM’s software segment revenues totaled $18.2 billion in 2006, an increase of 8 percent. Software generated 40 percent of IBM’s segment pretax profits. We are recognized as the industry leader in SOA . The information on demand practice we launched in 2006, grouped under Information Management, grew 68 percent. Our acquisition of companies such as FileNet, MRO and Micromuse enhanced our growth in information and systems management. Our industry-leading WebSphere family grew 23 percent for the year, with particular
strength in application servers and business integration. Rational software tools grew 4 percent, and Tivoli 26 percent. Our Lotus division — which introduced well-received Web 2.0-enabled collaboration tools for the enterprise in early 2007 — grew 12 percent. We will be expanding our software offerings in 2007 to move beyond one-on-one and team collaboration — introducing tools that build communities of expertise.
• global Services: The global services industry is being reshaped by two trends. The first is the emergence of a new services model, based on the integration of software and services, and the breaking-up of formerly monolithic business processes into components that can be delivered over the Web. IBM Global Services is leading the industry in the development of business componentization and the technology enablement of business processes. The second trend is a shift to smaller deals of shorter duration, higher profitability and more industry-specific focus. While our transition to this model experienced some hiccups initially, we are making steady progress and saw solid growth in short-term signings in 2006.
IBM remains the leading IT services company in the world, with more than twice the revenue of our nearest rival. Revenues from our two Global Services segments in 2006 totaled $48.3 billion, an increase of 2 percent. Services’ share of IBM’s segment pretax profits increased to 37 percent. Revenues from the Global Technology
0
4.2
02
6.6
03
7.5
04
8.0
05
9.4
06
2
4
6
8
$10
Chairman’s Letter
cyan yelo black
MAC
2718

�
innovation and gloBal integrationIBM’s lines of business work together in a model defined by innovation and global integration, the twin imperatives that we believe are reshaping business and society in the 21st century. This ability to both innovate and integrate — and do so in ways that are truly global — is unique to IBM, and sets us apart from our competition.
Last year was in many ways the culmination of our repositioning of IBM as an innovation company. Its most visible manifestation was our marketing and communications campaign around the theme, “What makes you special?” Of course, marketing campaigns by themselves are of little importance — unless they persuade the world of an underlying reality that is substantial and meaningful. Ours did, supported by a long list of clients whose innovation potential we have unleashed through unique solutions. It was also supported by the continued preeminence of IBM’s research and development capabilities, reflected in our 14th straight year of earning by far the most U.S. patents of any company in the world.
Our ability to deliver differentiating innovation to our clients is being greatly enhanced by IBM’s global integration — which is simultaneously giving us better economics and deeper capabilities, while eliminating enormous redundancies that were built up over 50 years as a multinational. IBM operates in 170 countries, with about 65 percent of our employees outside the U.S., including 30 percent in Asia Pacific. Our non-U.S. operations generate about 60 percent of IBM’s revenue.
IBM’s research and software development have long been globally integrated. The company’s R&D system assigns work among our 20,000-plus software developers in 61 labs in 15 countries, and 3,000 scientists and technologists in IBM Research centers in the U.S., China, Israel, Switzerland, Japan and India, based on areas of unique expertise.
In 2006 we expanded our global delivery centers, where talented IBMers support the full range of our clients’ applications and business transformation initiatives. We added thousands of skilled people and improved our capabilities in India, Brazil and Argentina, as well as Eastern Europe and multiple other locations in Asia. We have moved our global procurement mission to China and many of the services that support our external and internal Websites to places like Brazil and Ireland. Our financing back office is in Rio de Janeiro. These IBMers are not leading teams
Services segment totaled $32.3 billion, an increase of 3 percent. Revenues from the Global Business Services segment were essentially flat at $16 billion, but improvements in utilization, pricing, contract management and delivery optimization enabled it to grow its pretax margin by 2.7 points, to 9.8 percent, excluding 2005 special actions. IBM Global Services is ranked as the number one or number two service provider in consulting, systems integration, maintenance, Web hosting, application services and data center outsourcing. With a strong finish to the year — the fourth quarter, with nearly $18 billion in signings, was our largest since the second quarter of 2002 — we ended 2006 with an estimated backlog of $116 billion.
• Systems and technology: IBM is the world leader in servers, and is leading a number of key changes in the industry, including shifts to multicore microprocessors, to high-end virtualized systems, and to the new category of modular systems known as blades. In 2006 we rolled out systems based on the new generation of our Power Architecture family, POWER5+; introduced the System z Business Class mainframe, targeting smaller firms; and extended our virtualization and energy management capabilities.
Our systems and technology business extended its industry leadership in 2006, with segment revenues of $22 billion, an increase of 5 percent. Global Financing segment revenues totaled $2.4 billion, a decrease of 2 percent. Our System z mainframes had a strong year, growing 8 percent and marking their sixth consecutive quarter of increased shipments of MIPS (millions of instructions per second). Our system storage business was up 6 percent for the year, and our microelectronics business continued to grow, increasing 22 percent for the year, thanks to our position as the technology engine for all three major gaming platforms. Systems and Technology Group and Global Financing accounted for 23 percent of IBM’s segment pretax profit in 2006.
The hard work we’ve done to remix our businesses to lead in these emergent, higher-profit spaces is now showing up in our earnings and gross profit margins. But a changed business mix is not the only factor causing IBM’s strong performance.
black
MAC
2718

� 2006 Annual Report
�. and we decided to become a globally integrated enterprise, in order to improve iBM’s overall productivity and to participate in the world’s growth markets.
�00� revenue by geographic region(Excludes OEM)
�00� employee Population by geographic region
�00� iBM revenue growth(Excludes PCs)
Brazil . . . . . . . . . . . . . . . . . . . . . . . . . . . . . . . . . . . 19%
China . . . . . . . . . . . . . . . . . . . . . . . . . . . . . . . . . . . 16%
India . . . . . . . . . . . . . . . . . . . . . . . . . . . . . . . . . . . . 38%
Russia . . . . . . . . . . . . . . . . . . . . . . . . . . . . . . . . . . 21%
total . . . . . . . . . . . . . . . . . . . . . . . . . . . . . . . . . . . . ��%
EUROPE,MIDDLE EASTAND AFRICA ASIA PACIFIC
AMERICAS
35% 20%
45%
EUROPE,MIDDLE EASTAND AFRICA
ASIA PACIFIC
AMERICAS
25% 30%
45%
37%
23%
40%
SERVICES
SYSTEMS AND FINANCING
SOFTWARE
Generating Higher Value at IBM
Value was shifting in the IT industry, driven by a new computing paradigm, new client needs and the rising tide of globalization .
• Change in computing architecture was rippling across the data center and the network, to a proliferation of technology infused into all aspects of work and life .
• Companies were seeking to integrate advanced technology with their business processes and operations, not primarily to reduce costs, but to enable innovation and growth .
• Enterprises and institutions were looking to tap into skills and expertise available all over the world and to integrate their operations globally .
�. Several years ago, we saw change coming.
We exited commoditizing businesses like PCs and hard disk drives, and strengthened our position in areas like service-oriented architecture (SOA), information on demand, business process services and open, modular systems for businesses of all sizes . This has changed our business mix toward higher-value segments of the industry .
IBM operates in 170 countries, with about 65 percent of our employees outside the U .S ., including 30 percent in Asia Pacific . Our non-U .S . operations generate about 60 percent of IBM’s revenue .
Over the next four years, IBM expects the IT markets in Brazil, China, India and Russia to grow revenue at more than two times the worldwide rate, creating a market opportunity of more than $150 billion by 2010 .
�. We remixed our businesses, to move to the emerging higher-value spaces.
�00� Segment Pretax income Mix
cyan mag yelo black
MAC
2718

�
0
2.43
02
3.76
03
4.39
04
4.91
05
6.06
06
1
2
3
4
5
6
$7
�. as a result, iBM is a higher-performing enterprise today than it was a decade ago. our business model is more aligned with our clients’ needs and generates better earnings, profits and cash.
record earnings per share . . .Pretax earnings from continuing operations were $13 .3 billion, an increase of 9 percent . Diluted earnings per share were $6 .06, up 23 percent, marking 16 straight quarters of growth .
41.940.1
36.936.536.6
0605040302
14.613.411.110.6
7.2
0%
40%
50%
10%
20%
30%
10.5
02
6
8
2
4
10
12
14
16
$18
0
12.6
03
12.9
04
13.1
05
15.3
06
We have achieved record profit . . .The company’s gross profit margin and pretax income margin are the highest they have been in the past 10 years .
. . . and record cash performance. Cash generated from every dollar of revenue has increased 18 percent since 2003 .
earnings Per Share (From continuing operations)
Margins
net cash from operations, excluding global Financing receivables(Dollars in billions)
GrOss PrOFIt MArGIn
PrEtAx InCOME MArGIn
�. and that has enabled us to invest in future sources of growth and provide record return to investors . . .
Returned
to Shareho
lders
Reinvested
$80
70
60
50
40
30
20
10
0
SHARE REPURCHASES
DIVIDENDS
NET CAPITAL EXPENDITURES
STRATEGIC ACQUISITIONS
70
Primary uses of cash over the Past Five Years(Dollars in billions)
. . . while continuing to invest in r&d — more than $�8 billion over the past five years.
cyan mag yelo black
MAC
2718

8 2006 Annual Report
focused on China or India or Brazil or Ireland. They are leading integrated global operations.
In addition to integrating the entire company globally, we are investing to extend our leadership within the fastest-growing markets. We have tripled the number of people working in or serving markets such as China, India, Brazil and Russia in the past four years. Our business there, excluding PCs, grew 21 percent last year. Over the next four years, we expect these markets to grow at more than two times the worldwide rate, with an opportunity of more than $150 billion by 2010.
In the May / June 2006 issue of the public policy journal Foreign Affairs, I described our point of view on the globally integrated enterprise, and this idea has struck a chord with many leaders around the world. We are now working actively across IBM’s broad ecosystem to explore the promise — and challenges — of this new model. We believe it offers hope for a new kind of globalization, one that not only generates vast new opportunity, but that also vastly expands the chances for all people on the planet to share in it.
a diStinctive WaY oF thinkingTo many of us, IBM’s transformation of the past few years, while dramatic, has not felt unfamiliar. For me and others in my generation, the experience has not been one of entering uncharted waters, but of returning to a pace of change, a level of impact and a type of thinking that drew us to this company in the first place. And its origins go back a long way.
For nearly a century, businesses, institutions and individuals have sought a relationship with IBM because of this company’s unique ability to conceptualize opportunities, to analyze developments and to reimagine how the world could work. For nearly a century, literally millions of women and men have been drawn here to be part of an enterprise that above all grounded itself in lasting values, and that valued, above all, the capacity of its people to think.
Today, those values and that kind of thinking are deepening and taking on more and more exciting new forms. One example in 2006 was InnovationJam — an open brainstorming event on IBM’s worldwide intranet that engaged more than 150,000 IBMers, their family members, IBM clients and partners from business and academia. We shared a few of our “crown jewels,” some of the latest technologies from IBM’s labs. Then, together, we explored how these new
capabilities might be applied to urgent needs — from the environment, to healthcare, to small global business, to the emergence of a “3-D Internet” — and how those possibilities might spawn new high-growth businesses.
We have assigned senior business owners to develop 10 of the most promising ideas, and we’ve stripped away process so they can move quickly. We also gave them a pool of $100 million in development funds to get them started. The important point in this is that when you commit yourself to innovation that matters, you free up talented people to try new things — new approaches, new partnerships, new markets. That is, you ask them to think.
To capture some of the essential elements of IBM’s way of working, collaborating and approaching problems, we have created a companion piece for this year’s annual report. It is entitled, appropriately enough, tHInk. For all IBM investors — and for anyone who is considering a relationship with our company, either as a client, a partner, an employee, or a neighbor — an understanding of what makes IBM tick is essential in gauging our prospects for the century ahead.
As we enter this new era of technology, business and global society, I am proud of the worldwide IBM team for bringing us to this point, and I am grateful to you, our shareholders, for your support in our journey. I hope and trust that you are pleased with how your company is growing and evolving. My colleagues and I are excited by the possibilities for how, together with our clients, our partners and you, we can bring this remarkable enterprise into its next phase of leadership and discovery.
Samuel J. PalmisanoChairman, President and Chief Executive Officer
Chairman’s Letter
The selected references in this letter to the company’s financial results: (1) excluding the effects of the divestiture of the company’s PC business, (2) excluding non-recurring items, and (3) excluding the Global Financing business are non-GAAP financial measures, as is the reference to return on invested capital (ROIC), and these references are made to facilitate a comparative view of the company’s ongoing operational performance. Additional information on the use of these non-GAAP financial measures is provided in the company’s Form 8-K submitted to the SEC on January 18, 2007 (Attachment II — Non-GAAP Supplementary Materials) and in the company’s 2006 Annual Report (Management Discussion and Analysis — Year in Review and Looking Forward — Liquidity and Capital Resources).
cyan mag yelo black
MAC
2718

�
What does it take to change the way the world works?www.ibm.com/ibm/think
computing-tabulating-recording co.
cyan mag yelo black
MAC
2718

(Dollars in millions except per share amounts)
For the year 2006 2005
Revenue $ 91,424 $ 91,134
Income from continuing operations $ 9,416 $ 7,994
Income/(loss) from discontinued operations 76 (24)
Income before cumulative effect of change in accounting principle 9,492 7,970
Cumulative effect of change in accounting principle** — (36)
Net income $ 9,492 $ 7,934
Earnings/(loss) per share of common stock: Assuming dilution: Continuing operations $ 6.06 $ 4.91
Discontinued operations 0.05 (0.01)
Before cumulative effect of change in accounting principle 6.11 4.90
Cumulative effect of change in accounting principle** — (0.02)
Total $ 6.11 $ 4.87*
Basic: Continuing operations $ 6.15 $ 4.99
Discontinued operations 0.05 (0.02)
Before cumulative effect of change in accounting principle 6.20 4.98*
Cumulative effect of change in accounting principle** — (0.02)
Total $ 6.20 $ 4.96
Net cash provided by operating activities from continuing operations $ 15,019 $ 14,914
Capital expenditures, net 4,737 3,527
Share repurchase 8,084 7,739
Cash dividends paid on common stock 1,683 1,250
Per share of common stock 1.10 0.78
at year end 2006 2005
Cash, cash equivalents and marketable securities $ 10,657 $ 13,686
Total assets 103,234 105,748
Working capital 4,569 10,509
Total debt 22,682 22,641
Stockholders’ equity 28,506 33,098
Common shares outstanding (in millions) 1,506 1,574
Market capitalization $146,355 $129,381
Stock price per common share $ 97.15 $ 82.20
Number of employees in IBM/wholly owned subsidiaries 355,766 329,373
* Doesnottotalduetorounding.
**ReflectsimplementationofFASBInterpretationNo.47.SeenoteB,“AccountingChanges,”onpage72foradditionalinformation.
Financial HigHligHtsinternational business macHines corporation and subsidiary companies
10 2006AnnualReport
Black
MAC
2718 CG10

management discussion Road Map 12 Forward-Looking and Cautionary Statements 13 Management Discussion Snapshot 14 Description of Business 15 Year in Review 22 Prior Year in Review 37 Discontinued Operations 41 Other Information 41 Looking Forward 41 Liquidity and Capital Resources 43 Critical Accounting Estimates 45 Currency Rate Fluctuations 47 Market Risk 47 Financing Risks 48 Employees and Related Workforce 48 Global Financing 49
report oF management 54
report oF independent registered public accounting Firm 55
consolidated Financial statements Earnings 56 Financial Position 57 Cash Flows 58 Stockholders’ Equity 59
notes to consolidated Financial statements a Significant Accounting Policies 62 b Accounting Changes 71 c Acquisitions/Divestitures 73 d Financial Instruments (excluding derivatives) 78 e Inventories 79 F Financing Receivables 79 g Plant, Rental Machines and Other Property 79 H Investments and Sundry Assets 80 i Intangible Assets Including Goodwill 80 J Securitization of Receivables 81 K Borrowings 81 l Derivatives and Hedging Transactions 83 m Other Liabilities 87 n Stockholders’ Equity Activity 88 o Contingencies and Commitments 89 p Taxes 92 Q Research, Development and Engineering 93 r 2005 Actions 93 s Earnings Per Share of Common Stock 95 t Rental Expense and Lease Commitments 96 u Stock-Based Compensation 96 V Retirement-Related Benefits 100 W Segment Information 111 X Subsequent Events 115
FiVe-year comparison oF selected Financial data 116
selected Quarterly data 117
perFormance grapHs 118
board oF directors and senior eXecutiVe oFFicers 120
stocKHolder inFormation 121
report oF Financialsinternational business macHines corporation and subsidiary companies
11
cyan mag yelo black
MAC
2718 CG10

road mapthe financial section of the international business machines corporation (ibm or the company) 2006 annual report, consisting of this Management Discussion, the Consolidated Financial Statements that follow and the notes related thereto, comprises 108 pages of information. This Road Map is designed to provide the reader with some perspective regarding the information contained in the financial section.
ibm’s business modelThe company’s business model is built to support two principal goals: helping clients succeed in delivering business value by becoming more innovative, efficient and competitive through the use of business insight and information technology (IT) solutions; and providing long-term value to shareholders. In addition to these goals, the company is com-mitted to its employees and the communities in which it operates. In support of these objectives, the business model has been devel-oped over time through strategic investments in capabilities and technologies that have the best long-term growth and profitability prospects based on the value they deliver to clients. The company’s strategy is to focus on the high-growth, high-value segments of the IT industry. The company’s broad capabilities include services, software, hardware, fundamental research, financing and the component technologies used to build larger systems. These global capabilities are combined to provide business insight and solutions in the enterprise computing space. The business model is flexible, and allows for periodic rebalancing. In 2006, 13 acquisitions were completed, all focused on expanding the company’s software and services capabilities, at an aggregate cost of approximately $4.8 billion. In January 2007, the company announced its intent to form a joint venture with Ricoh Company based on the company’s Printing Systems business. The business model, supported by the company’s long-term financial model, enables the company to deliver consistently strong earnings, cash flows and high returns on invested capital in changing economic environments.
transparencytransparency is a primary goal of successful financial reporting. the following are the key elements found in this year’s annual report.
•Thecompany,inaccordancewithSection404oftheSarbanes-OxleyActof2002,conductedanevaluationofitsinternalcontroloverfinancialreportingandconcludedthattheinternalcontroloverfinancialreportingwaseffectiveasofDecember31,2006.
•TheManagementDiscussionisdesignedtoprovidereaderswithaviewofthecompany’sresultsandcertainfactorsthatmayaffectfutureprospectsfromtheperspectiveofthecompany’smanagement.Withinthe“ManagementDiscussionSnapshot,”onpages14to15,thekeymessagesanddetailswillgivereaderstheabilitytoquicklyassessthemostimportantdriversofperformancewithinthisbriefoverview.
•TheManagementDiscussionreflectsthecompany’scontinuedandimprovingstrengthinprovidingclient-andindustry-specificsolutionsutilizingitsbroadcapabilities.Thesectionson“DescriptionoftheBusiness”onpage15,“ResultsofContinuingOperations”onpage22,“FinancialPosition”onpage32,and“LookingForward”onpage41,areallwrittenfromtheperspectiveoftheconsolidatedentity.Detailedanalysisforeachofthecompany’ssegmentsisalsoincludedandappearsonpages29to32.
•GlobalFinancingisabusinesssegmentwithinthecompanythatismeasuredasifitwereastandaloneentity.Aseparate“GlobalFinancing”sectionbeginningonpage49isnotincludedintheconsoli-datedperspectivethatisreferredtoabove.Thissectionisseparatelypresentedgiventhissegment’suniqueimpactonthecompany’sfinancialconditionandleverage.
•EffectiveDecember31,2006,thecompanyadoptedtheprovisionsofStatementofFinancialAccountingStandards(SFAS)No.158,“Employer’sAccountingforDefinedBenefitPensionandOtherPostretirementPlans,anamendmenttoFASBStatementsNo.87,88,106,and132(R).”SFASNo.158requiresthatthefundedstatusofthecompany’spensionandnonpensionpostretirementbenefitplansberecognizedasanassetoraliabilityintheConsolidatedStatementofFinancialPosition,therecognitionofanychangesinthatfundedstatusintheyearinwhichthechangesoccurandtherecognitionofpreviouslyunrecognizedgains/(losses),priorservicecosts/(credits)andtransitionassetsasacomponentofAccumulatedgainsand(losses)notaffectingretainedearningsintheConsolidatedStatementofStockholders’Equity.TheadoptionofSFASNo.158hadasignificantnon-cashimpactonthecompany’sreportedfinancialpositionandstockholders’equity,reduc-ingequityby$9.5billion,netoftax.TheadoptionofSFASNo.158hadnoimpactonthecompany’sexistingdebtcovenants,creditratings
management discussioninternational business macHines corporation and subsidiary companies
12 2006AnnualReport
management discussion ........................................................ 12
RoadMap............................................................................. 12
Forward-LookingandCautionaryStatements..................... 13
ManagementDiscussionSnapshot...................................... 14
DescriptionofBusiness....................................................... 15
YearinReview...................................................................... 22
PriorYearinReview............................................................. 37
DiscontinuedOperations..................................................... 41
OtherInformation................................................................ 41
GlobalFinancing.................................................................. 49
report of management ......................................................... 54
report of independent registered public accounting Firm .... 55
consolidated statements ....................................................... 56
Black
MAC
2718 CG10

orfinancialflexibility.SeenoteV,“Retirement-RelatedBenefits,”onpages100to111foradditionalinformation,includingtheincrementaleffectontheConsolidatedStatementofFinancialPosition.
•ThecompanydivesteditsPersonalComputingbusinesstoLenovoonApril30,2005.ThedetailsofthissignificanttransactionarediscussedinnoteC,“Acquisitions/Divestitures,”onpages77and78.Asaresultofthisdivestiture,thecompany’sreportedfinancialresultsdonotincludeanyactivityin2006andincludefourmonthsofactivityforthePersonalComputingDivisionin2005ascomparedto12monthsin2004.Thislackofcomparableperiodshasamaterialimpactonthecompany’sreportedrevenuegrowth.Therefore,intheManagementDiscussion,withinthe“YearinReview”sectiononpages22to25andthe“PriorYearinReview”sectiononpages37and38,thecompanyhaspresentedananalysisofrevenuebothonanas-reportedbasisandonabasisthatexcludestherevenuefromthedivestedPersonalComputingbusinessfromboththe2005and2004periods.Thecom-panybelievesthattheanalysisthatexcludesthePersonalComputingrevenueisabetterindicatorofthecompany’soperationalrevenueperformanceonanongoingbasis.
•IBMmadechangestoitsmanagementsystemeffectiveasofthefirstquarterof2006.InaccordancewithSFASNo.131,“DisclosuresaboutSegmentsofanEnterpriseandRelatedInformation,”thesechangesimpactedthecompany’sreportablesegmentsandresultedinthereclassi-ficationofcertainrevenueandcostwithinitsConsolidatedStatementofEarningsfrompreviouslyreportedinformation.SeenoteW,“SegmentInformation,”onpage111foradditionalinformationonthechangesinreportablesegments.ThesechangesdidnotimpactIBM’stotalrevenue,cost,expense,netincome,earningspershare,ConsolidatedStatementofFinancialPositionorConsolidatedStatementofCashFlowsfrompre-viouslyreportedinformation.TheConsolidatedStatementofEarningsonpage56reflectsthesechangesforallperiodspresented.
•ThereferencetoconstantcurrencyintheManagementDiscussionismadesothatcertainfinancialresultscanbeviewedwithouttheimpactsofchangingforeigncurrencyexchangeratesandthereforefacilitatesacomparativeviewofbusinessgrowth.See“CurrencyRateFluctuations”onpage47foradditionalinformation.
•WithinthefinancialtablesinthisAnnualReport,certaincolumnsandrowsmaynotaddduetotheuseofroundednumbersfordisclosurepur-poses.PercentagesreportedinthefinancialtablesthroughoutthisAnnualReportarecalculatedfromtheunderlyingwhole-dollarnumbers.
management discussioninternational business macHines corporation and subsidiary companies
13
HelpFul Hintsorganization of information
•ThisManagementDiscussionsectionprovidesthereaderofthefinancialstatementswithanarrativeonthecompany’sfinancialresults.Itcontainstheresultsofoperationsforeachsegmentofthebusiness,followedbyadescriptionofthecompany’sfinancialposition,aswellascertainemployeedata.ItisusefultoreadtheManagementDiscussioninconjunctionwithnoteW,“SegmentInformation,”onpages111to115.
•Pages56through61includetheConsolidatedFinancialStatements.Thesestatementsprovideanoverviewofthecompany’sincomeandcashflowperformanceanditsfinancialposition.
•ThenotesfollowtheConsolidatedFinancialStatements.Amongotherthings,thenotescontainthecompany’saccountingpolicies(pages62to71),acquisitionsanddivestitures(pages73to78),detailedinformationonspecificitemswithinthefinancialstatements,certaincontingenciesandcommitments(pages89to92),andtheresultsofeachIBMsegment(pages111to115).
discontinued operationson december 31, 2002, the company sold its hard disk drive (Hdd) business to Hitachi, ltd. (Hitachi). The HDD business was accounted for as a discontinued operation under generally accepted accounting principles (GAAP) which requires that the income state-ment and cash flow information be reformatted to separate the divested business from the company’s continuing operations. See page 41 for additional information.
ForWard-looKing and cautionary statementscertain statements contained in this annual report may constitute forward-looking statements within the meaning of the private Securities Litigation Reform Act of 1995. These statements involve a number of risks, uncertainties and other factors that could cause actual results to be materially different, as discussed more fully else-where in this Annual Report and in the company’s filings with the Securities and Exchange Commission (SEC), including the company’s 2006 Form 10-K filed on February 27, 2007.
Black
MAC
2718 CG10

continuing operationsthe company’s 2006 performance was the result of a series of actions taken over the last several years to steadily transform the company. The company has divested of businesses that are commod-itizing, while investing in targeted acquisitions to continue to build capabilities in higher value areas. The company has also been focused on increasing productivity, to expand margins and improve efficiency. In addition, it has accelerated its move to become a globally inte-grated company. These actions have resulted in a more balanced mix of businesses and a stronger, more competitive and sustainable global business. The company’s 2006 financial results reflect this improved business model. The company divested its Personal Computing business on April 30, 2005. Therefore, the company’s reported results for 2006 do not include any activity for the Personal Computing Division, while the results for 2005 include four months of activity. Total revenue, as reported, increased 0.3 percent versus 2005; excluding the Personal Computing business external revenue from 2005, total 2006 revenue increased 3.6 percent (3.2 percent adjusted for currency). Pre-tax income from continuing operations grew 8.9 percent, while diluted earnings per share from continuing operations increased 23.4 percent compared to 2005. Income from continuing operations increased 17.8 percent compared to 2005, benefiting from an improved effective tax rate year to year. Net cash provided by operating activities was $15,019 million. The increase in revenue, excluding the Personal Computing busi-ness, in 2006 as compared to 2005, was primarily due to:
•Improveddemandinthesoftwarebusiness,drivenbyKeyBrandedMiddlewareproducts,withpositivecontributionsfromkeyacquisitions;
•IncreaseddemandinthehardwarebusinessdrivenbyMicroelec-tronics,SystemzandStorage;growthinSystemxandRetailStoreSolutions;and
•Continuedgrowthinemergingcountries(up21percent)andsolidper-formanceintheAmericasandEurope/MiddleEast/Africageographies.
The increase in income from continuing operations before income taxes in 2006 as compared to 2005 was primarily due to:
•RevenuegrowthintheSoftwaresegmentasdiscussedabove;
•Continuedexecutionofthecompany’sproductivityinitiativesdrivingimprovedGlobalServicesgrossmargins;and
•RevenuegrowthandcontinuedoperationalimprovementintheMicroelectronicsbusiness.
management discussion snapsHot(Dollars and shares in millions except per share amounts)
yr. to yr. Percent/ Margin For the year ended deceMber 31: 2006 2005 change
Revenue $ 91,424 $ 91,134 0.3%*
Gross profit margin 41.9% 40.1% 1.8pts.
Total expense and other income $ 24,978 $ 24,306 2.8%
Total expense and other income to revenue ratio 27.3% 26.7% 0.7pts.
Income from continuing operations before income taxes $ 13,317 $ 12,226 8.9%
Provision for income taxes $ 3,901 $ 4,232 (7.8)%
Income from continuing operations $ 9,416 $ 7,994 17.8%
Earnings per share of common stock: Assuming dilution: Continuing operations $ 6.06 $ 4.91 23.4%
Discontinued operations 0.05 (0.01) NM
Cumulative effect of change in accounting principle — (0.02) NM
Total $ 6.11 $ 4.87 25.5%
Weighted-average shares outstanding: Diluted 1,553.5 1,627.6 (4.6)%
Assets** $103,234 $105,748 (2.4)%
Liabilities** $ 74,728 $ 72,650 2.9%
Equity** $ 28,506 $ 33,098 (13.9)%
* Flatwhenadjustedforcurrency.
** AtDecember31.
NM—Notmeaningful
management discussioninternational business macHines corporation and subsidiary companies
14 2006AnnualReport
management discussion ........................................................ 12
RoadMap............................................................................. 12
Forward-LookingandCautionaryStatements..................... 13
ManagementDiscussionSnapshot...................................... 14
DescriptionofBusiness....................................................... 15
YearinReview...................................................................... 22
PriorYearinReview............................................................. 37
DiscontinuedOperations..................................................... 41
OtherInformation................................................................ 41
GlobalFinancing.................................................................. 49
report of management ......................................................... 54
report of independent registered public accounting Firm .... 55
consolidated statements ....................................................... 56
Black
MAC
2718 CG10
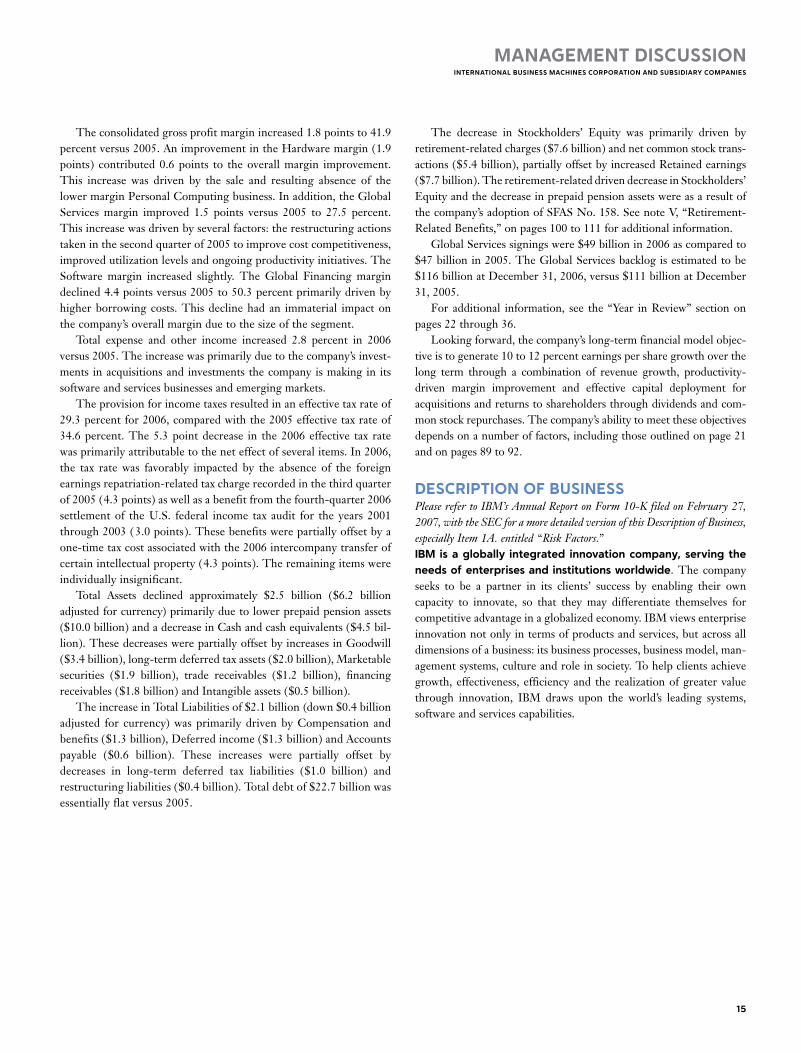
The consolidated gross profit margin increased 1.8 points to 41.9 percent versus 2005. An improvement in the Hardware margin (1.9 points) contributed 0.6 points to the overall margin improvement. This increase was driven by the sale and resulting absence of the lower margin Personal Computing business. In addition, the Global Services margin improved 1.5 points versus 2005 to 27.5 percent. This increase was driven by several factors: the restructuring actions taken in the second quarter of 2005 to improve cost competitiveness, improved utilization levels and ongoing productivity initiatives. The Software margin increased slightly. The Global Financing margin declined 4.4 points versus 2005 to 50.3 percent primarily driven by higher borrowing costs. This decline had an immaterial impact on the company’s overall margin due to the size of the segment. Total expense and other income increased 2.8 percent in 2006 versus 2005. The increase was primarily due to the company’s invest-ments in acquisitions and investments the company is making in its software and services businesses and emerging markets. The provision for income taxes resulted in an effective tax rate of 29.3 percent for 2006, compared with the 2005 effective tax rate of 34.6 percent. The 5.3 point decrease in the 2006 effective tax rate was primarily attributable to the net effect of several items. In 2006, the tax rate was favorably impacted by the absence of the foreign earnings repatriation-related tax charge recorded in the third quarter of 2005 (4.3 points) as well as a benefit from the fourth-quarter 2006 settlement of the U.S. federal income tax audit for the years 2001 through 2003 ( 3.0 points). These benefits were partially offset by a one-time tax cost associated with the 2006 intercompany transfer of certain intellectual property (4.3 points). The remaining items were individually insignificant. Total Assets declined approximately $2.5 billion ($6.2 billion adjusted for currency) primarily due to lower prepaid pension assets ($10.0 billion) and a decrease in Cash and cash equivalents ($4.5 bil-lion). These decreases were partially offset by increases in Goodwill ($3.4 billion), long-term deferred tax assets ($2.0 billion), Marketable securities ($1.9 billion), trade receivables ($1.2 billion), financing receivables ($1.8 billion) and Intangible assets ($0.5 billion). The increase in Total Liabilities of $2.1 billion (down $0.4 billion adjusted for currency) was primarily driven by Compensation and benefits ($1.3 billion), Deferred income ($1.3 billion) and Accounts payable ($0.6 billion). These increases were partially offset by decreases in long-term deferred tax liabilities ($1.0 billion) and restructuring liabilities ($0.4 billion). Total debt of $22.7 billion was essentially flat versus 2005.
The decrease in Stockholders’ Equity was primarily driven by retirement-related charges ($7.6 billion) and net common stock trans-actions ($5.4 billion), partially offset by increased Retained earnings ($7.7 billion). The retirement-related driven decrease in Stockholders’ Equity and the decrease in prepaid pension assets were as a result of the company’s adoption of SFAS No. 158. See note V, “Retirement-Related Benefits,” on pages 100 to 111 for additional information. Global Services signings were $49 billion in 2006 as compared to $47 billion in 2005. The Global Services backlog is estimated to be $116 billion at December 31, 2006, versus $111 billion at December 31, 2005. For additional information, see the “Year in Review” section on pages 22 through 36. Looking forward, the company’s long-term financial model objec-tive is to generate 10 to 12 percent earnings per share growth over the long term through a combination of revenue growth, productivity-driven margin improvement and effective capital deployment for acquisitions and returns to shareholders through dividends and com-mon stock repurchases. The company’s ability to meet these objectives depends on a number of factors, including those outlined on page 21 and on pages 89 to 92.
description oF businessPleaserefertoIBM’sAnnualReportonForm10-KfiledonFebruary27,2007,withtheSECforamoredetailedversionofthisDescriptionofBusiness,especiallyItem1A.entitled“RiskFactors.”ibm is a globally integrated innovation company, serving the needs of enterprises and institutions worldwide. The company seeks to be a partner in its clients’ success by enabling their own capacity to innovate, so that they may differentiate themselves for competitive advantage in a globalized economy. IBM views enterprise innovation not only in terms of products and services, but across all dimensions of a business: its business processes, business model, man-agement systems, culture and role in society. To help clients achieve growth, effectiveness, efficiency and the realization of greater value through innovation, IBM draws upon the world’s leading systems, software and services capabilities.
management discussioninternational business macHines corporation and subsidiary companies
15
Black
MAC
2718 CG10

management discussioninternational business macHines corporation and subsidiary companies
16 2006AnnualReport
In IBM’s view, the future of business is being shaped by the forces of global integration and innovation. They are foundational and inti-mately related to one another. A globally integrated enterprise is a new institutional form that shapes its strategy, management and operations globally, based on economics, expertise and open business environ-ments. It is optimized for innovation in a worldwide economy and society that are increasingly integrated and specialized. IBM’s strategic moves over the past several years—from divestitures and acquisitions, to areas of focus for innovation, to the transformation of its core lines of business—have been shaped by this vision.
IBM’s strategic priorities to pursue this vision include:
•offering enterprises in the global economy innovative, high-value solutionsbased on IBM’s ability to integrate technology and business model innovation to deliver measurable results for IBM and its clients;
•leading in the delivery of business value by providing business and information technology consulting and implementation ser-vices; building, running and maintaining cross-industry and industry-specific business process services; leveraging leadership technology and engineering services; and accelerating increased business value through Service Oriented Architectures (SOA) and Information on Demand;
•leading in the delivery of advanced infrastructure through enterprise SOA and infrastructure software and services; increased share leadership in servers; driving to leadership in storage; and leading the transition to standardized services offerings; and
•making ibm the premier globally integrated enterprise—lower-ing costs and increasing effectiveness by integrating the company’s decision making at the point of client contact (“lowering IBM’s center of gravity”); moving work to where it can best be per-formed; focusing IBM’s resources to create the greatest value; and excelling in business collaboration.
ibm’s strategythe company has divested low growth commoditizing product lines and acquired higher value opportunities to leverage ibm’s infrastructure.The company has divested low growth commoditizing product lines and acquired higher value opportunities to leverage IBM’s infrastructure.
IT INDUSTRY LANDSCAPE
Hardware Software Services
Infrastructure Value
Business Value
Component Value
PwCC Daksh Maersk IT
Corio Equitant
Viacore
LotusTivoliRationalInformixSector7Access360
Logical NetworksCyaneaCandleTrigo TechVeneticaSchlumberger
HealthlinkSRDAscentialDWLDataPowerIsogonCollationMeiosys
MicromuseFileNetMROCIMS LabsLanguage Analysis SystemUnicornREMBOBuildForgeWebifyISS
NetworkHDDDRAMDisplays
EDI Services4xx Power PC PCs
PRE 2004 2004 2005 2006
Div
esti
ture
sA
cqu
isit
ion
s
management discussion ........................................................ 12
RoadMap............................................................................. 12
Forward-LookingandCautionaryStatements..................... 13
ManagementDiscussionSnapshot...................................... 14
DescriptionofBusiness....................................................... 15
YearinReview...................................................................... 22
PriorYearinReview............................................................. 37
DiscontinuedOperations..................................................... 41
OtherInformation................................................................ 41
GlobalFinancing.................................................................. 49
report of management ......................................................... 54
report of independent registered public accounting Firm .... 55
consolidated statements ....................................................... 56
cyan mag yelo black
MAC
2718 CG10
ManageMent Discussioninternational business Machines corporation anD subsiDiary coMpanies
17
servicessoftware
servers
storage
Microelectronics
engineering &technology
services
printing systeMs
retail store solutions
coMMercial financing
client financing
reMarketing
consulting &systeMs integration
businesstransforMationoutsourcing
Maintenance
strategicoutsourcing
integrateDtechnologyservices
applicationManageMent
services
application on DeManD
inforMation ManageMent
lotus
rational
tivoli
proDuctlifecycle
ManageMent
systeMs & financing
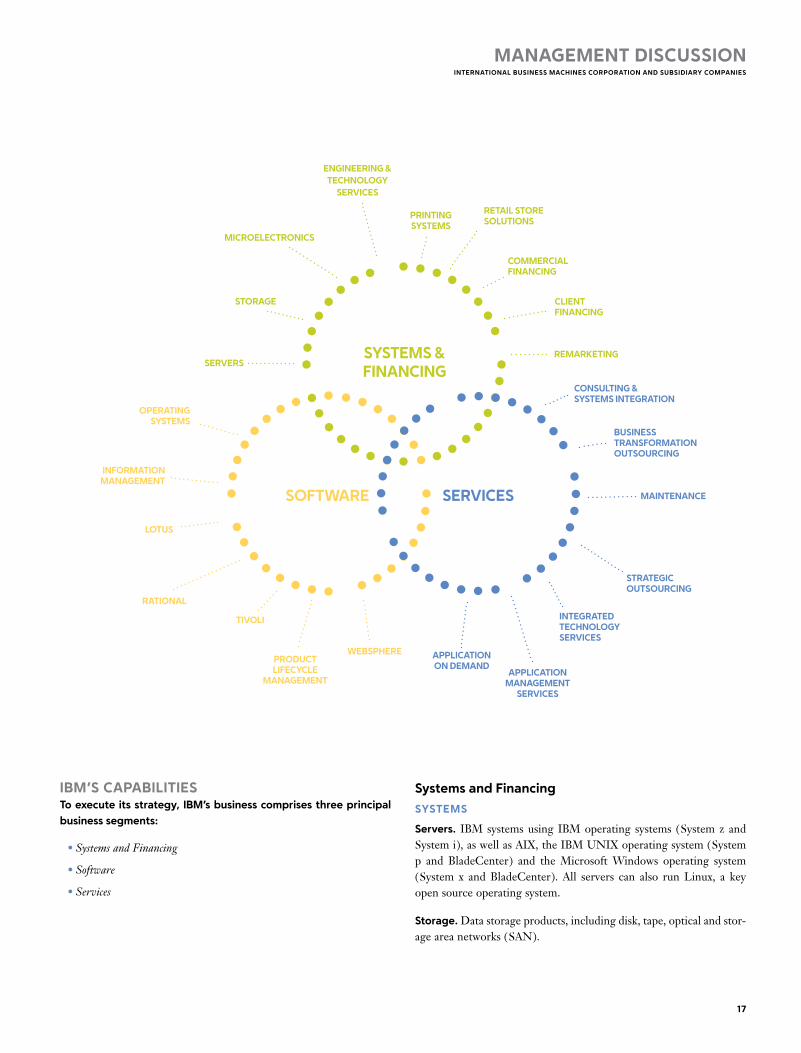
ibM’s capabilitiesto execute its strategy, ibM’s business comprises three principal business segments:
•SystemsandFinancing
•Software
•Services
systems and financing
systeMs
servers. IBM systems using IBM operating systems (System z and System i), as well as AIX, the IBM UNIX operating system (System p and BladeCenter) and the Microsoft Windows operating system (System x and BladeCenter). All servers can also run Linux, a key open source operating system.
storage. Data storage products, including disk, tape, optical and stor-age area networks (SAN).
websphere
operating systeMs
Black
MAC
390 CG10 2718

ManageMent Discussioninternational business Machines corporation anD subsiDiary coMpanies
18 2006 Annual Report
Microelectronics. Semiconductor design and manufacturing of cus-tomized products including microprocessors, application specific integrated circuits and standard products for IBM systems and exter-nal clients.
engineering and technology services (e&ts). System and compo-nent design services, strategic outsourcing of clients’ design teams, and technology and manufacturing consulting services.
printing systems. Production print solutions, on demand print-related solutions, enterprise workgroup print technologies, print management software, services and maintenance.
retail store solutions. Point-of-sale retail systems, software and solutions.
financing
commercial financing. Short-term inventory and accounts receiv-able financing to dealers and remarketers of IT products.
client financing. Lease and loan financing to external and internal clients for terms generally between two and seven years.
remarketing. The sale and lease of used equipment (primarily sourced from the conclusion of lease transactions) to new or existing clients.
softwareinformation Management software. Advanced database, content management and information integration software that helps compa-nies integrate, manage and gain value from their business information.
lotus software. Collaboration, messaging and social networking software that enables businesses to communicate, collaborate and increase productivity.
rational software. Software and process automation tools that help clients manage the business process of software and systems delivery.
tivoli software. Software for infrastructure management, including security and storage management that will help organizations better manage their IT infrastructure to more effectively deliver IT services.
websphere software. Provides the foundation for Web-enabled applications and is a key product set in deploying a Service Oriented Architecture. Management of a wide variety of business processes using open standards to interconnect applications, data and operat-ing systems.
product lifecycle Management (plM). Software that enables clients to improve their product development processes and their ability to use product-related information across their businesses.
operating systems. Software engines that manage the fundamental processes that make computers run.
servicesbusiness process services (bps). A range of offerings from stan-dardized processing platforms and Business Process Outsourcing (BPO) through Business Transformation Outsourcing (BTO) that delivers improved business results to clients through the strategic change and/or operation of the client’s business processes, applications and infrastructure.
consulting and systems integration (c&si). Delivery of value to clients through consulting services for client-relationship manage-ment, financial management, human capital, business strategy and change and supply-chain management.
strategic outsourcing services (so). Comprehensive IT services integrated with business insight working with clients to reduce costs and improve productivity through the outsourcing of processes and operations.
integrated technology services (its). Services offerings that help clients access, manage and support their technology infrastructures, through a combination of skilled resources, software and IBM’s knowl-edge of business processes.
Maintenance. A number of support services from product maintenance through solution support to maintain and improve the availability of clients’ IT infrastructure.
application Management services (aMs). Application develop-ment, management, maintenance and support services for packaged software, as well as custom and legacy applications.
applications on Demand (aoD). Solutions for the management of clients’ Web-based infrastructure and business applications, as well as a growing portfolio of industry-specific independent software vendor (ISV) solutions that are delivered as a service.
Management Discussion ........................................................ 12
RoadMap............................................................................. 12
Forward-LookingandCautionaryStatements..................... 13
ManagementDiscussionSnapshot...................................... 14
DescriptionofBusiness....................................................... 15
YearinReview...................................................................... 22
PriorYearinReview............................................................. 37
DiscontinuedOperations..................................................... 41
OtherInformation................................................................ 41
GlobalFinancing.................................................................. 49
report of Management ......................................................... 54
report of independent registered public accounting firm .... 55
consolidated statements ....................................................... 56
Black
MAC
2718 CG10

business segMentsorganizationally, the company’s major operations comprise a global technology services segment; a Global Business Services seg-ment; a Systems and Technology Group segment; a Software segment; and a Global Financing segment.
global services is a critical component of the company’s strategy of providing insight and solutions to clients. While solutions often include industry-leading IBM software and hardware, other suppliers’ products are also used if a client solution requires it. Contracts for IBM services—commonly referred to as “signings”—can range from less than one year to over 10 years. Within Global Services there are two reportable segments: Global Technology Services and Global Business Services.
global technology services (gts) segment primarily reflects infra-structure services, delivering value through the company’s global scale, standardization and automation. It includes outsourcing ser-vices, Integrated Technology Services and Maintenance.
global business services (gbs) segment primarily reflects profes-sional services, delivering business value and innovation to clients through solutions which leverage industry- and business-process expertise. It includes consulting, systems integration and Application Management Services.
systems and technology group provides IBM’s clients with business solutions requiring advanced computing power and storage capabilities. Approximately 55 percent of the Systems and Technology Group’s server and storage sales transactions are through business partners; approximately 45 percent are direct to end-user clients, more than half of which are through the Internet at ibm.com. In addition, the Group provides leading semiconductor technology and products, pack-aging solutions and engineering technology services to clients and for IBM’s own advanced technology needs. While not reported as external revenue, hardware is also deployed to support services solutions.
software consists primarily of middleware and operating systems software. Middleware software enables clients to integrate systems, processes and applications across a standard software platform. IBM middleware is designed to open standards which allows the efficient integration of disparate client applications that may have been built internally, or provided by package software vendors or system integra-tors. Operating systems are the software engines that run computers. In addition, Software includes Product Lifecycle Management soft-ware which primarily serves the Industrial sector. Approximately 25 percent of software transactions are sold through business partners. Also, 50 percent of external software revenue relates to one-time charge (OTC) arrangements, whereby the client pays one up-front payment for a perpetual license. The remaining annuity-based revenue consists of both maintenance revenue sold with OTC arrangements, as
well as revenue from software sold on a recurring license charge arrangement. Typically, arrangements for the sale of OTC software include one year of maintenance. The client can also purchase ongoing maintenance after the first year, which includes product upgrades and technical support. While not reported as external revenue, software is also deployed to support services solutions.
global financing is described on pages 49 through 53.
ibM worlDwiDe organizationsthe following three companywide organizations play key roles in ibM’s delivery of value to its clients:
•Sales&DistributionOrganizationandrelatedsaleschannels
•Research,DevelopmentandIntellectualProperty
•IntegratedSupplyChain
sales & Distribution organizationWith a comprehensive knowledge of IBM’s business and infrastructure solutions, as well as the products, technologies and services IBM and its business partners offer, the company’s global client teams gain a deep understanding of each client’s organizational, infrastructure and indus-try-specific needs to determine the best approach for addressing their critical business and IT challenges. These professionals work in inte-grated teams with IBM consultants and technology representatives, combining their deep skills and expertise to deliver high-value solutions that address clients’ pain points and innovational aspirations. To facilitate its access to clients and local markets and to improve productivity, the Sales & Distribution organization utilizes geographic organizations in the Americas, Europe/Middle East/Africa (EMEA) and Asia Pacific geographies. This structure enables resources and decision making to be closer to the clients. The majority of IBM’s revenue, excluding the company’s original equipment manufacturer (OEM) technology business, occurs in industries that are broadly grouped into six sectors:
•FinancialServices:Banking,FinancialMarkets,Insurance
•Public:Education,Government,Healthcare,LifeSciences
•Industrial:AerospaceandDefense,Automotive,ChemicalandPetroleum,Electronics
•Distribution:ConsumerProducts,Retail,TravelandTransportation
•Communications:Telecommunications,MediaandEntertainment,EnergyandUtilities
•SmallandMediumBusiness:Mainlycompanieswithlessthan1,000employees
ManageMent Discussioninternational business Machines corporation anD subsiDiary coMpanies
19
Black
MAC
2718 CG10

internal routes-to-Market
services consultants focus on selling end-to-end solutions for large, complex business challenges.
hardware and software brand specialists sell IBM products as parts of discrete technology decisions and as part of broader client solutions.
ibm.com provides fast, easy access to IBM’s product and business expertise via the Web and telephone. In addition, ibm.com identifies business opportunities for all of IBM’s routes to market and provides online and telephone sales of standard hardware, software, services and financing for all-size companies.
business partners routes-to-Market
global/major independent software vendors (isvs). ISVs deliver business-process or industry-specific applications and, in doing so, often influence the sale of IBM hardware, middleware and services.
global/major systems integrators (sis). SIs identify business prob-lems and design solutions when IBM Global Services is not the preferred systems integrator; they also sell computing infrastructures from IBM and its competitors.
regional isvs and sis. SIs identify the business problems, and ISVs deliver business process or industry-specific applications to medium-sized and large businesses requiring IBM computing infra-structure offerings.
solutions providers, resellers and distributors. Resellers sell IBM platforms and value-added services as part of a discrete technology platform decision to clients wanting third-party assistance.
research, Development and intellectual propertyIBM’s research and development (R&D) operations differentiate IBM from its competitors. IBM annually spends approximately $6 billion for R&D, focusing its investments in high-growth, high-value oppor-tunities. In 2006, the company’s investment in R&D was approximately 15 percent of its combined hardware and software revenue. As a result
of innovations in these and other areas, IBM was once again awarded more U.S. patents in 2006 than any other company. This marks the 14th year in a row that IBM achieved this distinction. In addition to producing world-class hardware and software products, IBM innovations are a major differentiator in providing solutions for the company’s clients through its growing services activities. The company’s investments in R&D also result in intellec-tual property (IP) income of approximately $1 billion annually. Some of IBM’s technological breakthroughs are used exclusively in IBM products, while others are licensed and may be used in either/both IBM products and/or the products of the licensee. In addition to these IP income sources, the company also generates value from its patent portfolio through cross-licensing arrangements and IP licensed in divestiture transactions. The value of these transac-tions is not readily apparent in the Consolidated Statement of Earnings, because income on cross-licensing arrangements is recorded only to the extent that cash is received. The value received for IP involving the sale of a business is included in the overall gain or loss from the divestiture, not in the separately presented IP income amounts on the Consolidated Statement of Earnings.
integrated supply chainJust as IBM works to transform its clients’ supply chains for greater efficiency and responsiveness to global market conditions, the company continues to derive business value from its own globally integrated sup-ply chain, reinvented as a strategic advantage for the company to create value for clients and shareholders. IBM leverages its supply-chain expertise for clients through its supply-chain business transformation outsourcing service to optimize and help run clients’ end-to-end sup-ply-chain processes, from procurement to logistics. IBM spends approximately $36 billion annually through its supply chain, procuring materials and services around the world. The com-pany’s supply, manufacturing and logistics and customer fulfillment operations are integrated in one operating unit that has reduced inventories, improved response to marketplace opportunities and external risks and converted fixed to variable costs. Simplifying and streamlining internal processes has improved operations, sales force productivity and processes, and these actions have improved client satisfaction when working with the company. Since some of the cost savings this unit generates are passed along to clients, they will not always result in a visible gross margin improvement in the company’s Consolidated Statement of Earnings. IBM is continuing to apply the supply-chain principles of product manufacturing and delivery to service delivery across its solutions and services lines of business. In addition to its own manufacturing operations, the company uses a number of contract manufacturing (CM) companies around the world to manufacture IBM-designed products. The use of CM companies is intended to generate cost efficiencies and reduce time to market for certain IBM products.
ManageMent Discussioninternational business Machines corporation anD subsiDiary coMpanies
20 2006 Annual Report
Management Discussion ........................................................ 12
RoadMap............................................................................. 12
Forward-LookingandCautionaryStatements..................... 13
ManagementDiscussionSnapshot...................................... 14
DescriptionofBusiness....................................................... 15
YearinReview...................................................................... 22
PriorYearinReview............................................................. 37
DiscontinuedOperations..................................................... 41
OtherInformation................................................................ 41
GlobalFinancing.................................................................. 49
report of Management ......................................................... 54
report of independent registered public accounting firm .... 55
consolidated statements ....................................................... 56
Black
MAC
2718 CG10

key business Drivers the following are some of the key drivers of the company’s business.
economic environment and corporate spending budgetsIf overall demand for systems, software and services changes, whether due to general economic conditions or a shift in corporate buying patterns, sales performance could be impacted. IBM’s diverse set of products and offerings is designed to provide more consistent results in both strong and weak economic environments. The company accomplishes this by not only having a mix of offerings with long-term cash and income streams, as well as cyclical transaction-based sales, but also by continually developing competitive products and solutions and effectively managing a skilled resource base. IBM con-tinues to transform itself to take advantage of shifting demand trends, focusing on client- or industry-specific solutions, business perfor-mance and open standards.
internal business transformation and global integration initiativesIBM continues to drive greater productivity, flexibility and cost sav-ings by transforming and globally integrating its own business pro-cesses and functions. In 2006, the company continued the global integration of its internal support functions—such as Legal, Finance, Human Resources, Information Technology and Real Estate Site Operations—which had been previously replicated for many of the individual countries where IBM operates. In addition to eliminating redundancies and overhead structures to drive productivity, this inte-gration has improved IBM’s capacity to innovate by providing greater clarity of key priorities around shared goals and objectives and led to a sharper focus for the company on learning, development and knowledge sharing. The company will continue to focus on global integration initiatives to improve productivity in its integrated supply chain, service delivery and internal support functions.
innovation initiativesIBM invests to improve its ability to help its clients innovate. Investment may occur in the research and development of new prod-ucts and services, as well as in the establishment of new collaborative and co-creation relationships with developers, other companies and other institutions. Examples include IBM’s leadership position in the design and fabrication of game processors; the design of smaller, faster and energy-efficient semiconductor devices; and the design of “grid” computing networks that allow computers to share processing power.
ManageMent Discussioninternational business Machines corporation anD subsiDiary coMpanies
21
Through the Global Innovation Outlook (GIO), IBM has opened up its technical and business forecasting processes to include external leaders from business, academia, the public sector, nongovernmental organizations and other influential constituents of the world com-munity. The GIO takes a deep look at some of the most pressing issues facing the world and works toward providing solutions to those needs. In 2006, IBM also announced that it will invest $100 million over the next two years to pursue 10 new businesses generated by InnovationJam, an on-line brainstorming session which brought together more than 150,000 people from 104 countries, including IBM employees, family members, universities, business partners and clients from 67 companies. Over two 72-hour sessions, participants posted more than 46,000 ideas as they explored IBM’s most advanced research technologies and considered their application to real-world problems and emerging business opportunities.
open standardsThe broad adoption of open standards is essential to the computing model for an on demand business and is a significant driver of col-laborative innovation across all industries. Without interoperability among all manner of computing platforms, the integration of any client’s internal systems, applications and processes remains a monu-mental and expensive task. The broad-based acceptance of open standards—rather than closed, proprietary architectures—also allows the computing infrastructure to more easily absorb (and thus benefit from) new technical innovations. IBM’s support of open standards is evidenced by the enabling of its products to support open standards such as Linux, and the development of Rational software development tools, which can be used to develop and upgrade other companies’ software products.
investing in growth opportunitiesThe company is continuing to refocus its business on the higher value segments of enterprise computing—providing technology and trans-formation services to clients’ businesses. Consistent with that focus, the company continues to significantly invest in growth opportunities as a way to drive revenue growth and market share gains. Areas of investment include strategic acquisitions, primarily in software and services, focused client- and industry-specific solutions, maintaining technology leadership and emerging growth countries such as China, Russia, India and Brazil.
Black
MAC
CG10

year in reviewresults of continuing operationsrevenue(Dollars in millions)
Yr.toYr. Percent Yr.toYr. change Percent constantFortheYearendeddecember31: 2006 2005 change currencY
Statement of Earnings Revenue Presentation: Global Services $48,247 $47,407 1.8% 1.7%
Hardware 22,499 24,343 (7.6) (8.3)
Software 18,204 16,830 8.2 7.5
Global Financing 2,379 2,407 (1.1) (1.6)
Other 94 147 (36.4) (33.4)
Total $91,424 $91,134 0.3% (0.0)%
(Dollars in millions)
Yr.toYr. Percent Yr.toYr. change Percent constantFortheYearendeddecember31: 2006 2005* change currencY
Industry Sector: Financial Services $25,181 $24,186 4.1% 3.8%
Public 13,401 14,064 (4.7) (5.3)
Industrial 11,535 11,699 (1.4) (1.6)
Distribution 9,034 8,959 0.8 0.3
Communications 8,679 8,601 0.9 0.6
Small & Medium Business 16,981 17,597 (3.5) (3.8)
OEM 3,856 3,271 17.9 17.9
Other 2,756 2,757 (0.1) 0.0
Total $91,424 $91,134 0.3% (0.0)%
* Reclassifiedtoconformwith2006presentation.
(Dollars in millions)
Yr.toYr. Percent Yr.toYr. change Percent constantFortheYearendeddecember31: 2006 2005 change currencY
Geographies: Americas $39,511 $38,817 1.8% 0.8%
Europe/Middle East/Africa 30,491 30,428 0.2 (1.1)
Asia Pacific 17,566 18,618 (5.7) (3.1)
OEM 3,856 3,271 17.9 17.9
Total $91,424 $91,134 0.3% (0.0)%
ManageMent Discussioninternational business Machines corporation anD subsiDiary coMpanies
22 2006 Annual Report
Management Discussion ........................................................ 12
RoadMap............................................................................. 12
Forward-LookingandCautionaryStatements..................... 13
ManagementDiscussionSnapshot...................................... 14
DescriptionofBusiness....................................................... 15
YearinReview...................................................................... 22
PriorYearinReview............................................................. 37
DiscontinuedOperations..................................................... 41
OtherInformation................................................................ 41
GlobalFinancing.................................................................. 49
report of Management ......................................................... 54
report of independent registered public accounting firm .... 55
consolidated statements ....................................................... 56
Black
MAC
2718 CG10

ManageMent Discussioninternational business Machines corporation anD subsiDiary coMpanies
23
The company divested its Personal Computing business to Lenovo on April 30, 2005. The details of this significant transaction are dis-cussed in note C, “Acquisitions/Divestitures”, on pages 77 and 78. As a result of this divestiture, the company’s reported financial results do not include any activity in 2006 and include four months of activity for the Personal Computing Division in 2005. This lack of comparable periods has a material impact on the company’s reported revenue growth. The company believes that a more appropriate analysis is one that excludes the revenue results of the Personal Computing Division in 2005 because it presents results on a comparable basis and provides a more meaningful focus on the company’s ongoing operational per-formance. Such discussion is presented on pages 24 and 25. Total revenue, as reported, increased 0.3 percent versus 2005. In addition to the revenue presentation in the Consolidated Statement of Earnings, the company also measures revenue performance on both an industry sector and geographic basis. As-reported revenue performance by industry sector was mixed in 2006 when compared to 2005. Revenue in the Financial Services sec-tor increased 4.1 percent versus the year-ago period, driven by Banking, which increased 7.2 percent. The Public sector revenue decline of 4.7 percent was attributable to decreased revenue in the Government (3.2 percent) and Education (25.1 percent) industries. The Industrial sector revenue decline (1.4 percent) was driven by Automotive (5.5 percent), partially offset by increased revenue in Chemical and Petroleum (12.4 percent). Revenue in the Distribution sector increased (0.8 percent) with growth in Consumer Products ( 5.3 percent) and the Retail industry (2.4 percent), partially offset by decreased revenue in Travel and Transportation (4.5 percent). The Communications sector revenue increase (0.9 percent) was driven by increased revenue in Utilities (9.3 percent). Revenue from Small and Medium Business decreased 3.5 percent in 2006 when compared to 2005, with revenue declines in all geographic markets. This sector was impacted most significantly by the loss of the Personal Computing business revenue. The following geographic, regional and country-specific revenue performance excludes OEM revenue, which is presented separately.
From a geographic perspective, as-reported revenue performance was mixed in 2006 compared to 2005, with growth in the Americas and EMEA, being offset by a decrease in Asia Pacific. Americas’ revenue increased 1.8 percent (1 percent adjusted for currency) in 2006 versus the year-ago period. Revenue increased in all regions with the U.S. up 1.0 percent, Canada 2.4 percent (decreased 4 percent adjusted for currency) and Latin America 8.6 percent (3 percent adjusted for currency). EMEA revenue increased a modest 0.2 percent on an as-reported basis (declined 1 percent adjusted for currency) in 2006 when com-pared to 2005. In the major countries, the U.K. increased 0.5 percent (decreased 1 percent adjusted for currency), France increased 1.6 percent (flat adjusted for currency), Italy increased 1.6 percent (flat adjusted for currency) and Spain increased 2.1 percent (flat adjusted for currency). These increases were largely offset by lower revenue in Germany of 2.8 percent (4 percent adjusted for currency) in 2006 versus the year-ago period. Asia Pacific revenue declined 5.7 percent (3 percent adjusted for currency) year over year. Japan, which represents over 50 percent of the Asia Pacific revenue base, declined 10.1 percent (5 percent adjusted for currency). Partially offsetting the Japan decline were revenue increases in Korea 12.6 percent and India 22.9 percent. The emerging countries of Brazil, India, Russia and China together grew 9.9 percent (5 percent adjusted for currency), as the company continues to invest to build capabilities in these countries. Brazil grew 15.4 percent (4 percent adjusted for currency), India increased 22.9 percent (26 percent adjusted for currency) and Russia increased 13.9 percent (14 percent adjusted for currency). China declined 0.3 percent (2 percent adjusted for currency) in 2006 as this country’s performance was significantly impacted by the Personal Computing divestiture. OEM revenue increased 17.9 percent (18 percent adjusted for cur-rency) in 2006 driven by strong demand for game processors in the Microelectronics business.
Black
MAC
CG10

revenue excluding Divested personal computing business(Dollars in millions)
Yr.toYr. Percent Yr.toYr. change Percent constantFortheYearendeddecember31: 2006 2005 change currencY
Statement of Earnings Revenue Presentation: Global Services $48,247 $47,407 1.8% 1.7%
Hardware 22,499 21,468 4.8 3.9
Software 18,204 16,830 8.2 7.5
Global Financing 2,379 2,407 (1.1) (1.6)
Other 94 147 (36.4) (33.4)
Total $91,424 $88,259 3.6% 3.2%
(Dollars in millions)
Yr.toYr. Percent Yr.toYr. change Percent constant FortheYearendeddecember31: 2006 2005* change currencY
Industry Sector: Financial Services $25,181 $23,916 5.3% 4.9%
Public 13,401 13,599 (1.5) (2.1)
Industrial 11,535 11,470 0.6 0.4
Distribution 9,034 8,836 2.3 1.7
Communications 8,679 8,468 2.5 2.1
Small & Medium Business 16,981 16,018 6.0 5.7
OEM 3,856 3,271 17.9 17.9
Other 2,756 2,681 2.8 2.9
Total $91,424 $88,259 3.6% 3.2%
* Reclassifiedtoconformwith2006presentation.
(Dollars in millions)
Yr.toYr. Percent Yr.toYr. change Percent constantFortheYearendeddecember31: 2006 2005 change currencY
Geographies: Americas $39,511 $37,725 4.7% 3.7%
Europe/Middle East/Africa 30,491 29,549 3.2 1.8
Asia Pacific 17,566 17,714 (0.8) 1.8
OEM 3,856 3,271 17.9 17.9
Total $91,424 $88,259 3.6% 3.2%
ManageMent Discussioninternational business Machines corporation anD subsiDiary coMpanies
24 2006 Annual Report
Total revenue, excluding the divested Personal Computing business, increased 3.6 percent (3.2 percent adjusted for currency) versus 2005. Revenue across all industry sectors increased in 2006 when com-pared to 2005, except for the Public sector. Financial Services sector revenue increased 5.3 percent driven by Banking (8.5 percent). Public sector revenue decreased 1.5 percent driven by a 15.0 percent decline in the Education industry. Industrial sector revenue increased 0.6 percent driven by Chemical and Petroleum (16.3 percent), partially offset by decreased revenue from Automotive (4.2 percent). Distribution sector revenue increased 2.3 percent driven by Consumer Products (8.0 percent) and Retail (3.2 percent) industries, partially offset by decreased revenue in Travel and Transportation (3.2 percent). Communications
sector revenue increased 2.5 percent on the strength of increased Utilities revenue (11.7 percent). Small and Medium Business increased 6.0 percent in 2006 versus 2005 with growth in all geographic markets and enabled by growth in the company’s ibm.com channel. The following geographic, regional and country-specific revenue performance and the table above excludes OEM revenue, which is presented separately. Adjusted for currency, revenue increased in all geographic markets in 2006 when compared with 2005, with the strongest growth coming from the Americas. Americas’ revenue grew 4.7 percent as reported (4 percent adjusted for currency), with growth in all regions. From a product
Black
MAC
2718 CG10

perspective, the increased revenue was driven by software. Latin America led the regions with growth of 14.4 percent (9 percent adjusted for currency). Brazil grew 18.9 percent (8 percent adjusted for currency). The U.S. increased 3.6 percent and Canada grew 6.5 percent (flat adjusted for currency). EMEA revenue increased 3.2 percent (2 percent adjusted for cur-rency) in 2006 when compared with 2005, with revenue growth in all the major countries, except Germany. Revenue increased in the U.K. 3.0 percent (1 percent adjusted for currency), France 4.0 percent (2 percent adjusted for currency), Spain 4.1 percent (2 percent adjusted for currency) and Italy 3.6 percent (2 percent adjusted for currency). Germany declined a modest 0.3 percent as reported (2 percent adjusted for currency) in 2006 when compared to 2005. Russia grew 21.1 percent (21 percent adjusted for currency). Asia Pacific revenue declined 0.8 percent (increased 2 percent adjusted for currency) in 2006 versus the prior year. Although Japan revenue declined 7.5 percent (2 percent adjusted for currency), its performance improved sequentially throughout 2006 and returned to growth in the fourth quarter. Partially offsetting the revenue decline in Japan was growth in other Asia Pacific regions. China grew 15.8 percent (14 percent adjusted for currency), Korea grew 14.2 percent (6 percent adjusted for currency) and India increased 38.5 percent (42 percent adjusted for currency). For the year, the company benefited from solid contributions from the emerging countries of Brazil, India, Russia and China . Collectively, revenue from these four countries increased 20.5 percent (16 percent adjusted for currency) in 2006 versus 2005. OEM revenue increased 17.9 percent (18 percent adjusted for cur-rency) in 2006 versus 2005 driven by strong game processor demand in the Microelectronics business. Total Global Services revenue increased 1.8 percent in 2006 versus 2005. The increase was driven by GTS (2.4 percent) and GBS (0.4 percent). The increase in GTS was driven by Strategic Outsourcing (3.2 percent) and BTO (17.2 percent), partially offset by a decline in ITS revenue of 1.8 percent. Overall, Hardware revenue declined as reported in 2006 compared to 2005 due to the divestiture of the Personal Computing business. Systems and Technology Group revenue increased 4.7 percent as System z revenue increased 7.8 percent and MIPS (millions of instruc-tions per second) volumes increased 11 percent versus 2005. System Storage revenue increased 6.4 percent as Total disk grew 7.8 percent driven by midrange disk (16.5 percent), while tape products revenue increased 3.1 percent. Microelectronics revenue increased 21.9 per-cent driven by strong demand in games processors and networking components. System x increased 3.7 percent compared to 2005 driven by increased revenue for servers (5.3 percent) and Blades (22.3 per-cent). Retail Stores Solutions revenue increased 21.4 percent versus 2005. These increases were partially offset by declines in System i servers (15.0) percent, System p servers (1.1 percent), Printing Systems (7.6 percent) and E&TS (16.2 percent). Personal Computing Division had no revenue in 2006 versus four months of revenue in 2005. See note C, “Acquisitions/Divestitures,” on pages 77 and 78 for additional information.
ManageMent Discussioninternational business Machines corporation anD subsiDiary coMpanies
25
Software revenue increased 8.2 percent in 2006 versus 2005 driven by growth in the company’s Key Branded Middleware offerings (17.1 percent), partially offset by lower Operating Systems revenue (6.3 percent). The Key Branded Middleware growth was driven by strong performance in the WebSphere family of products (23.3 percent) and Tivoli (26.3 percent). All five brands in Key Branded Middleware had double-digit revenue growth in 2006 versus 2005 with the exception of Rational which grew 4.4 percent. Global Financing revenue decreased 1.1 percent in 2006 versus 2005 due to lower remarketing equipment sales, partially offset by an increase in financing revenue. See pages 49 through 53 for additional information regarding Global Financing.
gross profit
Yr.toYr.FortheYearendeddecember31: 2006 2005 change
Consolidated Gross Profit Margins: Global Services 27.5% 26.0% 1.5 pts.
Hardware 37.0 35.1 1.9
Software 85.2 84.9 0.3
Global Financing 50.3 54.7 (4.4)
Other (13.2) 45.2 (58.4)
Total 41.9% 40.1% 1.8 pts.
The increase in the overall Global Services gross profit margin was primarily due to benefits from the company’s productivity initiatives and cost efficiencies, including improved utilization. The increase in Hardware margin was primarily due to the divestiture of the Personal Computing business (which had a lower gross profit margin than the other hardware businesses) in the second quarter of 2005. The absence of the Personal Computing business contributed 3.5 points to the increase in the 2006 hardware margin. This increase was partially offset by a 2.7 point decline in the Systems and Technology Group margin in 2006 versus 2005. The decrease in Global Financing gross profit margin was primar-ily driven by lower financing margins due to higher borrowing costs related to the external interest rate environment. In addition, an increase in retirement-related plan costs of approx-imately $235 million partially offset by a decrease in stock-based compensation costs of approximately $114 million compared to 2005 also impacted overall segment margins. See “Segment Details” dis-cussion on pages 29 to 32 for further details on gross profit.
expense(Dollars in millions)
Yr.toYr.FortheYearendeddecember31: 2006 2005 change
Total expense and other income $24,978 $24,306 2.8%
Expense to Revenue (E/R) 27.3% 26.7% 0.7 pts.
Black
MAC
2718 CG10

Total expense and other income increased 2.8 percent (2.4 percent adjusted for currency) in 2006 versus 2005. Overall, the increase was primarily due to increased Research, development and engineering expense driven by acquisitions and lower Other (income) and expense driven by the gain associated with the sale of the Personal Computing business and the Microsoft settlement in 2005. These increases were partially offset by lower Selling, general and administrative expense due primarily to the restructuring charges recorded in the second quarter of 2005. The expense-to-revenue ratio increased 0.7 points to 27.3 percent in 2006, as revenue increased 0.3 percent and expense increased 2.8 percent in 2006 versus 2005. For additional information regarding the increase in Total expense and other income, see the following analyses by category:
selling, general anD aDMinistrative(Dollars in millions)
Yr.toYr.FortheYearendeddecember31: 2006 2005* change
Selling, general and administrative expense:Selling, general and administrative—base $17,459 $16,620 5.0%
Advertising and promotional expense 1,195 1,284 (6.9)
Workforce reductions— ongoing 289 289 0.4
Restructuring (7) 1,482 NM
Amortization expense— acquired intangibles 208 218 (4.5)
Retirement-related expense 587 846 (30.6) Stock-based compensation 541 606 (10.7)
Bad debt expense (13) (31) (57.2)
Total $20,259 $21,314 (4.9)%
* Reclassifiedtoconformwith2006presentation.
NM—Notmeaningful
Total Selling, general and administrative (SG&A) expense decreased 4.9 percent (5.3 percent adjusted for currency). The decrease was primarily driven by the restructuring charges recorded in the second quarter of 2005. See note R, “2005 Actions,” on pages 93 and 94 for
additional information. In addition, retirement-related expense and stock-based compensation expense (see “Retirement-Related Benefits” and “Stock-Based Compensation,” on pages 27 and 28 for additional information) decreased in 2006 versus 2005. These decreases were partially offset by increased operational expenses (SG&A-base) as a result of strategic acquisitions and investments the company is making in its software and services businesses as well as emerging countries. The returns on these investments are reflected in the revenue growth in the company’s key middleware brands and emerging countries dur-ing 2006 and strong services signings in the fourth quarter.
other (incoMe) anD expense(Dollars in millions)
Yr.toYr.FortheYearendeddecember31: 2006 2005* change
Other (income) and expense: Foreign currency transaction (gains)/losses $(130) $ 218 NM
Losses on derivative instruments 135 4 NM
Interest income (536) (307) 74.8%
Net gains from securities and investments assets (40) (111) (63.9)
Net realized gains from certain real estate activities (41) (179) (77.2)
Restructuring (7) 230 NM
Lenovo/Microsoft gains (45) (1,883) (97.6)
Other (102) (93) 9.6
Total $(766) $(2,122) (63.9)%
* Reclassifiedtoconformwith2006presentation.
NM—Notmeaningful
Other (income) and expense was net income of $766 million and $2,122 million in 2006 and 2005, respectively. The decrease in net income was primarily driven by the gain on the sale of the company’s Personal Computing business recorded in 2005. The pre-tax gain associated with this transaction was $1,108 million. See note C, “Acquisitions/Divestitures,” on pages 77 and 78 for additional infor-mation. In addition, the company settled certain antitrust issues with the Microsoft Corporation in 2005 and the gain from this settlement was $775 million. The company also had lower income from certain real estate activities, as 2005 had unusually high gains from a few large real estate transactions. These decreases in income were par-tially offset by additional Interest income generated by the company in 2006; foreign currency transaction gains in 2006 versus losses in 2005 and real estate related restructuring charges recorded in the second quarter of 2005. See note R, “2005 Actions,” on pages 93 and 94 for additional information. The Losses on derivative instruments relate to losses on certain hedge contracts offset by settlement of foreign currency receivables and payables. See “Currency Rate Fluc-tuations,” on page 47 for additional discussion of currency impacts on the company’s financial results.
ManageMent Discussioninternational business Machines corporation anD subsiDiary coMpanies
26 2006 Annual Report
Management Discussion ........................................................ 12
RoadMap............................................................................. 12
Forward-LookingandCautionaryStatements..................... 13
ManagementDiscussionSnapshot...................................... 14
DescriptionofBusiness....................................................... 15
YearinReview...................................................................... 22
PriorYearinReview............................................................. 37
DiscontinuedOperations..................................................... 41
OtherInformation................................................................ 41
GlobalFinancing.................................................................. 49
report of Management ......................................................... 54
report of independent registered public accounting firm .... 55
consolidated statements ....................................................... 56
Black
MAC
2718 CG10

research, DevelopMent anD engineering(Dollars in millions)
Yr.toYr.FortheYearendeddecember31: 2006 2005 change
Research, development and engineering: Total $6,107 $5,842 4.5%
The increase in Research, development and engineering (RD&E) was primarily driven by acquisitions and the company’s investments to maintain its technology leadership across the product offerings. Soft-ware spending increased $210 million and Systems and Technology spending increased $92 million in 2006 versus 2005. These increases were partially offset by the year-to-year reduction in the Personal Computing Division of $52 million due to the divestiture of that business in the prior year. Retirement-related expense increased $32 million in 2006 versus 2005, partially offset by lower stock-based compensation expense of $18 million.
intellectual property anD custoM DevelopMent incoMe(Dollars in millions)
Yr.toYr.FortheYearendeddecember31: 2006 2005 change
Intellectual property and custom development income: Sales and other transfers of intellectual property $167 $236 (29.1)%
Licensing/royalty-based fees 352 367 (4.1)
Custom development income 381 345 10.5
Total $900 $948 (5.0)%
The timing and amount of Sales and other transfers of IP may vary significantly from period to period depending upon timing of divesti-tures, industry consolidation, economic conditions and the timing of new patents and know-how development. There were no significant IP transactions in 2006 and 2005.
interest expense(Dollars in millions)
Yr.toYr.FortheYearendeddecember31: 2006 2005 change
Interest expense: Total $278 $220 26.6%
The increase in Interest expense was primarily driven by higher effec-tive interest rates in 2006 versus 2005. Interest expense is presented in Cost of Global Financing in the Consolidated Statement of Earnings only if the related external borrowings are to support the Global Financing external business. See page 52 for additional information regarding Global Financing debt and interest expense.
stock-based compensationTotal pre-tax stock-based compensation expense of $846 million decreased $189 million compared to 2005. The decrease was princi-pally the result of: (1) a reduction in the level and fair value of stock option grants ($284 million), (2) changes to the terms of the company’s employee stock purchase plan, which rendered it non-compensatory in the second quarter of 2005 in accordance with the provisions of SFAS No. 123(R) ($18 million), offset by (3) increased expense for performance-based stock units ($34 million) resulting from changes in the probabilities of achieving performance metrics and (4) an increase in the level of restricted stock units ($78 million). The effects on pre-tax stock-based compensation expense of the 2005 sale of the Personal Computing business were recorded in Other (income) and expense in the Consolidated Statement of Earnings for the year ended December 31, 2005. The year-to-year reductions in pre-tax compen-sation expense were reflected in the following categories: Cost ($114 million); Selling, general and administrative expense ($65 million); Research, development and engineering ($18 million); and an increase in Other (income) and expense ($8 million). There was no significant capitalized stock-based compensation expense at December 31, 2006 and 2005. See note U, “Stock-Based Compensation,” on page 96 to 100 for additional information on the company’s stock-based incentive awards.
retirement-related benefits The following table provides the total pre-tax cost for all retirement-related plans. Cost amounts are included as an addition to the cost and expense amounts in the Consolidated Statement of Earnings within the caption (e.g., Cost, SG&A, RD&E) relating to the job function of the individuals participating in the plans.
(Dollars in millions)
Yr.toYr.FortheYearendeddecember31: 2006 2005* change
Retirement-related plans cost: Defined benefit and contribution pension plans cost $2,040 $1,726 18.2%
Nonpension postretirement plans costs 388 379 2.4
Plan amendments/curtailments — 332 NM
Total $2,428 $2,437 (0.4)%
* Reclassifiedtoconformwith2006presentation.
NM—Notmeaningful
Overall, retirement-related plan costs decreased $9 million versus 2005. The 2005 retirement-related plan costs included $332 million related to unique items: a curtailment charge of $267 million recorded in the fourth quarter as a result of U.S. pension plan amendments and a $65 million charge recorded in the second quarter related to the
ManageMent Discussioninternational business Machines corporation anD subsiDiary coMpanies
27
Black
MAC
2718 CG10

company’s restructuring actions. These non-recurring charges were recorded in SG&A ($318 million) and Other (income) and expense ($14 million). This decrease year to year in retirement-related plan costs was essentially offset by an increase in the recognition of previ-ously deferred actuarial losses in accordance with SFAS No. 87, “Employers’ Accounting for Pensions.” Retirement-related expense within SG&A decreased $262 million year to year: a $318 million decrease as a result of the prior year charges discussed previously, offset by recurring plan cost increases of $56 million versus 2005. Other (income) and expense decreased $14 million as discussed above. Increases year to year in Cost and RD&E expense of approximately $235 million and $32 million, respectively, were a result of recurring plan cost increases. See note V, “Retirement-Related Benefits,” on pages 100 to 111 for additional information on the company’s benefit plans including a description of the plans, plan financial information and assumptions.
acquired intangible asset amortization The company has been investing in targeted acquisitions primarily within its Software and Global Services segments to increase its capa-bilities in higher value market segments. The following table presents the total acquired intangible asset amortization included in the Consolidated Statement of Earnings. See note I, “Intangible Assets Including Goodwill,” on pages 80 and 81 for additional information.
(Dollars in millions)
Yr.toYr.FortheYearendeddecember31: 2006 2005 change
Cost: Software $ 81 $118 (30.9)%
Global Services 23 27 (15.3)
Hardware 3 4 (16.7)
Selling, general and administrative expense 208 218 (4.5)
Total $316 $367 (13.9)%
income taxesThe provision for income taxes resulted in an effective tax rate of 29.3 percent for 2006, compared with the 2005 effective tax rate of 34.6 percent. The 5.3 point decrease in the 2006 effective tax rate was primarily attributable to the net effect of several items. In 2006, the tax rate was favorably impacted by the absence of the foreign earnings repatriation-related tax charge recorded in the third quarter of 2005 (4.3 points) as well as a benefit from the fourth-quarter 2006 settle-ment of the U.S. federal income tax audit for the years 2001 through 2003 (3.0 points). These benefits were partially offset by a one-time tax cost associated with the 2006 intercompany transfer of certain intellectual property (4.3 points). The remaining items were indi-vidually insignificant.
earnings per shareBasic earnings per share is computed on the basis of the weighted-average number of shares of common stock outstanding during the period. Diluted earnings per share is computed on the basis of the weighted-average number of shares of common stock plus the effect of dilutive potential common shares outstanding during the period using the treasury stock method. Dilutive potential common shares include outstanding stock options, stock awards and convertible notes.
Yr.toYr.FortheYearendeddecember31: 2006 2005 change
Earnings per share of common stock: Assuming dilution: Continuing operations $6.06 $ 4.91 23.4%
Discontinued operations 0.05 (0.01) NM
Cumulative effect of change in accounting principle* — (0.02) NM
Total $6.11 $ 4.87 25.5%
Basic: Continuing operations $6.15 $ 4.99 23.2%
Discontinued operations 0.05 (0.02) NM
Cumulative effect of change in accounting principle* — (0.02) NM
Total $6.20 $ 4.96 25.0%
Weighted-average shares outstanding (in millions): Assuming dilution 1,553.5 1,627.6 (4.6)%
Basic 1,530.8 1,600.6 (4.4)%
* ReflectsimplementationofFASBInterpretationNo.47.SeenoteB,“AccountingChanges,”onpage72foradditionalinformation.
NM—Notmeaningful
Actual shares outstanding at December 31, 2006 and December 31, 2005 were 1,506.5 million and 1,574.0 million, respectively. The average number of common shares outstanding assuming dilution was lower by 74.1 million shares in 2006 versus 2005. The decrease was primarily the result of the company’s common share repurchase pro-gram. See note N, “Stockholders’ Equity Activity,” on page 88 for additional information regarding the common share activities. Also see note S, “Earnings Per Share of Common Stock,” on page 95.
ManageMent Discussioninternational business Machines corporation anD subsiDiary coMpanies
28 2006 Annual Report
Management Discussion ........................................................ 12
RoadMap............................................................................. 12
Forward-LookingandCautionaryStatements..................... 13
ManagementDiscussionSnapshot...................................... 14
DescriptionofBusiness....................................................... 15
YearinReview...................................................................... 22
PriorYearinReview............................................................. 37
DiscontinuedOperations..................................................... 41
OtherInformation................................................................ 41
GlobalFinancing.................................................................. 49
report of Management ......................................................... 54
report of independent registered public accounting firm .... 55
consolidated statements ....................................................... 56
Black
MAC
2718 CG10

segMent Detailsthe following is an analysis of the 2006 versus 2005 reportable segment results. The analysis of 2005 versus 2004 reportable segment results is on pages 39 and 40. The following table presents each reportable segment’s external revenue as a percentage of total external segment revenue, excluding the Personal Computing business.
FortheYearendeddecember31: 2006 2005
Global Technology Services 35.6% 36.0%
Global Business Services 17.6 18.2
Total Global Services 53.2 54.1
Hardware 24.2 23.9
Global Financing 2.6 2.7
Total Hardware/Financing 26.8 26.7
Software 20.0 19.2
Total 100.0% 100.0%
The table below presents each reportable segment’s pre-tax income as a percentage of total reportable segment pre-tax income, excluding the Personal Computing business and the 2005 restructuring charges. Segment pre-tax income includes transactions between the segments that are intended to reflect an arms-length transfer price.
FortheYearendeddecember31: 2006 2005
Global Technology Services 24.0% 25.5%
Global Business Services 12.5 9.5
Total Global Services 36.5 35.0
Hardware 12.7 15.4
Global Financing 10.6 12.2
Total Hardware/Financing 23.3 27.6
Software 40.1 37.4
Total 100.0% 100.0%
global servicesThe company’s two services segments, Global Technology Services and Global Business Services had revenue of $48,291 million, an increase of 1.9 percent (2 percent adjusted for currency) in 2006 ver-sus 2005. Revenue growth and the profile of the services business improved throughout 2006.
(Dollars in millions)
Yr.toYr.FortheYearendeddecember31: 2006 2005 change
Global Services segment revenue: $48,291 $47,407 1.9%
Global Technology Services $32,322 $31,501 2.6%
Strategic Outsourcing 17,044 16,522 3.2
Integrated Technology Services 7,448 7,538 (1.2)
Business Transformation Outsourcing 1,845 1,573 17.2
Maintenance 5,986 5,868 2.0
Global Business Services $15,969 $15,906 0.4%
Global Technology Services revenue increased 2.6 percent (2 per-cent adjusted for currency) in 2006 versus the prior year period. Total signings in GTS increased 1 percent in 2006 when compared to 2005, with shorter term signings increasing 5 percent while longer term signings were flat. Revenue from Strategic Outsourcing was up 3.2 percent (3 percent adjusted for currency) due primarily to signings growth in 2005 and a continued focus on increasing services into existing accounts. Signings in 2006 increased 7 percent when compared to 2005. Integrated Technology Services revenue decreased 1.2 percent (2 percent adjusted for currency) in 2006 versus 2005. The rate of reve-nue growth in ITS improved during the second half of 2006 reflecting progress from the changes implemented throughout 2006 to improve the ITS business, including streamlining offerings and aligning skills to address higher growth and higher value areas. The acquisition of Internet Security Systems Inc. (ISS), added to the company’s capabili-ties in security and intrusion protection, and contributed to improved performance in the fourth quarter. ITS signings increased 5 percent in 2006 over the year-ago period. Business Transformation Outsourcing revenue increased 17.2 percent (17 percent adjusted for currency) in 2006 when compared to 2005. The rate of growth in BTO was negatively impacted by a sig-nificant contract renegotiation in 2006 which will continue through the first quarter of 2007. While BTO signings in 2006 decreased 33 percent versus 2005, the company continues to see opportunity within this business, particularly in Finance and Accounting, Human Resources and Procurement. Maintenance revenue increased 2.0 percent (2 percent adjusted for currency) driven by increased availability services on non-IBM IT equipment, primarily in the Americas and Asia Pacific geographies. The GTS segment pre-tax margin was 9.6 percent in 2006, an increase of 1.9 points versus 2005. The improvement was primarily the result of the incremental restructuring charges recorded in the second quarter of 2005 and the continued focus on productivity ini-tiatives. The company is continuing to make investments in sales, delivery and business development skills across the entire set of GTS offerings, as well as investing in strategic outsourcing infrastructure and BTO capabilities. Global Business Services revenue increased 0.4 percent (1 percent adjusted for currency) in 2006 versus 2005. The rate of year-over-year revenue growth in GBS increased in the second half of 2006 reflecting progress made on actions taken throughout the year that focused on operational transformation and profitable growth initiatives. Total sign-ings in GBS increased 10 percent in 2006. Shorter term signings were up 6 percent; with particular strength in the larger, higher value-add engagements during the second half of the year. Longer term signings increased 17 percent, driven by the Application Management business. The GBS segment pre-tax margin was 9.8 percent in 2006, an improvement of 5.3 points versus 2005. In addition to the benefits received from the incremental restructuring charges recorded in the second quarter of 2005 (2.6 points of improvement), the margin improvement was driven by improved utilization, better contract management and delivery and stable-to-improved pricing.
ManageMent Discussioninternational business Machines corporation anD subsiDiary coMpanies
29
Black
MAC
2718 CG10
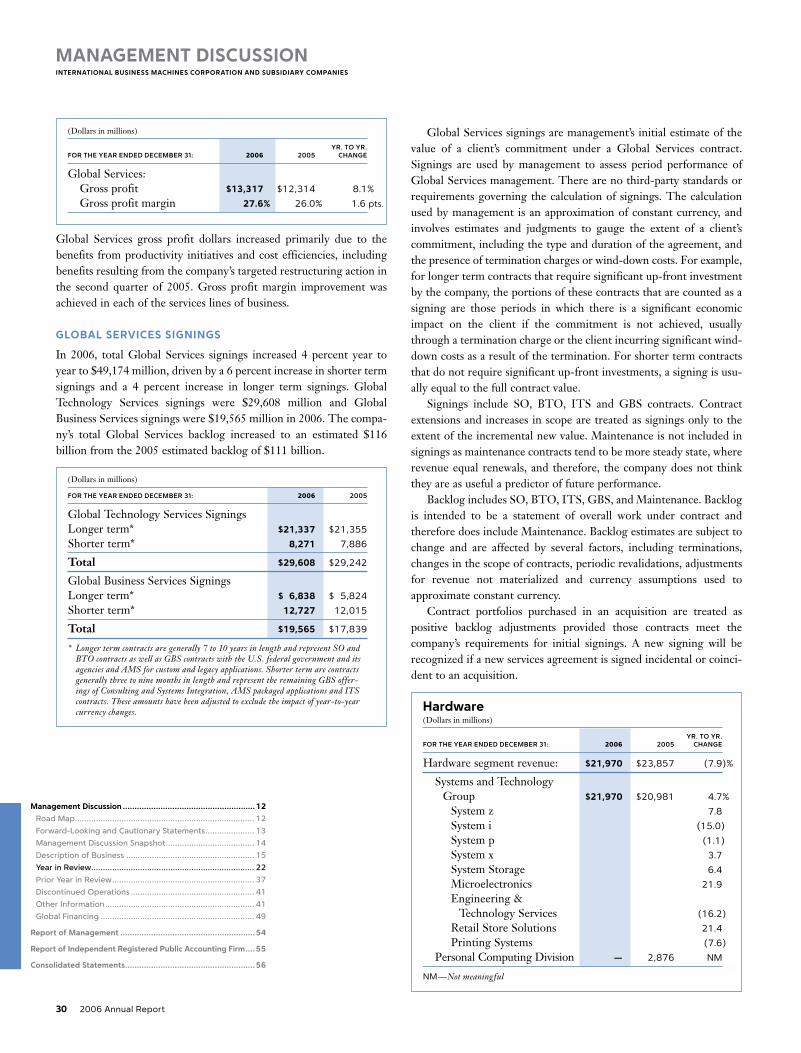
(Dollars in millions)
Yr.toYr.FortheYearendeddecember31: 2006 2005 change
Global Services: Gross profit $13,317 $12,314 8.1%
Gross profit margin 27.6% 26.0% 1.6 pts.
Global Services gross profit dollars increased primarily due to the benefits from productivity initiatives and cost efficiencies, including benefits resulting from the company’s targeted restructuring action in the second quarter of 2005. Gross profit margin improvement was achieved in each of the services lines of business.
global services signings
In 2006, total Global Services signings increased 4 percent year to year to $49,174 million, driven by a 6 percent increase in shorter term signings and a 4 percent increase in longer term signings. Global Technology Services signings were $29,608 million and Global Business Services signings were $19,565 million in 2006. The compa-ny’s total Global Services backlog increased to an estimated $116 billion from the 2005 estimated backlog of $111 billion.
(Dollars in millions)
FortheYearendeddecember31: 2006 2005
Global Technology Services SigningsLonger term* $21,337 $21,355
Shorter term* 8,271 7,886
Total $29,608 $29,242
Global Business Services SigningsLonger term* $ 6,838 $ 5,824
Shorter term* 12,727 12,015
Total $19,565 $17,839
* Longertermcontractsaregenerally7to10yearsinlengthandrepresentSOandBTOcontractsaswellasGBScontractswiththeU.S.federalgovernmentanditsagenciesandAMSforcustomandlegacyapplications.ShortertermarecontractsgenerallythreetoninemonthsinlengthandrepresenttheremainingGBSoffer-ingsofConsultingandSystemsIntegration,AMSpackagedapplicationsandITScontracts.Theseamountshavebeenadjustedtoexcludetheimpactofyear-to-yearcurrencychanges.
Global Services signings are management’s initial estimate of the value of a client’s commitment under a Global Services contract. Signings are used by management to assess period performance of Global Services management. There are no third-party standards or requirements governing the calculation of signings. The calculation used by management is an approximation of constant currency, and involves estimates and judgments to gauge the extent of a client’s commitment, including the type and duration of the agreement, and the presence of termination charges or wind-down costs. For example, for longer term contracts that require significant up-front investment by the company, the portions of these contracts that are counted as a signing are those periods in which there is a significant economic impact on the client if the commitment is not achieved, usually through a termination charge or the client incurring significant wind-down costs as a result of the termination. For shorter term contracts that do not require significant up-front investments, a signing is usu-ally equal to the full contract value. Signings include SO, BTO, ITS and GBS contracts. Contract extensions and increases in scope are treated as signings only to the extent of the incremental new value. Maintenance is not included in signings as maintenance contracts tend to be more steady state, where revenue equal renewals, and therefore, the company does not think they are as useful a predictor of future performance. Backlog includes SO, BTO, ITS, GBS, and Maintenance. Backlog is intended to be a statement of overall work under contract and therefore does include Maintenance. Backlog estimates are subject to change and are affected by several factors, including terminations, changes in the scope of contracts, periodic revalidations, adjustments for revenue not materialized and currency assumptions used to approximate constant currency. Contract portfolios purchased in an acquisition are treated as positive backlog adjustments provided those contracts meet the company’s requirements for initial signings. A new signing will be recognized if a new services agreement is signed incidental or coinci-dent to an acquisition.
hardware(Dollars in millions)
Yr.toYr.FortheYearendeddecember31: 2006 2005 change
Hardware segment revenue: $21,970 $23,857 (7.9)%
Systems and Technology Group $21,970 $20,981 4.7%
System z 7.8
System i (15.0)
System p (1.1)
System x 3.7
System Storage 6.4
Microelectronics 21.9
Engineering & Technology Services (16.2)
Retail Store Solutions 21.4
Printing Systems (7.6)
Personal Computing Division — 2,876 NM
NM—Notmeaningful
ManageMent Discussioninternational business Machines corporation anD subsiDiary coMpanies
30 2006 Annual Report
Management Discussion ........................................................ 12
RoadMap............................................................................. 12
Forward-LookingandCautionaryStatements..................... 13
ManagementDiscussionSnapshot...................................... 14
DescriptionofBusiness....................................................... 15
YearinReview...................................................................... 22
PriorYearinReview............................................................. 37
DiscontinuedOperations..................................................... 41
OtherInformation................................................................ 41
GlobalFinancing.................................................................. 49
report of Management ......................................................... 54
report of independent registered public accounting firm .... 55
consolidated statements ....................................................... 56
Black
MAC
2718 CG10

Systems and Technology Group revenue increased 4.7 percent (4 percent adjusted for currency) in 2006 versus 2005. System z rev-enue increased reflecting continued strong customer acceptance of both specialty engines for Linux and Java workloads and traditional mainframe workloads. MIPS shipments increased 11 percent versus 2005. System x revenue increased driven by increased server revenue ( 5.3 percent) and System x blades growth of 22.3 percent. IBM BladeCenter offers clients unique power and cooling capabilities and the flexibility to efficiently handle various workloads. In addition to the company’s System x blades, the company offers POWER blades and blades utilizing the Cell Broadband Engine. Total blade growth, including System p blades, was 24.6 percent in 2006 versus 2005. Although System p revenue declined for the year, high-end server revenue increased 9.4 percent. In the third quarter the company com-pleted its transition to POWER5+ and expanded the implementation of POWER Quadcore technology to all POWER-based entry level System p products. These transitions allowed the company to sustain the price/performance and virtualization leadership position that has made the company the number one UNIX vendor worldwide. System i revenue declined as the company completed its transition to POWER5+ in the third quarter, however clients continued to lever-age their existing capacity. System Storage revenue growth was driven by Total disk growth of 7.8 percent, while tape grew 3.1 percent in 2006 versus 2005. Within Total disk, mid-range disk revenue increased 16.5 percent and storage area network products increased 10.6 percent, while enter-prise products revenue declined 6.7 percent in 2006 versus 2005. The revenue increase in tape products was primarily driven by the new tape security offering which includes unique encryption capabilities. Microelectronics revenue increased due to strong demand in the game processor business and networking components. Retail Stores Solutions revenue increased primarily due to clients replacing older technology in favor of integrated retail solutions. Printing Systems revenue decreased due primarily to lower mainte-nance revenue as a result of a declining install base and lower sales of hardware products. Personal Computing Division revenue decreased as a result of the company divesting its Personal Computing business to Lenovo on April 30, 2005. The 2006 results do not include any revenue while the 2005 results include four months of revenue. See note C, “Acquisitions/ Divestitures,” on pages 77 and 78 for additional information.
(Dollars in millions)
Yr.toYr.FortheYearendeddecember31: 2006 2005 change
Hardware: Gross profit $8,284 $8,718 (5.0)%
Gross profit margin 37.7% 36.5% 1.2 pts.
The decrease in gross profit dollars for 2006 versus 2005 was primarily due to the absence of the Personal Computing business. The increase in gross profit margin was also primarily due to the divestiture of the
Personal Computing business (which had a lower gross profit margin than the other hardware products) in the second quarter of 2005. This divestiture contributed 3.5 points of the improvement in the Hardware margin. Systems and Technology Group gross profit margins declined 2.7 points to 37.7 percent in 2006 versus 2005. The decline in gross profit margin was driven by revenue mix towards lower margin products in 2006 versus 2005 (2.5 points) and pricing pressure in the company’s low- and mid-range server brands. Differences between the Hardware segment gross profit margin and gross profit dollar amounts above and the amounts reported on page 25 (and derived from page 56) primarily relate to the impact of certain cost hedging transactions (see “Anticipated Royalties and Cost Transactions” on page 84) as well as the ongoing warranty costs asso-ciated with the divested Personal Computing business. The recorded amounts for these transactions are considered unallocated corporate amounts for purposes of measuring the segment’s gross margin perfor-mance and therefore are not included in the segment results above.
software(Dollars in millions)
Yr.toYr.FortheYearendeddecember31: 2006 2005* change
Software segment revenue: $18,161 $16,830 7.9%
Middleware $13,891 $12,552 10.7%
Key Branded Middleware 9,369 8,004 17.1
WebSphere family 23.3
Information Management 14.0
Lotus 12.0
Tivoli 26.3
Rational 4.4
Other middleware 4,522 4,548 (0.6)
Operating systems 2,273 2,426 (6.3)
Product Lifecycle Management 1,123 1,077 4.2
Other 873 775 12.7
* Reclassifiedtoconformwith2006presentation.
Software revenue increased 7.9 percent (7 percent adjusted for cur-rency) in 2006 versus 2005 reflecting strong demand for the company’s industry-leading middleware capabilities. The revenue growth was driven from both organic sources and the company’s targeted acquisi-tions. The company’s leadership in technology and innovation has allowed it to continue to capitalize on industry trends such as SOA and Information on Demand. Key Branded Middleware is made up of five key brands which provide an integrated suite for the company’s customers. All five brands grew in 2006, reflecting continued momentum and benefit from the company’s sales and development investments along with additional benefit from acquisitions.
ManageMent Discussioninternational business Machines corporation anD subsiDiary coMpanies
31
Black
MAC
2718 CG10

Revenue from the WebSphere family of products increased 23.3 percent (22 percent adjusted for currency) and was led by double-digit growth in WebSphere Application Servers (25.3 percent) and WebSphere Business Integration (22.7 percent) software versus 2005. WebSphere provides the foundation for Web-enabled applications and is a key product set in deploying SOA. Information Management software helps companies integrate, manage and gain value from their business information. For the year, revenue increased 14.0 percent (13 percent adjusted for currency). Growth was driven by the company’s “Information on Demand” port-folio of software products. The acquisition of FileNet Corporation, during the fourth quarter of 2006, also contributed to the growth when compared to the year-ago period. Lotus revenue increased 12.0 percent (11 percent adjusted for cur-rency) driven by the Notes/Domino family of collaboration products. The company’s Lotus products provide clients with collaborative solutions which enable the integration of people, data and business processes as part of the company’s On Demand and SOA offerings. Customer loyalty to Lotus products remains strong. Tivoli revenue increased 26.3 percent (25 percent adjusted for currency) with double-digit growth in each of its key segments: Systems Management (24.5 percent), Security (40.8 percent) and Storage (27.4 percent). The acquisitions of Micromuse, Inc. in the first quarter and MRO Software, Inc. in the fourth quarter added to the company’s capabilities in the Tivoli brand and contributed to the revenue growth. Rational revenue increased 4.4 percent (3 percent adjusted for currency) in 2006 versus 2005, in a slower growing market. Rational software provides customers with products that manage the business process of software and systems delivery. Revenue from Other middleware products declined 0.6 percent (1 percent adjusted for currency) in 2006. This product set includes more mature products which provide a more stable flow of revenue. Operating Systems revenue declined 6.3 percent (7 percent adjusted for currency) in 2006 versus 2005. Operating Systems are closely tied to the company’s server products. The decline in revenue was primarily driven by improved price performance in System z operating systems.
Product Lifecycle Management (PLM) revenue increased 4.2 percent (4 percent adjusted for currency) in 2006 versus 2005. This product set benefited from a number of large transactions in the sec-ond quarter of 2006.
(Dollars in millions)
Yr.toYr.FortheYearendeddecember31: 2006 2005 change
Software: Gross profit $15,471 $14,296 8.2%
Gross profit margin 85.2% 84.9% 0.2 pts.
The increase in Software gross profit dollars and gross profit margin was primarily driven by the 7.9 percent growth in Software revenue. The Software segment contributed $5.5 billion of pre-tax profit in 2006, an increase of 14.9 percent versus 2005. Pre-tax profit margins improved 1.5 points to 26.9%.
global financingSee pages 49 and 50 for a discussion of Global Financing’s revenue and gross profit.
financial positionDynamicsThe assets and debt associated with the company’s Global Financing business are a significant part of the company’s financial position. The financial position amounts appearing below and on pages 33 and 34 are the company’s consolidated amounts including Global Financing. However, to the extent the Global Financing business is a major driver of the consolidated financial position, this narrative section will refer to the separate Global Financing section in this Management Discussion on pages 49 through 53. The amounts appearing in the separate Global Financing section are supplementary data presented to facilitate an understanding of the company’s Global Financing business.
working capital(Dollars in millions)
atdecember31: 2006 2005
Current assets $44,660 $45,661
Current liabilities 40,091 35,152
Working capital $ 4,569 $10,509
Current ratio 1.11 1.30
Working capital decreased $5,940 million compared to the prior year primarily as a result of an increase in Current liabilities. The key drivers are described below:
Current assets decreased $1,001 million due to:
•Declineof$3,030million,netofafavorable$202millioncurrencyimpact,inCashandcashequivalentsandMarketableSecuritiesduetocurrent-yearrequirementsinpensionfunding,sharerepurchase,
ManageMent Discussioninternational business Machines corporation anD subsiDiary coMpanies
32 2006 Annual Report
Management Discussion ........................................................ 12
RoadMap............................................................................. 12
Forward-LookingandCautionaryStatements..................... 13
ManagementDiscussionSnapshot...................................... 14
DescriptionofBusiness....................................................... 15
YearinReview...................................................................... 22
PriorYearinReview............................................................. 37
DiscontinuedOperations..................................................... 41
OtherInformation................................................................ 41
GlobalFinancing.................................................................. 49
report of Management ......................................................... 54
report of independent registered public accounting firm .... 55
consolidated statements ....................................................... 56
Black
MAC
2718 CG10

dividendpayments,taxpayments,acquisitionsandcapitalspending.SeeCashFlowanalysisbelow.
•Increaseof$2,420millioninshort-termreceivablesdrivenby:
—increaseof$769millionintradereceivablesasaresultoffourthquarterrevenuegrowth;
—increaseof$743millioninfinancingreceivablesduetoassetgrowthincommercialfinancingandcustomerloans;and
—approximately$1,106millionfavorablecurrencyimpact.
Current liabilities increased $4,939 million as a result of:
•Increaseof$1,686millioninShort-termdebtasthecompanyincreasedcommercialpaperbalancesinsupportoftheincreasedGlobalFinancingassetbasediscussedabove;
•GrowthinDeferredincomedrivenbySoftware($557million)andGlobalServices($423million);
•Increaseof$1,270millioninCompensationandbenefitsprimarilyasaresultofSFASNo.158implementation;thecompanyisrequiredtorecordasacurrentliabilitytheamountofretirement-relatedbenefitpaymentsthatwillbepaidinthecomingyear($990million)thatarenotcoveredbyretirementplanassets;thiswouldoccurinunfundedorunderfundedplans;and
•Increaseof$615millioninAccountspayableofwhich$256millionwasduetotheeffectsofcurrency.
Cash FlowThe company’s cash flow from operating, investing and financing activities, as reflected in the Consolidated Statement of Cash Flows on page 58, is summarized in the table below. These amounts include the cash flows associated with the company’s Global Financing busi-ness. See pages 49 through 53.
(Dollars in millions)
for the year ended deCeMBer 31: 2006 2005
Net cash provided by/(used in) continuing operations: Operating activities $ 15,019 $14,914
Investing activities (11,549) (4,423)
Financing activities (8,204) (7,147)
Effect of exchange rate changes on cash and cash equivalents 201 (789)
Net cash used in discontinued operations—operating activities* (12) (40)
Net change in cash and cash equivalents $ (4,546) $ 2,515
* Doesnotinclude$319millionin2005ofnetproceedsfromthesaleoftheHDDbusiness.$51millionisincludedinOperatingactivitiesfromcontinuingoperationsand$268millionisincludedinInvestingactivitiesfromcontinuingoperations.
Net cash from operating activities for 2006 increased $105 million as compared to 2005 driven by the following key factors:
•Increaseinnetincomeof$1,559million;
•Decreaseincashrelatedtodeferredincometaxes,$461million,duetotheutilizationoftaxcreditcarryforwardsin2005;
•Decreaseinnetgainsonassetsales,$1,350million,drivenbythegainrelatedtothePersonalComputingbusinessdivestiturein2005;
•Pensionassetsandliabilitiescontributedanincreaseincashof$878million,primarilydrivenbylowerpensionfundingof$549million($1,840millionfundingofnon-U.S.plansin2006versus$2,389milliontotalfundingin2005);
•IncreaseincashdrivenbyAccountspayableof$891millionprimarilyasaresultofthePersonalComputingbusinessdivestiturein2005;and
•Growthinaccountsreceivabledroveauseofcashof$2,731million;thiswasdrivenbyGlobalFinancingreceivables($2,071million)primarilyduetoassetgrowthinthesecondhalfof2006;inaddition,thePersonalComputingbusinessdivestiturecontributedtothisyear-to-yeardecreaseincash.
Net cash used in investing activities increased $7,126 million on a year-to-year basis driven by:
•Netpurchasesofmarketablesecuritiesandotherinvestmentsof$2,668million;
•Increasedspendingof$2,316millionforacquisitions;
•Increaseinnetcapitalspendingof$1,210millionasaresultofa$521millionincreaseincapitalexpendituresprimarilytosupporttheSObusiness,anda$677milliondecreaseinrealestatesalesversustheprioryear;and
•Adeclineindivestiturerelatedcashproceedsof$932million:$662millionrelatedtothePersonalComputingbusinessdivestitureand$268millionreceivedfromHitachirepresentingthefinalproceedsrelatedtotheHDDbusinesssale;bothofthesepaymentswerereceivedin2005.
Net cash used in financing activities increased $1,057 million com-pared to 2005 as a result of:
•Higherdividendpaymentsof$434millionasaresultoftheincreaseinthecompany’squarterlycommonstockdividendfrom$0.20to$0.30pershare;and
•Increaseinnetcashusedtoretiredebtof$730million.
Within total debt, on a net basis, the company utilized $121 million in net cash to retire debt versus $609 million in net proceeds from new debt in 2005. The net cash used in 2006 to retire debt was com-prised of: $3,400 million in cash payments to retire debt offset by $1,444 million of new debt issuances and $1,834 million in net short-term borrowings. See note K, “Borrowings,” on pages 81 to 83 for a listing of the company’s debt securities.
ManageMent DisCussioninternational business MaChines Corporation anD subsiDiary CoMpanies
33
Black
MAC
2718 CG10

non-Current assets and liabilities(Dollars in millions)
at deCeMBer 31: 2006 2005
Non-current assets $58,574 $60,087
Long-term debt $13,780 $15,425
Non-current liabilities (excluding debt) $20,857 $22,073
The decrease in Non-current assets of $1,513 million compared to the prior year-end balance was primarily driven by:
•Adeclineof$9,996million($10,776millionexcludingtheeffectsofcurrency)inPrepaidpensionassetsprimarilyattributabletotheimple-mentationofSFASNo.158whichrequiresthatonlyoverfundedplans( fairvalueofplanassetsexceedthebenefitobligation)berecognizedasaPrepaidpensionassetfortheexcessamount.
The significant decline in Prepaid pension assets was offset by increases in other non-current asset categories as follows:
•IncreaseinGoodwillof$3,413millionand$539millioninIntangibleassets-net,bothdrivenbythecompany’sacquisitionsinthecurrentyear;
•Growthof$440millioninlong-termfinancingreceivablesduetoincreasedGlobalFinancingvolumes;
•Increaseof$3,408millioninInvestmentsandsundryassetswhichwasattributabletothreekeyfactors:
—increaseof$2,048millioninnon-currentdeferredtaxassetsprimarilyasaresultofSFASNo.158;
—growthof$451millionindeferredtransitioncostsdrivenbyanincreaseinlong-termservicesarrangementswithclients;and
—$345millionduetoincreasedinvestmentsinlong-termmarketablesecurities.
Long-term debt decreased $1,644 million primarily due to a reclas-sification to short-term debt as these items approach maturity. The company continually monitors its liquidity profile and interest rates, and manages its short- and long-term debt portfolios accordingly.
Other non-current liabilities, excluding debt, decreased $1,216 million due to decreases of $951 million ($1,145 million before the effects of currency) in non-current deferred tax liabilities and $226 million ($858 million before the effects of currency) in Retirement and nonpension postretirement benefit obligations primarily due to the implementation of SFAS No. 158.
DebtThe company’s funding requirements are continually monitored and strategies are executed to manage the company’s overall asset and liability profile. Additionally, the company maintains sufficient flexi-bility to access global funding sources as needed.
(Dollars in millions)
at deCeMBer 31: 2006 2005
Total company debt $22,682 $22,641
Non-Global Financing debt* $ 395 $ 2,142
Non-Global Financing debt/ capitalization 1.5% 6.7%
* Non-GlobalFinancingdebtisthecompany’stotalexternaldebtlesstheGlobalFinancingdebtdescribedintheGlobalFinancingbalancesheetonpage50.
Non-Global Financing debt decreased $1,747 million and the debt-to-capital ratio at December 31, 2006 was at 1.5 percent. Non-Global Financing debt decreased versus 2005 as the company paid down debt, including debt used in 2005 to facilitate the company’s repatria-tion actions under the American Jobs Creation Act of 2004.
equity(Dollars in millions)
at deCeMBer 31: 2006 2005
Stockholders’ equity:Total $28,506 $33,098
The company’s consolidated Stockholders’ equity decreased $4,592 million in 2006 as a result of several key factors:
•Adeclineof$6,885millioninAccumulatedgainsand(losses)notaffectingretainedearningsprimarilyasaresultofthenon-cashequityimpactsrelatedtotheimplementationofSFASNo.158;
•Dividendpaymentsof$1,683million;and
•Adecreasedrivenbynetstocktransactionsof$5,405million,primarilyaresultofthecompany’songoingcommonstockrepurchaseprogram.
These reductions in Stockholders’ equity were partially offset by an increase in retained earnings driven by current year net income of $9,492 million.
sFas no. 158The impacts related to the implementation of SFAS No. 158 on the Consolidated Statement of Financial Position are discussed in detail in note V, “Retirement-Related Benefits,” on pages 100 to 111 and note A, “Significant Accounting Policies,” on pages 67 to 68.
ManageMent DisCussioninternational business MaChines Corporation anD subsiDiary CoMpanies
34 2006AnnualReport
Management Discussion ........................................................ 12
RoadMap............................................................................. 12
Forward-LookingandCautionaryStatements..................... 13
ManagementDiscussionSnapshot...................................... 14
DescriptionofBusiness....................................................... 15
YearinReview...................................................................... 22
PriorYearinReview............................................................. 37
DiscontinuedOperations..................................................... 41
OtherInformation................................................................ 41
GlobalFinancing.................................................................. 49
report of Management ......................................................... 54
report of independent registered public accounting Firm .... 55
Consolidated statements ....................................................... 56
Black
MAC
2718 CG10

ConsoliDateD Fourth-Quarter results(Dollars and shares in millions except per share amounts)
yr. to yr. perCent/ Margin for fourth quarter: 2006 2005 Change
Revenue $26,257 $24,427 7.5%*
Gross profit margin 44.6% 44.1% 0.5pts.
Total expense and other income $ 6,887 $ 6,197 11.1%
Total expense and other income-to-revenue ratio 26.2% 25.4% 0.9pts.
Income from continuing operations before income taxes $ 4,814 $ 4,568 5.4%
Provision for income taxes $ 1,350 $ 1,348 0.2%
Income from continuing operations $ 3,464 $ 3,220 7.6%
Income from discontinued operations $ 76 $ 3 NM
Cumulative effect of change in accounting principle** $ — $ (36) NM
Earnings per share of common stock: Assuming dilution: Continuing operations $ 2.26 $ 2.01 12.4%
Discontinued operations 0.05 — NM
Cumulative effect of change in accounting principle** — (0.02) NM
Total $ 2.31 $ 1.99 16.1%
Weighted-average shares outstanding: Assuming dilution 1,532.5 1,604.8 (4.5)%
* 4.1percentadjustedforcurrency.
**ReflectsimplementationofFinancialAccountingStandardsBoard(FASB)InterpretationNo.47.SeenoteB,“AccountingChanges,”onpage72foradditionalinformation.
NM—Notmeaningful
Continuing operationsIn the fourth quarter, the company increased Income from continuing operations by 7.6 percent ($244 million) to $3.5 billion versus the fourth quarter of 2005. Diluted earnings per share from continuing operations of $2.26 increased 12.4 percent versus the prior year. The company’s performance in the fourth quarter was driven by several factors:
•Strongrevenuegrowthinthesoftwarebusiness,drivenbycontinuedmomentuminstrategicmiddlewareandadditionalbenefitsfromrecentacquisitions;
•Animprovedservicesbusinessprofilethatdeliveredacceleratedrevenuegrowthand$17.8billionofnewbusinesssignings;and
•Improvedgrossmarginsresultingfromcontinuedproductivityinitiativesacrossthebusinesssegments.
Total revenue in the fourth quarter of $26.3 billion increased 7.5 percent as reported (4 percent adjusted for currency). From a geo-graphic perspective, the Americas and Asia Pacific had the strongest growth, (when adjusted for currency) with improved performance in Japan and positive contributions from emerging countries. Americas’ revenue was $11.1 billion, an increase of 5.9 percent as reported (5 percent adjusted for currency). EMEA revenue was $9.3 billion, up 11.2 percent (3 percent adjusted for currency). Asia Pacific revenue increased 6.9 percent (5 percent adjusted for currency) to $4.8 billion. Revenue from Japan improved with an increase of 2.9 percent (3 percent adjusted for currency) when compared to the fourth quarter of 2005. The emerging countries of Brazil, India, Russia and China together grew 20.7 percent (18 percent adjusted for currency). The company’s two services segments together had $12.8 billion of revenue in the fourth quarter, an increase of 6.8 percent (3 percent adjusted for currency) when compared to the same period of 2005. Total signings for services in the fourth quarter were $17.8 billion, an increase of 55.1 percent over the year-ago period. Global Technology Services revenue increased 7.1 percent (4 percent adjusted for cur-rency). The acceleration in revenue growth was across the segment’s key offerings. Integrated Technology Services, demonstrating progress from the implementation of new offerings and contribution from the newly acquired Internet Security Systems business grew 7.8 percent, with signings growth of 20 percent—all geographies grew signings. Strategic Outsourcing revenue increased 7.2 percent and signings doubled year over year, with growth in all geographies. Business Transformation Outsourcing revenue increased 8.5 percent. BTO signings declined 57 percent year to year compared to a very strong fourth quarter of 2005. The GTS segment fourth-quarter pre-tax margin was 9.3 percent, down 3.7 points as compared to a strong fourth quarter of 2005. The company is continuing to make invest-ments in sales, delivery and business development skills across its entire set of offerings, as well as investing in strategic outsourcing infrastructure and BTO capabilities. Global Business Services revenue increased 6.1 percent (3 percent adjusted for currency) led by solid performance in consulting. Revenue performance improved during the second half of 2006, as the company expanded its focus from operational transformation to a focus on profitable growth. Shorter term signings increased 13.5 per-cent year to year due primarily to strength in higher value add engagements. Longer term signings increased over 200 percent in the fourth quarter driven primarily by AMS. The GBS segment fourth- quarter pre-tax margin improved 2.3 points to 11.8 percent driven by improved resource utilization, strong contract management and delivery, and stable-to-improved pricing.
ManageMent DisCussioninternational business MaChines Corporation anD subsiDiary CoMpanies
35
Black
MAC
2718 CG10

Systems and Technology Group segment revenue was $7.1 billion and increased 3.2 percent as reported (flat adjusted for currency), when compared to the fourth quarter of 2005. System z revenue increased 4.5 percent, with MIPS volume growth of 6 percent year to year. System i revenue declined 10.1 percent as sales of upgrades declined year to year as customers continue to leverage their existing capability. Revenue from System p grew 3.5 percent, driven by high-end server sales as customers leverage the platform’s virtualization capabilities to consoli-date multiple smaller servers into high-end servers. System x server revenue increased 6.8 percent with growth in both EMEA and Asia Pacific, partially offset by decreased revenue in the Americas as cus-tomers continue to evaluate processor alternatives. Blades revenue was essentially flat year over year, with growth in both EMEA and Asia Pacific offset by a decline in the Americas. Storage products increased 9.3 percent, driven by growth in Total disk products of 11.8 percent. Tape products increased 3.9 percent on the continued strength of the new tape security offering. Microelectronics OEM revenue declined 5.6 percent when compared to a very strong fourth quarter of 2005. Retail Store Solutions increased 24.9 percent as customers are replac-ing older technology in favor of integrated retail solutions. Software segment revenue of $5.6 billion, increased 14.4 percent (11 percent adjusted for currency), reflecting strong demand for the company’s industry-leading middleware capabilities. In the fourth quarter, revenue from key branded middleware increased 25.1 percent (21 percent adjusted for currency), with all of the five brands deliver-ing double-digit growth. The growth came from both organic sources and strategic acquisitions. The major acquisitions for the year of FileNet, MRO and Micromuse contributed to the growth in the Information Management and Tivoli brands. The WebSphere family of software grew 21.8 percent, with continued strong performance from Application Servers and Business Integration products. Information Management software increased 27.9 percent, driven by the company’s distributed relational database and information on demand product sets. Lotus grew 29.7 percent, benefiting from strong momentum in its Notes/Domino family of collaboration prod-ucts and broad adoption of its enhanced version of Sametime, which started shipping in the third quarter of 2006. Tivoli increased 25.4 percent with double-digit growth in Systems Management, Security
and Storage software. Rational increased 12.0 percent in a slower growing market. In addition to the strong revenue growth in the fourth quarter, the software segment had pre-tax profit of $2.0 billion, an increase of 4.1 percent year to year. The pre-tax margin of 32.3 percent decreased 3.2 points versus 2005, primarily due to the inte-gration of new acquisitions. Global Financing revenue increased 2.9 percent (flat adjusted for currency), driven primarily by client financing revenue due to an increased average asset base. The company’s consolidated gross profit margin was 44.6 percent in the fourth quarter, compared with 44.1 percent in the year-ago period. The increase of 0.5 points was driven primarily by improved margins in services and a mix towards the higher margin software business. Total expense and other income increased 11.1 percent compared to the prior-year period. Selling, general and administrative expense increased 7.0 percent (4 percent adjusted for currency), driven pri-marily by investments the company made in its software and services businesses, emerging markets and acquisitions. Partially offsetting these increases was the year-over-year decline from the pre-tax curtail-ment charge of $267 million related to pension changes recorded in the fourth quarter of 2005. RD&E expense increased 8.8 percent in the fourth quarter, driven partially by acquisitions with the remainder reflecting the company’s ongoing investments to maintain technology leadership across its products and services. Other (income) and expense was $150 million of income, a reduction of $184 million (55.0 percent) versus the fourth quarter of 2005. In the prior year, gains on real estate transactions were unusually high due to several large trans-actions compared with current year real estate activity. The company’s effective tax rate in the fourth-quarter 2006 was 28.0 percent compared with 29.5 percent in the fourth quarter of 2005. The 1.5 point decrease in the fourth-quarter 2006 tax rate was primarily attributable to the net effect of several items in the quarter. In 2006, the fourth-quarter tax rate was favorably impacted by the settlement of the U.S. federal income tax audit for the years 2001 through 2003 as well as the retroactive reinstatement of the U.S. research tax credit during the quarter. These benefits were partially offset by the one-time tax cost associated with the intercompany transfer of certain intellectual property, which also occurred in the fourth quarter. In addition, the quarter also benefited from a more favorable mix of income in lower tax jurisdictions. Share repurchases totaled approximately $1.4 billion in the fourth quarter. The weighted-average number of diluted common shares outstanding in the fourth-quarter 2006 was 1,532.5 million compared with 1,604.8 million in the same period of 2005. The company generated $5,334 million in cash flow provided by operating activities. This was driven primarily by net income and continued focus on working capital. Net cash used in investing activities of $5,634 million, increased significantly ($4,203 million) versus the fourth quarter of 2005, driven primarily by increased spending on acquisitions.
ManageMent DisCussioninternational business MaChines Corporation anD subsiDiary CoMpanies
36 2006AnnualReport
Management Discussion ........................................................ 12
RoadMap............................................................................. 12
Forward-LookingandCautionaryStatements..................... 13
ManagementDiscussionSnapshot...................................... 14
DescriptionofBusiness....................................................... 15
YearinReview...................................................................... 22
PriorYearinReview............................................................. 37
DiscontinuedOperations..................................................... 41
OtherInformation................................................................ 41
GlobalFinancing.................................................................. 49
report of Management ......................................................... 54
report of independent registered public accounting Firm .... 55
Consolidated statements ....................................................... 56
Black
MAC
2718 CG10
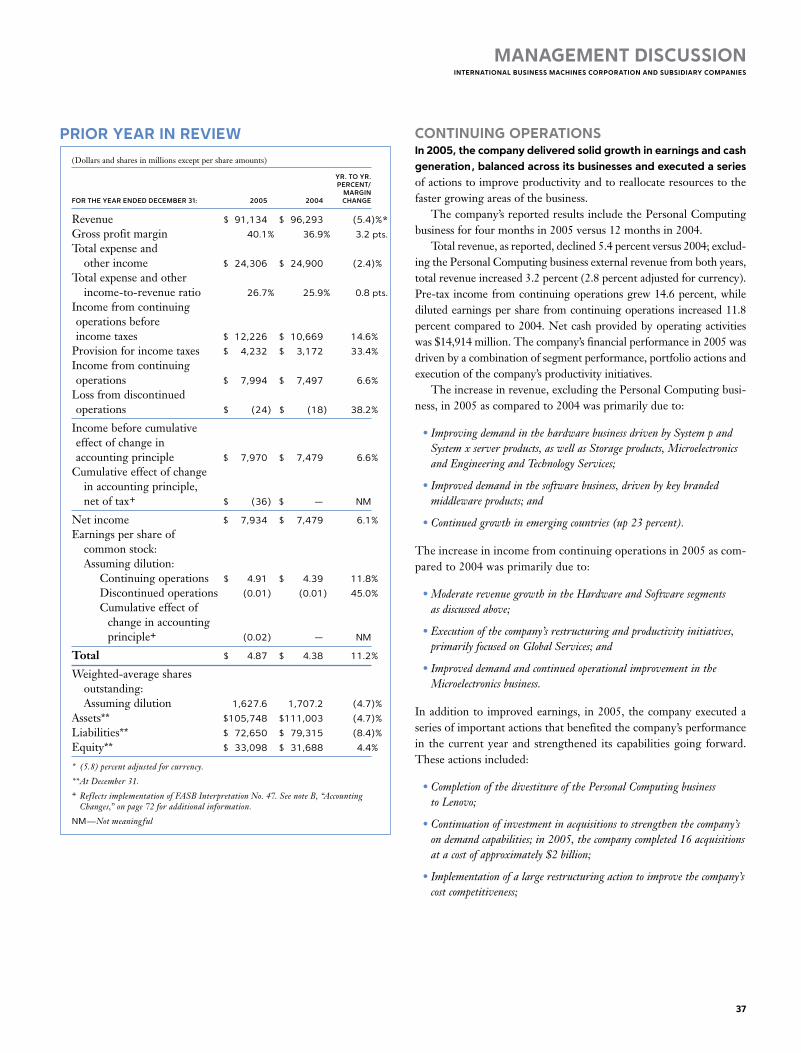
Continuing operationsin 2005, the company delivered solid growth in earnings and cash generation, balanced across its businesses and executed a series of actions to improve productivity and to reallocate resources to the faster growing areas of the business. The company’s reported results include the Personal Computing business for four months in 2005 versus 12 months in 2004. Total revenue, as reported, declined 5.4 percent versus 2004; exclud-ing the Personal Computing business external revenue from both years, total revenue increased 3.2 percent (2.8 percent adjusted for currency). Pre-tax income from continuing operations grew 14.6 percent, while diluted earnings per share from continuing operations increased 11.8 percent compared to 2004. Net cash provided by operating activities was $14,914 million. The company’s financial performance in 2005 was driven by a combination of segment performance, portfolio actions and execution of the company’s productivity initiatives. The increase in revenue, excluding the Personal Computing busi-ness, in 2005 as compared to 2004 was primarily due to:
•ImprovingdemandinthehardwarebusinessdrivenbySystempandSystemxserverproducts,aswellasStorageproducts,MicroelectronicsandEngineeringandTechnologyServices;
•Improveddemandinthesoftwarebusiness,drivenbykeybrandedmiddlewareproducts;and
•Continuedgrowthinemergingcountries(up23percent).
The increase in income from continuing operations in 2005 as com-pared to 2004 was primarily due to:
•ModeraterevenuegrowthintheHardwareandSoftwaresegmentsasdiscussedabove;
•Executionofthecompany’srestructuringandproductivityinitiatives,primarilyfocusedonGlobalServices;and
•ImproveddemandandcontinuedoperationalimprovementintheMicroelectronicsbusiness.
In addition to improved earnings, in 2005, the company executed a series of important actions that benefited the company’s performance in the current year and strengthened its capabilities going forward. These actions included:
•CompletionofthedivestitureofthePersonalComputingbusinesstoLenovo;
•Continuationofinvestmentinacquisitionstostrengthenthecompany’sondemandcapabilities;in2005,thecompanycompleted16acquisitionsatacostofapproximately$2billion;
•Implementationofalargerestructuringactiontoimprovethecompany’scostcompetitiveness;
prior year in review
(Dollars and shares in millions except per share amounts)
yr. to yr. perCent/ Margin for the year ended deCeMBer 31: 2005 2004 Change
Revenue $91,134 $ 96,293 (5.4)%*
Gross profit margin 40.1% 36.9% 3.2pts.
Total expense and other income $ 24,306 $ 24,900 (2.4)%
Total expense and other income-to-revenue ratio 26.7% 25.9% 0.8pts.
Income from continuing operations before income taxes $ 12,226 $ 10,669 14.6%
Provision for income taxes $ 4,232 $ 3,172 33.4%
Income from continuing operations $ 7,994 $ 7,497 6.6%
Loss from discontinued operations $ (24) $ (18) 38.2%
Income before cumulative effect of change in accounting principle $ 7,970 $ 7,479 6.6%
Cumulative effect of change in accounting principle, net of tax+ $ (36) $ — NM
Net income $ 7,934 $ 7,479 6.1%
Earnings per share of common stock: Assuming dilution: Continuing operations $ 4.91 $ 4.39 11.8%
Discontinued operations (0.01) (0.01) 45.0%
Cumulative effect of change in accounting principle+ (0.02) — NM
Total $ 4.87 $ 4.38 11.2%
Weighted-average shares outstanding: Assuming dilution 1,627.6 1,707.2 (4.7)%
Assets** $105,748 $111,003 (4.7)%
Liabilities** $ 72,650 $ 79,315 (8.4)%
Equity** $ 33,098 $ 31,688 4.4%
* (5.8)percentadjustedforcurrency.
**AtDecember31.+ ReflectsimplementationofFASBInterpretationNo.47.SeenoteB,“Accounting
Changes,”onpage72foradditionalinformation.
NM—Notmeaningful
ManageMent DisCussioninternational business MaChines Corporation anD subsiDiary CoMpanies
37
Black
MAC
2718 CG10

•Changeofthecompany’soperatingmodelinEurope—shiftingresourcesanddecision-makingclosertotheclients;
•Redesignofthecompany’sU.S.pensionplan,aswellastakingactionsinothercountries;overthelongerterm,theseactionswillreducevolatilityandprovideamorecompetitivecoststructure;
•Repatriationof$9.5billionofforeignearningsundertheAmericanJobsCreationActof2004improvingthecompany’sgeographicliquidityposition;and
•Furtherextensionofthecompany’scommitmenttoinnovationandopenstandards.
On April 30, 2005, the company sold its Personal Computing busi-ness. Accordingly, the company’s reported revenue results include four months of revenue for the Personal Computing Division in 2005 versus 12 months in 2004. A significant driver of the changes in rev-enue, on an as-reported basis, is the incomparable periods for which the Personal Computing business results are included in the as-reported results. As-reported revenue across all industry sectors declined, except for the Distribution sector, which was essentially flat, due to the sale of the Personal Computing business. The Financial Services revenue decrease (1.7 percent) was driven by Financial Markets (12.2 percent) partially offset by increases in Insurance (1.9 percent) and Banking (0.5 percent). The Public sector revenue decline ( 5.1 percent) was driven by Education (31.0 percent), Life Sciences (19.1 percent) and Government (2.0 percent), partially offset by increased revenue in Healthcare (13.1 percent). The Distribution sector revenue increase (0.1 percent) was driven by Travel and Transportation (11.0 percent) and Consumer Products (2.6 percent), partially offset by lower reve-nue in Retail industry (7.5 percent). The decrease (3.4 percent) in Communications sector revenue was driven by Media and Entertainment (11.5 percent), Utilities ( 5.4 percent) and Telecommu-nications (1.1 percent). Revenue from Small & Medium Business declined 13.6 percent. Americas’ revenue declined 3.1 percent (4 percent adjusted for currency) and was driven by the sale of the Personal Computing busi-ness. The U.S. declined 5 percent, while Canada increased 5 percent (declined 3 percent adjusted for currency) and Latin America increased 8 percent (declined 2 percent adjusted for currency).
Revenue in EMEA declined ( 5.1 percent as reported and 4 per-cent adjusted for currency) across most major countries driven by the sale of the Personal Computing business. Of the major countries, Germany declined 12 percent (11 percent adjusted for currency), France declined 7 percent (6 percent adjusted for currency), Italy declined 11 percent (10 percent adjusted for currency), the U.K. declined 1 percent (flat adjusted for currency) and Spain declined 1 percent (flat adjusted for currency). Asia Pacific had the weakest results (decreased 12.5 percent as reported and 13 percent adjusted for currency) of the major geogra-phies in 2005. Japan, which represents about 60 percent of the Asia Pacific revenue base, declined 13 percent (11 percent adjusted for currency) in 2005 versus 2004. In addition, ASEAN (Association of Southeast Asian Nations) revenue declined 3 percent (3 percent adjusted for currency) and China declined 19 percent (20 percent adjusted for currency), while India revenue increased 10 percent (8 percent adjusted for currency). The company continued to invest in growth initiatives in its emerging countries. Revenue growth in these emerging countries was driven by client investment to build out their infrastructures, especially in the Financial Services sector. Overall revenue in these countries declined 2 percent (9 percent adjusted for currency). The declines were driven by the sale of the Personal Computing business. China declined 19 percent (20 percent adjusted for currency), while Brazil’s revenue grew 21 percent (1 percent adjusted for currency), India’s revenue grew 10 percent (8 percent adjusted for currency) and Russia’s revenue increased 2 percent (2 percent adjusted for currency). OEM revenue increased 13.4 percent primarily due to improved manufacturing yields for game processors driven by the ramp up of production for these processors in the second half of 2005. In addi-tion, E&TS revenue continued to show strong revenue growth. The company believes that a more appropriate discussion is one that excludes the revenue results of the Personal Computing business in both 2005 and 2004 because it presents results on a comparable basis and provides a more meaningful discussion which focuses on the company’s ongoing operational performance. Revenue across all Industry sectors increased, except for the Industrial sector, when excluding revenue from the Personal Computing business. Revenue growth was lead by Small & Medium Business (6.5 percent) followed by the Public sector (5.4 percent), Distribution sector (5.0 percent), Financial Services (1.7 percent) and Communications (0.8 percent). Revenue from the Industrial sector declined 2.3 percent. Revenue in all geographies increased in 2005 versus 2004, with the exception of Asia Pacific. Americas’ revenue increased 5.1 percent (4 percent adjusted for currency) with growth across all key brands and regions. Revenue in EMEA increased 2.3 percent (4 percent adjusted for currency) with mixed performance across the major countries. Asia Pacific revenue decreased 0.9 percent (1 percent adjusted for currency). Overall revenue in the emerging countries of Brazil, India, Russia and China increased a combined 23 percent (14 percent adjusted for currency) in 2005 versus 2004.
ManageMent DisCussioninternational business MaChines Corporation anD subsiDiary CoMpanies
38 2006AnnualReport
Management Discussion ........................................................ 12
RoadMap............................................................................. 12
Forward-LookingandCautionaryStatements..................... 13
ManagementDiscussionSnapshot...................................... 14
DescriptionofBusiness....................................................... 15
YearinReview...................................................................... 22
PriorYearinReview............................................................. 37
DiscontinuedOperations..................................................... 41
OtherInformation................................................................ 41
GlobalFinancing.................................................................. 49
report of Management ......................................................... 54
report of independent registered public accounting Firm .... 55
Consolidated statements ....................................................... 56
Black
MAC
2718 CG10

The following is an analysis of the reportable segment results for Global Services, Hardware and Software. The Global Financing analy-sis is included in the Global Financing section on pages 49 and 50.
global servicesGlobal Services revenue increased 2.4 percent (2.0 percent adjusted for currency) in 2005 versus 2004.
(Dollars in millions)
yr. to yr. for the year ended deCeMBer 31: 2005 2004 Change
Global Services segment revenue: $47,407 $46,283 2.4%
Global Technology Services $31,501 $30,082 4.7%
Strategic Outsourcing 16,522 15,957 3.5
Integrated Technology Services 7,538 7,441 1.3
Business Transformation Outsourcing 1,573 988 59.2
Maintenance 5,868 5,696 3.0
Global Business Services $15,906 $16,201 (1.8)%
Global Technology Services revenue increased 4.7 percent (4 percent adjusted for currency). Although SO revenue continued to grow ( 3.5 percent), it experienced a slowdown in its revenue growth rate due to the impact of high levels of backlog erosion experienced in 2004 and the cumulative effect of lower signings, starting in 2004 through the first quarter of 2005. SO revenue growth was driven by EMEA (10 percent) and Asia Pacific (1 percent), while the Americas was essentially flat. ITS signings were down 7 percent in 2005 versus 2004. The ITS business is more dependent upon short-term signings for revenue growth and signings declines in the third and fourth quarter impacted the overall revenue growth rate (1.3 percent) for 2005. The company began to rebalance its ITS offerings and shift its business development and delivery capabilities and skills to higher growth areas in the third quarter of 2005. The company’s BTO busi-ness continued its strong year-to-year growth (59.2 percent) due to signings performance in both 2004 and 2005. Revenue growth was strong across all geographies. Global Business Services revenue decreased 1.8 percent (2 per-cent adjusted for currency) in 2005 versus 2004. Revenue declined 10 percent in both Asia Pacific and EMEA and increased in the Americas by 14 percent. The company’s Consulting and Systems Integration business had many areas of growth, with strong performance in the Strategy and Change and Supply Chain Management practices. This overall growth was mitigated by weakness year to year in Japan, Germany and the company’s Federal Business in the U.S. However, across all practices, the company drove improved resource utilization and pricing trends remained stable to improving.
hardware(Dollars in millions)
yr. to yr. for the year ended deCeMBer 31: 2005 2004 Change
Hardware segment revenue: $23,857 $30,710 (22.3)%
Systems and Technology Group $20,981 $19,973 5.0%
System z (7.6)
System i 0.8
System p 14.6
System x 5.9
System Storage 15.3
Microelectronics 15.6
Engineering & Technology Services 39.2
Retail Store Solutions (23.0)
Printing Systems (8.6)
Personal Computing Division 2,876 10,737 NM
NM—Notmeaningful
Systems and Technology Group revenue increased 5.0 percent (5 percent adjusted for currency) in 2005 versus 2004. System p server revenue increased 14.6 percent with double-digit growth in all geog-raphies as clients continue to recognize the strength and leadership of the POWER architecture. In October 2005, the company announced a new POWER5+ processor that included the industry’s first Quad Core Module, which puts four processor cores on a single piece of ceramic. System i server revenue increased 0.8 percent driven by broad demand for the company’s POWER5 based offerings. In 2005, System i added over 2,500 new clients, reflecting a continued commit-ment to the platform from ISVs, resellers and clients. Within System x, server revenue increased 7 percent despite strong competitive pressures driving lower prices, particularly in EMEA and Asia. The company’s momentum in Blades remained strong with revenue growth of 65 percent in 2005 versus 2004. Although System z server revenue declined 7.6 percent versus 2004, MIPS volumes grew 7 percent in 2005. The MIPS growth was driven by the company’s new System z9 which began shipping in late September 2005. System z clients con-tinued to add new workloads to this platform as they build their on demand infrastructure. These new workloads have accelerated Java and Linux adoption on the System z platform. System Storage revenue growth (15.3 percent) was driven by Total disk revenue growth of 19 percent, while tape grew 9 percent in 2005 versus 2004. Within External disk, mid-range disk and enterprise products both had strong revenue growth of approximately 24 per-cent in 2005 versus 2004.
ManageMent DisCussioninternational business MaChines Corporation anD subsiDiary CoMpanies
39
Black
MAC
2718 CG10
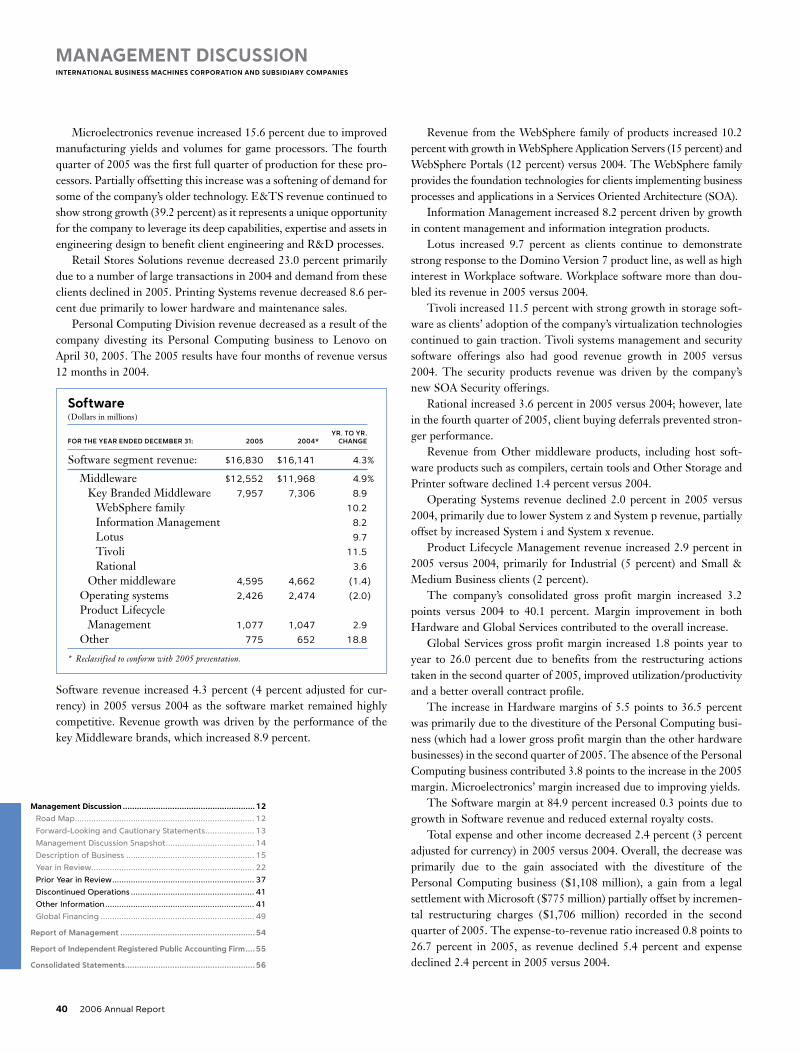
Microelectronics revenue increased 15.6 percent due to improved manufacturing yields and volumes for game processors. The fourth quarter of 2005 was the first full quarter of production for these pro-cessors. Partially offsetting this increase was a softening of demand for some of the company’s older technology. E&TS revenue continued to show strong growth (39.2 percent) as it represents a unique opportunity for the company to leverage its deep capabilities, expertise and assets in engineering design to benefit client engineering and R&D processes. Retail Stores Solutions revenue decreased 23.0 percent primarily due to a number of large transactions in 2004 and demand from these clients declined in 2005. Printing Systems revenue decreased 8.6 per-cent due primarily to lower hardware and maintenance sales. Personal Computing Division revenue decreased as a result of the company divesting its Personal Computing business to Lenovo on April 30, 2005. The 2005 results have four months of revenue versus 12 months in 2004.
software(Dollars in millions)
yr. to yr. for the year ended deCeMBer 31: 2005 2004* Change
Software segment revenue: $16,830 $16,141 4.3%
Middleware $12,552 $11,968 4.9%
Key Branded Middleware 7,957 7,306 8.9
WebSphere family 10.2
Information Management 8.2
Lotus 9.7
Tivoli 11.5
Rational 3.6
Other middleware 4,595 4,662 (1.4)
Operating systems 2,426 2,474 (2.0)
Product Lifecycle Management 1,077 1,047 2.9
Other 775 652 18.8
* Reclassifiedtoconformwith2005presentation.
Software revenue increased 4.3 percent (4 percent adjusted for cur-rency) in 2005 versus 2004 as the software market remained highly competitive. Revenue growth was driven by the performance of the key Middleware brands, which increased 8.9 percent.
Revenue from the WebSphere family of products increased 10.2 percent with growth in WebSphere Application Servers (15 percent) and WebSphere Portals (12 percent) versus 2004. The WebSphere family provides the foundation technologies for clients implementing business processes and applications in a Services Oriented Architecture (SOA). Information Management increased 8.2 percent driven by growth in content management and information integration products. Lotus increased 9.7 percent as clients continue to demonstrate strong response to the Domino Version 7 product line, as well as high interest in Workplace software. Workplace software more than dou-bled its revenue in 2005 versus 2004. Tivoli increased 11.5 percent with strong growth in storage soft-ware as clients’ adoption of the company’s virtualization technologies continued to gain traction. Tivoli systems management and security software offerings also had good revenue growth in 2005 versus 2004. The security products revenue was driven by the company’s new SOA Security offerings. Rational increased 3.6 percent in 2005 versus 2004; however, late in the fourth quarter of 2005, client buying deferrals prevented stron-ger performance. Revenue from Other middleware products, including host soft-ware products such as compilers, certain tools and Other Storage and Printer software declined 1.4 percent versus 2004. Operating Systems revenue declined 2.0 percent in 2005 versus 2004, primarily due to lower System z and System p revenue, partially offset by increased System i and System x revenue. Product Lifecycle Management revenue increased 2.9 percent in 2005 versus 2004, primarily for Industrial (5 percent) and Small & Medium Business clients (2 percent). The company’s consolidated gross profit margin increased 3.2 points versus 2004 to 40.1 percent. Margin improvement in both Hardware and Global Services contributed to the overall increase. Global Services gross profit margin increased 1.8 points year to year to 26.0 percent due to benefits from the restructuring actions taken in the second quarter of 2005, improved utilization/productivity and a better overall contract profile. The increase in Hardware margins of 5.5 points to 36.5 percent was primarily due to the divestiture of the Personal Computing busi-ness (which had a lower gross profit margin than the other hardware businesses) in the second quarter of 2005. The absence of the Personal Computing business contributed 3.8 points to the increase in the 2005 margin. Microelectronics’ margin increased due to improving yields. The Software margin at 84.9 percent increased 0.3 points due to growth in Software revenue and reduced external royalty costs. Total expense and other income decreased 2.4 percent (3 percent adjusted for currency) in 2005 versus 2004. Overall, the decrease was primarily due to the gain associated with the divestiture of the Personal Computing business ($1,108 million), a gain from a legal settlement with Microsoft ($775 million) partially offset by incremen-tal restructuring charges ($1,706 million) recorded in the second quarter of 2005. The expense-to-revenue ratio increased 0.8 points to 26.7 percent in 2005, as revenue declined 5.4 percent and expense declined 2.4 percent in 2005 versus 2004.
ManageMent DisCussioninternational business MaChines Corporation anD subsiDiary CoMpanies
40 2006AnnualReport
Management Discussion ........................................................ 12
RoadMap............................................................................. 12
Forward-LookingandCautionaryStatements..................... 13
ManagementDiscussionSnapshot...................................... 14
DescriptionofBusiness....................................................... 15
YearinReview...................................................................... 22
PriorYearinReview............................................................. 37
DiscontinuedOperations..................................................... 41
OtherInformation................................................................ 41
GlobalFinancing.................................................................. 49
report of Management ......................................................... 54
report of independent registered public accounting Firm .... 55
Consolidated statements ....................................................... 56
Black
MAC
2718 CG10

Total SG&A expense of $21,314 million increased 6.1 percent (6 percent adjusted for currency). The increase was primarily driven by the restructuring charges recorded in the second quarter of 2005. In addition, retirement-related expenses increased ($236 million) in 2005. These increases were partially offset by lower operational expenses as a result of the restructuring actions and the Personal Computing business divestiture, lower stock-based compensation expense of $308 million and lower ongoing workforce reductions. In addition, Bad debt expense declined $164 million primarily due to decreased specific reserve requirements, an overall reduction in the financing asset portfolio, an improvement in economic conditions and improved credit quality. Other (income) and expense was income of $2,122 million and $23 million in 2005 and 2004, respectively. The increase was primar-ily driven by the gain on the sale of the Personal Computing business. The pre-tax gain associated with this transaction was $1,108 million. In addition, the company settled certain antitrust issues with the Microsoft Corporation and the gain from this settlement was $775 million; additional Interest income ($127 million) generated by the company in 2005; and lower foreign currency transaction losses of $211 million, which relate to losses on certain hedge contracts offset by settlement of foreign currency receivables and payables. The com-pany also had additional gains ($108 million) from the sale of certain real estate transactions in 2005 versus 2004. These gains were par-tially offset by real-estate related restructuring charges recorded in the second quarter of 2005. Research, development and engineering (RD&E) expense of $5,842 million decreased $32 million or 0.6 percent driven by the sale of the Personal Computing business in the second quarter of 2005 ($93 million) and lower spending in Microelectronics ($93 mil-lion) and Software ($25 million). These decreases were partially offset by increased spending in Systems and Technology for server products ($171 million). Included in RD&E expense was increased retirement-related expense of $95 million and a decrease of $94 mil-lion for stock-based compensation expense in 2005 versus 2004. Intellectual property (IP) and custom development income of $948 million decreased $222 million or 19.0 percent in 2005 versus 2004. The decrease was driven by Sales and other transfers of intel-lectual property ($230 million) due primarily to Applied Micro Circuits Corporation’s (AMCC) acquisition of the company’s IP associated with its embedded PowerPC 4xx standard products for $208 million in 2004. The provision for income taxes resulted in an effective tax rate of 34.6 percent for 2005, compared with the 2004 effective tax rate of 29.7 percent. The 4.9 point increase in the effective tax rate in 2005 was primarily due to the third-quarter 2005 tax charge associated with the repatriation of $9.5 billion under the American Jobs Creation Act of 2004. Assets of $105,748 million declined $5,256 million or 4.7 percent, of which, $5,715 million of the year-to-year decrease relates to the impact of currency translation. Other asset changes primarily con-sisted of an increase in Cash and cash equivalents, an increase in
Goodwill associated with 2005 acquisitions and increased Prepaid pension assets. These increases were partially offset by lower financ-ing receivables and lower deferred tax assets.
DisContinueD operationson December 31, 2002, the company sold its hDD business to hitachi for approximately $2 billion. The final cash payment of $399 million was received on December 30, 2005. In addition, the company paid Hitachi $80 million to settle warranty obligations during 2005. These transactions were consistent with the company’s previous esti-mates. The HDD business was accounted for as a discontinued operation whereby the results of operations and cash flows were removed from the company’s results from continuing operations for all periods presented. In 2006, the company reported net income of $76 million, net of tax, primarily related to tax benefits from tax audit settlements. The company incurred a loss from discontinued operations of $24 million in 2005 and $18 million in 2004, net of tax. These losses were primar-ily due to additional costs associated with parts warranty as agreed upon by the company and Hitachi, under the terms of the agreement for the sale of the HDD business to Hitachi.
other inForMation
looking ForwarDthe following key drivers impacting the company’s business are discussed on page 21:
•Economicenvironmentandcorporatespendingbudgets;
•Internalbusinesstransformationandglobalintegrationinitiatives;
•Innovationinitiatives;
•Openstandards;and
•Investingingrowthopportunities.
Looking forward, while uncertainties make forecasts difficult, based on economic indicators, the company anticipates moderate growth for the world economy, capital investment and the traditional IT industry. The pace of globalization is expected to increase competi-tion, further driving clients to innovate and transform their business models, processes and practices, all of which create opportunities for the company. As highlighted in the Management Discussion Snapshot on page 14, the company has successfully transformed its business model over the past several years. This transformation led to the company’s per-formance in 2006 and has positioned it to capture additional market opportunities worldwide going forward. The company has a significant global presence, operating in 170 countries, with approximately 60 percent of its revenue generated outside the United States. In addition, approximately 65 percent of the company’s employees are located outside the United States, including about 30 percent in Asia Pacific. This global reach gives the company
ManageMent DisCussioninternational business MaChines Corporation anD subsiDiary CoMpanies
41
Black
MAC
2718 CG10

ManageMent DisCussioninternational business MaChines Corporation anD subsiDiary CoMpanies
42 2006AnnualReport
access to markets, with local management teams who understand the clients and their challenges and who can respond to these opportuni-ties with value-add solutions. In emerging markets, the company will continue to invest for revenue growth and leadership. The company has had good success in the emerging markets of China, India, Russia and Brazil. These coun-tries have been among the fastest growing IT markets in the world, and the company expects them to continue to grow at a rate greater than the worldwide IT growth rate for several years. As a globally integrated enterprise, the company will continue to leverage the skills and capabilities of its global infrastructure and work-force. The company’s global scale provides a base to leverage its invest-ments and continue to focus on increased productivity and efficiency in the coming year. In 2006, the company expanded its global delivery centers—improving its services delivery to clients—and significantly increased its resources in service delivery centers. Going forward, the company will also continue the global integration of its internal sup-port functions with a continued objective of increased productivity. With respect to technology, in 2006, the company was awarded more U.S. patents than any other company for the fourteenth year in a row. The company remains committed to technology leadership and will continue to focus internal development investments on high-value, high-growth opportunities and to broaden its ability to deliver client and industry solutions. The company will also continue to selectively pursue acquisitions to grow its capabilities. The company has a targeted acquisition strat-egy and has developed the ability to efficiently acquire, integrate and accelerate new product and service offerings. In addition, the com-pany will continue to evaluate underperforming and less strategic areas of its portfolio. The company’s continued investments in Software have led to this segment’s emergence as a strong source of revenue growth and the largest contributor to the company’s profit in 2006. The company’s Software is differentiated in the industry by both the strength of its individual products and the breadth of the software offerings. The key to the company’s continued Software growth stems from the ability to maintain and grow this industry-leading software business. The com-pany expects to accomplish this through a combination of internal development and strategic acquisitions. These products will be rapidly developed and integrated to bring continued value to clients.
In addition, continued Software growth is also dependent on the company’s ability to bring these technologies to market effectively, leveraging its worldwide sales and marketing capabilities. The com-pany will continue to invest in sales and marketing resources, targeting the faster growing regions, sectors and technologies in the industry. Finally, growth is fueled by the rapid deployment of these technolo-gies in client accounts. The company’s unique ability to combine Software, Services and Hardware into robust customer solutions increases the rate of Software deployment, leading to higher loyalty rates and improved Software annuity streams. Within the Global Services business, revenue growth improved over the course of the year and the company saw results from the targeted actions and investments it has made the past two years. The Integrated Technology Services business is improving after rebalanc-ing its offerings and resources. Global Business Services significantly improved profitability. The company will continue to make invest-ments in sales, delivery and business development across its services offerings. The company will also continue to optimize its resources and processes to increase productivity and improve flexibility and scalability. The key to future success in Services will come from the company’s ability to integrate its business globally, leverage both local and global skills and effectively use technology to create solutions that deliver value and cost savings for clients. The company’s Systems and Technology Group is the leader in servers. Through continued development investment, the company introduced POWER5+, extended virtualization capabilities and pro-vided leading technology for all major game platforms in 2006. Going forward, the company will focus its investments on differentiating technologies with high-growth potential including POWER6, blades, high-performance computing and energy efficiency. In the Micro-electronics business, the company anticipates that game processor demand will continue to moderate through the first half of 2007 given the seasonality of the consumer segment. As discussed in note X, “Subsequent Events,” on page 115, the company will form a joint venture with Ricoh based on the company’s Printing Systems Division and initially have a 49 percent ownership interest in the joint venture. This transaction is expected to close in the second quarter of 2007, and the company will continue to operate this business in the normal course until the closing. The company expects 2007 pre-tax retirement-related plan expense to increase approximately $100 million when compared to 2006. This expected year-to-year change is primarily driven by an increase in the cost of defined contribution plans. The cost of defined benefit plans is estimated to be essentially flat year to year as increases due to changes in the actuarial assumptions (used to determine 2007 expense) will be offset by expected savings due to better-than-expected 2006 return on asset performance. The actual return on the U.S. Personal Pension Plan (PPP) assets for 2006 was 15 percent. Pre-tax stock-based compensation expense declined $189 million in 2006, compared to 2005. The company expects stock-based compensa-tion expense to decline in 2007, when compared to 2006. The anticipated decline is expected to be less than $100 million on a pre-tax basis.
Management Discussion ........................................................ 12
RoadMap............................................................................. 12
Forward-LookingandCautionaryStatements..................... 13
ManagementDiscussionSnapshot...................................... 14
DescriptionofBusiness....................................................... 15
YearinReview...................................................................... 22
PriorYearinReview............................................................. 37
DiscontinuedOperations..................................................... 41
OtherInformation................................................................ 41
GlobalFinancing.................................................................. 49
report of Management ......................................................... 54
report of independent registered public accounting Firm .... 55
Consolidated statements ....................................................... 56
Black
MAC
2718 CG10

ManageMent DisCussioninternational business MaChines Corporation anD subsiDiary CoMpanies
43
The amount of IP and custom development income has been declining in recent years, down 5 percent in 2006 and 19 percent in 2005. A moderate declining trend may continue as the company does not expect IP income to be a contributor to growth. The overall level of IP income is dependent on several factors: divestitures, industry consolidation, economic conditions and the timing of new patents and know-how development. The company’s business is designed to be measured over the long term. The strategies that the company deploys, investments and any other actions are implemented with an objective of optimizing the company’s long-term performance. In the coming year, the company expects to take actions to continue its transformation and improve the business. These actions are done within the framework of managing the business for sustainability and to deliver the company’s long-term objective of 10 to 12 percent earnings per share growth.
income taxesthe company expects that its effective tax rate in 2007 will be approximately 28.5 percent. This rate is lower than the company’s historical expected tax rate of 30 percent due to an expectation of a more favorable mix of income in lower tax jurisdictions. The rate will change year to year based on non-recurring events, such as the settle-ment of income tax audits, as well as recurring factors including the geographic mix of income before taxes, the timing and amount of foreign dividend repatriation, state and local taxes and the effects of various global income tax strategies. In 2006 and 2005, the company’s cash tax rate was approximately 16 percent. The company’s cash tax rate represents the amount of income taxes paid during the year over Income from continuing operations before income taxes. The cash tax rate differs from the company’s effective tax rate due to a number of variables including, but not limited to, certain items of income and expense that are recognized in different years for financial reporting purposes than for income tax purposes, differences in currency rates used in the translation of the non-U.S. income tax provision and income tax payments and current year cash tax payments or refunds that are related to prior years. The company anticipates that its cash tax rate will increase in the near term as the company has now fully utilized its U.S. federal tax credit carryforwards.
liQuiDity anD Capital resourCesthe company has consistently generated strong cash flow from operations, providing a source of funds ranging between $13.8 billion and $15.3 billion per year over the past five years. The company provides for additional liquidity through several sources; maintaining a sizable cash balance, access to global funding sources and a commit-ted global credit facility. The following table provides a summary of these major sources of liquidity for the years ended December 31, 2002 through 2006.
Cash Flow and liquidity trends(Dollars in billions)
2006 2005 2004 2003 2002
Net cash from operating activities $15.0 $14.9 $15.3 $14.5 $13.8
Cash and short-term marketable securities $10.7 $13.7 $10.6 $ 7.6 $ 6.0
Size of global credit facilities $10.0 $10.0 $10.0 $10.0 $12.0
Trade receivables securitization facility $ — $ 0.5 $ 0.5 $ — $ —
The major rating agencies’ ratings on the company’s debt securities at December 31, 2006 appear in the following table and remain unchanged over the past five years. The company has no contractual arrangements that, in the event of a change in credit rating, would result in a material adverse effect on its financial position or liquidity.
Standard Moody’S and inveStorS fitCh poor’S ServiCe ratingS
Senior long-term debt A+ A1 AA-
Commercial paper A-1 Prime-1 F1+
The company prepares its Consolidated Statement of Cash Flows in accordance with SFAS No. 95, “Statement of Cash Flows,” on page 58 and highlights causes and events underlying sources and uses of cash in that format on page 33. For purposes of running its business, the com-pany manages, monitors and analyzes cash flows in a different format. As discussed on page 49, one of the company’s two primary objec-tives of its Global Financing business is to generate strong return on equity. Increasing receivables is the basis for growth in a financing business. Accordingly, management considers Global Financing receiv-ables as a profit-generating investment, not as working capital that should be minimized for efficiency. After classifying Global Financing accounts receivables as an investment, the remaining net cash flow is viewed by the company as the Cash available for investment and for distribution to shareholders. With respect to the company’s cash flow analysis for internal management purposes (see the table on page 44), Global Financing accounts receivables are combined with Global Financing debt to represent the Net Global Financing debt to accounts receivable (a profit-generating investment). From the perspective of how management views cash flows, in 2006, net cash from operating activities, excluding Global Financing receivables, was $15.3 billion, an increase of $2.2 billion compared to 2005. This cash performance was driven primarily by the growth in net income from continuing operations, continued focus on working capital and lower pension funding year over year. The company returned over 100 percent of net income in 2006 to shareholders in dividend payments and share repurchases. Over the past five years, the company generated over $64.3 billion in Cash available for investment and for distribution to shareholders. As a result, during that period the company invested $20.5 billion of net
Black
MAC
2718 CG10

ManageMent DisCussioninternational business MaChines Corporation anD subsiDiary CoMpanies
44 2006AnnualReport
(Dollars in billions)
for the year ended deCeMBer 31: 2006 2005 2004 2003 2002
Net cash from operating activities (Continuing Operations): $15.0 $14.9 $15.3 $14.5 $13.8
Less: Global Financing accounts receivable (0.3) 1.8 2.5 1.9 3.3
Net cash from operating activities (Continuing Operations), excluding Global Financing receivables 15.3 13.1 12.9 12.6 10.5
Investing Activities: Capital expenditures, net (4.7) (3.5) (3.7) (3.9) (4.6)
Global Financing accounts receivable (0.3) 1.8 2.5 1.9 3.3
Global Financing debt 1.0 (0.6) (1.7) (2.6) (3.1)
Net Global Financing debt to accounts receivable 0.8 1.3 0.7 (0.7) 0.2
Acquisitions (3.8) (1.5) (1.7) (1.8) (3.2)
Divestitures — 0.9 — 0.1 1.2
Return to shareholders: Share Repurchase (8.1) (7.7) (7.1) (4.3) (4.2)
Dividends (1.7) (1.2) (1.2) (1.1) (1.0)
Change in non-Global Financing debt (1.1) 1.2 0.7 (0.9) (0.1)
Other 0.4 0.7 2.5 1.9 1.4
Discontinued operations — — (0.1) (0.2) (0.7)
Change in cash, cash equivalents and short-term marketable securities $ (3.0) $ 3.1 $ 2.9 $ 1.7 $(0.4)
Events that could temporarily change the historical cash flow dynam-ics discussed above include significant changes in operating results, material changes in geographic sources of cash, unexpected adverse impacts from litigation or future pension funding during periods of severe and prolonged downturn in the capital markets. Whether any litigation has such an adverse impact will depend on a number of variables, which are more completely described on page 91. With respect to pension funding, in the first quarter of 2006, the company
contributed approximately $1 billion to the U.K. pension plan, and on January 19, 2005, the company contributed $1.7 billion to the quali-fied portion of the PPP, a U.S. defined benefit plan. As highlighted in the Contractual Obligations table on page 45, the company expects to make legally mandated pension plan contributions to certain non-U.S. plans of approximately $2.6 billion in the next five years. The company is not quantifying any further impact from pension funding because it is not possible to predict future movements in the capital markets or pension plan funding regulations. As discussed in note B, “Accounting Changes,” on page 71, the company implemented SFAS No. 158 effective December 31, 2006. The effects of applying SFAS No. 158 on the Consolidated Statement of Financial Position are highlighted in the table on page 101. The adoption of SFAS No. 158 will have no impact on the company’s existing debt covenants, credit ratings or financial flexibility. The Pension Protection Act of 2006 (the Act) was enacted into law in 2006, and, among other things, increases the funding requirements for certain U.S. defined benefit plans beginning after December 31, 2007. The company currently does not expect the Act to have a mate-rial effect on the company’s minimum mandatory contributions to its U.S. defined benefit plan.
capital expenditures, invested $12.0 billion in strategic acquisitions, received $2.3 billion from divestitures and returned $37.7 billion to shareholders through dividends and share repurchases. The amount of prospective returns to shareholders in the form of dividends and share repurchases will vary based upon several factors including each year’s operating results, capital expenditures, research and development and acquisitions, as well as the factors discussed following the table below.
The company’s Board of Directors meets quarterly to consider the dividend payment. The company expects to fund dividend payments through cash from operations. In the second quarter of 2006, the Board of Directors increased the company’s quarterly common stock dividend from $0.20 to $0.30 per share. The table below represents the way in which management reviews cash flow as described on page 43.
Management Discussion ........................................................ 12
RoadMap............................................................................. 12
Forward-LookingandCautionaryStatements..................... 13
ManagementDiscussionSnapshot...................................... 14
DescriptionofBusiness....................................................... 15
YearinReview...................................................................... 22
PriorYearinReview............................................................. 37
DiscontinuedOperations..................................................... 41
OtherInformation................................................................ 41
GlobalFinancing.................................................................. 49
report of Management ......................................................... 54
report of independent registered public accounting Firm .... 55
Consolidated statements ....................................................... 56
Black
MAC
2718 CG10

ManageMent DisCussioninternational business MaChines Corporation anD subsiDiary CoMpanies
45
Contractual obligations(Dollars in millions)
total ContraCtual
payMentS due in
payMent StreaM 2007 2008-09 2010-11 after 2011
Long-term debt obligations $16,086 $2,724 $3,662 $3,852 $5,848
Capital (finance) lease obligations 363 83 148 93 39
Operating lease obligations 5,345 1,302 2,006 1,182 855
Purchase obligations 1,844 841 737 173 93
Other long-term liabilities: Minimum pension funding (mandated)* 2,625 563 1,055 1,007 —
Executive compensation 994 60 129 141 664
Long-term termination benefits 2,160 315 277 176 1,392
Other 689 47 113 85 444
Total $30,106 $5,935 $8,127 $6,709 $9,335
* Theseamountsrepresentfuturepensioncontributionsthataremandatedbylocalregulationsorstatuteforretireesreceivingpensionbenefits.Theyareallassociatedwithnon-U.S.pensionplans.Theprojectedpaymentsbeyond2011arenotcurrentlydeterminable.SeenoteV,“Retirement-RelatedBenefits,”onpages100to111foradditionalinformationonthenon-U.S.plans’investmentstrategiesandexpectedcontributionsandforinformationregardingthecompany’sunfundedpensionliabilityof$14,543millionatDecember31,2006.
Total contractual payments are reported in the table above excluding the effects of time value and therefore, may not equal the amounts reported in the company’s Consolidated Statement of Financial Position. Purchase obligations include all commitments to purchase goods or services of either a fixed or minimum quantity that meet any of the following criteria: (1) they are noncancelable, (2) the company would incur a penalty if the agreement was canceled, or (3) the company must make specified minimum payments even if it does not take deliv-ery of the contracted products or services (“take-or-pay”). If the obligation to purchase goods or services is noncancelable, the entire value of the contract is included in the table above. If the obligation is cancelable, but the company would incur a penalty if canceled, the dollar amount of the penalty is included as a purchase obligation. Contracted minimum amounts specified in take-or-pay contracts are also included in the table as they represent the portion of each con-tract that is a firm commitment. In the ordinary course of business, the company enters into con-tracts that specify that the company will purchase all or a portion of its requirements of a specific product, commodity or service from a supplier or vendor. These contracts are generally entered into in order to secure pricing or other negotiated terms. They do not specify fixed or minimum quantities to be purchased and, therefore, the com-pany does not consider them to be purchase obligations.
off-balance sheet arrangementsIn the ordinary course of business, the company entered into off-bal-ance sheet arrangements as defined by the SEC Financial Reporting Release 67 (FRR-67), “Disclosure in Management’s Discussion and Analysis about Off-Balance Sheet Arrangements and Aggregate Contractual Obligations.” None of these off-balance sheet arrangements either has, or is reasonably likely to have, a material current or future effect on finan-cial condition, changes in financial condition, revenues or expenses, results of operations, liquidity, capital expenditures or capital resources. See the table above for the company’s contractual obligations and
note O, “Contingencies and Commitments,” on pages 91 and 92, for detailed information about the company’s guarantees, financial com-mitments and indemnification arrangements. The company does not have retained interests in assets transferred to unconsolidated entities (see note J, “Securitization of Receivables,” on page 81) or other mate-rial off-balance sheet interests or instruments.
CritiCal aCCounting estiMatesthe application of gaap requires the company to make estimates and assumptions about future events that directly affect its reported financial condition and operating performance. The account-ing estimates and assumptions discussed in this section are those that the company considers to be the most critical to its financial state-ments. An accounting estimate is considered critical if both (a) the nature of the estimates or assumptions is material due to the levels of subjectivity and judgment involved, and (b) the impact within a rea-sonable range of outcomes of the estimates and assumptions is material to the company’s financial condition or operating performance. The critical accounting estimates related to the company’s Global Financing business are described on page 53 in the Global Financing section. The company’s significant accounting policies are described in note A, “Significant Accounting Policies,” on pages 62 to 71. A quantitative sensitivity analysis is provided where that informa-tion is reasonably available, can be reliably estimated and provides material information to investors. The amounts used to assess sensi-tivity (e.g., 1 percent, 5 percent, etc.) are included to allow users of the Annual Report to understand a general direction cause and effect of changes in the estimates and do not represent management’s pre-dictions of variability.
pension assumptionsThe measurement of the company’s benefit obligation to its employ-ees and net periodic pension cost/(income) requires the use of certain assumptions, including, among others, estimates of discount rates and expected return on plan assets.
Black
MAC
2718 CG10

Changes in the discount rate assumptions will impact the service cost, (gain)/loss amortization and interest cost components of the net periodic pension cost/(income) calculation (see page 107 for informa-tion regarding the discount rate assumptions) and the projected benefit obligation (PBO). As presented on page 106, the company increased the discount rate assumption for the U.S. PPP by 25 basis points to 5.75 percent on December 31, 2006. This change will decrease pre-tax cost and expense recognized in 2007 by $90 million. If the discount rate assumption for the PPP decreased by 25 basis points on December 31, 2006, pre-tax cost and expense recognized in 2007 would have increased by $87 million. Changes in the discount rate assumptions will impact the PBO which, in turn, may impact the company’s funding decisions if the PBO exceeds plan assets. Each 25 basis point increase or decrease in the discount rate will cause a cor-responding decrease or increase, respectively, in the PPP’s PBO of an estimated $1.2 billion based upon December 31, 2006 data. Page 104 presents the PPP’s PBO (after the increase in discount rate presented on page 106) and plan assets as of December 31, 2006. The expected long-term return on plan assets is used in calculating the net periodic pension (income)/cost. See page 107 for information regarding the expected long-term return on plan assets assumption. The differences between the actual return on plan assets and expected long-term return on plan assets are recognized over five years in the expected return on plan assets line in net periodic pension (income)/cost and also as a component of actuarial gains/losses, which are rec-ognized over the service lives of the employees in the plan, provided such amounts exceed thresholds which are based upon the obligation or the value of plan assets, as provided by accounting standards. To the extent the outlook for long-term returns changes such that management changes its expected long-term return on plan assets assumption, each 50 basis point increase or decrease in the expected long-term return on PPP plan assets assumption will have an estimated increase or decrease, respectively, of $232 million on the following year’s pre-tax net periodic pension (income)/cost (based upon the PPP’s plan assets at December 31, 2006 and assuming no contribu-tions are made in 2007). The company may voluntarily make contributions or be required, by law, to make contributions to its pension plans. Actual results that
differ from the estimates may result in more or less future company funding into the pension plans than is planned by management. Impacts of these types of changes on the company’s pension plans in other countries worldwide will vary depending upon the status of each respective plan.
Costs to Complete service ContractsThe company enters into numerous service contracts through its GTS and GBS businesses. During the contractual period, revenue, cost and profits may be impacted by estimates of the ultimate profit-ability of each contract, especially contracts for which the company uses the percentage-of-completion (POC) method of accounting. If at any time these estimates indicate the contract will be unprofitable for POC contracts, the entire estimated loss for the remainder of the contract is recorded immediately in cost. The company performs ongo-ing profitability analyses of its services contracts in order to determine whether the latest estimates require updating. Key factors reviewed by the company to estimate the future costs to complete each contract are future labor costs, future product costs and productivity efficiencies. Contract loss provisions recorded as a component of Other accrued expenses and liabilities are approximately $32 million and $70 million at December 31, 2006 and December 31, 2005, respectively.
income taxesThe company is subject to income taxes in both the U.S. and numerous foreign jurisdictions. Significant judgments are required in determin-ing the consolidated provision for income taxes. During the ordinary course of business, there are many transac-tions and calculations for which the ultimate tax determination is uncertain. As a result, the company recognizes tax liabilities based on estimates of whether additional taxes and interest will be due. These tax liabilities are recognized when, despite the company’s belief that its tax return positions are supportable, the company believes that certain positions are likely to be challenged and may not be fully sus-tained upon review by tax authorities. The company believes that its accruals for tax liabilities are adequate for all open audit years based on its assessment of many factors including past experience and interpre-tations of tax law. This assessment relies on estimates and assumptions and may involve a series of complex judgments about future events. To the extent that the final tax outcome of these matters is different than the amounts recorded, such differences will impact income tax expense in the period in which such determination is made. Significant judgment is also required in determining any valuation allowance recorded against deferred tax assets. In assessing the need for a valuation allowance, management considers all available evi-dence including past operating results, estimates of future taxable income and the feasibility of ongoing tax planning strategies. In the event that the company changes its determination as to the amount of deferred tax assets that can be realized, the company will adjust its valuation allowance with a corresponding impact to income tax expense in the period in which such determination is made.
ManageMent DisCussioninternational business MaChines Corporation anD subsiDiary CoMpanies
46 2006AnnualReport
Management Discussion ........................................................ 12
RoadMap............................................................................. 12
Forward-LookingandCautionaryStatements..................... 13
ManagementDiscussionSnapshot...................................... 14
DescriptionofBusiness....................................................... 15
YearinReview...................................................................... 22
PriorYearinReview............................................................. 37
DiscontinuedOperations..................................................... 41
OtherInformation................................................................ 41
GlobalFinancing.................................................................. 49
report of Management ......................................................... 54
report of independent registered public accounting Firm .... 55
Consolidated statements ....................................................... 56
Black
MAC
2718 CG10
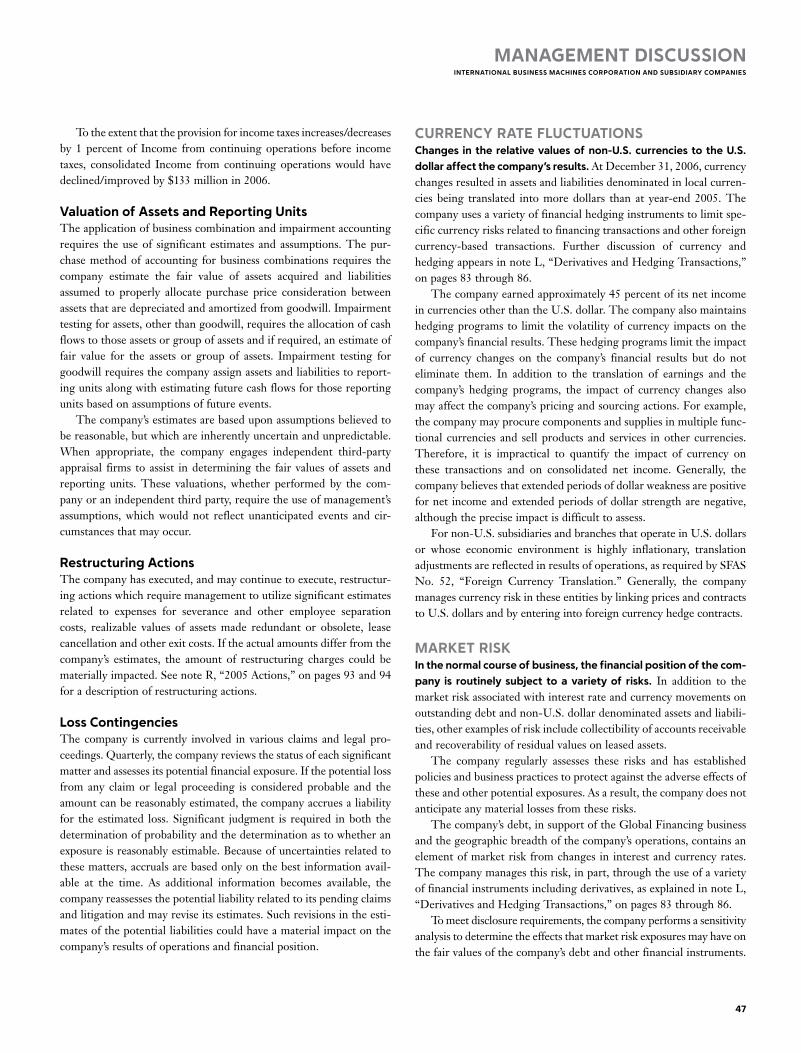
To the extent that the provision for income taxes increases/decreases by 1 percent of Income from continuing operations before income taxes, consolidated Income from continuing operations would have declined/improved by $133 million in 2006.
valuation of assets and reporting unitsThe application of business combination and impairment accounting requires the use of significant estimates and assumptions. The pur-chase method of accounting for business combinations requires the company estimate the fair value of assets acquired and liabilities assumed to properly allocate purchase price consideration between assets that are depreciated and amortized from goodwill. Impairment testing for assets, other than goodwill, requires the allocation of cash flows to those assets or group of assets and if required, an estimate of fair value for the assets or group of assets. Impairment testing for goodwill requires the company assign assets and liabilities to report-ing units along with estimating future cash flows for those reporting units based on assumptions of future events. The company’s estimates are based upon assumptions believed to be reasonable, but which are inherently uncertain and unpredictable. When appropriate, the company engages independent third-party appraisal firms to assist in determining the fair values of assets and reporting units. These valuations, whether performed by the com-pany or an independent third party, require the use of management’s assumptions, which would not reflect unanticipated events and cir-cumstances that may occur.
restructuring actionsThe company has executed, and may continue to execute, restructur-ing actions which require management to utilize significant estimates related to expenses for severance and other employee separation costs, realizable values of assets made redundant or obsolete, lease cancellation and other exit costs. If the actual amounts differ from the company’s estimates, the amount of restructuring charges could be materially impacted. See note R, “2005 Actions,” on pages 93 and 94 for a description of restructuring actions.
loss ContingenciesThe company is currently involved in various claims and legal pro-ceedings. Quarterly, the company reviews the status of each significant matter and assesses its potential financial exposure. If the potential loss from any claim or legal proceeding is considered probable and the amount can be reasonably estimated, the company accrues a liability for the estimated loss. Significant judgment is required in both the determination of probability and the determination as to whether an exposure is reasonably estimable. Because of uncertainties related to these matters, accruals are based only on the best information avail-able at the time. As additional information becomes available, the company reassesses the potential liability related to its pending claims and litigation and may revise its estimates. Such revisions in the esti-mates of the potential liabilities could have a material impact on the company’s results of operations and financial position.
ManageMent DisCussioninternational business MaChines Corporation anD subsiDiary CoMpanies
47
CurrenCy rate FluCtuationsChanges in the relative values of non-u.s. currencies to the u.s. dollar affect the company’s results. At December 31, 2006, currency changes resulted in assets and liabilities denominated in local curren-cies being translated into more dollars than at year-end 2005. The company uses a variety of financial hedging instruments to limit spe-cific currency risks related to financing transactions and other foreign currency-based transactions. Further discussion of currency and hedging appears in note L, “Derivatives and Hedging Transactions,” on pages 83 through 86. The company earned approximately 45 percent of its net income in currencies other than the U.S. dollar. The company also maintains hedging programs to limit the volatility of currency impacts on the company’s financial results. These hedging programs limit the impact of currency changes on the company’s financial results but do not eliminate them. In addition to the translation of earnings and the company’s hedging programs, the impact of currency changes also may affect the company’s pricing and sourcing actions. For example, the company may procure components and supplies in multiple func-tional currencies and sell products and services in other currencies. Therefore, it is impractical to quantify the impact of currency on these transactions and on consolidated net income. Generally, the company believes that extended periods of dollar weakness are positive for net income and extended periods of dollar strength are negative, although the precise impact is difficult to assess. For non-U.S. subsidiaries and branches that operate in U.S. dollars or whose economic environment is highly inflationary, translation adjustments are reflected in results of operations, as required by SFAS No. 52, “Foreign Currency Translation.” Generally, the company manages currency risk in these entities by linking prices and contracts to U.S. dollars and by entering into foreign currency hedge contracts.
Market riskin the normal course of business, the financial position of the com-pany is routinely subject to a variety of risks. In addition to the market risk associated with interest rate and currency movements on outstanding debt and non-U.S. dollar denominated assets and liabili-ties, other examples of risk include collectibility of accounts receivable and recoverability of residual values on leased assets. The company regularly assesses these risks and has established policies and business practices to protect against the adverse effects of these and other potential exposures. As a result, the company does not anticipate any material losses from these risks. The company’s debt, in support of the Global Financing business and the geographic breadth of the company’s operations, contains an element of market risk from changes in interest and currency rates. The company manages this risk, in part, through the use of a variety of financial instruments including derivatives, as explained in note L, “Derivatives and Hedging Transactions,” on pages 83 through 86. To meet disclosure requirements, the company performs a sensitivity analysis to determine the effects that market risk exposures may have on the fair values of the company’s debt and other financial instruments.
Black
MAC
CG10
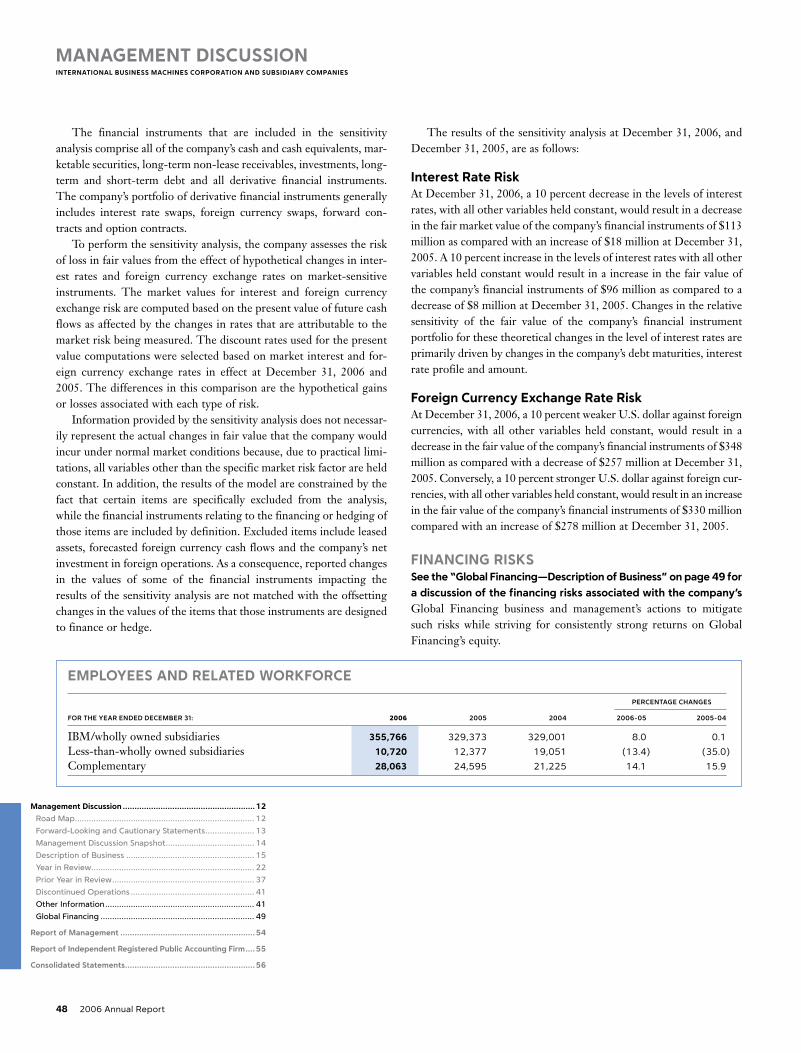
ManageMent DisCussioninternational business MaChines Corporation anD subsiDiary CoMpanies
48 2006AnnualReport
The financial instruments that are included in the sensitivity analysis comprise all of the company’s cash and cash equivalents, mar-ketable securities, long-term non-lease receivables, investments, long-term and short-term debt and all derivative financial instruments. The company’s portfolio of derivative financial instruments generally includes interest rate swaps, foreign currency swaps, forward con-tracts and option contracts. To perform the sensitivity analysis, the company assesses the risk of loss in fair values from the effect of hypothetical changes in inter-est rates and foreign currency exchange rates on market-sensitive instruments. The market values for interest and foreign currency exchange risk are computed based on the present value of future cash flows as affected by the changes in rates that are attributable to the market risk being measured. The discount rates used for the present value computations were selected based on market interest and for-eign currency exchange rates in effect at December 31, 2006 and 2005. The differences in this comparison are the hypothetical gains or losses associated with each type of risk. Information provided by the sensitivity analysis does not necessar-ily represent the actual changes in fair value that the company would incur under normal market conditions because, due to practical limi-tations, all variables other than the specific market risk factor are held constant. In addition, the results of the model are constrained by the fact that certain items are specifically excluded from the analysis, while the financial instruments relating to the financing or hedging of those items are included by definition. Excluded items include leased assets, forecasted foreign currency cash flows and the company’s net investment in foreign operations. As a consequence, reported changes in the values of some of the financial instruments impacting the results of the sensitivity analysis are not matched with the offsetting changes in the values of the items that those instruments are designed to finance or hedge.
The results of the sensitivity analysis at December 31, 2006, and December 31, 2005, are as follows:
interest rate riskAt December 31, 2006, a 10 percent decrease in the levels of interest rates, with all other variables held constant, would result in a decrease in the fair market value of the company’s financial instruments of $113 million as compared with an increase of $18 million at December 31, 2005. A 10 percent increase in the levels of interest rates with all other variables held constant would result in a increase in the fair value of the company’s financial instruments of $96 million as compared to a decrease of $8 million at December 31, 2005. Changes in the relative sensitivity of the fair value of the company’s financial instrument portfolio for these theoretical changes in the level of interest rates are primarily driven by changes in the company’s debt maturities, interest rate profile and amount.
Foreign Currency exchange rate riskAt December 31, 2006, a 10 percent weaker U.S. dollar against foreign currencies, with all other variables held constant, would result in a decrease in the fair value of the company’s financial instruments of $348 million as compared with a decrease of $257 million at December 31, 2005. Conversely, a 10 percent stronger U.S. dollar against foreign cur-rencies, with all other variables held constant, would result in an increase in the fair value of the company’s financial instruments of $330 million compared with an increase of $278 million at December 31, 2005.
FinanCing riskssee the “global Financing—Description of business” on page 49 for a discussion of the financing risks associated with the company’s Global Financing business and management’s actions to mitigate such risks while striving for consistently strong returns on Global Financing’s equity.
eMployees anD relateD workForCe
perCentage ChangeS
for the year ended deCeMBer 31: 2006 2005 2004 2006-05 2005-04
IBM/wholly owned subsidiaries 355,766 329,373 329,001 8.0 0.1
Less-than-wholly owned subsidiaries 10,720 12,377 19,051 (13.4) (35.0)
Complementary 28,063 24,595 21,225 14.1 15.9
Management Discussion ........................................................ 12
RoadMap............................................................................. 12
Forward-LookingandCautionaryStatements..................... 13
ManagementDiscussionSnapshot...................................... 14
DescriptionofBusiness....................................................... 15
YearinReview...................................................................... 22
PriorYearinReview............................................................. 37
DiscontinuedOperations..................................................... 41
OtherInformation................................................................ 41
GlobalFinancing.................................................................. 49
report of Management ......................................................... 54
report of independent registered public accounting Firm .... 55
Consolidated statements ....................................................... 56
Black
MAC
2718 CG10
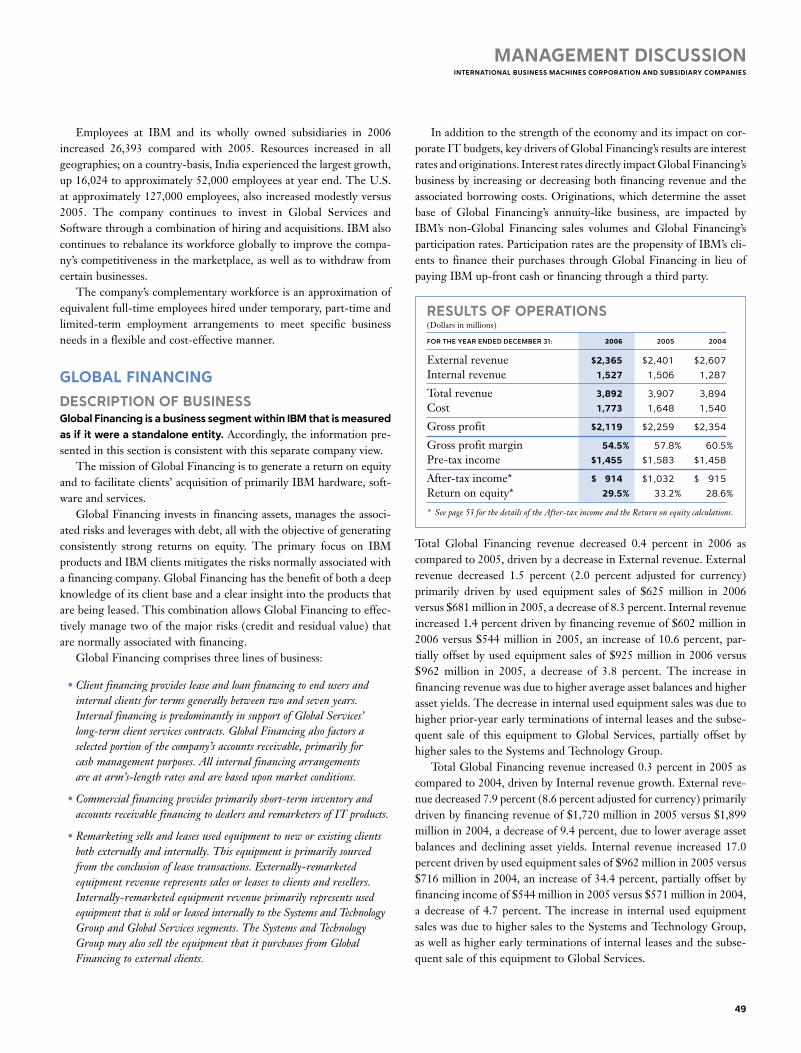
Employees at IBM and its wholly owned subsidiaries in 2006increased 26,393 compared with 2005. Resources increased in allgeographies;onacountry-basis,Indiaexperiencedthelargestgrowth,up16,024toapproximately52,000employeesatyearend.TheU.S.atapproximately127,000employees,alsoincreasedmodestlyversus2005. The company continues to invest in Global Services andSoftwarethroughacombinationofhiringandacquisitions.IBMalsocontinuestorebalanceitsworkforcegloballytoimprovethecompa-ny’scompetitivenessinthemarketplace,aswellastowithdrawfromcertainbusinesses. Thecompany’scomplementaryworkforceisanapproximationofequivalentfull-timeemployeeshiredundertemporary,part-timeandlimited-term employment arrangements to meet specific businessneedsinaflexibleandcost-effectivemanner.
Global FinancinG
Description oF businessGlobal Financing is a business segment within ibM that is measured as if it were a standalone entity.Accordingly,theinformationpre-sentedinthissectionisconsistentwiththisseparatecompanyview. ThemissionofGlobalFinancingistogenerateareturnonequityandtofacilitateclients’acquisitionofprimarilyIBMhardware,soft-wareandservices. GlobalFinancinginvestsinfinancingassets,managestheassoci-atedrisksandleverageswithdebt,allwiththeobjectiveofgeneratingconsistently strong returns on equity. The primary focus on IBMproductsandIBMclientsmitigatestherisksnormallyassociatedwithafinancingcompany.GlobalFinancinghasthebenefitofbothadeepknowledgeofitsclientbaseandaclearinsightintotheproductsthatarebeingleased.ThiscombinationallowsGlobalFinancingtoeffec-tivelymanagetwoofthemajorrisks(creditandresidualvalue)thatarenormallyassociatedwithfinancing. GlobalFinancingcomprisesthreelinesofbusiness:
•Clientfinancingprovidesleaseandloanfinancingtoendusersandinternalclientsfortermsgenerallybetweentwoandsevenyears.InternalfinancingispredominantlyinsupportofGlobalServices’long-termclientservicescontracts.GlobalFinancingalsofactorsaselectedportionofthecompany’saccountsreceivable,primarilyforcashmanagementpurposes.Allinternalfinancingarrangementsareatarm’s-lengthratesandarebaseduponmarketconditions.
•Commercialfinancingprovidesprimarilyshort-terminventoryandaccountsreceivablefinancingtodealersandremarketersofITproducts.
•Remarketingsellsandleasesusedequipmenttoneworexistingclientsbothexternallyandinternally.Thisequipmentisprimarilysourcedfromtheconclusionofleasetransactions.Externally-remarketedequipmentrevenuerepresentssalesorleasestoclientsandresellers.Internally-remarketedequipmentrevenueprimarilyrepresentsusedequipmentthatissoldorleasedinternallytotheSystemsandTechnologyGroupandGlobalServicessegments.TheSystemsandTechnologyGroupmayalsoselltheequipmentthatitpurchasesfromGlobalFinancingtoexternalclients.
Inadditiontothestrengthoftheeconomyanditsimpactoncor-porateITbudgets,keydriversofGlobalFinancing’sresultsareinterestratesandoriginations.InterestratesdirectlyimpactGlobalFinancing’sbusinessbyincreasingordecreasingbothfinancingrevenueandtheassociatedborrowingcosts.Originations,whichdeterminetheassetbase of Global Financing’s annuity-like business, are impacted byIBM’s non-Global Financing sales volumes and Global Financing’sparticipationrates.ParticipationratesarethepropensityofIBM’scli-ents to finance theirpurchases throughGlobalFinancing in lieuofpayingIBMup-frontcashorfinancingthroughathirdparty.
results oF operations(Dollarsinmillions)
for the year ended deCeMBer 31: 2006 2005 2004
Externalrevenue $2,365 $2,401 $2,607
Internalrevenue 1,527 1,506 1,287
Totalrevenue 3,892 3,907 3,894
Cost 1,773 1,648 1,540
Grossprofit $2,119 $2,259 $2,354
Grossprofitmargin 54.5% 57.8% 60.5%
Pre-taxincome $1,455 $1,583 $1,458
After-taxincome* $ 914 $1,032 $ 915
Returnonequity* 29.5% 33.2% 28.6%
* Seepage53forthedetailsoftheAfter-taxincomeandtheReturnonequitycalculations.
Total Global Financing revenue decreased 0.4 percent in 2006 ascomparedto2005,drivenbyadecreaseinExternalrevenue.Externalrevenue decreased 1.5 percent (2.0 percent adjusted for currency)primarily driven by used equipment sales of $625 million in 2006versus$681millionin2005,adecreaseof8.3percent.Internalrevenueincreased1.4percentdrivenbyfinancingrevenueof$602millionin2006versus$544million in2005,an increaseof10.6percent,par-tiallyoffsetbyusedequipmentsalesof$925million in2006versus$962 million in 2005, a decrease of 3.8 percent. The increase infinancingrevenuewasduetohigheraverageassetbalancesandhigherassetyields.Thedecreaseininternalusedequipmentsaleswasduetohigherprior-yearearlyterminationsofinternalleasesandthesubse-quent sale of this equipment to Global Services, partially offset byhighersalestotheSystemsandTechnologyGroup. TotalGlobalFinancingrevenueincreased0.3percentin2005ascomparedto2004,drivenbyInternalrevenuegrowth.Externalreve-nuedecreased7.9percent(8.6percentadjustedforcurrency)primarilydrivenbyfinancingrevenueof$1,720millionin2005versus$1,899millionin2004,adecreaseof9.4percent,duetoloweraverageassetbalances and declining asset yields. Internal revenue increased 17.0percentdrivenbyusedequipmentsalesof$962millionin2005versus$716millionin2004,anincreaseof34.4percent,partiallyoffsetbyfinancingincomeof$544millionin2005versus$571millionin2004,a decrease of 4.7 percent. The increase in internal used equipmentsaleswasduetohighersalestotheSystemsandTechnologyGroup,aswellashigherearlyterminationsofinternalleasesandthesubse-quentsaleofthisequipmenttoGlobalServices.
ManaGeMent Discussioninternational business Machines corporation anD subsiDiary coMpanies
49
Black
MAC
2718 CG10

ManaGeMent Discussioninternational business Machines corporation anD subsiDiary coMpanies
50 2006AnnualReport
Global Financing gross profit dollars decreased $140 million or6.2percentandgrossprofitmargindeclined3.3pointsin2006versus2005. The decrease in gross profit dollars was primarily driven byborrowingcostsof$813millionin2006versus$641millionin2005,anincreaseof26.8percent,primarilyrelatedtotheinterestrateenvi-ronment during the year, and equipment sales gross profit of $591millionin2006versus$637millionin2005,adecreaseof7.2percentduetothedecreaseinusedequipmentsalesdiscussedpreviously.Thiswaspartiallyoffsetbytheincreaseinfinancingrevenuealsodiscussedabove. The decrease in gross profit margin was driven by lowerfinancingmarginsduetohigherborrowingcostsrelatedtotheinter-est rate environment during the year and a decrease in equipmentsalesmargins,partiallyoffsetbyamixchangeawayfromlowermar-ginremarketingsalestowardshighermarginfinancingincome. GlobalFinancinggrossprofitdollarsdecreased$95millionor4.0percent and gross profit margin declined 2.7 points in 2005 versus2004.Thedecreaseingrossprofitdollarswasprimarilydrivenbythedeclineinfinancingrevenuediscussedaboveandborrowingcostsof$641millionin2005versus$608millionin2004,anincreaseof5.5percentrelatedtotheinterestrateenvironmentduringtheyear,par-tiallyoffsetbyequipmentsalesgrossprofitof$637million in2005versus$492million in2004,an increaseof29.4percentdue to theincreaseinusedequipmentsalesdiscussedpreviously.Thedecreaseingrossprofitmarginwasdrivenbyamixchangetowardslowermarginremarketingsalesandawayfromhighermarginfinancingincomeandlowerfinancingmarginsduetohigherborrowingcostsrelatedtotheinterest rate environment during the year, partially offset by animprovementinequipmentsalesmargins. Global Financing pre-tax income decreased 8.1 percent in 2006versus2005,compared toan increaseof8.6percent in2005versus2004.Thedecreasein2006wasprimarilydrivenbythedecreaseingrossprofitof$140million.The increase in2005versus2004wasdriven by a decrease of $140 million in bad debt expense and adecrease of $78 million in SG&A expense, partially offset by thedecrease in gross profit of $95 million. The decrease in bad debtexpense in 2005 was reflective of the improved general economicenvironment,improvedcreditqualityoftheportfolioandthedeclin-ingsizeofthereceivablesportfolio.(Seepage51foradiscussionofGlobalFinancingReceivablesandAllowances.)
Thedecreaseinreturnonequityfrom2005to2006wasprimarilyduetolowerearningsandtheincreasefrom2004to2005wasprimarilyduetohigherearnings.
Financial conDition
balance sheet(Dollarsinmillions)
at deCeMBer 31: 2006 2005
Cash $ 879 $ 1,292
Netinvestmentinsales-typeleases 10,108 9,876
Equipmentunderoperatingleases: Externalclients 2,264 1,847
Internalclients(a)(b) 1,976 1,788
Clientloans 9,267 8,486
Totalclientfinancingassets 23,615 21,997
Commercialfinancingreceivables 5,844 5,070
Intercompanyfinancingreceivables(a)(b) 2,534 1,968
Otherreceivables 327 127
Otherassets 746 711
Total financing assets $33,945 $31,165
Intercompanypayables(a) $ 5,858 $ 5,262
Debt(c) 22,287 20,499
Otherliabilities 2,590 2,348
Totalfinancingliabilities 30,735 28,109
Totalfinancingequity 3,211 3,056
Total financing liabilities and equity $33,945 $31,165
(a)AmountseliminatedforpurposesofIBM’sconsolidatedresultsandthereforedonotappearonpage57.
(b)Theseassets,alongwithallotherfinancingassetsinthistable,areleveragedusingGlobalFinancingdebt.
(c) GlobalFinancingdebtincludesdebtofthecompanyandoftheGlobalFinancingunitsthatsupporttheGlobalFinancingbusiness.
sources and uses of Funds Theprimaryuseof funds inGlobalFinancing is tooriginateclientandcommercialfinancingassets.Clientfinancingassetsforendusersconsist primarily of IBM hardware, software and services, but alsoinclude non-IBM equipment, software and services to meet clients’total solutions requirements. Client financing assets are primarilysalestype,directfinancingandoperatingleasesforequipment,aswellasloansforhardware,softwareandserviceswithtermsgenerallyfortwotosevenyears.GlobalFinancing’sclientloansareprimarilyforsoftwareandservices,andareunsecured.Theseloansaresubjectedtoadditional credit analysis in order to mitigate the associated risk.Unsecuredloanagreementsincludecreditprotectivelanguage,secu-ritydepositadvancesanddollarlimitsonhowmuchcanbefinancedinordertominimizecreditrisk.Clientfinancingalsoincludesinter-nalactivityasdescribedonpage49.
Management Discussion ........................................................ 12
RoadMap............................................................................. 12
Forward-LookingandCautionaryStatements..................... 13
ManagementDiscussionSnapshot...................................... 14
DescriptionofBusiness....................................................... 15
YearinReview...................................................................... 22
PriorYearinReview............................................................. 37
DiscontinuedOperations..................................................... 41
OtherInformation................................................................ 41
GlobalFinancing.................................................................. 49
report of Management ......................................................... 54
report of independent registered public accounting Firm .... 55
consolidated statements ....................................................... 56
Black
MAC
2718 CG10

CommercialfinancingreceivablesariseprimarilyfrominventoryandaccountsreceivablefinancingfordealersandremarketersofIBMandnon-IBMproducts.Paymenttermsfor inventory financingandaccounts receivable financing generally range from 30 to 90 days.Theseshort-termreceivablesareprimarilyunsecuredandarealsosub-jecttoadditionalcreditactionsinordertomitigatetheassociatedrisk.
originations Thefollowingaretotalexternalandinternalfinancingoriginations.
(Dollarsinmillions)
for the year ended deCeMBer 31: 2006 2005 2004
Clientfinancing: External $13,087 $12,249 $12,433
Internal 1,214 1,167 1,185
Commercialfinancing 27,969 27,032 25,566
Total $42,270 $40,448 $39,184
Newfinancingoriginationsexceededcashcollectionsforbothclientandcommercialfinancingin2006,whichresultedinanetincreaseinfinancing assets fromDecember31,2005.The increase inorigina-tionsin2006versus2005wasduetoimprovingvolumesinbothclientandcommercialfinancing.Theincreasefrom2005versus2004wasdrivenbyanimprovementincommercialfinancingpartiallyoffsetbyadeclineinclientfinancing. CashgeneratedbyGlobalFinancingin2006wasdeployedtopayintercompanypayablesanddividendstoIBM.
Financing assets by sector The following are the percentages of external financing assets byindustrysector.
at deCeMBer 31: 2006 2005
FinancialServices 36% 33%
BusinessPartners* 19 19
Industrial 18 20
Public 10 10
Distribution 8 8
Communications 6 6
Other 3 4
Total 100% 100%
* BusinessPartners’financingassetsrepresentaportionofcommercialfinancinginventoryandaccountsreceivablefinancingfortermsgenerallylessthan90days.
Global Financing receivables and allowancesThefollowingtablepresentsexternalfinancingreceivables,excludingresidualvalues,andtheallowancefordoubtfulaccounts.
(Dollarsinmillions)
at deCeMBer 31: 2006 2005
Grossfinancingreceivables $24,926 $23,197
Specificallowancefordoubtfulaccounts 294 421
Unallocatedallowancefor doubtfulaccounts 76 84
Totalallowancefordoubtfulaccounts 370 505
Netfinancingreceivables $24,556 $22,692
Allowancefordoubtfulaccountcoverage 1.5% 2.2%
roll-Forward of Financing receivables allowance for Doubtful accounts(Dollarsinmillions)
additions/ (reduCtions) allowanCe Bad deBt Dec.31,Jan. 1, 2006 used* expense other** 2006
$505 $(154) $(20) $39 $370
* Representsreservedreceivables,netofrecoveries,thatweredisposedofduringtheperiod.
**Primarilyrepresentstranslationadjustments.
Thepercentageoffinancingreceivablesreserveddecreasedfrom2.2percentatDecember31,2005to1.5percentatDecember31,2006primarilydue to thedecrease in the specific allowance fordoubtfulaccounts.Specificreservesdecreased30.2percentfrom$421millionatDecember31,2005to$294millionatDecember31,2006duetothe disposition of reserved receivables during the period combinedwith lowerrequirements foradditionalspecificreserves.This lowerrequirement is due to improving economic conditions, as well asportfolio management to reduce credit risk. Unallocated reservesdecreased9.5percentfrom$84millionatDecember31,2005to$76millionatDecember31,2006alsoduetoimprovedeconomiccondi-tionsandtheimprovedcreditqualityoftheportfolio. GlobalFinancing’sbaddebtexpensewasareductionof$20mil-lionfor2006andareductionof$35millionfor2005.Thecontinuedreductionwasprimarilyattributabletotheimprovementineconomicconditionsandimprovedcreditqualityoftheportfolioduring2006.
residual Value Residualvalueisariskuniquetothefinancingbusinessandmanage-mentofthisriskisdependentupontheabilitytoaccuratelyprojectfuture equipment values at lease inception. Global Financing hasinsight into product plans and cycles for the IBM products underlease. Based upon this product information, Global Financing con-tinuallymonitorsprojectionsoffutureequipmentvaluesandcomparesthemwiththeresidualvaluesreflectedintheportfolio.SeenoteA,“Significant Accounting Policies,” on page 71 for the company’saccountingpolicyforresidualvalues.
ManaGeMent Discussioninternational business Machines corporation anD subsiDiary coMpanies
51
Black
MAC
2718 CG10

GlobalFinancingoptimizestherecoveryofresidualvaluesbysell-ingassetssourcedfromendoflease,leasingusedequipmenttonewclients,orextendingleasearrangementswithcurrentclients.Salesofequipment,whichareprimarilysourcedfromequipmentreturnedatendoflease,represented39.8percentofGlobalFinancing’srevenuein2006and42.1percentin2005.Thedecreasewasduetodeclinesinbothinternalandexternalusedequipmentsales.Thegrossmarginonthesesaleswas38.1percentand38.7percentin2006and2005,respectively. Thefollowingtablepresentstherecordedamountofunguaranteedresidualvalueforsales-typeandoperatingleasesatDecember31,2005and2006.Inaddition,thetablebelowpresentstheresidualvalueasapercentageof therelatedoriginalamount financedandarunoutofwhentheunguaranteedresidualvalueassignedtoequipmentonleasesatDecember31,2006isexpectedtobereturnedtothecompany.Inadditiontotheunguaranteedresidualvaluebelow,onalimitedbasis,Global Financing will obtain guarantees of the future value of theequipmenttobereturnedatendoflease.Thesethird-partyguaranteesareincludedinminimumleasepaymentsasprovidedforbyaccountingstandardsinthedeterminationofleaseclassificationsforthecovered
equipment and provide protection against risk of loss arising fromdeclinesinequipmentvaluesfortheseassets.Theresidualvalueguar-antee increases the minimum lease payments that are utilized indetermining the classification of a lease as a sales-type lease or anoperatinglease.Theaggregateassetvaluesassociatedwiththeguar-anteeswere$794millionand$651millionforfinancingtransactionsoriginated during the years ended December 31, 2006 and 2005,respectively.In2006,theresidualvalueguaranteeprogramresultedinthecompanyrecognizingapproximately$564millionofrevenuethatwouldotherwisehavebeenrecognizedinfutureperiodsasoperatinglease revenue. If the company had chosen not to participate in aresidualvalueprogramin2006andprioryears,overallrevenuewouldnothavebeenmateriallyaffectedduetotherelativelyconstantyear-to-yearaggregateassetvalueassociatedwiththeresidualvalueguarantees.Theassociated aggregateguaranteed future values at the scheduledendofleasewere$38millionand$27millionforfinancingtransac-tionsoriginatedduringthesametimeperiods,respectively.Thecostofguaranteeswas$5millionforyearendedDecember31,2006,and$4.3millionforyearendedDecember31,2005.
unguaranteed residual Value(Dollarsinmillions)
total run out of 2006 BalanCe
2010 and 2005* 2006 2007 2008 2009 Beyond
Sales-typeleases $ 792 $ 854 $221 $235 $274 $124
Operatingleases 258 342 119 105 92 26
Total unguaranteed residual value $ 1,050 $ 1,196 $340 $340 $366 $150
Relatedoriginalamountfinanced $23,397 $23,225
Percentage 4.5% 5.2%
* Restatedtoconformwith2006presentation.
Debt
at deCeMBer 31: 2006 2005
Debt-to-equityratio 6.9x 6.7x
GlobalFinancingfundsitsoperationsprimarilythroughborrowingsusing adebt-to-equity ratioobjectiveof approximately7 to1.The
debtisusedtofundGlobalFinancingassetsandiscomposedofinter-company loans and external debt. The terms of the intercompanyloansaresetbythecompanytosubstantiallymatchthetermandcur-rencyunderlyingthefinancingreceivable.Theintercompanyloansarebasedonarm’s-lengthpricing.BothassetsanddebtarepresentedintheGlobalFinancingBalanceSheetonpage50. The company’s Global Financing business provides fundingpredominantly for the company’s external clients but also providesintercompany financing for the company (internal), as described inthe“DescriptionofBusiness”onpage49.Aspreviously stated, thecompanymeasuresGlobalFinancingasifitwereastandaloneentityandaccordingly,interestexpenserelatingtodebtsupportingGlobalFinancing’s external client and internal business is included in the“GlobalFinancingResultsofOperations”onpage49andinnoteW,“SegmentInformation,”onpages111to115. Inthecompany’sConsolidatedStatementofEarningsonpage56,however,theinterestexpensesupportingGlobalFinancing’sinternalfinancing to the company is reclassified from Cost of financing toInterestexpense.
ManaGeMent Discussioninternational business Machines corporation anD subsiDiary coMpanies
52 2006AnnualReport
Management Discussion ........................................................ 12
RoadMap............................................................................. 12
Forward-LookingandCautionaryStatements..................... 13
ManagementDiscussionSnapshot...................................... 14
DescriptionofBusiness....................................................... 15
YearinReview...................................................................... 22
PriorYearinReview............................................................. 37
DiscontinuedOperations..................................................... 41
OtherInformation................................................................ 41
GlobalFinancing.................................................................. 49
report of Management ......................................................... 54
report of independent registered public accounting Firm .... 55
consolidated statements ....................................................... 56
Black
MAC
2718 CG10
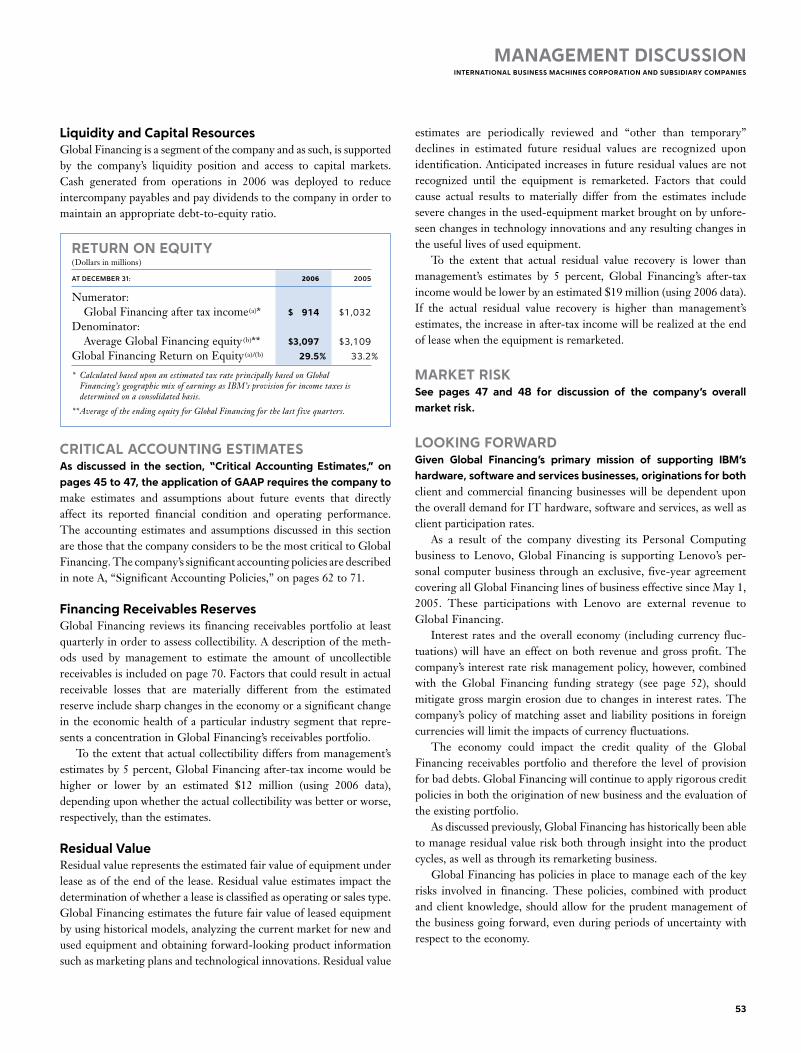
liquidity and capital resourcesGlobalFinancingisasegmentofthecompanyandassuch,issupportedby the company’s liquidity position and access to capital markets.Cash generated from operations in 2006 was deployed to reduceintercompanypayablesandpaydividendstothecompanyinordertomaintainanappropriatedebt-to-equityratio.
return on equity(Dollarsinmillions)
at deCeMBer 31: 2006 2005
Numerator: GlobalFinancingaftertaxincome(a)* $ 914 $1,032
Denominator: AverageGlobalFinancingequity (b)** $3,097 $3,109
GlobalFinancingReturnonEquity (a)/(b) 29.5% 33.2%
* CalculatedbaseduponanestimatedtaxrateprincipallybasedonGlobalFinancing’sgeographicmixofearningsasIBM’sprovisionforincometaxesisdeterminedonaconsolidatedbasis.
**AverageoftheendingequityforGlobalFinancingforthelastfivequarters.
critical accountinG estiMatesas discussed in the section, “critical accounting estimates,” on pages 45 to 47, the application of Gaap requires the company to make estimates and assumptions about future events that directlyaffect its reported financial condition and operating performance.Theaccountingestimatesandassumptionsdiscussed in this sectionarethosethatthecompanyconsiderstobethemostcriticaltoGlobalFinancing.Thecompany’ssignificantaccountingpoliciesaredescribedinnoteA,“SignificantAccountingPolicies,”onpages62to71.
Financing receivables reserves GlobalFinancing reviews its financing receivablesportfolio at leastquarterlyinordertoassesscollectibility.Adescriptionofthemeth-ods used by management to estimate the amount of uncollectiblereceivablesisincludedonpage70.Factorsthatcouldresultinactualreceivable losses that are materially different from the estimatedreserveincludesharpchangesintheeconomyorasignificantchangein theeconomichealthofaparticular industry segment that repre-sentsaconcentrationinGlobalFinancing’sreceivablesportfolio. Totheextentthatactualcollectibilitydiffersfrommanagement’sestimatesby5percent,GlobalFinancingafter-taxincomewouldbehigher or lower by an estimated $12 million (using 2006 data),dependinguponwhethertheactualcollectibilitywasbetterorworse,respectively,thantheestimates.
residual Value Residualvaluerepresentstheestimatedfairvalueofequipmentunderleaseasof theendof the lease.Residualvalueestimates impact thedeterminationofwhetheraleaseisclassifiedasoperatingorsalestype.GlobalFinancingestimatesthefuturefairvalueofleasedequipmentbyusinghistoricalmodels,analyzingthecurrentmarketfornewandusedequipmentandobtainingforward-lookingproductinformationsuchasmarketingplansandtechnologicalinnovations.Residualvalue
estimates are periodically reviewed and “other than temporary”declines in estimated future residual values are recognized uponidentification.Anticipatedincreasesinfutureresidualvaluesarenotrecognized until the equipment is remarketed. Factors that couldcause actual results to materially differ from the estimates includeseverechangesintheused-equipmentmarketbroughtonbyunfore-seenchangesintechnologyinnovationsandanyresultingchangesintheusefullivesofusedequipment. To the extent that actual residual value recovery is lower thanmanagement’s estimates by 5 percent, Global Financing’s after-taxincomewouldbelowerbyanestimated$19million(using2006data).If the actual residual value recovery is higher than management’sestimates,theincreaseinafter-taxincomewillberealizedattheendofleasewhentheequipmentisremarketed.
Market risksee pages 47 and 48 for discussion of the company’s overall market risk.
lookinG ForwarDGiven Global Financing’s primary mission of supporting ibM’s hardware, software and services businesses, originations for both client andcommercial financingbusinesseswillbedependentupontheoveralldemandforIThardware,softwareandservices,aswellasclientparticipationrates. As a result of the company divesting its Personal Computingbusiness toLenovo,GlobalFinancing is supportingLenovo’sper-sonalcomputerbusinessthroughanexclusive,five-yearagreementcoveringallGlobalFinancinglinesofbusinesseffectivesinceMay1,2005. These participations with Lenovo are external revenue toGlobalFinancing. Interest rates and theoverall economy (includingcurrency fluc-tuations)willhave aneffectonboth revenueandgrossprofit.Thecompany’s interestrateriskmanagementpolicy,however,combinedwith the Global Financing funding strategy (see page 52), shouldmitigategrossmarginerosiondue tochanges in interest rates.Thecompany’spolicyofmatchingassetandliabilitypositions inforeigncurrencieswilllimittheimpactsofcurrencyfluctuations. The economy could impact the credit quality of the GlobalFinancing receivables portfolio and therefore the level of provisionforbaddebts.GlobalFinancingwillcontinuetoapplyrigorouscreditpoliciesinboththeoriginationofnewbusinessandtheevaluationoftheexistingportfolio. Asdiscussedpreviously,GlobalFinancinghashistoricallybeenabletomanageresidualvalueriskboththroughinsightintotheproductcycles,aswellasthroughitsremarketingbusiness. GlobalFinancinghaspoliciesinplacetomanageeachofthekeyrisks involved in financing. These policies, combined with productandclientknowledge, shouldallowfor theprudentmanagementofthebusinessgoingforward,evenduringperiodsofuncertaintywithrespecttotheeconomy.
ManaGeMent Discussioninternational business Machines corporation anD subsiDiary coMpanies
53
Black
MAC
2718 CG10

report oF ManaGeMentinternational business Machines corporation anD subsiDiary coMpanies
Management responsibility for Financial informationResponsibilityfortheintegrityandobjectivityofthefinancialinforma-tionpresentedinthisAnnualReportrestswithIBMmanagement.TheaccompanyingfinancialstatementshavebeenpreparedinaccordancewithaccountingprinciplesgenerallyacceptedintheUnitedStatesofAmerica,applyingcertainestimatesandjudgmentsasrequired. IBMmaintainsaneffectiveinternalcontrolstructure.Itconsists,inpart,oforganizationalarrangementswithclearlydefined linesofresponsibilityanddelegationofauthority,andcomprehensivesystemsandcontrolprocedures.Animportantelementofthecontrolenviron-mentisanongoinginternalauditprogram.Oursystemalsocontainsself-monitoring mechanisms, and actions are taken to correct defi-cienciesastheyareidentified. Toassuretheeffectiveadministrationofinternalcontrols,wecare-fullyselectandtrainouremployees,developanddisseminatewrittenpoliciesandprocedures,provideappropriatecommunicationchannelsandfosteranenvironmentconducivetotheeffectivefunctioningofcontrols.Webelievethatitisessentialforthecompanytoconductitsbusinessaffairsinaccordancewiththehighestethicalstandards,assetforth in the IBM Business Conduct Guidelines. These guidelines,translated into numerous languages, are distributed to employeesthroughouttheworld,andreemphasizedthroughinternalprogramstoassurethattheyareunderstoodandfollowed. PricewaterhouseCoopers LLP, an independent registered publicaccounting firm, is retained to audit IBM’s Consolidated FinancialStatementsandmanagement’sassessmentoftheeffectivenessoftheinternalcontroloverfinancialreporting.Itsaccompanyingreportisbased on audits conducted in accordance with the standards of thePublicCompanyAccountingOversightBoard(UnitedStates). The Audit Committee of the Board of Directors is composedsolelyofindependent,non-managementdirectors,andisresponsiblefor recommending to the Board the independent registered publicaccountingfirmtoberetainedforthecomingyear,subjecttostock-holder ratification. The Audit Committee meets periodically andprivately with the independent registered public accounting firm,with the company’s internal auditors, as well as with IBM manage-ment, toreviewaccounting,auditing, internalcontrolstructureandfinancialreportingmatters.
Management’s report on internal control over Financial reportingManagement is responsible for establishing and maintaining ade-quate internal control over financial reporting of the company.Internal control over financial reporting is a process designed toprovide reasonable assurance regarding the reliability of financialreporting and the preparation of financial statements for externalpurposesinaccordancewithaccountingprinciplesgenerallyacceptedintheUnitedStatesofAmerica.
Thecompany’sinternalcontroloverfinancialreportingincludesthosepoliciesandproceduresthat(i)pertaintothemaintenanceofrecords that, in reasonable detail, accurately and fairly reflect thetransactionsanddispositionsoftheassetsofthecompany; (ii)pro-videreasonableassurancethattransactionsarerecordedasnecessaryto permit preparation of financial statements in accordance withaccounting principles generally accepted in the United States ofAmerica, and that receipts and expenditures of the company arebeingmadeonlyinaccordancewithauthorizationsofmanagementanddirectorsofthecompany;and(iii)providereasonableassuranceregarding prevention or timely detection of unauthorized acquisi-tion, use, or disposition of the company’s assets that could have amaterialeffectonthefinancialstatements. Becauseofitsinherentlimitations,internalcontroloverfinancialreportingmaynotpreventordetectmisstatements.Also,projectionsofanyevaluationofeffectivenesstofutureperiodsaresubjecttotherisk that controls may become inadequate because of changes inconditions, or that the degree of compliance with the policies orproceduresmaydeteriorate. Management conducted an evaluation of the effectiveness ofinternalcontroloverfinancialreportingbasedontheframeworkinInternalControl—IntegratedFrameworkissuedbytheCommitteeofSponsoringOrganizationsoftheTreadwayCommission(COSO).Basedonthisevaluation,managementconcludedthatthecompany’sinternalcontroloverfinancialreportingwaseffectiveasofDecember31,2006.Management’sassessmentoftheeffectivenessofthecom-pany’s internalcontrolover financial reportingasofDecember31,2006hasbeenauditedbyPricewaterhouseCoopersLLP,anindepen-dent registered public accounting firm, as stated in their reportwhichisincludedherein.
saMuel j. palMisano
ChairmanoftheBoard,PresidentandChiefExecutiveOfficerFebruary27,2007
Mark louGhriDGe
SeniorVicePresident,ChiefFinancialOfficerFebruary27,2007
54 2006AnnualReport
Black
MAC
CG10

report oF inDepenDent reGistereD public accountinG FirMinternational business Machines corporation anD subsiDiary coMpanies
to the stockholders and board of Directors of international business Machines corporation:We have completed integrated audits of International BusinessMachinesCorporation’sConsolidatedFinancialStatementsandofitsinternalcontroloverfinancialreportingasofDecember31,2006inaccordance with the standards of the Public Company AccountingOversightBoard(UnitedStates).Ouropinions,basedonourauditsandthereportofotherauditors,arepresentedbelow.
consolidated Financial statementsInouropinion,basedonourauditsandthereportofotherauditors,the accompanying Consolidated Financial Statements appearing onpages56through115presentfairly,inallmaterialrespects,thefinan-cialpositionofInternationalBusinessMachinesCorporationanditssubsidiarycompaniesatDecember31,2006and2005,andtheresultsoftheiroperationsandtheircashflowsforeachofthethreeyearsintheperiodendedDecember31,2006,inconformitywithaccountingprinciplesgenerallyacceptedintheUnitedStatesofAmerica.Thesefinancialstatementsaretheresponsibilityofthecompany’smanage-ment.Ourresponsibility is toexpressanopinionon these financialstatementsbasedonouraudits.Wedidnotauditthefinancialstate-mentsofthecompany’sBusinessConsultingServicesReportingUnit(whichincludestheconsultingpracticeacquiredfromus)fortheyearendedDecember31,2004,whichstatementsreflecttotalrevenuesof14.3 percent of the related consolidated totals in the year endedDecember31,2004.Thosestatementswereauditedbyotherauditorswhose report thereon has been furnished to us, and our opinionexpressedherein,insofarasitrelatestotheamountsincludedforthecompany’s Business Consulting Services Reporting Unit, is basedsolelyonthereportoftheotherauditors.Weconductedourauditsofthese statements in accordance with the standards of the PublicCompanyAccountingOversightBoard(UnitedStates).Thosestan-dardsrequirethatweplanandperformtheaudittoobtainreasonableassuranceaboutwhetherthefinancialstatementsarefreeofmaterialmisstatement.Anauditoffinancialstatementsincludesexamining,onatestbasis,evidencesupportingtheamountsanddisclosures inthefinancial statements, assessing the accounting principles used andsignificantestimatesmadebymanagement,andevaluatingtheoverallfinancialstatementpresentation.Webelievethatourauditsandthereportofotherauditorsprovideareasonablebasisforouropinion. AsdiscussedinnoteAtotheConsolidatedFinancialStatements,the company adopted the provisions of Statement of FinancialAccountingStandardsNo.158,“Employers’AccountingforDefinedBenefitPensionandOtherPostretirementPlans,”asofDecember31,2006.
internal control over Financial reportingAlso, in our opinion, management’s assessment, included in theaccompanying Management’s Report on Internal Control OverFinancialReporting that the companymaintainedeffective internalcontrol over financial reporting as of December 31, 2006 based oncriteriaestablishedinInternalControl-IntegratedFrameworkissued
by the Committee of Sponsoring Organizations of the TreadwayCommission(COSO), is fairlystated, inallmaterialrespects,basedon thosecriteria.Furthermore, inouropinion, thecompanymain-tained,inallmaterialrespects,effectiveinternalcontroloverfinancialreportingasofDecember31,2006,basedoncriteriaestablished inInternal Control-Integrated Framework issued by the COSO. Thecompany’smanagementisresponsibleformaintainingeffectiveinter-nal control over financial reporting and for its assessment of theeffectivenessofinternalcontroloverfinancialreporting.Ourrespon-sibilityistoexpressopinionsonmanagement’sassessmentandontheeffectivenessofthecompany’sinternalcontroloverfinancialreport-ingbasedonouraudit.Weconductedourauditof internalcontroloverfinancialreportinginaccordancewiththestandardsofthePublicCompanyAccountingOversightBoard(UnitedStates).Thosestan-dardsrequirethatweplanandperformtheaudittoobtainreasonableassurance about whether effective internal control over financialreportingwasmaintainedinallmaterialrespects.Anauditofinternalcontroloverfinancialreportingincludesobtaininganunderstandingofinternalcontroloverfinancialreporting,evaluatingmanagement’sassessment,testingandevaluatingthedesignandoperatingeffective-nessofinternalcontrol,andperformingsuchotherproceduresasweconsider necessary in the circumstances. We believe that our auditprovidesareasonablebasisforouropinions. Acompany’sinternalcontroloverfinancialreportingisaprocessdesignedtoprovidereasonableassuranceregardingthereliabilityoffinancial reporting and the preparation of financial statements forexternalpurposes inaccordancewithgenerallyacceptedaccountingprinciples. A company’s internal control over financial reportingincludesthosepoliciesandproceduresthat(i)pertaintothemainte-nanceofrecordsthat,inreasonabledetail,accuratelyandfairlyreflectthe transactions and dispositions of the assets of the company; (ii)providereasonableassurancethattransactionsarerecordedasneces-sarytopermitpreparationoffinancialstatementsinaccordancewithgenerallyacceptedaccountingprinciples,andthatreceiptsandexpen-ditures of the company are being made only in accordance withauthorizationsofmanagementanddirectorsofthecompany;and(iii)provide reasonable assurance regardingpreventionor timelydetec-tionofunauthorizedacquisition,use,ordispositionofthecompany’sassetsthatcouldhaveamaterialeffectonthefinancialstatements. Becauseofitsinherentlimitations,internalcontroloverfinancialreportingmaynotpreventordetectmisstatements.Also,projectionsofanyevaluationofeffectivenesstofutureperiodsaresubjecttotherisk that controls may become inadequate because of changes inconditions, or that the degree of compliance with the policies orproceduresmaydeteriorate.
pricewaterhousecoopers llp
NewYork,NewYorkFebruary27,2007
55
Black
MAC
CG10

Black
MAC
129 CG10
consoliDateD stateMent oF earninGsinternational business Machines corporation anD subsiDiary coMpanies
56 2006AnnualReport
(Dollarsinmillionsexceptpershareamounts)
for the year ended deCeMBer 31: notes 2006 2005 2004
Revenue:GlobalServices $48,247 $47,407 $46,283
Hardware 22,499 24,343 31,193
Software 18,204 16,830 16,141
GlobalFinancing 2,379 2,407 2,608
Other 94 147 68
Total Revenue 91,424 91,134 96,293
Cost:GlobalServices 34,972 35,093 35,078
Hardware 14,175 15,803 22,008
Software 2,693 2,534 2,489
GlobalFinancing 1,182 1,091 1,046Other 107 81 103
Total Cost 53,129 54,602 60,724
Gross Profit 38,295 36,532 35,569
Expense and Other Income:Selling,generalandadministrative 20,259 21,314 20,079
Research,developmentandengineering q 6,107 5,842 5,874
Intellectualpropertyandcustomdevelopmentincome (900) (948) (1,169)
Other(income)andexpense (766) (2,122) (23)Interestexpense k&l 278 220 139
Total Expense and Other Income 24,978 24,306 24,900
Income from Continuing Operations Before Income Taxes 13,317 12,226 10,669
Provisionforincometaxes p 3,901 4,232 3,172
Income from Continuing Operations 9,416 7,994 7,497
Discontinued Operations:Income/( loss)fromdiscontinuedoperations,netoftax 76 (24) (18)
Incomebeforecumulativeeffectofchangeinaccountingprinciple 9,492 7,970 7,479
Cumulativeeffectofchangeinaccountingprinciple,netoftax* b — (36) —
Net Income $ 9,492 $ 7,934 $ 7,479
Earnings/(Loss) per Share of Common Stock: Assuming Dilution: Continuingoperations s $ 6.06 $ 4.91 $ 4.39
Discontinuedoperations s 0.05 (0.01) (0.01)
Beforecumulativeeffectofchangeinaccountingprinciple s 6.11 4.90 4.38
Cumulativeeffectofchangeinaccountingprinciple* — (0.02) —
Total s $ 6.11 $ 4.87 $ 4.38
Basic: Continuingoperations s $ 6.15 $ 4.99 $ 4.48
Discontinuedoperations s 0.05 (0.02) (0.01)
Beforecumulativeeffectofchangeinaccountingprinciple s 6.20 4.98 4.47 Cumulativeeffectofchangeinaccountingprinciple* s — (0.02) —
Total s $ 6.20 $ 4.96 $ 4.47
Weighted-Average Number of Common Shares Outstanding: Assumingdilution 1,553,535,384 1,627,632,662 1,707,231,708
Basic 1,530,806,987 1,600,591,264 1,674,959,086
* ReflectsimplementationofFASBInterpretationNo.47.SeenoteB,“AccountingChanges,”onpage72foradditionalinformation.
Theaccompanyingnotesonpages62through115areanintegralpartofthefinancialstatements.
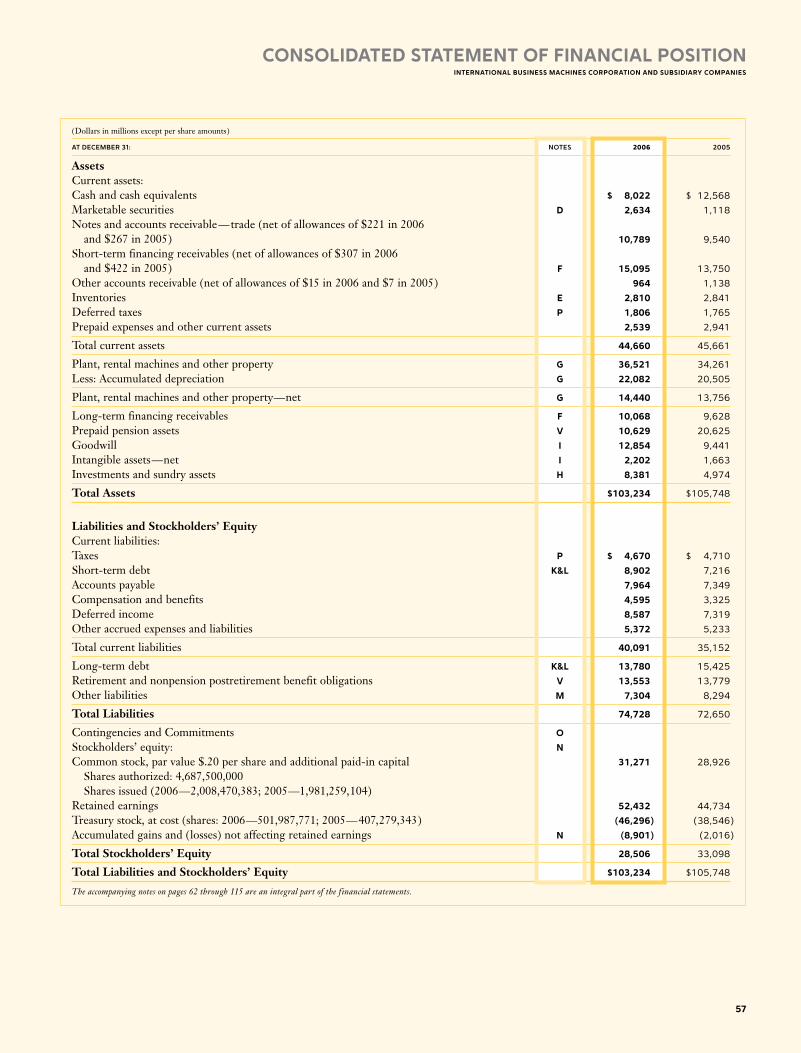
Black
MAC
129 CG10
consoliDateD stateMent oF Financial positioninternational business Machines corporation anD subsiDiary coMpanies
57
(Dollarsinmillionsexceptpershareamounts)
at deCeMBer 31: notes 2006 2005
AssetsCurrentassets:Cashandcashequivalents $ 8,022 $ 12,568
Marketablesecurities D 2,634 1,118
Notesandaccountsreceivable—trade(netofallowancesof$221in2006 and$267in2005) 10,789 9,540
Short-termfinancingreceivables(netofallowancesof$307in2006 and$422in2005) F 15,095 13,750
Otheraccountsreceivable(netofallowancesof$15in2006and$7in2005) 964 1,138
Inventories e 2,810 2,841
Deferredtaxes p 1,806 1,765
Prepaidexpensesandothercurrentassets 2,539 2,941
Totalcurrentassets 44,660 45,661
Plant,rentalmachinesandotherproperty G 36,521 34,261
Less:Accumulateddepreciation G 22,082 20,505
Plant,rentalmachinesandotherproperty—net G 14,440 13,756
Long-termfinancingreceivables F 10,068 9,628
Prepaidpensionassets V 10,629 20,625
Goodwill i 12,854 9,441
Intangibleassets—net i 2,202 1,663
Investmentsandsundryassets h 8,381 4,974
Total Assets $103,234 $105,748
Liabilities and Stockholders’ EquityCurrentliabilities:Taxes p $ 4,670 $ 4,710
Short-termdebt k&l 8,902 7,216
Accountspayable 7,964 7,349
Compensationandbenefits 4,595 3,325
Deferredincome 8,587 7,319
Otheraccruedexpensesandliabilities 5,372 5,233
Totalcurrentliabilities 40,091 35,152
Long-termdebt k&l 13,780 15,425
Retirementandnonpensionpostretirementbenefitobligations V 13,553 13,779
Otherliabilities M 7,304 8,294
Total Liabilities 74,728 72,650
ContingenciesandCommitments oStockholders’equity: nCommonstock,parvalue$.20pershareandadditionalpaid-incapital 31,271 28,926
Sharesauthorized:4,687,500,000 Sharesissued(2006—2,008,470,383;2005—1,981,259,104)Retainedearnings 52,432 44,734
Treasurystock,atcost(shares:2006—501,987,771;2005—407,279,343) (46,296) (38,546)
Accumulatedgainsand(losses)notaffectingretainedearnings n (8,901) (2,016)
Total Stockholders’ Equity 28,506 33,098
Total Liabilities and Stockholders’ Equity $103,234 $105,748
Theaccompanyingnotesonpages62through115areanintegralpartofthefinancialstatements.
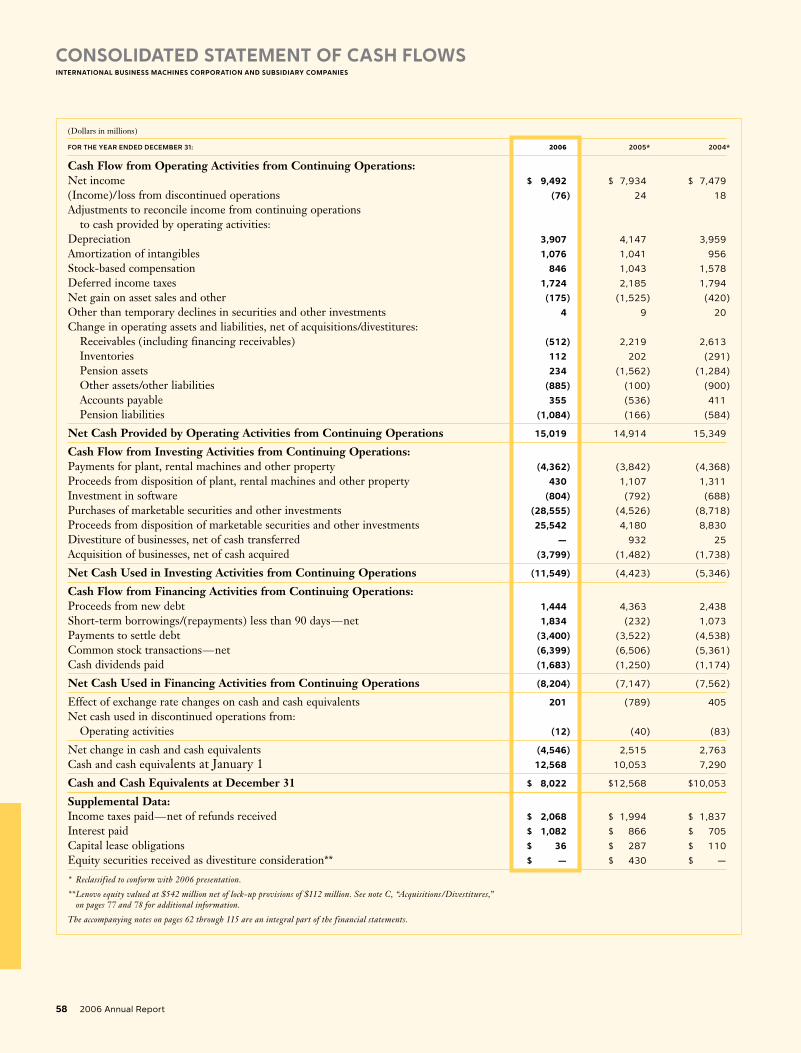
Black
MAC
129 CG10
(Dollarsinmillions)
for the year ended deCeMBer 31: 2006 2005* 2004*
Cash Flow from Operating Activities from Continuing Operations:Netincome $ 9,492 $ 7,934 $ 7,479
(Income)/lossfromdiscontinuedoperations (76) 24 18
Adjustmentstoreconcileincomefromcontinuingoperations tocashprovidedbyoperatingactivities:Depreciation 3,907 4,147 3,959
Amortizationofintangibles 1,076 1,041 956
Stock-basedcompensation 846 1,043 1,578
Deferredincometaxes 1,724 2,185 1,794
Netgainonassetsalesandother (175) (1,525) (420)
Otherthantemporarydeclinesinsecuritiesandotherinvestments 4 9 20
Changeinoperatingassetsandliabilities,netofacquisitions/divestitures: Receivables(includingfinancingreceivables) (512) 2,219 2,613
Inventories 112 202 (291)
Pensionassets 234 (1,562) (1,284)
Otherassets/otherliabilities (885) (100) (900)
Accountspayable 355 (536) 411
Pensionliabilities (1,084) (166) (584)
Net Cash Provided by Operating Activities from Continuing Operations 15,019 14,914 15,349
Cash Flow from Investing Activities from Continuing Operations:Paymentsforplant,rentalmachinesandotherproperty (4,362) (3,842) (4,368)
Proceedsfromdispositionofplant,rentalmachinesandotherproperty 430 1,107 1,311
Investmentinsoftware (804) (792) (688)
Purchasesofmarketablesecuritiesandotherinvestments (28,555) (4,526) (8,718)
Proceedsfromdispositionofmarketablesecuritiesandotherinvestments 25,542 4,180 8,830
Divestitureofbusinesses,netofcashtransferred — 932 25
Acquisitionofbusinesses,netofcashacquired (3,799) (1,482) (1,738)
Net Cash Used in Investing Activities from Continuing Operations (11,549) (4,423) (5,346)
Cash Flow from Financing Activities from Continuing Operations:Proceedsfromnewdebt 1,444 4,363 2,438
Short-termborrowings/(repayments)lessthan90days—net 1,834 (232) 1,073
Paymentstosettledebt (3,400) (3,522) (4,538)
Commonstocktransactions—net (6,399) (6,506) (5,361)
Cashdividendspaid (1,683) (1,250) (1,174)
Net Cash Used in Financing Activities from Continuing Operations (8,204) (7,147) (7,562)
Effectofexchangeratechangesoncashandcashequivalents 201 (789) 405
Netcashusedindiscontinuedoperationsfrom: Operatingactivities (12) (40) (83)
Netchangeincashandcashequivalents (4,546) 2,515 2,763
CashandcashequivalentsatJanuary1 12,568 10,053 7,290
Cash and Cash Equivalents at December 31 $ 8,022 $12,568 $10,053
Supplemental Data:Incometaxespaid—netofrefundsreceived $ 2,068 $ 1,994 $ 1,837
Interestpaid $ 1,082 $ 866 $ 705
Capitalleaseobligations $ 36 $ 287 $ 110
Equitysecuritiesreceivedasdivestitureconsideration** $ — $ 430 $ —
* Reclassifiedtoconformwith2006presentation.
**Lenovoequityvaluedat$542millionnetoflock-upprovisionsof$112million.SeenoteC,“Acquisitions/Divestitures,”onpages77and78foradditionalinformation.
Theaccompanyingnotesonpages62through115areanintegralpartofthefinancialstatements.
consoliDateD stateMent oF cash Flowsinternational business Machines corporation anD subsiDiary coMpanies
58 2006AnnualReport

Black
MAC
129 CG10
(Dollarsinmillions)
CoMMon aCCuMulated stoCk Gains and and (losses) not additional affeCtinG paid-in retained treasury retained Capital earninGs stoCk earninGs total
2004 Stockholders’equity,January1,2004 $23,490 $31,971 $(24,034) $(1,896) $29,531
Netincomeplusgainsand( losses)not affectingretainedearnings: Netincome 7,479 $ 7,479
Gainsand(losses)notaffectingretained earnings(netoftax): NetunrealizedlossesonSFASNo.133 cashflowhedgederivatives (netoftaxbenefitof$112) (199) (199)
Foreigncurrencytranslationadjustments (netoftaxbenefitof$93*) 1,055 1,055
Minimumpensionliabilityadjustment (netoftaxbenefitof$540) (1,066) (1,066)
Netunrealizedgainsonmarketable securities(netoftaxexpenseof$30) 45 45
Totalgainsand(losses)notaffecting retainedearnings (165)
Subtotal:Netincomeplusgainsand(losses) notaffectingretainedearnings $ 7,314
Cashdividendsdeclared—commonstock (1,174) (1,174)
Commonstockissuedunderemployeeplans (25,293,484shares) 3,033 3,033
Purchases(422,338shares)andsales (2,840,648shares)oftreasurystock underemployeeplans—net (128) 237 109
Othertreasurysharespurchased,notretired (78,562,974shares) (7,275) (7,275)
Decreaseinsharesremainingtobeissued inacquisition (6) (6)
Incometaxbenefits—stocktransactions 156 156
Stockholders’ equity, December 31, 2004 $26,673 $38,148 $(31,072) $(2,061) $31,688
* Foreigncurrencytranslationadjustmentsarepresentedgrosswithassociatedhedgesshownnetoftax.
Theaccompanyingnotesonpages62through115areanintegralpartofthefinancialstatements.
consoliDateD stateMent oF stockholDers’ equityinternational business Machines corporation anD subsiDiary coMpanies
59

Black
MAC
129 CG10
(Dollarsinmillions)
CoMMon aCCuMulated stoCk Gains and and (losses) not additional affeCtinG paid-in retained treasury retained Capital earninGs stoCk earninGs total
2005 Stockholders’equity,January1,2005 $26,673 $38,148 $(31,072) $(2,061) $31,688
Netincomeplusgainsand(losses)not affectingretainedearnings: Netincome 7,934 $ 7,934
Gainsand(losses)notaffectingretained earnings(netoftax): NetunrealizedgainsonSFASNo.133 cashflowhedgederivatives (netoftaxexpenseof$502) 891 891
Foreigncurrencytranslationadjustments (netoftaxexpenseof$345*) (1,153) (1,153)
Minimumpensionliabilityadjustment (netoftaxexpenseof$320) 290 290
Netunrealizedgainsonmarketable securities(netoftaxexpenseof$8) 17 17
Totalgainsand(losses)notaffecting retainedearnings 45
Subtotal:Netincomeplusgainsand(losses) notaffectingretainedearnings $ 7,979
Cashdividendsdeclared—commonstock (1,250) (1,250)
Commonstockissuedunderemployeeplans (18,572,017shares) 2,257 2,257
Purchases(606,697shares)andsales (2,594,786shares)oftreasurystock underemployeeplans—net (98) 197 99
Othertreasurysharespurchased,notretired (90,237,800shares) (7,671) (7,671)
Decreaseinsharesremainingtobeissued inacquisition (24) (24)
Incometaxbenefits—stocktransactions 20 20
Stockholders’ equity, December 31, 2005 $28,926 $44,734 $(38,546) $(2,016) $33,098
* Foreigncurrencytranslationadjustmentsarepresentedgrosswithassociatedhedgesshownnetoftax.
Theaccompanyingnotesonpages62through115areanintegralpartofthefinancialstatements.
consoliDateD stateMent oF stockholDers’ equityinternational business Machines corporation anD subsiDiary coMpanies
60 2006AnnualReport

Black
MAC
129 CG10
(Dollarsinmillions)
CoMMon aCCuMulated stoCk Gains and and (losses) not additional affeCtinG paid-in retained treasury retained Capital earninGs stoCk earninGs total
2006 Stockholders’equity,January1,2006 $28,926 $44,734 $(38,546) $ (2,016) $33,098
Netincomeplusgainsand(losses)not affectingretainedearnings: Netincome 9,492 $ 9,492
Gainsand(losses)notaffectingretained earnings(netoftax): NetunrealizedlossesonSFASNo.133 cashflowhedgederivatives (netoftaxbenefitof$178) (342) (342)
Foreigncurrencytranslationadjustments (netoftaxbenefitof$225*) 1,020 1,020
Minimumpensionliabilityadjustment (netoftaxexpenseof$900) 1,881 1,881
Netunrealizedgainsonmarketable securities(netoftaxexpenseof$34) 53 53
Totalgainsand( losses)notaffecting retainedearnings 2,613
AdjustmentstoinitiallyadoptSFASNo.158: Priorservicecosts(netoftaxexpenseof$494) 871 871
Netgains/( losses)(netoftaxbenefitof$6,028) (10,371) (10,371)
Transitionassets/(obligations) (netoftaxexpenseof$1) 2 2
Subtotal:Netincomeplusgainsand( losses) notaffectingretainedearningsandadjustments toadoptSFASNo.158 $ 2,607
Cashdividendsdeclared—commonstock (1,683) (1,683)
Commonstockissuedunderemployeeplans (27,211,279shares) 2,322 2,322
Purchases(633,769shares)andsales ( 3,489,803shares)oftreasurystock underemployeeplans—net (111) 272 161
Othertreasurysharespurchased,notretired ( 97,564,462shares) (8,022) (8,022)
Decreaseinsharesremainingtobeissued inacquisition (3) (3)
Incometaxbenefits—stocktransactions 26 26
Stockholders’ equity, December 31, 2006 $31,271 $52,432 $(46,296) $ (8,901) $28,506
* Foreigncurrencytranslationadjustmentsarepresentedgrosswithassociatedhedgesshownnetoftax.
Theaccompanyingnotesonpages62through115areanintegralpartofthefinancialstatements.
consoliDateD stateMent oF stockholDers’ equityinternational business Machines corporation anD subsiDiary coMpanies
61

a. siGniFicant accountinG policies
basis oF presentationthe international business Machines corporation (ibM or the company) made changes to its management system effective as ofthefirstquarterof2006.InaccordancewithStatementofFinancialAccountingStandards(SFAS)No.131,“DisclosuresaboutSegmentsofanEnterpriseandRelated Information,” thesechanges impactedthecompany’sreportablesegmentsandresultedinthereclassificationof certain revenue and cost within its Consolidated Statement ofEarningsfrompreviouslyreportedinformation.SeenoteW,“SegmentInformation,”onpage111foradditionalinformationonthechangesin reportable segments. These changes did not impact IBM’s totalrevenue,cost,expense,netincome,earningspershare,ConsolidatedStatementofFinancialPositionorConsolidatedStatementofCashFlows from previously reported information. The company filed aForm8-KwiththeSecuritiesandExchangeCommission(SEC)onJune 13, 2006 to reclassify its historical financial statements andrelated footnotes to reflect thesemanagement systemchanges.TheConsolidatedFinancialStatementsandaccompanyingnotes,asappli-cable,reflectthesechangesforallperiodspresented. On December 31, 2002, the company sold its hard disk drive(HDD)businesstoHitachi,Ltd.(Hitachi).TheHDDbusinesswaspart of the company’s Systems and Technology Group reportablesegment. The HDD business was accounted for as a discontinuedoperation under accounting principles generally accepted in theUnitedStatesofAmerica(GAAP)andtherefore,theHDDresultsofoperations and cash flows have been removed from the company’sresultsofcontinuingoperationsandcash flows forallperiodspre-sentedinthisdocument. For 2006, Income from discontinued operations, net of tax, isrelatedtotaxbenefitsfromtaxauditsettlements.Fortheyears2005and2004, theLoss fromdiscontinuedoperations,netof tax, ispri-marilyadditionalcostsassociatedwithpartswarrantyasagreeduponbythecompanyandHitachi.
principles oF consoliDationthe consolidated Financial statements include the accounts of ibM and its controlled subsidiaries, which are generally majority owned.Theaccountsofvariableinterestentities(VIEs)asdefinedbytheFinancialAccountingStandardsBoard(FASB)InterpretationNo.46(R)( FIN46(R)),areincludedintheConsolidatedFinancialStatements,ifrequired.Investmentsinbusinessentitiesinwhichthecompanydoesnothavecontrol,buthas theability toexercise sig-nificantinfluenceoveroperatingandfinancialpolicies,areaccountedforusingtheequitymethodandthecompany’sproportionateshareof incomeor loss is recorded inOther (income)andexpense.Theaccounting policy for other investments in equity securities isdescribedonpage70within“MarketableSecurities.”Equityinvest-ments in non-publicly traded entities are primarily accounted forusing the cost method. Intercompany transactions and accountshavebeeneliminated.
use oF estiMatesthe preparation of consolidated Financial statements in confor-mity with Gaap requires management to make estimates and assumptions thataffecttheamountsofassets,liabilities,revenue,costs,expensesandgainsandlossesnotaffectingretainedearningsthatarereportedintheConsolidatedFinancialStatementsandaccompanyingdisclosures,includingthedisclosureofcontingentassetsandliabilities.Theseestimatesarebasedonmanagement’sbestknowledgeofcurrentevents,historicalexperience,actionsthatthecompanymayundertakeinthefutureandonvariousotherassumptionsthatarebelievedtobereasonableunderthecircumstances.Asaresult,actualresultsmaybedifferentfromtheseestimates.Seepages45to47andpage53foradiscussionofthecompany’scriticalaccountingestimates.
reVenuethe company recognizes revenue when it is realized or realizable and earned.Thecompanyconsidersrevenuerealizedorrealizableand earned when it has persuasive evidence of an arrangement,delivery has occurred, the sales price is fixed or determinable andcollectibility is reasonably assured. Delivery does not occur untilproducts have been shipped or services have been provided to theclient, risk of loss has transferred to the client, and either clientacceptance has been obtained, client acceptance provisions havelapsed,orthecompanyhasobjectiveevidencethatthecriteriaspeci-fiedintheclientacceptanceprovisionshavebeensatisfied.Thesalespriceisnotconsideredtobefixedordeterminableuntilallcontin-genciesrelatedtothesalehavebeenresolved. Thecompanyrecognizesrevenueonsales tosolutionproviders,resellersanddistributors(hereinreferredtoas“resellers”)whentheresellerhaseconomicsubstanceapartfromthecompany,creditrisk,titleandriskof losstotheinventory,thefeetothecompanyisnotcontingentuponresaleorpaymentbytheenduser,thecompanyhasnofurtherobligationsrelatedtobringingaboutresaleordeliveryandallotherrevenuerecognitioncriteriahavebeenmet.
notes to consoliDateD Financial stateMentsinternational business Machines corporation anD subsiDiary coMpanies
62 2006AnnualReport
consolidated statements ......................................................... 56
notes ..................................................................................... 62
A-G......................................................................................... 62
A.SignificantAccountingPolicies....................................... 62
B.AccountingChanges........................................................ 71
C.Acquisitions/Divestitures................................................. 73
D.FinancialInstruments(excludingderivatives)................ 78
E.Inventories....................................................................... 79
F.FinancingReceivables...................................................... 79
G.Plant,RentalMachinesandOtherProperty................... 79
H-M......................................................................................... 80
N-S.......................................................................................... 88
T-X.......................................................................................... 96
Black
MAC
390 CG10

Black
MAC
CG10
Thecompanyreducesrevenueforestimatedclientreturns,stockrotation,priceprotection,rebatesandothersimilarallowances. (SeeSchedule II, “Valuation and Qualifying Accounts and Reserves”includedinthecompany’sAnnualReportonForm10-K).Revenueisrecognized only if these estimates can be reliably determined. Thecompanybasesitsestimatesonhistoricalresultstakingintoconsider-ationthetypeofclient,thetypeoftransactionandthespecificsofeacharrangement.Paymentsmadeundercooperativemarketingprogramsare recognizedas anexpenseonly if thecompany receives fromtheclient an identifiable benefit sufficiently separable from the productsalewhosefairvaluecanbereasonablyestimated.Ifthecompanydoesnotreceiveanidentifiablebenefitsufficientlyseparablefromtheprod-uctsalewhosefairvaluecanbereasonablyestimated,suchpaymentsarerecordedasareductionofrevenue. Revenuefromsalesofthird-partyvendorproductsorservicesisrecordednetofcostswhenthecompanyisactingasanagentbetweentheclientandvendorandgrosswhenthecompanyisaprincipaltothetransaction.Severalfactorsareconsideredtodeterminewhetherthecompanyisanagentorprincipal,mostnotablywhetherthecom-panyistheprimaryobligortotheclient,hasinventoryriskoraddsmeaningfulvaluetothevendor’sproductorservice.Considerationisalsogiventowhetherthecompanywasinvolvedintheselectionofthevendor’sproductorservice,haslatitudeinestablishingthesalespriceorhascreditrisk. The company reports revenue net of any revenue-based taxesassessedbygovernmentalauthoritiesthatareimposedonandconcur-rentwithspecificrevenue-producingtransactions.Inadditiontotheaforementionedgeneralpolicies,thefollowingarethespecificrevenuerecognitionpoliciesformultiple-elementarrangementsandforeachmajorcategoryofrevenue.
Multiple-element arrangementsThe company enters into multiple-element revenue arrangements,whichmay includeanycombinationof services, software,hardwareand/or financing.Totheextent thatadeliverable inamultiple-ele-ment arrangement is subject to specific guidance ( like leased hard-ware that is subject to SFAS No. 13, “Accounting for Leases,” orsoftwarethatissubjecttotheAmericanInstituteofCertifiedPublicAccountants(AICPA)StatementofPosition(SOP)No.97-2,“SoftwareRevenueRecognition,”see“Software”onpage64)onwhetherand/orhowtoseparatemultipledeliverablearrangementsintoseparateunitsof accounting (separability) and how to allocate the arrangementconsiderationamongthoseseparateunitsofaccounting(allocation),that deliverable is accounted for in accordance with such specificguidance. For all other deliverables in multiple-element arrange-ments,theguidancebelowisappliedforseparabilityandallocation.Amultiple-elementarrangementisseparatedintomorethanoneunitofaccountingifallofthefollowingcriteriaaremet:
•Thedelivereditem(s)hasvaluetotheclientonastand-alonebasis;
•Thereisobjectiveandreliableevidenceofthefairvalueoftheundelivereditem(s);and
•Ifthearrangementincludesageneralrightofreturnrelativetothedelivereditem(s),deliveryorperformanceoftheundelivereditem(s)isconsideredprobableandsubstantiallyinthecontrolofthecompany.
Ifthesecriteriaarenotmet,thearrangementisaccountedforasoneunitofaccountingwhichwouldresultinrevenuebeingrecognizedonastraight-linebasisorbeingdeferreduntiltheearlierofwhensuchcriteriaaremetorwhenthelastundeliveredelementisdelivered.Ifthese criteria are met for each element and there is objective andreliableevidenceoffairvalueforallunitsofaccountinginanarrange-ment,thearrangementconsiderationisallocatedtotheseparateunitsofaccountingbasedoneachunit’srelativefairvalue.Theremaybecases,however,inwhichthereisobjectiveandreliableevidenceoffairvalueoftheundelivereditem(s)butnosuchevidenceforthedelivereditem(s). In those cases, the residual method is used to allocate thearrangementconsideration.Undertheresidualmethod,theamountof consideration allocated to the delivered item(s) equals the totalarrangementconsiderationlesstheaggregatefairvalueoftheunde-livereditem(s).Therevenuepoliciesdescribedbelowarethenappliedtoeachunitofaccounting,asapplicable. If the allocation of consideration in a profitable arrangementresultsinalossonanelement,thatlossisrecognizedattheearlierof(a) delivery of that element, (b) when the first dollar of revenue isrecognizedonthatelement,or(c)whentherearenoremainingprof-itableelementsinthearrangementtobedelivered.
servicesThecompany’sprimaryservicesofferings includeinformationtech-nology(IT)datacenterandbusinessprocessoutsourcing,applicationmanagementservices, technology infrastructureandsystemmainte-nance,Webhosting,andthedesignanddevelopmentofcomplexITsystemstoaclient’sspecifications(DesignandBuild).Theseservicesareprovidedonatime-and-materialbasis,asafixed-pricecontractorasafixed-pricepermeasureofoutputcontractandthecontracttermsrangefromlessthanoneyeartoover10years. Revenue from IT datacenter and business process outsourcingcontractsisrecognizedintheperiodtheservicesareprovidedusingeitheranobjectivemeasureofoutputorastraight-linebasisoverthetermofthecontract.Undertheoutputmethod,theamountofrevenuerecognizedisbasedontheservicesdeliveredintheperiod. Revenue from application management services, technologyinfrastructureandsystemmaintenanceandWebhostingcontractsisrecognized on a straight-line basis over the terms of the contracts.Revenue from time-and-material contracts is recognized as laborhoursaredeliveredanddirectexpensesareincurred.Revenuerelatedto extended warranty and product maintenance contracts is recog-nizedonastraight-linebasisoverthedeliveryperiod.
notes to consoliDateD Financial stateMentsinternational business Machines corporation anD subsiDiary coMpanies
63

Revenue from fixed-price Design and Build contracts is recog-nizedinaccordancewithSOPNo.81-1,“AccountingforPerformanceof Construction-Type and Certain Production-Type Contracts,”under the percentage-of-completion (POC) method. Under thePOCmethod,revenue is recognizedbasedonthecosts incurredtodateasapercentageofthetotalestimatedcoststofulfillthecontract.Ifcircumstancesarisethatchangetheoriginalestimatesofrevenues,costs,orextentofprogresstowardcompletion,revisionstotheesti-matesaremade.Theserevisionsmayresultinincreasesordecreasesin estimated revenues or costs, and such revisions are reflected inincomeintheperiodinwhichthecircumstancesthatgiverisetotherevisionbecomeknownbymanagement.WhilethecompanyusesthePOC method as its basic accounting policy under SOP 81-1, thecompanyusesthecompleted-contractmethodifreasonableestimatesforacontractorgroupofcontractscannotbedeveloped. The companyperformsongoingprofitability analysesof its ser-vices contracts accounted for under the POC method in order todeterminewhether the latestestimatesofrevenue,costsandprofitsrequire updating. If at any time these estimates indicate that thecontractwillbeunprofitable,theentireestimatedlossfortheremain-derof thecontract is recorded immediately.Fornon-POCservicescontracts,lossesarerecordedasincurred. Insomeofthecompany’sservicescontracts,thecompanybillstheclient prior to recognizing revenue from performing the services.Deferred income of $5.0 billion and $4.3 billion at December 31,2006and2005,respectively,isincludedintheConsolidatedStatementofFinancialPosition.Inotherservicescontracts,thecompanyper-forms the services prior to billing the client. Unbilled accountsreceivableof$1.8billionand$1.7billionatDecember31,2006and2005, respectively, are included in Notes and accounts receivable-trade in theConsolidatedStatementofFinancialPosition.Billingsusuallyoccurinthemonthafterthecompanyperformstheservicesor in accordance with specific contractual provisions. Unbilledreceivables are expected to be billed and collected within fourmonths,rarelyexceedingninemonths.
hardwareRevenue from hardware sales and sales-type leases is recognizedwhenriskoflosshastransferredtotheclientandtherearenounful-filledcompanyobligationsthataffecttheclient’sfinalacceptanceofthe arrangement. Any cost of standard warranties and remainingobligationsthatareinconsequentialorperfunctoryareaccruedwhenthecorrespondingrevenueisrecognized.Revenuefromrentalsandoperatingleasesisrecognizedonastraight-linebasisoverthetermoftherentalorlease.
softwareRevenuefromperpetual(one-timecharge)licensesoftwareisrecog-nizedat the inceptionof the license termifall revenuerecognitioncriteriahavebeenmet.Revenuefromterm(recurringlicensecharge)licensesoftwareisrecognizedonasubscriptionbasisovertheperiodthattheclientisentitledtousethelicense.Revenuefrommaintenance,unspecifiedupgradesonawhen-and-if-availablebasis and technicalsupport is recognized over the period such items are delivered. Inmultiple-elementrevenuearrangementsthatincludesoftwarethatismorethanincidentaltotheproductsorservicesasawhole(softwaremultiple-element arrangements), software and software-related ele-ments are accounted for in accordance with the following policies.Software-relatedelementsincludesoftwareproductsandservices,aswellasanynon-softwaredeliverableforwhichasoftwaredeliverableisessentialtoitsfunctionality. Asoftwaremultiple-elementarrangementisseparatedintomorethanoneunitofaccountingifallofthefollowingcriteriaaremet:
•Thefunctionalityofthedeliveredelement(s)isnotdependentontheundeliveredelement(s);
•Thereisvendor-specificobjectiveevidence( VSOE)offairvalueoftheundeliveredelement(s).VSOEoffairvalueisbasedonthepricechargedwhenthedeliverableissoldseparatelybythecompanyonaregularbasisandnotaspartofthemultiple-elementarrangement;and
•Deliveryofthedeliveredelement(s)representstheculminationoftheearningsprocessforthatelement(s).
Ifthesecriteriaarenotmet,thearrangementisaccountedforasoneunitofaccountingwhichwouldresultinrevenuebeingrecognizedonastraight-linebasisorbeingdeferreduntiltheearlierofwhensuchcriteriaaremetorwhenthelastundeliveredelementisdelivered.IfthesecriteriaaremetforeachelementandthereisVSOEoffairvalueforallunitsofaccountinginanarrangement,thearrangementcon-sideration is allocated to the separate units of accounting based oneachunit’srelativeVSOEoffairvalue.Theremaybecases,however,inwhichthereisVSOEoffairvalueoftheundelivereditem(s)butnosuch evidence for the delivered item(s). In these cases, the residualmethodisusedtoallocatethearrangementconsideration.Undertheresidualmethod,theamountofconsiderationallocatedtothedeliv-ered item(s) equals the total arrangement consideration less theaggregateVSOEoffairvalueoftheundeliveredelements.
notes to consoliDateD Financial stateMentsinternational business Machines corporation anD subsiDiary coMpanies
64 2006AnnualReport
consolidated statements ......................................................... 56
notes ..................................................................................... 62
A-G......................................................................................... 62
A.SignificantAccountingPolicies....................................... 62
B.AccountingChanges........................................................ 71
C.Acquisitions/Divestitures................................................. 73
D.FinancialInstruments(excludingderivatives)................ 78
E.Inventories....................................................................... 79
F.FinancingReceivables...................................................... 79
G.Plant,RentalMachinesandOtherProperty................... 79
H-M......................................................................................... 80
N-S.......................................................................................... 88
T-X.......................................................................................... 96
Black
MAC
390 CG10

Black
MAC
390 CG10
FinancingFinance income attributable to sales-type leases, direct financing leases and loans is recognized on the accrual basis using the effective interest method. Operating lease income is recognized on a straight-line basis over the term of the lease.
ServiceS coStSrecurring operating costs for outsourcing contracts, including costs related to bid and proposal activities, are expensed as incurred. Certain eligible, nonrecurring costs incurred in the initial phases of outsourcing contracts are deferred and subsequently amortized. These costs consist of transition and set up costs related to the instal-lation of systems and processes and are amortized on a straight-line basis over the expected period of benefit, not to exceed the term of the contract. Additionally, fixed assets associated with outsourcing con-tracts are capitalized and depreciated on a straight-line basis over the expected useful life of the asset. If an asset is contract specific, then the depreciation period is the shorter of the useful life of the asset or the contract term. Amounts paid to clients in excess of the fair value of acquired assets used in outsourcing arrangements are deferred and amortized on a straight-line basis as a reduction of revenue over the expected period of benefit not to exceed the term of the contract. The company performs periodic reviews to assess the recoverability of deferred contract transition and set up costs. This review is done by comparing the estimated minimum remaining undiscounted cash flows of a contract to the unamortized contract costs. If such minimum undiscounted cash flows are not sufficient to recover the unamortized costs, a loss is recognized. Deferred services transition and set up costs were $1,511 million and $1,004 million at December 31, 2006 and December 31, 2005, respectively. The primary driver of the increase year to year was the continued growth of the company’s Global Services business. Amortization expense of deferred services transition and set up costs is estimated at December 31, 2006 to be $386 million in 2007, $324 million in 2008, $250 million in 2009, $188 million in 2010, and $363 million thereafter. Deferred amounts paid to clients in excess of the fair value of acquired assets used in outsourcing arrangements were $210 million and $227 million at December 31, 2006 and December 31, 2005, respectively. Amortization of deferred amounts paid to clients in excess of the fair value of acquired assets is recorded as an offset of revenue and is estimated at December 31, 2006 to be $94 million in 2007, $57 million in 2008, $37 million in 2009, $16 million in 2010, and $5 million thereafter. In situations in which an outsourcing contract is terminated, the terms of the contract may require the client to reimburse the company for the recovery of unbilled accounts receivable, unamortized deferred costs incurred to purchase specific assets utilized in the delivery of services and to pay any additional costs incurred by the company to transition the services.
SoFtware coStScosts that are related to the conceptual formulation and design of licensed programs are expensed as incurred to research, devel-opment and engineering expense. Also, for licensed programs, the company capitalizes costs that are incurred to produce the finished product after technological feasibility has been established. Capitalized amounts are amortized using the straight-line method, which is applied over periods ranging up to three years. The company per-forms periodic reviews to ensure that unamortized program costs remain recoverable from future revenue. Costs to support or service licensed programs are charged to software cost as incurred. The company capitalizes certain costs that are incurred to pur-chase or to create and implement internal-use computer software, which includes software coding, installation, testing and certain data conversion. These capitalized costs are amortized on a straight-line basis over two years and are recorded in Selling, general and admin-istrative expense. See note I, “Intangible Assets Including Goodwill,” on pages 80 and 81.
Product warrantieSthe company offers warranties for its hardware products that range up to four years, with the majority being either one or three years. Estimated costs from warranty terms standard to the deliverable are recognized when revenue is recorded for the related deliverable. The company estimates its warranty costs standard to the deliverable based on historical warranty claim experience and applies this esti-mate to the revenue stream for products under warranty. Estimated future costs for warranties applicable to revenue recognized in the current period are charged to cost of revenue. The warranty accrual is reviewed quarterly to verify that it properly reflects the remaining obligation based on the anticipated expenditures over the balance of the obligation period. Adjustments are made when actual warranty claim experience differs from estimates. Costs from fixed-price support or maintenance contracts, including extended-warranty contracts, are recognized as incurred. Changes in the company’s warranty liability balance are presented in the following table:
at DECEMBER 31: 2006 2005
Balance at January 1 $ 754 $ 944
Current period accruals 540 622
Accrual adjustments to reflect actual experience 49 19
Charges incurred (762) (831)
Balance at December 31 $ 582 $ 754
The decrease in the balance was primarily driven by a reduction in estimated future costs as a result of the divestiture of the company’s Personal Computing business to Lenovo Group Limited (Lenovo) in April 2005.
noteS to conSolidated Financial StatementSinternational buSineSS machineS corPoration and SubSidiary comPanieS
65

ShiPPing and handlingcosts related to shipping and handling are included in cost in the consolidated Statement of earnings.
exPenSe and other incomeSelling, general and administrativeSelling, general and administrative (SG&A) expense is charged to income as incurred. Expenses of promoting and selling products and services are classified as selling expense and include such items as advertising, sales commissions and travel. General and administrative expense includes such items as compensation, office supplies, non-income taxes, insurance and office rental. In addition, general and administrative expense includes other operating items such as a pro-vision for doubtful accounts, workforce accruals for contractually obligated payments to employees terminated in the ongoing course of business, amortization of certain intangible assets and environmental remediation costs. Certain special actions discussed in note R, “2005 Actions,” on pages 93 and 94 are also included in SG&A.
advertising and Promotional expenseThe company expenses advertising and promotional costs when incurred. Cooperative advertising reimbursements from vendors are recorded net of advertising and promotional expense in the period the related advertising and promotional expense is incurred. Advertising and promotional expense, which includes media, agency and promo-tional expense, was $1,195 million, $1,284 million and $1,335 million in 2006, 2005 and 2004, respectively, and is recorded in SG&A expense in the Consolidated Statement of Earnings.
research, development and engineeringResearch, development and engineering (RD&E) costs are expensed as incurred.
intellectual Property and custom development incomeAs part of the company’s business model and as a result of the compa-ny’s ongoing investment in research and development, the company licenses and sells the rights to certain of its intellectual property (IP) including internally developed patents, trade secrets and technologi-cal know-how. Certain transfers of IP to third parties are licensing/
royalty-based and other transfers are transaction-based sales and other transfers. Licensing/royalty-based fees involve transfers in which the company earns the income over time, or the amount of income is not fixed or determinable until the licensee sells future related products (i.e., variable royalty, based upon licensee’s revenue). Sales and other transfers typically include transfers of IP whereby the company has fulfilled its obligations and the fee received is fixed or determinable at the transfer date. The company also enters into cross-licensing arrange-ments of patents, and income from these arrangements is recorded only to the extent cash is received. Furthermore, the company earns income from certain custom development projects for strategic technology partners and specific clients. The company records the income from these projects when the fee is realized or realizable and earned, is not refundable and is not dependent upon the success of the project.
other (income) and expenseOther (income) and expense includes interest income (other than from the company’s Global Financing external business transactions), gains and losses on certain derivative instruments, gains and losses from securities and other investments, gains and losses from certain real estate activity, foreign currency transaction gains and losses, gains and losses from the sale of businesses and amounts related to accre-tion of asset retirement obligations. Certain special actions discussed in note R, “2005 Actions,” on pages 93 and 94 are also included in Other (income) and expense.
buSineSS combinationS and intangible aSSetS including goodwillthe company accounts for business combinations using the purchase method of accounting and accordingly, the assets and liabilities of the acquired entities are recorded at their estimated fair values at the date of acquisition. Goodwill represents the excess of the purchase price over the fair value of net assets, including the amount assigned to identifiable intangible assets. The company does not amor-tize the goodwill balance. Substantially all of the company’s goodwill is not deductible for tax purposes. The primary drivers that generate goodwill are the value of synergies between the acquired entities and the company and the acquired assembled workforce, neither of which qualifies as an identifiable intangible asset. Identifiable intangible assets with finite lives are amortized over their useful lives. See note C, “Acquisition/Divestitures,” on pages 73 to 78 and note I, “Intangible Assets Including Goodwill,” on pages 80 and 81, for additional infor-mation. The results of operations of the acquired businesses were included in the company’s Consolidated Financial Statements from the respective dates of acquisition.
imPairmentassets, other than goodwill, are tested for impairment based on undiscounted cash flows and, if impaired, written down to fair value based on either discounted cash flows or appraised values. Goodwill is tested annually for impairment, or sooner when circumstances indicate an impairment may exist, using a fair-value approach at the
noteS to conSolidated Financial StatementSinternational buSineSS machineS corPoration and SubSidiary comPanieS
66 2006 Annual Report
consolidated Statements ......................................................... 56
notes ..................................................................................... 62
A-G.......................................................................................... 62
. A..Significant.Accounting.Policies........................................ 62
. B..Accounting.Changes........................................................ 71
. C..Acquisitions/Divestitures.................................................. 73
. D..Financial.Instruments.(excluding.derivatives)................. 78
. E..Inventories........................................................................ 79
. F..Financing.Receivables....................................................... 79
. G..Plant,.Rental.Machines.and.Other.Property.................... 79
H-M.......................................................................................... 80
N-S........................................................................................... 88
T-X........................................................................................... 96
Black
MAC
390 CG10
Black
MAC
CG10
reporting unit level. A reporting unit is the operating segment, or a business, which is one level below that operating segment (the “component” level) if discrete financial information is prepared and regularly reviewed by management at the segment level. Components are aggregated as a single reporting unit if they have similar eco-nomic characteristics.
dePreciation and amortizationPlant, rental machines and other property are carried at cost and depreciated over their estimated useful lives using the straight-line method. The estimated useful lives of depreciable properties are as follows: buildings, 50 years; building equipment, 10 to 20 years; land improvements, 20 years; plant, laboratory and office equipment, 2 to 15 years; and computer equipment, 1.5 to 5 years. Leasehold improvements are amortized over the shorter of their estimated useful lives or the related lease term, rarely exceeding 25 years. Capitalized software costs incurred or acquired after technological feasibility has been established are amortized over periods up to five years. Capitalized costs for internal-use software are amortized on a straight-line basis over two years. (See “Software Costs” on page 65 for additional information). Other intangible assets are amortized over periods between three and seven years.
environmentalthe cost of internal environmental protection programs that are preventative in nature are expensed as incurred. When a cleanup program becomes likely, and it is probable that the company will incur cleanup costs and those costs can be reasonably estimated, the com-pany accrues remediation costs for known environmental liabilities. The company’s maximum exposure for all environmental liabilities cannot be estimated and no amounts are recorded for environmental liabilities that are not probable or estimable.
aSSet retirement obligationSasset retirement obligations (aro) are legal obligations associ-ated with the retirement of long-lived assets. These liabilities are initially recorded at fair value and the related asset retirement costs are capitalized by increasing the carrying amount of the related assets by the same amount as the liability. Asset retirement costs are subsequently depreciated over the useful lives of the related assets. Subsequent to initial recognition, the company records period-to-period changes in the ARO liability resulting from the passage of time and revisions to either the timing or the amount of the original estimate of undis-counted cash flows.
retirement-related beneFitSeffective december 31, 2006, the company adopted the provi-sions of SFaS no. 158, “employer’s accounting for defined benefit Pension and Other Postretirement Plans—an amendment of FASB Statements No. 87, 88, 106, and 132(R)” (SFAS No. 158). SFAS No. 158 requires the recognition of the funded status of the pension plans
and nonpension postretirement benefit plans (retirement-related benefit plans) as an asset or a liability in the Consolidated Statement of Financial Position, the recognition of changes in that funded status in the year in which they occur through the Gains and ( losses) not affecting retained earnings, net of tax, and the recognition of previ-ously unrecognized gains/( losses), prior service costs/(credits) and transition assets as a component of Accumulated gains and ( losses) not affecting retained earnings in the Consolidated Statement of Stockholders’ Equity. The provisions of SFAS No. 158 were adopted pursuant to the transition provisions therein. See note B, “Accounting Changes” on page 71 and note V, “Retirement-Related Benefits,” on pages 100 to 111 for additional information.
defined benefit Pension and nonpension Postretirement benefit PlansThe funded status of the company’s retirement-related benefit plans is recognized in the Consolidated Statement of Financial Position. The funded status is measured as the difference between the fair value of plan assets and the benefit obligation at December 31, the measure-ment date. For defined benefit pension plans, the benefit obligation is the projected benefit obligation (PBO) and for the nonpension post-retirement benefit plans the benefit obligation is the accumulated postretirement benefit obligation (APBO). The PBO represents the actuarial present value of benefits expected to be paid upon retirement based on estimated future compensation levels. The APBO represents the actuarial present value of postretirement benefits attributed to employee services already rendered. The fair value of plan assets rep-resents the current market value of cumulative company contributions made to an irrevocable trust fund, held for the sole benefit of partici-pants, which are invested by the trust fund. Overfunded plans, with the fair value of plan assets exceeding the benefit obligation, are aggregated and recorded as a Prepaid pension asset equal to this excess. Underfunded plans, with the benefit obligation exceeding the fair value of plan assets, are aggregated and recorded as a Retirement and nonpension postretirement benefit obligation equal to this excess. The current portion of the Retirement and nonpension postretirement benefit obligations represent the actuarial present value of benefits payable in the next 12 months exceeding the fair value of plan assets, measured on a plan-by-plan basis. This liability is recorded in Compensation and benefits in the Consolidated Statement of Financial Position. (Gains)/losses and prior service cost/(credit) not recognized as a component of net periodic pension cost/(income) in the Consolidated Statement of Earnings as they arise are recognized as a component of Gains and ( losses) not affecting retained earnings in the Consolidated Statement of Stockholders’ Equity, net of tax. Those (gains)/losses and prior service cost/(credit) are subsequently recognized as a component of net periodic pension period cost/(income) pursuant to the recogni-tion and amortization provisions of applicable accounting standards. (Gains)/losses arise as a result of differences between actual experience and assumptions or as a result of changes in actuarial assumptions. Prior service cost/(credit) represents the cost of benefit improvements attributable to prior service granted in plan amendments.
noteS to conSolidated Financial StatementSinternational buSineSS machineS corPoration and SubSidiary comPanieS
67
Net periodic pension cost/(income) is recorded in the Consolidated Statement of Earnings and includes service cost, interest cost, expected return on plan assets, amortization of prior service cost and (gains)/losses previously recognized as a component of Gains and ( losses) not affecting retained earnings and amortization of the net transition asset remaining in Accumulated gains and ( losses) not affecting retained earnings. Service cost represents the actuarial present value of par-ticipant benefits earned in the current year. Interest cost represents the time value of money cost associated with the passage of time. Certain events, such as changes in employee base, plan amendments and changes in actuarial assumptions, result in a change in the benefit obligation and the corresponding change in the Gains and ( losses) not affecting retained earnings. The result of these events is amortized as a component of net periodic cost/(income) over the service lives of the participants, provided such amounts exceed thresholds which are based upon the benefit obligation or the value of plan assets. The average service lives of the IBM Personal Pension Plan (PPP), a U.S. plan, participants currently approximates 11 years and varies for participants in non-U.S. plans. The measurement of the benefit obligation and net periodic pen-sion cost/(income) is based on the company’s estimates and actuarial valuations provided by third-party actuaries which are approved by the company’s management. These valuations reflect the terms of the plans and use participant-specific information such as compensation, age and years of service, as well as certain assumptions, including estimates of discount rates, expected return on plan assets, rate of compensation increases, interest crediting rates and mortality rates.
defined contribution PlansThe company records expense for defined contribution plans for the company’s contribution when the employee renders service to the com-pany, essentially coinciding with the cash contributions to the plans.
Stock-baSed comPenSationStock-based compensation represents the cost related to stock-based awards granted to employees. the company measures stock-based compensation cost at grant date, based on the estimated fair value of the award and recognizes the cost as expense on a straight-line basis (net of estimated forfeitures) over the employee
requisite service period. The company estimates the fair value of stock options using a Black-Scholes valuation model. The expense is recorded in Cost, SG&A, and RD&E in the Consolidated Statement of Earnings based on the employees’ respective function. The company records deferred tax assets for awards that result in deductions on the company’s income tax returns, based on the amount of compensation cost recognized and the company’s statutory tax rate in the jurisdiction in which it will receive a deduction. Differences between the deferred tax assets recognized for financial reporting purposes and the actual tax deduction reported on the company’s income tax return are recorded in Additional Paid-In Capital (if the tax deduction exceeds the deferred tax asset) or in the Consolidated Statement of Earnings (if the deferred tax asset exceeds the tax deduc-tion and no additional paid-in capital exists from previous awards). See note U, “Stock-Based Compensation,” on pages 96 to 100 for additional information.
income taxeSincome tax expense is based on reported income before income taxes. Deferred income taxes reflect the tax effect of temporary dif-ferences between asset and liability amounts that are recognized for financial reporting purposes and the amounts that are recognized for income tax purposes. These deferred taxes are measured by applying currently enacted tax laws. Valuation allowances are recognized to reduce deferred tax assets to the amount that will more likely than not be realized. In assessing the need for a valuation allowance, manage-ment considers all available evidence including past operating results, estimates of future taxable income and the feasibility of ongoing tax planning strategies. When the company changes its determination as to the amount of deferred tax assets that can be realized, the valuation allowance is adjusted with a corresponding impact to income tax expense in the period in which such determination is made. The company recognizes tax liabilities based on estimates of whether additional taxes will be due. These tax liabilities are recog-nized when, despite the company’s belief that its tax return positions are supportable, the company believes that certain positions are likely to be challenged and may not be fully sustained upon review by tax authorities. These liabilities are included in Taxes in the Consolidated Statement of Financial Position. To the extent that the final tax outcome of these matters is different than the amounts recorded, such differences impact income tax expense in the period in which such determination is made. Interest and penalties, if any, related to accrued liabilities for potential tax assessments are included in income tax expense.
tranSlation oF non-u.S. currency amountSassets and liabilities of non-u.S. subsidiaries that have a local func-tional currency are translated to u.S. dollars at year-end exchange rates. Translation adjustments are recorded in Accumulated gains and ( losses) not affecting retained earnings in the Consolidated Statement of Stockholders’ Equity. Income and expense items are translated at weighted-average rates of exchange prevailing during the year.
noteS to conSolidated Financial StatementSinternational buSineSS machineS corPoration and SubSidiary comPanieS
68 2006 Annual Report
consolidated Statements ......................................................... 56
notes ..................................................................................... 62
A-G.......................................................................................... 62
. A..Significant.Accounting.Policies........................................ 62
. B..Accounting.Changes........................................................ 71
. C..Acquisitions/Divestitures.................................................. 73
. D..Financial.Instruments.(excluding.derivatives)................. 78
. E..Inventories........................................................................ 79
. F..Financing.Receivables....................................................... 79
. G..Plant,.Rental.Machines.and.Other.Property.................... 79
H-M.......................................................................................... 80
N-S........................................................................................... 88
T-X........................................................................................... 96
Black
MAC
390 CG10

Black
MAC
CG10
Inventories, plant, rental machines and other property—net, and other non-monetary assets and liabilities of non-U.S. subsidiaries and branches that operate in U.S. dollars are translated at approximate exchange rates prevailing when the company acquired the assets or liabilities. All other assets and liabilities denominated in a currency other than U.S. dollars are translated at year-end exchange rates with the transaction gain or loss recognized in Other (income) and expense. Cost of sales and depreciation are translated at historical exchange rates. All other income and expense items are translated at the weighted-average rates of exchange prevailing during the year. These translation gains and losses are included in net income for the period in which exchange rates change.
derivativeSall derivatives are recognized in the consolidated Statement of Financial Position at fair value and are reported in Prepaid expenses and other current assets, Investments and sundry assets, Other accrued expenses and liabilities or Other liabilities. Classification of each deriva-tive as current or non-current is based upon whether the maturity of the instrument is less than or greater than 12 months. To qualify for hedge accounting in accordance with SFAS No. 133, “Accounting for Derivative Instruments and Hedging Activities,” as amended by SFAS No. 138, “Accounting for Certain Derivative Instruments and Certain Hedging Activities,” and SFAS No. 149, “Amendment of Statement 133 on Derivative Instruments and Hedging Activities,” (collectively, “SFAS No. 133”), the company requires that the instruments be effec-tive in reducing the risk exposure that they are designated to hedge. For instruments that hedge cash flows, hedge effectiveness criteria also require that it be probable that the underlying transaction will occur. Instruments that meet established accounting criteria are formally designated as hedges. These criteria demonstrate that the derivative is expected to be highly effective at offsetting changes in fair value or cash flows of the underlying exposure both at inception of the hedging relationship and on an ongoing basis. The method of assessing hedge effectiveness and measuring hedge ineffectiveness is formally docu-mented at hedge inception. The company assesses hedge effectiveness and measures hedge ineffectiveness at least quarterly throughout the designated hedge period. The company applies hedge accounting in accordance with SFAS No. 133, whereby the company designates each derivative as a hedge of: (1) the fair value of a recognized financial asset or liability or of an unrecognized firm commitment (“fair value” hedge); (2) the variabil-ity of anticipated cash flows of a forecasted transaction or the cash flows to be received or paid related to a recognized financial asset or liability (“cash flow” hedge); or (3) a hedge of a long-term investment (“net investment” hedge) in a foreign operation. From time to time, however, the company may enter into derivative contracts that eco-nomically hedge certain of its risks, even though hedge accounting does not apply or the company elects not to apply hedge accounting under SFAS No. 133. In these cases, there exists a natural hedging relationship in which changes in the fair value of the derivative, which are recognized currently in net income, act as an economic offset to changes in the fair value of the underlying hedged item(s).
Changes in the fair value of a derivative that is designated as a fair value hedge, along with offsetting changes in the fair value of the underlying hedged exposure, are recorded in earnings each period. For hedges of interest rate risk, the fair value adjustments are recorded as adjustments to Interest expense and Cost of Global Financing in the Consolidated Statement of Earnings. For hedges of currency risk asso-ciated with recorded financial assets or liabilities, derivative fair value adjustments are recognized in Other (income) and expense in the Consolidated Statement of Earnings. Changes in the fair value of a derivative that is designated as a cash flow hedge are recorded, net of applicable taxes, in the Accumulated gains and (losses) not affecting retained earnings, a component of Stockholders’ equity. When net income is affected by the variability of the underlying cash flow, the applicable offsetting amount of the gain or loss from the derivative that is deferred in Stockholders’ equity is released to net income and reported in Interest expense, Cost, SG&A expense or Other (income) and expense in the Consolidated Statement of Earnings based on the nature of the underlying cash flow hedged. Effectiveness for net invest-ment hedging derivatives is measured on a spot-to-spot basis. The effective portion of changes in the fair value of net investment hedging derivatives and other non-derivative risk management instruments designated as net investment hedges are recorded as foreign currency translation adjustments, net of applicable taxes, in the Accumulated gains and (losses) not affecting retained earnings section of the Consolidated Statement of Stockholders’ Equity. Changes in the fair value of the portion of a net investment hedging derivative excluded from the effectiveness assessment are recorded in Interest expense. When the underlying hedged item ceases to exist, all changes in the fair value of the derivative are included in net income each period until the instrument matures. When the derivative transaction ceases to exist, a hedged asset or liability is no longer adjusted for changes in its fair value except as required under other relevant accounting stan-dards. Derivatives that are not designated as hedges, as well as changes in the fair value of derivatives that do not effectively offset changes in the fair value of the underlying hedged item throughout the designated hedge period (collectively, “ineffectiveness”), are recorded in net income each period and are reported in Other (income) and expense. The company reports cash flows arising from the company’s derivative financial instruments consistent with the classification of cash flows from the underlying hedged items that the derivatives are hedging. Accordingly, the majority of cash flows associated with the company’s derivative programs are classified in Cash flows from oper-ating activities in the Consolidated Statement of Cash Flows. Cash flow from derivatives that do not qualify as hedges is reported in investing activities. For currency swaps designated as hedges of foreign currency denominated debt (included in the company’s debt risk man-agement program as addressed in note L, “Derivatives and Hedging Transactions,” on pages 83 through 86), cash flows directly associated with the settlement of the principal element of these swaps are reported in Payments to settle debt in the Cash Flow from Financing Activities from Continuing Operations section of the Consolidated Statement of Cash Flows.
noteS to conSolidated Financial StatementSinternational buSineSS machineS corPoration and SubSidiary comPanieS
69

Financial inStrumentSin determining fair value of its financial instruments, the company uses a variety of methods and assumptions that are based on market conditions and risks existing at each balance sheet date. For the majority of financial instruments, including most derivatives, long-term investments and long-term debt, standard market conventions and techniques such as discounted cash flow analysis, option pricing mod-els, replacement cost and termination cost are used to determine fair value. Dealer quotes are used for the remaining financial instruments. All methods of assessing fair value result in a general approximation of value, and such value may never actually be realized.
caSh equivalentSall highly liquid investments with maturities of three months or less at the date of purchase are considered to be cash equivalents.
marketable SecuritieSdebt securities included in current assets represent securities that are expected to be realized in cash within one year of the balance sheet date. Long-term debt securities that are not expected to be realized in cash within one year and alliance equity securities that are within the scope of SFAS No. 115, “Accounting for Certain Investments in Debt and Equity Securities,” are included in Investments and sundry assets. Those securities are considered available-for-sale and are reported at fair value with unrealized gains and losses, net of applicable taxes, recorded in Accumulated gains and ( losses) not affecting retained earnings within Stockholders’ equity. Realized gains and losses are calculated based on the specific identification method. Other-than-temporary declines in market value from origi-nal cost are charged to Other (income) and expense in the period in which the loss occurs. In determining whether an other-than-tempo-rary decline in the market value has occurred, the company considers the duration that, and extent to which, fair value of the investment is below its cost. Realized gains and losses also are included in Other (income) and expense in the Consolidated Statement of Earnings.
inventorieSraw materials, work in process and finished goods are stated at the lower of average cost or market. in accordance with SFaS no. 95, “Statement of Cash Flows,” cash flows related to the sale of the com-pany’s inventories are reflected in Net Cash Provided by Operating Activities from Continuing Operations in the Consolidated Statement of Cash Flows.
allowance For uncollectible receivableStradeAn allowance for uncollectible trade receivables is estimated based on a combination of write-off history, aging analysis and any specific, known troubled accounts.
FinancingFinancing receivables include sales-type leases, direct financing leases and loans. Below are the methodologies the company uses to calculate both its specific and its unallocated reserves, which are applied consis-tently to its different portfolios.
SPeciFic –The company reviews all financing account receivables considered at risk on a quarterly basis. The review primarily consists of an analysis based upon current information available about the cli-ent, such as financial statements, news reports and published credit ratings, as well as the current economic environment, collateral net of repossession cost and prior collection history. For loans that are col-lateral dependent, impairment is measured using the fair value of the collateral when foreclosure is probable. Using this information, the company determines the expected cash flow for the receivable and calculates a recommended estimate of the potential loss and the prob-ability of loss. For those accounts in which the loss is probable, the company records a specific reserve.
unallocated – The company records an unallocated reserve that is calculated by applying a reserve rate to its different portfolios, excluding accounts that have been specifically reserved. This reserve rate is based upon credit rating, probability of default, term, asset characteristics and loss history. Receivable losses are charged against the allowance when manage-ment believes the uncollectibility of the receivable is confirmed. Subsequent recoveries, if any, are credited to the allowance. Certain receivables for which the company recorded specific reserves may also be placed on non-accrual status. Non-accrual assets are those receivables (impaired loans or non-performing leases) with specific reserves and other accounts for which it is likely that the company will be unable to collect all amounts due according to original terms of the lease or loan agreement. Income recognition is discontinued on these receivables. Cash collections are first applied as a reduction to principal outstanding. Any cash received in excess of principal payments outstanding is recognized as interest income. Receivables may be removed from non-accrual status, if appropriate, based upon changes in client circumstances.
noteS to conSolidated Financial StatementSinternational buSineSS machineS corPoration and SubSidiary comPanieS
70 2006 Annual Report
consolidated Statements ......................................................... 56
notes ..................................................................................... 62
A-G.......................................................................................... 62
. A..Significant.Accounting.Policies........................................ 62
. B..Accounting.Changes........................................................ 71
. C..Acquisitions/Divestitures.................................................. 73
. D..Financial.Instruments.(excluding.derivatives)................. 78
. E..Inventories........................................................................ 79
. F..Financing.Receivables....................................................... 79
. G..Plant,.Rental.Machines.and.Other.Property.................... 79
H-M.......................................................................................... 80
N-S........................................................................................... 88
T-X........................................................................................... 96
Black
MAC
390 CG10

Black
MAC
390 CG10
eStimated reSidual valueS oF leaSe aSSetSthe recorded residual values of the company’s lease assets are estimated at the inception of the lease to be the expected fair value of the assets at the end of the lease term. The company periodi-cally reassesses the realizable value of its lease residual values. Any anticipated increases in specific future residual values are not recog-nized before realization through remarketing efforts. Anticipated decreases in specific future residual values that are considered to be other-than-temporary are recognized immediately upon identification and are recorded as an adjustment to the residual-value estimate. For sales-type and direct financing leases, this reduction lowers the recorded net investment and is recognized as a loss charged to finance income in the period in which the estimate is changed, as well as an adjust-ment to unearned income to reduce future-period finance income.
common Stockcommon stock refers to the $.20 par value capital stock as desig-nated in the company’s certificate of incorporation. Treasury stock is accounted for using the cost method. When treasury stock is reissued, the value is computed and recorded using a weighted-average basis.
earningS Per Share oF common Stockearnings per share of common stock—basic is computed by divid-ing net income by the weighted-average number of common shares outstanding for the period. Earnings per share of common stock—assuming dilution, reflects the maximum potential dilution that could occur if securities or other contracts to issue common stock were exercised or converted into common stock and would then share in the net income of the company. See note S, “Earnings Per Share of Common Stock,” on page 95 for additional information.
b. accounting changeS
new StandardS to be imPlementedin September 2006, the FaSb finalized SFaS no. 157, “Fair value measurements,” which will become effective in 2008. This Statement defines fair value, establishes a framework for measuring fair value, and expands disclosures about fair value measurements; however, it does not require any new fair value measurements. The provisions of SFAS No. 157 will be applied prospectively to fair value measure-ments and disclosures beginning in the first quarter of 2008 and is not expected to have a material effect on the company’s Consolidated Financial Statements. In June 2006, the FASB released FASB Interpretation No. 48, “Accounting for Uncertainty in Income Taxes—an interpretation of FASB Statement No. 109” (FIN 48). FIN 48 clarifies the accounting and reporting for uncertainties in income tax law. This Interpretation prescribes a comprehensive model for the financial statement recog-nition, measurement, presentation and disclosure of uncertain tax positions taken or expected to be taken in income tax returns. The company has substantially completed the process of evaluating the
effect of FIN 48 on its Consolidated Financial Statements as of the beginning of the period of adoption, January 1, 2007. The company estimates that the cumulative effects of applying this Interpretation will be recorded as a $0.1 billion increase to beginning Retained earn-ings. In addition, in accordance with the provisions of FIN 48, the company will reclassify an estimated $2.0 billion of unrecognized tax benefits from current to non-current liabilities because payment of cash is not anticipated within one year of the balance sheet date. In March 2006, the FASB issued SFAS No. 156, “Accounting for Servicing of Financial Assets—an amendment of FASB Statement No. 140,” that provides guidance on accounting for separately recognized servicing assets and servicing liabilities. In accordance with the provi-sions of SFAS No. 156, separately recognized servicing assets and servicing liabilities must be initially measured at fair value, if practi-cable. Subsequent to initial recognition, the company may use either the amortization method or the fair-value measurement method to account for servicing assets and servicing liabilities within the scope of this Statement. The company will adopt SFAS No. 156 in fiscal year 2007. The adoption of this Statement is not expected to have a material effect on the company’s Consolidated Financial Statements. In February 2006, the FASB issued SFAS No. 155, “Accounting for Certain Hybrid Financial Instruments—an amendment of FASB Statements No. 133 and 140,” to permit fair value remeasurement for any hybrid financial instrument that contains an embedded derivative that otherwise would require bifurcation in accordance with the pro-visions of SFAS No. 133, “Accounting for Derivative Instruments and Hedging Activities.” The company will adopt SFAS No. 155 in fiscal year 2007. The adoption of this Statement is not expected to have a material effect on the company’s Consolidated Financial Statements.
StandardS imPlementedas discussed in note a, “Significant accounting Policies,” on pages 62 to 71, effective december 31, 2006, the company adopted SFaS No. 158, “Employer’s Accounting for Defined Benefit Pension and Other Postretirement Plans—an amendment of FASB Statements No. 87, 88, 106 and 132(R),” which requires the recognition of the funded status of the retirement-related benefit plans in the Consolidated Statement of Financial Position and the recognition of the changes in that funded status in the year in which the changes occur through Gains and ( losses) not affecting retained earnings, net of applicable tax effects. The provisions of SFAS No. 158 were adopted pursuant to the transition provisions therein. The company measures defined benefit plan assets and obligations as of December 31 and SFAS No. 158 did not affect the company’s existing valuation practices. The adoption of SFAS No. 158 had no impact on the company’s existing debt covenants, credit ratings or financial flexibility. See note V, “Retirement-Related Benefits,” on pages 100 to 111 for additional information, including the incremental effect of the adoption on the Consolidated Statement of Financial Position.
noteS to conSolidated Financial StatementSinternational buSineSS machineS corPoration and SubSidiary comPanieS
71
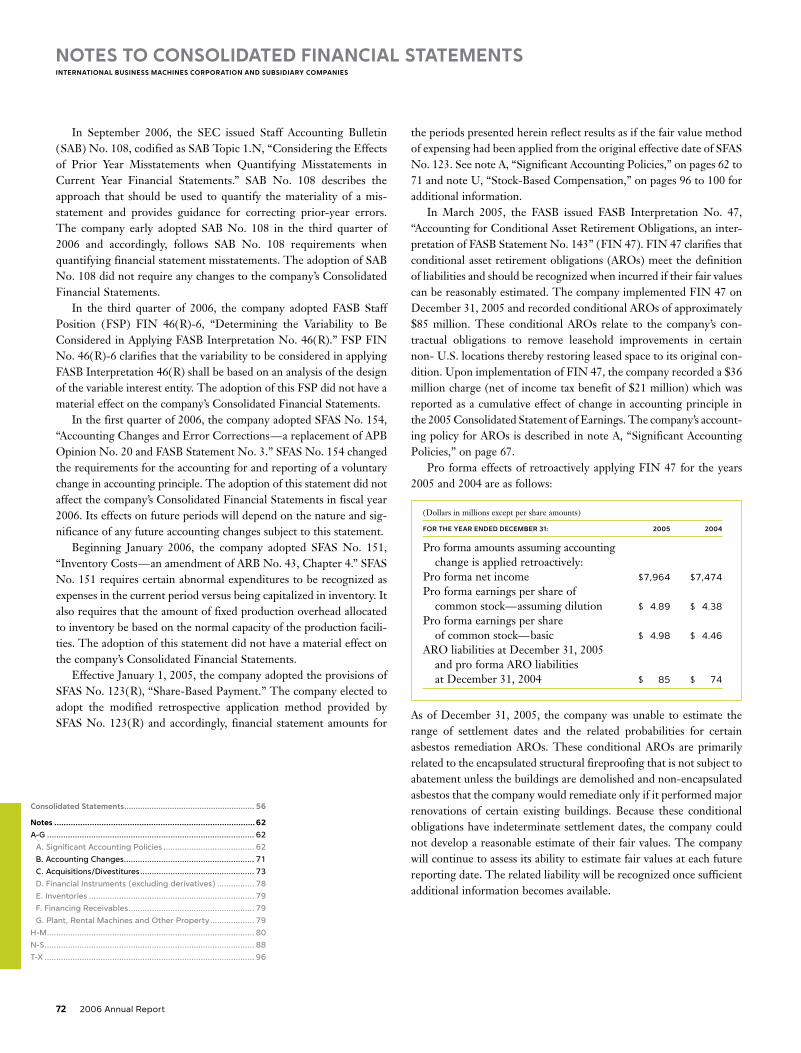
In September 2006, the SEC issued Staff Accounting Bulletin (SAB) No. 108, codified as SAB Topic 1.N, “Considering the Effects of Prior Year Misstatements when Quantifying Misstatements in Current Year Financial Statements.” SAB No. 108 describes the approach that should be used to quantify the materiality of a mis-statement and provides guidance for correcting prior-year errors. The company early adopted SAB No. 108 in the third quarter of 2006 and accordingly, follows SAB No. 108 requirements when quantifying financial statement misstatements. The adoption of SAB No. 108 did not require any changes to the company’s Consolidated Financial Statements. In the third quarter of 2006, the company adopted FASB Staff Position (FSP) FIN 46(R)-6, “Determining the Variability to Be Considered in Applying FASB Interpretation No. 46(R).” FSP FIN No. 46(R)-6 clarifies that the variability to be considered in applying FASB Interpretation 46(R) shall be based on an analysis of the design of the variable interest entity. The adoption of this FSP did not have a material effect on the company’s Consolidated Financial Statements. In the first quarter of 2006, the company adopted SFAS No. 154, “Accounting Changes and Error Corrections—a replacement of APB Opinion No. 20 and FASB Statement No. 3.” SFAS No. 154 changed the requirements for the accounting for and reporting of a voluntary change in accounting principle. The adoption of this statement did not affect the company’s Consolidated Financial Statements in fiscal year 2006. Its effects on future periods will depend on the nature and sig-nificance of any future accounting changes subject to this statement. Beginning January 2006, the company adopted SFAS No. 151, “Inventory Costs—an amendment of ARB No. 43, Chapter 4.” SFAS No. 151 requires certain abnormal expenditures to be recognized as expenses in the current period versus being capitalized in inventory. It also requires that the amount of fixed production overhead allocated to inventory be based on the normal capacity of the production facili-ties. The adoption of this statement did not have a material effect on the company’s Consolidated Financial Statements. Effective January 1, 2005, the company adopted the provisions of SFAS No. 123(R), “Share-Based Payment.” The company elected to adopt the modified retrospective application method provided by SFAS No. 123(R) and accordingly, financial statement amounts for
the periods presented herein reflect results as if the fair value method of expensing had been applied from the original effective date of SFAS No. 123. See note A, “Significant Accounting Policies,” on pages 62 to 71 and note U, “Stock-Based Compensation,” on pages 96 to 100 for additional information. In March 2005, the FASB issued FASB Interpretation No. 47, “Accounting for Conditional Asset Retirement Obligations, an inter-pretation of FASB Statement No. 143” (FIN 47). FIN 47 clarifies that conditional asset retirement obligations (AROs) meet the definition of liabilities and should be recognized when incurred if their fair values can be reasonably estimated. The company implemented FIN 47 on December 31, 2005 and recorded conditional AROs of approximately $85 million. These conditional AROs relate to the company’s con-tractual obligations to remove leasehold improvements in certain non- U.S. locations thereby restoring leased space to its original con-dition. Upon implementation of FIN 47, the company recorded a $36 million charge (net of income tax benefit of $21 million) which was reported as a cumulative effect of change in accounting principle in the 2005 Consolidated Statement of Earnings. The company’s account-ing policy for AROs is described in note A, “Significant Accounting Policies,” on page 67. Pro forma effects of retroactively applying FIN 47 for the years 2005 and 2004 are as follows:
(Dollars in millions except per share amounts)
foR thE yEaR EnDED DECEMBER 31: 2005 2004
Pro forma amounts assuming accounting change is applied retroactively:Pro forma net income $7,964 $7,474
Pro forma earnings per share of common stock—assuming dilution $ 4.89 $ 4.38
Pro forma earnings per share of common stock—basic $ 4.98 $ 4.46
ARO liabilities at December 31, 2005 and pro forma ARO liabilities at December 31, 2004 $ 85 $ 74
As of December 31, 2005, the company was unable to estimate the range of settlement dates and the related probabilities for certain asbestos remediation AROs. These conditional AROs are primarily related to the encapsulated structural fireproofing that is not subject to abatement unless the buildings are demolished and non-encapsulated asbestos that the company would remediate only if it performed major renovations of certain existing buildings. Because these conditional obligations have indeterminate settlement dates, the company could not develop a reasonable estimate of their fair values. The company will continue to assess its ability to estimate fair values at each future reporting date. The related liability will be recognized once sufficient additional information becomes available.
noteS to conSolidated Financial StatementSinternational buSineSS machineS corPoration and SubSidiary comPanieS
72 2006 Annual Report
consolidated Statements ......................................................... 56
notes ..................................................................................... 62
A-G.......................................................................................... 62
. A..Significant.Accounting.Policies........................................ 62
. B..Accounting.Changes........................................................ 71
. C..Acquisitions/Divestitures.................................................. 73
. D..Financial.Instruments.(excluding.derivatives)................. 78
. E..Inventories........................................................................ 79
. F..Financing.Receivables....................................................... 79
. G..Plant,.Rental.Machines.and.Other.Property.................... 79
H-M.......................................................................................... 80
N-S........................................................................................... 88
T-X........................................................................................... 96
Black
MAC
390 CG10

Black
MAC
390 CG10
In June 2005, the FASB issued FASB Staff Position (FSP) No. FAS 143-1, “Accounting for Electronic Equipment Waste Obligations,” (FSP FAS 143-1) that provides guidance on how commercial users and producers of electronic equipment should recognize and measure asset retirement obligations associated with the European Directive 2002/96/EC on Waste Electrical and Electronic Equipment (the “Directive”). In 2005, the company adopted FSP FAS 143-1 in those European Union (EU) member countries that transposed the Directive into country-specific laws. Its adoption did not have a mate-rial effect on the company’s Consolidated Financial Statements. The effect of applying FSP FAS 143-1 in the remaining countries in future periods is not expected to have a material effect on the company’s Consolidated Financial Statements. In the third quarter of 2005, the company adopted SFAS No. 153, “Exchanges of Nonmonetary Assets—an amendment of APB Opinion No. 29.” SFAS No. 153 requires that exchanges of productive assets be accounted for at fair value unless fair value cannot be reasonably determined or the transaction lacks commercial substance. The adop-tion of SFAS No. 153 did not have a material effect on the company’s Consolidated Financial Statements. The American Jobs Creation Act of 2004 (the “Act”) introduced a temporary incentive for the company to repatriate earnings accumu-lated outside the U.S. In the fourth quarter of 2004, the company adopted the provisions of FSP No. FAS 109-2, “Accounting and Disclosure Guidance for the Foreign Earnings Repatriation Provision within the American Jobs Creation Act of 2004.” According to FSP No. FAS 109-2, the company was allowed time beyond the financial reporting period of enactment to evaluate the effects of the Act on its plan for repatriation of foreign earnings for purposes of applying SFAS No. 109, “Accounting for Income Taxes.” Accordingly, as of December 31, 2004, the company did not adjust its income tax expense or deferred tax liability to reflect the possible effect of the new repatriation provision. In 2005, the company repatriated $9.5 billion of foreign earnings and recorded income tax expense of $525 million associated with this repatriation. In January 2003, the FASB issued FASB Interpretation No. 46 (FIN 46), “Consolidation of Variable Interest Entities,” and amended it by issuing FIN 46(R) in December 2003. FIN 46(R) addresses consolidation by business enterprises of variable interest entities (VIEs) that either: (1) do not have sufficient equity investment at risk to permit the entity to finance its activities without additional subor-dinated financial support or (2) have equity investors that lack an essential characteristic of a controlling financial interest. In accor-dance with the transition provisions of FIN 46(R), the company adopted FIN 46(R) for all VIEs and special-purpose entities as defined within FIN 46(R) as of March 31, 2004. These accounting pronouncements did not have a material effect on the company’s Consolidated Financial Statements.
c. acquiSitionS/diveStitureS
acquiSitionS2006In 2006, the company completed 13 acquisitions at an aggregate cost of $4,817 million, which was paid in cash. The cost of these acquisi-tions is reported in the Consolidated Statement of Cash Flows net of acquired cash and cash equivalents. The tables on page 74 and 75 represent the purchase price allocations for all of the 2006 acquisitions. The Micromuse Inc., FileNet Corporation, Internet Security Systems, Inc. and MRO Software, Inc. acquisitions are shown separately given their significant purchase prices.
micromuSe, inc.– On February 15, 2006, the company acquired 100 percent of the outstanding common shares of Micromuse, Inc. for cash consideration of $862 million. Micromuse is a leading provider of network management software used by banks, telecommunications carriers, governments, retailers and other organizations to monitor and manage their sophisticated technology infrastructures. The soft-ware helps customers manage increasingly complex IT systems that support the proliferation of voice, data and video traffic due to the growing adoption of voice over IP (VoIP)-based audio and video services delivered over the internet. The combination of Micromuse’s software and the company’s IT services management technology can provide a comprehensive approach to help customers reduce the com-plexity of their IT environments, lower operational costs and address compliance mandates. Micromuse was integrated into the Software segment upon acquisition and Goodwill, as reflected in the table on page 74, has been entirely assigned to the Software segment. The overall weighted-average useful life of the intangible assets purchased, excluding Goodwill, is 4.0 years. In the fourth quarter, as a result of completing the integration of Micromuse’s legal and intercompany structure into the company’s legal structure, the company recorded an increase in current assets and current liabilities with a corresponding offset in Goodwill totaling $137 million. These increases relate to an increase in both deferred tax assets and current tax liabilities. These adjustments are reflected in the table on page 74.
Filenet corPoration – On October 12, 2006, the company acquired 100 percent of the outstanding common shares of FileNet Corporation for cash consideration of $1,609 million. FileNet is a leading provider of business process and content management solu-tions that help companies simplify critical and everyday decision making processes and give organizations a competitive advantage. The FileNet acquisition enhances the company’s ability to meet increasing client demand for a combination of content- and process-centric busi-ness process management capabilities, which is driven by changing governance and compliance mandates, as well as the need to integrate content-centric business processes with enterprise applications. The company has integrated its business process management and service oriented architecture (SOA) technologies with the FileNet platform to allow customers to access content wherever it may reside and use it in
noteS to conSolidated Financial StatementSinternational buSineSS machineS corPoration and SubSidiary comPanieS
73

(Dollars in millions)
MiCRoMusE, inC.
oRiginal aMount DisClosED in aMoRtization fiRst PuRChasE total filEnEt2006 aCquisitions lifE (in yEaRs) qtR. 2006 aDjustMEnts* alloCation CoRPoRation
Current assets $ 201 $ 56 $ 257 $ 681
Fixed assets/non-current 8 — 8 69
Intangible assets: Goodwill N/A 694 137 831 894
Completed technology 3 to 5 46 — 46 73
Client relationships 3 to 7 46 — 46 194
Other identifiable intangible assets 2 to 4 4 — 4 55
In-process R&D 1 — 1 3
Total assets acquired 1,000 193 1,193 1,969
Current liabilities (89) (193) (282) (252)
Non-current liabilities (49) — (49) (108)
Total liabilities assumed (138) (193) (331) (360)
Total purchase price $ 862 $ — $ 862 $1,609
* Adjustmentsprimarilyrelatetoacquisitioncosts,deferredtaxesandotheraccruals.
N/A—Notapplicable
the context of business processes. FileNet was integrated into the Software segment upon acquisition and Goodwill, as reflected in the table below, has been entirely assigned to the Software segment. The overall weighted-average useful life of the intangible assets purchased, excluding Goodwill, is 5.9 years.
internet Security SyStemS, inc.– On October 20, 2006, the company acquired 100 percent of the outstanding common shares of Internet Security Systems, Inc. (ISS) for cash consideration of $1,368 million. ISS provides security solutions to thousands of the world’s lead-ing companies and governments, helping to proactively protect against Internet threats across networks, desktops and servers. ISS software, appliances and services monitor and manage network vulnerabilities and rapidly respond in advance of potential threats. The acquisition advances the company’s strategy to utilize IT services, software and consulting expertise to automate labor-based processes into standard-ized, software-based services that can help clients optimize and transform their businesses. ISS was integrated into the Global Technology Services segment upon acquisition and Goodwill, as reflected in the table on page 75, has been entirely assigned to the Global Technology Services segment. The overall weighted-average useful life of the intangible assets purchased, excluding Goodwill, is 5.6 years.
mro SoFtware inc.– On October 5, 2006, the company acquired 100 percent of the outstanding common shares of MRO Software, Inc. for cash consideration of $739 million. MRO’s asset and service manage-ment software and consulting services are used by many of the world’s top companies to effectively manage how they buy, maintain and retire assets—such as production equipment, facilities, transportation and information technology hardware and software—in a wide variety of
industries including utilities, manufacturing, energy, pharmaceutical and telecommunications. The acquisition builds upon the company’s strategy to leverage business consulting, IT services, and software to develop repeatable tools that help clients optimize and transform their business. MRO was integrated into the Software, Global Technology Services and Global Business Services segments upon acquisition and Goodwill, as reflected in the table on page 75, has been assigned to the Software segment for $337 million, Global Technology Services segment for $49 million and Global Business Services segment for $122 million. The overall weighted-average useful life of the intangible assets purchased, excluding Goodwill, is 5.6 years.
other acquiSitionS – The company acquired nine additional companies that are presented as Other Acquisitions in the table on page 75. Three of the acquisitions were Global Services-related com-panies: two were integrated into the Global Technology Services segment: Viacore, Inc. and Palisades Technology Partners, LLP; the third, Valchemy, Inc., was integrated into the Global Business Services segment. Six of the acquisitions were software-related companies that were integrated into the Software segment: Cims Lab; Language Analysis Systems, (LAS) Inc.; Buildforge; Unicorn Solutions, Inc.; Rembo Technology; and Webify Solutions. The purchase price allo-cations resulted in aggregate Goodwill of $211 million, of which $161 million was assigned to the Software segment and $51 million was assigned to the Global Technology Services segment. The overall weighted-average useful life of the intangible assets purchased in these acquisitions, excluding Goodwill, is 3.4 years. See note A, “Significant Accounting Policies,” on page 66 for further description of the company’s accounting policies related to business combinations and intangible assets, including Goodwill.
noteS to conSolidated Financial StatementSinternational buSineSS machineS corPoration and SubSidiary comPanieS
74 2006 Annual Report
Black
MAC
390 CG10

Black
MAC
390 CG10
(Dollars in millions)
intERnEt MRo aMoRtization sECuRity softwaRE, othER 2006 aCquisitions lifE (in yEaRs) systEMs, inC. inC. aCquisitions
Current assets $ 309 $ 227 $ 28
Fixed assets/non-current 62 20 4
Intangible assets: Goodwill N/A 967 508 211
Completed technology 3 to 5 135 71 8
Client relationships 3 to 7 60 42 22
Other identifiable intangible assets 2 to 4 21 4 4
In-process R&D 3 — —
Total assets acquired 1,557 872 277
Current liabilities (92) (69) (24)
Non-current liabilities (97) (64) (13)
Total liabilities assumed (189) (133) (37)
Total purchase price $1,368 $ 739 $240
N/A—Notapplicable
noteS to conSolidated Financial StatementSinternational buSineSS machineS corPoration and SubSidiary comPanieS
75
2005In 2005, the company completed 16 acquisitions at an aggregate cost of $2,022 million, which was paid in cash. The cost of these acquisi-tions are reported in the Consolidated Statement of Cash Flows net of acquired cash and cash equivalents. The table on page 76 represents the purchase price allocations for all of the 2005 acquisitions. The Ascential Corporation (Ascential) acquisition is shown separately given its significant purchase price.
aScential – On April 29, 2005, the company acquired 100 percent of the outstanding common shares of Ascential for cash consideration of $1,140 million. Ascential is a provider of enterprise data integration software used to help build enterprise data warehouses, power busi-ness intelligence systems, consolidate enterprise applications, create and manage master repositories of critical business information and enable on demand data access. Ascential complements and strength-ens the company’s information and integration offerings and further extends the company’s ability to enable clients to become on demand businesses by providing a single, agile infrastructure for delivering accurate, consistent, timely and coherent information. Ascential was integrated into the Software segment upon acquisition and Goodwill, as reflected in the table on page 76, has been entirely assigned to the Software segment. The overall weighted-average useful life of the intangible assets purchased, excluding Goodwill, is 3.9 years.
other acquiSitionS – The company acquired 15 additional companies that are presented as Other Acquisitions in the table on page 76. Four of the acquisitions were technology services-related companies that were integrated into the Global Technology Services segment: Network Solutions; Classic Blue; Corio; and Equitant. One of the acquisitions, HealthLink, was integrated into the Global Business Services segment. Nine of the acquisitions were software-related companies that were integrated into the Software segment: iPhrase; Data Power Technology, Inc.; Bowstreet; Collation Inc.; DWL; Isogon Corporation; PureEdge Solutions, Inc.; SRD; and Gluecode. One acquisition, Meiosys, was integrated into the Systems and Technology Group segment. The purchase price allocations resulted in aggregate Goodwill of $791 million, of which $456 million was assigned to the Software segment; $239 million was assigned to the Global Technology Services segment; $62 million was assigned to the Global Business Services segment; and $34 million was assigned to the Systems and Technology Group segment. The overall weighted-average useful life of the intangible assets purchased, excluding Goodwill, is 3.1 years.

(Dollars in millions)
asCEntial
oRiginal aMount DisClosED in aMoRtization sEConD PuRChasE total othER2005 aCquisitions lifE (in yEaRs) qtR. 2005 aDjustMEnts* alloCation aCquisitions
Current assets $ 526 $(1) $ 525 $ 137
Fixed assets/non-current 20 — 20 28
Intangible assets: Goodwill N/A 639 1 640 791
Completed technology 3 56 — 56 35
Client relationships 5 46 — 46 22
Other identifiable intangible assets 1–5 — — — 5
In-process R&D — — — 1
Total assets acquired 1,287 — 1,287 1,019
Current liabilities (112) (4) (116) (89)
Non-current liabilities (35) 4 (31) (48)
Total liabilities assumed (147) — (147) (137)
Total purchase price $1,140 $ — $1,140 $ 882
* Adjustmentsprimarilyrelatetoacquisitioncosts,deferredtaxesandotheraccruals.
N/A—Notapplicable
noteS to conSolidated Financial StatementSinternational buSineSS machineS corPoration and SubSidiary comPanieS
76 2006 Annual Report
2004In 2004, the company completed 14 acquisitions at an aggregate cost of $2,111 million. The cost of these acquisitions are reported in the Consolidated Statement of Cash Flows net of acquired cash and cash equivalents. The table on page 77 represents the purchase price allo-cations for all 2004 acquisitions. The Candle Corporation (Candle) and Maersk Data/DMdata acquisitions are shown separately given the significant purchase price for each acquisition.
candle – On June 7, 2004, the company acquired 100 percent of the outstanding common shares of Candle for cash consideration of $431 million. Candle provides services to develop, deploy and manage enterprise infrastructure. The acquisition allows the company to pro-vide its clients with an enhanced set of software solutions for managing an on demand environment and complements the company’s existing middleware solutions. Candle was integrated into the Software seg-ment upon acquisition and Goodwill, as reflected in the table on page 77, has been entirely assigned to the Software segment. The overall weighted-average useful life of the intangible assets acquired, excluding Goodwill, is 5.9 years.
maerSk data/dmdata – On December 1, 2004, the company purchased 100 percent of the outstanding common stock of Maersk Data and 45 percent of the outstanding common stock of DMdata for $792 million. Maersk Data owned the remaining 55 percent of DMdata’s outstanding common stock. Maersk Data and DMdata are located in Denmark. Maersk Data is a provider of IT solutions and offers consultancy, application development, and operations and sup-port to companies and organizations. DMdata is a provider of IT operations and its core business areas include the operation of cen-tralized and decentralized IT systems, network establishment and operation, as well as print and security solutions for clients in a number of different industries. These acquisitions significantly increased the company’s capabilities in serving clients in the transportation and logistics industry globally, while also enhancing its capabilities in areas such as financial services, public sector, healthcare and the food and agriculture industries. Maersk Data and DM Data were integrated into the Global Technology Services and the Global Business Services segments and Goodwill, as reflected in the table on page 77, has been assigned to Global Technology Services segment for $269 million and to Global Business Services segment for $157 million. The overall weighted-average useful life of the intangible assets acquired, excluding Goodwill, is 4.7 years.
other acquiSitionS –The company acquired 12 additional com-panies that are presented as Other Acquisitions in the table on page 77. Seven of the acquisitions were for technology services-related companies, which were integrated into the Global Technology Services segment and five were for software companies, which were integrated into the Software segment. The purchase price allocations resulted in aggregate Goodwill of $711 million, of which $329 million was assigned to the Software segment and $382 million was assigned to the Global Technology Services segment. The overall weighted-average useful life of the intangible assets purchased, excluding Goodwill, is 4.8 years.
consolidated Statements ......................................................... 56
notes ..................................................................................... 62
A-G.......................................................................................... 62
. A..Significant.Accounting.Policies........................................ 62
. B..Accounting.Changes........................................................ 71
. C..Acquisitions/Divestitures.................................................. 73
. D..Financial.Instruments.(excluding.derivatives)................. 78
. E..Inventories........................................................................ 79
. F..Financing.Receivables....................................................... 79
. G..Plant,.Rental.Machines.and.Other.Property.................... 79
H-M.......................................................................................... 80
N-S........................................................................................... 88
T-X........................................................................................... 96
Black
MAC
390 CG10
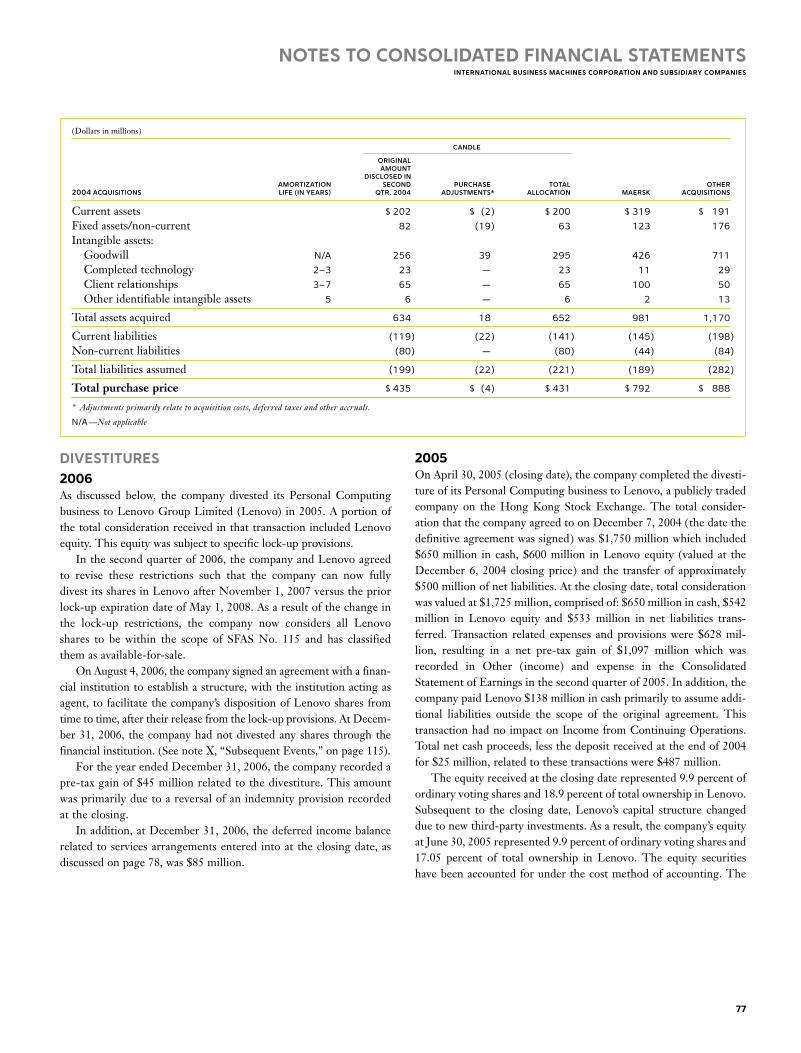
Black
MAC
390 CG10
(Dollars in millions)
CanDlE
oRiginal aMount DisClosED in aMoRtization sEConD PuRChasE total othER2004 aCquisitions lifE (in yEaRs) qtR. 2004 aDjustMEnts* alloCation MaERsk aCquisitions
Current assets $ 202 $ (2) $ 200 $ 319 $ 191
Fixed assets/non-current 82 (19) 63 123 176
Intangible assets: Goodwill N/A 256 39 295 426 711
Completed technology 2–3 23 — 23 11 29
Client relationships 3–7 65 — 65 100 50
Other identifiable intangible assets 5 6 — 6 2 13
Total assets acquired 634 18 652 981 1,170
Current liabilities (119) (22) (141) (145) (198)
Non-current liabilities (80) — (80) (44) (84)
Total liabilities assumed (199) (22) (221) (189) (282)
Total purchase price $ 435 $ (4) $ 431 $ 792 $ 888
* Adjustmentsprimarilyrelatetoacquisitioncosts,deferredtaxesandotheraccruals.
N/A—Notapplicable
noteS to conSolidated Financial StatementSinternational buSineSS machineS corPoration and SubSidiary comPanieS
77
diveStitureS2006As discussed below, the company divested its Personal Computing business to Lenovo Group Limited (Lenovo) in 2005. A portion of the total consideration received in that transaction included Lenovo equity. This equity was subject to specific lock-up provisions. In the second quarter of 2006, the company and Lenovo agreed to revise these restrictions such that the company can now fully divest its shares in Lenovo after November 1, 2007 versus the prior lock-up expiration date of May 1, 2008. As a result of the change in the lock-up restrictions, the company now considers all Lenovo shares to be within the scope of SFAS No. 115 and has classified them as available-for-sale. On August 4, 2006, the company signed an agreement with a finan-cial institution to establish a structure, with the institution acting as agent, to facilitate the company’s disposition of Lenovo shares from time to time, after their release from the lock-up provisions. At Decem-ber 31, 2006, the company had not divested any shares through the financial institution. (See note X, “Subsequent Events,” on page 115). For the year ended December 31, 2006, the company recorded a pre-tax gain of $45 million related to the divestiture. This amount was primarily due to a reversal of an indemnity provision recorded at the closing. In addition, at December 31, 2006, the deferred income balance related to services arrangements entered into at the closing date, as discussed on page 78, was $85 million.
2005On April 30, 2005 (closing date), the company completed the divesti-ture of its Personal Computing business to Lenovo, a publicly traded company on the Hong Kong Stock Exchange. The total consider-ation that the company agreed to on December 7, 2004 (the date the definitive agreement was signed) was $1,750 million which included $650 million in cash, $600 million in Lenovo equity (valued at the December 6, 2004 closing price) and the transfer of approximately $500 million of net liabilities. At the closing date, total consideration was valued at $1,725 million, comprised of: $650 million in cash, $542 million in Lenovo equity and $533 million in net liabilities trans-ferred. Transaction related expenses and provisions were $628 mil-lion, resulting in a net pre-tax gain of $1,097 million which was recorded in Other (income) and expense in the Consolidated Statement of Earnings in the second quarter of 2005. In addition, the company paid Lenovo $138 million in cash primarily to assume addi-tional liabilities outside the scope of the original agreement. This transaction had no impact on Income from Continuing Operations. Total net cash proceeds, less the deposit received at the end of 2004 for $25 million, related to these transactions were $487 million. The equity received at the closing date represented 9.9 percent of ordinary voting shares and 18.9 percent of total ownership in Lenovo. Subsequent to the closing date, Lenovo’s capital structure changed due to new third-party investments. As a result, the company’s equity at June 30, 2005 represented 9.9 percent of ordinary voting shares and 17.05 percent of total ownership in Lenovo. The equity securities have been accounted for under the cost method of accounting. The

resulted in the receipt of $152 million of cash and a pre-tax gain of $17 million. As a result of this transaction, the company’s equity in Lenovo at September 30, 2005 represented 9.9 percent of ordinary voting shares and 14.88 percent of total ownership. Also, in the second half of the year, the company received an addi-tional $23 million of cash from Lenovo related to working capital adjustments, net of expenses related to employee matters. These transactions were consistent with the company’s previous estimates. Overall, including the gain on the equity sale recorded in the third quarter, the company recorded an additional net pre-tax gain of $11 million; the resulting net pre-tax gain for the year ending December 31, 2005 is $1,108 million. In addition, at December 31, 2005, the deferred income balance re- lated to the services arrangements discussed previously is $169 million.
d. Financial inStrumentS (excluding derivativeS)
Fair value oF Financial inStrumentScash and cash equivalents, marketable securities and derivative financial instruments are recognized and measured at fair value in the company’s financial statements. Notes and other accounts receiv-able and other investments are financial assets with carrying values that approximate fair value. Accounts payable, other accrued expenses and short-term debt are financial liabilities with carrying values that approximate fair value. The carrying amount of long-term debt is approximately $13.8 billion and $15.4 billion and the estimated fair value is $16.2 billion and $16.7 billion at December 31, 2006 and 2005, respectively. In the absence of quoted prices in active markets, considerable judgment is required in developing estimates of fair value. Estimates are not necessarily indicative of the amounts the company could real-ize in a current market transaction. The following methods and assumptions were used to estimate fair values:
loans and Financing receivablesEstimates of fair value are based on discounted future cash flows using current interest rates offered for similar loans to clients with similar credit ratings for the same remaining maturities.
restricted SecuritiesThe fair value of restricted securities was estimated based on a quoted price for an identical unrestricted security, adjusted to reflect the effect of the restriction.
long-term debtFor publicly-traded debt, estimates of fair value are based on market prices. For other debt, fair value is estimated based on rates cur-rently available to the company for debt with similar terms and remaining maturities.
noteS to conSolidated Financial StatementSinternational buSineSS machineS corPoration and SubSidiary comPanieS
78 2006 Annual Report
equity is subject to specific lock-up provisions that restrict the com-pany from divesting the securities. These restrictions apply to specific equity tranches and expire over a three-year period from the closing date. The Lenovo equity was valued at $542 million at the closing date and is recorded in Investments and sundry assets in the Consolidated Statement of Financial Position. In addition, the com-pany recorded an equity deferral of $112 million to reflect the value of the lock-up provisions. This deferral was recorded as a contra-investment in Investments and sundry assets. As part of the agreements with Lenovo, the company will provide certain services. These services include marketing support, informa-tion technology, human resources support and learning services. These service arrangements are primarily for periods of three years or less and can be terminated earlier by Lenovo. The company estimated the fair value of these service arrangements, and, as a result, has deferred $262 million of the transaction gain. This amount will be recorded as revenue, primarily in the company’s Global Services seg-ments, as services are provided to Lenovo. The deferred amount was recorded in deferred income in Other liabilities in the Consolidated Statement of Financial Position. The company also recorded direct and incremental expenses and related provisions of $254 million associated with the divestiture, consisting of $74 million for certain indemnities; $64 million for employee-related charges; $40 million in real estate and information technology costs; $20 million in transaction expenses; $22 million of goodwill; and $34 million in other expenses. The company, as part of the agreement, retained the right and will be given a preference to provide maintenance, warranty and financing services to Lenovo. The company retained the warranty liability for all Personal Computing business products sold prior to the closing date. Lenovo will have the right to use certain IBM trademarks under a Trademark License Agreement for a term of five years. In addition, the company entered into an arm’s-length supply agreement with Lenovo for a term of five years, designed to provide the company with computers for its internal use. In the third quarter of 2005, as a result of the third-party invest-ments described previously, Lenovo was required to repurchase the first equity tranche at a specified share price. The equity repurchase
consolidated Statements ......................................................... 56
notes ..................................................................................... 62
A-G.......................................................................................... 62
. A..Significant.Accounting.Policies........................................ 62
. B..Accounting.Changes........................................................ 71
. C..Acquisitions/Divestitures.................................................. 73
. D..Financial.Instruments.(excluding.derivatives)................. 78
. E..Inventories........................................................................ 79
. F..Financing.Receivables....................................................... 79
. G..Plant,.Rental.Machines.and.Other.Property.................... 79
H-M.......................................................................................... 80
N-S........................................................................................... 88
T-X........................................................................................... 96
Black
MAC
390 CG10

Black
MAC
390 CG10
marketable SecuritieS*the following table summarizes the company’s marketable secu-rities, all of which are considered available-for-sale, and alliance investments.
(Dollars in millions)
faiR ValuE
at DECEMBER 31: 2006 2005
Marketable securities—current:Auction rate securities and other obligations $2,634 $1,118
Marketable securities—non-current:**Time deposits and other obligations $ 359 $ 2
Non-U.S. government securities and other fixed-term obligations 2 13
Total $ 361 $ 15
Non-equity method alliance investments** $ 628 $ 558
* Grossunrealizedgains(beforetaxes)onmarketablesecuritieswere$19millionand$31millionatDecember31,2006and2005,respectively.Grossunrealizedgains(beforetaxes)onallianceinvestmentswere$178millionand$79millionatDecember31,2006and2005,respectively.Grossunrealizedlosses(beforetaxes)onmarketablesecuritiesandallianceinvestmentswereimmaterialtotheConsolidatedFinancialStatementsatDecember31,2006and2005.SeenoteN,“Stockholders’EquityActivity,”onpage88fornetchangeinunrealizedgainsandlossesonmarketablesecurities.
**IncludedwithinInvestmentsandsundryassetsintheConsolidatedStatementofFinancialPosition.SeenoteH,“InvestmentsandSundryAssets,”onpage80.
e. inventorieS(Dollars in millions)
at DECEMBER 31: 2006 2005
Finished goods $ 506 $ 902
Work in process and raw materials 2,304 1,939
Total $2,810 $2,841
F. Financing receivableS(Dollars in millions)
at DECEMBER 31: 2006 2005
Short-term:Net investment in sales-type leases $ 4,590 $ 4,435
Commercial financing receivables 5,814 5,053
Client loan receivables 4,196 3,752
Installment payment receivables 496 510
Total $15,095 $13,750
Long-term:Net investment in sales-type leases $ 5,471 $ 5,393
Commercial financing receivables 32 17
Client loan receivables 4,214 3,901
Installment payment receivables 351 317
Total $10,068 $ 9,628
Net investment in sales-type leases is for leases that relate princi-pally to the company’s equipment and are for terms ranging from two to seven years. Net investment in sales-type leases includes unguaran-teed residual values of $854 million and $792 million at December 31, 2006 and 2005, respectively, and is reflected net of unearned income of $1,005 million and $939 million and of allowance for uncollectible accounts of $135 million and $176 million at those dates, respectively. Scheduled maturities of minimum lease payments outstanding at December 31, 2006, expressed as a percentage of the total, are approximately: 2007, 44 percent; 2008, 28 percent; 2009, 17 percent; 2010, 7 percent; and 2011 and beyond, 4 percent. Commercial financing receivables arise primarily from inventory and accounts receivable financing for dealers and remarketers of IBM and non-IBM products. Payment terms for inventory and accounts receivable financing generally range from 30 to 90 days. Client loan receivables relate to loans that are provided by Global Financing primarily to the company’s clients to finance the purchase of the company’s software and services. Separate contractual relation-ships on these financing arrangements are for terms ranging from two to seven years. Each financing contract is priced independently at competitive market rates. The company has a history of enforcing the terms of these separate financing agreements. The company did not have financing receivables held for sale as of December 31, 2006 and 2005.
g. Plant, rental machineS and other ProPerty
(Dollars in millions)
at DECEMBER 31: 2006 2005
Land and land improvements $ 693 $ 684
Buildings and building improvements 8,243 8,312
Plant, laboratory and office equipment 23,907 21,760
32,843 30,756
Less: Accumulated depreciation 20,441 18,600
Plant and other property—net 12,401 12,156
Rental machines 3,678 3,505
Less: Accumulated depreciation 1,640 1,905
Rental machines—net 2,038 1,600
Total—net $14,440 $13,756
noteS to conSolidated Financial StatementSinternational buSineSS machineS corPoration and SubSidiary comPanieS
79

noteS to conSolidated Financial StatementSinternational buSineSS machineS corPoration and SubSidiary comPanieS
80 2006 Annual Report
h. inveStmentS and Sundry aSSetS(Dollars in millions)
at DECEMBER 31: 2006 2005*
Deferred taxes $3,880 $1,832
Deferred transition and set up costs and other deferred arrangements** 1,232 804
Alliance investments: Equity method 416 456
Non-equity method 628 558
Long-term deposits 228 200
Derivatives—non-current+ 213 160
Marketable securities 361 15
Other assets 1,423 949
Total $8,381 $4,974
* Reclassifiedtoconformwith2006presentation.
**DeferredtransitionandsetupcostsandotherdeferredarrangementsarerelatedtoGlobalServicesclientarrangements.AlsoseenoteA,“SignificantAccountingPolicies,”onpage65foradditionalinformation.
+ SeenoteL,“DerivativesandHedgingTransactions,”onpages83through86forthefairvalueofallderivativesreportedintheConsolidatedStatementofFinancialPosition.
i. intangible aSSetS including goodwillThe following table details the company’s intangible asset balances by major asset class:
(Dollars in millions)
AtDecember31,2006
Gross Net cArryiNG AccumulAteD cArryiNG intangiBlE assEt Class AmouNt AmortizAtioN AmouNt
Capitalized software $1,871 $ (837) $1,034
Client-related 1,038 (424) 614
Completed technology 500 (128) 372
Strategic alliances 104 (89) 15
Patents/trademarks 112 (29) 83
Other* 264 (179) 84
Total $3,888 $(1,686) $2,202
* Otherintangiblesareprimarilyacquiredproprietaryandnonproprietarybusinessprocesses,methodologiesandsystems,andimpactsfromcurrencytranslation.
(Dollars in millions)
at DECEMBER 31, 2005
gRoss nEt CaRRying aCCuMulatED CaRRying intangiBlE assEt Class aMount aMoRtization aMount
Capitalized software $1,805 $ (802) $1,003
Client-related 910 (490) 420
Completed technology 383 (270) 113
Strategic alliances 104 (68) 36
Patents/trademarks 32 (17) 15
Other* 218 (142) 76
Total $3,452 $(1,789) $1,663
* Otherintangiblesareprimarilyacquiredproprietaryandnonproprietarybusinessprocesses,methodologiesandsystems,andimpactsfromcurrencytranslation.
The company amortizes intangible assets over their estimated useful lives unless such lives are deemed indefinite. Amortizable intangible assets are tested for impairment based on undiscounted cash flows, and, if impaired, written down to fair value based on either discounted cash flows or appraised values. Intangible assets with indefinite lives are tested annually for impairment and written down to fair value as required. No impairment of intangible assets has been identified dur-ing any of the periods presented. The net carrying amount of intangible assets increased by $539 million for the year ended December 31, 2006, primarily due to acquired intangibles as a result of the company’s acquisitions. Total amortization was $1,076 million and $1,041 million for the years ended December 31, 2006 and 2005, respectively. The aggregate amortization expense for acquired intangibles (excluding capitalized software) was $316 million and $367 million for the years ended December 31, 2006 and 2005, respectively. In addition, in 2006 the company retired $1,186 million of fully amortized intangible assets, impacting both the gross carrying amount and accumulated amortiza-tion for this amount. The future amortization expense for each of the five succeeding years relating to all intangible assets that are currently recorded in the Consolidated Statement of Financial Position is estimated to be the following at December 31, 2006:
(Dollars in millions)
CaPitalizED aCquiRED softwaRE intangiBlEs total
2007 $658 $346 $1,005
2008 315 279 594
2009 61 222 283
2010 — 142 142
2011 — 98 98
consolidated Statements ......................................................... 56
notes ..................................................................................... 62
A-G.......................................................................................... 62
H-M.......................................................................................... 80
. H..Investments.and.Sundry.Assets....................................... 80
. I..Intangible.Assets.Including.Goodwill................................ 80
. J..Securitization.of.Receivables............................................ 81
. K..Borrowings........................................................................ 81
. L..Derivatives.and.Hedging.Transactions............................. 83
. M..Other.Liabilities................................................................ 87
N-S........................................................................................... 88
T-X........................................................................................... 96
Black
MAC
390 CG10

Black
MAC
390 CG10
Notes to CoNsolidated FiNaNCial statemeNtsiNterNatioNal busiNess maChiNes CorporatioN aNd subsidiary CompaNies
81
J. seCuritizatioN oF reCeivablesthe company periodically sells receivables through the securitiza-tion of trade receivables, loans and leases. The company retains servicing rights in the securitized receivables for which it receives a servicing fee. Any gain or loss incurred as a result of such sales is recognized in the period in which the sale occurs. On July 28, 2006, the company terminated its committed trade receivables securitization facility. This facility was established in 2004 and provided the company with securitization capability up to $0.5 billion. The facility was put in place to provide backup liquidity acces-sible on a three-day notice. During 2005, the company securitized $6.3 million of trade receivables and retained the servicing responsi-bilities for which it received a servicing fee. In 2005, both the pre-tax loss on the sale of receivables and the servicing fees received were insignificant. The facility was terminated in 2006 as the company determined that it had sufficient liquidity and alternative funding sources. No trade receivables were securitized in 2006 under this facility prior to the closure, nor did the company have any amounts outstanding under this facility at December 31, 2005. The company utilizes certain of its financing receivables as col-lateral for non-recourse borrowings. Financing receivables pledged as collateral for borrowings were $304 million and $318 million at December 31, 2006 and 2005, respectively. These borrowings are included in note K, “Borrowings,” on page 82.
K. borrowiNgs
short-term debt(Dollars in millions)
AT DECEMBER 31: 2006 2005
Commercial paper $3,779 $ 858
Short-term loans 2,355 3,370
Long-term debt—current maturities 2,768 2,988
Total $8,902 $7,216
The weighted-average interest rates for commercial paper at December 31, 2006 and 2005, were 5.3 percent and 4.3 percent, respectively. The weighted-average interest rates for short-term loans were 3.0 percent and 2.2 percent at December 31, 2006 and 2005, respectively.
goodwillThe changes in the carrying amount of goodwill, by reportable segment, for the year ended December 31, 2006, are as follows:
(Dollars in millions)
FoREign BAlAnCE PuRChAsE CuRREnCy BAlAnCE JAnuARy 1, gooDwill PRiCE TRAnslATion DECEMBER 31, sEgMEnT 2006 ADDiTions ADJusTMEnTs DivEsTiTuREs ADJusTMEnTs 2006
Global Business Services $3,588 $ 122 $ (16) $— $117 $ 3,811
Global Technology Services 1,530 1,067 (97) — 200 2,700
Systems and Technology Group 254 — (40) — — 214
Software 4,069 2,223 (171) — 7 6,129
Total $9,441 $3,412 $(323) $— $324 $12,854

Notes to CoNsolidated FiNaNCial statemeNtsiNterNatioNal busiNess maChiNes CorporatioN aNd subsidiary CompaNies
82 2006AnnualReport
loNg-term debtpre-swap borrowing(Dollars in millions)
AT DECEMBER 31: MATuRiTiEs 2006 2005
U.S. Dollars:Debentures:5.875% 2032 $ 600 $ 600
6.22% 2027 469 469
6.5% 2028 313 313
7.0% 2025 600 600
7.0% 2045 150 150
7.125% 2096 850 850
7.5% 2013 532 532
8.375% 2019 750 750
3.43% convertible note* 2007 188 238
Notes: 5.9% average 2007–2009 1,100 2,713
Medium-term note program: 4.7% average 2007–2014 5,361 5,620
Other: 3.8% average** 2007–2013 2,029 1,833
12,942 14,668
Other currencies (average interest rate at December 31, 2006, in parentheses):Euros (3.4%) 2007–2011 2,234 1,280
Japanese yen (1.8%) 2010–2014 796 1,450
Canadian dollars (6.3%) 2011–2013 6 5
Swiss francs (1.5%) 2008 410 378
Other (5.4%) 2007–2011 60 406
16,448 18,187
Less: Net unamortized discount 64 45
Add: SFAS No. 133 fair value adjustment+ 164 271
16,548 18,413
Less: Current maturities 2,768 2,988
Total $13,780 $15,425
* Aspartofthecompany’s2002acquisitionofPricewaterhouseCoopers’GlobalBusinessConsultingandTechnologyServicesUnit( PwCC),thecompanyissuedconvertiblenotesbearinginterestatastatedrateof3.43percentwithafacevalueofapproximately$328milliontocertainoftheacquiredPwCCpartners.Thenotesareconvertibleinto4,764,543sharesofIBMcommonstockattheoptionoftheholdersatanytimebasedonafixedconversionpriceof$68.81pershareofthecompany’scommonstock.AsofDecember31,2006,atotalof2,053,267shareshadbeenissuedunderthisprovision.
**Includes$304millionand$318millionofdebtcollateralizedbyfinancingreceivablesatDecember31,2006and2005,respectively.SeenoteJ,“SecuritizationofReceivables,”onpage81forfurtherdetails.
+ InaccordancewiththerequirementsofSFASNo.133,theportionofthecompany’sfixedratedebtobligationsthatishedgedisreflectedintheConsolidatedStatementofFinancialPositionasanamountequaltothesumofthedebt’scarryingvalueplusanSFASNo.133fairvalueadjustmentrepresentingchangesinthefairvalueofthehedgeddebtobligationsattributabletomovementsinbenchmarkinterestrates.
Consolidated statements ......................................................... 56
Notes ..................................................................................... 62
A-G.......................................................................................... 62
H-M.......................................................................................... 80
. H..Investments.and.Sundry.Assets....................................... 80
. I..Intangible.Assets.Including.Goodwill................................ 80
. J..Securitization.of.Receivables............................................ 81
. K..Borrowings........................................................................ 81
. L..Derivatives.and.Hedging.Transactions............................. 83
. M..Other.Liabilities................................................................ 87
N-S........................................................................................... 88
T-X........................................................................................... 96
Black
MAC
390 CG10

Black
MAC
390 CG10
post-swap borrowiNg (loNg-term debt, iNCludiNg CurreNt portioN)(Dollars in millions)
2006 2005
AT DECEMBER 31: Amount AverAgerAte AMounT AvERAgE RATE
Fixed-rate debt $ 8,758 5.25% $ 8,099 4.84%
Floating-rate debt* 7,790 6.30% 10,314 4.82%
Total $16,548 $18,413
* Includes$6,616millionin2006and$7,811millionin2005ofnotionallong-terminterestrateswapsthateffectivelyconvertthefixed-ratedebtintofloating-ratedebt.(SeenoteL,“DerivativesandHedgingTransactions,”onpages83through86).
Pre-swap annual contractual maturities of long-term debt outstanding at December 31, 2006, are as follows:
(Dollars in millions)
2007 $ 2,806
2008 1,559
2009 2,251
2010 2,881
2011 1,064
2012 and beyond 5,887
Total $16,448
iNterest oN debt(Dollars in millions)
FoR ThE yEAR EnDED DECEMBER 31: 2006 2005 2004
Cost of Global Financing $692 $525 $428
Interest expense 278 220 139
Interest capitalized 11 16 4
Totalinterestondebt $981 $761 $571
Refer to the related discussion on page 113 in note W, “Segment Information,” for total interest expense of the Global Financing seg-ment. See note L, “Derivatives and Hedging Transactions,” on pages 83 through 86 for a discussion of the use of currency and interest rate swaps in the company’s debt risk management program.
liNes oF Crediton June 28, 2006, the company entered into a new five-year $10 billion Credit agreement (the “Credit agreement”) with Jpmorgan Chase Bank, N.A., as Administrative Agent, and Citibank, N.A., as Syndication Agent replacing the company’s existing five-year $10 bil-lion Credit Agreement (the “Existing Agreement”) dated May 27, 2004. The Existing Agreement was not otherwise due to expire until May 27, 2009. The total expense recorded by the company related to these facilities was $7.4 million in 2006 and $8.9 million in both 2005 and 2004. The new Credit Agreement permits the company and its Subsidiary Borrowers to borrow up to $10 billion on a revolving basis. Borrowings of the Subsidiary Borrowers will be unconditionally backed by the company. The company may also, upon the agreement of either existing Lenders, or of the additional banks not currently party to the Credit Agreement, increase the commitments under the
Notes to CoNsolidated FiNaNCial statemeNtsiNterNatioNal busiNess maChiNes CorporatioN aNd subsidiary CompaNies
83
Credit Agreement up to an additional $2.0 billion. Subject to certain terms of the Credit Agreement, the company and Subsidiary Borrowers may borrow, prepay and reborrow amounts under the Credit Agreement at any time during the Credit Agreement. Interest rates on borrowings under the Credit Agreement will be based on prevailing market interest rates, as further described in the Credit Agreement. The Credit Agreement contains customary representations and war-ranties, covenants, events of default, and indemnification provisions. The company believes that circumstances that might give rise to breach of these covenants or an event of default, as specified in the Credit Agreement are remote. The company’s other lines of credit, most of which are uncommitted, totaled $9,429 million and $10,057 million at December 31, 2006 and 2005, respectively. Interest rates and other terms of borrowing under these lines of credit vary from country to country, depending on local market conditions.
(Dollars in millions)
AT DECEMBER 31: 2006 2005
Unused lines: From the committed global credit facility $ 9,875 $ 9,913
From other committed and uncommitted lines 7,215 6,781
Totalunusedlinesofcredit $17,090 $16,694
l. derivatives aNd hedgiNg traNsaCtioNsthe company operates in multiple functional currencies and is a significant lender and borrower in the global markets. In the normal course of business, the company is exposed to the impact of interest rate changes and foreign currency fluctuations, and to a lesser extent equity price changes and client credit risk. The company limits these risks by following established risk management policies and proce-dures, including the use of derivatives, and, where cost-effective, financing with debt in the currencies in which assets are denominated. For interest rate exposures, derivatives are used to align rate move-ments between the interest rates associated with the company’s lease and other financial assets and the interest rates associated with its financing debt. Derivatives are also used to manage the related cost of debt. For foreign currency exposures, derivatives are used to limit the effects of foreign exchange rate fluctuations on financial results.

As a result of the company’s use of derivative instruments, the company is exposed to the risk that counterparties to derivative con-tracts will fail to meet their contractual obligations. To mitigate the counterparty credit risk, the company has a policy of only entering into contracts with carefully selected major financial institutions based upon their credit ratings and other factors, and maintains strict dollar and term limits that correspond to the institution’s credit rating. The company’s established policies and procedures for mitigating credit risk on principal transactions include reviewing and establishing limits for credit exposure and continually assessing the creditworthi-ness of counterparties. Master agreements with counterparties include master netting arrangements as further mitigation of credit exposure to counterparties. These arrangements permit the company to net amounts due from the company to a counterparty with amounts due to the company from a counterparty reducing the maximum loss from credit risk in the event of counterparty default. In its hedging programs, the company uses forward contracts, futures contracts, interest-rate swaps, currency swaps and options depending upon the underlying exposure. The company does not use derivatives for trading or speculative purposes, nor is it a party to leveraged derivatives. A brief description of the major hedging programs follows.
debt risK maNagemeNtthe company issues debt in the global capital markets, principally to fund its financing lease and loan portfolio. Access to cost-effec-tive financing can result in interest rate and/or currency mismatches with the underlying assets. To manage these mismatches and to reduce overall interest cost, the company uses interest-rate swaps to convert specific fixed-rate debt issuances into variable-rate debt (i.e., fair value hedges) and to convert specific variable-rate debt issuances into fixed-rate debt (i.e., cash flow hedges). The resulting cost of funds is lower than that which would have been available if debt with matching characteristics was issued directly. At December 31, 2006, the weighted-average remaining maturity of all swaps in the debt risk management program was approximately three years, as compared to approximately four years at December 31, 2005.
Notes to CoNsolidated FiNaNCial statemeNtsiNterNatioNal busiNess maChiNes CorporatioN aNd subsidiary CompaNies
84 2006AnnualReport
loNg-term iNvestmeNts iN ForeigN subsidiaries (Net iNvestmeNt)a significant portion of the company’s foreign currency denomi-nated debt portfolio is designated as a hedge of net investment to reduce the volatility in stockholders’ equity caused by changes in for-eign currency exchange rates in the functional currency of major for-eign subsidiaries with respect to the U.S. dollar. The company also uses currency swaps and foreign exchange forward contracts for this risk management purpose. The currency effects of these hedges (approximately $350 million losses in 2006, $570 million gains in 2005 and $156 million losses in 2004, net of tax) were reflected in the Accumulated gains and ( losses) not affecting retained earnings section of the Consolidated Statement of Stockholders’ Equity, thereby offset-ting a portion of the translation adjustment of the applicable foreign subsidiaries’ net assets.
aNtiCipated royalties aNd Cost traNsaCtioNsthe company’s operations generate significant nonfunctional cur-rency, third-party vendor payments and intercompany payments for royalties and goods and services among the company’s non-U.S. subsidiaries and with the parent company. In anticipation of these foreign currency cash flows and in view of the volatility of the currency markets, the company selectively employs foreign exchange forward and option contracts to manage its currency risk. Currently, these cash flow hedges have maturities of one year or less, however, from time to time can extend beyond one year commensurate with the underlying hedged anticipated cash flows. At December 31, 2006, the weighted-average remaining maturity of these derivative instruments was 216 days, as compared to 240 days at December 31, 2005.
aNtiCipated Commodity purChase traNsaCtioNsin connection with the purchase of electricity for anticipated manufacturing requirements, the company selectively employs forward contracts to manage its price risk. Currently, these cash flow hedges have maturities of one year or less, however, from time to time could extend beyond one year commensurate with the underlying hedged anticipated cash flows. At December 31, 2006, the weighted-average remaining maturity of these derivative instruments was approximately seven months. This risk management program was implemented in 2006.Consolidated statements ......................................................... 56
Notes ..................................................................................... 62
A-G.......................................................................................... 62
H-M.......................................................................................... 80
. H..Investments.and.Sundry.Assets....................................... 80
. I..Intangible.Assets.Including.Goodwill................................ 80
. J..Securitization.of.Receivables............................................ 81
. K..Borrowings........................................................................ 81
. L..Derivatives.and.Hedging.Transactions............................. 83
. M..Other.Liabilities................................................................ 87
N-S........................................................................................... 88
T-X........................................................................................... 96
Black
MAC
390 CG10

Black
MAC
390 CG10
Notes to CoNsolidated FiNaNCial statemeNtsiNterNatioNal busiNess maChiNes CorporatioN aNd subsidiary CompaNies
85
subsidiary Cash aNd ForeigN CurreNCy asset/liability maNagemeNtthe company uses its global treasury Centers to manage the cash of its subsidiaries. These centers principally use currency swaps to convert cash flows in a cost-effective manner. In addition, the com-pany uses foreign exchange forward contracts to economically hedge, on a net basis, the foreign currency exposure of a portion of the company’s nonfunctional currency assets and liabilities. The terms of these forward and swap contracts are generally less than one year. The changes in the fair values of these contracts and of the underlying hedged exposures are generally offsetting and are recorded in Other (income) and expense in the Consolidated Statement of Earnings.
equity risK maNagemeNtthe company is exposed to equity price changes related to certain obligations to employees. These equity exposures are primarily related to market price movements in certain broad equity market indices and in the company’s common stock. Changes in the overall value of these employee compensation obligations are recorded in SG&A expense in the Consolidated Statement of Earnings. Although not designated as accounting hedges, the company utilizes equity derivatives, including equity swaps and futures, to economically hedge the exposures related to its employee compensation obligations. The derivatives are linked to the total return on certain broad equity market indices or the total return on the company’s common stock. They are recorded at fair value with gains or losses reported in SG&A expense in the Consolidated Statement of Earnings.
other derivativesthe company holds warrants in connection with certain invest-ments that are deemed derivatives because they contain net share or net cash settlement provisions. The company records the changes in the fair value of these warrants in Other (income) and expense in the Consolidated Statement of Earnings. The company is exposed to a potential loss if a client fails to pay amounts due under contractual terms (“credit risk”). In 2003, the company began utilizing credit default swaps to economically hedge certain credit exposures. These derivatives have terms of two years or less. The swaps are recorded at fair value with gains and losses reported in Other (income) and expense in the Consolidated State-ment of Earnings. To economically hedge its foreign exchange exposure not covered by any of the above programs, the company also uses certain forward and option contracts that are not designated in accounting hedging relationships. These derivatives are recorded at fair value with gains and losses reported in Other (income) and expense in the Consolidated Statement of Earnings. The following tables summarize the net fair value of the compa-ny’s derivative and other risk management instruments at December 31, 2006 and 2005 (included in the Consolidated Statement of Financial Position).
risK maNagemeNt program(Dollars in millions)
hEDgE DEsignATion
nET non-hEDgE/ AT DECEMBER 31, 2006 FAiR vAluE CAsh Flow invEsTMEnT oThER
Derivatives—net asset/(liability): Debt risk management $(139) $110 $ — $(96)
Long-term investments in foreign subsidiaries (“net investments”) — — (165) —
Anticipated royalties and cost transactions — (84) — —
Anticipated commodity purchase transactions — (2) — —
Subsidiary cash and foreign currency asset/liability management — — — (14)
Equity risk management — — — 40
Other derivatives — — — 10
Total derivatives (139)(a) 24(b) (165)(c) (60)(d)
Debt: Long-term investments in foreign subsidiaries (“net investments”) — — (2,529)(e) —
Total $(139) $ 24 $(2,694) $(60)
(a) Comprisesassetsof$1millionandliabilitiesof$140million.(b) Comprisesassetsof$293millionandliabilitiesof$269million.(c)Comprisesassetsof$42millionandliabilitiesof$207million.(d)Comprisesassetsof$74millionandliabilitiesof$134million.(e)Representsforeigncurrencydenominateddebtformallydesignatedasahedgeofnetinvestment.

(Dollars in millions)
hEDgE DEsignATion
nET non-hEDgE/ AT DECEMBER 31, 2005 FAiR vAluE CAsh Flow invEsTMEnT oThER
Derivatives—net asset/(liability): Debt risk management $(116) $(79) $ — $(109)
Long-term investments in foreign subsidiaries (“net investments”) — — 120 —
Anticipated royalties and cost transactions — 324 — —
Subsidiary cash and foreign currency asset/liability management — — — (4)
Equity risk management — — — 17
Other derivatives — — — 4
Total derivatives (116)(a) 245(b) 120(c) (92)(d)
Debt: Long-term investments in foreign subsidiaries (“net investments”) — — (2,027)(e) —
Total $(116) $245 $(1,907) $ (92)
(a) Comprisesassetsof$34millionandliabilitiesof$150million.(b)Comprisesassetsof$363millionandliabilitiesof$118million.(c) Comprisesassetsof$150millionandliabilitiesof$30million.(d)Comprisesassetsof$25millionandliabilitiesof$117million.(e)Representsforeigncurrencydenominateddebtformallydesignatedasahedgeofnetinvestment.
Notes to CoNsolidated FiNaNCial statemeNtsiNterNatioNal busiNess maChiNes CorporatioN aNd subsidiary CompaNies
86 2006AnnualReport
aCCumulated derivative gaiNs or lossesat december 31, 2006, in connection with its cash flow hedges of anticipated royalties, and cost and commodity purchase trans-actions, the company recorded losses of $49 million, net of tax, in Accumulated gains and ( losses) not affecting retained earnings. This amount is expected to be reclassified to net income within the next year, providing an offsetting economic impact against the underlying antici-pated transactions. At December 31, 2006, losses of approximately $55 million, net of tax, were recorded in Accumulated gains and ( losses) not affecting retained earnings in connection with cash flow hedges of the company’s borrowings. Of this amount $10 million is expected to be reclassified to net income within the next year providing an offset-ting economic impact against the underlying transactions. The following table summarizes activity in the Accumulated gains and ( losses) not affecting retained earnings section of the Consolidated Statement of Stockholders’ Equity related to all derivatives classified as cash flow hedges:
(Dollars in millions, net of tax)
DEBiT/(CREDiT)
December 31, 2003 $454
Net losses reclassified into earnings from equity during 2004 (463)
Changes in fair value of derivatives in 2004 662
December 31, 2004 653
Net losses reclassified into earnings from equity during 2005 (104)
Changes in fair value of derivatives in 2005 (787)
December 31, 2005 (238)
Net gains reclassified into earnings from equity during 2006 205
Changes in fair value of derivatives in 2006 138
December31,2006 $104
For the years ending December 31, 2006, 2005 and 2004, there were no significant gains or losses recognized in earnings representing hedge ineffectiveness or excluded from the assessment of hedge effec-tiveness (for fair value hedges and cash flow hedges), or associated with an underlying exposure that did not or was not expected to occur (for cash flow hedges); nor are there any anticipated in the normal course of business.
Consolidated statements ......................................................... 56
Notes ..................................................................................... 62
A-G.......................................................................................... 62
H-M.......................................................................................... 80
. H..Investments.and.Sundry.Assets....................................... 80
. I..Intangible.Assets.Including.Goodwill................................ 80
. J..Securitization.of.Receivables............................................ 81
. K..Borrowings........................................................................ 81
. L..Derivatives.and.Hedging.Transactions............................. 83
. M..Other.Liabilities................................................................ 87
N-S........................................................................................... 88
T-X........................................................................................... 96
Black
MAC
390 CG10

Black
MAC
390 CG10
Notes to CoNsolidated FiNaNCial statemeNtsiNterNatioNal busiNess maChiNes CorporatioN aNd subsidiary CompaNies
87
m. other liabilities(Dollars in millions)
AT DECEMBER 31: 2006 2005
Deferred income* $2,502 $2,437
Deferred taxes 665 1,616
Executive compensation accruals 942 1,023
Restructuring actions 640 733
Workforce reductions 435 434
Disability benefits 626 420
Derivatives liabilities 235 314
Non-current warranty accruals 176 255
Environmental accruals 221 226
Other 861 836
Total $7,304 $8,294
* Deferredincomeamountsareprimarilyrelatedtohardwareandsoftwarelong-termmaintenanceagreements.AlsoseenoteA,“SignificantAccountingPolicies,”onpages62to71foradditionalinformation.
In response to changing business needs, the company periodically takes workforce reduction actions to improve productivity, cost com-petitiveness and to rebalance skills. The non-current contractually obligated future payments associated with these activities are reflected in the Workforce reductions caption in the previous table. In addition, the company executed certain special actions as follows: (1) the second quarter of 2005 (discussed in note R, “2005 Actions,” on pages 93 and 94), (2) the second quarter of 2002 associated with the Microelectronics Division and rebalancing of both the company’s workforce and leased space resources, (3) the fourth quarter of 2002 associated with the acquisition of the PricewaterhouseCoopers consult-ing business, (4) the 2002 actions associated with the HDD business for reductions in workforce, manufacturing capacity and space, ( 5) the actions taken in 1999, and (6) the actions that took place prior to 1994. The following table provides a roll forward of the current and non-current liabilities associated with these special actions. The current liabilities presented in the table are included in Other accrued expenses and liabilities in the Consolidated Statement of Financial Position.
(Dollars in millions)
liABiliTy LiAbiLity As oF oThER Asof DEC. 31, 2005 PAyMEnTs ADJusTMEnTs* Dec.31,2006
Current: Workforce $461 $(366) $ 67 $163
Space 62 (91) 117 88
Other 6 — — 6
TotalCurrent $529 $(457) $184 $257
Non-current: Workforce $497 $ — $ 34 $531
Space 236 — (127) 109
TotalNon-current $733 $ — $(93) $640
* TheOtherAdjustmentscolumninthetableaboveprincipallyincludesthereclassificationofnon-currenttocurrentandforeigncurrencytranslationadjustments.Inaddition,duringtheyearendedDecember31,2006,netadjustmentswererecordedtodecreasepreviouslyrecordedliabilitiesforchangesintheestimatedcostofemployeeterminationsandvacantspaceforthe2002actions($25million),thesecond-quarter2005actions($35million),offsetbyincreasesfortheactionstakenpriorto1994($13million).Ofthe$47millionofnetreductionsrecordedduringtheyearendedDecember31,2006,$18million($7millionwhenoffsetby$11millioninaccretionexpense)wasincludedinSG&Aexpenseand$11million($7millionwhenoffsetby$4millioninaccretionexpense)wasrecordedinOther(income)andexpense.
The workforce accruals primarily relate to the company’s Global Services business. The remaining liability relates to terminated employ-ees who are no longer working for the company who were granted annual payments to supplement their incomes in certain countries. Depending on the individual country’s legal requirements, these required payments will continue until the former employee begins receiving pension benefits or dies. Included in the December 31, 2006 workforce accruals above is $46 million associated with the HDD divestiture discussed in note A, “Significant Accounting Policies,” on page 62. The space accruals are for ongoing obligations to pay rent for vacant space that could not be sublet or space that was sublet at rates lower than the committed lease arrangement. The length of these obligations varies by lease with the longest extending through 2016. Other accruals are primarily the remaining liabilities (other than workforce or space) associated with the HDD divestiture.
The company employs extensive internal environmental protection programs that primarily are preventive in nature. The company also participates in environmental assessments and cleanups at a number of locations, including operating facilities, previously owned facilities and Superfund sites. The company’s maximum exposure for all environmen-tal liabilities cannot be estimated and no amounts have been recorded for non-ARO environmental liabilities that are not probable or estima-ble. The total amounts accrued for non-ARO environmental liabilities, including amounts classified as current in the Consolidated Statement of Financial Position, that do not reflect actual or anticipated insurance recoveries, were $252 million and $254 million at December 31, 2006 and 2005, respectively. Estimated environmental costs are not expected to materially affect the consolidated financial position or consolidated results of the company’s operations in future periods. However, esti-mates of future costs are subject to change due to protracted cleanup periods and changing environmental remediation regulations.

N. stoCKholders’ equity aCtivitythe authorized capital stock of ibm consists of 4,687,500,000 shares of common stock, $.20 par value, of which 1,506,482,612 shares were outstanding at December 31, 2006 and 150,000,000 shares of preferred stock, $.01 par value, none of which were outstanding at December 31, 2006.
stoCK repurChasesFrom time to time, the board of directors authorizes the company to repurchase ibm common stock. The company repurchased 97,564,462 common shares at a cost of $8,022 million, 90,237,800 common shares at a cost of $7,671 million and 78,562,974 common shares at a cost of $7,275 million in 2006, 2005 and 2004, respectively. The company issued 3,489,803 treasury shares in 2006, 2,594,786
treasury shares in 2005 and 2,840,648 treasury shares in 2004, as a result of exercises of stock options by employees of certain recently acquired businesses and by non-U.S. employees. At December 31, 2006, $4,993 million of Board authorized repurchases was still available. The company plans to purchase shares on the open market or in pri-vate transactions from time to time, depending on market conditions. In connection with the issuance of stock as part of the company’s stock-based compensation plans, 633,769 common shares at a cost of $52 million, 606,697 common shares at a cost of $52 million and 422,338 common shares at a cost of $38 million in 2006, 2005 and 2004, respectively, were remitted by employees to the company in order to satisfy minimum statutory tax withholding requirements. Such amounts are included in the Treasury stock balance in the Consolidated Statement of Financial Position and the Consolidated Statement of Stockholders’ Equity.
Notes to CoNsolidated FiNaNCial statemeNtsiNterNatioNal busiNess maChiNes CorporatioN aNd subsidiary CompaNies
88 2006AnnualReport
aCCumulated gaiNs aNd (losses) Not aFFeCtiNg retaiNed earNiNgs (Net oF tax)(Dollars in millions)
RETiREMEnT-RElATED BEnEFiT PlAns*
nET PRioR sERviCE nET ACCuMulATED unREAlizED FoREign MiniMuM CosTs, nET gAins/ unREAlizED gAins/(lossEs) gAins/(lossEs) CuRREnCy PEnsion (lossEs) AnD gAins on noT AFFECTing on CAsh Flow TRAnslATion liABiliTy TRAnsiTion AssETs/ MARkETABlE RETAinED hEDgE DERivATivEs ADJusTMEnTs** ADJusTMEnTs* (oBligATions)* sECuRiTiEs EARnings
December 31, 2004 $(653) $3,061 $(4,519) $ — $50 $(2,061)
Change for period 891 (1,153) 290 — 17 45
December 31, 2005 238 1,908 (4,229) — 67 (2,016)
Change for period (342) 1,020 1,881 — 53 2,613
Adoption of SFAS No. 158 — — 2,348 (11,846) — (9,498)
December31,2006 $(104) $ 2,929 $ — $(11,846) $119 $(8,901)
* 2006activityrelatestoadoptionofSFASNo.158,seenoteV,“Retirement-RelatedBenefits,”onpages100to111foradditionalinformation.
**Foreigncurrencytranslationadjustmentsarepresentedgrosswithassociatedhedgesshownnetoftax.
Net ChaNge iN uNrealized gaiNs oN marKetable seCurities (Net oF tax)(Dollars in millions)
FoR ThE PERioD EnDED DECEMBER 31: 2006 2005
Net unrealized gains arising during the period $77 $64
Less: Net gains included in net income for the period 24* 47*
Netchangeinunrealizedgainsonmarketablesecurities $53 $17
* Includeswritedownsof$2.9millionand$0.6millionin2006and2005,respectively.
Consolidated statements ......................................................... 56
Notes ..................................................................................... 62
A-G.......................................................................................... 62
H-M.......................................................................................... 80
N-S........................................................................................... 88
. N..Stockholders’.Equity.Activity........................................... 88
. O..Contingencies.and.Commitments.................................... 89
. P..Taxes................................................................................. 92
. Q..Research,.Development.and.Engineering....................... 93
. R..2005.Actions..................................................................... 93
. S..Earnings.Per.Share.of.Common.Stock.............................. 95
T-X........................................................................................... 96
Black
MAC
390 CG10

Black
MAC
390 CG10
O. COntingenCies and COmmitments
COntingenCiesthe company is involved in a variety of claims, suits, investigations and proceedings that arise from time to time in the ordinary course of its business, including actions with respect to contracts, intellectual property, product liability, employment, benefits, securi-ties and environmental matters. These actions may be commenced by a number of different constituents, including competitors, partners, clients, current or former employees, government and regulatory agencies, stockholders and representatives of the locations in which the company does business. The following is a discussion of some of the more significant legal matters involving the company. Plaintiffs filed a class-action lawsuit against the company and its pension plan in 1999 in the U.S. District Court for the Southern District of Illinois, Cooper et al. v. The IBM Personal Pension Plan and IBM Corporation. The District Court held on July 31, 2003 that the company’s pension plan violated the age discrimination provisions of the Employee Retirement Income Security Act of 1974 (ERISA). IBM and plaintiffs subsequently entered into a settlement agreement that was approved by the District Court on August 16, 2005. The agreement provides for plaintiffs to receive incremental pension ben-efits and for the payment of costs and attorneys fees. This agreement, together with a previous settlement of a claim referred to as the partial plan termination claim, resulted in the company taking a one-time charge of $320 million in the third quarter of 2004. This agreement terminated the litigation on all claims except for two claims associated with IBM’s cash balance formula. The agree-ment permitted the company to appeal the District Court’s ruling in favor of plaintiffs on these two claims and stipulated that if the com-pany did not prevail on appeal of the two claims, the agreed remedy, including costs and attorneys fees, would be increased by up to $1.4 billion—$780 million for an age discrimination claim with respect to the company’s cash balance formula and $620 million for the claim with respect to the “always cash balance” method used to establish opening account balances during the 1999 pension plan conversion. On August 7, 2006, the Court of Appeals for the Seventh Circuit ruled in favor of IBM on both claims. The Court of Appeals found that neither IBM’s cash balance formula, nor the “always cash balance” method by which opening account balances were established during the 1999 conversion, violated ERISA’s age discrimination provision. On September 1, 2006, the Court of Appeals denied plaintiffs’ peti-tion for a rehearing or rehearing en banc. On January 16, 2007, the U.S. Supreme Court denied plaintiffs’ petition for certiorari. The decision by the U.S. Supreme Court ends the appeals process. The company is a defendant in an action filed on March 6, 2003 in state court in Salt Lake City, Utah by The SCO Group. The com-pany removed the case to Federal Court in Utah. Plaintiff is an alleged successor in interest to some of AT&T’s Unix IP rights, and alleges copyright infringement, unfair competition, interference with contract and breach of contract with regard to the company’s distri-bution of AIX and Dynix and contribution of code to Linux. The company has asserted counterclaims, including breach of contract, violation of the Lanham Act, unfair competition, intentional torts,
unfair and deceptive trade practices, breach of the General Public License that governs open source distributions, promissory estoppel and copyright infringement. In October 2005, the company withdrew its patent counterclaims in an effort to simplify and focus the issues in the case and to expedite their resolution. Each of the parties has filed motions for summary judgment; hearings on the motions are sched-uled for March 2007. A trial date has not been set. In May 2005, the Louisiana Supreme Court denied the company’s motion to review and reverse a Louisiana state court’s certification of a nationwide class in a case filed against the company in 1995. The class consists of certain former employees who left the company in 1992, and their spouses. They claim damages based on the company’s termination of an education assistance program. On April 4, 2006, the trial court denied the company’s motion for summary judgment. On October 27, 2006, the Louisiana Supreme Court denied IBM’s writ seeking an appeal of the trial court’s decision to deny summary judgment. At present, trial briefs are due in April 2007. No date has been set for trial. On June 2, 2003, the company announced that it received notice of a formal, nonpublic investigation by the Securities and Exchange Commission (SEC). The SEC sought information relating to revenue recognition in 2000 and 2001 primarily concerning certain types of client transactions. The company believes that the investigation arises from a separate investigation by the SEC of Dollar General Corporation, a client of the company’s Retail Stores Solutions unit, which markets and sells point-of-sale products. On January 8, 2004, the company announced that it received a “Wells Notice” from the staff of the SEC in connection with the staff’s investigation of Dollar General Corporation, which as noted above, is a client of the company’s Retail Stores Solutions unit. It is the company’s understanding that an employee in the company’s Sales & Distribution unit also received a Wells Notice from the SEC in connection with this matter. The Wells Notice notifies the company that the SEC staff is considering recommending that the SEC bring a civil action against the company for possible violations of the U.S. securities laws relating to Dollar General’s accounting for a specific transaction, by participating in and aiding and abetting Dollar General’s misstatement of its 2000 results. In that transaction, the company paid Dollar General $11 million for certain used equipment as part of a sale of IBM replacement equipment in Dollar General’s 2000 fourth fiscal quarter. Under the SEC’s procedures, the company responded to the SEC staff regarding whether any action should be brought against the company by the SEC. The separate SEC investi-gation noted above, relating to the recognition of revenue by the company in 2000 and 2001 primarily concerning certain types of client transactions, is not the subject of this Wells Notice. On June 27, 2005, the company announced that it had received a request to voluntarily comply with an informal investigation by the staff of the SEC concerning the company’s disclosures relating to the company’s first-quarter 2005 earnings and expensing of equity com-pensation. On January 12, 2006, the company announced that it received notice of a formal, nonpublic investigation by the SEC of this matter. The company has been cooperating with the SEC, and
nOtes tO COnsOlidated FinanCial statementsinternatiOnal business maChines COrpOratiOn and subsidiary COmpanies
89

will continue to do so. The SEC has informed the company that the investigation should not be construed as an indication that any viola-tions of law have occurred. In July 2005, two lawsuits were filed in the United States District Court for the Southern District of New York related to the company’s disclosures concerning first-quarter 2005 earnings and the expensing of equity compensation. One lawsuit named as defendants IBM and IBM’s Senior Vice President and Chief Financial Officer. The other lawsuit named as defendants IBM, IBM’s Senior Vice President and Chief Financial Officer and IBM’s Chairman and Chief Executive Officer. Both complaints alleged that defendants made certain misrep-resentations in violation of Section 10(b) and 20(a) of the Securities Exchange Act of 1934 and Rule 10b-5 promulgated thereunder. On September 6, 2005, counsel in one of these lawsuits filed a motion seeking to have the lawsuits consolidated, and for the appointment of lead plaintiff and lead counsel. Pursuant to an Order from the Court dated March 28, 2006, the two lawsuits were consolidated into a sin-gle action captioned “In re. International Business Machines Corp. Securities Litigation.” Pursuant to a schedule set by the Court, Plaintiffs served on the company an Amended Consolidated Complaint on May 19, 2006. IBM filed a Motion to Dismiss the Amended Consolidated Complaint on June 23, 2006. Plaintiffs filed their response to IBM’s Motion on July 21, 2006; and IBM filed its final brief in support of its Motion on August 2, 2006. On September 20, 2006, the Court denied IBM’s Motion to Dismiss. On January 16, 2007, Plaintiffs filed a motion for class certification. IBM filed its response on January 23, 2007 and the Plaintiffs’ reply is due to be filed in late February 2007. In January 2004, the Seoul District Prosecutors Office in South Korea announced it had brought criminal bid-rigging charges against several companies, including IBM Korea and LG IBM (a joint ven-ture between IBM Korea and LG Electronics, which has since been dissolved, effective January, 2005) and had also charged employees of some of those entities with, among other things, bribery of certain officials of government-controlled entities in Korea and bid rigging. IBM Korea and LG IBM cooperated fully with authorities in these matters. A number of individuals, including former IBM Korea and LG IBM employees, were subsequently found guilty and sentenced. IBM Korea and LG IBM were also required to pay fines. Debarment orders were imposed at different times, covering a period of no more than a year from the date of issuance, which barred IBM Korea from
doing business directly with certain government-controlled entities in Korea. All debarment orders have since expired and when they were in force did not prohibit IBM Korea from selling products and ser-vices to business partners who sold to government-controlled entities in Korea. In addition, the U.S. Department of Justice and the SEC have both contacted the company in connection with this matter. On January 24, 2006, a putative class action lawsuit was filed against IBM in federal court in San Francisco on behalf of technical support workers whose primary responsibilities are or were to install and maintain computer software and hardware. The complaint was subsequently amended on March 13, 2006. The First Amended Complaint, among other things, adds four additional named plaintiffs and modifies the definition of the workers purportedly included in the class. The suit, Rosenburg, et. al., v. IBM, alleges the company failed to pay overtime wages pursuant to the Fair Labor Standards Act and state law, and asserts violations of various state wage requirements, including recordkeeping and meal-break provisions. The suit also asserts certain violations of ERISA. Relief sought includes back wages, corresponding 401(k) and pension plan credits, interest and attorneys’ fees. On January 11, 2007, the District Court granted preliminary approval to a class-wide settlement whereby IBM will place into a fund $65 million, plus certain interest accruing between December 1, 2006 until such time as the fund is transferred to the claims adminis-trator, to pay claims asserted by class members, Plaintiffs’ attorneys’ fees and administrative costs. Individual payments will be based on factors, including the class member’s state of employment, time worked in the relevant job position and base salary. The District Court is scheduled to have a hearing to finally approve the settlement in July 2007. The charge associated with this settlement was consis-tent with a provision previously established by the company. On October 23, 2006, the company filed two lawsuits against Amazon.com, Inc. (Amazon), in the United States District Court for the Eastern District of Texas, one in the Lufkin Division and one in the Tyler Division. The Lufkin suit alleges that Amazon has unlaw-fully infringed three IBM patents. The Tyler suit alleges that Amazon has unlawfully infringed two IBM patents. The Lufkin Division patents cover methods for storing data, presenting applications and presenting advertising on a computer network. The Tyler Division patents cover an electronic catalog requisition system and related information retrieval and ordering methods and a computer-implemented hyper-text system and method for operating a computer-implemented object-oriented hypertext system. Each suit seeks, among other things, compensatory damages and injunctive relief. On December 14, 2006, Amazon answered, counterclaimed in each suit and sought to transfer the Lufkin suit to consolidate it with Tyler suit. IBM filed its opposition to the transfer motion on January 2, 2007 and answered the counterclaims in both suits on January 8. On January 16, 2007, the Lufkin court denied Amazon’s transfer motion. The courts have issued scheduling orders in both suits. The Lufkin action has been set for trial on April 14, 2008 and the Tyler action on October 13, 2008. On November 29, 2006, the company filed a lawsuit against Platform Solutions, Inc. (PSI) in the United States District Court for the Southern District of New York. IBM asserted claims for patent infringement and breach of contract in connection with PSI’s development and marketing
nOtes tO COnsOlidated FinanCial statementsinternatiOnal business maChines COrpOratiOn and subsidiary COmpanies
90 2006 Annual Report
Consolidated statements ......................................................... 56
notes ..................................................................................... 62
A-G.......................................................................................... 62
H-M.......................................................................................... 80
N-S........................................................................................... 88
. N..Stockholders’.Equity.Activity........................................... 88
. O..Contingencies.and.Commitments.................................... 89
. P..Taxes................................................................................. 92
. Q..Research,.Development.and.Engineering....................... 93
. R..2005.Actions..................................................................... 93
. S..Earnings.Per.Share.of.Common.Stock.............................. 95
T-X........................................................................................... 96
Black
MAC
390 CG10

Black
MAC
CG10
of a computer system that PSI says is compatible with IBM’s S/390 and System z architectures. IBM also sought a declaratory judgment that its refusal to license its patents to PSI and certain of its software for use on PSI systems does not violate the antitrust laws. IBM seeks damages and injunctive relief. On January 19, 2007, PSI answered the complaint and asserted counterclaims against IBM for alleged monopolization and attempted monopolization, tying, violations of New York and California statutes proscribing unfair competition, tortious interference with the acquisition of PSI by a third party and promissory estoppel. PSI also sought declaratory judgments of noninfringement of IBM’s patents and patent invalidity. The court has not yet set a trial date. In October 2003, a purported collective action lawsuit was filed against IBM in the United States District Court for the Northern District of California by ten former IBM employees alleging, on behalf of themselves and allegedly similarly situated former employees, that the company engaged in a pattern and practice of discriminating against employees on the basis of age when it terminated employees in connection with reductions in force. Initially, the District Court dismissed the lawsuit on the basis of release agreements signed by all the plaintiffs. On appeal, the Ninth Circuit reversed the trial court’s finding that the release barred these claims, and in January 2007 after denial of IBM’s petition for rehearing, the matter was returned to the trial court for further proceedings. The company is party to, or otherwise involved in, proceedings brought by U.S. federal or state environmental agencies under the Comprehensive Environmental Response, Compensation and Liability Act (CERCLA), known as “Superfund,” or laws similar to CERCLA. Such statutes require potentially responsible parties to participate in remediation activities regardless of fault or ownership of sites. The company is also conducting environmental investigations or remedia-tions at or in the vicinity of several current or former operating sites pursuant to permits, administrative orders or agreements with state environmental agencies, and is involved in lawsuits and claims con-cerning certain current or former operating sites. The company is also subject to ongoing tax examinations and gov-ernmental assessments in various jurisdictions. Similar to many other U.S. companies doing business in Brazil, the company is involved in various challenges with Brazilian authorities regarding non-income tax assessments and non-income tax litigation matters. These matters principally relate to claims for taxes on the importation of computer software. The total amounts related to these matters are approxi-mately $1.5 billion, including amounts currently in litigation and other amounts. The company believes it will prevail on these matters and that these amounts are not meaningful indicators of liability. In accordance with SFAS No. 5, “Accounting for Contingencies,” (SFAS No. 5), the company records a provision with respect to a claim, suit, investigation or proceeding when it is probable that a liability has been incurred and the amount of the loss can be reasonably estimated. Any provisions are reviewed at least quarterly and are adjusted to reflect the impact and status of settlements, rulings, advice of counsel and other information pertinent to a particular matter. Any recorded liabil-ities for the above items, including any changes to such liabilities for the year ended December 31, 2006, were not material to the Consolidated
Financial Statements. Based on its experience, the company believes that the damage amounts claimed in the matters referred to above are not a meaningful indicator of the potential liability. Claims, suits, investigations and proceedings are inherently uncertain and it is not possible to predict the ultimate outcome of the matters previously discussed. While the company will continue to defend itself vigorously in all such matters, it is possible that the company’s business, financial condition, results of operations or cash flows could be affected in any particular period by the resolution of one or more of these matters. Whether any losses, damages or remedies finally determined in any such claim, suit, investigation or proceeding could reasonably have a material effect on the company’s business, financial condition, results of operations or cash flow will depend on a number of variables, includ-ing the timing and amount of such losses or damages; the structure and type of any such remedies; the significance of the impact any such losses, damages or remedies may have on the company’s Consolidated Financial Statements; and the unique facts and circumstances of the particular matter which may give rise to additional factors.
COmmitmentsthe company’s extended lines of credit to third-party entities include unused amounts of $2,895 million and $3,019 million at December 31, 2006 and 2005, respectively. A portion of these amounts was available to the company’s business partners to support their working capital needs. In addition, the company has committed to provide future financing to its clients in connection with client pur-chase agreements for approximately $2,496 million and $2,155 million at December 31, 2006 and 2005, respectively. The change over the prior year is due to increased signings of long-term IT infrastructure arrangements in which financing is committed by the company to fund a client’s future purchases from the company. The company has applied the provisions of FIN 45 to its agree-ments that contain guarantee or indemnification clauses. These provi-sions expand those required by SFAS No. 5, by requiring a guarantor to recognize and disclose certain types of guarantees, even if the likelihood of requiring the guarantor’s performance is remote. The following is a description of arrangements in which the company is the guarantor. The company is a party to a variety of agreements pursuant to which it may be obligated to indemnify the other party with respect to certain matters. Typically, these obligations arise in the context of contracts entered into by the company, under which the company customarily agrees to hold the other party harmless against losses aris-ing from a breach of representations and covenants related to such matters as title to assets sold, certain IP rights, specified environmen-tal matters, third-party performance of non-financial contractual obligations and certain income taxes. In each of these circumstances, payment by the company is conditioned on the other party making a claim pursuant to the procedures specified in the particular contract, which procedures typically allow the company to challenge the other party’s claims. Further, the company’s obligations under these agree-ments may be limited in terms of time and/or amount, and in some instances, the company may have recourse against third parties for certain payments made by the company.
nOtes tO COnsOlidated FinanCial statementsinternatiOnal business maChines COrpOratiOn and subsidiary COmpanies
91

It is not possible to predict the maximum potential amount of future payments under these or similar agreements due to the condi-tional nature of the company’s obligations and the unique facts and circumstances involved in each particular agreement. Historically, payments made by the company under these agreements have not had a material effect on the company’s business, financial condition or results of operations. In addition, the company guarantees certain loans and financial commitments. The maximum potential future payment under these financial guarantees was $32 million and $39 million at December 31, 2006 and 2005, respectively. The fair value of the guarantees recog-nized in the company’s Consolidated Statement of Financial Position is not material.
p. taxes(Dollars in millions)
for the year ended deCeMBer 31: 2006 2005 2004
Income from continuing operations before income taxes: U.S. operations $ 7,277 $ 7,450 $ 4,400
Non-U.S. operations 6,040 4,776 6,269
Total income from continuing operations before income taxes $13,317 $12,226 $10,669
The continuing operations provision for income taxes by geographic operations is as follows:
(Dollars in millions)
for the year ended deCeMBer 31: 2006 2005 2004
U.S. operations $2,413 $2,988 $1,492
Non-U.S. operations 1,488 1,244 1,680
Total continuing operations provision for income taxes $3,901 $4,232 $3,172
The components of the continuing operations provision for income taxes by taxing jurisdiction are as follows:
(Dollars in millions)
for the year ended deCeMBer 31: 2006 2005 2004
U.S. federal: Current $ 602 $ 521 $ (681)*
Deferred 1,326 1,811 1,668*
1,928 2,332 987
U.S. state and local: Current 11 80 36
Deferred 198 183 79
209 263 115
Non-U.S: Current 1,564 1,446 2,023
Deferred 200 191 47
1,764 1,637 2,070
Total continuing operations provision for income taxes 3,901 4,232 3,172
Provision for social security, real estate, personal property and other taxes 3,461 3,501 3,449
Total taxes included in income from continuing operations $7,362 $7,733 $6,621
* IncludedintheU.S.federalcurrentanddeferredtaxprovisionsareabenefitof$848millionandachargeof$848million,respectively,duetoa2004InternalRevenueService(IRS)settlement.
A reconciliation of the statutory U.S. federal tax rate to the company’s continuing operations effective tax rate is as follows:
for the year ended deCeMBer 31: 2006 2005 2004
Statutory rate 35% 35% 35%
Foreign tax differential (5) (5) (5)
State and local 1 1 1
“Act” repatriation — 4 —
Other (2) — (1)
Effective rate 29% 35% 30%
The effect of tax law changes on deferred tax assets and liabilities did not have a material impact on the company’s effective tax rate. The significant components of deferred tax assets and liabilities that are recorded in the Consolidated Statement of Financial Position were as follows:
nOtes tO COnsOlidated FinanCial statementsinternatiOnal business maChines COrpOratiOn and subsidiary COmpanies
92 2006 Annual Report
Consolidated statements ......................................................... 56
notes ..................................................................................... 62
A-G.......................................................................................... 62
H-M.......................................................................................... 80
N-S........................................................................................... 88
. N..Stockholders’.Equity.Activity........................................... 88
. O..Contingencies.and.Commitments.................................... 89
. P..Taxes................................................................................. 92
. Q..Research,.Development.and.Engineering....................... 93
. R..2005.Actions..................................................................... 93
. S..Earnings.Per.Share.of.Common.Stock.............................. 95
T-X........................................................................................... 96
Black
MAC
390 CG10
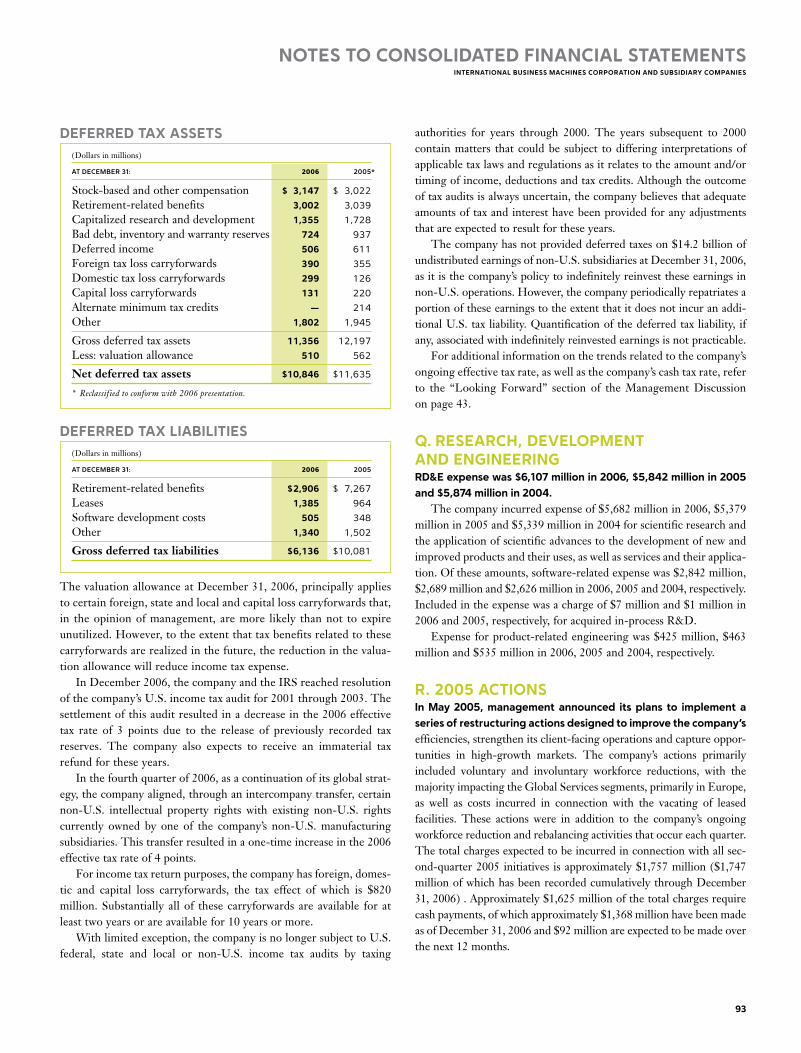
Black
MAC
390 CG10
deFerred tax assets(Dollars in millions)
at deCeMBer 31: 2006 2005*
Stock-based and other compensation $ 3,147 $ 3,022
Retirement-related benefits 3,002 3,039
Capitalized research and development 1,355 1,728
Bad debt, inventory and warranty reserves 724 937
Deferred income 506 611
Foreign tax loss carryforwards 390 355
Domestic tax loss carryforwards 299 126
Capital loss carryforwards 131 220
Alternate minimum tax credits — 214
Other 1,802 1,945
Gross deferred tax assets 11,356 12,197 Less: valuation allowance 510 562
Net deferred tax assets $10,846 $11,635
* Reclassifiedtoconformwith2006presentation.
deFerred tax liabilities(Dollars in millions)
at deCeMBer 31: 2006 2005
Retirement-related benefits $2,906 $ 7,267
Leases 1,385 964
Software development costs 505 348
Other 1,340 1,502
Gross deferred tax liabilities $6,136 $10,081
The valuation allowance at December 31, 2006, principally applies to certain foreign, state and local and capital loss carryforwards that, in the opinion of management, are more likely than not to expire unutilized. However, to the extent that tax benefits related to these carryforwards are realized in the future, the reduction in the valua-tion allowance will reduce income tax expense. In December 2006, the company and the IRS reached resolution of the company’s U.S. income tax audit for 2001 through 2003. The settlement of this audit resulted in a decrease in the 2006 effective tax rate of 3 points due to the release of previously recorded tax reserves. The company also expects to receive an immaterial tax refund for these years. In the fourth quarter of 2006, as a continuation of its global strat-egy, the company aligned, through an intercompany transfer, certain non-U.S. intellectual property rights with existing non-U.S. rights currently owned by one of the company’s non-U.S. manufacturing subsidiaries. This transfer resulted in a one-time increase in the 2006 effective tax rate of 4 points. For income tax return purposes, the company has foreign, domes-tic and capital loss carryforwards, the tax effect of which is $820 million. Substantially all of these carryforwards are available for at least two years or are available for 10 years or more. With limited exception, the company is no longer subject to U.S. federal, state and local or non-U.S. income tax audits by taxing
authorities for years through 2000. The years subsequent to 2000 contain matters that could be subject to differing interpretations of applicable tax laws and regulations as it relates to the amount and/or timing of income, deductions and tax credits. Although the outcome of tax audits is always uncertain, the company believes that adequate amounts of tax and interest have been provided for any adjustments that are expected to result for these years. The company has not provided deferred taxes on $14.2 billion of undistributed earnings of non-U.S. subsidiaries at December 31, 2006, as it is the company’s policy to indefinitely reinvest these earnings in non-U.S. operations. However, the company periodically repatriates a portion of these earnings to the extent that it does not incur an addi-tional U.S. tax liability. Quantification of the deferred tax liability, if any, associated with indefinitely reinvested earnings is not practicable. For additional information on the trends related to the company’s ongoing effective tax rate, as well as the company’s cash tax rate, refer to the “Looking Forward” section of the Management Discussion on page 43.
Q. researCh, develOpment and engineeringrd&e expense was $6,107 million in 2006, $5,842 million in 2005 and $5,874 million in 2004. The company incurred expense of $5,682 million in 2006, $5,379 million in 2005 and $5,339 million in 2004 for scientific research and the application of scientific advances to the development of new and improved products and their uses, as well as services and their applica-tion. Of these amounts, software-related expense was $2,842 million, $2,689 million and $2,626 million in 2006, 2005 and 2004, respectively. Included in the expense was a charge of $7 million and $1 million in 2006 and 2005, respectively, for acquired in-process R&D. Expense for product-related engineering was $425 million, $463 million and $535 million in 2006, 2005 and 2004, respectively.
r. 2005 aCtiOnsin may 2005, management announced its plans to implement a series of restructuring actions designed to improve the company’s efficiencies, strengthen its client-facing operations and capture oppor-tunities in high-growth markets. The company’s actions primarily included voluntary and involuntary workforce reductions, with the majority impacting the Global Services segments, primarily in Europe, as well as costs incurred in connection with the vacating of leased facilities. These actions were in addition to the company’s ongoing workforce reduction and rebalancing activities that occur each quarter. The total charges expected to be incurred in connection with all sec-ond-quarter 2005 initiatives is approximately $1,757 million ($1,747 million of which has been recorded cumulatively through December 31, 2006) . Approximately $1,625 million of the total charges require cash payments, of which approximately $1,368 million have been made as of December 31, 2006 and $92 million are expected to be made over the next 12 months.
nOtes tO COnsOlidated FinanCial statementsinternatiOnal business maChines COrpOratiOn and subsidiary COmpanies
93

Charges incurred for the workforce reductions consisted of severance/termination benefits for approximately 16,000 employees (14,500 of which were for the incremental second-quarter 2005 actions). All separations were substantially completed by March 31, 2006. The non-current portion of the liability associated with the workforce reductions relates to terminated employees who were granted annual payments to supplement their income in certain countries. Depending on individual country legal requirements, these required payments will continue until the former employee begins receiving pension benefits or is deceased. Cash payments made through December 31, 2006 associated with the workforce reductions were $1,277 million. The vacant space accruals are primarily for ongoing obligations to pay rent for vacant space, offset by estimated sublease income, over the respective lease term of the company’s lease agreements. The
nOtes tO COnsOlidated FinanCial statementsinternatiOnal business maChines COrpOratiOn and subsidiary COmpanies
94 2006 Annual Report
Total pre-tax restructuring activity was as follows:
(Dollars in millions)
Pre-tax Charges LiaBiLity LiaBiLity reCorded reCorded in as of in seCond asset the seCond deC. 31, Qtr. 2005 iMPairMents Qtr. 2005 PayMents other** 2005
Workforce reductions $1,574 $ — $1,574 $(1,013) $(107) $454
Vacant space 141 — 141 (53) (5) 83
Asset impairments 95 95 — — — —
Total restructuring activity for second-quarter 2005 actions $1,810* $95 $1,715 $(1,066) $(112) $537+
* $1.6billionrecordedinSG&Aexpenseand$0.2billionrecordedinOther(income)andexpenseintheConsolidatedStatementofEarnings.
**Consistsofforeigncurrencytranslationadjustments($38million),netbalancesheetreclassifications($41million)andreversalsofpreviouslyrecordedliabilities($34million)forchangesintheestimatedcostofemployeeterminationsandvacantspace,offsetbyapproximately$1millionofaccretionexpense.ThereversalswererecordedprimarilyinSG&Aexpense.
+ $391millionrecordedasacurrentliabilityinAccountspayableandaccrualsand$146millionasanon-currentliabilityinOtherliabilitiesintheConsolidatedStatementofFinancialPosition.
(Dollars in millions)
LiaBiLity LiaBiLity as of as of deC. 31, deC. 31, 2005 PayMents other* 2006
Workforce reductions $454 $(264) $10 $ 199
Vacant space 83 (37) 1 47
Total restructuring activity for second-quarter 2005 actions $537 $(302) $11 $247**
* Consistsofforeigncurrencytranslationadjustments($37million),netbalancesheetreclassifications($2million),accretionexpense($7million)andreversalsofpreviousrecordedliabilities($35million)forchangesintheestimatedcostofemployeeterminationsandvacantspace.Thesereversals,netofaccretionexpense,wereprimarilyrecordedinSG&A.
**$92millionrecordedasacurrentliabilityinAccountspayableandaccrualsand$155millionasanon-currentliabilityinOtherliabilitiesintheConsolidatedStatementofFinancialPosition.
length of these obligations varies by lease with the longest extending through 2016. In connection with the company’s restructuring activities initiated in the second quarter of 2005, the company recorded pre-tax impairment charges for certain real estate assets of approximately $95 million during the year ended December 31, 2005. The principal component of such impairment charges resulted from the sale of a facility in Yasu-City, Japan, which closed during the third quarter of 2005. In connection with this sale, the company recorded an impairment charge to write the asset down to its fair value in the second quarter. These restructuring activities had the following effect on the company’s reportable segments:
(Dollars in millions)
totaL Pre-tax CuMuLative Charges Pre-tax Charges exPeCted reCorded for to Be 2nd-Qtr. 2005at deCeMBer 31: inCurred initiatives*
Global Technology Services $ 718 $ 713
Global Business Services 442 441
Systems and Technology Group 132 132
Software 98 97
Global Financing 16 16
Total reportable segments 1,405 1,399
Unallocated corporate amounts 352 348
Total $1,757 $1,747
* Includes$35millionand$34millionforreversalsofpreviouslyrecordedchargesfortheyearsendedDecember31,2006and2005,respectively,duetochangesintheestimatedcostofemployeeterminationsandvacantspace.TheseadjustmentswerepredominantlyrecordedinSG&AexpenseintheConsolidatedStatementofEarnings.
Consolidated statements ......................................................... 56
notes ..................................................................................... 62
A-G.......................................................................................... 62
H-M.......................................................................................... 80
N-S........................................................................................... 88
. N..Stockholders’.Equity.Activity........................................... 88
. O..Contingencies.and.Commitments.................................... 89
. P..Taxes................................................................................. 92
. Q..Research,.Development.and.Engineering....................... 93
. R..2005.Actions..................................................................... 93
. S..Earnings.Per.Share.of.Common.Stock.............................. 95
T-X........................................................................................... 96
Black
MAC
390 CG10

Black
MAC
390 CG10
nOtes tO COnsOlidated FinanCial statementsinternatiOnal business maChines COrpOratiOn and subsidiary COmpanies
95
s. earnings per share OF COmmOn stOCkThe following table presents the computation of basic and diluted earnings per share of common stock:
for the year ended deCeMBer 31: 2006 2005* 2004
Weighted-average number of shares on which earnings per share calculations are based:Basic 1,530,806,987 1,600,591,264 1,674,959,086
Add—incremental shares under stock compensation plans 18,074,331 21,757,121 26,905,053
Add—incremental shares associated with convertible notes 3,273,706 3,791,228 4,273,541
Add—incremental shares associated with contingently issuable shares 1,380,360 1,493,049 1,094,028
Assuming dilution 1,553,535,384 1,627,632,662 1,707,231,708
(Dollars in millions except per share amounts)
Basic: Income from continuing operations $9,416 $7,994 $7,497
Income/(loss) from discontinued operations 76 (24) (18)
Cumulative effect of change in accounting principle** — (36) —
Net income from total operations on which basic earnings per share is calculated $9,492 $7,934 $7,479
Assuming dilution: Income from continuing operations $9,416 $7,994 $7,497
Net loss applicable to contingently issuable shares liability — (2) —
Income/(loss) from discontinued operations 76 (24) (18)
Cumulative effect of change in accounting principle** — (36) —
Net income from total operations on which diluted earnings per share is calculated $9,492 $7,932 $7,479
Earnings/(loss) per share of common stock: Assuming dilution: Continuing operations $ 6.06 $ 4.91 $ 4.39
Discontinued operations 0.05 (0.01) (0.01)
Before cumulative effect of change in accounting principle 6.11 4.90 4.38
Cumulative effect of change in accounting principle** — (0.02) —
Total $ 6.11 $ 4.87 $ 4.38
Basic: Continuing operations $ 6.15 $ 4.99 $ 4.48
Discontinued operations 0.05 (0.02) (0.01)
Before cumulative effect of change in accounting principle 6.20 4.98 4.47
Cumulative effect of change in accounting principle** — (0.02) —
Total $ 6.20 $ 4.96 $ 4.47
* Reclassifiedtoconformwith2006presentation.
**ReflectsimplementationofFASBInterpretationNo.47.SeenoteB,“AccountingChanges,”onpage72foradditionalinformation.
Weighted-average stock options to purchase 157,942,283 common shares in 2006, 165,615,293 common shares in 2005 and 133,220,730 common shares in 2004 were outstanding, but were not included in the computation of diluted earnings per share because the exercise price of the options was greater than the average market price of the common shares for the full year and, therefore, the effect would have been antidilutive.

t. rental expense and lease COmmitmentsrental expense from continuing operations, including amounts charged to inventories and fixed assets, and excluding amounts previously reserved, was $1,263 million in 2006, $1,345 million in 2005 and $1,442 million in 2004. Rental expense in agreements with rent holidays and scheduled rent increases is recorded on a straight-line basis over the lease term. Contingent rentals are included in the
nOtes tO COnsOlidated FinanCial statementsinternatiOnal business maChines COrpOratiOn and subsidiary COmpanies
96 2006 Annual Report
determination of rental expense as accruable. The table below depicts gross minimum rental commitments from continuing operations under noncancelable leases, amounts related to vacant space associ-ated with infrastructure reductions and restructuring actions taken through 1993, and in 1999, 2002 and 2005 (previously reserved), sublease income commitments and capital lease commitments. These amounts reflect activities primarily related to office space, as well as manufacturing facilities.
(Dollars in millions)
2007 2008 2009 2010 2011 Beyond 2011
Operating lease commitments: Gross minimum rental commitments (including Vacant space below) $1,302 $1,100 $906 $696 $486 $855
Vacant space 94 48 29 21 18 11
Sublease income commitments (87) (64) (43) (33) (18) (16)
Capital lease commitments 83 76 71 78 15 39
u. stOCk-based COmpensatiOneffective January 1, 2005, the company adopted the fair value rec-ognition provisions for stock-based awards granted to employees using the modified retrospective application method provided by SFAS No. 123(R), “Share-Based Payment,” (SFAS No. 123(R)). Stock-based compensation cost is measured at grant date, based on the fair value of the award, and is recognized as expense over the employee requisite service period. See note A, “Significant Accounting Policies,” on page 68 for additional information. The following table represents total stock-based compensation expense included in the Consolidated Statement of Earnings:
(Dollars in millions)
for the year ended deCeMBer 31: 2006 2005 2004
Cost $ 216 $ 330 $ 463
Selling, general and administrative* 541 606 914 Research, development and engineering 89 107 201 Other (income) and expense** — (8) —
Pre-tax stock-based compensation expense 846 1,035 1,578
Income tax benefits (305) (349) (498)
Total stock-based compensation expense $ 541 $ 686 $1,080
* Includes$7millionofcreditsrecordedduringtheyearendedDecember31,2005,asaresultofawardsforfeitedinconnectionwiththecompany’ssecond-quarter2005workforceresourceactions.
**Reflectstheone-timeeffectsonstock-basedcompensationexpenseasaresultofthedivestitureofthePersonalComputingbusiness.
Total unrecognized compensation costs related to non-vested awards at December 31, 2006 and 2005 were $1,238 million and $1,512 million, respectively, and are expected to be recognized over a weighted-aver-age period of approximately two years. There were no significant capitalized stock-based compensation costs at December 31, 2006, 2005 and 2004.
Consolidated statements ......................................................... 56
notes ..................................................................................... 62
A-G.......................................................................................... 62
H-M.......................................................................................... 80
N-S........................................................................................... 88
T-X........................................................................................... 96
. T..Rental.Expense.and.Lease.Commitments........................ 96
. U..Stock-Based.Compensation............................................. 96
. V..Retirement-Related.Benefits.......................................... 100
. W..Segment.Information.................................................... 111
. X..Subsequent.Events......................................................... 115
Black
MAC
390 CG10
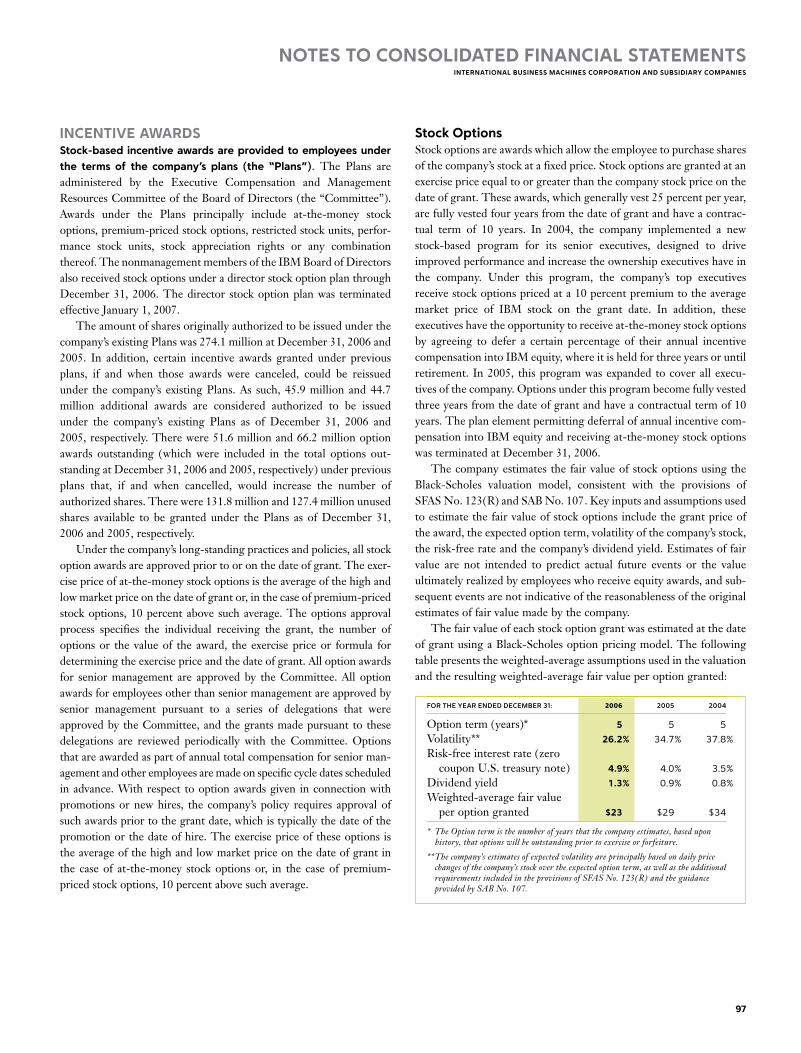
Black
MAC
390 CG10
nOtes tO COnsOlidated FinanCial statementsinternatiOnal business maChines COrpOratiOn and subsidiary COmpanies
97
inCentive awardsstock-based incentive awards are provided to employees under the terms of the company’s plans (the “plans”). The Plans are administered by the Executive Compensation and Management Resources Committee of the Board of Directors (the “Committee”). Awards under the Plans principally include at-the-money stock options, premium-priced stock options, restricted stock units, perfor-mance stock units, stock appreciation rights or any combination thereof. The nonmanagement members of the IBM Board of Directors also received stock options under a director stock option plan through December 31, 2006. The director stock option plan was terminated effective January 1, 2007. The amount of shares originally authorized to be issued under the company’s existing Plans was 274.1 million at December 31, 2006 and 2005. In addition, certain incentive awards granted under previous plans, if and when those awards were canceled, could be reissued under the company’s existing Plans. As such, 45.9 million and 44.7 million additional awards are considered authorized to be issued under the company’s existing Plans as of December 31, 2006 and 2005, respectively. There were 51.6 million and 66.2 million option awards outstanding (which were included in the total options out-standing at December 31, 2006 and 2005, respectively) under previous plans that, if and when cancelled, would increase the number of authorized shares. There were 131.8 million and 127.4 million unused shares available to be granted under the Plans as of December 31, 2006 and 2005, respectively. Under the company’s long-standing practices and policies, all stock option awards are approved prior to or on the date of grant. The exer-cise price of at-the-money stock options is the average of the high and low market price on the date of grant or, in the case of premium-priced stock options, 10 percent above such average. The options approval process specifies the individual receiving the grant, the number of options or the value of the award, the exercise price or formula for determining the exercise price and the date of grant. All option awards for senior management are approved by the Committee. All option awards for employees other than senior management are approved by senior management pursuant to a series of delegations that were approved by the Committee, and the grants made pursuant to these delegations are reviewed periodically with the Committee. Options that are awarded as part of annual total compensation for senior man-agement and other employees are made on specific cycle dates scheduled in advance. With respect to option awards given in connection with promotions or new hires, the company’s policy requires approval of such awards prior to the grant date, which is typically the date of the promotion or the date of hire. The exercise price of these options is the average of the high and low market price on the date of grant in the case of at-the-money stock options or, in the case of premium-priced stock options, 10 percent above such average.
stock OptionsStock options are awards which allow the employee to purchase shares of the company’s stock at a fixed price. Stock options are granted at an exercise price equal to or greater than the company stock price on the date of grant. These awards, which generally vest 25 percent per year, are fully vested four years from the date of grant and have a contrac-tual term of 10 years. In 2004, the company implemented a new stock-based program for its senior executives, designed to drive improved performance and increase the ownership executives have in the company. Under this program, the company’s top executives receive stock options priced at a 10 percent premium to the average market price of IBM stock on the grant date. In addition, these executives have the opportunity to receive at-the-money stock options by agreeing to defer a certain percentage of their annual incentive compensation into IBM equity, where it is held for three years or until retirement. In 2005, this program was expanded to cover all execu-tives of the company. Options under this program become fully vested three years from the date of grant and have a contractual term of 10 years. The plan element permitting deferral of annual incentive com-pensation into IBM equity and receiving at-the-money stock options was terminated at December 31, 2006. The company estimates the fair value of stock options using the Black-Scholes valuation model, consistent with the provisions of SFAS No. 123(R) and SAB No. 107. Key inputs and assumptions used to estimate the fair value of stock options include the grant price of the award, the expected option term, volatility of the company’s stock, the risk-free rate and the company’s dividend yield. Estimates of fair value are not intended to predict actual future events or the value ultimately realized by employees who receive equity awards, and sub-sequent events are not indicative of the reasonableness of the original estimates of fair value made by the company. The fair value of each stock option grant was estimated at the date of grant using a Black-Scholes option pricing model. The following table presents the weighted-average assumptions used in the valuation and the resulting weighted-average fair value per option granted:
for the year ended deCeMBer 31: 2006 2005 2004
Option term (years)* 5 5 5
Volatility** 26.2% 34.7% 37.8%
Risk-free interest rate (zero coupon U.S. treasury note) 4.9% 4.0% 3.5%
Dividend yield 1.3% 0.9% 0.8%
Weighted-average fair value per option granted $23 $29 $34
* TheOptiontermisthenumberofyearsthatthecompanyestimates,baseduponhistory,thatoptionswillbeoutstandingpriortoexerciseorforfeiture.
**Thecompany’sestimatesofexpectedvolatilityareprincipallybasedondailypricechangesofthecompany’sstockovertheexpectedoptionterm,aswellastheadditionalrequirementsincludedintheprovisionsofSFASNo.123( R)andtheguidanceprovidedbySABNo.107.

The following table summarizes option activity under the Plans during the years ended December 31, 2006, 2005 and 2004:
2006 2005 2004
Wtd. Avg. Wtd. avg. Wtd. avg. ExErcisE No. of shArEs exerCise no. of shares exerCise no. of shares PricE UNdEr oPtioN PriCe under oPtion PriCe under oPtion
Balance at January 1 $ 91 236,070,040 $ 89 249,347,906 $86 244,966,052
Options granted 85 2,013,623 100 13,016,765 97 26,537,055
Options exercised 53 (21,685,948) 47 (11,690,186) 47 (14,035,038)
Options canceled/expired 100 (8,734,492) 97 (14,604,445) 93 (8,120,163)
Balance at December 31 $ 95 207,663,223 $ 91 236,070,040 $89 249,347,906
Exercisable at December 31 $ 95 177,318,905 $ 92 176,962,180 $89 159,607,886
During the years ended December 31, 2006, 2005 and 2004, the company granted approximately 0.5 million, 12.5 million and 5.0 million stock options, respectively, with exercise prices greater than the stock price at the date of grant. These stock options had weighted-average exercise prices of $91, $100 and $106 for the years ended December 31, 2006, 2005 and 2004, respectively, and are included in the table above. The shares under option at December 31, 2006 were in the following exercise price ranges:
oPtions outstanding
Wtd. avg. Wtd. avg. nuMBer aggregate reMaining exerCise of shares intrinsiC ContraCtuaL exerCise PriCe range PriCe under oPtion vaLue Life (in years)
$34-$60 $ 51 19,647,646 $ 915,580,749 2
$61-$85 78 45,044,045 877,175,067 6
$86-$105 98 78,802,714 150,501,582 6
$106 and over 116 64,168,818 — 4
$ 95 207,663,223 $1,943,257,398 5
oPtions exerCisaBLe
Wtd. avg. Wtd. avg. nuMBer aggregate reMaining exerCise of shares intrinsiC ContraCtuaL exerCise PriCe range PriCe under oPtion vaLue Life (in years)
$34-$60 $ 51 19,647,646 $ 915,580,749 2
$61-$85 77 35,981,052 735,466,736 6
$86-$105 98 59,477,967 118,167,463 5
$106 and over 117 62,212,240 — 4
$ 95 177,318,905 $1,769,214,948 4
nOtes tO COnsOlidated FinanCial statementsinternatiOnal business maChines COrpOratiOn and subsidiary COmpanies
98 2006 Annual Report
Consolidated statements ......................................................... 56
notes ..................................................................................... 62
A-G.......................................................................................... 62
H-M.......................................................................................... 80
N-S........................................................................................... 88
T-X........................................................................................... 96
. T..Rental.Expense.and.Lease.Commitments........................ 96
. U..Stock-Based.Compensation............................................. 96
. V..Retirement-Related.Benefits.......................................... 100
. W..Segment.Information.................................................... 111
. X..Subsequent.Events......................................................... 115
Black
MAC
390 CG10

Black
MAC
390 CG10
nOtes tO COnsOlidated FinanCial statementsinternatiOnal business maChines COrpOratiOn and subsidiary COmpanies
99
In connection with various acquisition transactions, there were an additional 3.2 million options outstanding at December 31, 2006, as a result of the company’s assumption of options granted by the acquired entities. The weighted-average exercise price of these options was $77 per share.
exercises of employee stock OptionsThe total intrinsic value of options exercised during the years ended December 31, 2006, 2005 and 2004 was $727 million, $470 million and $651 million, respectively. The total cash received from employ-ees as a result of employee stock option exercises for the years ended December 31, 2006, 2005 and 2004 was approximately $1,149 mil-lion, $550 million and $661 million, respectively. In connection with these exercises, the tax benefits realized by the company for the years ended December 31, 2006, 2005 and 2004 were $242 million, $148 million and $225 million, respectively. The company settles employee stock option exercises primarily with newly issued common shares and, occasionally, with treasury shares. Total treasury shares held at December 31, 2006 and 2005 were approximately 502 million and 407 million shares, respectively.
stock awardsIn addition to stock options, the company grants its employees stock awards. These awards are made in the form of Restricted Stock Units (RSUs) or Performance Stock Units (PSUs). RSUs are stock awards granted to employees that entitle the holder to shares of common stock as the award vests, typically over a two- to five-year period. The fair value of the awards is determined and fixed on the grant date based on the company’s stock price. During the year ended December 31, 2006, the company modified its equity com-pensation plans to increase awards of RSUs compared to stock options. RSUs awarded during the years ended December 31, 2005 and 2004 were not material when compared to the value of stock options awarded during the respective years. The following table summarizes RSU activity under the Plans during the year ended December 31, 2006:
Wtd. avg. nuMBer grant PriCe of units
Balance at January 1 $83 6,813,698
RSUs granted 85 4,831,227
RSUs released 76 (1,037,927)
RSUs canceled/forfeited 85 (389,740)
Balance at December 31 $84 10,217,258
The remaining weighted-average contractual term of RSUs at December 31, 2006 is the same as the period over which the remaining cost of the awards will be recognized, which is approximately three years. The fair value of RSUs granted during the year ended
December 31, 2006 was $410 million. The total fair value of RSUs vested and released during the year ended December 31, 2006 was $79 million. As of December 31, 2006, there was $501 million of unrecognized compensation cost related to nonvested RSUs. The company received no cash from employees as a result of employee vesting and release of RSUs for the year ended December 31, 2006. In connection with employee vesting and release of RSUs, the tax benefit realized by the company for the year ended December 31, 2006 was $59 million. PSUs are stock awards where the number of shares ultimately received by the employee depends on the company’s performance against specified targets and typically vest over a three-year period. The fair value of each PSU is determined on the date of grant, based on the company’s stock price, and assumes that performance targets will be achieved. Over the performance period, the number of shares of stock that will be issued is adjusted upward or downward based upon the probability of achievement of performance targets. The ultimate number of shares issued and the related compensation cost recognized as expense will be based on a comparison of the final per-formance metrics to the specified targets. The fair value of PSUs granted during the year ended December 31, 2006 was $104 million. Total fair value of PSUs vested and released during the year ended December 31, 2006 was $67 million.
ibm emplOyees stOCk purChase planthe company maintains an employees stock purchase plan (espp). The ESPP enables eligible participants to purchase full or fractional shares of IBM common stock through payroll deductions of up to 10 percent of eligible compensation. Eligible compensation includes any compensation received by the employee during the year. The ESPP provides for offering periods during which shares may be purchased and continues as long as shares remain available under the ESPP, unless terminated earlier at the discretion of the Board of Directors. Individual ESPP participants are restricted from purchasing more than $25,000 of common stock in one calendar year or 1,000 shares in an offering period. Prior to April 1, 2005, the ESPP was considered compensatory under the provisions of SFAS No. 123(R). The share price paid by an employee prior to April 1, 2005 was the lesser of 85 percent of the average market price on the first business day of each offering period or 85 percent of the average market price on the last business day of each pay period. Effective April 1, 2005, the company modified the terms of the plan whereas eligible participants may purchase full or fractional shares of IBM common stock under the ESPP at a five percent discount off the average market price on the day of the pur-chase. In accordance with the provisions of SFAS No. 123(R), effective April 1, 2005, the ESPP is not considered compensatory.

Employees purchased 5.8 million, 6.7 million and 11.6 million shares under the ESPP during the years ended December 31, 2006, 2005 and 2004, respectively. Cash dividends declared and paid by the company on its common stock also include cash dividends on the company stock purchased through the ESPP. Dividends are paid on full and fractional shares and can be reinvested in the ESPP. The company stock purchased through the ESPP is considered outstand-ing and is included in the weighted-average outstanding shares for purposes of computing basic and diluted earnings per share. Approximately 20.3 million, 26.2 million and 32.8 million shares were available for purchase under the ESPP at December 31, 2006, 2005 and 2004, respectively.
v. retirement-related beneFits
desCriptiOn OF plansibm sponsors defined benefit pension plans and defined contri-bution plans that cover substantially all regular employees, a supplemental retention plan that covers certain U.S. executives and nonpension postretirement benefit plans primarily consisting of retiree medical and dental benefits for eligible retirees and depen-dents. These benefits form an important part of the company’s total compensation and benefits program that is designed to attract and retain highly skilled and talented employees.
u.s. plans
deFined beneFit pensiOn plan
ibm personal pension plan IBM provides U.S. regular, full-time and part-time employees hired prior to January 1, 2005 with noncontributory defined benefit pension benefits via the IBM Personal Pension Plan (PPP). The PPP consists of a tax-qualified (qualified) plan and a non-tax qualified (non-quali-fied) plan. The qualified plan is funded by company contributions to an irrevocable trust fund, which is held for the sole benefit of partici-pants and beneficiaries. The non-qualified plan, which is unfunded, provides benefits in excess of IRS limitations for qualified plans.
nOtes tO COnsOlidated FinanCial statementsinternatiOnal business maChines COrpOratiOn and subsidiary COmpanies
100 2006 Annual Report
Benefits provided to the PPP participants are calculated using benefit formulas that vary based on the participant. Pension benefits are calculated using one of two methods based upon specified crite-ria used to determine each participant’s eligibility. The first method uses a five-year, final pay formula that determines benefits based on salary, years of service, mortality and other participant-specific fac-tors. The second method is a cash balance formula that calculates benefits using a percentage of employees’ annual salary, as well as an interest crediting rate. In December 2005, the company approved an amendment to the PPP, which provides that no further benefits under the PPP will accrue for active participants after December 31, 2007.
u.s. supplemental retention planThe company also sponsors a non-qualified U.S. Supplemental Reten-tion Plan (SRP). The SRP, which is unfunded, provides benefits to eligible U.S. executives based on average earnings, years of service and age at termination of employment. Effective July 1, 1999, the company replaced the then-effective SRP with the current SRP. Some partici-pants in the previous SRP will still be eligible for benefits under that prior plan if those benefits are greater than the benefits provided under the current plan. In December 2005, the company approved an amendment to the SRP, which provides that no further benefits will accrue for active participants after December 31, 2007.
deFined COntributiOn plans
ibm savings plan U.S. regular, full-time and part-time employees are eligible to par-ticipate in the IBM Savings Plan, which is a qualified defined contribu-tion plan under section 401(k) of the Internal Revenue Code. For participants hired prior to January 1, 2005, the company matches 50 percent of their contributions up to the first 6 percent of eligible com-pensation. For participants hired or rehired on or after January 1, 2005, who have completed one year of service, the company matches 100 percent of their contributions up to the first 6 percent of eligible compensation. These participants participate in the 401(k) Pension Plan offered through the IBM Savings Plan. The company’s matching contributions vest immediately, and participants are always fully vested in their own contributions. All contributions, including the company match, are made in cash in accordance with the participants’ invest-ment elections. There are no minimum amounts that must be invested in company stock, and there are no restrictions on transferring amounts out of the company stock to another investment choice. In January 2006, the company announced its intention to amend the plan effective January 1, 2008. The announced change will con-sist of two components: an automatic contribution for all eligible U.S. employees and an increase in the amount of company matching contribution for all eligible U.S. employees hired on or before December 31, 2004.
Consolidated statements ......................................................... 56
notes ..................................................................................... 62
A-G.......................................................................................... 62
H-M.......................................................................................... 80
N-S........................................................................................... 88
T-X........................................................................................... 96
. T..Rental.Expense.and.Lease.Commitments........................ 96
. U..Stock-Based.Compensation............................................. 96
. V..Retirement-Related.Benefits.......................................... 100
. W..Segment.Information.................................................... 111
. X..Subsequent.Events......................................................... 115
Black
MAC
390 CG10

Black
MAC
390 CG10
ibm executive deferred Compensation planThe company also maintains an unfunded, non-qualified, defined contribution plan, the IBM Executive Deferred Compensation Plan (EDCP), which allows eligible executives to defer compensation and to receive company matching contributions under the applicable IBM Savings Plan formula (depending on the date of hire, as described earlier), with respect to amounts in excess of IRS limits for qualified plans. Amounts contributed to the plan as a result of deferred com-pensation, as well as company matching contributions, are recorded as liabilities. Deferred compensation amounts may be directed by participants into an account that replicates the return that would have been received had the amounts been invested in similar IBM Savings Plan investment options. The company matching contributions are directed to participant accounts and change in value each reporting period based on changes in the company’s stock price.
nOnpensiOn pOstretirement beneFit plan
u.s. nonpension postretirement plan The company sponsors a defined benefit nonpension postretirement benefit plan that provides medical and dental benefits to eligible U.S. retirees and eligible dependents, as well as life insurance for eligible U.S. retirees. Effective July 1, 1999, the company established a Future Health Account (FHA) for employees who were more than five years away from retirement eligibility. Employees who were within five years of retirement eligibility are covered under the company’s prior retiree health benefits arrangements. Under either the FHA or the prior retiree health benefit arrangements, there is a maximum cost to the company for retiree health benefits. For employees who retired before January 1, 1992, that maximum became effective in 2001. For all other employees, the maximum is effective upon retirement. Effective January 1, 2004, the company amended its nonpension postretirement benefit plan to provide that new hires, as of that date or later, will no longer be eligible for company subsidized benefits.
non-u.s. plansMost subsidiaries and branches outside the United States sponsor defined benefit and/or defined contribution plans that cover substan-tially all regular employees. The company deposits funds under various fiduciary-type arrangements, purchases annuities under group con-tracts or provides reserves for these plans. Benefits under the defined benefit plans are typically based either on years of service and the employee’s compensation (generally during a fixed number of years immediately before retirement) or on annual credits. The range of assumptions that are used for the non-U.S. defined benefit plans reflects the different economic environments within various countries. In addition, certain of the company’s non-U.S. subsidiaries sponsor defined benefit nonpension postretirement benefit plans that provide medical and dental benefits for eligible non-U.S. retirees and eligible dependents, as well as life insurance for certain eligible non-U.S. retirees. However, most of the retirees outside the United States are covered by local government sponsored and administered programs.
nOtes tO COnsOlidated FinanCial statementsinternatiOnal business maChines COrpOratiOn and subsidiary COmpanies
101
implementatiOn OF sFas nO. 158as highlighted in note b, “accounting Changes,” on page 71, effec-tive december 31, 2006, the company adopted the provisions of SFAS No. 158. In note A, “Significant Accounting Policies,” on pages 67 and 68, the requirements of SFAS No. 158 are discussed in detail. SFAS No. 158 requires the recognition of the funded status of each defined benefit pension plan and nonpension postretirement benefit plan on the company’s balance sheet. Each overfunded plan is recog-nized as an asset and each underfunded plan (or unfunded) is recognized as a liability. The initial impact of SFAS No. 158 due to previously unrecognized actuarial gains and losses and prior service costs or credits, as well as subsequent changes in the funded status, is recognized as a component of Accumulated gains and losses not affecting retained earnings (net of tax) in Stockholders’ equity. The following table presents the incremental effect of applying SFAS No. 158 on the Consolidated Statement of Financial Position:
(Dollars in millions)
Before after aPPLiCation aPPLiCation at deCeMBer 31, 2006 of sfas no. 158 adjustMents* of sfas no. 158
Prepaid pension assets $ 24,003 $(13,374) $ 10,629
Investments and sundry assets (deferred taxes) $ 4,245 $ 4,136 $ 8,381
Total Assets $112,473 $ (9,240) $103,234
Current liabilities, Compensation and benefits $ 3,605 $ 990 $ 4,595
Non-current liabilities, Retirement and nonpension postretirement obligations $ 12,888 $ 665 $ 13,553
Other liabilities (deferred taxes) $ 8,701 $ (1,397) $ 7,304
Total Liabilities $ 74,470 $ 258 $ 74,728
Accumulated gains and (losses) not affecting retained earnings, net of tax $ 597 $ (9,498) $ (8,901)
Total Stockholders’ Equity $ 38,004 $ (9,498) $ 28,506
* Adjustmentsareprimarilycomprisedofpreviouslyunrecognizedgains/(losses),priorservicecosts/(credits)andtransitionassets/(obligations).
At December 31, 2006, the company recorded prior service costs, net gains/(losses) and transition assets/(obligations) in the Stockholders’ equity section of the Consolidated Statement of Financial Position, net of tax, of $871 million, $(10,371) million and $2 million, respectively. In addition, the minimum pension liability of $2,348 million was eliminated upon the adoption of SFAS No. 158.

nOtes tO COnsOlidated FinanCial statementsinternatiOnal business maChines COrpOratiOn and subsidiary COmpanies
102 2006 Annual Report
plan FinanCial inFOrmatiOnsummary of Financial informationThe following table presents a summary of the total retirement-related benefits net periodic cost/(income) recorded in the Consolidated Statement of Earnings:
(Dollars in millions)
u.s. PLans non-u.s. PLans totaL
for the year ended deCeMBer 31: 2006 2005 2004 2006 2005*** 2004 2006 2005*** 2004
Significant defined benefit pension plans* $ 456 $ 381 $ 30 $ 639 $ 729 $ 65 $1,095 $1,110 $ 95
Other defined benefit pension plans** 93 125 110 85 136 187 178 261 297
Supplemental Retention Plan 20 9 22 — — — 20 9 22
Total defined benefit pension plans cost $ 569 $ 515 $162 $ 724 $ 865 $252 $1,293 $1,380 $ 414
IBM Savings Plan and Non-U.S. Plans $ 358 $ 331 $329 $ 377 $ 337 $320 $ 735 $ 668 $ 649
Executive Deferred Compensation Plan 11 10 9 — — — 11 10 9
Total defined contribution plans cost $ 370 $ 341 $338 $ 377 $ 337 $320 $ 747 $ 678 $ 658
Nonpension postretirement benefit plans cost $ 335 $ 332 $327 $ 53 $ 47 $ 45 $ 388 $ 379 $ 372
Total retirement-related benefits net periodic cost $1,274 $1,188 $827 $1,154 $1,249 $617 $2,428 $2,437 $1,444
* SignificantdefinedbenefitpensionplansconsistofthequalifiedportionofthePPPintheU.S.andthematerialnon-U.S.Plans.Seepage103foralistofsignificantplans.
** Otherdefinedbenefitpensionplansconsistofthenon-qualifiedportionofthePPPintheU.S.andthenon-materialnon-U.S.Plans.
The following table presents a summary of the total projected benefit obligation, fair value of plan assets and the associated funded status recorded in the Consolidated Statement of Financial Position:
(Dollars in millions)
ProjeCted Benefit fair vaLue funded net aMount oBLigation of PLan assets status reCognized**
at deCeMBer 31: 2006 2005+ 2006 2005+ 2006 2005 2005
U.S. Plans: Overfunded plans: Qualified portion of the PPP $46,498 $46,405 $52,913 $48,542 $ 6,415 $ 2,137 $ 13,876
Underfunded plans: Non-qualified portion of the PPP $ 1,123 $ 1,135 $ — $ — $ (1,123) $ (1,135) $ (1,090)
Supplemental Retention Plan 217 204 — — (217) (204) (207)
Nonpension Postretirement Benefit Plan 5,773 5,892 47 66 (5,726) (5,826) (5,095)
Total underfunded U.S. Plans $ 7,113 $ 7,231 $ 47 $ 66 $ (7,066) $ (7,165) $ (6,392)
Non-U.S. Plans*: Overfunded plans: Qualified defined benefit pension plans $25,613 $11,626 $29,766 $13,908 $ 4,153 $ 2,282 $ 6,458
Underfunded plans: Qualified defined benefit pension plans $ 9,076 $20,740 $ 7,866 $17,241 $ (1,210) $ (3,499) $ (2,334)
Non-qualified defined benefit pension plans 4,765 4,277 — — (4,765) (4,277) (4,099)
Nonpension postretirement benefit plans 637 585 — — (637) (585) (344)
Total underfunded non-U.S. plans $14,478 $25,602 $ 7,866 $17,241 $ (6,612) $ (8,361) $ (6,777)
Total overfunded plans $72,111 $58,031 $82,679 $62,450 $ 10,568 $ 4,419 $ 20,334
Total underfunded plans* $21,591 $32,833 $ 7,913 $17,307 $(13,678) $(15,526) $(13,169)
* Excludesnon-materialnon-U.S.definedbenefitpensionplans;seepage103foralistofsignificantplans.
**In2005,thenetamountrecognizedrepresentedamountsrecognizedintheConsolidatedStatementofFinancialPositionwhichincludedboththefundedstatusaswellasanypreviouslydeferreditems.AtDecember31,2006,inaccordancewiththeprovisionsofSFASNo.158,theamountrecognizedintheConsolidatedStatementofFinancialPositionwasequivalenttothefundedstatus.Inbothyears,theamountsrecognizedintheConsolidatedStatementofFinancialPositionwererecordedasfollows:AssetamountsrecordedasPrepaidpensionassets;(Liability)amountsrecordedasCompensationandbenefits(currentliability)andRetirementandnonpensionpostretirementbenefitobligations(non-currentliability).
+ Amountshavebeenreclassifiedtoconformwith2006presentation.
Black
MAC
390 CG10

Black
MAC
390 CG10
(Dollars in millions)
nonPension PostretireMent signifiCant defined Benefit Pension PLans Benefit PLans
u.s. PLan non-u.s. PLans u.s. PLan
for the year ended deCeMBer 31: 2006 2005 2004 2006 2005 2004 2006 2005 2004
Service cost $ 769 $ 682 $ 652 $ 596 $ 694 $ 611 $ 62 $ 45 $ 40
Interest cost 2,454 2,463 2,453 1,585 1,635 1,618 306 324 337
Expected return on plan assets (3,613) (3,672) (3,607) (2,298) (2,245) (2,380) — — —
Amortization of transition assets — — (72) (6) (6) (10) — — —
Amortization of prior service costs/(credits) 61 61 61 (108) 8 5 (62) (62) (62)
Settlement of certain legal claims — — 320 — — — — — —
Recognized actuarial losses 785 567 223 870 578 221 29 25 12
Plan amendments/ curtailments/settlements — 280 — — 65 — — — —
Total net periodic cost $ 456 $ 381 $ 30 $ 639 $ 729 $ 65 $ 335 $332 $327
nOtes tO COnsOlidated FinanCial statementsinternatiOnal business maChines COrpOratiOn and subsidiary COmpanies
103
defined benefit pension and nonpension post-retirement benefit plan Financial informationThe following represents financial information for the company’s significant retirement-related benefit plans. The significant defined benefit pension plans consist of the qualified portion of the PPP in the U.S. and material non-U.S. pension plans, including plans in Germany, the United Kingdom, Japan, the Netherlands, Canada, Switzerland and Spain. In 2006, certain non-U.S. pension plans were no longer
considered material and, accordingly, prior-year amounts presented have been reclassified to conform with current-year presentation. The significant nonpension postretirement benefit plans represents the U.S. nonpension postretirement benefit plan. The following table presents the components of net periodic pen-sion cost/(income) and net periodic postretirement benefit cost/(income) of the significant retirement-related benefit plans recog-nized in the Consolidated Statement of Earnings:

The following table presents the changes in the pension benefit and postretirement nonpension benefit obligations (benefit obligations) and plan assets of the significant retirement-related benefit plans:
(Dollars in millions)
nonPension PostretireMent signifiCant defined Benefit Pension PLans Benefit PLans
u.s. PLan non-u.s. PLans u.s. PLan
at deCeMBer 31: 2006 2005 2006 2005 2006 2005
Change in benefit obligation: Benefit obligation at beginning of year $46,405 $44,637 $36,643 $38,694 $ 5,892 $ 5,894
Service cost 769 682 596 694 62 45
Interest cost 2,454 2,463 1,585 1,635 306 324
Plan participants’ contributions — — 57 55 — —
Acquisitions/divestitures, net — 57 10 (14) — (7)
Actuarial losses/(gains) (283) 2,237 (600) 2,324 8 343
Benefits paid from trust (2,847) (2,896) (1,454) (1,427) — —
Direct benefit payments — — (311) (288) (486) (519)
Foreign exchange impact — — 3,616 (4,548) — —
Medicare subsidy — — — — (9) (188)
Plan amendments/curtailments/settlements — (775) (688) (482) — —
Benefit obligation at end of year $46,498 $46,405 $39,454 $36,643 $ 5,773 $ 5,892
Change in plan assets:Fair value of plan assets at beginning of year $48,542 $44,845 $31,148 $30,736 $ 66 $ 50
Actual return on plan assets 7,218 4,880 3,016 4,984 3 1
Employer contributions — 1,715 1,769 561 438 500
Acquisitions/divestitures, net — (2) (78) 17 — —
Plan participants’ contributions — — 57 55 185 171
Benefits paid from trust (2,847) (2,896) (1,454) (1,427) (645) (656)
Foreign exchange impact — — 3,174 (3,778) — —
Fair value of plan assets at end of year $52,913 $48,542 $37,632 $31,148 $ 47 $ 66
Funded status at end of year $ 6,415 $ 2,137 $ (1,822) $ (5,495) $(5,726) $(5,826)
Unrecognized net actuarial losses n/a $11,617 n/a $12,444 n/a $ 970
Unrecognized prior service costs/(credits) n/a 122 n/a (705) n/a (239)
Unrecognized net transition assets/(obligations) n/a — n/a (9) n/a —
Net prepaid assets/(accrued benefit liabilities) recognized in the Consolidated Statement of Financial Position n/a $13,876 n/a $ 6,235 n/a $(5,095)
Accumulated benefit obligation $46,421 $46,184 $38,088 $35,011 n/a N/A
N/A—Notapplicable.InaccordancewiththeprovisionsofSFASNo.158,thefundedstatuswasrecognizedintheConsolidatedStatementofFinancialPositionandanyunrecognizedgains/(losses),priorservicecosts/(credits)andtransitionassets/(obligations)wererecognizedintheConsolidatedStatementofStockholders’EquityatDecember31,2006.SeenoteA,“SignificantAccountingPolicies,”onpages67and68forfurtherinformation.
nOtes tO COnsOlidated FinanCial statementsinternatiOnal business maChines COrpOratiOn and subsidiary COmpanies
104 2006 Annual Report
Consolidated statements ......................................................... 56
notes ..................................................................................... 62
A-G.......................................................................................... 62
H-M.......................................................................................... 80
N-S........................................................................................... 88
T-X........................................................................................... 96
. T..Rental.Expense.and.Lease.Commitments........................ 96
. U..Stock-Based.Compensation............................................. 96
. V..Retirement-Related.Benefits.......................................... 100
. W..Segment.Information.................................................... 111
. X..Subsequent.Events......................................................... 115
Black
MAC
390 CG10

Black
MAC
390 CG10
The following table presents the amounts recognized in the Consolidated Statement of Financial Position for the company’s significant retire-ment-related benefit plans:
(Dollars in millions)
nonpension significantdefined postretirement Benefitpensionplans Benefitplans
atdecemBer31,2006: U.s.plan non-U.s.plans U.s.plan
Prepaid pension assets $ 6,415 $4,153 $ —
Current liabilities—Compensation and benefits — (269) (487)
Non-current liabilities—Retirement and nonpension postretirement benefit obligation — (5,706) (5,239)
Funded status—net $ 6,415 $(1,822) $(5,726)
atdecemBer31,2005*:
Prepaid pension assets $13,876 $6,458 $ —
Intangible assets — 38 —
Total prepaid pension assets 13,876 6,496 —
Non-current liabilities—Retirement and nonpension postretirement benefit obligation — (6,433) (5,095)
Accumulated losses not affecting retained earnings — 4,081 —
Deferred tax assets (Investmentsand sundry assets) — 2,091 —
Net amount recognized $13,876 $6,235 $(5,095)
* DuetotheadoptionofSFASNo.158,whichwasimplementedatDecember31,2006,year-to-yearcomparibilityisnotpractical.
The following table presents the pre-tax net loss, prior service costs/(credits) and transition assets/(obligations) recognized in Accumulated gains and (losses) not affecting retained earnings for the company’s significant retirement-related benefit plans:
(Dollars in millions)
nonpension significantdefined postretirement Benefitpensionplans Benefitplans
atdecemBer31,2006: U.s.plan non-U.s.plans U.s.plan
Net loss $6,944 $11,298 $935
Prior service costs/(credits) 61 (1,269) (177)
Transition assets/(obligations) — (4) —
Total recognized in Accumulated gains and (losses) not affecting retained earnings $7,005 $10,025 $758
The following table presents the estimated net loss, estimated prior service costs/(credits) and estimated transition assets/(obligations) of the company’s significant retirement-related benefit plans that will be amortized from Accumulated gains and (losses) not affecting retained earnings into net periodic cost/(income) and recorded in the Consolidated Statement of Earnings in 2007:
(Dollars in millions)
nonpension significantdefined postretirement Benefitpensionplans Benefitplans
U.s.plan non-U.s.plans U.s.plan
Net loss $674 $910 $33
Prior service costs/(credits) 61 (124) (62)
Transition assets/(obligations) — (1) —
Notes to CoNsolidated FiNaNCial statemeNtsiNterNatioNal busiNess maChiNes CorporatioN aNd subsidiary CompaNies
105

In 2006, the company redesigned certain non-U.S. defined benefit pension plans that resulted in a reduction to the PBO of $688 million and had no impact on the current-year net periodic cost/(income). The majority of the reduction was attributed to modified plans in the United Kingdom, Switzerland and the Netherlands. There were no significant amendments of the significant U.S. retirement-related benefit plans during the year ended December 31, 2006 that would have a material effect on the Consolidated Statement of Earnings. In December 2005, the company approved amendments to the PPP and the SRP which provided that active participants will no longer accrue benefits under these plans after December 31, 2007. As a result of this action, the company recorded a curtailment charge of approxi-mately $267 million in the Consolidated Statement of Earnings for the year ended December 31, 2005. In addition, the company recorded a reduction in the PBO balances of approximately $775 million and $13 million at December 31, 2005 for the PPP and the SRP, respectively. In addition, in December 2005, the company amended the IBM Japan Pension Plan, which modified certain plan terms including a
change in the method of calculating benefits for certain participants at December 31, 2005. This amendment did not impact the 2005 net periodic cost/(income), however, the amendment resulted in a $561 million reduction to the PBO as of December 31, 2005.
assumptions used to determine plan Financial informationUnderlying both the measurement of the PBO and net periodic cost/(income) are actuarial valuations. These valuations use partici-pant-specific information such as salary, age and years of service, as well as certain assumptions, the most significant of which include estimates of discount rates, expected return on plan assets, rate of compensation increases, interest crediting rates and mortality rates. The company evaluates these assumptions, at a minimum, annually, and makes changes as necessary. The following table presents the assumptions which can have a material impact on net periodic cost/(income) and the year-end ben-efit obligations for significant retirement-related benefit plans:
nonpensionpostretirement significantdefinedBenefitpensionplans Benefitplans
U.s.plan non-U.s.plans U.s.plan
2006 2005 2004 2006 2005* 2004 2006 2005 2004
Weighted-average assumptions used to determine net periodic cost/(income) for the year ended December 31:Discount rate 5.50% 5.75% 6.00% 4.20% 4.70% 5.20% 5.50% 5.75% 6.00%
Expected long-term return on plan assets 8.00% 8.00% 8.00% 7.10% 7.10% 7.50% N/a N/A N/A
Rate of compensation increase 4.00% 4.00% 4.00% 3.00% 3.00% 2.90% N/a N/A N/A
Weighted-average assumptions used to determine benefit obligation at December 31:Discount rate 5.75% 5.50% 5.75% 4.40% 4.20% 4.70% 5.75% 5.50% 5.75%
Rate of compensation increase 4.00% 4.00% 4.00% 2.90% 3.00% 3.10% N/a N/A N/A
N/A—Notapplicable
* Reclassifiedtoconformwith2006presentation.
Notes to CoNsolidated FiNaNCial statemeNtsiNterNatioNal busiNess maChiNes CorporatioN aNd subsidiary CompaNies
106 2006AnnualReport
Consolidated statements ......................................................... 56
Notes ..................................................................................... 62
A-G.......................................................................................... 62
H-M.......................................................................................... 80
N-S........................................................................................... 88
T-X........................................................................................... 96
. T..Rental.Expense.and.Lease.Commitments........................ 96
. U..Stock-Based.Compensation............................................. 96
. V..Retirement-Related.Benefits.......................................... 100
. W..Segment.Information.................................................... 111
. X..Subsequent.Events......................................................... 115
Black
MAC
390 CG10

Black
MAC
390 CG10
disCouNt rate
The discount rate assumptions used for the retirement-related benefit plans accounting reflect the yields available on high-quality, fixed income debt instruments. For the U.S. discount rate assumptions, a portfolio of corporate bonds is constructed with maturities that match the expected timing of the benefit obligation payments. In the non-U.S., where markets for high-quality long-term bonds are not generally as well developed, long-term government bonds are used as a base, to which a credit spread is added to simulate corporate bond yields at these maturities in the jurisdiction of each plan, as the benchmark for developing the respective discount rates. For the PPP, the changes in discount rate assumptions impacted both net periodic cost/(income) and the PBO. For purposes of mea-suring the net periodic cost/(income) for the years ended December 31, 2006, 2005 and 2004, the changes in discount rate assumptions resulted in an increase in net periodic cost/(income) of $94 million, $90 million and $197 million, respectively. For purposes of measuring the PBO, the changes in discount rate assumptions resulted in a decrease in the PBO of $1,240 million at December 31, 2006 and an increase in the PBO of $1,272 million at December 31, 2005. For the significant non-U.S. defined benefit pension plans, the changes in discount rate assumptions at December 31, 2005 resulted in an increase in 2006 net periodic cost/(income) of $274 million. Changes in discount rate assumptions at December 31, 2004 had no material impact on 2005 net periodic cost/(income). For the U.S. nonpension postretirement benefit plan, the changes in discount rate assumptions had no material impact on net periodic cost/(income) for the years ended December 31, 2006, 2005 and 2004 and on the benefit obligation at December 31, 2006 and 2005.
expeCted loNg-term returNs oN plaN assets
Expected long-term returns on plan assets take into account long-term expectations for future returns and investment strategy. These rates of return are developed by the company in conjunction with external advisors, are calculated using an arithmetic average and are tested for reasonableness against the historical return average by asset category, usually over a 10-year period. The use of expected long-term returns on plan assets may result in recognized pension income that is greater or less than the actual returns of those plan assets in any given year. Over time, however, the expected long-term returns are designed to approximate the actual long-term returns and therefore result in a pattern of income and expense recognition that more closely matches the pattern of the services provided by the employees. Differences between actual and expected returns are recognized over five years in the expected return on plan assets line in net periodic cost/(income) and also as a component of unrecognized gains/losses, which is recog-nized over the service lives of the employees in the plan, provided such amounts exceed thresholds which are based upon the obligation or the value of plan assets, as provided by accounting standards.
For the PPP, the expected long-term return on plan assets of 8.0 percent remained constant for the years ended December 31, 2006 and 2005 and, consequently, had no incremental impact on net peri-odic cost/(income). For the material non-U.S. defined benefit pension plans, the changes in the expected long-term return on plan assets for the years ended December 31, 2006, 2005 and 2004 resulted in an increase in the net periodic cost/(income) of $18 million, $140 million and $54 million, respectively. For the U.S. nonpension postretirement benefit plan, the com-pany maintains a nominal, highly liquid trust fund balance to ensure payments are made timely. As a result, for the years ended December 31, 2006, 2005 and 2004, the expected long-term return on plan assets and the actual return on those assets were not material.
rate oF CompeNsatioN iNCreases aNd mortality rate
The rate of compensation increases and mortality rates are also signifi-cant assumptions used in the actuarial model for pension accounting. The rate of compensation increases is determined by the company, based upon its long-term plans for such increases. Mortality rate assumptions are based on life expectancy and death rates for different types of participants. Mortality rates are periodically updated based on actual experience. Changes to defined benefit pension plans mortality rate assumptions increased 2006 net periodic pension cost/(income) approximately $55 million and changes to the rate of compensation increases reduced 2006 net periodic pension cost/(income) approxi-mately $32 million. Changes to the rate of compensation increases or to mortality rate assumptions had no material impact on the net peri-odic cost/(income) for the years ended December 31, 2005 and 2004 and on the benefit obligation at December 31, 2006 and 2005.
iNterest CreditiNg rate
Benefits for certain participants in the PPP are calculated using a cash balance formula. An assumption underlying this formula is an interest crediting rate, which impacts both net periodic cost/(income) and the PBO. This assumption provides a basis for projecting the expected interest rate that participants will earn on the benefits that they are expected to receive in the following year and are based on the average from August to October of the one-year U.S. Treasury Constant Maturity yield plus one percent. For the PPP, the change in the interest crediting rate to 5.0 per-cent for the year ended December 31, 2006 from 3.1 percent for the year ended December 31, 2005 resulted in an increase to net periodic cost/(income) of $170 million. The change in the interest crediting rate to 3.1 percent for the year ended December 31, 2005 from 2.3 percent for the year ended December 31, 2004, resulted in an increase to net periodic cost/(income) of $55 million. The change in the inter-est crediting rate to 2.3 percent for the year ended December 31, 2004 from 2.7 percent for the year ended December 31, 2003, resulted in a decrease to net periodic cost/(income) of $20 million.
Notes to CoNsolidated FiNaNCial statemeNtsiNterNatioNal busiNess maChiNes CorporatioN aNd subsidiary CompaNies
107
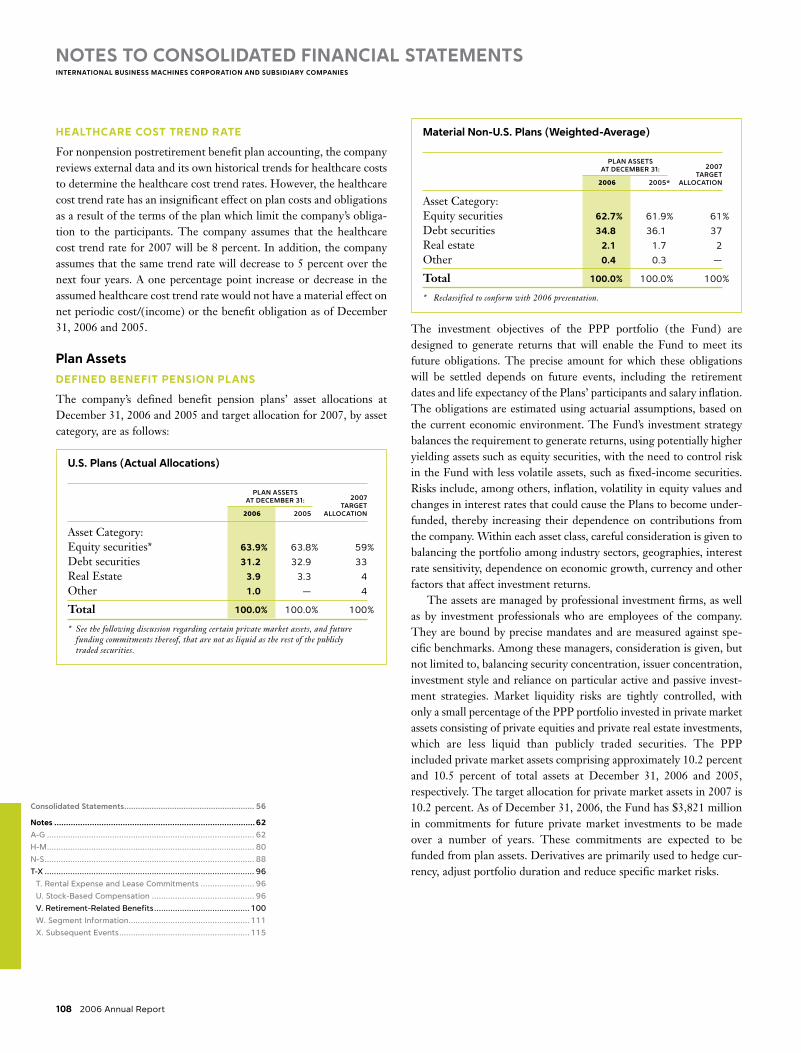
healthCare Cost treNd rate
For nonpension postretirement benefit plan accounting, the company reviews external data and its own historical trends for healthcare costs to determine the healthcare cost trend rates. However, the healthcare cost trend rate has an insignificant effect on plan costs and obligations as a result of the terms of the plan which limit the company’s obliga-tion to the participants. The company assumes that the healthcare cost trend rate for 2007 will be 8 percent. In addition, the company assumes that the same trend rate will decrease to 5 percent over the next four years. A one percentage point increase or decrease in the assumed healthcare cost trend rate would not have a material effect on net periodic cost/(income) or the benefit obligation as of December 31, 2006 and 2005.
plan assets
deFiNed beNeFit peNsioN plaNs
The company’s defined benefit pension plans’ asset allocations at December 31, 2006 and 2005 and target allocation for 2007, by asset category, are as follows:
u.s. plans (actual allocations)
planassets2007
atdecemBer31:
target 2006 2005 allocation
Asset Category:Equity securities* 63.9% 63.8% 59%
Debt securities 31.2 32.9 33
Real Estate 3.9 3.3 4
Other 1.0 — 4
Total 100.0% 100.0% 100%
* Seethefollowingdiscussionregardingcertainprivatemarketassets,andfuturefundingcommitmentsthereof,thatarenotasliquidastherestofthepubliclytradedsecurities.
Notes to CoNsolidated FiNaNCial statemeNtsiNterNatioNal busiNess maChiNes CorporatioN aNd subsidiary CompaNies
material Non-u.s. plans (Weighted-average)
planassets2007
atdecemBer31:
target 2006 2005* allocation
Asset Category:Equity securities 62.7% 61.9% 61%
Debt securities 34.8 36.1 37
Real estate 2.1 1.7 2
Other 0.4 0.3 —
Total 100.0% 100.0% 100%
* Reclassifiedtoconformwith2006presentation.
The investment objectives of the PPP portfolio (the Fund) are designed to generate returns that will enable the Fund to meet its future obligations. The precise amount for which these obligations will be settled depends on future events, including the retirement dates and life expectancy of the Plans’ participants and salary inflation. The obligations are estimated using actuarial assumptions, based on the current economic environment. The Fund’s investment strategy balances the requirement to generate returns, using potentially higher yielding assets such as equity securities, with the need to control risk in the Fund with less volatile assets, such as fixed-income securities. Risks include, among others, inflation, volatility in equity values and changes in interest rates that could cause the Plans to become under-funded, thereby increasing their dependence on contributions from the company. Within each asset class, careful consideration is given to balancing the portfolio among industry sectors, geographies, interest rate sensitivity, dependence on economic growth, currency and other factors that affect investment returns. The assets are managed by professional investment firms, as well as by investment professionals who are employees of the company. They are bound by precise mandates and are measured against spe-cific benchmarks. Among these managers, consideration is given, but not limited to, balancing security concentration, issuer concentration, investment style and reliance on particular active and passive invest-ment strategies. Market liquidity risks are tightly controlled, with only a small percentage of the PPP portfolio invested in private market assets consisting of private equities and private real estate investments, which are less liquid than publicly traded securities. The PPP included private market assets comprising approximately 10.2 percent and 10.5 percent of total assets at December 31, 2006 and 2005, respectively. The target allocation for private market assets in 2007 is 10.2 percent. As of December 31, 2006, the Fund has $3,821 million in commitments for future private market investments to be made over a number of years. These commitments are expected to be funded from plan assets. Derivatives are primarily used to hedge cur-rency, adjust portfolio duration and reduce specific market risks.
108 2006AnnualReport
Consolidated statements ......................................................... 56
Notes ..................................................................................... 62
A-G.......................................................................................... 62
H-M.......................................................................................... 80
N-S........................................................................................... 88
T-X........................................................................................... 96
. T..Rental.Expense.and.Lease.Commitments........................ 96
. U..Stock-Based.Compensation............................................. 96
. V..Retirement-Related.Benefits.......................................... 100
. W..Segment.Information.................................................... 111
. X..Subsequent.Events......................................................... 115
Black
MAC
390 CG10

Black
MAC
390 CG10
Equity securities include IBM common stock in the amounts of $159 million (0.3 percent of total PPP plan assets) at December 31, 2006 and $139 million (0.3 percent of total PPP plan assets) at December 31, 2005. Outside the U.S., the investment objectives are similar, subject to local regulations. In some countries, a higher percentage allocation to fixed income securities is required. In others, the responsibility for managing the investments typically lies with a board that may include up to 50 percent of members elected by employees and retirees. This can result in slight differences compared with the strategies previously described. Generally, these non-U.S. funds do not invest in illiquid assets, such as private equities, and their use of derivatives is usually limited to currency hedging, adjusting portfolio durations and reduc-ing specific market risks. There was no significant change in the investment strategies of these plans during either 2006 or 2005.
expected Contributions
deFiNed beNeFit peNsioN plaNs
It is the company’s general practice to fund amounts for pensions suf-ficient to meet the minimum requirements set forth in applicable employee benefits laws and local tax laws. From time to time, the company contributes additional amounts as it deems appropriate. The company contributed approximately $1,769 million and $561 million in cash to the material non-U.S. plans during the years ended December 31, 2006 and 2005, respectively. During the year ended December 31, 2005, the company contributed approximately $1,715 million in cash to the qualified portion of the PPP. In 2007, the company is not legally required to make any contribu-tions to the PPP. However, depending on market conditions, or other factors, the company may elect to make discretionary contributions to the qualified portion of the PPP during the year.
Notes to CoNsolidated FiNaNCial statemeNtsiNterNatioNal busiNess maChiNes CorporatioN aNd subsidiary CompaNies
109
The Pension Protection Act of 2006 (the Act), enacted into law in 2006, is a comprehensive reform package that, among other provisions, increases pension funding requirements for certain U.S. defined benefit plans, provides guidelines for measuring pension plan assets and pension obligations for funding purposes and raises tax deduction limits for con-tributions to retirement-related benefit plans. The additional funding requirements by the Act apply to plan years beginning after December 31, 2007. The adoption of the Act is not expected to have a material effect on the company’s minimum mandatory contributions to its PPP. In 2007, the company estimates contributions to its non-U.S. plans to be approximately $560 million, which will be mainly contrib-uted to defined benefit pension plans in Germany, the Netherlands, Spain, Switzerland, Sweden and the United Kingdom. These 2007 contributions represent legally mandated minimum contributions to the company’s non-U.S. plans. The company could elect to contribute more than the legally mandated amount based on market conditions or other factors.
NoNpeNsioN postretiremeNt beNeFit plaNs
The U.S. nonpension postretirement benefit plan is reviewed in order to determine the amount of company contributions, if any. In 2007, the company expects its contributions to the U.S. nonpension postretirement benefit plan will approximate the total expected ben-efit payments.
expected benefit payments
deFiNed beNeFit peNsioN plaN expeCted paymeNts
The following table presents the total expected benefit payments to defined benefit pension plan participants. These payments have been estimated based on the same assumptions used to measure the plans’ PBO at December 31, 2006 and include benefits attributable to esti-mated future compensation increases.
(Dollars in millions)
total qUalified non-qUalified qUalified non-qUalified expected U.s.plan U.s.plan non-U.s.plans non-U.s.plans Benefit payments payments payments payments payments
2007 $ 3,219* $ 78 $1,636 $ 310 $ 5,243
2008 3,050 80 1,684 312 5,126
2009 3,073 82 1,742 307 5,204
2010 3,126 85 1,780 308 5,299
2011 3,168 89 1,832 307 5,396
2012-2016 16,453 482 9,756 1,577 28,268
* The2007totalexpectedbenefitpaymentstodefinedbenefitpensionplanparticipantsofthequalifiedportionofthePPPincludeapproximately$160millionofthe$320millionrelatedtothePPPlawsuitsettlement;theremainingsettlementamountwillbespreadovera10-yearperiodstartingin2007.SeenoteO,“ContingenciesandCommitments,”onpage89forfurtherinformation.
The 2007 expected benefit payments to defined benefit pension plan participants not covered by the respective plan assets represent a component of Compensation and benefits, within Current liabilities, in the Consolidated Statement of Financial Position.

Notes to CoNsolidated FiNaNCial statemeNtsiNterNatioNal busiNess maChiNes CorporatioN aNd subsidiary CompaNies
110 2006AnnualReport
NoNpeNsioN postretiremeNt beNeFit plaN expeCted paymeNts
The following table reflects the total expected benefit payments to nonpension postretirement benefit plan participants, as well as the expected receipt of the company’s share of the Medicare subsidy described below. These payments have been estimated based on the same assumptions used to measure the company’s benefit obligation at year end.
(Dollars in millions)
less:U.s.plan total expected expected U.s.plan medicare Benefit payments sUBsidy payments
2007 $ 518 $28 $ 490
2008 504 33 471
2009 492 37 455
2010 482 40 442
2011 473 42 431
2012-2016 2,276 — 2,276
The 2007 expected benefit payments to nonpension postretirement benefit plan participants not covered by the plan assets represent a component of Compensation and benefits, within Current liabilities, in the Consolidated Statement of Financial Position.
mediCare presCriptioN drug aCtin connection with the medicare prescription drug improvement and modernization act of 2003, the company is expected to receive a federal subsidy of approximately $340 million to subsidize the prescription drug coverage provided by the U.S. nonpension postre-tirement benefit plan over a period of approximately six years beginning in 2006. Approximately $204 million of the subsidy will be used by the company to reduce its obligation and expense related to the U.S. nonpension postretirement benefit plan. The company will contrib-ute the remaining subsidy of $136 million to the plan in order to reduce contributions required by the participants. The company received $27 million of the subsidy during the year ended December 31, 2006, which was utilized to reduce the company contributions for prescription drug-related coverage.
In accordance with the provision of FASB Staff Position FSP FAS 106-2, “Accounting and Disclosure Requirements Related to the Medicare Prescription Drug, Improvement and Modernization Act of 2003,” the company has included the impact of its portion of the subsidy in the determination of APBO for the U.S. nonpension postretirement benefit plan for the years ended December 31, 2006 and 2005. The impact of the subsidy resulted in a reduction in the benefit obligation of approximately $154 million and $188 million, at December 31, 2006 and 2005, respectively, and a reduction of net periodic cost/(income) of $24 million for the year ended December 31, 2006 and there was no reduction for the year ended December 31, 2005.
other plaN iNFormatioNAt December 31, 2005 the company elected not to fund certain of the company’s non-U.S. plans that had unfunded positions to the accumu-lated benefit obligation (ABO) level, which required the company to record a minimum pension liability. As of December 31, 2005, the company recorded a reduction in the minimum pension liability of $1,726 million and an increase to stockholders’ equity of $436 million. The differences between these amounts and the amounts included in the Consolidated Statement of Financial Position and Consolidated Statement of Stockholders’ Equity relate to the non-material plans. This accounting transaction did not impact 2005 net periodic cost/(income). The minimum pension liability at December 31, 2006 of $2,348 million was eliminated upon adoption of SFAS No. 158. The table on page 111 presents information for significant pen-sion plans with an ABO in excess of plan assets. For a more detailed presentation of the funded status of the company’s significant pension plans, see the table on page 102.
Consolidated statements ......................................................... 56
Notes ..................................................................................... 62
A-G.......................................................................................... 62
H-M.......................................................................................... 80
N-S........................................................................................... 88
T-X........................................................................................... 96
. T..Rental.Expense.and.Lease.Commitments........................ 96
. U..Stock-Based.Compensation............................................. 96
. V..Retirement-Related.Benefits.......................................... 100
. W..Segment.Information.................................................... 111
. X..Subsequent.Events......................................................... 115
Black
MAC
390 CG10

Black
MAC
390 CG10
Notes to CoNsolidated FiNaNCial statemeNtsiNterNatioNal busiNess maChiNes CorporatioN aNd subsidiary CompaNies
111
(Dollars in millions)
2006 2005
benefit BenefitatdecemBer31: obligation planassets oBligation planassets
Plans with PBO in excess of plan assets $15,181 $ 7,866 $26,354 $17,241
Plans with ABO in excess of plan assets 14,027 7,093 24,986 17,241
Plans with assets in excess of PBO 72,111 82,679 58,031 62,450
W. segmeNt iNFormatioNthe company uses business insight and its broad range of it capabilities to create client- and industry-specific information solutions. The company operates primarily in a single industry using several segments that create value by offering solutions that include, either singularly or in some combination, services, software, hardware and financing. Organizationally, the company’s major operations comprise a Global Technology Services segment; a Global Business Services segment; a Software segment; a predominantly hardware product seg-ment—Systems and Technology Group; and a Global Financing segment. The segments represent components of the company for which separate financial information is available that is utilized on a regular basis by the chief executive officer in determining how to allocate the company’s resources and evaluate performance. The seg-ments are determined based on several factors, including client base, homogeneity of products, technology, delivery channels and similar economic characteristics. Information about each segment’s business and the products and services that generate each segment’s revenue is located in the “Description of Business” section of the Management Discussion on page 19, and “Segment Details,” on pages 29 to 32. In 2004, the company combined the Systems Group segment and the Technology Group segment and formed the Systems and Technol-ogy Group segment. In the second quarter of 2005, the company sold its Personal Computing business which was previously a part of the Personal Systems Group. The two remaining units of the Personal Systems Group, Retail Store Solutions and Printing Systems, were combined with the Systems and Technology Group. Personal Computing Division financial results are displayed as part of the segment disclo-sures, in a manner consistent with the segment disclosures. In the first quarter of 2006, the company made changes to its management system. This included the transfer of products and ser-vices from the former Enterprise Investments segment to other reportable segments and the separation of the prior Global Services segment into the two new reportable segments: Global Technology Services and Global Business Services. In addition to the creation of two new reportable segments, there are two primary differences to previously reported information. First, the Business Transformation Outsourcing (BTO) business was aligned within the Global
Technology Services segment. This brought the company’s outsourc-ing businesses together, and drives synergies within the company’s offerings and delivery capabilities. U.S. Federal BTO remained with the U.S. Federal business within Global Business Services, to con-tinue to leverage the synergy in the company’s Federal offerings and delivery capabilities. Secondly, the Application Management Services (AMS) business was consolidated under the Global Business Services segment. As a result, the AMS business for custom and legacy applica-tions previously reported in Strategic Outsourcing revenue is now included in Global Business Services. Previously reported segment information has been restated for all periods presented to reflect those changes in the company’s reportable segments. Segment revenue and pre-tax income include transactions between the segments that are intended to reflect an arm’s-length transfer price. Hardware and software that is used by the Global Technology Services segment in outsourcing engagements is primarily sourced internally from the Systems and Technology Group and Software seg-ments. For the internal use of IT services, the Global Technology Services segment and the Global Business Services segment recover cost, as well as a reasonable fee, reflecting the arm’s-length value of providing the services. The Global Services segments enter into arm’s-length leases and loans at prices equivalent to market rates with the Global Financing segment to facilitate the acquisition of equip-ment used in services engagements. All internal transaction prices are reviewed annually, and reset if appropriate. The company uses shared resources concepts to realize economies of scale and efficient use of resources. As a result, a considerable amount of expense is shared by all of the company’s segments. This expense represents sales coverage, marketing and support functions such as Accounting, Treasury, Procurement, Legal, Human Resources and Billing and Collections. Where practical, shared expenses are allocated based on measurable drivers of expense, e.g., headcount. When a clear and measurable driver cannot be identified, shared expenses are allocated on a financial basis that is consistent with the company’s management system; e.g., advertising is allocated based on the gross profits of the segments. The unallocated corporate amounts arising from certain divestitures, indirect infrastructure reductions, miscellaneous tax items and the unallocated corporate expense pool are recorded in net income but are not allocated to the segments.

Notes to CoNsolidated FiNaNCial statemeNtsiNterNatioNal busiNess maChiNes CorporatioN aNd subsidiary CompaNies
112 2006AnnualReport
maNagemeNt system segmeNt VieW(Dollars in millions)
gloBalservicessegments
gloBal gloBal systemsand personal technology BUsiness technology gloBal compUting totalfortheyearendeddecemBer31: services services groUp software financing division segments
2006:External revenue $ 32,322 $1 5,969 $ 21,970 $ 18,161 $ 2,365 $ — $ 90,787
Internal revenue 1,763 1,373 1,168 2,249 1,527 — 8,080
Total revenue $ 34,086 $ 17,341 $ 23,138 $ 20,409 $ 3,892 $ — $ 98,867
Pre-tax income/(loss) $ 3,288 $ 1,706 $ 1,739 $ 5,493 $ 1,455 $ — $ 13,682
Revenue year-to-year change 1.4% 0.6% 4.7% 8.5% (0.4)% Nm 0.3%
Pre-tax income year-to-year change 25.6% 116.9% (7.6)% 14.9% (8.1)% Nm 19.1%
Pre-tax income margin 9.6% 9.8% 7.5% 26.9% 37.4% Nm 13.8%
2005:External revenue $31,501 $15,906 $20,981 $16,830 $2,401 $ 2,876 $ 90,495
Internal revenue 2,102 1,339 1,118 1,979 1,506 33 8,077
Total revenue $33,603 $17,245 $22,099 $18,809 $3,907 $ 2,909 $ 98,572
Pre-tax income/(loss) $ 2,619 $ 786 $ 1,883 $ 4,779 $1,583 $ (165) $ 11,485
Revenue year-to-year change 3.5% (1.9)% 4.9% 4.8% 0.3% NM (5.0)%
Pre-tax income year-to-year change (10.9)% (28.9)% (7.9)% 19.1% 8.6% NM (0.6)%
Pre-tax income margin 7.8% 4.6% 8.5% 25.4% 40.5% NM 11.7%
2004:External revenue $30,082 $16,201 $19,973 $16,141 $2,607 $10,737 $ 95,741
Internal revenue 2,376 1,373 1,095 1,813 1,287 129 8,073
Total revenue $32,458 $17,574 $21,068 $17,954 $3,894 $10,866 $103,814
Pre-tax income/(loss) $ 2,940 $ 1,105 $ 2,045 $ 4,014 $1,458 $ (10) $ 11,552
Revenue year-to-year change 11.3% 3.0% 8.6% 6.7% (5.6)% 14.4% 8.1%
Pre-tax income year-to-year change 8.0% (2.0)% 27.1% 26.3% 26.6% 97.1% 22.4%
Pre-tax income margin 9.1% 6.3% 9.7% 22.4% 37.4% (0.1)% 11.1%
NM—Notmeaningful
The following tables reflect the results of continuing operations of the segments and the Personal Computing Division consistent with the company’s management system. These results are not neces-sarily a depiction that is in conformity with GAAP; e.g., employee retirement plan costs are developed using actuarial assumptions on a country-by-country basis and allocated to the segments based on
headcount. Different amounts could result if actuarial assumptions that are unique to the segment were used. Performance measurement is based on income before income taxes (pre-tax income). These results are used, in part, by management, both in evaluating the per-formance of, and in allocating resources to, each of the segments.
Consolidated statements ......................................................... 56
Notes ..................................................................................... 62
A-G.......................................................................................... 62
H-M.......................................................................................... 80
N-S........................................................................................... 88
T-X........................................................................................... 96
. T..Rental.Expense.and.Lease.Commitments........................ 96
. U..Stock-Based.Compensation............................................. 96
. V..Retirement-Related.Benefits.......................................... 100
. W..Segment.Information.................................................... 111
. X..Subsequent.Events......................................................... 115
Black
MAC
390 CG10

Black
MAC
390 CG10
Notes to CoNsolidated FiNaNCial statemeNtsiNterNatioNal busiNess maChiNes CorporatioN aNd subsidiary CompaNies
113
reconciliations of ibm as reported
(Dollars in millions)
fortheyearendeddecemBer31: 2006 2005 2004
Revenue:Total reportable segments $98,867 $98,572 $103,814
Other revenue and adjustments 637 639 552
Elimination of internal revenue (8,080) (8,077) (8,073)
Total IBM consolidated revenue $91,424 $91,134 $ 96,293
(Dollars in millions)
fortheyearendeddecemBer31: 2006 2005 2004
Pre-tax income:Total reportable segments $13,682 $11,485 $ 11,552
Elimination of internal transactions (171) (168) (106)
Unallocated corporate amounts (194) 909 (777)
Total IBM consolidated pre-tax income from continuing operations $13,317 $12,226 $10,669
Within pre-tax income from continuing operations, unallocated cor-porate amounts in 2005 include the gain from the sale of the company’s Personal Computing business to Lenovo, the impact of the legal settlement with Microsoft Corporation, pension curtailment related charges and unallocated charges related to the company’s incremental restructuring actions in the second quarter. The year 2004 includes charges for the partial settlement of certain legal claims against the company’s PPP and charges for certain litigation-related expenses.
immaterial itemsinvestment in equity alliances and equity alliance gains/(losses)The investments in equity alliances and the resulting gains and ( losses) from these investments that are attributable to the segments do not have a material effect on the financial position or the financial results of the segments.
segmeNt assets aNd other itemsglobal technology services assets are primarily accounts receiv-able, plant, property and equipment including those associated with the segment’s outsourcing business, goodwill, acquired intangible assets, deferred services arrangement transition costs and maintenance parts inventory. Global Business Services assets are primarily goodwill and accounts receivable. Software segment assets are mainly goodwill, acquired intangible assets, accounts receivable, plant, property and equipment and investment in capitalized software. The assets of the Systems and Technology Group segment and the Personal Computing Division are primarily plant, property and equipment and manufactur-ing inventory. The assets of the Global Financing segment are primarily financing receivables and fixed assets under operating leases. To accomplish the efficient use of the company’s space and equip-ment, it usually is necessary for several segments to share plant, property and equipment assets. Where assets are shared, landlord ownership of the assets is assigned to one segment and is not allocated to each user segment. This is consistent with the company’s manage-ment system and is reflected accordingly in the table on page 114. In those cases, there will not be a precise correlation between segment pre-tax income and segment assets. Similarly, the depreciation amounts reported by each segment are based on the assigned landlord ownership and may not be consistent with the amounts that are included in the segments’ pre-tax income. The amounts that are included in pre-tax income reflect occupancy charges from the landlord segment and are not specifically identified by the management reporting system. Capital expenditures that are reported by each segment also are consistent with the landlord owner-ship basis of asset assignment. The Global Financing segment amounts on page 114 for Interest income and Cost of Global Financing interest expense reflect the interest income and interest expense associated with the Global Financing business, including the intercompany financing activities discussed on page 49, as well as the income from the investment in cash and marketable securities. The explanation of the difference between Cost of Global Financing and Interest expense for segment presentation versus presentation in the Consolidated Statement of Earnings is included on page 52 of the Management Discussion.

maNagemeNt system segmeNt VieW(Dollars in millions)
gloBalservicessegments
gloBal gloBal systemsand personal technology BUsiness technology gloBal compUting totalfortheyearendeddecemBer31: services services groUp software financing division segments
2006:Assets $ 14,483 $ 6,517 $ 7,924 $ 9,262 $ 33,945 $ — $ 72,130
Depreciation/amortization of intangibles 1,575 136 1,024 632 1,691 — 5,058
Capital expenditures/investments in intangibles 1,714 43 777 423 2,514 — 5,470
Interest income — — — — 2,265 — 2,265
Interest expense — — — — 792 — 792
2005:Assets $11,809 $6,229 $8,304 $6,485 $31,165 $ — $63,992
Depreciation/amortization of intangibles 1,663 160 1,272 672 1,923 17 5,707
Capital expenditures/investments in intangibles 1,635 21 642 389 2,273 18 4,978
Interest income — — — — 2,183 — 2,183
Interest expense — — — — 617 — 617
2004:Assets $12,477 $6,647 $8,952 $5,280 $34,589 $1,660 $69,605
Depreciation/amortization of intangibles 1,573 141 1,189 658 2,013 76 5,650
Capital expenditures/investments in intangibles 1,901 52 979 440 2,229 60 5,661
Interest income — — — — 2,355 — 2,355
Interest expense — — — — 584 — 584
Notes to CoNsolidated FiNaNCial statemeNtsiNterNatioNal busiNess maChiNes CorporatioN aNd subsidiary CompaNies
114 2006AnnualReport
Consolidated statements ......................................................... 56
Notes ..................................................................................... 62
A-G.......................................................................................... 62
H-M.......................................................................................... 80
N-S........................................................................................... 88
T-X........................................................................................... 96
. T..Rental.Expense.and.Lease.Commitments........................ 96
. U..Stock-Based.Compensation............................................. 96
. V..Retirement-Related.Benefits.......................................... 100
. W..Segment.Information.................................................... 111
. X..Subsequent.Events......................................................... 115
Black
MAC
390 CG10
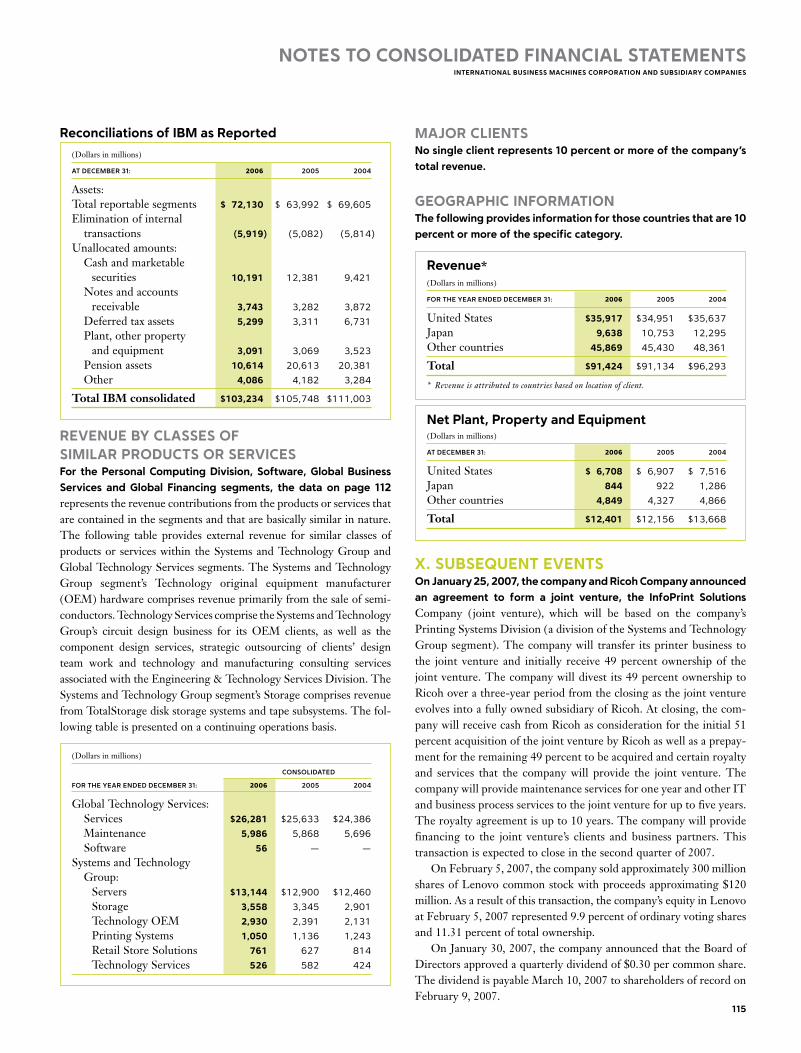
Black
MAC
390 CG10
Notes to CoNsolidated FiNaNCial statemeNtsiNterNatioNal busiNess maChiNes CorporatioN aNd subsidiary CompaNies
115
reconciliations of ibm as reported
(Dollars in millions)
atdecemBer31: 2006 2005 2004
Assets:Total reportable segments $ 72,130 $ 63,992 $ 69,605
Elimination of internal transactions (5,919) (5,082) (5,814)
Unallocated amounts: Cash and marketable securities 10,191 12,381 9,421
Notes and accounts receivable 3,743 3,282 3,872
Deferred tax assets 5,299 3,311 6,731
Plant, other property and equipment 3,091 3,069 3,523
Pension assets 10,614 20,613 20,381
Other 4,086 4,182 3,284
Total IBM consolidated $103,234 $105,748 $111,003
reVeNue by Classes oF similar produCts or serViCesFor the personal Computing division, software, global business services and global Financing segments, the data on page 112 represents the revenue contributions from the products or services that are contained in the segments and that are basically similar in nature. The following table provides external revenue for similar classes of products or services within the Systems and Technology Group and Global Technology Services segments. The Systems and Technology Group segment’s Technology original equipment manufacturer (OEM) hardware comprises revenue primarily from the sale of semi-conductors. Technology Services comprise the Systems and Technology Group’s circuit design business for its OEM clients, as well as the component design services, strategic outsourcing of clients’ design team work and technology and manufacturing consulting services associated with the Engineering & Technology Services Division. The Systems and Technology Group segment’s Storage comprises revenue from TotalStorage disk storage systems and tape subsystems. The fol-lowing table is presented on a continuing operations basis.
(Dollars in millions)
consolidated
fortheyearendeddecemBer31: 2006 2005 2004
Global Technology Services: Services $26,281 $25,633 $24,386
Maintenance 5,986 5,868 5,696
Software 56 — —
Systems and Technology Group: Servers $13,144 $12,900 $12,460
Storage 3,558 3,345 2,901
Technology OEM 2,930 2,391 2,131
Printing Systems 1,050 1,136 1,243
Retail Store Solutions 761 627 814
Technology Services 526 582 424
major ClieNtsNo single client represents 10 percent or more of the company’s total revenue.
geographiC iNFormatioN the following provides information for those countries that are 10 percent or more of the specific category.
revenue*(Dollars in millions)
fortheyearendeddecemBer31: 2006 2005 2004
United States $35,917 $34,951 $35,637
Japan 9,638 10,753 12,295
Other countries 45,869 45,430 48,361
Total $91,424 $91,134 $96,293
* Revenueisattributedtocountriesbasedonlocationofclient.
Net plant, property and equipment(Dollars in millions)
atdecemBer31: 2006 2005 2004
United States $ 6,708 $ 6,907 $ 7,516
Japan 844 922 1,286
Other countries 4,849 4,327 4,866
Total $12,401 $12,156 $13,668
x. subsequeNt eVeNtson january 25, 2007, the company and ricoh Company announced an agreement to form a joint venture, the infoprint solutions Company ( joint venture), which will be based on the company’s Printing Systems Division (a division of the Systems and Technology Group segment). The company will transfer its printer business to the joint venture and initially receive 49 percent ownership of the joint venture. The company will divest its 49 percent ownership to Ricoh over a three-year period from the closing as the joint venture evolves into a fully owned subsidiary of Ricoh. At closing, the com-pany will receive cash from Ricoh as consideration for the initial 51 percent acquisition of the joint venture by Ricoh as well as a prepay-ment for the remaining 49 percent to be acquired and certain royalty and services that the company will provide the joint venture. The company will provide maintenance services for one year and other IT and business process services to the joint venture for up to five years. The royalty agreement is up to 10 years. The company will provide financing to the joint venture’s clients and business partners. This transaction is expected to close in the second quarter of 2007. On February 5, 2007, the company sold approximately 300 million shares of Lenovo common stock with proceeds approximating $120 million. As a result of this transaction, the company’s equity in Lenovo at February 5, 2007 represented 9.9 percent of ordinary voting shares and 11.31 percent of total ownership. On January 30, 2007, the company announced that the Board of Directors approved a quarterly dividend of $0.30 per common share. The dividend is payable March 10, 2007 to shareholders of record on February 9, 2007.

FiVe-year ComparisoN oF seleCted FiNaNCial dataiNterNatioNal busiNess maChiNes CorporatioN aNd subsidiary CompaNies
116 2006AnnualReport
(Dollars in millions except per share amounts)
fortheyear: 2006 2005 2004 2003 2002
Revenue $91,424 $91,134 $96,293 $89,131 $81,186
Income from continuing operations $ 9,416 $ 7,994 $ 7,497 $ 6,588 $ 4,156
Income/(loss) from discontinued operations 76 (24) (18) (30) (1,780)
Income before cumulative effect of change in accounting principle 9,492 7,970 7,479 6,558 2,376
Cumulative effect of change in accounting principle* — (36) — — —
Net income $ 9,492 $ 7,934 $ 7,479 $ 6,558 $ 2,376
Earnings/(loss) per share of common stock: Assuming dilution: Continuing operations $ 6.06 $ 4.91 $ 4.39 $ 3.76 $ 2.43
Discontinued operations 0.05 (0.01) (0.01) (0.02) (1.04)
Before cumulative effect of change in accounting principle 6.11 4.90 4.38 3.74 1.39
Cumulative effect of change in accounting principle* — (0.02) — — —
Total $ 6.11 $ 4.87 $ 4.38 $ 3.74 $ 1.39
Basic: Continuing operations $ 6.15 $ 4.99 $ 4.48 $ 3.83 $ 2.44
Discontinued operations 0.05 (0.02) (0.01) (0.02) (1.05)
Before cumulative effect of change in accounting principle 6.20 4.98 4.47 3.81 1.40
Cumulative effect of change in accounting principle* — (0.02) — — —
Total $ 6.20 $ 4.96 $ 4.47 $ 3.81 $ 1.40
Cash dividends paid on common stock $ 1,683 $ 1,250 $ 1,174 $ 1,085 $ 1,005
Per share of common stock 1.10 0.78 0.70 0.63 0.59
Investment in plant, rental machines and other property $ 4,362 $ 3,842 $ 4,368 $ 4,398 $ 5,022
Return on stockholders’ equity 30.8% 24.5% 24.4% 24.5% 9.8%
atendofyear: 2006 2005 2004 2003 2002
Total assets $103,234 $105,748 $111,003 $106,021 $97,814
Net investment in plant, rental machines and other property 14,440 13,756 15,175 14,689 14,440
Working capital 4,569 10,509 7,357 7,205 6,927
Total debt 22,682 22,641 22,927 23,632 26,017
Stockholders’ equity 28,506 33,098 31,688 29,531 24,112
* ReflectsimplementationofFASBInterpretationNo.47.SeenoteB,“AccountingChanges,”onpage72foradditionalinformation.
Black
MAC
390 CG10
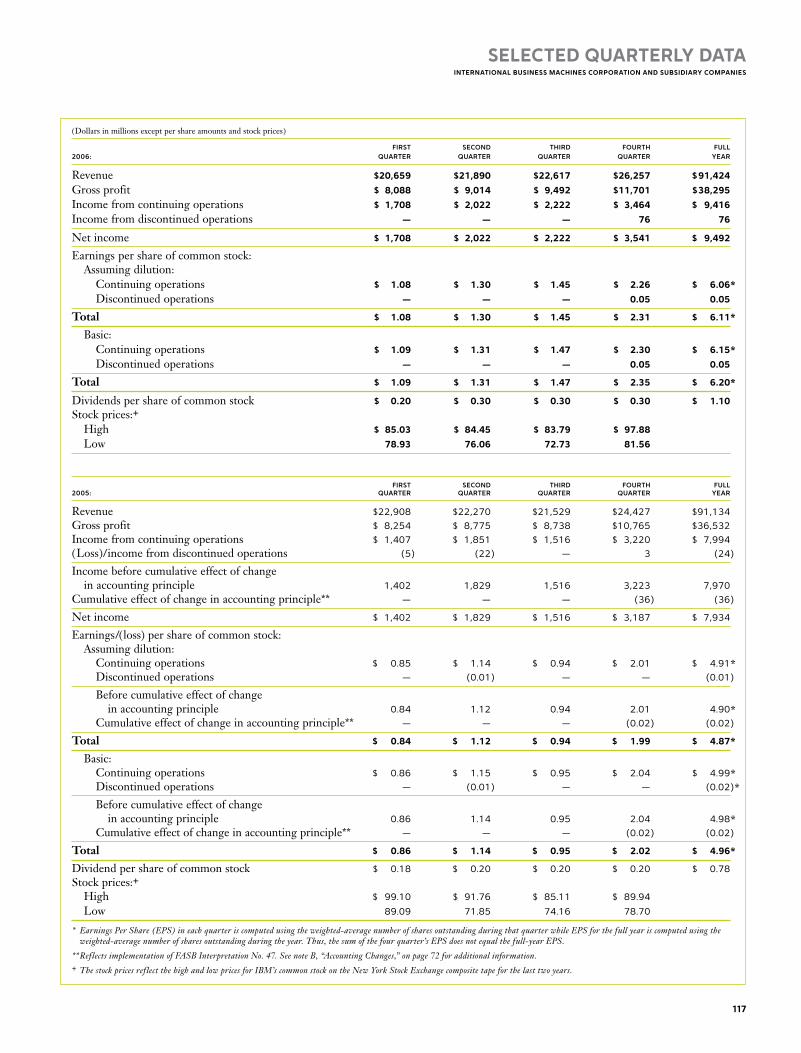
Black
MAC
390 CG10
(Dollars in millions except per share amounts and stock prices)
first second third foUrth fUll2006: qUarter qUarter qUarter qUarter year
Revenue $20,659 $21,890 $22,617 $26,257 $91,424
Gross profit $ 8,088 $ 9,014 $ 9,492 $11,701 $ 38,295
Income from continuing operations $ 1,708 $ 2,022 $ 2,222 $ 3,464 $ 9,416
Income from discontinued operations — — — 76 76
Net income $ 1,708 $ 2,022 $ 2,222 $ 3,541 $ 9,492
Earnings per share of common stock: Assuming dilution: Continuing operations $ 1.08 $ 1.30 $ 1.45 $ 2.26 $ 6.06*
Discontinued operations — — — 0.05 0.05
Total $ 1.08 $ 1.30 $ 1.45 $ 2.31 $ 6.11*
Basic: Continuing operations $ 1.09 $ 1.31 $ 1.47 $ 2.30 $ 6.15*
Discontinued operations — — — 0.05 0.05
Total $ 1.09 $ 1.31 $ 1.47 $ 2.35 $ 6.20*
Dividends per share of common stock $ 0.20 $ 0.30 $ 0.30 $ 0.30 $ 1.10
Stock prices:+ High $ 85.03 $ 84.45 $ 83.79 $ 97.88
Low 78.93 76.06 72.73 81.56
first second third foUrth fUll2005: qUarter qUarter qUarter qUarter year
Revenue $22,908 $22,270 $21,529 $24,427 $91,134
Gross profit $ 8,254 $ 8,775 $ 8,738 $10,765 $36,532
Income from continuing operations $ 1,407 $ 1,851 $ 1,516 $ 3,220 $ 7,994
(Loss)/income from discontinued operations (5) (22) — 3 (24)
Income before cumulative effect of change in accounting principle 1,402 1,829 1,516 3,223 7,970
Cumulative effect of change in accounting principle** — — — (36) (36)
Net income $ 1,402 $ 1,829 $ 1,516 $ 3,187 $ 7,934
Earnings/(loss) per share of common stock: Assuming dilution: Continuing operations $ 0.85 $ 1.14 $ 0.94 $ 2.01 $ 4.91*
Discontinued operations — (0.01) — — (0.01)
Before cumulative effect of change in accounting principle 0.84 1.12 0.94 2.01 4.90*
Cumulative effect of change in accounting principle** — — — (0.02) (0.02)
Total $ 0.84 $ 1.12 $ 0.94 $ 1.99 $ 4.87*
Basic: Continuing operations $ 0.86 $ 1.15 $ 0.95 $ 2.04 $ 4.99*
Discontinued operations — (0.01) — — (0.02)*
Before cumulative effect of change in accounting principle 0.86 1.14 0.95 2.04 4.98*
Cumulative effect of change in accounting principle** — — — (0.02) (0.02)
Total $ 0.86 $ 1.14 $ 0.95 $ 2.02 $ 4.96*
Dividend per share of common stock $ 0.18 $ 0.20 $ 0.20 $ 0.20 $ 0.78
Stock prices:+ High $ 99.10 $ 91.76 $ 85.11 $ 89.94
Low 89.09 71.85 74.16 78.70
* EarningsPerShare(EPS)ineachquarteriscomputedusingtheweighted-averagenumberofsharesoutstandingduringthatquarterwhileEPSforthefullyeariscomputedusingtheweighted-averagenumberofsharesoutstandingduringtheyear.Thus,thesumofthefourquarter’sEPSdoesnotequalthefull-yearEPS.
**ReflectsimplementationofFASBInterpretationNo.47.SeenoteB,“AccountingChanges,”onpage72foradditionalinformation.+ ThestockpricesreflectthehighandlowpricesforIBM’scommonstockontheNewYorkStockExchangecompositetapeforthelasttwoyears.
seleCted quarterly dataiNterNatioNal busiNess maChiNes CorporatioN aNd subsidiary CompaNies
117

perFormaNCe graphsiNterNatioNal busiNess maChiNes CorporatioN aNd subsidiary CompaNies
118 2006AnnualReport
Black
MAC
390 CG10 2718 129
‘01 ‘02 ‘03 ‘04 ‘05 ‘06
160
140
120
100
80
60
40
20
0
DO
LLA
RS
(USD
)
‘96 ‘97 ‘98 ‘99 ‘00 ‘01 ‘02 ‘03 ‘04 ‘05 ‘06
450
400
350
300
250
200
150
100
50
0
DO
LLA
RS
(USD
)
‘05 ‘06
140
130
120
110
100
90
80
DO
LLA
RS
(USD
)
ComparisoN oF oNe- FiVe- aNd teN-year CumulatiVe total returN For ibm, s&p 500 stoCK iNdex aNd s&p iNFormatioN teChNology iNdex
The following graphs compare the one- five- and ten-year cumulative total returns for IBM common stock with the comparable cumulative return of certain Standard & Poor’s (S&P) indices. Due to the fact that IBM is a company included in the S&P 500 Stock Index, the SEC’s rules require the use of that index for the required five-year graph. Under those rules, the second index used for comparison may be a
published industry or line-of-business index. The S&P 500 Information Technology Index is such an index. Each graph assumes $100 invested on December 31 (of the initial year shown in the graph) in IBM com-mon stock and $100 invested on the same date in each of the S&P indices. The comparisons assume that all dividends are reinvested.
2005 2006
l IBM Common Stock $100.00 $119.77
l S & P 500 Index 100.00 115.80
l S & P Information Technology Index 100.00 108.42
oNe-year

119
Black
MAC
390 CG10 2718 129
2001 2002 2003 2004 2005 2006
l IBM Common Stock $100.00 $64.53 $ 77.76 $ 83.35 $ 70.15 $ 84.02
l S & P 500 Index 100.00 77.90 100.25 111.15 116.61 135.03
l S & P Information Technology Index 100.00 62.59 92.14 94.50 95.44 103.47
‘01 ‘02 ‘03 ‘04 ‘05 ‘06
160
140
120
100
80
60
40
20
0
DO
LLA
RS
(USD
)
‘96 ‘97 ‘98 ‘99 ‘00 ‘01 ‘02 ‘03 ‘04 ‘05 ‘06
450
400
350
300
250
200
150
100
50
0
DO
LLA
RS
(USD
)
‘05 ‘06
140
130
120
110
100
90
80
DO
LLA
RS
(USD
)
‘01 ‘02 ‘03 ‘04 ‘05 ‘06
160
140
120
100
80
60
40
20
0
DO
LLA
RS
(USD
)
‘96 ‘97 ‘98 ‘99 ‘00 ‘01 ‘02 ‘03 ‘04 ‘05 ‘06
450
400
350
300
250
200
150
100
50
0
DO
LLA
RS
(USD
)
‘05 ‘06
140
130
120
110
100
90
80
DO
LLA
RS
(USD
)
1996 1997 1998 1999 2000 2001 2002 2003 2004 2005 2006
l IBM Common Stock $100.00 $139.33 $247.27 $290.55 $229.99 $328.88 $212.23 $255.73 $274.12 $230.72 $276.33
l S & P 500 Index 100.00 133.36 171.47 207.56 188.86 166.24 129.50 166.65 184.78 193.86 224.48
l S & P Information Technology Index 100.00 128.53 228.97 409.27 241.87 179.31 112.22 165.22 169.44 171.12 185.53
FiVe-year
teN-year

board oF direCtors aNd seNior exeCutiVe oFFiCersiNterNatioNal busiNess maChiNes CorporatioN aNd subsidiary CompaNies
120 2006AnnualReport
CathleeN blaCKPresident Hearst Magazines
KeNNeth i. CheNaultChairman and Chief Executive Officer American Express Company
juergeN dormaNNChairman of the Board ABB Ltd
miChael l. esKeWChairman and Chief Executive Officer United Parcel Service, Inc.
shirley aNN jaCKsoNPresident Rensselaer Polytechnic Institute
miNoru maKiharaSenior Corporate Advisor and former Chairman Mitsubishi Corporation
luCio a. NotoManaging Partner Midstream Partners LLC
james W. oWeNsChairman and Chief Executive Officer Caterpillar Inc.
samuel j. palmisaNoChairman, President and Chief Executive Officer IBM
joaN e. speroPresident Doris Duke Charitable Foundation
sidNey taurelChairman and Chief Executive Officer Eli Lilly and Company
Charles m. Vest*President Emeritus Massachusetts Institute of Technology
loreNzo h. zambraNoChairman and Chief Executive Officer CEMEX, S.A.B. de C.V.
* TermontheBoardendsonApril24,2007
miChael e. daNielsSenior Vice President Global Technology Services
NiCholas m. doNoFrioExecutive Vice President Innovation and Technology
douglas t. elixSenior Vice President and Group Executive Sales and Distribution
jesse j. greeNe, jr.Vice President and Treasurer
j. bruCe harreldSenior Vice President Marketing and Strategy
paul m. horNSenior Vice President Research
joN C. iWataSenior Vice President Communications
johN e. Kelly ii iSenior Vice President Technology and Intellectual Property
marK loughridgeSenior Vice President and Chief Financial Officer
j. raNdall maCdoNaldSenior Vice President Human Resources
steVeN a. millsSenior Vice President and Group Executive Software Group
robert W. moFFat, jr.Senior Vice President Integrated Operations
daNiel e. o’doNNellVice President, Assistant General Counsel and Secretary
samuel j. palmisaNoChairman, President and Chief Executive Officer
VirgiNia m. romettySenior Vice President Global Business Services
liNda s. saNFordSenior Vice President Enterprise On Demand Transformation
timothy s. shaughNessyVice President and Controller
robert C. WeberSenior Vice President Legal and Regulatory Affairs, and General Counsel
William m. zeitlerSenior Vice President and Group Executive Systems and Technology Group
seNior exeCutiVe oFFiCers
board oF direCtors
Black
MAC
2718 CG10

Des
ign:
VSA
Par
tner
s, I
nc.,
Chi
cago
P
rint
ing:
Alli
ed P
rint
ing
Serv
ice s
, Inc
. P
hoto
grap
hy: J
ens
Um
bach
ibm stockholder servicesStockholders with questions about their accounts should contact:
Computershare Trust Company, N.A. P.O. Box 43072 Providence, Rhode Island 02940-3072 (888) IBM-6700
Investors residing outside the United States, Canada and Puerto Rico should call (781) 575-2727.
Stockholders can also reach Computershare Trust Company, N.A. via e-mail at: [email protected]
Hearing-impaired stockholders with access to a telecommunications device (TDD) can communicate directly with Computershare Trust Company, N.A., by calling (800) 490-1493. Stockholders residing outside the United States, Canada and Puerto Rico should call (781) 575-2694.
ibm on the internetTopics featured in this Annual Report can be found via the IBM home page on the Internet (http://www.ibm.com). Financial results, news on IBM products, services and other activities can also be found via that address.
Stockholders of record can receive online account information and answers to frequently asked questions regarding stockholder accounts via the internet (http://www.ibm.com/investor).
Stockholders of record can also consent to receive future IBM Annual Reports and Proxy Statements online through the Internet at this site.
IBM files reports with the Securities and Exchange Commission (SEC), including annual reports on Form 10-K, quarterly reports on Form 10-Q, current reports on Form 8-K and any other filings required by the SEC. Certifications by IBM’s Chief Executive Officer and Chief Financial Officer are included as exhibits to the company’s SEC reports (including the company’s Form 10-K filed in 2007), and Certifications by IBM’s Chief Executive Officer are included in the company’s filings with the New York Stock Exchange and the Chicago Stock Exchange (including filings in 2006).
IBM’s website (http://www.ibm.com) contains a significant amount of information about IBM, including the company’s annual report on Form 10-K, quarterly reports on Form 10-Q, current reports on Form 8-K, and all amendments to those reports as soon as reasonably practicable after such material is electronically filed with or furnished to the SEC (http://www.ibm.com/investor). These materials are available free of charge on or through our website.
The public may read and copy any materials the company files with the SEC at the SECs Public Reference Room at 100 F Street, NE, Washington, DC 20549. The public may obtain information on the operation of the Public Reference Room by calling the SEC at 1-800-SEC-0330. The SEC maintains an Internet site (http://www.sec.gov) that contains reports, proxy and information statements, and other information regarding issuers that file electronically with the SEC.
ibm investor services programThe Investor Services Program brochure outlines a number of services provided for IBM stockholders and potential IBM investors, including the reinvestment of dividends, direct purchase and the deposit of IBM stock certificates for safekeeping. Call (888) IBM-6700 for a copy of the brochure. Investors residing outside the United States, Canada and Puerto Rico should call (781) 575-2727.
Investors with other requests may write to: IBM Stockholder Relations New Orchard Road Armonk, New York 10504
ibm stockIBM common stock is listed on the New York Stock Exchange, the Chicago Stock Exchange, and outside the United States.
annual meetingThe IBM Annual Meeting of Stockholders will be held on Tuesday, April 24, 2007, at 10 a.m. in the Grand Ballroom of the Knoxville Convention Center, 701 Henley Street, Knoxville, Tennessee.
stockholder communicationsStockholders in the United States and Canada can get quarterly financial results, listen to a summary of the Annual Meeting remarks and hear voting results from the meeting by calling (800) IBM-7800. Callers can also request printed copies of the information via mail or fax. Stockholders residing outside the United States, Canada and Puerto Rico should call (402) 573-9861.
literature for ibm stockholdersThe following literature on IBM is available without charge from:
Computershare Trust Company, N.A. P.O. Box 43072 Providence, Rhode Island 02940-3072 (888) IBM-6700
Investors residing outside the United States, Canada and Puerto Rico should call (781) 575-2727.
The Form 10-K Annual Report and Form 10-Q Quarterly Reports to the SEC provide additional information on IBM’s business. The 10-K report is released by the end of February; 10-Q reports are released by early May, August and November.
An audio cassette recording of the 2006 Annual Report will be available for sight-impaired stockholders in June.
“Collaboration That Matters: IBM 2006 Corporate Responsibility Report” details our proactive approach to corporate citizenship, reflecting on our corporate commitment to making a significant impact on the key challenges that face our company and the world. It outlines our results and strategies delivered by more than 350,000 employees across 170 countries worldwide and covers areas of performance from accessibility to supply chain practices, from diversity to climate protection, outlining our progressive approach to community engagement and utilizing our innovative technologies applied against a range of societal problems from education to health care, disaster relief and recovery to economic security. Further information is also available on IBM’s corporate responsibility reporting website: (www.ibm.com/ibm/responsibility).
general informationFor answers to general questions about IBM from within the continental United States, call (800) IBM-4YOU. From outside the United States, Canada and Puerto Rico, call (404) 238-1234.
corporate officesInternational Business Machines Corporation New Orchard Road Armonk, New York 10504 (914) 499-1900
The IBM Annual Report is printed on recycled paper and is recyclable.
Access360, AIX, Ascential, BladeCenter, Buildforge, Candle, Collation, Cynaea, DataPower, Domino, IBM, Informix, Isogon, Lotus, Notes, POWER, POWER5+, POWER6, Rational, System i, System p, System x, System z, Tivoli, Trigo, Venetica and WebSphere are trademarks of International Business Machines Corporation or its wholly owned subsidiaries. Java is a trademark of Sun Microsystems, Inc. Linux is a trademark of Linus Torvalds. Windows is a trademark of Microsoft Corporation. UNIX is a registered trademark of The Open Group in the United States and other countries. Other company, product and service names may be trademarks or service marks of others.
Printed in the U.S.A. G507-0501-14
stockholder informationinternational business machines corporation and subsidiary companies

2006 Annual Report