macro-productivity indicatorsthe macro-productivity indicators project provides a report that...
TRANSCRIPT

2012
MACRO-PRODUCTIVITY INDICATORS PROJECT
i
TABLE OF CONTENTS
LIST OF TABLES … … … … … … … … … … II LIST OF FIGURES … … … … … … … … … … III LIST OF BOXES … … … … … … … … … … III EXECUTIVE SUMMARY … … … … … … … … … IV INTRODUCTION … … … … … … … … … … 1
TRENDS IN BARBADIAN PRODUCTIVITY … … … … … … … 4
National Productivity Indicators … … … … … … … 4 Survey-Based Productivity Indicators … … … … … … 4
CALCULATING PRODUCTIVITY … … … … … … … … 10
COMPARATIVE RESULTS BY INDUSTRY … … … … … … … 11
PRODUCTIVITY INDICATORS … … … … … … … … 12
Labour Productivity Growth … … … … … … … 12 Output per Employee Growth … … … … … … … 13 Unit Labour Cost Indicator … … … … … … … … 15
ABSENTEEISM … … … … … … … … … … 20
CONCLUSION AND SUMMARY … … … … … … … … 23
TERMINOLOGY AND DEFINITIONS … … … … … … … … 25
APPENDICES … … … … … … … … … … 26
Table A.1: Combined Sales of Surveyed Establishments 2007–2011
Table A.2: Total Number of Full-Time Employees 2007–2011
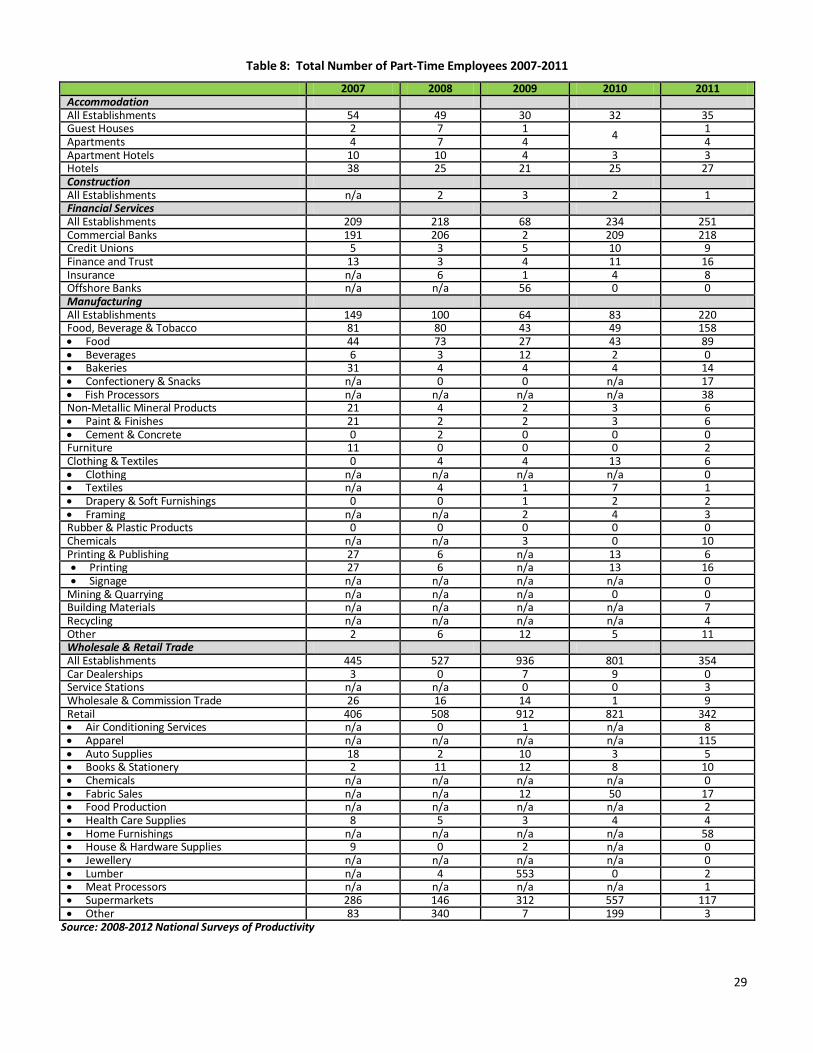
Table A.3: Total Number of Part-Time Employees 2007–2011
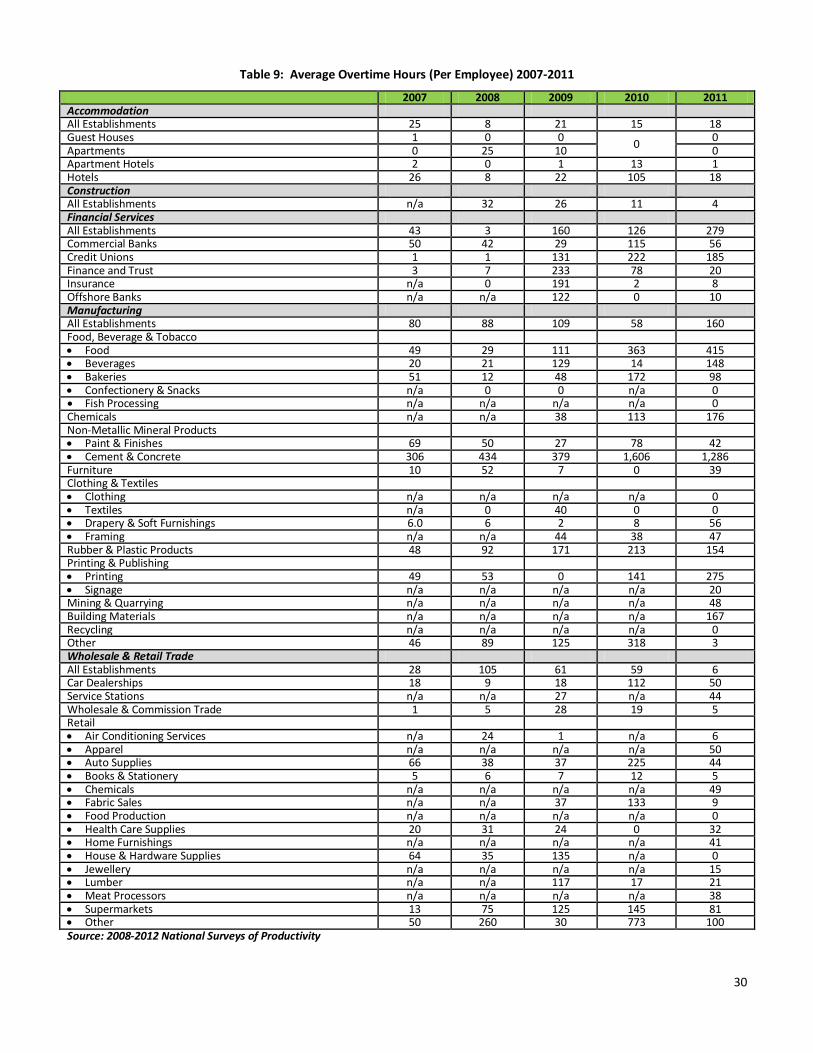
Table A.4: Average Overtime Hours (Per Employee) 2007–2011
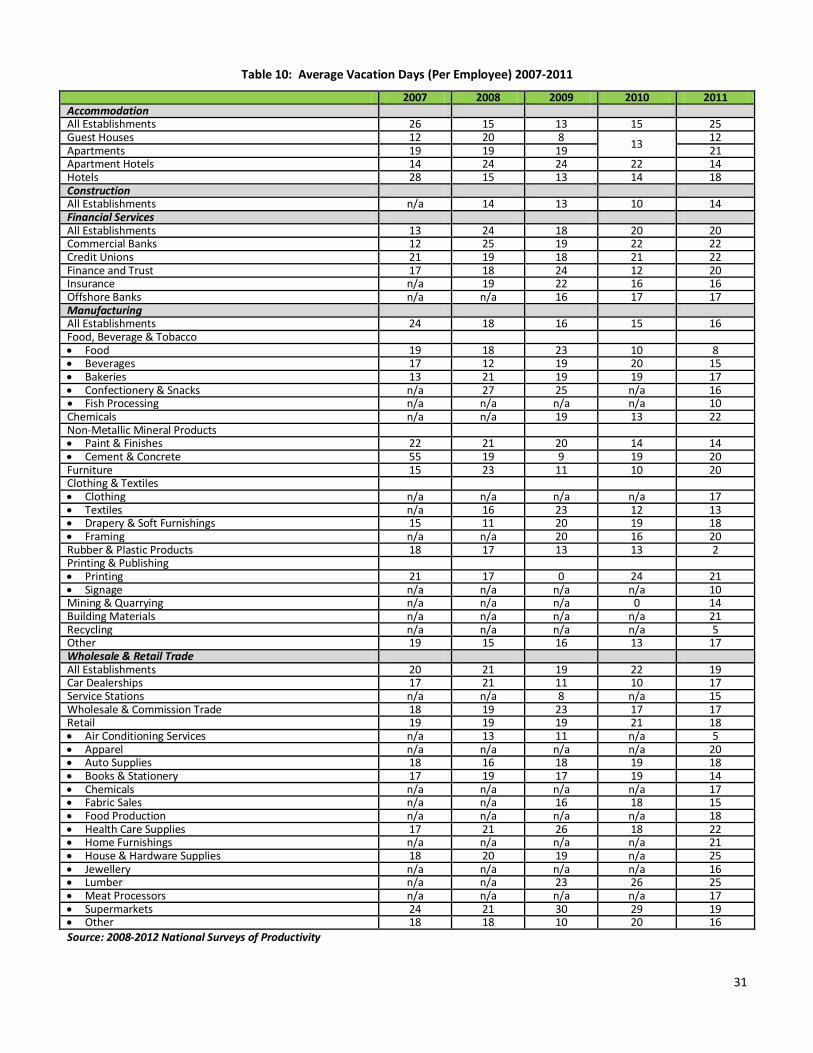
Table A.5: Average Vacation Days (Per Employee) 2007–2011
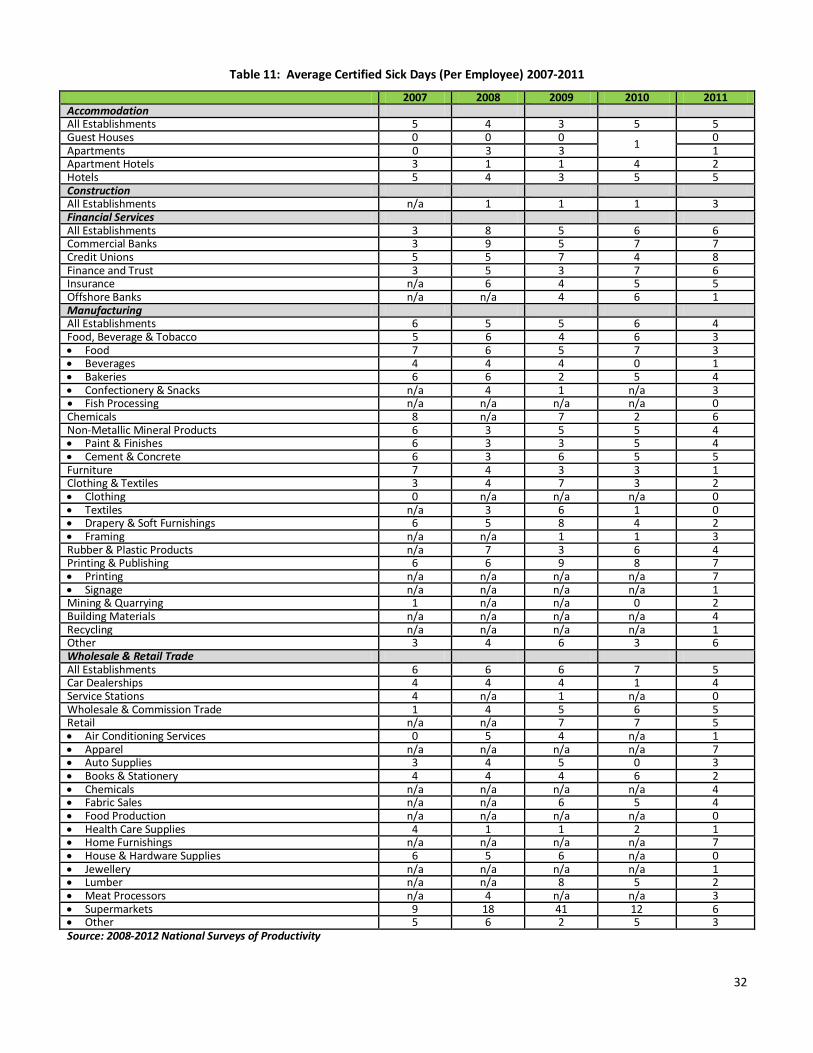
Table A.6: Average Certified Sick Days (Per Employee) 2007–2011
Table A.7: Average Uncertified Sick Days (Per Employee) 2007–2011
LIST OF TABLES 1: Number of Establishments Participating in the National
Survey of Productivity … … … … … … … … 6
2: Descriptive Statistics for Firms Responding to Survey … … … … 7
3: Labour Productivity Growth in Selected Industries in
2007–2011 (Percent Change) … … … … … … … 11
4: Output per Employee Growth in 2010 and 2011 … … … … … 14
5: Unit Labour Cost in 2010 and 2011 … … … … … … 16
6: Labour Productivity Growth in Selected Industries in 2011 … … … … 17
7: Absenteeism Rate … … … … … … … … 20
ii
LIST OF FIGURES 1: Macro-Productivity Growth (Percent Change) 2000–2011 … … … … 4
2: Descriptive Statistics for Firms Responding to Survey (Sales) … … … 7
3: Descriptive Statistics for Firms Responding to Survey
(Full-Time Employment) … … … … … … … 8
4. Descriptive Statistics for Firms Responding to Survey
(Part-Time Employment) … … … … … … … 8
5: Trends in Labour Productivity in Select Industries (2007–2011) … … … 12
6: Labour Productivity in Five (5) Industries Surveyed 2012 (Percent Change) … … 18
7: Absenteeism Rate for Five (5) Industries Surveyed 2007–2011 … … … 21
LIST OF BOXES 1: Communication and Productivity … … … … … … … 3
2: Motivation – One of the Keys to Unlocking Employee Productivity … … … 9
3: Is the Boss the Barrier? … … … … … … … … 19
4. CARICOM Competitiveness Performance … … … … … … 22
iii
EXECUTIVE SUMMARY The Macro-Productivity Indicators Project provides a report that presents analysis of productivity growth at both the national and sectoral levels. The specific sectors included in the project are accommodation, construction, financial services, manufacturing and wholesale and retail trade. The results at the national level suggest that average productivity growth for 2011 was estimated at 2.2 percent, down from 3.7 percent in 2010. Productivity is simply a convenient term for summarising and expressing a relationship. In essence, it is a measure of how efficiently a firm manipulates its resources or factors of production (human capital, materials, equipment, space, energy and knowledge) within the production of goods and services. However, productivity is not only related to the fostering of maximum efficiency by “doing things right” but it also involves the attainment of maximum effectiveness of “doing the right things”. Increased productivity is basically achieved by accomplishing more with the same amount of resources or achieving higher output in terms of volume and quality for the same input. It is usually stated as:
Several factors affect productivity growth at the macro level: (1) macro-economic structural change and policies, both fiscal and monetary (2) sectoral allocation of resources (3) economies of scale (4) trade orientation (5) education and training policy (6) human resource development policy (7) research and development policy (8) technological change (9) social infrastructure development (10) regulatory environment (11) international business (12) political environment (13) business cycle (14) use/exploitation of the natural environment It is known widely that productivity is essential to the expansion of national welfare. All human activity can benefit from an improvement in productivity. This can be said because an increase in Gross Domestic Product is attained as a result of improving the effectiveness and quality of manpower instead of using additional labour and capital. Basically, Gross Domestic Product grows faster than the input factors when productivity is improved. Therefore, expansions in productivity result in direct increases in the standard of living, and productivity is definitely one of, if not the most important source of real economic growth and social progress. Changes in productivity are considered a major influence on a number of social and economic trends, such as economic growth, high standard of living and improvements in a nation’s balance of payments, inflation control and even the amount and quality of leisure. These changes in turn influence wage levels, cost or price relationships, capital investment needs and employment. This was the rationale for the development of the Macro-Productivity Indicators Project and National Survey of Productivity; because monitoring and maintenance of productivity, must be preceded by measurement.
iv
The report presents the results of the National Survey of Productivity conducted in five (5) industries – accommodation, construction, financial services, manufacturing and wholesale and retail trade. The results are three specific forms of labour productivity indicators and the absenteeism rate. The results suggest that four of the five industries under review had positive rates of growth: these were accommodation (1.6 percent); financial services (37.0 percent) – the highest for 2011; manufacturing (0.4 percent) and wholesale and retail trade (9.3 percent). The other industry, construction registered a contraction of 3.0 percent. The lowest absenteeism rate recorded for the overall industries in 2011 was in the construction industry, 13.3 percent. With regards to the sub-sectors under review, food, beverage and tobacco – fish processors – 3.8 percent had the lowest overall average absenteeism rate. This was followed by apartments (8.1 percent), clothing and textiles – textiles (8.6 percent) and service stations (9.6 percent). The highest absenteeism rate for the industries was in the financial services sector – 17.9 percent. However, significant absenteeism rates were registered for clothing and textiles – framing (24.5 percent), chemicals (23.5 percent), retail – house and hardware supplies and mining and quarrying (21.3 percent), retail – books and stationery (20.7 percent) and non-metallic mineral products – cement and concrete (20.1 percent).
1
INTRODUCTION 1. What is productivity? Productivity means how much and how well we produce from the resources used. If we produce more and better goods from the same resources, we increase productivity. Or, if we produce the same goods from fewer resources, we also increase productivity. The same applies to services. If we provide more services or better quality services from the same resources, our productivity has increased. Or, if we provide the same services and just as good, from less resources, we also improve productivity. In this context, “resources” means all human and physical resources, that is, the people who produce the goods or provide the services, and the assets with which the people can produce the goods or provide the services. The physical resources that people use include the land and buildings, fixed and moving machines and equipment, tools, raw materials, inventories and other current assets. 2. What is not productivity? If sales increase due to inflation, it is not a productivity increase because productivity means real increase, not just monetary increase. If sales volume increases but also the resources used increase, it is not necessarily a productivity increase. Productivity improvement means the increase of the production of goods or services per resources used. 3. Who benefits from increased productivity? Everyone benefits: Companies, workers, customers and the general public. In fact, the country’s standard of living can increase only through increased productivity. The country can borrow money, but it must be paid back. The only way we can have more is to produce more from our resources, that is, by increasing our productivity. Employers benefit through increased sales, increased profitability, increased competitiveness, more turn-over, more stable and growing business, less waste and less absenteeism, to name a few. Workers benefit because more productive, successful companies provide more stable employment, better pay and working conditions, better career opportunities, better management-labour relations and so on. Customers/clients benefit through better quality and less expensive products and improved services. General public benefits (through governments) by improved public services without increased taxes. 4. Can productivity be improved significantly? There is overwhelming evidence worldwide, both in developed and developing countries that conscious productivity improvements can bring dramatic one-time productivity improvement as well as very substantial, say five (5) percent on greater productivity increases annually. It has also been proven that organisations which have productivity improvement programmes have much better results than those that do not have productivity programmes.
2
As a result, the Macro-Productivity Indicators Project was initiated, to assist companies in measuring, monitoring and ultimately maintaining high productivity levels. Hence, the results derived from the project can aid in the development of a plan that can move the country forward in terms of improving its level of productivity for the total economy and the five industries under review. The Macro-Productivity Indicators Report is a product of the National Survey of Productivity and is structured as follows. The report begins with an executive summary followed by the introduction which gives some insight into what productivity is and is not and what benefits can be derived from an increase in productivity. The remainder of the report comprises the analysis of the trends in the productivity and absenteeism indicators for the firms surveyed. The final section of the report is the conclusion and summary.
Article written by John Pilgrim was taken from the
Newsletter of the National Productivity Board (January – March 1994)
3
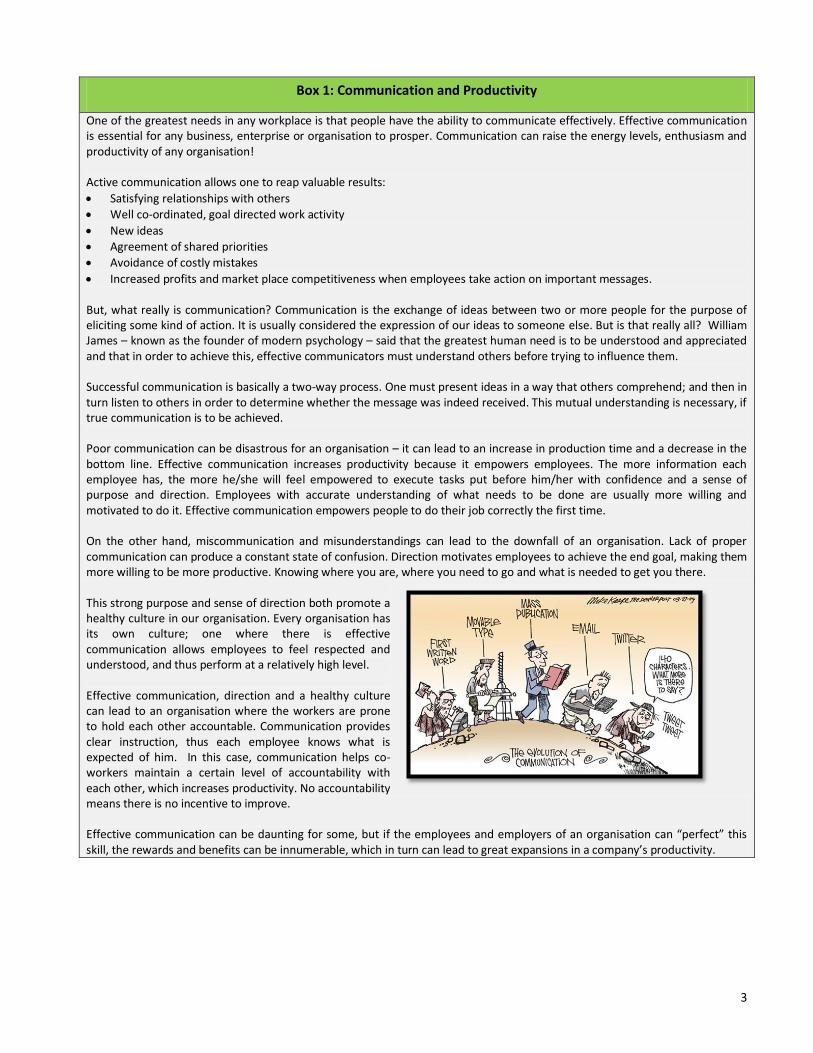
Box 1: Communication and Productivity
One of the greatest needs in any workplace is that people have the ability to communicate effectively. Effective communication is essential for any business, enterprise or organisation to prosper. Communication can raise the energy levels, enthusiasm and productivity of any organisation! Active communication allows one to reap valuable results:
Satisfying relationships with others Well co-ordinated, goal directed work activity
New ideas Agreement of shared priorities
Avoidance of costly mistakes
Increased profits and market place competitiveness when employees take action on important messages. But, what really is communication? Communication is the exchange of ideas between two or more people for the purpose of eliciting some kind of action. It is usually considered the expression of our ideas to someone else. But is that really all? William James – known as the founder of modern psychology – said that the greatest human need is to be understood and appreciated and that in order to achieve this, effective communicators must understand others before trying to influence them. Successful communication is basically a two-way process. One must present ideas in a way that others comprehend; and then in turn listen to others in order to determine whether the message was indeed received. This mutual understanding is necessary, if true communication is to be achieved. Poor communication can be disastrous for an organisation – it can lead to an increase in production time and a decrease in the bottom line. Effective communication increases productivity because it empowers employees. The more information each employee has, the more he/she will feel empowered to execute tasks put before him/her with confidence and a sense of purpose and direction. Employees with accurate understanding of what needs to be done are usually more willing and motivated to do it. Effective communication empowers people to do their job correctly the first time. On the other hand, miscommunication and misunderstandings can lead to the downfall of an organisation. Lack of proper communication can produce a constant state of confusion. Direction motivates employees to achieve the end goal, making them more willing to be more productive. Knowing where you are, where you need to go and what is needed to get you there. This strong purpose and sense of direction both promote a healthy culture in our organisation. Every organisation has its own culture; one where there is effective communication allows employees to feel respected and understood, and thus perform at a relatively high level. Effective communication, direction and a healthy culture can lead to an organisation where the workers are prone to hold each other accountable. Communication provides clear instruction, thus each employee knows what is expected of him. In this case, communication helps co-workers maintain a certain level of accountability with each other, which increases productivity. No accountability means there is no incentive to improve. Effective communication can be daunting for some, but if the employees and employers of an organisation can “perfect” this skill, the rewards and benefits can be innumerable, which in turn can lead to great expansions in a company’s productivity.
4
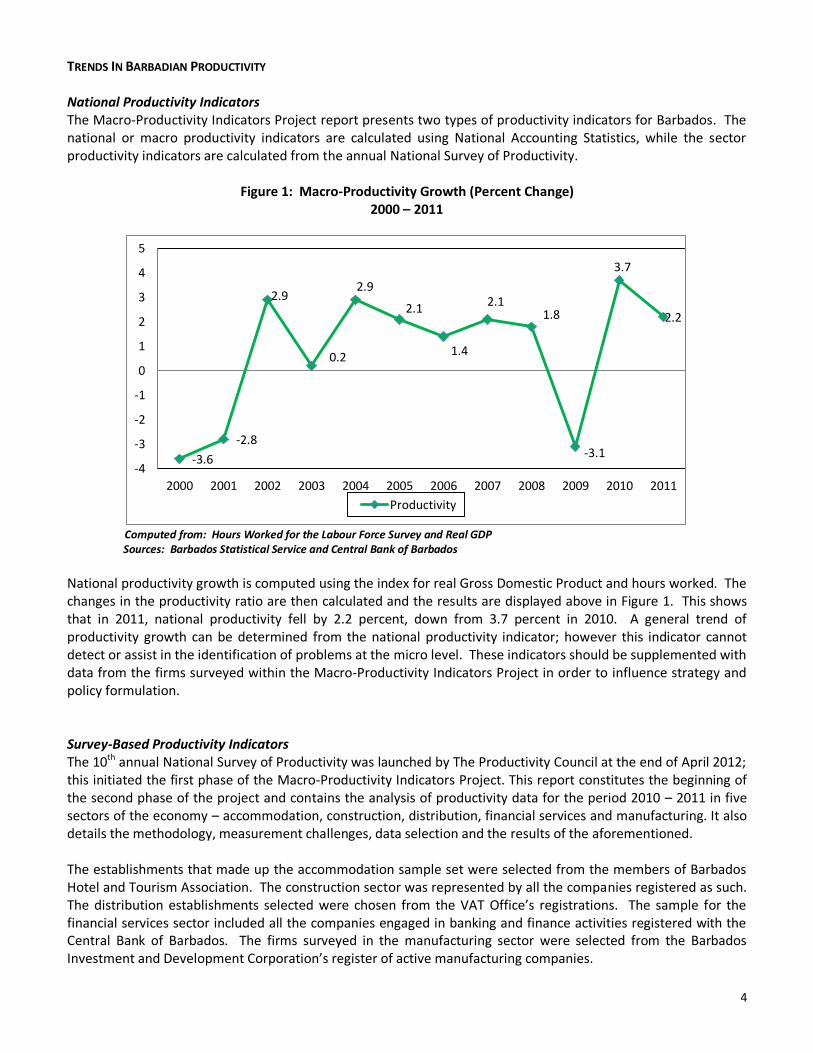
TRENDS IN BARBADIAN PRODUCTIVITY National Productivity Indicators The Macro-Productivity Indicators Project report presents two types of productivity indicators for Barbados. The national or macro productivity indicators are calculated using National Accounting Statistics, while the sector productivity indicators are calculated from the annual National Survey of Productivity.
Figure 1: Macro-Productivity Growth (Percent Change) 2000 – 2011
Computed from: Hours Worked for the Labour Force Survey and Real GDP Sources: Barbados Statistical Service and Central Bank of Barbados
National productivity growth is computed using the index for real Gross Domestic Product and hours worked. The changes in the productivity ratio are then calculated and the results are displayed above in Figure 1. This shows that in 2011, national productivity fell by 2.2 percent, down from 3.7 percent in 2010. A general trend of productivity growth can be determined from the national productivity indicator; however this indicator cannot detect or assist in the identification of problems at the micro level. These indicators should be supplemented with data from the firms surveyed within the Macro-Productivity Indicators Project in order to influence strategy and policy formulation. Survey-Based Productivity Indicators The 10th annual National Survey of Productivity was launched by The Productivity Council at the end of April 2012; this initiated the first phase of the Macro-Productivity Indicators Project. This report constitutes the beginning of the second phase of the project and contains the analysis of productivity data for the period 2010 – 2011 in five sectors of the economy – accommodation, construction, distribution, financial services and manufacturing. It also details the methodology, measurement challenges, data selection and the results of the aforementioned. The establishments that made up the accommodation sample set were selected from the members of Barbados Hotel and Tourism Association. The construction sector was represented by all the companies registered as such. The distribution establishments selected were chosen from the VAT Office’s registrations. The sample for the financial services sector included all the companies engaged in banking and finance activities registered with the Central Bank of Barbados. The firms surveyed in the manufacturing sector were selected from the Barbados Investment and Development Corporation’s register of active manufacturing companies.
-3.6
-2.8
2.9
0.2
2.9
2.1
1.4
2.1 1.8
-3.1
3.7
2.2
-4
-3
-2
-1
0
1
2
3
4
5
2000 2001 2002 2003 2004 2005 2006 2007 2008 2009 2010 2011
Productivity
5
The annual National Survey of Productivity collects both labour and output information for the two-year period prior to the year of the exercise. In mid-May, the survey instruments were hand delivered by the enumerators, and the deadline was set at July 27th, 2012. The project team consisted of one (1) supervisor and five (5) enumerators. During the initial months of the project, the respondents of the accommodation and construction sectors were not as co-operative as expected, and the deadline was extended until August 30th, 2012 to further facilitate the data collection process. The initial sample set for the Macro-Productivity Indicators Project consisted of:
Sixty-six (66) accommodation establishments;
Twenty-eight (28) construction companies;
Two hundred and fifty-one (251) businesses for the distribution sector;
Fifty-two (52) companies for the financial services sector; and
Two hundred and seventy-eight (278) establishments for the manufacturing sector. The project was promoted in the print (Nation Newspaper and Barbados Advocate) and broadcast media (radio interview). These initiatives encouraged the business community to participate in the data collection exercise. The response rate was exceptional this year, as a great deal of first time companies responded to the survey. However, there were a number of reasons that other companies did not respond, below is a break-down by industry: 1. The accommodation sector lost twenty-five (25) companies, eighteen (18) refused to complete the survey
instrument and seven (7) closed during the period under review. Therefore, the total number of establishments in the sample set for the said industry was forty-one (41).
2. For the construction industry, five (5) companies refused to complete the survey and four (4) closed or were in the process of closing. One (1) company actually changed its operations and is no longer considered a construction company. Therefore, the sample set for the sector was eighteen (18).
3. From the original sample set of the distribution sector, there were forty-three (43) establishments that had no interest in participating in the project and twenty-one (21) closed their doors to business. Thus, the total sample set for this industry was one hundred and eighty-seven (187).
4. The financial services sector had an initial sample set of fifty-two (52) companies, which decreased to forty-four (44), when eight (8) establishments refused to participate.
5. The manufacturing industry had thirty-nine (39) companies close during the period under review and forty-six (46) companies refused to participate in this year’s National Survey of Productivity. Also, three (3) companies changed their sector of operation from manufacturing. This left the sample set at one hundred and ninety (190) establishments.
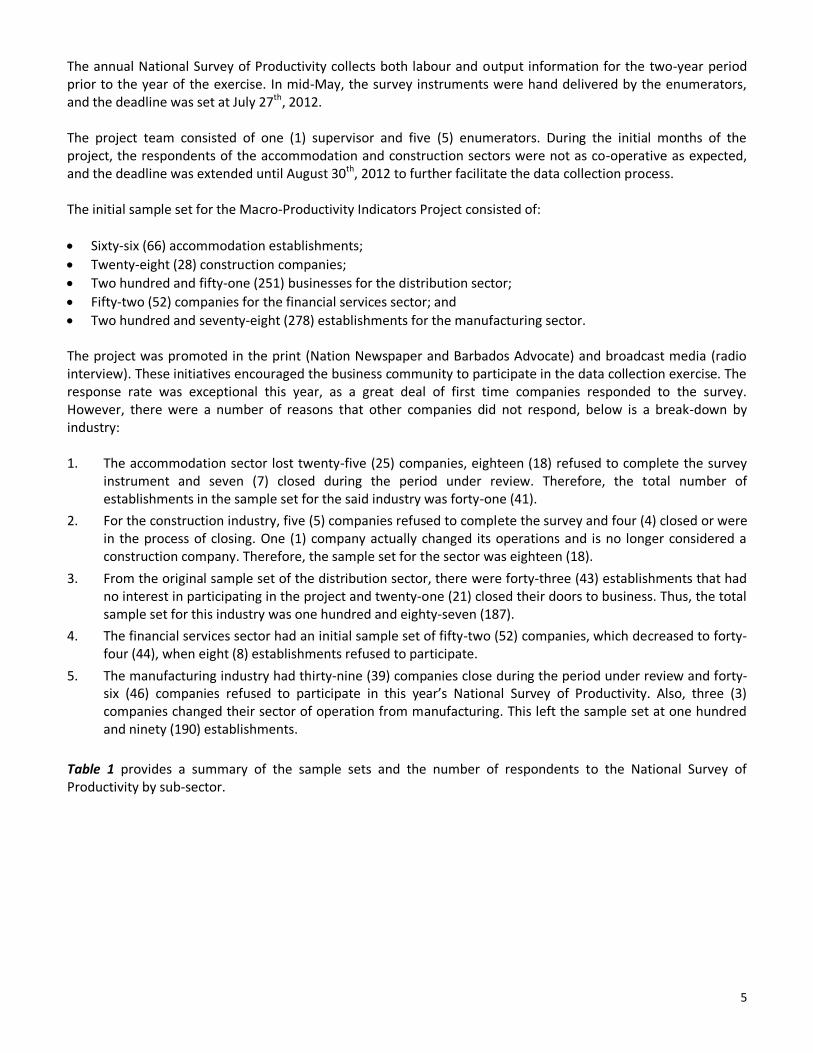
Table 1 provides a summary of the sample sets and the number of respondents to the National Survey of Productivity by sub-sector.
6
Table 1: Number of Establishments Participating in the National Survey of Productivity
Industry Number of Respondents
Total Number of Establishments Surveyed
2011 2012 2011 2012
Accommodation 18 28 63 41 Guest Houses
5 3
Apartments 3 Apartment Hotels 3 4 Hotels 10 18 Construction 10 10 28 20 Financial Services 33 32 51 44 Commercial Banks 4 4 Credit Unions 12 10 Finance and Trust 6 8 Insurance 6 8 Offshore Banks 5 2 Manufacturing 83 104 265 190 Food, Beverage & Tobacco 14 26 Food 7 8 Beverages 2 4 Bakeries 5 10 Confectionery & Snacks - 2 Fish Processors - 2 Non-Metallic Mineral Products 8 11 Paint & Finishes 6 2 Cement & Concrete 2 9 Furniture 3 8 Clothing & Textiles 5 14 Clothing - 4 Drapery & Soft Furnishings 3 5 Textiles 2 3 Framing 3 2 Rubber & Plastic Products 2 2 Chemicals 4 4 Printing & Publishing 7 20 Printing 7 16 Signage - 4 Building Materials - 3 Recycling - 3 Mining & Quarrying 2 2 Other 8 11 Wholesale & Retail Trade 45 81 253 187 Car Dealerships 5 3 Service Stations - 2 Wholesale & Commission Trade 9 12 Retail 31 64 Air Conditioning - 4 Apparel - 6 Auto Supplies 6 11 Books & Stationery Supplies 2 3 Chemicals - 2 Fabric Sales 2 3 Food Production - 2 Health Care Supplies 4 3 Home Furnishings n/a 2 House & Hardware Supplies n/a 4 Jewellery n/a 5 Lumber 3 4 Meat Processors n/a 3 Supermarkets 2 6 Other 12 6

7
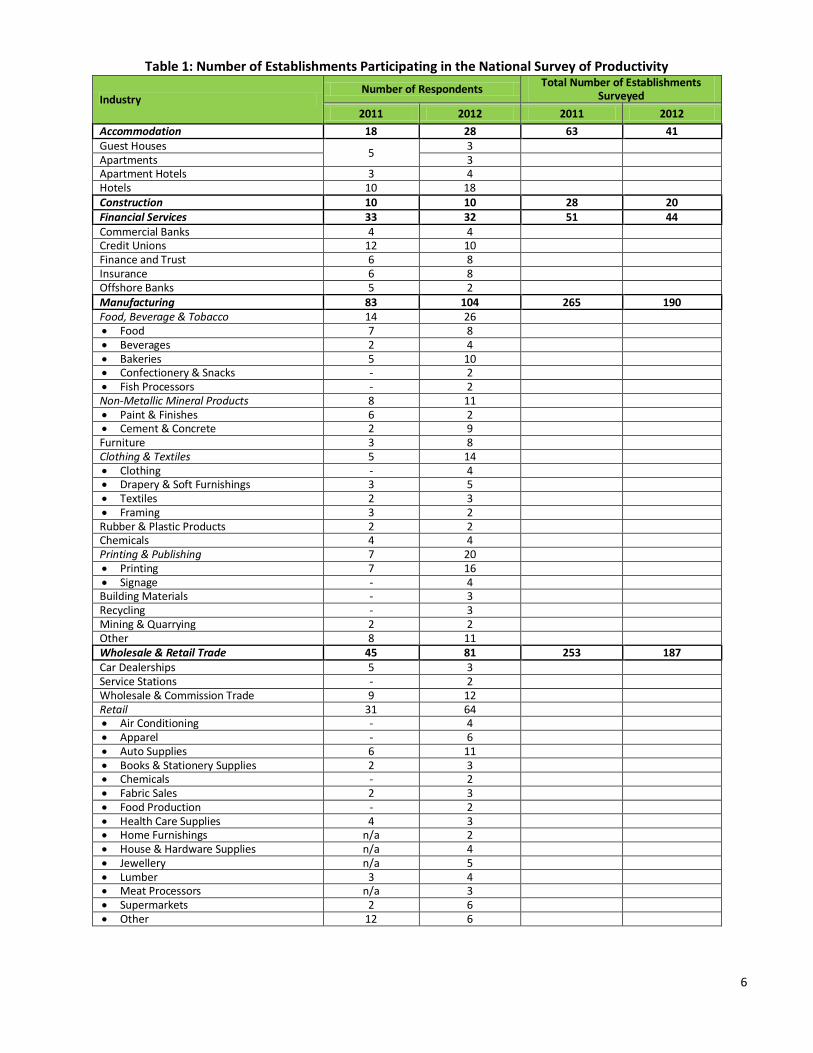
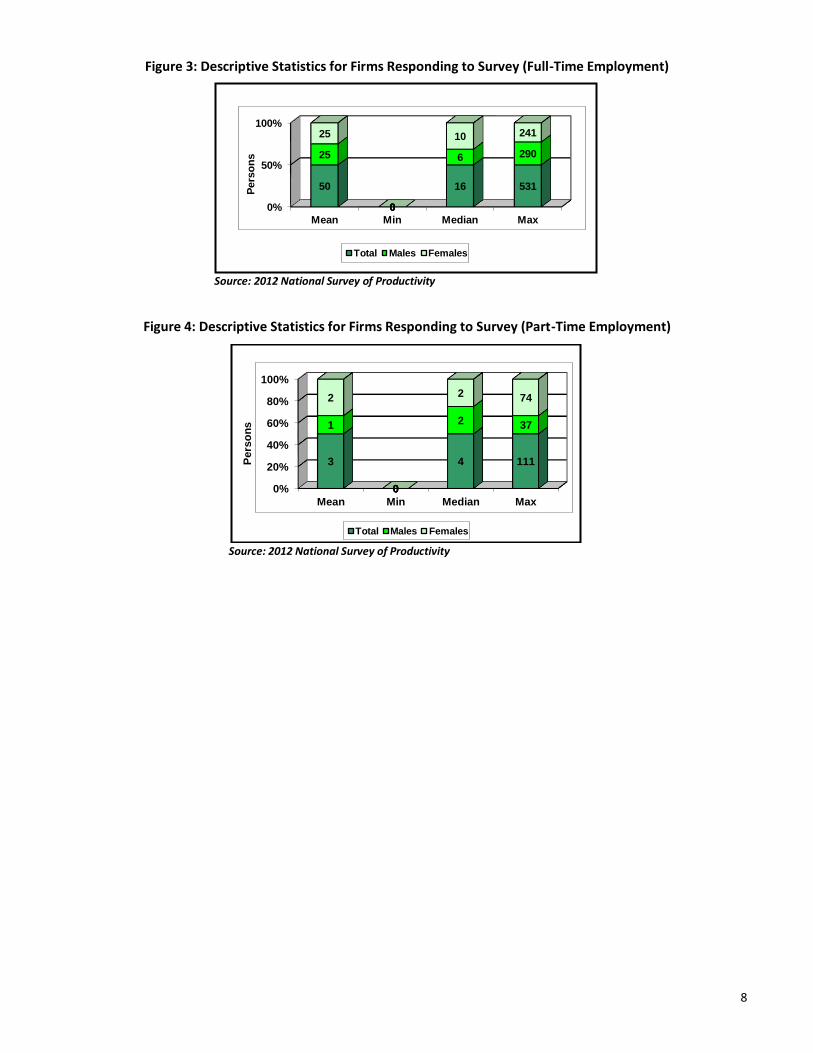
The issues and problems faced by the enumerators were mainly that representatives of companies were reluctant to disclose the companies’ information, as a number of establishments have not necessarily been performing as they should, during the current global recession. There was still the issue of some persons deliberately avoiding the enumerators and also the lack of co-operation among the departments of a number of firms. The survey instrument was often passed back and forth between the Human Resource and Finance Units, or to and from head office with little or none of its completed and returned. However, this year a large number of companies must be commended for their efforts to collect data in a format to facilitate the completion of the questionnaire. One issue that still plagues the process is false reports and, to a lesser extent, recording errors. Consequently, the data was subjected to multiple rounds of investigation. Questionnaires were manually checked by the enumerators and the project co-ordinator from The Productivity Council to identify possible errors in reporting. Secondly, a statistical approach was introduced to identify and eliminate any remaining outliers from the estimation sample. Table 2 shows the descriptive statistics for the sample set of firms for the 2012 National Survey of Productivity. An analysis of the respondent firms suggests that the establishments participating in the survey had average sales of $8.1 million. The sales for the firms ranged from $1,500 to $243.5 million hence proving that there actually is a wide variation in the firms. After analysing employment and sales, both the average sales statistics and employment figures showed that the firms in the sample can be classified as small, medium and large businesses. The analysis also showed that the average number of full time employees per firm was fifty (50), reaching as high as five hundred and thirty-one (531) persons per company.
Table 2: Descriptive Statistics for Firms Responding to Survey
Category Mean Median Min Max Sales (million) $8.1 $1.4 $0.0015 $243.5 Employment Full-Time 50 16 0 531 Males 25 6 0 290 Females 25 10 0 241 Part-Time 3 4 0 111 Males 1 2 0 37 Females 2 2 0 74
Source: 2012 National Survey of Productivity
Figure 2: Descriptive Statistics for Firms Responding to Survey (Sales)
Source: 2012 National Survey of Productivity
8.1 0.0015 1.4
243.5
0
100
200
300
400
500
Mean Min Median Max
Millio
ns
Sales
.
8
Figure 3: Descriptive Statistics for Firms Responding to Survey (Full-Time Employment)
Source: 2012 National Survey of Productivity
Figure 4: Descriptive Statistics for Firms Responding to Survey (Part-Time Employment)
Source: 2012 National Survey of Productivity
0%
50%
100%
Mean Min Median Max
50
0
16 531
25
0
6 290
25
0
10 241
Pers
on
s
Total Males Females
0%
20%
40%
60%
80%
100%
Mean Min Median Max
3
0
4 111
1
0
2 37
2
0
2 74
Pe
rso
ns
Total Males Females
9
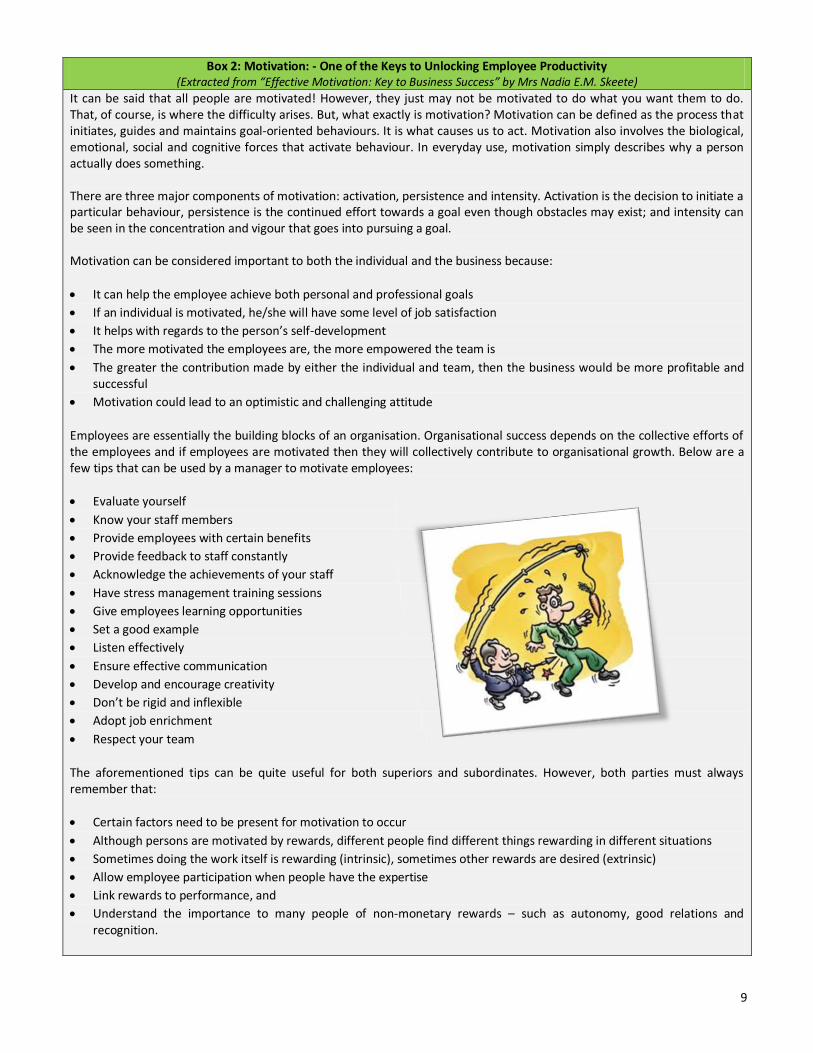
Box 2: Motivation: - One of the Keys to Unlocking Employee Productivity (Extracted from “Effective Motivation: Key to Business Success” by Mrs Nadia E.M. Skeete)
It can be said that all people are motivated! However, they just may not be motivated to do what you want them to do. That, of course, is where the difficulty arises. But, what exactly is motivation? Motivation can be defined as the process that initiates, guides and maintains goal-oriented behaviours. It is what causes us to act. Motivation also involves the biological, emotional, social and cognitive forces that activate behaviour. In everyday use, motivation simply describes why a person actually does something. There are three major components of motivation: activation, persistence and intensity. Activation is the decision to initiate a particular behaviour, persistence is the continued effort towards a goal even though obstacles may exist; and intensity can be seen in the concentration and vigour that goes into pursuing a goal. Motivation can be considered important to both the individual and the business because:
It can help the employee achieve both personal and professional goals
If an individual is motivated, he/she will have some level of job satisfaction
It helps with regards to the person’s self-development
The more motivated the employees are, the more empowered the team is
The greater the contribution made by either the individual and team, then the business would be more profitable and successful
Motivation could lead to an optimistic and challenging attitude
Employees are essentially the building blocks of an organisation. Organisational success depends on the collective efforts of the employees and if employees are motivated then they will collectively contribute to organisational growth. Below are a few tips that can be used by a manager to motivate employees:
Evaluate yourself
Know your staff members
Provide employees with certain benefits
Provide feedback to staff constantly
Acknowledge the achievements of your staff
Have stress management training sessions
Give employees learning opportunities
Set a good example
Listen effectively
Ensure effective communication
Develop and encourage creativity
Don’t be rigid and inflexible
Adopt job enrichment
Respect your team
The aforementioned tips can be quite useful for both superiors and subordinates. However, both parties must always remember that:
Certain factors need to be present for motivation to occur
Although persons are motivated by rewards, different people find different things rewarding in different situations
Sometimes doing the work itself is rewarding (intrinsic), sometimes other rewards are desired (extrinsic)
Allow employee participation when people have the expertise
Link rewards to performance, and
Understand the importance to many people of non-monetary rewards – such as autonomy, good relations and recognition.
10
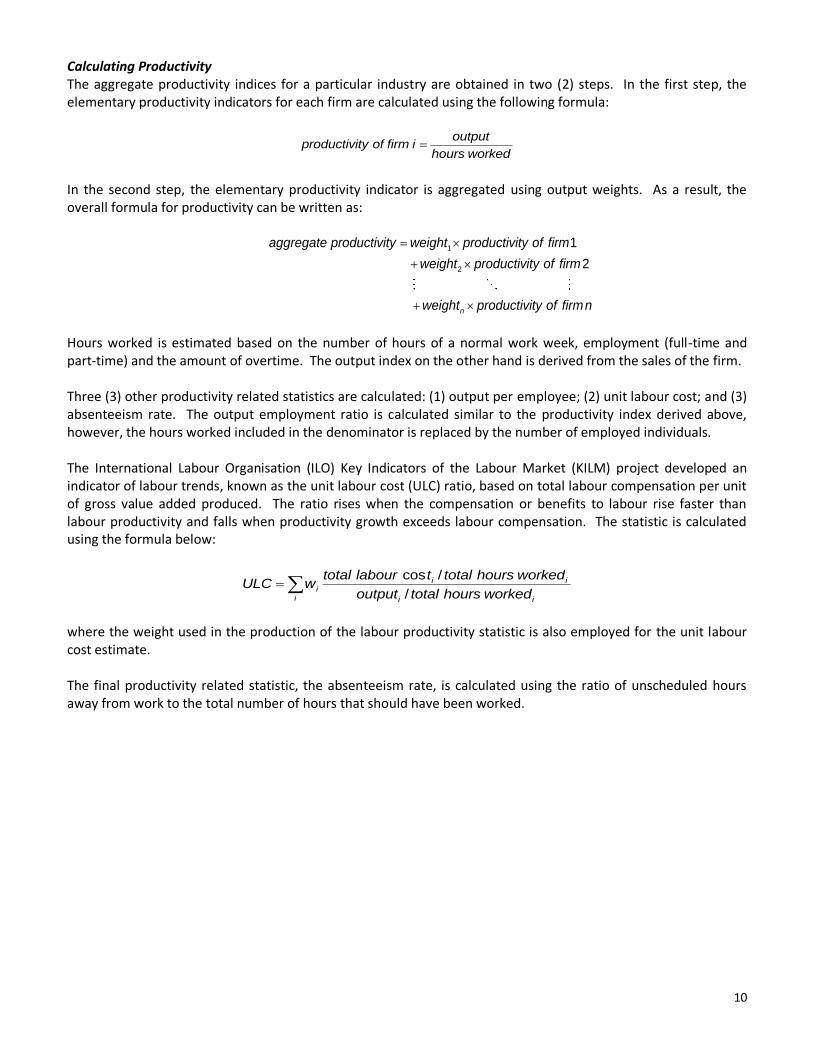
Calculating Productivity The aggregate productivity indices for a particular industry are obtained in two (2) steps. In the first step, the elementary productivity indicators for each firm are calculated using the following formula:
output
productivity of firm ihours worked
In the second step, the elementary productivity indicator is aggregated using output weights. As a result, the overall formula for productivity can be written as:
1
2
1
2
n
aggregate productivity weight productivity of firm
weight productivity of firm
weight productivity of firmn
Hours worked is estimated based on the number of hours of a normal work week, employment (full-time and part-time) and the amount of overtime. The output index on the other hand is derived from the sales of the firm. Three (3) other productivity related statistics are calculated: (1) output per employee; (2) unit labour cost; and (3) absenteeism rate. The output employment ratio is calculated similar to the productivity index derived above, however, the hours worked included in the denominator is replaced by the number of employed individuals.
The International Labour Organisation (ILO) Key Indicators of the Labour Market (KILM) project developed an indicator of labour trends, known as the unit labour cost (ULC) ratio, based on total labour compensation per unit of gross value added produced. The ratio rises when the compensation or benefits to labour rise faster than labour productivity and falls when productivity growth exceeds labour compensation. The statistic is calculated using the formula below:
cos /
/i i
i
i i i
total labour t total hours workedULC w
output total hours worked
where the weight used in the production of the labour productivity statistic is also employed for the unit labour cost estimate. The final productivity related statistic, the absenteeism rate, is calculated using the ratio of unscheduled hours away from work to the total number of hours that should have been worked.
11
Comparative Results by Industry
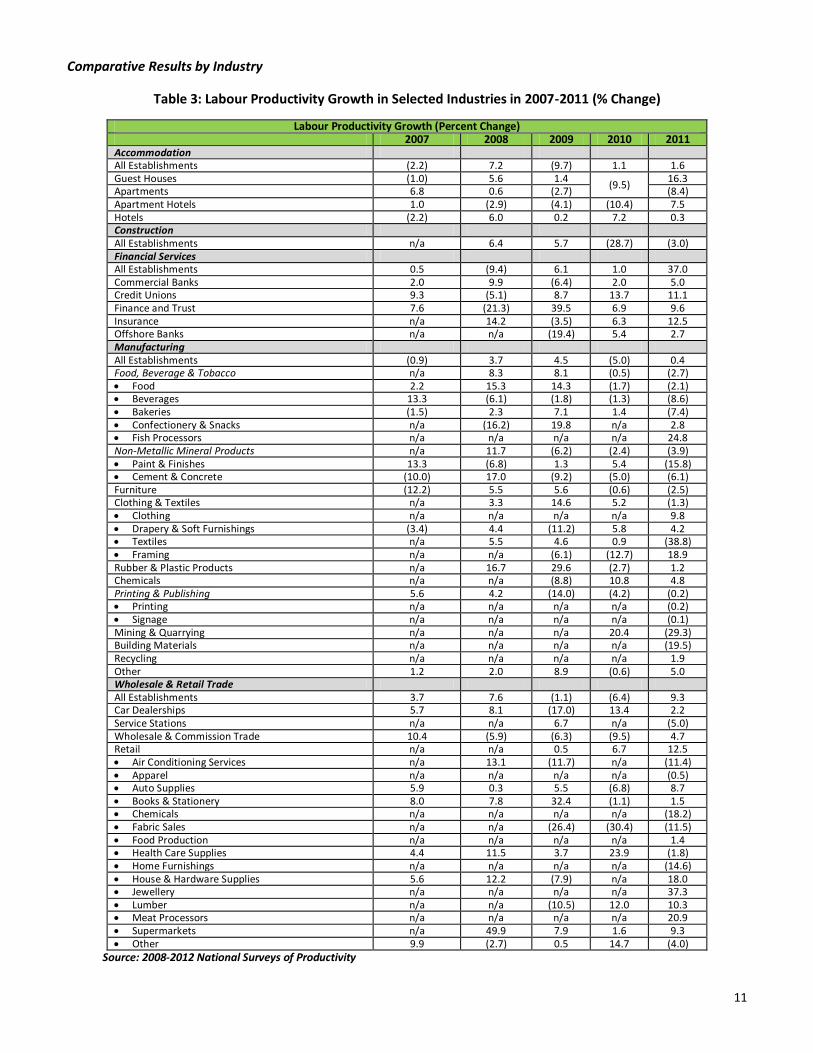
Table 3: Labour Productivity Growth in Selected Industries in 2007-2011 (% Change)
Labour Productivity Growth (Percent Change) 2007 2008 2009 2010 2011
Accommodation All Establishments (2.2) 7.2 (9.7) 1.1 1.6 Guest Houses (1.0) 5.6 1.4
(9.5) 16.3
Apartments 6.8 0.6 (2.7) (8.4) Apartment Hotels 1.0 (2.9) (4.1) (10.4) 7.5 Hotels (2.2) 6.0 0.2 7.2 0.3 Construction All Establishments n/a 6.4 5.7 (28.7) (3.0) Financial Services All Establishments 0.5 (9.4) 6.1 1.0 37.0 Commercial Banks 2.0 9.9 (6.4) 2.0 5.0 Credit Unions 9.3 (5.1) 8.7 13.7 11.1 Finance and Trust 7.6 (21.3) 39.5 6.9 9.6 Insurance n/a 14.2 (3.5) 6.3 12.5 Offshore Banks n/a n/a (19.4) 5.4 2.7 Manufacturing All Establishments (0.9) 3.7 4.5 (5.0) 0.4 Food, Beverage & Tobacco n/a 8.3 8.1 (0.5) (2.7) Food 2.2 15.3 14.3 (1.7) (2.1) Beverages 13.3 (6.1) (1.8) (1.3) (8.6) Bakeries (1.5) 2.3 7.1 1.4 (7.4) Confectionery & Snacks n/a (16.2) 19.8 n/a 2.8 Fish Processors n/a n/a n/a n/a 24.8 Non-Metallic Mineral Products n/a 11.7 (6.2) (2.4) (3.9) Paint & Finishes 13.3 (6.8) 1.3 5.4 (15.8) Cement & Concrete (10.0) 17.0 (9.2) (5.0) (6.1) Furniture (12.2) 5.5 5.6 (0.6) (2.5) Clothing & Textiles n/a 3.3 14.6 5.2 (1.3) Clothing n/a n/a n/a n/a 9.8 Drapery & Soft Furnishings (3.4) 4.4 (11.2) 5.8 4.2 Textiles n/a 5.5 4.6 0.9 (38.8) Framing n/a n/a (6.1) (12.7) 18.9 Rubber & Plastic Products n/a 16.7 29.6 (2.7) 1.2 Chemicals n/a n/a (8.8) 10.8 4.8 Printing & Publishing 5.6 4.2 (14.0) (4.2) (0.2) Printing n/a n/a n/a n/a (0.2) Signage n/a n/a n/a n/a (0.1) Mining & Quarrying n/a n/a n/a 20.4 (29.3) Building Materials n/a n/a n/a n/a (19.5) Recycling n/a n/a n/a n/a 1.9 Other 1.2 2.0 8.9 (0.6) 5.0 Wholesale & Retail Trade All Establishments 3.7 7.6 (1.1) (6.4) 9.3 Car Dealerships 5.7 8.1 (17.0) 13.4 2.2 Service Stations n/a n/a 6.7 n/a (5.0) Wholesale & Commission Trade 10.4 (5.9) (6.3) (9.5) 4.7 Retail n/a n/a 0.5 6.7 12.5 Air Conditioning Services n/a 13.1 (11.7) n/a (11.4) Apparel n/a n/a n/a n/a (0.5) Auto Supplies 5.9 0.3 5.5 (6.8) 8.7 Books & Stationery 8.0 7.8 32.4 (1.1) 1.5 Chemicals n/a n/a n/a n/a (18.2) Fabric Sales n/a n/a (26.4) (30.4) (11.5) Food Production n/a n/a n/a n/a 1.4 Health Care Supplies 4.4 11.5 3.7 23.9 (1.8) Home Furnishings n/a n/a n/a n/a (14.6) House & Hardware Supplies 5.6 12.2 (7.9) n/a 18.0 Jewellery n/a n/a n/a n/a 37.3 Lumber n/a n/a (10.5) 12.0 10.3 Meat Processors n/a n/a n/a n/a 20.9 Supermarkets n/a 49.9 7.9 1.6 9.3 Other 9.9 (2.7) 0.5 14.7 (4.0)
Source: 2008-2012 National Surveys of Productivity

12
Figure 5: Labour Productivity in Five Industries Surveyed 2012 (% Change)
Source: 2012 National Survey of Productivity
Productivity Indicators Labour Productivity Growth Productivity growth was calculated for all the sub-sectors within the five (5) industries. Table 3 shows the estimated rates of change in labour productivity for the establishment classifications within the five (5) industries surveyed. On average, the financial services sector had the best overall rate of productivity growth (37.0 percent), while construction for the second straight year had the worst with a contraction of 3.0 percent. Within the sub-sectors, the highest estimated positive labour productivity growth was registered in the retail – jewellery (37.3 percent), food, beverage and tobacco – fish processors (24.8 percent); clothing and textiles – framing (18.9 percent) and retail – house and hardware supplies (18.0 percent). Conversely, the lowest registered negative productivity growth rates in the sub-sectors were in the clothing and textiles – textiles (38.8 percent), mining and quarrying (29.3 percent), building materials (19.5 percent) and non-metallic mineral products – paints and finishes (15.8 percent). Accommodation Establishments From the 2012 National Survey of Productivity, productivity growth in this sector of the economy rose slightly by approximately 1.6 percent. One sub-sector – apartments registered a contraction of 8.4 percent; while the highest expansion was recorded in the guest houses sub-sector (16.3 percent). The hotel sub-grouping produced a small increase in labour productivity of 0.3 percent and to round out the sector, apartment hotels expanded by 7.5 percent. (See Table 3) Construction Companies In 2011, labour productivity within the construction industry contracted by 3.0 percent; however this was less than the decrease recorded in 2010 of 28.7 percent. (See Table 3)
1.6
-3
37
0.4 9.3
3.7 6.4 15.3
-0.4
12.1
32.83 27.6 28.24
78.55
35.8
-10
0
10
20
30
40
50
60
70
80
90
Acc
om
mo
dati
on
Co
nstr
ucti
on
Fin
an
cia
l S
erv
ice
s
Man
ufa
ctu
rin
g
Wh
ole
sale
& R
eta
il
Productivity Output per Employee Unit Labour Cost

13
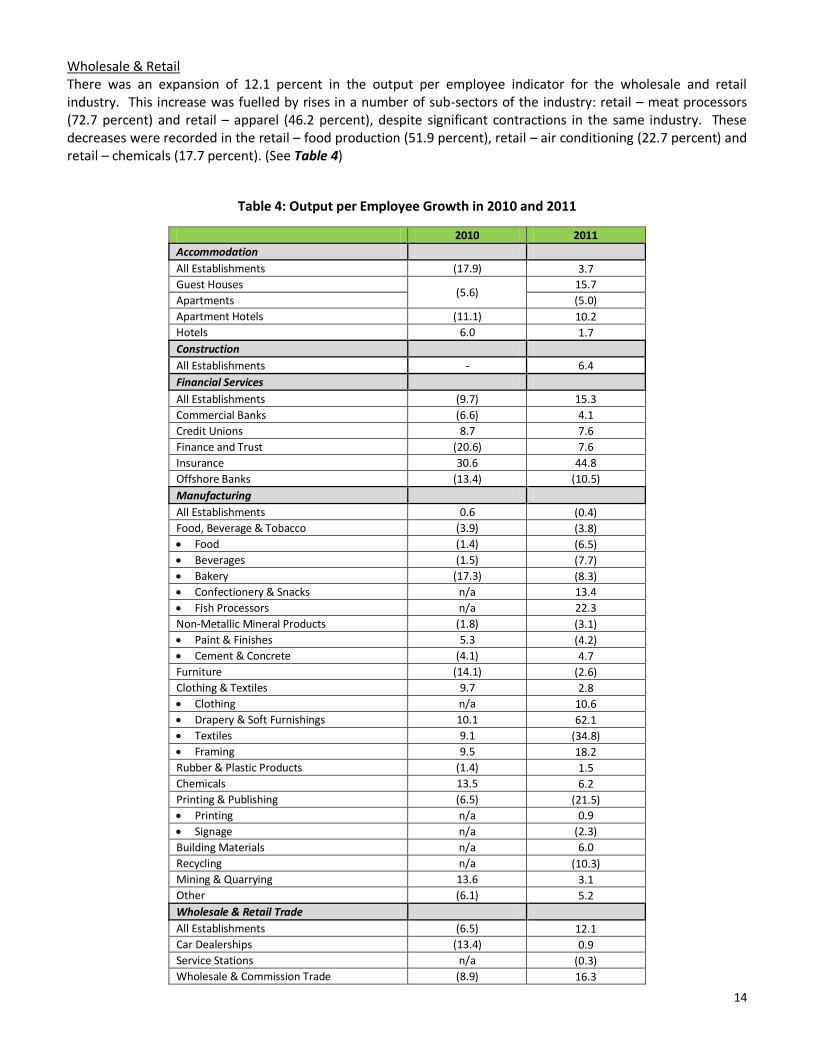
Financial Services Institutions Labour productivity in the financial services institutions increased by 37.0 percent in 2011, following a slight expansion in 2010 of 1.0 percent. This sector registered the largest rise in labour productivity for the five (5) sectors under review. All sub-sectors recorded positive growth from 2.7 percent in offshore banks to 12.5 percent in the insurance sub-sector. (See Table 3) Manufacturing Establishments Labour productivity among the manufacturing firms surveyed rose ever so slightly by 0.4 percent in 2011, after a contraction of approximately 5.0 percent in 2010. Significant reductions were registered for clothing and textiles – textiles (38.8 percent), mining and quarrying (29.3 percent), building materials (19.5 percent) and non-metallic mineral products – paints and finishes (15.8 percent). Conversely, large expansions were recorded for food, beverage and tobacco – fish processors (24.8 percent), clothing and textiles – framing (18.9 percent) and clothing and textile – clothing (9.8 percent). (See Table 3) Wholesale & Retail Trade Establishments High productivity growth rates were recorded for five (5) of the wholesale and retail trade sub-sectors, namely retail – jewellery (37.3 percent), retail – meat processors (20.9 percent) house and hardware supplies (18.0 percent) and retail (12.5 percent). Contractions were registered for eight (8) sub-sectors within the industry: chemicals (18.2 percent), home furnishings (14.6 percent), fabric sales (11.5 percent), air conditioning (11.4 percent), service stations (5.0), other (4.0 percent), health care supplies (1.8 percent) and apparel (0.5 percent). (See Table 3) Output per Employee Growth The most significant increase recorded in the five (5) sectors under review was in the financial services sector (15.3 percent) followed by the wholesale and retail trade (12.1 percent). However, larger expansions were estimated for retail – meat processors (72.7 percent), clothing and textiles – drapery and soft furnishings (62.1 percent), retail – apparel (46.2 percent) and insurance (44.8 percent). (See Table 4) Accommodation Output per employee for this industry was an estimated 3.7 percent, as a result of expansions in the guest houses (15.7 percent), apartment hotels (10.2 percent) and hotels (1.7 percent) sub-groupings. The final sub-sector – apartments registered the only decrease for the industry (5.0 percent). (See Table 4) Construction There was a 6.4 percent change in the output per employee indicator for the construction companies participating in 2012 National Survey of Productivity. (See Table 4) Financial Services The output per employee ratio for this sector estimated to have expanded by approximately 15.3 percent. This increase was due mainly to the insurance sub-sector (44.8 percent) and the credit union and finance and trust sub-groupings (7.6 percent) for both. One contraction was registered for the output per employee indicator in the offshore banking sector (10.5 percent). (See Table 4) Manufacturing The manufacturing industry was the sole industry registering a decline in output per employee (0.4 percent). This sector registered major contractions of 34.8 percent – clothing and textiles (textiles), 21.5 percent – printing and publishing and 10.3 percent – recycling. This significantly outweighed large expansions of 62.1 percent – clothing and textiles (drapery and soft furnishings), 22.3 percent – food, beverage and tobacco (fish processors), 18.2 percent – clothing and textiles (framing), 13.4 percent – food, beverages and tobacco (confectionery and snacks), and 10.6 percent – clothing and textiles – clothing. (See Table 4)
14
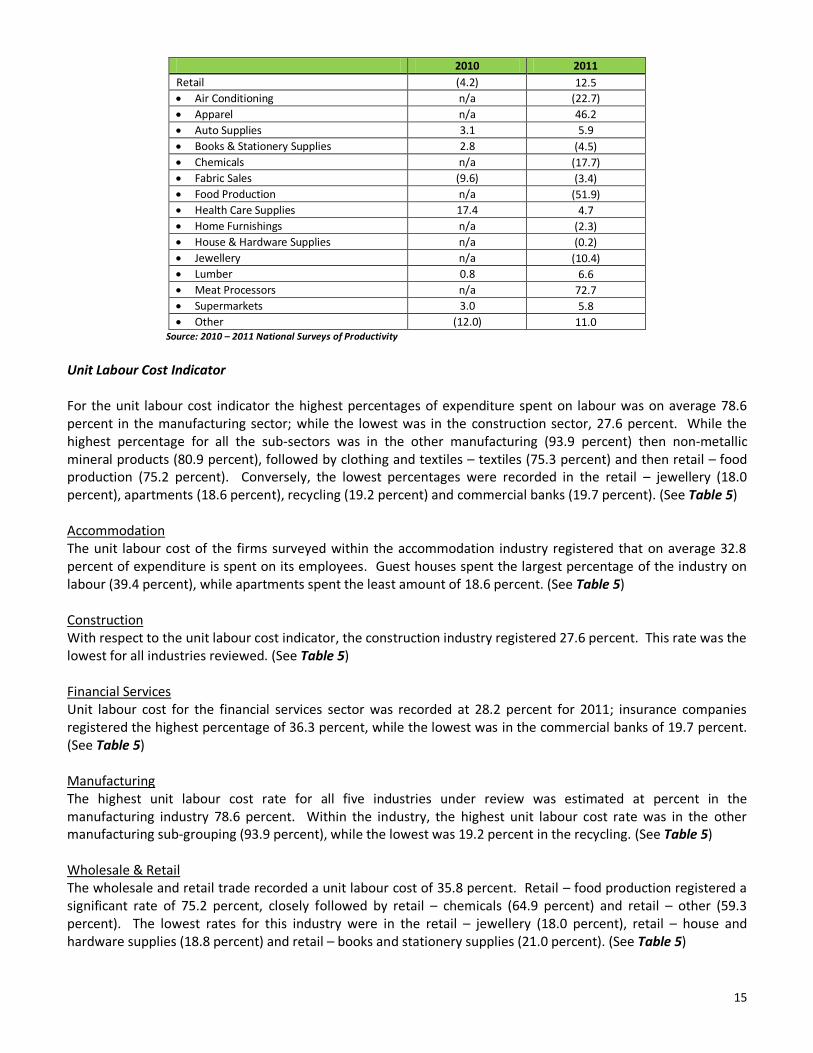
Wholesale & Retail There was an expansion of 12.1 percent in the output per employee indicator for the wholesale and retail industry. This increase was fuelled by rises in a number of sub-sectors of the industry: retail – meat processors (72.7 percent) and retail – apparel (46.2 percent), despite significant contractions in the same industry. These decreases were recorded in the retail – food production (51.9 percent), retail – air conditioning (22.7 percent) and retail – chemicals (17.7 percent). (See Table 4)
Table 4: Output per Employee Growth in 2010 and 2011
2010 2011
Accommodation
All Establishments (17.9) 3.7
Guest Houses (5.6)
15.7
Apartments (5.0)
Apartment Hotels (11.1) 10.2
Hotels 6.0 1.7
Construction
All Establishments - 6.4
Financial Services
All Establishments (9.7) 15.3
Commercial Banks (6.6) 4.1
Credit Unions 8.7 7.6
Finance and Trust (20.6) 7.6
Insurance 30.6 44.8
Offshore Banks (13.4) (10.5)
Manufacturing
All Establishments 0.6 (0.4)
Food, Beverage & Tobacco (3.9) (3.8)
Food (1.4) (6.5)
Beverages (1.5) (7.7)
Bakery (17.3) (8.3)
Confectionery & Snacks n/a 13.4
Fish Processors n/a 22.3
Non-Metallic Mineral Products (1.8) (3.1)
Paint & Finishes 5.3 (4.2)
Cement & Concrete (4.1) 4.7
Furniture (14.1) (2.6)
Clothing & Textiles 9.7 2.8
Clothing n/a 10.6
Drapery & Soft Furnishings 10.1 62.1
Textiles 9.1 (34.8)
Framing 9.5 18.2
Rubber & Plastic Products (1.4) 1.5
Chemicals 13.5 6.2
Printing & Publishing (6.5) (21.5)
Printing n/a 0.9
Signage n/a (2.3)
Building Materials n/a 6.0
Recycling n/a (10.3)
Mining & Quarrying 13.6 3.1
Other (6.1) 5.2
Wholesale & Retail Trade
All Establishments (6.5) 12.1
Car Dealerships (13.4) 0.9
Service Stations n/a (0.3)
Wholesale & Commission Trade (8.9) 16.3
15
2010 2011
Retail (4.2) 12.5
Air Conditioning n/a (22.7)
Apparel n/a 46.2
Auto Supplies 3.1 5.9
Books & Stationery Supplies 2.8 (4.5)
Chemicals n/a (17.7)
Fabric Sales (9.6) (3.4)
Food Production n/a (51.9)
Health Care Supplies 17.4 4.7
Home Furnishings n/a (2.3)
House & Hardware Supplies n/a (0.2)
Jewellery n/a (10.4)
Lumber 0.8 6.6
Meat Processors n/a 72.7
Supermarkets 3.0 5.8
Other (12.0) 11.0 Source: 2010 – 2011 National Surveys of Productivity
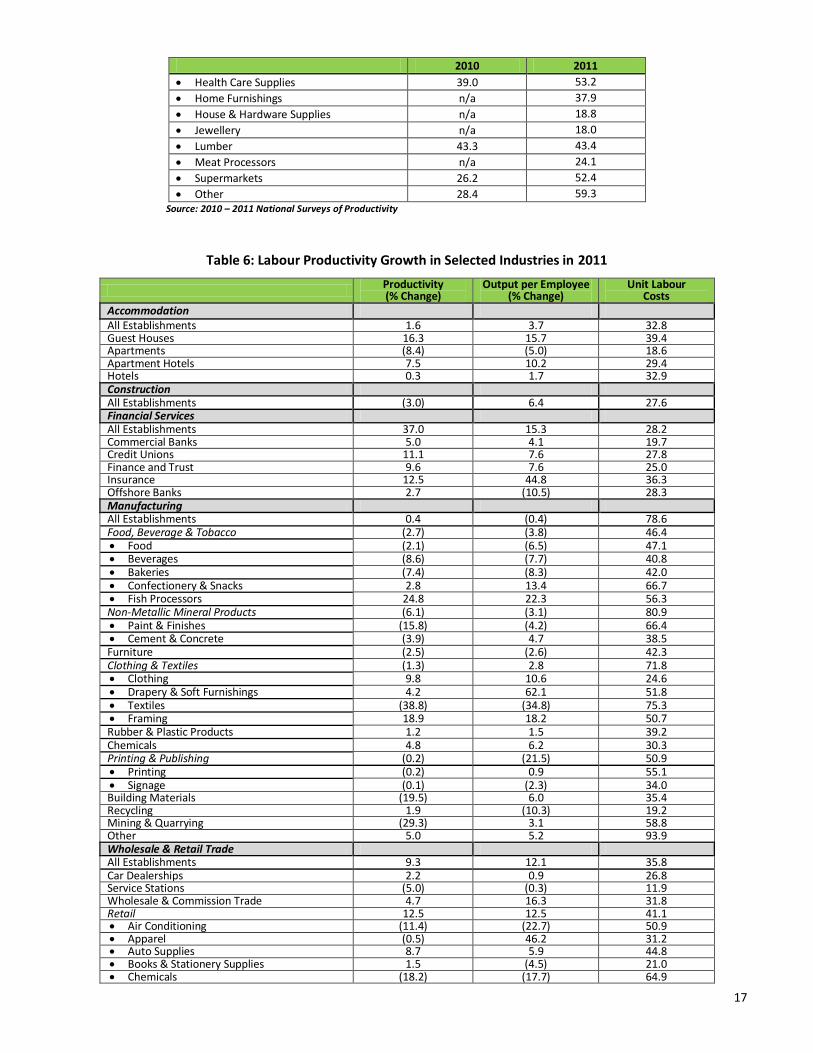
Unit Labour Cost Indicator For the unit labour cost indicator the highest percentages of expenditure spent on labour was on average 78.6 percent in the manufacturing sector; while the lowest was in the construction sector, 27.6 percent. While the highest percentage for all the sub-sectors was in the other manufacturing (93.9 percent) then non-metallic mineral products (80.9 percent), followed by clothing and textiles – textiles (75.3 percent) and then retail – food production (75.2 percent). Conversely, the lowest percentages were recorded in the retail – jewellery (18.0 percent), apartments (18.6 percent), recycling (19.2 percent) and commercial banks (19.7 percent). (See Table 5) Accommodation The unit labour cost of the firms surveyed within the accommodation industry registered that on average 32.8 percent of expenditure is spent on its employees. Guest houses spent the largest percentage of the industry on labour (39.4 percent), while apartments spent the least amount of 18.6 percent. (See Table 5) Construction With respect to the unit labour cost indicator, the construction industry registered 27.6 percent. This rate was the lowest for all industries reviewed. (See Table 5) Financial Services Unit labour cost for the financial services sector was recorded at 28.2 percent for 2011; insurance companies registered the highest percentage of 36.3 percent, while the lowest was in the commercial banks of 19.7 percent. (See Table 5) Manufacturing The highest unit labour cost rate for all five industries under review was estimated at percent in the manufacturing industry 78.6 percent. Within the industry, the highest unit labour cost rate was in the other manufacturing sub-grouping (93.9 percent), while the lowest was 19.2 percent in the recycling. (See Table 5) Wholesale & Retail The wholesale and retail trade recorded a unit labour cost of 35.8 percent. Retail – food production registered a significant rate of 75.2 percent, closely followed by retail – chemicals (64.9 percent) and retail – other (59.3 percent). The lowest rates for this industry were in the retail – jewellery (18.0 percent), retail – house and hardware supplies (18.8 percent) and retail – books and stationery supplies (21.0 percent). (See Table 5)

16
Table 5: Unit Labour Cost in 2010 and 2011
2010 2011
Accommodation
All Establishments 26.2 32.8
Guest Houses 28.4
39.4
Apartments 18.6
Apartment Hotels 40.1 29.4
Hotels 25.8 32.9
Construction
All Establishments 31.8 27.6
Financial Services
All Establishments 23.5 28.2 Commercial Banks 27.3 19.7 Credit Unions 26.9 27.8 Finance and Trust 16.8 25.0 Insurance 16.8 36.3 Offshore Banks 26.1 28.3
Manufacturing
All Establishments 54.0 78.6 Food, Beverage & Tobacco 30.0 46.4 Food 28.0 47.1 Beverages 10.0 40.8 Bakery 17.0 42.0 Confectionery & Snacks n/a 66.7
Fish Processors n/a 56.3
Non-Metallic Mineral Products 30.0 80.9 Paint & Finishes 38.0 66.4 Cement & Concrete 24.0 38.5 Furniture 29.0 42.3 Clothing & Textiles 50.0 71.8 Clothing n/a 24.6 Drapery & Soft Furnishings 36.0 51.8 Textiles 14.0 75.3 Framing 29.0 50.7 Rubber & Plastic Products 31.0 39.2 Chemicals 24.0 30.3 Printing & Publishing 63.0 50.9 Printing n/a 55.1
Signage n/a 34.0
Building Materials n/a 35.4
Recycling n/a 19.2
Mining & Quarrying 20.0 58.8
Other 21.0 93.9
Wholesale & Retail Trade
All Establishments 20.0 35.8
Car Dealerships 20.0 26.8
Service Stations n/a 11.9
Wholesale & Commission Trade 12.3 31.8
Retail 27.2 41.1
Air Conditioning n/a 50.9
Apparel n/a 31.2
Auto Supplies 25.9 44.8
Books & Stationery Supplies 26.7 21.0
Chemicals n/a 64.9
Fabric Sales 20.0 43.3
Food Production n/a 75.2
17
2010 2011
Health Care Supplies 39.0 53.2
Home Furnishings n/a 37.9
House & Hardware Supplies n/a 18.8
Jewellery n/a 18.0
Lumber 43.3 43.4
Meat Processors n/a 24.1
Supermarkets 26.2 52.4
Other 28.4 59.3 Source: 2010 – 2011 National Surveys of Productivity
Table 6: Labour Productivity Growth in Selected Industries in 2011
Productivity (% Change)
Output per Employee (% Change)
Unit Labour Costs
Accommodation All Establishments 1.6 3.7 32.8 Guest Houses 16.3 15.7 39.4 Apartments (8.4) (5.0) 18.6 Apartment Hotels 7.5 10.2 29.4 Hotels 0.3 1.7 32.9 Construction All Establishments (3.0) 6.4 27.6 Financial Services All Establishments 37.0 15.3 28.2 Commercial Banks 5.0 4.1 19.7 Credit Unions 11.1 7.6 27.8 Finance and Trust 9.6 7.6 25.0 Insurance 12.5 44.8 36.3 Offshore Banks 2.7 (10.5) 28.3 Manufacturing All Establishments 0.4 (0.4) 78.6 Food, Beverage & Tobacco (2.7) (3.8) 46.4 Food (2.1) (6.5) 47.1 Beverages (8.6) (7.7) 40.8 Bakeries (7.4) (8.3) 42.0 Confectionery & Snacks 2.8 13.4 66.7 Fish Processors 24.8 22.3 56.3 Non-Metallic Mineral Products (6.1) (3.1) 80.9 Paint & Finishes (15.8) (4.2) 66.4 Cement & Concrete (3.9) 4.7 38.5 Furniture (2.5) (2.6) 42.3 Clothing & Textiles (1.3) 2.8 71.8 Clothing 9.8 10.6 24.6 Drapery & Soft Furnishings 4.2 62.1 51.8 Textiles (38.8) (34.8) 75.3 Framing 18.9 18.2 50.7 Rubber & Plastic Products 1.2 1.5 39.2 Chemicals 4.8 6.2 30.3 Printing & Publishing (0.2) (21.5) 50.9 Printing (0.2) 0.9 55.1 Signage (0.1) (2.3) 34.0 Building Materials (19.5) 6.0 35.4 Recycling 1.9 (10.3) 19.2 Mining & Quarrying (29.3) 3.1 58.8 Other 5.0 5.2 93.9 Wholesale & Retail Trade All Establishments 9.3 12.1 35.8 Car Dealerships 2.2 0.9 26.8 Service Stations (5.0) (0.3) 11.9 Wholesale & Commission Trade 4.7 16.3 31.8 Retail 12.5 12.5 41.1 Air Conditioning (11.4) (22.7) 50.9 Apparel (0.5) 46.2 31.2 Auto Supplies 8.7 5.9 44.8 Books & Stationery Supplies 1.5 (4.5) 21.0 Chemicals (18.2) (17.7) 64.9
18
Productivity (% Change)
Output per Employee (% Change)
Unit Labour Costs
Fabric Sales (11.5) (3.4) 43.3 Food Production 1.4 (51.9) 75.2 Health Care Supplies (1.8) (0.2) 53.2 Home Furnishings (14.6) (2.3) 37.9 House & Hardware Supplies 18.0 4.7 18.8 Jewellery 37.3 10.4 18.0 Lumber 10.3 6.6 43.4 Meat Processors 20.9 72.7 24.1 Supermarkets 9.3 5.8 52.4 Other (4.0) 11.0 59.3
Source: 2012 National Survey of Productivity
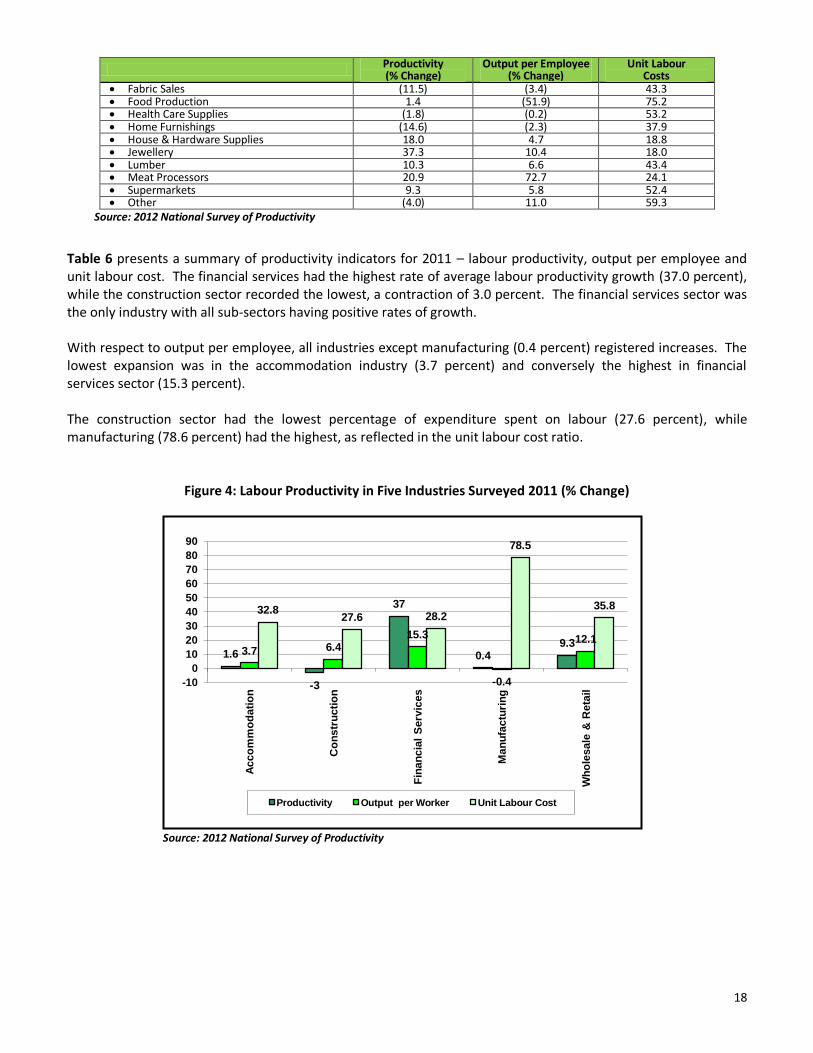
Table 6 presents a summary of productivity indicators for 2011 – labour productivity, output per employee and unit labour cost. The financial services had the highest rate of average labour productivity growth (37.0 percent), while the construction sector recorded the lowest, a contraction of 3.0 percent. The financial services sector was the only industry with all sub-sectors having positive rates of growth. With respect to output per employee, all industries except manufacturing (0.4 percent) registered increases. The lowest expansion was in the accommodation industry (3.7 percent) and conversely the highest in financial services sector (15.3 percent). The construction sector had the lowest percentage of expenditure spent on labour (27.6 percent), while manufacturing (78.6 percent) had the highest, as reflected in the unit labour cost ratio.
Figure 4: Labour Productivity in Five Industries Surveyed 2011 (% Change)
Source: 2012 National Survey of Productivity
1.6
-3
37
0.4 9.3
3.7 6.4 15.3
-0.4
12.1
32.8 27.6 28.2
78.5
35.8
-10
0
10
20
30
40
50
60
70
80
90
Acc
om
mo
dati
on
Co
nstr
ucti
on
Fin
an
cia
l S
erv
ice
s
Man
ufa
ctu
rin
g
Wh
ole
sale
& R
eta
il
Productivity Output per Worker Unit Labour Cost
19
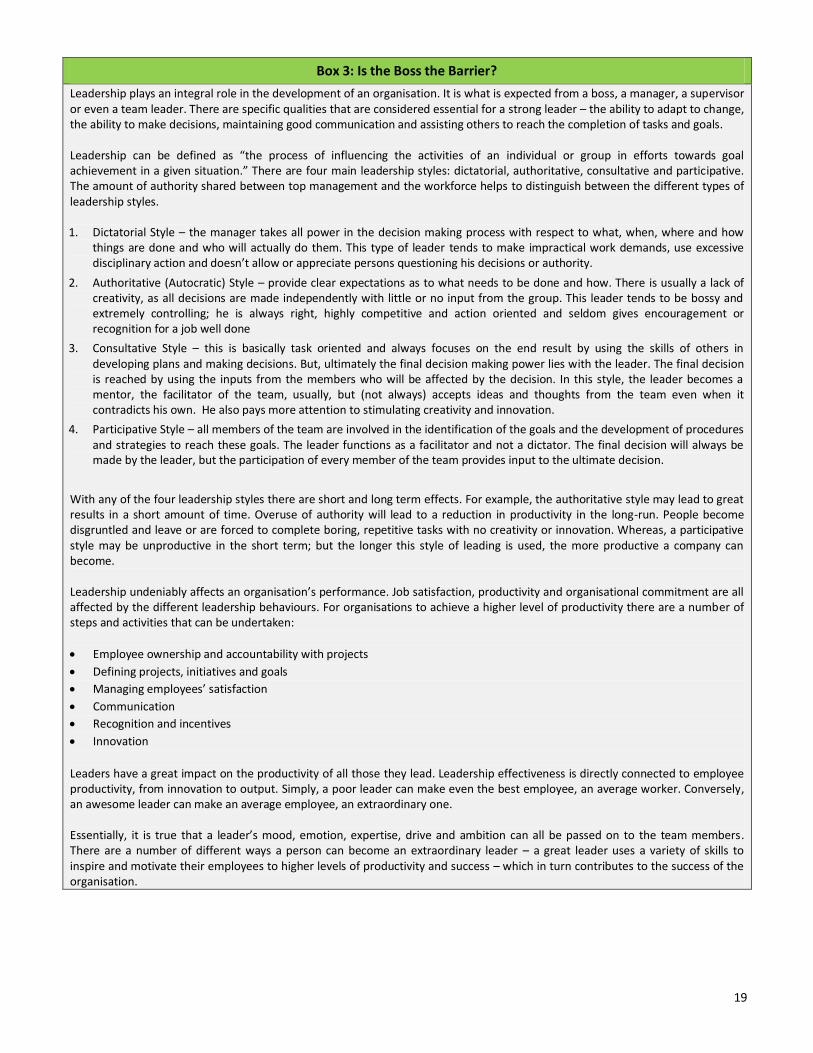
Box 3: Is the Boss the Barrier?
Leadership plays an integral role in the development of an organisation. It is what is expected from a boss, a manager, a supervisor or even a team leader. There are specific qualities that are considered essential for a strong leader – the ability to adapt to change, the ability to make decisions, maintaining good communication and assisting others to reach the completion of tasks and goals. Leadership can be defined as “the process of influencing the activities of an individual or group in efforts towards goal achievement in a given situation.” There are four main leadership styles: dictatorial, authoritative, consultative and participative. The amount of authority shared between top management and the workforce helps to distinguish between the different types of leadership styles. 1. Dictatorial Style – the manager takes all power in the decision making process with respect to what, when, where and how
things are done and who will actually do them. This type of leader tends to make impractical work demands, use excessive disciplinary action and doesn’t allow or appreciate persons questioning his decisions or authority.
2. Authoritative (Autocratic) Style – provide clear expectations as to what needs to be done and how. There is usually a lack of creativity, as all decisions are made independently with little or no input from the group. This leader tends to be bossy and extremely controlling; he is always right, highly competitive and action oriented and seldom gives encouragement or recognition for a job well done
3. Consultative Style – this is basically task oriented and always focuses on the end result by using the skills of others in developing plans and making decisions. But, ultimately the final decision making power lies with the leader. The final decision is reached by using the inputs from the members who will be affected by the decision. In this style, the leader becomes a mentor, the facilitator of the team, usually, but (not always) accepts ideas and thoughts from the team even when it contradicts his own. He also pays more attention to stimulating creativity and innovation.
4. Participative Style – all members of the team are involved in the identification of the goals and the development of procedures and strategies to reach these goals. The leader functions as a facilitator and not a dictator. The final decision will always be made by the leader, but the participation of every member of the team provides input to the ultimate decision.
With any of the four leadership styles there are short and long term effects. For example, the authoritative style may lead to great results in a short amount of time. Overuse of authority will lead to a reduction in productivity in the long-run. People become disgruntled and leave or are forced to complete boring, repetitive tasks with no creativity or innovation. Whereas, a participative style may be unproductive in the short term; but the longer this style of leading is used, the more productive a company can become. Leadership undeniably affects an organisation’s performance. Job satisfaction, productivity and organisational commitment are all affected by the different leadership behaviours. For organisations to achieve a higher level of productivity there are a number of steps and activities that can be undertaken: Employee ownership and accountability with projects
Defining projects, initiatives and goals
Managing employees’ satisfaction
Communication
Recognition and incentives
Innovation
Leaders have a great impact on the productivity of all those they lead. Leadership effectiveness is directly connected to employee productivity, from innovation to output. Simply, a poor leader can make even the best employee, an average worker. Conversely, an awesome leader can make an average employee, an extraordinary one. Essentially, it is true that a leader’s mood, emotion, expertise, drive and ambition can all be passed on to the team members. There are a number of different ways a person can become an extraordinary leader – a great leader uses a variety of skills to inspire and motivate their employees to higher levels of productivity and success – which in turn contributes to the success of the organisation.
20
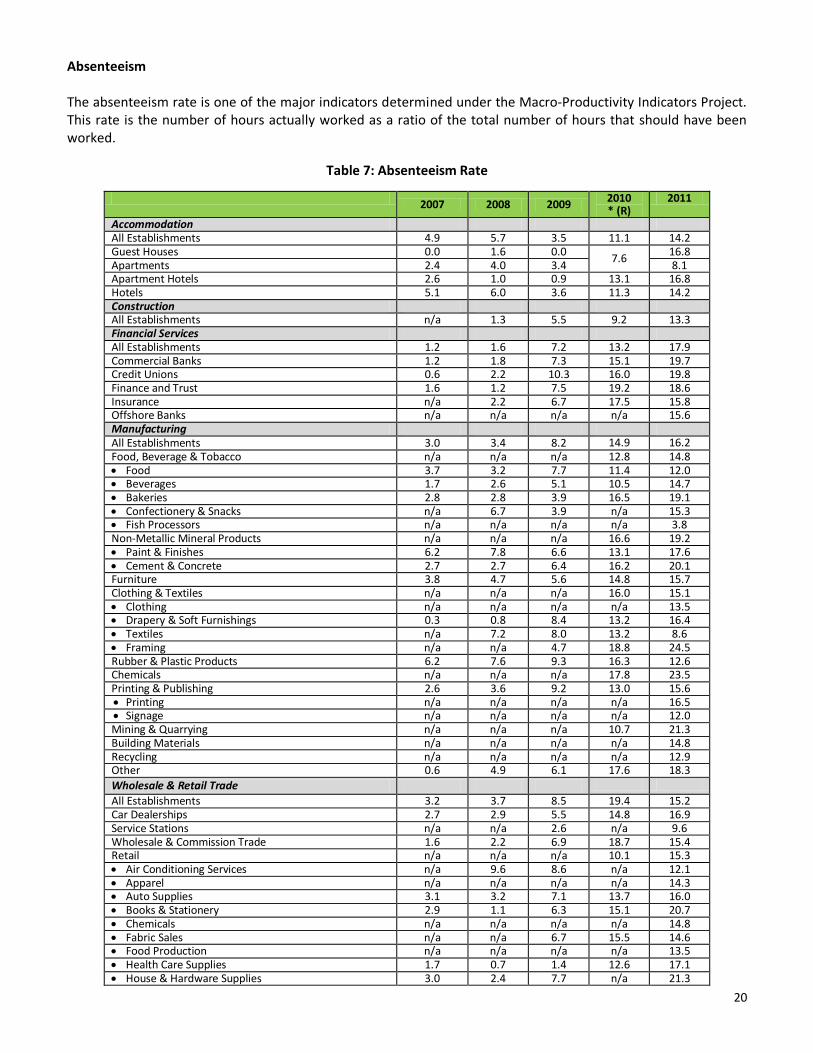
Absenteeism The absenteeism rate is one of the major indicators determined under the Macro-Productivity Indicators Project. This rate is the number of hours actually worked as a ratio of the total number of hours that should have been worked.
Table 7: Absenteeism Rate
2007 2008 2009
2010 * (R)
2011
Accommodation All Establishments 4.9 5.7 3.5 11.1 14.2 Guest Houses 0.0 1.6 0.0
7.6 16.8
Apartments 2.4 4.0 3.4 8.1 Apartment Hotels 2.6 1.0 0.9 13.1 16.8 Hotels 5.1 6.0 3.6 11.3 14.2 Construction All Establishments n/a 1.3 5.5 9.2 13.3 Financial Services All Establishments 1.2 1.6 7.2 13.2 17.9 Commercial Banks 1.2 1.8 7.3 15.1 19.7 Credit Unions 0.6 2.2 10.3 16.0 19.8 Finance and Trust 1.6 1.2 7.5 19.2 18.6 Insurance n/a 2.2 6.7 17.5 15.8 Offshore Banks n/a n/a n/a n/a 15.6 Manufacturing All Establishments 3.0 3.4 8.2 14.9 16.2 Food, Beverage & Tobacco n/a n/a n/a 12.8 14.8 Food 3.7 3.2 7.7 11.4 12.0 Beverages 1.7 2.6 5.1 10.5 14.7 Bakeries 2.8 2.8 3.9 16.5 19.1 Confectionery & Snacks n/a 6.7 3.9 n/a 15.3 Fish Processors n/a n/a n/a n/a 3.8 Non-Metallic Mineral Products n/a n/a n/a 16.6 19.2 Paint & Finishes 6.2 7.8 6.6 13.1 17.6 Cement & Concrete 2.7 2.7 6.4 16.2 20.1 Furniture 3.8 4.7 5.6 14.8 15.7 Clothing & Textiles n/a n/a n/a 16.0 15.1 Clothing n/a n/a n/a n/a 13.5 Drapery & Soft Furnishings 0.3 0.8 8.4 13.2 16.4 Textiles n/a 7.2 8.0 13.2 8.6 Framing n/a n/a 4.7 18.8 24.5 Rubber & Plastic Products 6.2 7.6 9.3 16.3 12.6 Chemicals n/a n/a n/a 17.8 23.5 Printing & Publishing 2.6 3.6 9.2 13.0 15.6 Printing n/a n/a n/a n/a 16.5 Signage n/a n/a n/a n/a 12.0 Mining & Quarrying n/a n/a n/a 10.7 21.3 Building Materials n/a n/a n/a n/a 14.8 Recycling n/a n/a n/a n/a 12.9 Other 0.6 4.9 6.1 17.6 18.3
Wholesale & Retail Trade
All Establishments 3.2 3.7 8.5 19.4 15.2 Car Dealerships 2.7 2.9 5.5 14.8 16.9 Service Stations n/a n/a 2.6 n/a 9.6 Wholesale & Commission Trade 1.6 2.2 6.9 18.7 15.4 Retail n/a n/a n/a 10.1 15.3 Air Conditioning Services n/a 9.6 8.6 n/a 12.1 Apparel n/a n/a n/a n/a 14.3 Auto Supplies 3.1 3.2 7.1 13.7 16.0 Books & Stationery 2.9 1.1 6.3 15.1 20.7 Chemicals n/a n/a n/a n/a 14.8 Fabric Sales n/a n/a 6.7 15.5 14.6 Food Production n/a n/a n/a n/a 13.5 Health Care Supplies 1.7 0.7 1.4 12.6 17.1 House & Hardware Supplies 3.0 2.4 7.7 n/a 21.3

21
2007 2008 2009
2010 * (R)
2011
Home Furnishings n/a n/a n/a n/a 16.3 Jewellery n/a n/a n/a n/a 12.5 Lumber n/a n/a 11.4 17.7 19.5 Meat Processors n/a n/a n/a n/a 16.9 Supermarkets 4.2 4.9 12.5 17.1 11.6 Other 2.9 7.9 3.2 14.8 12.8
Source: 2008-2012 National Surveys of Productivity *All figures have been revised using a new formula for Absenteeism Rate.
The lowest absenteeism rate recorded overall for the industries in 2011 was in the construction industry 13.3 percent. With regards to the sub-sectors under review, food, beverage and tobacco – fish processors had the lowest overall average absenteeism rate (3.8 percent). This was followed by apartments (8.1 percent), clothing and textiles – craft (8.6 percent) and service stations (9.6 percent). The highest absenteeism rate for the industries was in the financial services sector – 17.9 percent. However, significant absenteeism rates were registered for clothing and textiles – framing (24.5 percent), chemicals (23.5 percent), retail – home furnishings and mining and quarrying both (21.3 percent), retail – books and stationery (20.7 percent) and non-metallic mineral products – cement and concrete (20.1 percent).
Figure 6: Absenteeism Rate for Five Industries Surveyed 2007 – 2011
Source: 2008-2012 National Surveys of Productivity
0
2
4
6
8
10
12
14
16
18
20
Accommodation Construction Financial Services Manfacturing Wholesale & Retail
2007 2008 2009 2010 2011
22
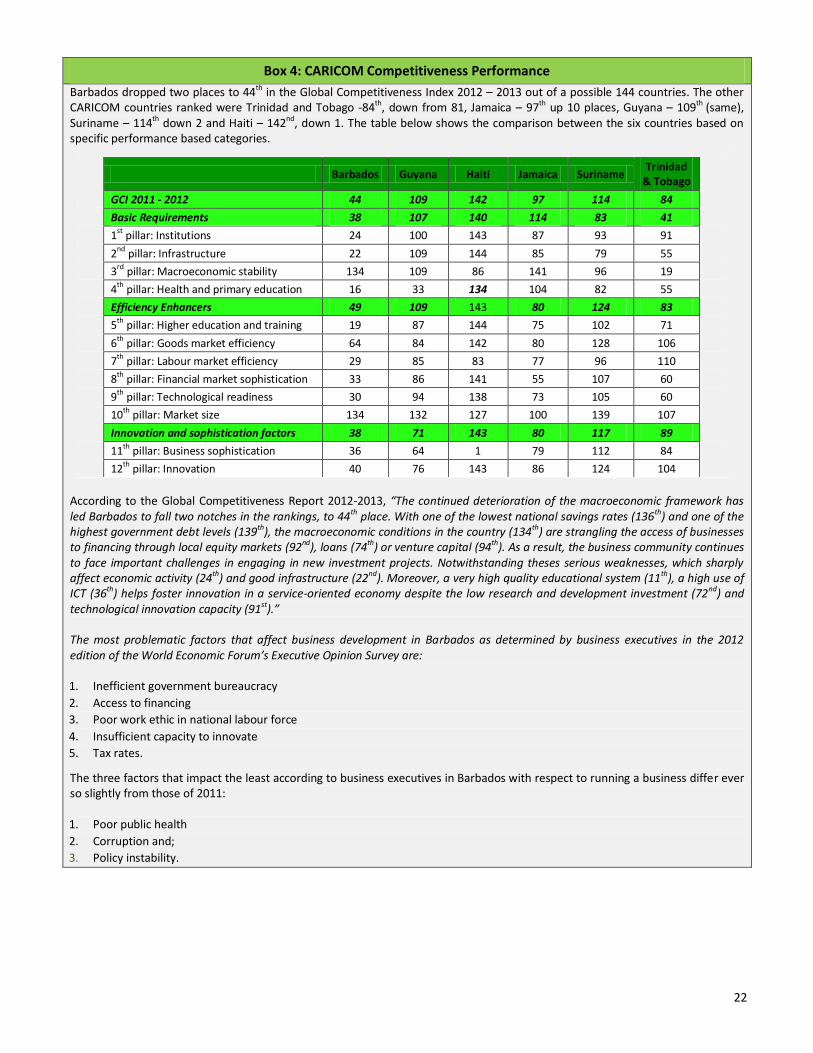
Box 4: CARICOM Competitiveness Performance
Barbados dropped two places to 44th in the Global Competitiveness Index 2012 – 2013 out of a possible 144 countries. The other CARICOM countries ranked were Trinidad and Tobago -84th, down from 81, Jamaica – 97th up 10 places, Guyana – 109th (same), Suriname – 114th down 2 and Haiti – 142nd, down 1. The table below shows the comparison between the six countries based on specific performance based categories.
Barbados Guyana Haiti Jamaica Suriname Trinidad
& Tobago
GCI 2011 - 2012 44 109 142 97 114 84
Basic Requirements 38 107 140 114 83 41
1st pillar: Institutions 24 100 143 87 93 91
2nd
pillar: Infrastructure 22 109 144 85 79 55
3rd pillar: Macroeconomic stability 134 109 86 141 96 19
4th pillar: Health and primary education 16 33 134 104 82 55
Efficiency Enhancers 49 109 143 80 124 83
5th pillar: Higher education and training 19 87 144 75 102 71
6th pillar: Goods market efficiency 64 84 142 80 128 106
7th pillar: Labour market efficiency 29 85 83 77 96 110
8th pillar: Financial market sophistication 33 86 141 55 107 60
9th pillar: Technological readiness 30 94 138 73 105 60
10th pillar: Market size 134 132 127 100 139 107
Innovation and sophistication factors 38 71 143 80 117 89
11th pillar: Business sophistication 36 64 1 79 112 84
12th pillar: Innovation 40 76 143 86 124 104
According to the Global Competitiveness Report 2012-2013, “The continued deterioration of the macroeconomic framework has led Barbados to fall two notches in the rankings, to 44th place. With one of the lowest national savings rates (136th) and one of the highest government debt levels (139th), the macroeconomic conditions in the country (134th) are strangling the access of businesses to financing through local equity markets (92nd), loans (74th) or venture capital (94th). As a result, the business community continues to face important challenges in engaging in new investment projects. Notwithstanding theses serious weaknesses, which sharply affect economic activity (24th) and good infrastructure (22nd). Moreover, a very high quality educational system (11th), a high use of ICT (36th) helps foster innovation in a service-oriented economy despite the low research and development investment (72nd) and technological innovation capacity (91st).” The most problematic factors that affect business development in Barbados as determined by business executives in the 2012 edition of the World Economic Forum’s Executive Opinion Survey are: 1. Inefficient government bureaucracy
2. Access to financing
3. Poor work ethic in national labour force
4. Insufficient capacity to innovate
5. Tax rates.
The three factors that impact the least according to business executives in Barbados with respect to running a business differ ever so slightly from those of 2011: 1. Poor public health
2. Corruption and;
3. Policy instability.

23
CONCLUSION AND SUMMARY A simple way of looking at productivity in a business organization is to think of it in terms of the productivity model illustrated below. Productivity is basically a ratio to measure how well an organisation (or individual or industry or country) converts input resources (labor, materials, machines, et al.) into goods and services. The Productivity Conceptual Model below takes the form of a 'productivity tree'. The roots denote the inputs to the system, the trunk the conversion process and the foliage and fruits the systems outputs.
Productivity affects everyone in the economy. It drives economic growth and a highly-productive economy means we are able to: produce more goods and services with the same amount of resources (new wealth),
or produce the same level of goods and services with less resources (more wealth)

24
Using the productivity model, improvements can be realised by:
Achieving more output for the same input Achieving the same output from less input Achieving much more output for slightly more input Getting slightly less output for much less input
There are six (6) main ways to improve the productivity ratio of an organisation, these are:
Improve basic processes by research and development (long term) Improve and provide new plant, equipment, and machinery (long term) Simplify product and reduce variety (medium term) Improve existing methods and procedures (short term) Improve the planning of work and the use of manpower (short term) Increase the overall effectiveness of employees (short term)
For the five (5) sectors under review, four (4) registered improvements with respect to productivity growth. The most notable expansion was seen in the financial services sector (37.0 percent), followed by the wholesale and retail trade (9.3 percent). One (1) industry, construction recorded a contraction of 3.0 percent. Output per employee, another labour productivity indicator also recorded expansions for all but one (1) industry – manufacturing (0.4 percent). The largest increase was also in the financial services sector (15.3 percent) closely followed by wholesale and retail trade (12.1 percent). Unit labour costs across the industries ranged from 27.6 percent in construction to 78.6 percent in manufacturing. Within the sub-sectors, low unit labour costs were calculated in retail – jewellery (18.0 percent), apartments (18.6 percent), retail – house and hardware supplies (18.8 percent) and commercial banks (19.7 percent). Conversely, high unit labour costs were recorded for retail – other (93.9 percent), non-metallic mineral products (80.9 percent), retail – food production (75.2 percent), clothing and textiles (71.8 percent), non-metallic mineral products – paints and finishes (66.4 percent) and food, beverage and tobacco – confectionery snacks (66.7 percent). Absenteeism continues to be a challenge within most sectors, especially in the financial services sector (17.9 percent); while the construction sector registered the lowest absenteeism rate overall for the industries (13.3 percent).
25
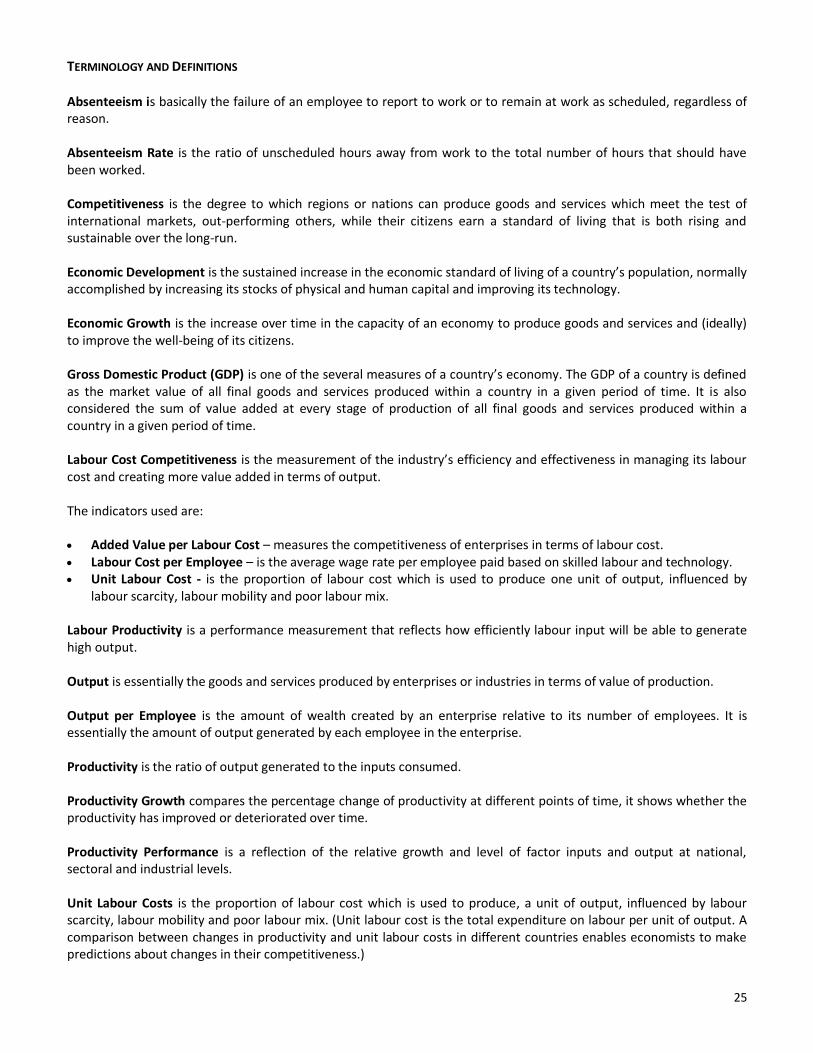
TERMINOLOGY AND DEFINITIONS Absenteeism is basically the failure of an employee to report to work or to remain at work as scheduled, regardless of reason. Absenteeism Rate is the ratio of unscheduled hours away from work to the total number of hours that should have been worked. Competitiveness is the degree to which regions or nations can produce goods and services which meet the test of international markets, out-performing others, while their citizens earn a standard of living that is both rising and sustainable over the long-run. Economic Development is the sustained increase in the economic standard of living of a country’s population, normally accomplished by increasing its stocks of physical and human capital and improving its technology. Economic Growth is the increase over time in the capacity of an economy to produce goods and services and (ideally) to improve the well-being of its citizens. Gross Domestic Product (GDP) is one of the several measures of a country’s economy. The GDP of a country is defined as the market value of all final goods and services produced within a country in a given period of time. It is also considered the sum of value added at every stage of production of all final goods and services produced within a country in a given period of time. Labour Cost Competitiveness is the measurement of the industry’s efficiency and effectiveness in managing its labour cost and creating more value added in terms of output. The indicators used are: Added Value per Labour Cost – measures the competitiveness of enterprises in terms of labour cost. Labour Cost per Employee – is the average wage rate per employee paid based on skilled labour and technology. Unit Labour Cost - is the proportion of labour cost which is used to produce one unit of output, influenced by
labour scarcity, labour mobility and poor labour mix. Labour Productivity is a performance measurement that reflects how efficiently labour input will be able to generate high output. Output is essentially the goods and services produced by enterprises or industries in terms of value of production. Output per Employee is the amount of wealth created by an enterprise relative to its number of employees. It is essentially the amount of output generated by each employee in the enterprise. Productivity is the ratio of output generated to the inputs consumed. Productivity Growth compares the percentage change of productivity at different points of time, it shows whether the productivity has improved or deteriorated over time. Productivity Performance is a reflection of the relative growth and level of factor inputs and output at national, sectoral and industrial levels. Unit Labour Costs is the proportion of labour cost which is used to produce, a unit of output, influenced by labour scarcity, labour mobility and poor labour mix. (Unit labour cost is the total expenditure on labour per unit of output. A comparison between changes in productivity and unit labour costs in different countries enables economists to make predictions about changes in their competitiveness.)

26
APPENDICES
27
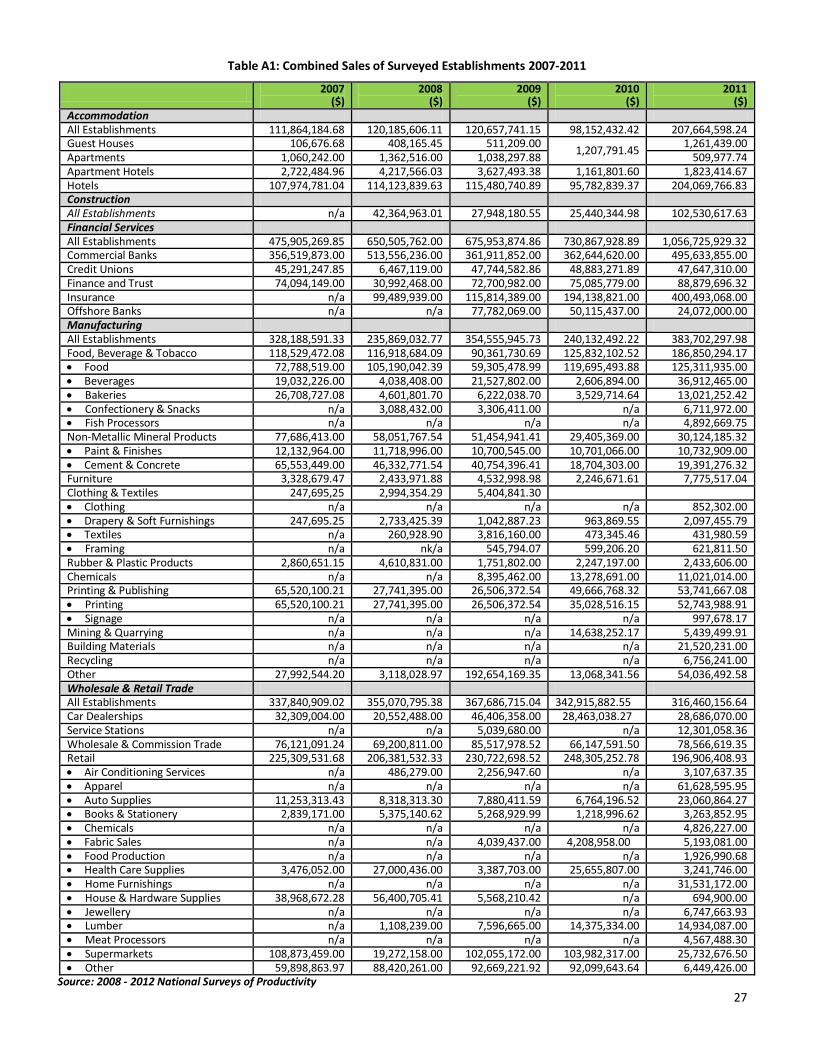
Table A1: Combined Sales of Surveyed Establishments 2007-2011
2007
($) 2008
($) 2009
($) 2010
($) 2011
($) Accommodation All Establishments 111,864,184.68 120,185,606.11 120,657,741.15 98,152,432.42 207,664,598.24 Guest Houses 106,676.68 408,165.45 511,209.00
1,207,791.45 1,261,439.00
Apartments 1,060,242.00 1,362,516.00 1,038,297.88 509,977.74 Apartment Hotels 2,722,484.96 4,217,566.03 3,627,493.38 1,161,801.60 1,823,414.67 Hotels 107,974,781.04 114,123,839.63 115,480,740.89 95,782,839.37 204,069,766.83 Construction All Establishments n/a 42,364,963.01 27,948,180.55 25,440,344.98 102,530,617.63 Financial Services All Establishments 475,905,269.85 650,505,762.00 675,953,874.86 730,867,928.89 1,056,725,929.32 Commercial Banks 356,519,873.00 513,556,236.00 361,911,852.00 362,644,620.00 495,633,855.00 Credit Unions 45,291,247.85 6,467,119.00 47,744,582.86 48,883,271.89 47,647,310.00 Finance and Trust 74,094,149.00 30,992,468.00 72,700,982.00 75,085,779.00 88,879,696.32 Insurance n/a 99,489,939.00 115,814,389.00 194,138,821.00 400,493,068.00 Offshore Banks n/a n/a 77,782,069.00 50,115,437.00 24,072,000.00 Manufacturing All Establishments 328,188,591.33 235,869,032.77 354,555,945.73 240,132,492.22 383,702,297.98 Food, Beverage & Tobacco 118,529,472.08 116,918,684.09 90,361,730.69 125,832,102.52 186,850,294.17 Food 72,788,519.00 105,190,042.39 59,305,478.99 119,695,493.88 125,311,935.00 Beverages 19,032,226.00 4,038,408.00 21,527,802.00 2,606,894.00 36,912,465.00 Bakeries 26,708,727.08 4,601,801.70 6,222,038.70 3,529,714.64 13,021,252.42 Confectionery & Snacks n/a 3,088,432.00 3,306,411.00 n/a 6,711,972.00 Fish Processors n/a n/a n/a n/a 4,892,669.75 Non-Metallic Mineral Products 77,686,413.00 58,051,767.54 51,454,941.41 29,405,369.00 30,124,185.32 Paint & Finishes 12,132,964.00 11,718,996.00 10,700,545.00 10,701,066.00 10,732,909.00 Cement & Concrete 65,553,449.00 46,332,771.54 40,754,396.41 18,704,303.00 19,391,276.32 Furniture 3,328,679.47 2,433,971.88 4,532,998.98 2,246,671.61 7,775,517.04 Clothing & Textiles 247,695,25 2,994,354.29 5,404,841.30 Clothing n/a n/a n/a n/a 852,302.00 Drapery & Soft Furnishings 247,695.25 2,733,425.39 1,042,887.23 963,869.55 2,097,455.79 Textiles n/a 260,928.90 3,816,160.00 473,345.46 431,980.59 Framing n/a nk/a 545,794.07 599,206.20 621,811.50 Rubber & Plastic Products 2,860,651.15 4,610,831.00 1,751,802.00 2,247,197.00 2,433,606.00 Chemicals n/a n/a 8,395,462.00 13,278,691.00 11,021,014.00 Printing & Publishing 65,520,100.21 27,741,395.00 26,506,372.54 49,666,768.32 53,741,667.08 Printing 65,520,100.21 27,741,395.00 26,506,372.54 35,028,516.15 52,743,988.91 Signage n/a n/a n/a n/a 997,678.17 Mining & Quarrying n/a n/a n/a 14,638,252.17 5,439,499.91 Building Materials n/a n/a n/a n/a 21,520,231.00 Recycling n/a n/a n/a n/a 6,756,241.00 Other 27,992,544.20 3,118,028.97 192,654,169.35 13,068,341.56 54,036,492.58 Wholesale & Retail Trade All Establishments 337,840,909.02 355,070,795.38 367,686,715.04 342,915,882.55 316,460,156.64 Car Dealerships 32,309,004.00 20,552,488.00 46,406,358.00 28,463,038.27 28,686,070.00 Service Stations n/a n/a 5,039,680.00 n/a 12,301,058.36 Wholesale & Commission Trade 76,121,091.24 69,200,811.00 85,517,978.52 66,147,591.50 78,566,619.35 Retail 225,309,531.68 206,381,532.33 230,722,698.52 248,305,252.78 196,906,408.93 Air Conditioning Services n/a 486,279.00 2,256,947.60 n/a 3,107,637.35 Apparel n/a n/a n/a n/a 61,628,595.95 Auto Supplies 11,253,313.43 8,318,313.30 7,880,411.59 6,764,196.52 23,060,864.27 Books & Stationery 2,839,171.00 5,375,140.62 5,268,929.99 1,218,996.62 3,263,852.95 Chemicals n/a n/a n/a n/a 4,826,227.00 Fabric Sales n/a n/a 4,039,437.00 4,208,958.00 5,193,081.00 Food Production n/a n/a n/a n/a 1,926,990.68 Health Care Supplies 3,476,052.00 27,000,436.00 3,387,703.00 25,655,807.00 3,241,746.00 Home Furnishings n/a n/a n/a n/a 31,531,172.00 House & Hardware Supplies 38,968,672.28 56,400,705.41 5,568,210.42 n/a 694,900.00 Jewellery n/a n/a n/a n/a 6,747,663.93 Lumber n/a 1,108,239.00 7,596,665.00 14,375,334.00 14,934,087.00 Meat Processors n/a n/a n/a n/a 4,567,488.30 Supermarkets 108,873,459.00 19,272,158.00 102,055,172.00 103,982,317.00 25,732,676.50 Other 59,898,863.97 88,420,261.00 92,669,221.92 92,099,643.64 6,449,426.00
Source: 2008 - 2012 National Surveys of Productivity
28
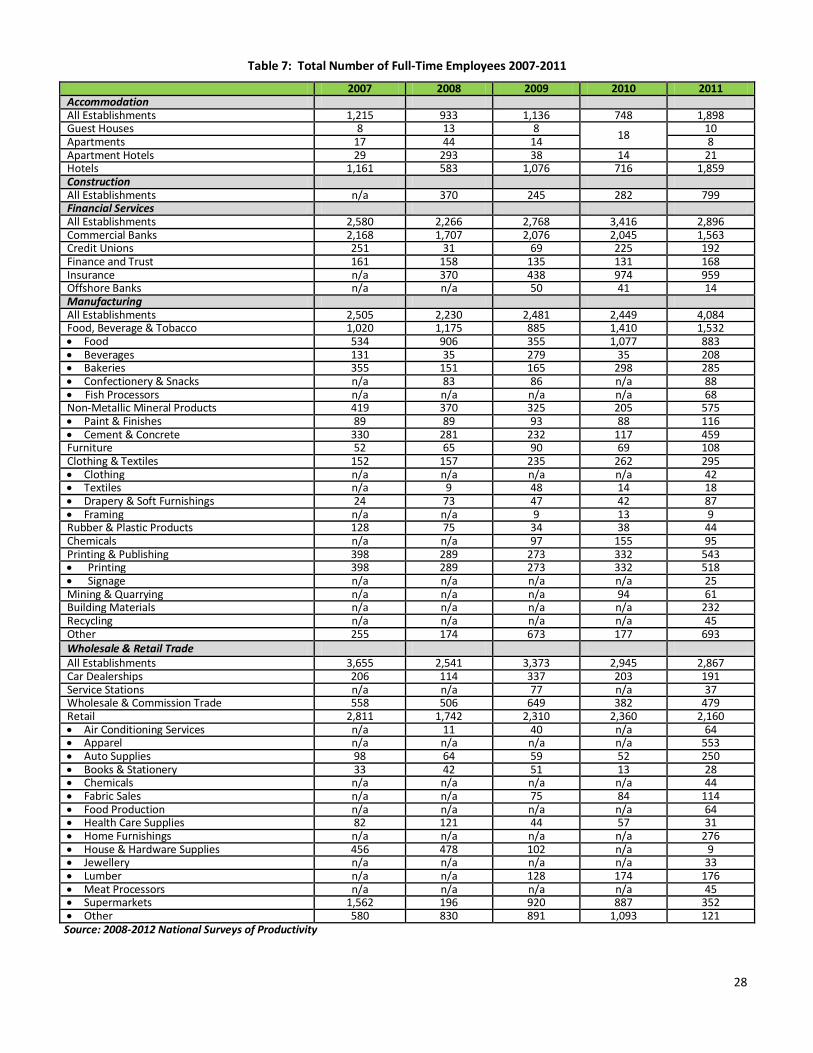
Table 7: Total Number of Full-Time Employees 2007-2011
2007 2008 2009 2010 2011 Accommodation All Establishments 1,215 933 1,136 748 1,898 Guest Houses 8 13 8
18 10
Apartments 17 44 14 8 Apartment Hotels 29 293 38 14 21 Hotels 1,161 583 1,076 716 1,859 Construction All Establishments n/a 370 245 282 799 Financial Services All Establishments 2,580 2,266 2,768 3,416 2,896 Commercial Banks 2,168 1,707 2,076 2,045 1,563 Credit Unions 251 31 69 225 192 Finance and Trust 161 158 135 131 168 Insurance n/a 370 438 974 959 Offshore Banks n/a n/a 50 41 14 Manufacturing All Establishments 2,505 2,230 2,481 2,449 4,084 Food, Beverage & Tobacco 1,020 1,175 885 1,410 1,532 Food 534 906 355 1,077 883 Beverages 131 35 279 35 208 Bakeries 355 151 165 298 285 Confectionery & Snacks n/a 83 86 n/a 88 Fish Processors n/a n/a n/a n/a 68 Non-Metallic Mineral Products 419 370 325 205 575 Paint & Finishes 89 89 93 88 116 Cement & Concrete 330 281 232 117 459 Furniture 52 65 90 69 108 Clothing & Textiles 152 157 235 262 295 Clothing n/a n/a n/a n/a 42 Textiles n/a 9 48 14 18 Drapery & Soft Furnishings 24 73 47 42 87 Framing n/a n/a 9 13 9 Rubber & Plastic Products 128 75 34 38 44 Chemicals n/a n/a 97 155 95 Printing & Publishing 398 289 273 332 543 Printing 398 289 273 332 518 Signage n/a n/a n/a n/a 25 Mining & Quarrying n/a n/a n/a 94 61 Building Materials n/a n/a n/a n/a 232 Recycling n/a n/a n/a n/a 45 Other 255 174 673 177 693 Wholesale & Retail Trade
All Establishments 3,655 2,541 3,373 2,945 2,867 Car Dealerships 206 114 337 203 191 Service Stations n/a n/a 77 n/a 37 Wholesale & Commission Trade 558 506 649 382 479 Retail 2,811 1,742 2,310 2,360 2,160 Air Conditioning Services n/a 11 40 n/a 64 Apparel n/a n/a n/a n/a 553 Auto Supplies 98 64 59 52 250 Books & Stationery 33 42 51 13 28 Chemicals n/a n/a n/a n/a 44 Fabric Sales n/a n/a 75 84 114 Food Production n/a n/a n/a n/a 64 Health Care Supplies 82 121 44 57 31 Home Furnishings n/a n/a n/a n/a 276 House & Hardware Supplies 456 478 102 n/a 9 Jewellery n/a n/a n/a n/a 33 Lumber n/a n/a 128 174 176 Meat Processors n/a n/a n/a n/a 45 Supermarkets 1,562 196 920 887 352 Other 580 830 891 1,093 121
Source: 2008-2012 National Surveys of Productivity
29
Table 8: Total Number of Part-Time Employees 2007-2011
2007 2008 2009 2010 2011 Accommodation All Establishments 54 49 30 32 35 Guest Houses 2 7 1
4 1
Apartments 4 7 4 4 Apartment Hotels 10 10 4 3 3 Hotels 38 25 21 25 27 Construction All Establishments n/a 2 3 2 1 Financial Services All Establishments 209 218 68 234 251 Commercial Banks 191 206 2 209 218 Credit Unions 5 3 5 10 9 Finance and Trust 13 3 4 11 16 Insurance n/a 6 1 4 8 Offshore Banks n/a n/a 56 0 0 Manufacturing All Establishments 149 100 64 83 220 Food, Beverage & Tobacco 81 80 43 49 158 Food 44 73 27 43 89 Beverages 6 3 12 2 0 Bakeries 31 4 4 4 14 Confectionery & Snacks n/a 0 0 n/a 17 Fish Processors n/a n/a n/a n/a 38 Non-Metallic Mineral Products 21 4 2 3 6 Paint & Finishes 21 2 2 3 6 Cement & Concrete 0 2 0 0 0 Furniture 11 0 0 0 2 Clothing & Textiles 0 4 4 13 6 Clothing n/a n/a n/a n/a 0 Textiles n/a 4 1 7 1 Drapery & Soft Furnishings 0 0 1 2 2 Framing n/a n/a 2 4 3 Rubber & Plastic Products 0 0 0 0 0 Chemicals n/a n/a 3 0 10 Printing & Publishing 27 6 n/a 13 6 Printing 27 6 n/a 13 16 Signage n/a n/a n/a n/a 0
Mining & Quarrying n/a n/a n/a 0 0 Building Materials n/a n/a n/a n/a 7 Recycling n/a n/a n/a n/a 4 Other 2 6 12 5 11 Wholesale & Retail Trade All Establishments 445 527 936 801 354 Car Dealerships 3 0 7 9 0 Service Stations n/a n/a 0 0 3 Wholesale & Commission Trade 26 16 14 1 9 Retail 406 508 912 821 342 Air Conditioning Services n/a 0 1 n/a 8 Apparel n/a n/a n/a n/a 115 Auto Supplies 18 2 10 3 5 Books & Stationery 2 11 12 8 10 Chemicals n/a n/a n/a n/a 0 Fabric Sales n/a n/a 12 50 17 Food Production n/a n/a n/a n/a 2 Health Care Supplies 8 5 3 4 4 Home Furnishings n/a n/a n/a n/a 58 House & Hardware Supplies 9 0 2 n/a 0 Jewellery n/a n/a n/a n/a 0 Lumber n/a 4 553 0 2 Meat Processors n/a n/a n/a n/a 1 Supermarkets 286 146 312 557 117 Other 83 340 7 199 3
Source: 2008-2012 National Surveys of Productivity
30
Table 9: Average Overtime Hours (Per Employee) 2007-2011
2007 2008 2009 2010 2011 Accommodation All Establishments 25 8 21 15 18 Guest Houses 1 0 0
0 0
Apartments 0 25 10 0 Apartment Hotels 2 0 1 13 1 Hotels 26 8 22 105 18 Construction All Establishments n/a 32 26 11 4 Financial Services All Establishments 43 3 160 126 279 Commercial Banks 50 42 29 115 56 Credit Unions 1 1 131 222 185 Finance and Trust 3 7 233 78 20 Insurance n/a 0 191 2 8 Offshore Banks n/a n/a 122 0 10 Manufacturing All Establishments 80 88 109 58 160 Food, Beverage & Tobacco Food 49 29 111 363 415 Beverages 20 21 129 14 148 Bakeries 51 12 48 172 98 Confectionery & Snacks n/a 0 0 n/a 0 Fish Processing n/a n/a n/a n/a 0 Chemicals n/a n/a 38 113 176 Non-Metallic Mineral Products Paint & Finishes 69 50 27 78 42 Cement & Concrete 306 434 379 1,606 1,286 Furniture 10 52 7 0 39 Clothing & Textiles Clothing n/a n/a n/a n/a 0 Textiles n/a 0 40 0 0 Drapery & Soft Furnishings 6.0 6 2 8 56 Framing n/a n/a 44 38 47 Rubber & Plastic Products 48 92 171 213 154 Printing & Publishing Printing 49 53 0 141 275 Signage n/a n/a n/a n/a 20 Mining & Quarrying n/a n/a n/a n/a 48 Building Materials n/a n/a n/a n/a 167 Recycling n/a n/a n/a n/a 0 Other 46 89 125 318 3 Wholesale & Retail Trade All Establishments 28 105 61 59 6 Car Dealerships 18 9 18 112 50 Service Stations n/a n/a 27 n/a 44 Wholesale & Commission Trade 1 5 28 19 5 Retail Air Conditioning Services n/a 24 1 n/a 6 Apparel n/a n/a n/a n/a 50 Auto Supplies 66 38 37 225 44 Books & Stationery 5 6 7 12 5 Chemicals n/a n/a n/a n/a 49 Fabric Sales n/a n/a 37 133 9 Food Production n/a n/a n/a n/a 0 Health Care Supplies 20 31 24 0 32 Home Furnishings n/a n/a n/a n/a 41 House & Hardware Supplies 64 35 135 n/a 0 Jewellery n/a n/a n/a n/a 15 Lumber n/a n/a 117 17 21 Meat Processors n/a n/a n/a n/a 38 Supermarkets 13 75 125 145 81 Other 50 260 30 773 100 Source: 2008-2012 National Surveys of Productivity
31
Table 10: Average Vacation Days (Per Employee) 2007-2011
2007 2008 2009 2010 2011 Accommodation All Establishments 26 15 13 15 25 Guest Houses 12 20 8
13 12
Apartments 19 19 19 21 Apartment Hotels 14 24 24 22 14 Hotels 28 15 13 14 18 Construction All Establishments n/a 14 13 10 14 Financial Services All Establishments 13 24 18 20 20 Commercial Banks 12 25 19 22 22 Credit Unions 21 19 18 21 22 Finance and Trust 17 18 24 12 20 Insurance n/a 19 22 16 16 Offshore Banks n/a n/a 16 17 17 Manufacturing All Establishments 24 18 16 15 16 Food, Beverage & Tobacco Food 19 18 23 10 8 Beverages 17 12 19 20 15 Bakeries 13 21 19 19 17 Confectionery & Snacks n/a 27 25 n/a 16 Fish Processing n/a n/a n/a n/a 10 Chemicals n/a n/a 19 13 22 Non-Metallic Mineral Products Paint & Finishes 22 21 20 14 14 Cement & Concrete 55 19 9 19 20 Furniture 15 23 11 10 20 Clothing & Textiles Clothing n/a n/a n/a n/a 17 Textiles n/a 16 23 12 13 Drapery & Soft Furnishings 15 11 20 19 18 Framing n/a n/a 20 16 20 Rubber & Plastic Products 18 17 13 13 2 Printing & Publishing Printing 21 17 0 24 21 Signage n/a n/a n/a n/a 10 Mining & Quarrying n/a n/a n/a 0 14 Building Materials n/a n/a n/a n/a 21 Recycling n/a n/a n/a n/a 5 Other 19 15 16 13 17 Wholesale & Retail Trade All Establishments 20 21 19 22 19 Car Dealerships 17 21 11 10 17 Service Stations n/a n/a 8 n/a 15 Wholesale & Commission Trade 18 19 23 17 17 Retail 19 19 19 21 18 Air Conditioning Services n/a 13 11 n/a 5 Apparel n/a n/a n/a n/a 20 Auto Supplies 18 16 18 19 18 Books & Stationery 17 19 17 19 14 Chemicals n/a n/a n/a n/a 17 Fabric Sales n/a n/a 16 18 15 Food Production n/a n/a n/a n/a 18 Health Care Supplies 17 21 26 18 22 Home Furnishings n/a n/a n/a n/a 21 House & Hardware Supplies 18 20 19 n/a 25 Jewellery n/a n/a n/a n/a 16 Lumber n/a n/a 23 26 25 Meat Processors n/a n/a n/a n/a 17 Supermarkets 24 21 30 29 19 Other 18 18 10 20 16 Source: 2008-2012 National Surveys of Productivity
32
Table 11: Average Certified Sick Days (Per Employee) 2007-2011
2007 2008 2009 2010 2011 Accommodation All Establishments 5 4 3 5 5 Guest Houses 0 0 0
1 0
Apartments 0 3 3 1 Apartment Hotels 3 1 1 4 2 Hotels 5 4 3 5 5 Construction All Establishments n/a 1 1 1 3 Financial Services All Establishments 3 8 5 6 6 Commercial Banks 3 9 5 7 7 Credit Unions 5 5 7 4 8 Finance and Trust 3 5 3 7 6 Insurance n/a 6 4 5 5 Offshore Banks n/a n/a 4 6 1 Manufacturing All Establishments 6 5 5 6 4 Food, Beverage & Tobacco 5 6 4 6 3 Food 7 6 5 7 3 Beverages 4 4 4 0 1 Bakeries 6 6 2 5 4 Confectionery & Snacks n/a 4 1 n/a 3 Fish Processing n/a n/a n/a n/a 0 Chemicals 8 n/a 7 2 6 Non-Metallic Mineral Products 6 3 5 5 4 Paint & Finishes 6 3 3 5 4 Cement & Concrete 6 3 6 5 5 Furniture 7 4 3 3 1 Clothing & Textiles 3 4 7 3 2 Clothing 0 n/a n/a n/a 0 Textiles n/a 3 6 1 0 Drapery & Soft Furnishings 6 5 8 4 2 Framing n/a n/a 1 1 3 Rubber & Plastic Products n/a 7 3 6 4 Printing & Publishing 6 6 9 8 7 Printing n/a n/a n/a n/a 7 Signage n/a n/a n/a n/a 1 Mining & Quarrying 1 n/a n/a 0 2 Building Materials n/a n/a n/a n/a 4 Recycling n/a n/a n/a n/a 1 Other 3 4 6 3 6 Wholesale & Retail Trade All Establishments 6 6 6 7 5 Car Dealerships 4 4 4 1 4 Service Stations 4 n/a 1 n/a 0 Wholesale & Commission Trade 1 4 5 6 5 Retail n/a n/a 7 7 5 Air Conditioning Services 0 5 4 n/a 1 Apparel n/a n/a n/a n/a 7 Auto Supplies 3 4 5 0 3 Books & Stationery 4 4 4 6 2 Chemicals n/a n/a n/a n/a 4 Fabric Sales n/a n/a 6 5 4 Food Production n/a n/a n/a n/a 0 Health Care Supplies 4 1 1 2 1 Home Furnishings n/a n/a n/a n/a 7 House & Hardware Supplies 6 5 6 n/a 0 Jewellery n/a n/a n/a n/a 1 Lumber n/a n/a 8 5 2 Meat Processors n/a 4 n/a n/a 3 Supermarkets 9 18 41 12 6 Other 5 6 2 5 3 Source: 2008-2012 National Surveys of Productivity
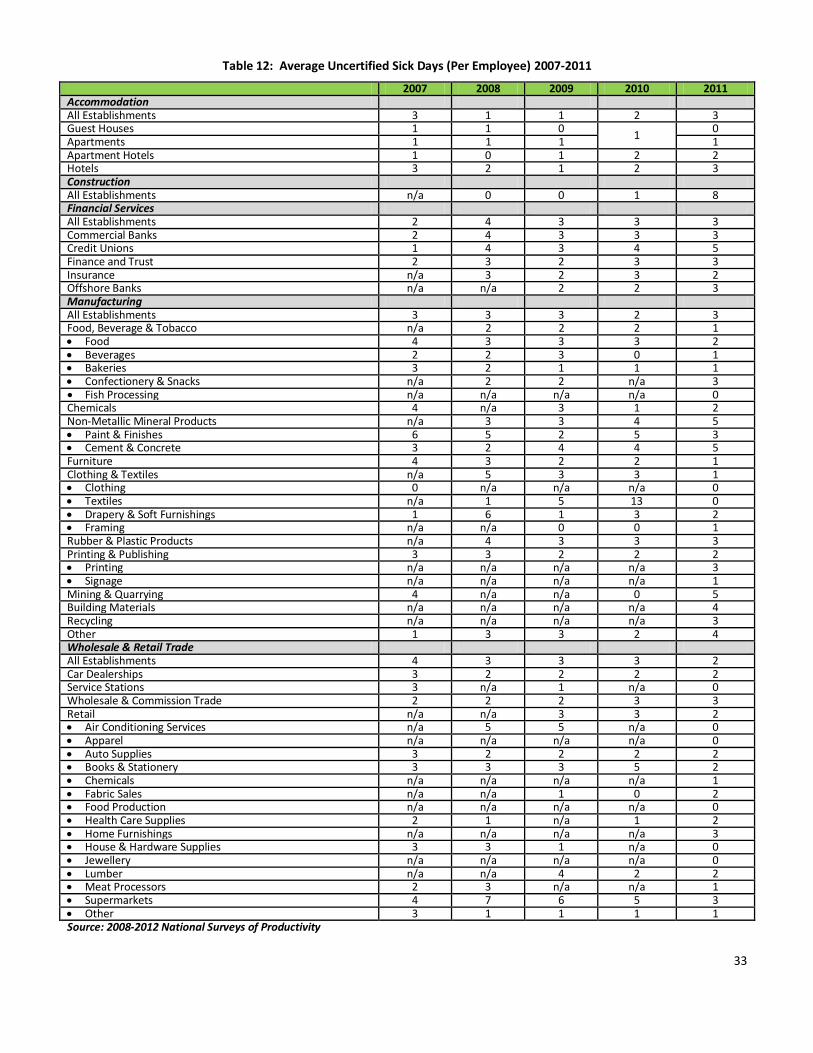
33
Table 12: Average Uncertified Sick Days (Per Employee) 2007-2011
2007 2008 2009 2010 2011 Accommodation All Establishments 3 1 1 2 3 Guest Houses 1 1 0
1 0
Apartments 1 1 1 1 Apartment Hotels 1 0 1 2 2 Hotels 3 2 1 2 3 Construction All Establishments n/a 0 0 1 8 Financial Services All Establishments 2 4 3 3 3 Commercial Banks 2 4 3 3 3 Credit Unions 1 4 3 4 5 Finance and Trust 2 3 2 3 3 Insurance n/a 3 2 3 2 Offshore Banks n/a n/a 2 2 3 Manufacturing All Establishments 3 3 3 2 3 Food, Beverage & Tobacco n/a 2 2 2 1 Food 4 3 3 3 2 Beverages 2 2 3 0 1 Bakeries 3 2 1 1 1 Confectionery & Snacks n/a 2 2 n/a 3 Fish Processing n/a n/a n/a n/a 0 Chemicals 4 n/a 3 1 2 Non-Metallic Mineral Products n/a 3 3 4 5 Paint & Finishes 6 5 2 5 3 Cement & Concrete 3 2 4 4 5 Furniture 4 3 2 2 1 Clothing & Textiles n/a 5 3 3 1 Clothing 0 n/a n/a n/a 0 Textiles n/a 1 5 13 0 Drapery & Soft Furnishings 1 6 1 3 2 Framing n/a n/a 0 0 1 Rubber & Plastic Products n/a 4 3 3 3 Printing & Publishing 3 3 2 2 2 Printing n/a n/a n/a n/a 3 Signage n/a n/a n/a n/a 1 Mining & Quarrying 4 n/a n/a 0 5 Building Materials n/a n/a n/a n/a 4 Recycling n/a n/a n/a n/a 3 Other 1 3 3 2 4 Wholesale & Retail Trade All Establishments 4 3 3 3 2 Car Dealerships 3 2 2 2 2 Service Stations 3 n/a 1 n/a 0 Wholesale & Commission Trade 2 2 2 3 3 Retail n/a n/a 3 3 2 Air Conditioning Services n/a 5 5 n/a 0 Apparel n/a n/a n/a n/a 0 Auto Supplies 3 2 2 2 2 Books & Stationery 3 3 3 5 2 Chemicals n/a n/a n/a n/a 1 Fabric Sales n/a n/a 1 0 2 Food Production n/a n/a n/a n/a 0 Health Care Supplies 2 1 n/a 1 2 Home Furnishings n/a n/a n/a n/a 3 House & Hardware Supplies 3 3 1 n/a 0 Jewellery n/a n/a n/a n/a 0 Lumber n/a n/a 4 2 2 Meat Processors 2 3 n/a n/a 1 Supermarkets 4 7 6 5 3 Other 3 1 1 1 1 Source: 2008-2012 National Surveys of Productivity