maine public utilities commission review of natural … investigation/eversource... · maine public...
TRANSCRIPT

Mai
ne P
ublic
Utili
ties
Com
miss
ion
Rev
iew
of N
atur
al G
as C
apac
ity O
ptio
ns
Febr
uary
26,
201
4
Suss
ex E
cono
mic
Adv
isor
s, L
LC (“
Suss
ex”)
has
relie
d up
on c
erta
in p
ublic
sou
rces
of i
nfor
mat
ion
cons
iste
nt w
ith s
tand
ard
cons
ultin
g pr
actic
es. S
usse
x m
akes
no
war
rant
ies
or g
uara
ntee
s re
gard
ing
the
accu
racy
of a
ny e
stim
ates
, pro
ject
ions
or a
naly
ses
cont
aine
d he
rein
. Tho
se re
view
ing
the
info
rmat
ion
cont
aine
d he
rein
wai
ve a
ny c
laim
aga
inst
Sus
sex,
its
partn
ers
and
empl
oyee
s.
Sus
sex
shal
l not
be
liabl
e to
any
par
ty re
view
ing
this
info
rmat
ion.
Docket No. IR 15-124 Comments of Eversource Energy
Attachment 13 Page 1 of 65
000336

Con
tent
s
1.In
trod
uctio
n
Legi
slat
ive
Bac
kgro
und
P
roje
ct O
bjec
tive
and
Rep
ort O
rgan
izat
ion
2.E
xecu
tive
Sum
mar
y
3.N
atur
al G
as M
arke
t Ove
rvie
w
4.N
atur
al G
as P
ipel
ine
Cap
acity
Opt
ions
5.C
ost /
Ben
efit
Ana
lysi
s
6.S
umm
ary
and
Con
clus
ions
1
Docket No. IR 15-124 Comments of Eversource Energy
Attachment 13 Page 2 of 65
000337

1. In
trodu
ctio
n: L
egis
lativ
e B
ackg
roun
d
B
ased
on
the
rece
ntly
ena
cted
H.P
. 112
8 –
L.D
. 155
9 (i.
e., A
n A
ct to
Red
uce
Ene
rgy
Cos
ts, I
ncre
ase
Ene
rgy
Effi
cien
cy, P
rom
ote
Ele
ctric
Sys
tem
Rel
iabi
lity
and
Pro
tect
th
e E
nviro
nmen
t), th
e M
aine
Pub
lic U
tiliti
es C
omm
issi
on (“
Mai
ne P
UC
”) h
as th
e ab
ility
to e
xecu
te c
ontra
cts
for n
atur
al g
as p
ipel
ine
capa
city
:3.
Par
ties
to a
n en
ergy
cos
t red
uctio
n co
ntra
ct. T
he c
omm
issi
on m
ay e
xecu
te, o
r dire
ct to
be
exec
uted
, an
ener
gy c
ost r
educ
tion
cont
ract
that
con
tain
s th
e fo
llow
ing
prov
isio
ns.
A. T
he c
omm
issi
on m
ay d
irect
one
or m
ore
trans
mis
sion
and
dis
tribu
tion
utili
ties,
gas
util
ities
or
natu
ral g
as p
ipel
ine
utili
ties
to b
e a
coun
terp
arty
to a
n en
ergy
cos
t red
uctio
n co
ntra
ct. I
n de
term
inin
g w
heth
er a
nd to
wha
t ext
ent t
o di
rect
a u
tility
to b
e a
coun
terp
arty
to a
con
tract
un
der t
his
subs
ectio
n, th
e co
mm
issi
on s
hall
cons
ider
the
antic
ipat
ed re
duct
ion
in th
e pr
ice
of
gas
or e
lect
ricity
, as
appl
icab
le, a
ccru
ing
to th
e cu
stom
ers
of th
e ut
ility
as
a re
sult
of th
e co
ntra
ct a
s de
term
ined
by
the
com
mis
sion
in a
n ad
judi
cato
ry p
roce
edin
g.A
ny e
cono
mic
loss
, inc
ludi
ng b
ut n
ot li
mite
d to
any
effe
cts
on th
e co
st o
f cap
ital r
esul
ting
from
an
ene
rgy
cost
redu
ctio
n co
ntra
ct fo
r a tr
ansm
issi
on a
nd d
istri
butio
n ut
ility
, a g
as u
tility
or a
na
tura
l gas
pip
elin
e ut
ility
, is
deem
ed to
be
prud
ent a
nd th
e co
mm
issi
on s
hall
allo
w fu
ll re
cove
ry th
roug
h th
e ut
ility
's ra
tes.
B. I
f the
com
mis
sion
con
clud
es th
at a
n en
ergy
cos
t red
uctio
n co
ntra
ct c
an b
e ac
hiev
ed w
ith th
e pa
rtici
patio
n of
oth
er e
ntiti
es, t
he c
omm
issi
on m
ay c
ontra
ct jo
intly
with
oth
er e
ntiti
es, i
nclu
ding
ot
her s
tate
age
ncie
s an
d in
stru
men
talit
ies,
gov
ernm
ents
in o
ther
sta
tes
and
natio
ns, u
tiliti
es
and
gene
rato
rs.
C. T
he c
omm
issi
on m
ay e
xecu
te a
n en
ergy
cos
t red
uctio
n co
ntra
ct a
s a
prin
cipa
l and
co
unte
rpar
ty.
2
Docket No. IR 15-124 Comments of Eversource Energy
Attachment 13 Page 3 of 65
000338

1. In
trodu
ctio
n: P
roje
ct O
bjec
tive
and
Rep
ort O
rgan
izat
ion
S
usse
x E
cono
mic
Adv
isor
s, L
LC (“
Sus
sex”
) was
reta
ined
by
the
Mai
ne P
UC
to
revi
ew th
e va
rious
nat
ural
gas
pip
elin
es s
ervi
ng N
ew E
ngla
nd, t
heir
rela
ted
open
sea
sons
for c
apac
ity, a
nd th
e po
tent
ial c
osts
and
ben
efits
of i
ncre
men
tal
natu
ral g
as d
eliv
erab
ility
into
New
Eng
land
. The
rem
aind
er o
f thi
s re
port
is
orga
nize
d as
follo
ws:
S
ectio
n 2
–Ex
ecut
ive
Sum
mar
y: P
rovi
des
an e
xecu
tive
sum
mar
y of
the
key
obse
rvat
ions
and
find
ings
S
ectio
n 3
–N
atur
al G
as M
arke
t Ove
rvie
w: P
rovi
des
an o
verv
iew
of t
he c
urre
nt n
atur
al
gas
mar
kets
in N
ew E
ngla
nd, w
ith a
par
ticul
ar fo
cus
on M
aine
; dis
cuss
es th
e re
gion
al
natu
ral g
as d
eman
d an
d su
pply
driv
ers;
and
revi
ews
natu
ral g
as p
rices
and
bas
is v
alue
s
Sec
tion
4 –
Nat
ural
Gas
Pip
elin
e C
apac
ity O
ptio
ns: I
dent
ifies
and
revi
ews
the
natu
ral
gas
pipe
line
capa
city
opt
ions
into
New
Eng
land
S
ectio
n 5
–C
ost /
Ben
efit
Ana
lysi
s: P
rovi
des
an e
stim
ate
of th
e co
sts
and
bene
fits
asso
ciat
ed w
ith in
crem
enta
l pip
elin
e ca
paci
ty in
to th
e N
ew E
ngla
nd re
gion
S
ectio
n 6
–Su
mm
ary
and
Con
clus
ions
: Sum
mar
izes
the
obse
rvat
ions
and
con
clus
ions
ba
sed
on th
e an
alys
es a
nd re
sear
ch p
rese
nted
her
ein
3
Docket No. IR 15-124 Comments of Eversource Energy
Attachment 13 Page 4 of 65
000339

Con
tent
s
1.In
trodu
ctio
n
2.Ex
ecut
ive
Sum
mar
y
3.N
atur
al G
as M
arke
t Ove
rvie
w
4.N
atur
al G
as P
ipel
ine
Cap
acity
Opt
ions
5.C
ost /
Ben
efit
Ana
lysi
s
6.S
umm
ary
and
Con
clus
ions
4
Docket No. IR 15-124 Comments of Eversource Energy
Attachment 13 Page 5 of 65
000340

2. E
xecu
tive
Sum
mar
y: N
atur
al G
as D
eman
d D
river
s
Th
ere
is s
igni
fican
t act
ivity
affe
ctin
g na
tura
l gas
dem
and
in th
e N
ew E
ngla
nd,
New
Yor
k C
ity a
nd A
tlant
ic C
anad
a re
gion
M
aine
: loc
al d
istri
butio
n co
mpa
nies
(“LD
Cs”
) hav
e si
gnifi
cant
nat
ural
gas
exp
ansi
on
plan
s
Con
nect
icut
Com
preh
ensi
ve E
nerg
y S
trate
gy (“
CT
CE
S”)
: pot
entia
l for
300
,000
new
na
tura
l gas
cus
tom
ers
over
the
next
sev
en to
ten
year
s
Mas
sach
uset
ts: D
epar
tmen
t of E
nerg
y R
esou
rces
(“D
OE
R”)
has
spo
nsor
ed a
stu
dy
rega
rdin
g po
tent
ial p
olic
y ch
ange
s as
soci
ated
with
LD
C e
xpan
sion
N
ew Y
ork
City
: no
perm
its fo
r No.
4 a
nd 6
fuel
oil
unle
ss e
mis
sion
s ar
e eq
uiva
lent
to N
o.
2 oi
l, w
hich
has
resu
lted
in s
igni
fican
t con
vers
ion
to n
atur
al g
as; C
on E
diso
n es
timat
ed
peak
day
gro
wth
of a
ppro
xim
atel
y 4%
A
tlant
ic C
anad
a: in
crea
sing
dem
and
for n
atur
al g
as fr
om th
e LD
C a
nd p
ower
gen
erat
ion
segm
ents
IS
O N
ew E
ngla
nd (“
ISO
-NE
”): i
ncre
asin
g re
lianc
e on
nat
ural
gas
, as
over
hal
f of t
he
gene
ratio
n in
the
inte
rcon
nect
ion
queu
e is
nat
ural
gas
-fire
d; n
early
10%
of I
SO
-NE
’s to
tal
gene
ratin
g ca
paci
ty is
sch
edul
ed to
be
retir
ed o
ver t
he n
ext t
hree
yea
rs
5
Docket No. IR 15-124 Comments of Eversource Energy
Attachment 13 Page 6 of 65
000341
2. E
xecu
tive
Sum
mar
y: N
atur
al G
as S
uppl
y D
river
s
E
aste
rn C
anad
a:
Dec
reas
ing
prod
uctio
n fro
m th
e S
able
Offs
hore
Ene
rgy
Pro
ject
(“S
OE
P”)
D
eep
Pan
uke
is o
n-lin
e an
d at
full
volu
me
(i.e.
, app
roxi
mat
ely
300
MM
cf/d
ay);
how
ever
, th
ere
are
unce
rtain
ties
rega
rdin
g su
stai
nabi
lity
and
dura
tion
of p
rodu
ctio
n
Li
quef
ied
Nat
ural
Gas
(“LN
G”):
M
assa
chus
etts
off-
shor
e fa
cilit
ies
have
not
rece
ived
any
car
goes
in th
e pa
st 3
yea
rs
Can
apor
t LN
G a
nd G
DF
SU
EZ
volu
mes
are
app
roxi
mat
ely
50%
of p
revi
ous
leve
ls
Alte
rnat
ive
mar
ket p
rices
for L
NG
are
cur
rent
ly m
ore
attra
ctiv
e th
an N
ew E
ngla
nd m
arke
t in
dex
pric
es
D
awn
Gas
Sup
ply
Hub
(“D
awn
Hub
”) / W
este
rn C
anad
a:
Tran
sCan
ada
Pip
elin
es L
imite
d (“
TCP
L”) M
ainl
ine,
the
prim
ary
pipe
line
deliv
erin
g C
anad
ian
natu
ral g
as s
uppl
ies
to N
ew E
ngla
nd, h
as re
ache
d a
toll
and
serv
ice
settl
emen
t with
the
maj
or e
aste
rn C
anad
ian
LDC
s. T
he s
ettle
men
t was
sub
mitt
ed fo
r re
view
by
the
Nat
iona
l Ene
rgy
Boa
rd (“
NE
B”)
in D
ecem
ber 2
013,
and
as
a re
sult,
the
tolls
for s
ervi
ce o
n th
e TC
PL
Mai
nlin
e w
ill b
e su
bjec
t to
the
resu
lts a
nd ti
min
g of
that
pr
ocee
ding
A
lgon
quin
Gas
Tra
nsm
issi
on (“
AG
T”) /
Ten
ness
ee G
as P
ipel
ine
(“TG
P”):
M
arce
llus
Sha
le g
as p
rodu
ctio
n co
ntin
ues
to g
row,
whi
ch h
as in
crea
sed
the
utili
zatio
n of
th
e A
GT
and
TGP
pipe
lines
and
has
resu
lted
in in
crea
sed
inte
rrup
tible
or n
on-fi
rm
serv
ice
rest
rictio
ns6
Docket No. IR 15-124 Comments of Eversource Energy
Attachment 13 Page 7 of 65
000342
2. E
xecu
tive
Sum
mar
y: R
esul
tant
Nat
ural
Gas
Pric
e S
igna
ls
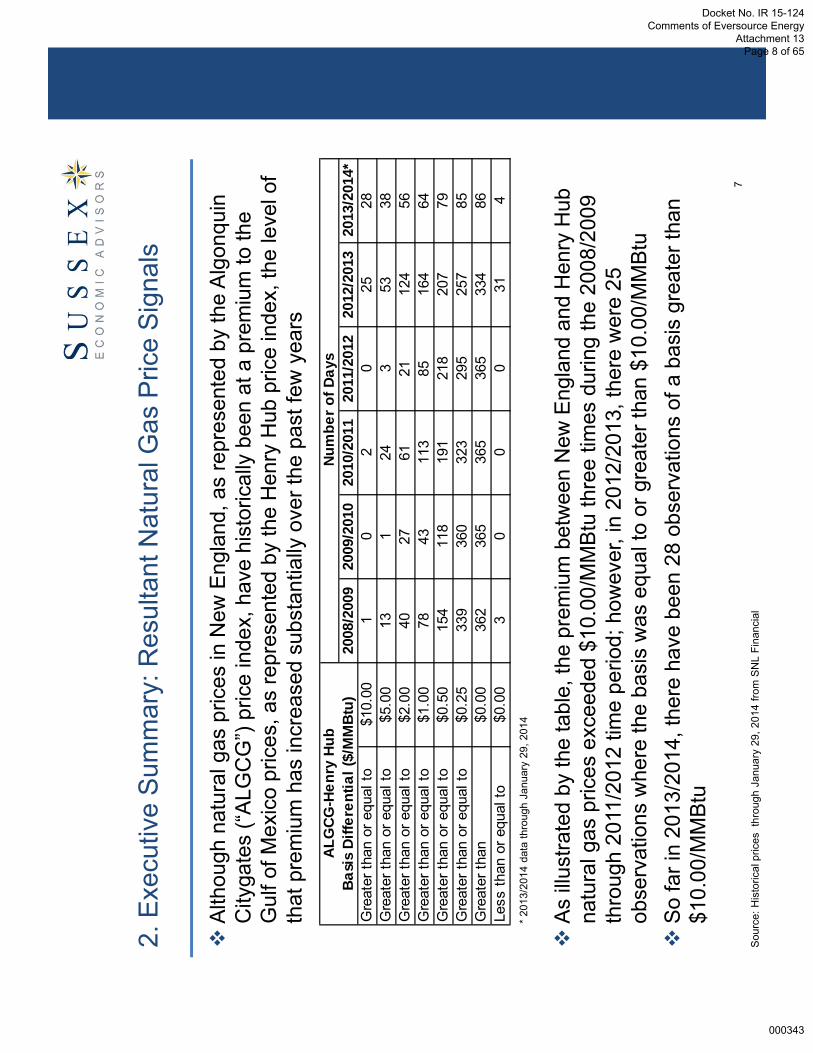
A
lthou
gh n
atur
al g
as p
rices
in N
ew E
ngla
nd, a
s re
pres
ente
d by
the
Alg
onqu
in
City
gate
s (“A
LGC
G”)
pric
e in
dex,
hav
e hi
stor
ical
ly b
een
at a
pre
miu
m to
the
Gul
f of M
exic
o pr
ices
, as
repr
esen
ted
by th
e H
enry
Hub
pric
e in
dex,
the
leve
l of
that
pre
miu
m h
as in
crea
sed
subs
tant
ially
ove
r the
pas
t few
yea
rs
A
s illu
stra
ted
by th
e ta
ble,
the
prem
ium
bet
wee
n N
ew E
ngla
nd a
nd H
enry
Hub
na
tura
l gas
pric
es e
xcee
ded
$10.
00/M
MB
tu th
ree
times
dur
ing
the
2008
/200
9 th
roug
h 20
11/2
012
time
perio
d; h
owev
er, i
n 20
12/2
013,
ther
e w
ere
25
obse
rvat
ions
whe
re th
e ba
sis
was
equ
al to
or g
reat
er th
an $
10.0
0/M
MB
tu
So
far i
n 20
13/2
014,
ther
e ha
ve b
een
28 o
bser
vatio
ns o
f a b
asis
gre
ater
than
$1
0.00
/MM
Btu
* 20
13/2
014
data
thro
ugh
Janu
ary
29, 2
014
Sou
rce:
His
toric
al p
rices
thr
ough
Jan
uary
29,
201
4 fro
m S
NL
Fina
ncia
l
2008
/200
920
09/2
010
2010
/201
120
11/2
012
2012
/201
320
13/2
014*
Gre
ater
than
or e
qual
to$1
0.00
10
20
2528
Gre
ater
than
or e
qual
to$5
.00
131
243
5338
Gre
ater
than
or e
qual
to$2
.00
4027
6121
124
56G
reat
er th
an o
r equ
al to
$1.0
078
4311
385
164
64G
reat
er th
an o
r equ
al to
$0.5
015
411
819
121
820
779
Gre
ater
than
or e
qual
to$0
.25
339
360
323
295
257
85G
reat
er th
an$0
.00
362
365
365
365
334
86Le
ss th
an o
r equ
al to
$0.0
03
00
031
4
ALG
CG-H
enry
Hub
Ba
sis
Diffe
rent
ial (
$/M
MBt
u)Nu
mbe
r of D
ays
7
Docket No. IR 15-124 Comments of Eversource Energy
Attachment 13 Page 8 of 65
000343
2. E
xecu
tive
Sum
mar
y: N
atur
al G
as P
ipel
ine
Cap
acity
Opt
ions
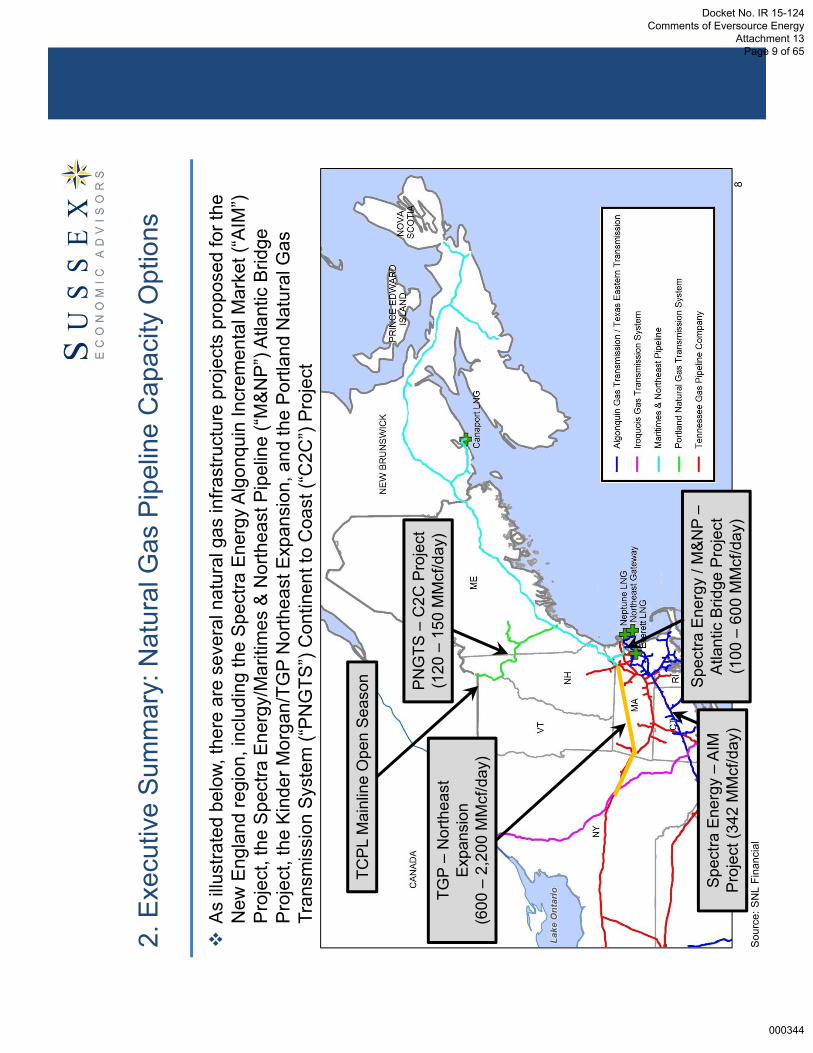
A
s ill
ustra
ted
belo
w, th
ere
are
seve
ral n
atur
al g
as in
frast
ruct
ure
proj
ects
pro
pose
d fo
r the
N
ew E
ngla
nd re
gion
, inc
ludi
ng th
e S
pect
ra E
nerg
y A
lgon
quin
Incr
emen
tal M
arke
t (“A
IM”)
Pro
ject
, the
Spe
ctra
Ene
rgy/
Mar
itim
es &
Nor
thea
st P
ipel
ine
(“M
&N
P”)
Atla
ntic
Brid
ge
Pro
ject
, the
Kin
der M
orga
n/TG
P N
orth
east
Exp
ansi
on, a
nd th
e P
ortla
nd N
atur
al G
as
Tran
smis
sion
Sys
tem
(“P
NG
TS”)
Con
tinen
t to
Coa
st (“
C2C
”) P
roje
ct
Spe
ctra
Ene
rgy
–AI
M
Pro
ject
(342
MM
cf/d
ay)
TGP
–N
orth
east
Ex
pans
ion
(600
–2,
200
MM
cf/d
ay)
PN
GTS
–C
2C P
roje
ct(1
20 –
150
MM
cf/d
ay)
Spe
ctra
Ene
rgy
/ M&
NP
–A
tlant
ic B
ridge
Pro
ject
(1
00 –
600
MM
cf/d
ay)
TCP
L M
ainl
ine
Ope
n S
easo
n
Sou
rce:
SN
L Fi
nanc
ial
8
Docket No. IR 15-124 Comments of Eversource Energy
Attachment 13 Page 9 of 65
000344

2. E
xecu
tive
Sum
mar
y: C
ost /
Ben
efit
Ana
lysi
s –
New
Eng
land
B
ased
on
the
rela
tions
hip
betw
een
natu
ral g
as p
rices
and
ele
ctric
ity lo
catio
nal
mar
gina
l pric
es (“
LMP
s”) i
n IS
O-N
E, S
usse
x ca
lcul
ated
the
pote
ntia
l red
uctio
n in
LM
Ps
as a
resu
lt of
a re
duct
ion
in w
hole
sale
nat
ural
gas
pric
es to
est
imat
e th
e po
tent
ial e
nerg
y co
st s
avin
gs to
ele
ctric
ity c
usto
mer
s fo
r the
201
2/20
13
split
-yea
r[1]
A
s illu
stra
ted
by th
e ta
bles
bel
ow, a
40%
redu
ctio
n in
the
New
Eng
land
nat
ural
ga
s ba
sis
(i.e.
, a lo
wer
ing
of th
e pr
emiu
m b
etw
een
New
Eng
land
and
Gul
f of
Mex
ico
natu
ral g
as p
rice
indi
ces)
wou
ld o
ffset
1,0
00,0
00 D
th/d
ay o
f inc
rem
enta
l pi
pelin
e ca
paci
ty, a
ssum
ing
a da
ily p
ipel
ine
char
ge a
s hi
gh a
s $2
.00/
Dth
Not
e: [1
] Spl
it-ye
ar is
def
ined
as
the
twel
ve-m
onth
per
iod
from
Nov
embe
r to
Oct
ober
Estim
ated
Ben
efits
Bas
is R
educ
tion
of:
Annu
al E
nerg
y C
ost S
avin
gs fo
r M
aine
Cus
tom
ers
($)
Annu
al E
nerg
y C
ost S
avin
gs fo
r IS
O-N
E C
usto
mer
s ($
)25
%$4
0,04
7,60
5$4
67,6
68,0
31
30%
$48,
057,
127
$561
,201
,637
35%
$56,
066,
648
$654
,735
,243
40%
$64,
076,
169
$748
,268
,849
45%
$72,
085,
690
$841
,802
,455
50%
$80,
095,
211
$935
,336
,062
55%
$88,
104,
732
$1,0
28,8
69,6
68
60%
$96,
114,
253
$1,1
22,4
03,2
74
65%
$104
,123
,774
$1,2
15,9
36,8
80
70%
$112
,133
,295
$1,3
09,4
70,4
86
75%
$120
,142
,816
$1,4
03,0
04,0
92
Cos
t Ass
umpt
ions
(1,0
00,0
00 D
th)
Rat
e($
/Dth
)C
apac
ity (D
th)
Annu
al C
ost
($)
$1.0
01,
000,
000
$365
,000
,000
$1.1
01,
000,
000
$401
,500
,000
$1.2
01,
000,
000
$438
,000
,000
$1.3
01,
000,
000
$474
,500
,000
$1.4
01,
000,
000
$511
,000
,000
$1.5
01,
000,
000
$547
,500
,000
$1.6
01,
000,
000
$584
,000
,000
$1.7
01,
000,
000
$620
,500
,000
$1.8
01,
000,
000
$657
,000
,000
$1.9
01,
000,
000
$693
,500
,000
$2.0
01,
000,
000
$730
,000
,000
9
Docket No. IR 15-124 Comments of Eversource Energy
Attachment 13 Page 10 of 65
000345

2. E
xecu
tive
Sum
mar
y: C
ost /
Ben
efit
Ana
lysi
s –
Mai
ne
A
cost
/ be
nefit
ana
lysi
s w
as a
lso
cond
ucte
d fo
r Mai
ne u
sing
an
appr
oach
si
mila
r to
the
ISO
-NE
ana
lysi
s di
scus
sed
earli
er a
nd u
nder
two
volu
me
scen
ario
s (i.
e., 5
0,00
0 D
th a
nd 2
00,0
00 D
th)
A
s in
dica
ted
in th
e ta
bles
bel
ow, t
he e
stim
ated
ann
ual b
enef
its to
Mai
ne u
nder
a
scen
ario
in w
hich
the
natu
ral g
as b
asis
is re
duce
d by
40%
is a
ppro
xim
atel
y $6
4 m
illion
, whi
ch w
ould
offs
et a
50,
000
Dth
/day
con
tract
ass
umin
g a
daily
rate
as
high
as
$2.0
0/D
th
How
ever
, the
est
imat
ed a
nnua
l ben
efits
to M
aine
of a
ppro
xim
atel
y $6
4 m
illion
w
ould
not
offs
et a
200
,000
Dth
/day
con
tract
at a
dai
ly ra
te o
f a $
1.00
/Dth
Estim
ated
Ben
efits
Bas
is
Red
uctio
n of
:
Annu
al E
nerg
y C
ost S
avin
gs fo
r M
aine
Cus
tom
ers
($)
25%
$40,
047,
605
30%
$48,
057,
127
35%
$56,
066,
648
40%
$64,
076,
169
45%
$72,
085,
690
50%
$80,
095,
211
55%
$88,
104,
732
60%
$96,
114,
253
65%
$104
,123
,774
70%
$112
,133
,295
75%
$120
,142
,816
Cos
t Ass
umpt
ions
(200
,000
Dth
)
Rat
e($
/Dth
)C
apac
ity (D
th)
Annu
al C
ost
($)
$1.0
020
0,00
0$7
3,00
0,00
0$1
.10
200,
000
$80,
300,
000
$1.2
020
0,00
0$8
7,60
0,00
0
$1.3
020
0,00
0$9
4,90
0,00
0
$1.4
020
0,00
0$1
02,2
00,0
00
$1.5
020
0,00
0$1
09,5
00,0
00
$1.6
020
0,00
0$1
16,8
00,0
00
$1.7
020
0,00
0$1
24,1
00,0
00
$1.8
020
0,00
0$1
31,4
00,0
00
$1.9
020
0,00
0$1
38,7
00,0
00
$2.0
020
0,00
0$1
46,0
00,0
00
Cos
t Ass
umpt
ions
(50,
000
Dth
)
Rat
e($
/Dth
)C
apac
ity (D
th)
Annu
al C
ost
($)
$1.0
050
,000
$18,
250,
000
$1.1
050
,000
$20,
075,
000
$1.2
050
,000
$21,
900,
000
$1.3
050
,000
$23,
725,
000
$1.4
050
,000
$25,
550,
000
$1.5
050
,000
$27,
375,
000
$1.6
050
,000
$29,
200,
000
$1.7
050
,000
$31,
025,
000
$1.8
050
,000
$32,
850,
000
$1.9
050
,000
$34,
675,
000
$2.0
050
,000
$36,
500,
000
10
Docket No. IR 15-124 Comments of Eversource Energy
Attachment 13 Page 11 of 65
000346

Con
tent
s
1.In
trodu
ctio
n
2.E
xecu
tive
Sum
mar
y
3.N
atur
al G
as M
arke
t Ove
rvie
w
Mar
ket C
onte
xt
Reg
iona
l Nat
ural
Gas
Dem
and
Driv
ers
N
atur
al G
as S
uppl
y D
river
s
Nat
ural
Gas
Pric
e an
d B
asis
Ana
lysi
s
4.N
atur
al G
as P
ipel
ine
Cap
acity
Opt
ions
5.C
ost /
Ben
efit
Ana
lysi
s
6.S
umm
ary
and
Con
clus
ions
11
Docket No. IR 15-124 Comments of Eversource Energy
Attachment 13 Page 12 of 65
000347

3. M
arke
t Con
text
: Nat
ural
Gas
Infra
stru
ctur
e –
New
Eng
land
Fi
ve in
ters
tate
nat
ural
gas
pip
elin
es s
erve
the
New
Eng
land
regi
on:
Sou
rces
: Com
pany
web
site
s; a
nd S
NL
Fina
ncia
l
Pipe
line
Ow
ner(
s)Pr
imar
y Su
pply
Sour
ces
Alg
onqu
in G
as T
rans
mis
sion
,LLC
(“
Alg
onqu
in” o
r “A
GT”
)S
pect
raEn
ergy
Par
tner
s, L
PG
ulfo
f Mex
ico,
App
alac
hian
B
asin
, Roc
kies
Bas
in, L
NG
Iroqu
ois
Gas
Tra
nsm
issi
on,L
.P.
(“Iro
quoi
s”)
Iroqu
ois
Gas
Tra
nsm
issi
on, L
.P.
Wes
tern
Can
adia
n S
edim
enta
ry
Bas
in (“
WC
SB
”)/ D
awn
Hub
Mar
itim
es&
Nor
thea
st P
ipel
ine
(“M
&N
P”)
(U.S
.)S
pect
ra E
nerg
y P
artn
ers,
LP
(77.
53%
); E
mer
a, In
c. (1
2.92
%);
Exx
onM
obil
Cor
p. (9
.55%
)
SO
EP
/ Dee
p P
anuk
e / L
NG
Por
tland
Nat
ural
Gas
Tra
nsm
issi
on
Sys
tem
(“P
NG
TS”)
Tran
sCan
ada
Pip
elin
es L
imite
d (6
1.71
%);
Gaz
Met
ro(3
8.29
%)
WC
SB
/ D
awn
Hub
Tenn
esse
eG
as P
ipel
ine
Com
pany
, L.
L.C
. (“T
enne
ssee
” or “
TGP
”)K
inde
r Mor
gan
Ene
rgy
Par
tner
s,
L.P.
Gul
f ofM
exic
o, A
ppal
achi
anB
asin
, Roc
kies
Bas
in, L
NG
12
Docket No. IR 15-124 Comments of Eversource Energy
Attachment 13 Page 13 of 65
000348
3. M
arke
t Con
text
: Nat
ural
Gas
Infra
stru
ctur
e –
New
Eng
land
(con
t.)
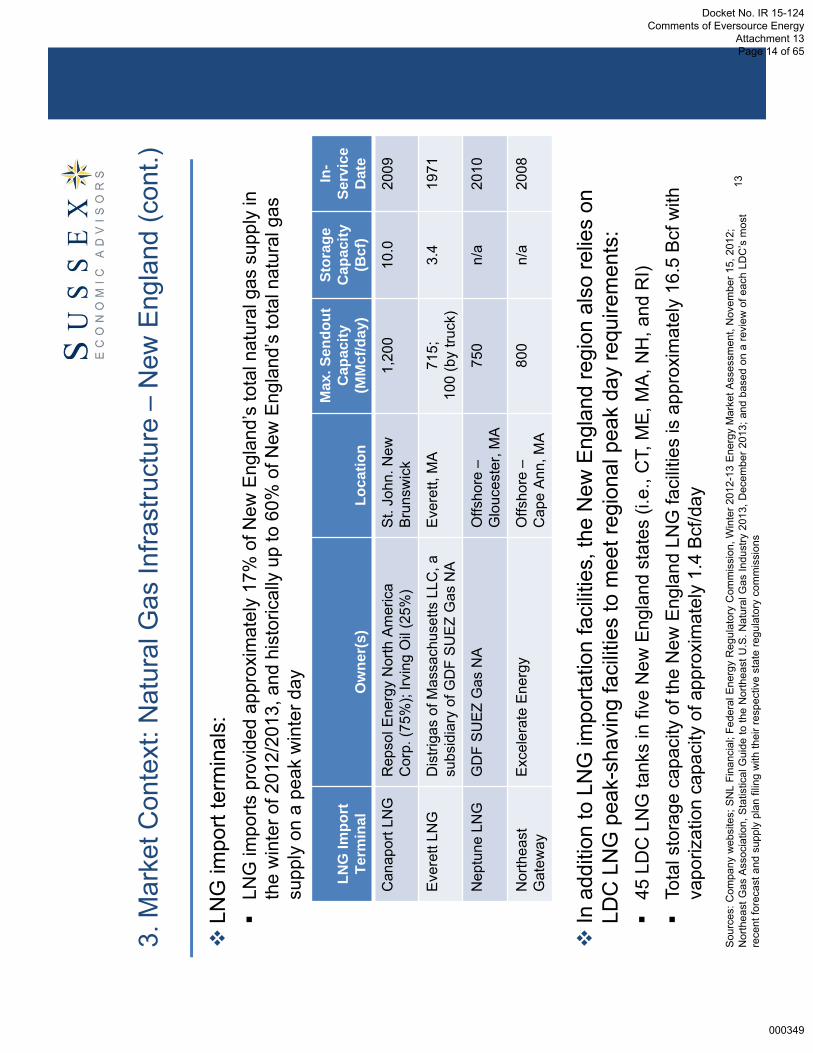
LN
G im
port
term
inal
s:
LNG
impo
rts p
rovi
ded
appr
oxim
atel
y 17
% o
f New
Eng
land
’s to
tal n
atur
al g
as s
uppl
y in
th
e w
inte
r of 2
012/
2013
, and
his
toric
ally
up
to 6
0% o
f New
Eng
land
’s to
tal n
atur
al g
as
supp
ly o
n a
peak
win
ter d
ay
In
add
ition
to L
NG
impo
rtatio
n fa
cilit
ies,
the
New
Eng
land
regi
on a
lso
relie
s on
LD
C L
NG
pea
k-sh
avin
g fa
cilit
ies
to m
eet r
egio
nal p
eak
day
requ
irem
ents
:
45 L
DC
LN
G ta
nks
in fi
ve N
ew E
ngla
nd s
tate
s (i.
e., C
T, M
E, M
A, N
H, a
nd R
I)
Tota
l sto
rage
cap
acity
of t
he N
ew E
ngla
nd L
NG
faci
litie
s is
app
roxi
mat
ely
16.5
Bcf
with
va
poriz
atio
n ca
paci
ty o
f app
roxi
mat
ely
1.4
Bcf
/day
Sou
rces
: Com
pany
web
site
s; S
NL
Fina
ncia
l; Fe
dera
l Ene
rgy
Reg
ulat
ory
Com
mis
sion
, Win
ter 2
012-
13 E
nerg
y M
arke
t Ass
essm
ent,
Nov
embe
r 15,
201
2;
Nor
thea
st G
as A
ssoc
iatio
n, S
tatis
tical
Gui
de to
the
Nor
thea
st U
.S. N
atur
al G
as In
dust
ry 2
013,
Dec
embe
r 201
3; a
nd b
ased
on
a re
view
of e
ach
LDC
’s m
ost
rece
nt fo
reca
st a
nd s
uppl
y pl
an fi
ling
with
thei
r res
pect
ive
stat
e re
gula
tory
com
mis
sion
s
LNG
Impo
rt
Term
inal
Ow
ner(
s)Lo
catio
n
Max
. Sen
dout
Cap
acity
(M
Mcf
/day
)
Stor
age
Cap
acity
(B
cf)
In-
Serv
ice
Dat
e
Can
apor
t LN
GR
epso
l Ene
rgy
Nor
thA
mer
ica
Cor
p. (7
5%);
Irvin
g O
il (2
5%)
St.
John
.New
B
runs
wic
k1,
200
10.0
2009
Eve
rett
LNG
Dis
triga
s of
Mas
sach
uset
tsLL
C, a
su
bsid
iary
of G
DF
SU
EZ
Gas
NA
Eve
rett,
MA
715;
10
0 (b
y tru
ck)
3.4
1971
Nep
tune
LN
GG
DF
SU
EZ
Gas
NA
Offs
hore
–G
louc
este
r, M
A75
0n/
a20
10
Nor
thea
stG
atew
ayE
xcel
erat
e E
nerg
yO
ffsho
re –
Cap
e A
nn, M
A80
0n/
a20
08
13
Docket No. IR 15-124 Comments of Eversource Energy
Attachment 13 Page 14 of 65
000349

3. M
arke
t Con
text
: Nat
ural
Gas
Infra
stru
ctur
e –
New
Eng
land
(con
t.)
Sou
rce:
SN
L Fi
nanc
ial
14
Th
ere
are
five
maj
or in
ters
tate
pip
elin
es a
nd fo
ur L
NG
impo
rt te
rmin
als
that
de
liver
nat
ural
gas
to N
ew E
ngla
nd
Docket No. IR 15-124 Comments of Eversource Energy
Attachment 13 Page 15 of 65
000350

3. M
arke
t Con
text
: Nat
ural
Gas
Infra
stru
ctur
e –
Mai
ne
Th
e M
aine
nat
ural
gas
mar
ket i
s pr
imar
ily s
erve
d by
M&
NP
and
PN
GTS
; in
addi
tion,
ther
e ar
e fo
ur L
DC
s th
at p
rovi
de d
istri
butio
n se
rvic
e
15S
ourc
e: S
NL
Fina
ncia
l
Not
es:
[1] T
he m
ap a
bove
sho
ws
the
serv
ice
terr
itorie
s fo
r the
Mai
ne L
DC
s pr
ior t
o th
e na
tura
l gas
pip
elin
e ex
pans
ions
to th
e ci
ty o
f A
ugus
ta, M
aine
by
Mai
ne N
atur
al G
as a
nd S
umm
it N
atur
al G
as in
late
201
3[2
] Mad
ison
Pap
er is
cur
rent
ly s
erve
d by
LN
G, a
nd is
exp
ecte
d to
be
serv
ed b
y S
umm
it N
atur
al G
as in
201
4
Docket No. IR 15-124 Comments of Eversource Energy
Attachment 13 Page 16 of 65
000351

O
ver t
he p
ast f
ive
split
-yea
rs (i
.e.,
2008
/200
9 to
201
2/20
13):
To
tal a
nnua
l dem
and
for n
atur
al g
as in
crea
sed
by
a co
mpo
und
annu
al g
row
th ra
te (“
CA
GR
”) o
f 2.3
%
from
731
.7 B
cf (i
.e.,
2,00
5 M
Mcf
/day
) to
801.
1 B
cf
(i.e.
, 2,1
95 M
Mcf
/day
)
W
inte
r nat
ural
gas
dem
and
incr
ease
d by
a C
AG
R
of 1
.0%
from
400
.0 B
cf (i
.e.,
2,64
9 M
Mcf
/day
) to
416.
0 B
cf (i
.e.,
2,75
5 M
Mcf
/day
)
S
umm
er n
atur
al g
as d
eman
d in
crea
sed
by a
C
AG
R o
f 3.8
% fr
om 3
31.7
Bcf
(i.e
., 1,
550
MM
cf/d
ay) t
o 38
5.1
Bcf
(i.e
., 1,
800
MM
cf/d
ay)
In
201
2/20
13, t
he p
ower
gen
erat
ion
segm
ent
acco
unte
d fo
r app
roxi
mat
ely
43%
of t
otal
na
tura
l gas
dem
and,
follo
wed
by
the
resi
dent
ial,
com
mer
cial
and
indu
stria
l se
gmen
ts w
ith 2
6%, 1
9% a
nd 1
2%,
resp
ectiv
ely
3. M
arke
t Con
text
: His
toric
al D
eman
d –
New
Eng
land
(exc
ludi
ng
Mai
ne)
Not
e: D
ata
for 2
013
for c
erta
in s
tate
s ba
sed
on S
usse
x es
timat
es (S
ourc
e: U
.S. E
nerg
y In
form
atio
n A
dmin
istra
tion,
Nat
ural
Gas
Con
sum
ptio
n by
End
Use
, re
leas
e da
te J
anua
ry 7
, 201
4)
0.0
20.0
40.0
60.0
80.0
100.
0
120.
0
Nov-2008
Feb-2009
May-2009
Aug-2009
Nov-2009
Feb-2010
May-2010
Aug-2010
Nov-2010
Feb-2011
May-2011
Aug-2011
Nov-2011
Feb-2012
May-2012
Aug-2012
Nov-2012
Feb-2013
May-2013
Aug-2013
Consumption (Bcf)
Res
iden
tial
Com
mer
cial
Indu
stria
lPo
wer
Gen
erat
ion
Res
iden
tial
205.
8 Bc
f26
%
Com
mer
cial
152.
2 Bc
f19
%In
dust
rial
93.6
Bcf
12%
Pow
er
Gen
erat
ion
349.
5 B
cf43
%
Tota
l 201
2/20
13 N
atur
al G
as D
eman
d =
801.
1 B
cf
16
Docket No. IR 15-124 Comments of Eversource Energy
Attachment 13 Page 17 of 65
000352

O
ver t
he p
ast f
ive
split
-yea
rs (i
.e.,
2008
/200
9 to
201
2/20
13):
To
tal a
nnua
l dem
and
for n
atur
al g
as d
ecre
ased
by
a C
AG
R o
f 3.4
% fr
om 6
9.2
Bcf
(i.e
., 19
0 M
Mcf
/day
) to
60.3
Bcf
(i.e
., 16
5 M
Mcf
/day
)
W
inte
r nat
ural
gas
dem
and
decr
ease
d by
a C
AG
R
of a
ppro
xim
atel
y 2.
0% fr
om 3
0.9
Bcf
(i.e
., 20
5 M
Mcf
/day
) to
28.6
Bcf
(i.e
., 18
9 M
Mcf
/day
)
S
umm
er n
atur
al g
as d
eman
d de
crea
sed
by a
C
AG
R o
f 4.6
% fr
om 3
8.3
Bcf
(i.e
., 17
9 M
Mcf
/day
) to
31.
7 B
cf (
i.e.,
148
MM
cf/d
ay)
W
hile
the
resi
dent
ial,
com
mer
cial
and
indu
stria
l se
gmen
ts a
ll ha
ve e
xper
ienc
ed in
crea
ses
in
cons
umpt
ion,
the
dem
and
for n
atur
al g
as b
y th
e po
wer
gen
erat
ion
segm
ent h
as d
eclin
ed fr
om 3
6.9
Bcf
(i.e
., 10
1 M
Mcf
/day
) to
20.0
Bcf
(i.e
., 55
M
Mcf
/day
), lik
ely
driv
en b
y hi
gher
gas
sup
ply
cost
s
In
201
2/20
13, t
he p
ower
gen
erat
ion
segm
ent
acco
unte
d fo
r app
roxi
mat
ely
33%
of M
aine
’s
tota
l nat
ural
gas
dem
and,
whi
le th
e in
dust
rial
segm
ent a
ccou
nted
for 5
2% o
f the
tota
l de
man
d
3. M
arke
t Con
text
: His
toric
al D
eman
d –
Mai
ne
Res
iden
tial
1.5
Bcf
3%
Com
mer
cial
7.4
Bcf
12%
Indu
stria
l31
.5 B
cf52
%
Pow
er
Gen
erat
ion
20.0
Bcf
33%
Tota
l 201
2/20
13 N
atur
al G
as D
eman
d =
60.3
Bcf
0.0
1.0
2.0
3.0
4.0
5.0
6.0
7.0
8.0
Nov-2008
Feb-2009
May-2009
Aug-2009
Nov-2009
Feb-2010
May-2010
Aug-2010
Nov-2010
Feb-2011
May-2011
Aug-2011
Nov-2011
Feb-2012
May-2012
Aug-2012
Nov-2012
Feb-2013
May-2013
Aug-2013
Consumption (Bcf)
Res
iden
tial
Com
mer
cial
Indu
stria
lPo
wer
Gen
erat
ion
Not
e: D
ata
for J
anua
ry-A
pril
2013
for t
he re
side
ntia
l and
com
mer
cial
seg
men
ts b
ased
on
Sus
sex
estim
ates
(Sou
rce:
U.S
. Ene
rgy
Info
rmat
ion
Adm
inis
tratio
n,
Nat
ural
Gas
Con
sum
ptio
n by
End
Use
, rel
ease
dat
e Ja
nuar
y 7,
201
4)17
Docket No. IR 15-124 Comments of Eversource Energy
Attachment 13 Page 18 of 65
000353

3. N
atur
al G
as D
eman
d D
river
s: M
aine
Th
e fo
ur M
aine
LD
Cs
have
sig
nific
ant n
atur
al g
as in
frast
ruct
ure
deve
lopm
ent
and
expa
nsio
n pl
ans:
U
nitil
, whi
ch s
erve
s na
tura
l gas
cus
tom
ers
in M
aine
, New
Ham
pshi
re a
nd
Mas
sach
uset
ts, h
as p
lans
to in
crea
se it
s nu
mbe
r of c
usto
mer
s fro
m 7
4,00
0 to
92,
000
(i.e.
, an
appr
oxim
atel
y 25
% in
crea
se in
cus
tom
er b
ase)
by
2016
thro
ugh
addi
tions
and
co
nver
sion
s
Sum
mit
Nat
ural
Gas
(“S
umm
it”) i
s cu
rren
tly u
nder
taki
ng m
ultip
le p
roje
cts
to p
rovi
de
natu
ral g
as s
ervi
ce to
new
are
as w
ithin
Mai
ne•
The
$350
milli
on K
enne
bec
Valle
y P
roje
ct, w
hich
con
sist
s of
an
88-m
ile tr
ansm
issi
on p
ipel
ine
to
supp
ly n
atur
al g
as to
two
pape
r mills
, alo
ng w
ith 1
,600
mile
s of
dis
tribu
tion
pipe
line
to e
xpan
d S
umm
it’s
serv
ice
terr
itory
into
sev
ente
en c
omm
uniti
es in
the
Ken
nebe
c Va
lley
regi
on
•S
umm
it al
so re
ceiv
ed a
ppro
val f
or a
$42
milli
on p
roje
ct, w
hich
con
sist
s of
32
mile
s of
tran
smis
sion
lin
es a
nd 2
13 m
iles
of d
istri
butio
n lin
es, t
o pr
ovid
e na
tura
l gas
dis
tribu
tion
serv
ice
to th
e to
wns
of
Cum
berla
nd, F
alm
outh
and
Yar
mou
th
Th
e ne
w $
23 m
illio
n na
tura
l gas
pip
elin
e bu
ilt b
y M
aine
Nat
ural
Gas
from
an
inte
rcon
nect
w
ith M
&N
P in
Win
dsor
, Mai
ne to
Aug
usta
, Mai
ne c
omm
ence
d se
rvic
e in
Nov
embe
r 201
3
In la
te O
ctob
er 2
013,
Ban
gor N
atur
al G
as a
nnou
nced
pla
ns to
con
stru
ct a
five
-pha
se,
$7.5
mill
ion
natu
ral g
as p
ipel
ine
to L
inco
ln, M
aine
Sou
rces
: Uni
til, P
rese
ntat
ion
for S
econ
d Q
uarte
r 201
3 E
arni
ngs
Con
fere
nce
Cal
l, Ju
ly 2
4, 2
013;
Sum
mit
Nat
ural
Gas
, “G
as is
Tur
ned
On,
Sum
mit
Now
S
ervi
ng C
usto
mer
s”, J
anua
ry 6
, 201
4; B
ango
r Dai
ly N
ews,
“Fal
mou
th re
leas
es m
ap d
etai
ling
natu
ral g
as li
ne e
xpan
sion
”, D
ecem
ber 2
3, 2
013;
SN
L Fi
nanc
ial,
“Mai
ne N
atur
al G
as c
ompl
etes
1st
gas
pip
elin
e to
Aug
usta
, Mai
ne”,
Oct
ober
28,
201
3; a
nd S
NL
Fina
ncia
l, “R
epor
t: B
ango
r Nat
ural
pro
pose
s $7
.5M
pip
elin
e in
Mai
ne”,
Oct
ober
23,
201
318
Docket No. IR 15-124 Comments of Eversource Energy
Attachment 13 Page 19 of 65
000354
3. N
atur
al G
as D
eman
d D
river
s: C
onne
ctic
ut
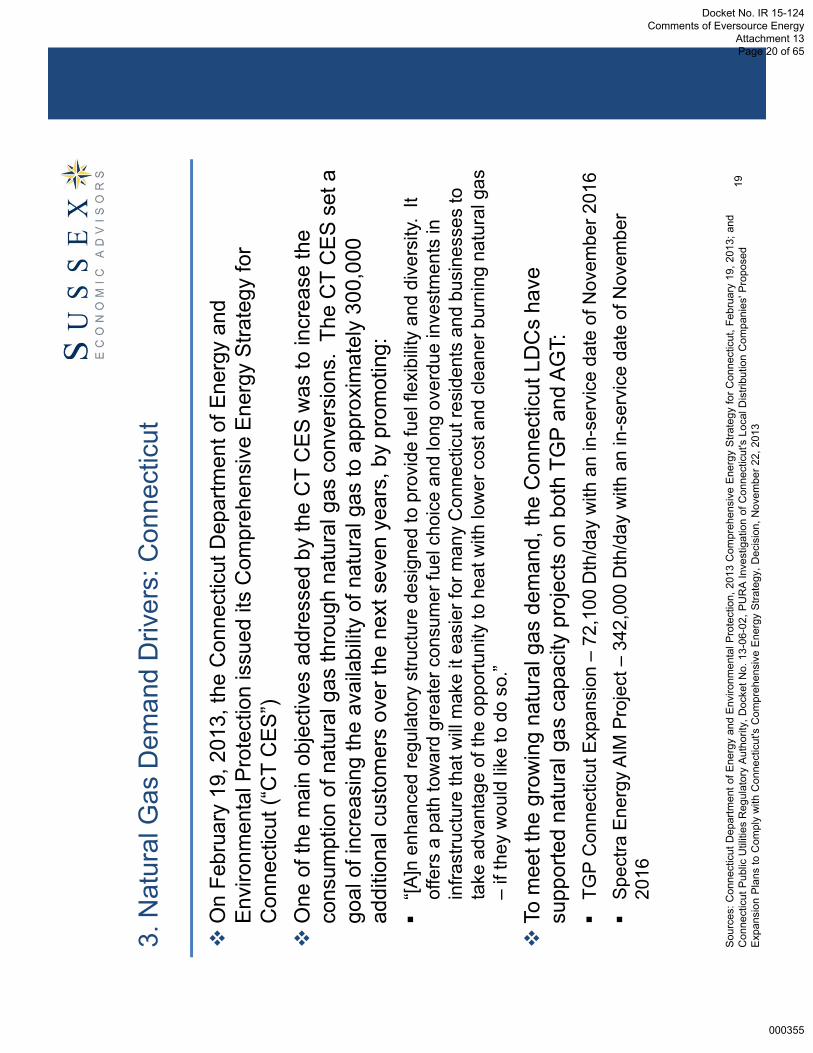
O
n Fe
brua
ry 1
9, 2
013,
the
Con
nect
icut
Dep
artm
ent o
f Ene
rgy
and
Env
ironm
enta
l Pro
tect
ion
issu
ed it
s C
ompr
ehen
sive
Ene
rgy
Stra
tegy
for
Con
nect
icut
(“C
T C
ES
”)
One
of t
he m
ain
obje
ctiv
es a
ddre
ssed
by
the
CT
CE
S w
as to
incr
ease
the
cons
umpt
ion
of n
atur
al g
as th
roug
h na
tura
l gas
con
vers
ions
. Th
e C
T C
ES
set
a
goal
of i
ncre
asin
g th
e av
aila
bilit
y of
nat
ural
gas
to a
ppro
xim
atel
y 30
0,00
0 ad
ditio
nal c
usto
mer
s ov
er th
e ne
xt s
even
yea
rs, b
y pr
omot
ing:
“[A
]n e
nhan
ced
regu
lato
ry s
truct
ure
desi
gned
to p
rovi
de fu
el fl
exib
ility
and
div
ersi
ty.
It of
fers
a p
ath
tow
ard
grea
ter c
onsu
mer
fuel
cho
ice
and
long
ove
rdue
inve
stm
ents
in
infra
stru
ctur
e th
at w
ill m
ake
it ea
sier
for m
any
Con
nect
icut
resi
dent
s an
d bu
sine
sses
to
take
adv
anta
ge o
f the
opp
ortu
nity
to h
eat w
ith lo
wer
cos
t and
cle
aner
bur
ning
nat
ural
gas
–
if th
ey w
ould
like
to d
o so
.”
To
mee
t the
gro
win
g na
tura
l gas
dem
and,
the
Con
nect
icut
LD
Cs
have
su
ppor
ted
natu
ral g
as c
apac
ity p
roje
cts
on b
oth
TGP
and
AG
T:
TGP
Con
nect
icut
Exp
ansi
on –
72,1
00 D
th/d
ay w
ith a
n in
-ser
vice
dat
e of
Nov
embe
r 201
6
Spe
ctra
Ene
rgy
AIM
Pro
ject
–34
2,00
0 D
th/d
ay w
ith a
n in
-ser
vice
dat
e of
Nov
embe
r 20
16
Sou
rces
: Con
nect
icut
Dep
artm
ent o
f Ene
rgy
and
Env
ironm
enta
l Pro
tect
ion,
201
3 C
ompr
ehen
sive
Ene
rgy
Stra
tegy
for C
onne
ctic
ut, F
ebru
ary
19, 2
013;
and
C
onne
ctic
ut P
ublic
Util
ities
Reg
ulat
ory
Aut
horit
y, D
ocke
t No.
13-
06-0
2, P
UR
A In
vest
igat
ion
of C
onne
ctic
ut's
Loc
al D
istri
butio
n C
ompa
nies
' Pro
pose
d E
xpan
sion
Pla
ns to
Com
ply
with
Con
nect
icut
's C
ompr
ehen
sive
Ene
rgy
Stra
tegy
, Dec
isio
n, N
ovem
ber 2
2, 2
013
19
Docket No. IR 15-124 Comments of Eversource Energy
Attachment 13 Page 20 of 65
000355

3. N
atur
al G
as D
eman
d D
river
s: M
assa
chus
etts
Th
e M
assa
chus
etts
DO
ER
has
spo
nsor
ed a
stu
dy to
ana
lyze
the
net e
cono
mic
an
d en
viro
nmen
tal b
enef
its o
f exp
andi
ng n
atur
al g
as d
istri
butio
n se
rvic
e to
mor
e M
assa
chus
etts
hou
seho
lds
and
busi
ness
es (“
the
Nat
ural
Gas
Stu
dy”)
Th
e pu
rpos
e of
the
Nat
ural
Gas
Stu
dy is
to d
evel
op a
n an
alyt
ical
fram
ewor
k,
findi
ngs,
and
reco
mm
enda
tions
rega
rdin
g na
tura
l gas
dis
tribu
tion
expa
nsio
n in
lig
ht o
f cha
ngin
g m
arke
t con
ditio
ns a
nd e
nviro
nmen
tal i
ssue
s
The
DO
ER
ant
icip
ates
that
the
outc
ome
of th
e N
atur
al G
as S
tudy
, alo
ng w
ith it
s re
new
able
ther
mal
exp
ansi
on s
tudy
, cou
ld re
sult
in n
ew a
ppro
ache
s w
ith
resp
ect t
o th
erm
al p
olic
ies
in M
assa
chus
etts
Th
e N
atur
al G
as S
tudy
will
eval
uate
the
bene
fits,
cos
ts, a
nd c
halle
nges
as
soci
ated
with
nat
ural
gas
LD
C e
xpan
sion
und
er a
rang
e of
pot
entia
l stra
tegy
op
tions
20
Docket No. IR 15-124 Comments of Eversource Energy
Attachment 13 Page 21 of 65
000356

3. N
atur
al G
as D
eman
d D
river
s: N
ew Y
ork
City
G
as c
onve
rsio
n re
ques
ts h
ave
incr
ease
d be
twee
n 20
10 a
nd 2
013
P
laN
YC
cal
ls fo
r the
elim
inat
ion
of th
e us
e of
No.
4 a
nd 6
hea
ting
oil
N
o pe
rmits
for n
ew N
o. 4
or 6
boi
lers
(unl
ess
emis
sion
s as
cle
an a
s N
o. 2
oil)
N
o ce
rtific
ate
of o
pera
tion
will
be
rene
wed
for
No.
6 b
oile
r as
of J
uly
2012
(unl
ess
emis
sion
s as
cle
an a
s N
o. 4
oil)
A
ll bo
ilers
mus
t use
No.
2 o
il, n
atur
al g
as o
r eq
uiva
lent
upo
n re
tirem
ent o
r by
2030
C
on E
diso
n is
fore
cast
ing
peak
usa
ge o
ver
the
next
five
yea
rs to
incr
ease
C
EC
ON
Y G
as: 3
.8%
ann
ually
O
&R
Gas
: 0.7
% a
nnua
lly
Pote
ntia
l Con
vers
ions
by
Fuel
Typ
eM
ulti-
Fam
ily a
nd C
omm
erci
al B
uild
ings
Year
Num
ber o
f Con
vers
ions
2010
73
2011
310
2012
855
Thro
ugh
Sep.
201
387
0
Num
ber o
f Con
vers
ions
–C
ECO
NY
Gas
Mul
ti-Fa
mily
and
Com
mer
cial
Bui
ldin
gs
Sou
rce:
Con
Edi
son,
Inve
stor
Pre
sent
atio
n at
the
Edi
son
Ele
ctric
Inst
itute
Fin
ance
Con
fere
nce,
Nov
embe
r 10-
12, 2
013
No.
2 O
il,
70%
No.
4 O
il,
12%
No.
6 O
il,
18%
21
Docket No. IR 15-124 Comments of Eversource Energy
Attachment 13 Page 22 of 65
000357

3. N
atur
al G
as D
eman
d D
river
s: M
ariti
mes
Can
ada
A
ccor
ding
to a
rece
nt N
ova
Sco
tia D
epar
tmen
t of E
nerg
y (“N
S D
OE
”) S
tudy
:
Nat
ural
Gas
Dem
and:
•M
ariti
mes
Can
ada
natu
ral g
as c
onsu
mpt
ion
will
incr
ease
from
app
roxi
mat
ely
62 B
cf in
201
2 (i.
e.,
170
MM
cf/d
ay) t
o ap
prox
imat
ely
70 B
cf b
y 20
20 (i
.e.,
192
MM
cf/d
ay),
larg
ely
driv
en b
y th
e po
wer
ge
nera
tion
segm
ent
•G
as-fi
red
gene
ratio
n in
Nov
a S
cotia
has
incr
ease
d fro
m 3
% o
f tot
al g
ener
atio
n in
200
6 to
ove
r 20%
in
201
2
N
atur
al G
as S
uppl
y:•
Mar
itim
es C
anad
a na
tura
l gas
sup
ply
is e
xpec
ted
to s
hift
from
a re
lianc
e on
offs
hore
nat
ural
gas
re
sour
ces
(i.e.
, SO
EP,
Dee
p P
anuk
e) to
ext
erna
l sou
rces
of n
atur
al g
as s
uppl
y (e
.g.,
LNG
, or
impo
rts fr
om th
e U
.S.)
•O
ne o
f the
focu
s ar
eas
of th
e N
S D
OE
Stu
dy w
as u
pstre
am c
apac
ity c
ontra
ctin
g, s
peci
fical
ly:
“[g]iv
en th
e ne
ed fo
r ext
erna
l sup
ply,
ICF
belie
ves
ther
e is
a s
trong
arg
umen
t for
Mar
itim
es C
anad
a co
nsum
ers
to c
ontra
ct fo
r firm
pip
elin
e ca
paci
ty o
n on
e of
the
prop
osed
pip
elin
e ex
pans
ions
into
N
ew E
ngla
nd th
at w
ould
allo
w s
hipp
ers
to b
uy g
as a
t one
of t
he M
arce
llus
basi
n hu
bs to
an
inte
rcon
nect
ion
with
M&
NP.
Thi
s w
ould
ens
ure
a re
liabl
e so
urce
of g
as a
s w
ell a
s av
oid
the
pric
e vo
latil
ity in
New
Eng
land
.”
Sou
rce:
Nov
a S
cotia
Dep
artm
ent o
f Ene
rgy,
The
Fut
ure
of N
atur
al G
as S
uppl
y fo
r Nov
a S
cotia
, pre
pare
d by
ICF
Con
sulti
ng C
anad
a, In
c., M
arch
28, 2
013
22
Docket No. IR 15-124 Comments of Eversource Energy
Attachment 13 Page 23 of 65
000358

3. N
atur
al G
as D
eman
d D
river
s: P
ower
Gen
erat
ion
Th
ere
are
appr
oxim
atel
y 35
0 ge
nera
ting
units
in th
e IS
O N
ew E
ngla
nd re
gion
–a
tota
l of
over
32,
000
MW
of g
ener
atin
g ca
paci
ty –
with
nat
ural
gas
-fire
d ge
nera
tors
repr
esen
ting
appr
oxim
atel
y 43
% o
f tot
al g
ener
atin
g ca
paci
ty a
nd 5
2% o
f tot
al e
lect
ric e
nerg
y pr
oduc
tion
in 2
012
S
ever
al k
ey g
ener
atin
g fa
cilit
ies,
whi
ch re
pres
ent n
early
10%
of t
he re
gion
’s to
tal c
apac
ity,
have
ann
ounc
ed p
lans
to re
tire
over
the
next
thre
e ye
ars:
S
alem
Har
bor (
750
MW
) –sc
hedu
led
to b
e re
tired
by
June
201
4; e
xpec
ted
to b
e re
plac
ed b
y a
new
ap
prox
imat
ely
700
MW
com
bine
d cy
cle
gas
turb
ine
faci
lity
Ve
rmon
t Yan
kee
(604
MW
) –ex
pect
ed to
be
deco
mm
issi
oned
in la
te 2
014;
sin
ce 2
007,
has
gen
erat
ed
appr
oxim
atel
y 4%
of t
he to
tal a
nnua
l ele
ctric
ity s
uppl
y in
New
Eng
land
B
rayt
on P
oint
(1,4
92 M
W) –
thre
e co
al-fi
red
units
and
sev
eral
oil-
fired
uni
ts s
ched
uled
to re
tire
by 2
017
N
orw
alk
Har
bor (
340
MW
) –oi
l-fire
d ge
nera
ting
faci
lity
sche
dule
d to
be
retir
ed b
y Ju
ne 2
017
A
s of
Jan
uary
1, 2
014,
ther
e ar
e 70
gen
erat
ion
proj
ects
in v
ario
us s
tage
s of
dev
elop
men
t in
the
ISO
New
Eng
land
regi
on to
talin
g 4,
980
MW
S
even
of t
he 7
0 pr
ojec
ts a
re d
ual f
uel (
i.e.,
natu
ral g
as a
nd o
il-fir
ed) g
ener
atio
n pr
ojec
ts lo
cate
d in
M
assa
chus
etts
and
Con
nect
icut
, for
a to
tal o
f 2,2
30 M
W, w
ith in
-ser
vice
dat
es b
etw
een
2014
and
201
7;
and
two
proj
ects
are
nat
ural
gas
com
bine
d-cy
cle
gene
ratio
n pr
ojec
ts, f
or a
tota
l of 5
03 M
W, w
ith in
-se
rvic
e da
tes
in 2
014
and
2017
S
tate
d di
ffere
ntly,
of t
he 4
,980
MW
of g
ener
atio
n be
ing
deve
lope
d, o
ver h
alf (
i.e.,
2,73
3 M
W) w
ill be
fu
eled
by
natu
ral g
asS
ourc
es: I
SO
New
Eng
land
, New
Eng
land
201
2-13
Reg
iona
l Pro
file
and
Mai
ne 2
012-
13 S
tate
Pro
file,
Feb
ruar
y 20
13; I
SO
New
Eng
land
, Sea
sona
l Cla
imed
C
apac
ity M
onth
ly R
epor
t, O
ctob
er 1
, 201
3; IS
O N
ew E
ngla
nd, S
tatu
s of
Non
-Pric
e R
etire
men
t Req
uest
s, D
ecem
ber 2
0, 2
013;
and
ISO
New
Eng
land
, In
terc
onne
ct R
eque
st Q
ueue
, Jan
uary
1, 2
014
23
Docket No. IR 15-124 Comments of Eversource Energy
Attachment 13 Page 24 of 65
000359

3. N
atur
al G
as S
uppl
y D
river
s: A
tlant
ic C
anad
a
Sou
rces
: Can
ada-
Nov
a S
cotia
Offs
hore
Pet
role
um B
oard
, Sab
le M
onth
ly P
rodu
ctio
n R
epor
ts, a
s of
Jan
uary
21,
201
4; N
ova
Sco
tia D
epar
tmen
t of E
nerg
y,
The
Futu
re o
f Nat
ural
Gas
Sup
ply
for N
ova
Sco
tia, p
repa
red
by IC
F C
onsu
lting
Can
ada,
Inc.
, Mar
ch 2
8, 2
013;
and
The
Chr
onic
le H
eral
d, “D
eep
Pan
uke
back
in
full
swin
g”, D
ecem
ber 1
1, 2
013
S
able
Offs
hore
Ene
rgy
Pro
ject
:
Nat
ural
gas
pro
duct
ion
from
SO
EP
decl
ined
from
a p
eak
of n
early
600
MM
cf/d
ay in
Dec
embe
r 20
01 to
240
MM
cf/d
ay in
Aug
ust 2
012;
sin
ce S
epte
mbe
r 201
2, a
vera
ge d
aily
SO
EP
prod
uctio
n ha
s de
clin
ed to
app
roxi
mat
ely
140
MM
cf/d
ay
D
eep
Pan
uke:
In
itial
pro
duct
ion
of 2
00 M
Mcf
/day
, with
pea
k ga
s pr
oduc
tion
of 3
00 M
Mcf
/day
D
ecem
ber 2
013:
Rea
ched
pro
duct
ion
of 2
90 M
Mcf
/day
Th
e na
tura
l gas
pro
duct
ion
prof
ile fo
r Dee
p P
anuk
e w
as a
ddre
ssed
by
a re
cent
Nov
a S
cotia
D
epar
tmen
t of E
nerg
y st
udy:
•“D
eep
Pan
uke,
is p
roje
cted
to c
ome
onlin
e in
mid
-201
3, w
ith p
eak
prod
uctio
n vo
lum
es o
f 300
MM
cfd
by
2014
-15.
Afte
r 201
5, p
rodu
ctio
n fro
m D
eep
Pan
uke
is p
roje
cted
to d
eclin
e, re
achi
ng 9
0 M
Mcf
d by
202
0 an
d le
ss th
an 2
0 M
Mcf
d by
203
5.”
Yea
r
Tota
l A
nnua
l P
rodu
ctio
n (M
Mcf
)
Avg
. Dai
ly
Pro
duct
ion
(MM
cf/d
ay)
2000
126,
983
347
2001
189,
755
520
2002
193,
273
530
2003
164,
706
451
2004
152,
779
417
2005
149,
174
409
2006
133,
957
367
2007
155,
432
426
2008
163,
687
447
2009
126,
469
346
2010
116,
454
319
2011
99,8
9527
420
1275
,806
207
2013
51,0
2014
0
0
100
200
300
400
500
600
Dec-99Aug-00Apr-01Dec-01Aug-02Apr-03Dec-03Aug-04Apr-05Dec-05Aug-06Apr-07Dec-07Aug-08Apr-09Dec-09Aug-10Apr-11Dec-11Aug-12Apr-13Dec-13
(MMcf/day)
24
Docket No. IR 15-124 Comments of Eversource Energy
Attachment 13 Page 25 of 65
000360

M
assa
chus
etts
LN
G fa
cilit
ies:
Im
ports
into
DO
MA
C’s
Eve
rett
LNG
term
inal
de
clin
ed fr
om a
n av
erag
e of
app
roxi
mat
ely
400
MM
cf/d
ay o
ver t
he 2
008
to 2
011
time
perio
d to
an
aver
age
of le
ss th
an 2
00
MM
cf/d
ay in
201
3
The
Nor
thea
st G
atew
ay te
rmin
al h
as n
ot
rece
ived
any
LN
G c
argo
es s
ince
Mar
ch
2010
, whi
le th
e N
eptu
ne L
NG
Dee
pwat
er
Por
t has
rece
ived
onl
y fo
ur s
hipm
ents
sin
ce
it ca
me
onlin
e in
Feb
ruar
y 20
10, w
ith n
o sh
ipm
ents
in 2
011,
201
2 or
201
3
C
anap
ort L
NG
:
Impo
rt vo
lum
es fr
om th
e C
anap
ort L
NG
fa
cilit
y, b
ased
on
a tw
elve
-mon
th ro
lling
aver
age,
pea
ked
at a
ppro
xim
atel
y 30
0 M
Mcf
/day
in th
e 20
11/2
012
win
ter a
nd h
ave
decl
ined
to b
elow
200
MM
cf/d
ay s
ince
M
arch
201
3
In te
rms
of p
eak
volu
me
send
out,
the
Can
apor
t LN
G fa
cilit
y pr
ovid
ed o
ver 7
00
MM
cf/d
ay o
n an
ave
rage
day
bas
is in
Ja
nuar
y 20
11 d
eclin
ing
to a
pea
k m
onth
av
erag
e da
y vo
lum
e se
ndou
t of 2
00
MM
cf/d
ay in
Nov
embe
r 201
3
3. N
atur
al G
as S
uppl
y D
river
s: Im
porte
d LN
G
Sou
rces
: U.S
. Dep
artm
ent o
f Ene
rgy,
LN
G M
onth
ly R
epor
ts; a
nd N
atio
nal E
nerg
y B
oard
, LN
G S
hipm
ent D
etai
ls, a
s of
Jan
uary
27,
201
4
0
100
200
300
400
500
600
700
Jan-08
Jun-08
Nov-08
Apr-09
Sep-09
Feb-10
Jul-10
Dec-10
May-11
Oct-11
Mar-12
Aug-12
Jan-13
Jun-13
Nov-13
(MMcf/day)
DO
MAC
- E
vere
tt LN
G
Nor
thea
st G
atew
ay
Nep
tune
Dee
pwat
er P
ort
0
100
200
300
400
500
600
700
800
Jul-09
Nov-09
Mar-10
Jul-10
Nov-10
Mar-11
Jul-11
Nov-11
Mar-12
Jul-12
Nov-12
Mar-13
Jul-13
Nov-13
(MMcf/day)Av
erag
e D
aily
Vol
umes
Rol
ling
12-m
onth
Ave
rage
25
Docket No. IR 15-124 Comments of Eversource Energy
Attachment 13 Page 26 of 65
000361

N
ew E
ngla
nd n
atur
al g
as p
rices
ha
ve h
isto
rical
ly tr
aded
at a
pr
emiu
m to
oth
er N
orth
Am
eric
an
loca
tions
H
owev
er, N
ew E
ngla
nd n
atur
al g
as
pric
es (a
s re
pres
ente
d by
the
Alg
onqu
in C
ityga
tes
natu
ral g
as
pric
e in
dex)
usu
ally
trad
e at
a
disc
ount
to th
e U
nite
d K
ingd
om
natu
ral g
as p
rices
(i.e
., N
atio
nal
Bal
anci
ng P
oint
(“U
K N
BP
”)) a
nd
Asi
an L
NG
pric
es, w
hich
has
re
duce
d th
e nu
mbe
r of L
NG
de
liver
ies
to th
e re
gion
3. N
atur
al G
as S
uppl
y D
river
s: L
NG
Mar
ket S
igna
ls
Sou
rces
: His
toric
al p
rices
thr
ough
Jan
uary
29,
201
4 fro
m S
NL
Fina
ncia
l and
Blo
ombe
rg P
rofe
ssio
nal;
forw
ard
settl
emen
t pric
es a
s of
Jan
uary
28,
201
4 fro
m
Blo
ombe
rg P
rofe
ssio
nal;
and
FER
C, W
inte
r 201
3-14
Ene
rgy
Mar
ket A
sses
smen
t Rep
ort t
o th
e C
omm
issi
on, O
ctob
er 1
7, 2
013
Acc
ordi
ng to
the
FER
C: “
…LN
G is
like
ly to
rem
ain
in s
hort
supp
ly th
is w
inte
r with
pric
e sp
ikes
in
New
Eng
land
not
sus
tain
ed lo
ng e
noug
h to
ince
ntiv
ize
LNG
car
gos.
GD
F S
uez,
the
owne
r of
the
Eve
rett
LNG
pla
nt in
Mas
sach
uset
ts, i
s un
der c
ontra
ct to
div
ert a
lmos
t hal
f of i
ts
supp
lies
to h
ighe
r pric
ed a
reas
els
ewhe
re in
the
wor
ld…
Rep
sol,
the
owne
r of C
anap
ort L
NG
, do
es n
ot a
ntic
ipat
e re
ceiv
ing
man
y ca
rgos
this
win
ter o
r goi
ng fo
rwar
d. A
s of
mid
-201
3,
Rep
sol i
s un
der c
ontra
ct to
rece
ive
abou
t tw
o sh
ipm
ents
of L
NG
a y
ear,
just
eno
ugh
to k
eep
the
term
inal
ope
ratin
g.”
$0$5$10
$15
$20
$25
$30
$35
Nov-08Feb-09May-09Aug-09Nov-09Feb-10May-10Aug-10Nov-10Feb-11May-11Aug-11Nov-11Feb-12May-12Aug-12Nov-12Feb-13May-13Aug-13Nov-13Feb-14May-14Aug-14Nov-14Feb-15May-15
($/MMBtu)Av
g. D
aily
Alg
onqu
in C
ityga
tes
Avg.
Dai
ly U
K N
BPJa
pan
LNG
Impo
rt Pr
ice
Fore
cast
His
toric
al
26
Docket No. IR 15-124 Comments of Eversource Energy
Attachment 13 Page 27 of 65
000362

3. N
atur
al G
as S
uppl
y D
river
s: T
rans
Can
ada
Pip
eLin
es L
imite
d
In
Dec
embe
r 201
3, T
CP
Lfil
ed w
ith th
e N
EB
its
Mai
nlin
e S
ettle
men
t Agr
eem
ent
with
the
east
ern
Can
adia
n LD
Cs
(i.e.
, Uni
on G
as L
td.,
Gaz
Met
ro L
imite
d P
artn
ersh
ip a
nd E
nbrid
ge G
as D
istri
butio
n) in
con
nect
ion
with
acc
ess
to D
awn
and
Nia
gara
sup
plie
s an
d lo
ng-te
rm to
lls
Acc
ordi
ng to
the
TCP
L ap
plic
atio
n: “T
he S
ettle
men
t bui
lds
upon
the
RH
-003
-201
1 D
ecis
ion
and
reso
lves
var
ious
regu
lato
ry a
nd ju
dici
al p
roce
edin
gs th
at a
rose
sin
ce th
e B
oard
’s d
ecis
ion
in th
e R
H-0
03-2
011
proc
eedi
ng a
nd a
ddre
sses
the
requ
irem
ent t
hat
Tran
sCan
ada
file
a to
lls a
pplic
atio
n in
the
even
t tha
t one
of t
he o
ff-ra
mps
is re
ache
d be
fore
the
end
of th
e pe
riod
of fi
xed
tolls
est
ablis
hed
by th
e D
ecis
ion.
”
Th
e M
ainl
ine
Set
tlem
ent A
gree
men
t mus
t be
appr
oved
by
the
NE
B b
efor
e be
ing
plac
ed
into
effe
ct in
Jan
uary
201
5
O
ver 2
0 in
terv
enin
g pa
rties
hav
e su
bmitt
ed c
omm
ents
in re
spon
se to
the
TCP
L ap
plic
atio
n
Fr
om N
ovem
ber 2
9, 2
013
to J
anua
ry 1
5, 2
014,
TC
PL
cond
ucte
d a
bind
ing
open
se
ason
for c
apac
ity o
n th
e TC
PL
Mai
nlin
e. T
he b
indi
ng o
pen
seas
on is
pr
emis
ed o
n N
EB
app
rova
l of t
he M
ainl
ine
Set
tlem
ent A
gree
men
t
Sou
rces
: Tra
nsC
anad
a P
ipel
ines
Lim
ited,
App
licat
ion
for A
ppro
val o
f Mai
nlin
e 20
13-2
013
Set
tlem
ent,
Dec
embe
r 201
3; a
nd c
ompa
ny w
ebsi
te27
Docket No. IR 15-124 Comments of Eversource Energy
Attachment 13 Page 28 of 65
000363

D
ry s
hale
gas
pro
duct
ion
from
the
Mar
cellu
s S
hale
bas
in h
as s
igni
fican
tly
incr
ease
d fro
m le
ss th
an 0
.5 B
cf/d
ay in
A
ugus
t 200
9 to
app
roxi
mat
ely
11.5
B
cf/d
ay in
Dec
embe
r 201
3
The
U.S
. Ene
rgy
Info
rmat
ion
Adm
inis
tratio
n (“
EIA
”) is
fore
cast
ing
natu
ral g
as p
rodu
ctio
n fro
m th
e N
orth
east
U.S
. will
incr
ease
from
less
th
an 4
.0 T
cf in
201
3 to
app
roxi
mat
ely
5.3
Tcf i
n 20
20, a
nd o
ver 8
.0 T
cf in
204
0
The
incr
ease
in M
arce
llus
Sha
le
prod
uctio
n co
uple
d w
ith th
e E
IA’s
pr
ojec
tion
of c
ontin
ued
deve
lopm
ent o
f th
is n
atur
al g
as s
hale
pla
y re
sults
in th
e M
arce
llus
Sha
le b
ecom
ing
a cr
itica
l na
tura
l gas
sup
ply
sour
ce fo
r the
New
E
ngla
nd re
gion
3. N
atur
al G
as S
uppl
y D
river
s: M
arce
llus
Sha
le P
rodu
ctio
n
Sou
rces
: U.S
. Ene
rgy
Info
rmat
ion
Adm
inis
tratio
n, N
atur
al G
as W
eekl
y U
pdat
e fo
r wee
k en
ding
Jan
uary
22,
201
4; a
nd U
.S. E
nerg
y In
form
atio
n A
dmin
istra
tion,
A
nnua
l Ene
rgy
Out
look
201
4 w
ith p
roje
ctio
ns to
204
0, L
ower
48
Nat
ural
Gas
Pro
duct
ion
and
Sup
ply
Pric
es b
y S
uppl
y R
egio
n, D
ecem
ber 1
6, 2
013
Fore
cast
ed N
atur
al G
as P
rodu
ctio
n (2
011
–20
40)
05101520253035
Jan-08Apr-08Jul-08Oct-08Jan-09Apr-09Jul-09Oct-09Jan-10Apr-10Jul-10Oct-10Jan-11Apr-11Jul-11Oct-11Jan-12Apr-12Jul-12Oct-12Jan-13Apr-13Jul-13Oct-13
Dry Shale Gas Production (Bcf/day)
Antri
m (M
I, IN
, & O
H)
Bakk
en (N
D)
Woo
dfor
d (O
K)
Barn
ett (
TX)
Faye
ttevi
lle (A
R)
Eagl
e Fo
rd (T
X)
Hay
nesv
ille (L
A &
TX)
Mar
cellu
s (P
A &
WV
)R
est o
f US
'sha
le'
Dry
Sha
le G
as P
rodu
ctio
n (2
008
–20
13)
28
Docket No. IR 15-124 Comments of Eversource Energy
Attachment 13 Page 29 of 65
000364

B
oth
AG
T an
d TG
P ar
e fu
lly
subs
crib
ed (i
nto
New
Eng
land
) and
ha
ve e
xper
ienc
ed s
igni
fican
t in
terr
uptib
le o
r non
-firm
cap
acity
co
nstra
ints
due
to in
crea
sed
utili
zatio
n as
soci
ated
with
Mar
cellu
s S
hale
sup
ply
In
a re
cent
pre
sent
atio
n, A
GT
repo
rted
an in
crea
sing
num
ber o
f day
s w
ith n
o in
terr
uptib
le c
apac
ity a
vaila
ble
on it
s pi
pelin
e
TGP
also
has
exp
erie
nced
hig
h ut
iliza
tion
in th
e N
orth
east
U.S
. dur
ing
both
the
win
ter a
nd s
umm
er p
erio
ds
M
ost r
ecen
tly, T
GP
expe
rienc
ed
inte
rrup
tible
tran
spor
tatio
n re
stric
tions
at
Com
pres
sor S
tatio
n 24
5 in
New
Yor
k 94
%
of th
e da
ys in
the
2012
sum
mer
and
100
%
of th
e da
ys in
the
2012
/201
3 w
inte
r
3. N
atur
al G
as S
uppl
y D
river
s: C
apac
ity C
onst
rain
ts
Sou
rces
: Spe
ctra
Ene
rgy,
201
3 P
re-W
inte
r Ope
ratio
ns M
eetin
g, N
ovem
ber
5, 2
013;
and
Ten
ness
ee G
as P
ipel
ine
Co,
LLC
, Pre
sent
atio
n to
New
E
ngla
nd G
as-E
lect
ric F
ocus
Gro
up, O
ctob
er 1
8, 2
013
29
Docket No. IR 15-124 Comments of Eversource Energy
Attachment 13 Page 30 of 65
000365

3. N
atur
al G
as P
rice
and
Bas
is A
naly
sis
To
pro
vide
con
text
for t
he e
valu
atio
n of
the
cost
s an
d be
nefit
s as
soci
ated
with
in
crem
enta
l pip
elin
e ca
paci
ty in
to th
e N
ew E
ngla
nd re
gion
, the
regi
onal
nat
ural
ga
s pr
ices
and
bas
is d
iffer
entia
ls w
ere
anal
yzed
ove
r the
pas
t fiv
e sp
lit-y
ears
(i.
e., 2
008/
2009
to 2
012/
2013
)
The
follo
win
g pr
icin
g po
ints
wer
e re
view
ed:
A
lgon
quin
City
gate
s (“
ALG
CG
”): D
eliv
ery
poin
ts in
Con
nect
icut
, Mas
sach
uset
ts a
nd
Rho
de Is
land
off
of A
lgon
quin
Gas
Tra
nsm
issi
on•
The
ALG
CG
pric
e in
dex
was
util
ized
as
a pr
oxy
for t
he N
ew E
ngla
nd re
gion
pric
e. O
ther
New
E
ngla
nd re
gion
pric
e in
dice
s in
clud
e Te
nnes
see
at D
racu
t and
Ten
ness
ee Z
one
6
Te
tco
M-3
(“TE
TM3”
): M
arke
t Are
a 3
zone
of T
exas
Eas
tern
Pip
elin
e, w
hich
runs
from
W
estm
orel
and
Cou
nty,
Pa.
, to
Mor
ris C
ount
y, N
.J.
H
enry
Hub
: In
Verm
ilion
Par
ish
in S
outh
Lou
isia
na, t
he H
ub h
as 1
4 in
terc
onne
ctin
g pi
pelin
es.
Pip
elin
es in
clud
e Tr
unkl
ine
Gas
, Tra
nsco
ntin
enta
l Gas
Pip
elin
e (“
Tran
sco”
), C
olum
bia
Gul
f Tra
nsm
issi
on, T
exas
Gas
Tra
nsm
issi
on, S
abin
e P
ipe
Line
, Nat
ural
Gas
P
ipel
ine
Co.
, Sou
ther
n N
atur
al G
as a
nd G
ulf S
outh
Pip
elin
e
Not
e: A
ll hi
stor
ical
nat
ural
gas
pric
ing
data
and
def
initi
ons
are
sour
ced
from
SN
L Fi
nanc
ial
30
Docket No. IR 15-124 Comments of Eversource Energy
Attachment 13 Page 31 of 65
000366

3. N
atur
al G
as P
rice
and
Bas
is A
naly
sis
(con
t.)
M
id-A
tlant
ic n
atur
al g
as p
rices
, as
repr
esen
ted
by th
e TE
TM3
natu
ral g
as p
rice
inde
x, h
ave
hist
oric
ally
bee
n pr
iced
at a
pre
miu
m to
the
Hen
ry H
ub p
rice
inde
x
Nat
ural
gas
pric
es in
New
Eng
land
, as
repr
esen
ted
by th
e A
LGC
G n
atur
al g
as
pric
e in
dex,
hav
e be
en a
t an
addi
tiona
l pre
miu
m to
the
Mid
-Atla
ntic
nat
ural
gas
pr
ices
Th
e A
LGC
G n
atur
al g
as p
rice
inde
x ha
s ex
hibi
ted
sign
ifica
ntly
mor
e da
ily
vola
tility
than
the
Hen
ry H
ub n
atur
al g
as p
rice
inde
x, w
ith A
LGC
G p
rices
dur
ing
this
cur
rent
win
ter (
i.e.,
win
ter 2
013/
2014
) exc
eedi
ng $
77.0
0/M
MB
tu
Not
e: N
atur
al g
as p
rice
vola
tility
was
cal
cula
ted
for e
ach
split
-yea
r by
“mul
tiply
ing
the
stan
dard
dev
iatio
n of
the
daily
loga
rithm
ic p
rice
chan
ges,
∆p,
for a
ll tra
ding
day
s w
ithin
a c
erta
in ti
me
perio
d by
the
squa
re ro
ot o
f he
num
ber o
f tra
ding
day
s w
ithin
the
time
perio
d.” S
ee, U
.S. E
nerg
y In
form
atio
n A
dmin
istra
tion,
A
n A
naly
sis
of P
rice
Vol
atili
ty in
Nat
ural
Gas
Mar
kets
, Aug
ust 2
007.
Sou
rce:
His
toric
al p
rices
thr
ough
Jan
uary
29,
201
4 fro
m S
NL
Fina
ncia
l
0%50%
100%
150%
200%
250%
300%
350%
400%
450%
2008
/200
920
09/2
010
2010
/201
120
11/2
012
2012
/201
320
13/2
014*
Volatility
Split
-Yea
r (N
ov-O
ct)
Hen
ry H
ub
TETM
3
ALG
CG
-$10$0$10
$20
$30
$40
$50
$60
$70
$80
$90
Nov-08
Feb-09
May-09
Aug-09
Nov-09
Feb-10
May-10
Aug-10
Nov-10
Feb-11
May-11
Aug-11
Nov-11
Feb-12
May-12
Aug-12
Nov-12
Feb-13
May-13
Aug-13
Nov-13
Basis Differential ($/MMBtu)
ALG
CG
-Hen
ry H
ubTE
TM3-
Hen
ry H
ub
* 20
13/2
014
data
thro
ugh
Janu
ary
29, 2
014
31
Docket No. IR 15-124 Comments of Eversource Energy
Attachment 13 Page 32 of 65
000367

Th
e nu
mbe
rs o
f day
s in
w
hich
the
daily
New
E
ngla
nd n
atur
al g
as p
rice
prem
ium
to H
enry
Hub
is
grea
ter t
han
$2.0
0/M
MB
tu,
or e
ven
as h
igh
as
$5.0
0/M
MBt
u, h
as
incr
ease
d si
gnifi
cant
ly o
ver
the
past
few
yea
rs
The
New
Eng
land
nat
ural
ga
s pr
ice
prem
ium
to H
enry
H
ub ra
rely
exc
eede
d $1
0.00
/MM
Btu
ove
r the
20
08/2
009
to 2
011/
2012
tim
e pe
riod;
how
ever
, it
exce
eded
that
pric
e le
vel
on 2
5 da
ys in
201
2/20
13
and
has
alre
ady
exce
eded
th
at p
rice
leve
l on
28 d
ays
of th
e cu
rren
t 201
3/20
14
split
-yea
r
3. N
atur
al G
as P
rice
and
Bas
is A
naly
sis
(con
t.)
* 20
13/2
014
data
thro
ugh
Janu
ary
29, 2
014
Sou
rces
: His
toric
al p
rices
thr
ough
Jan
uary
29,
201
4 fro
m S
NL
Fina
ncia
l
$0.0
0
$0.5
0
$1.0
0
$1.5
0
$2.0
0
$2.5
0
$3.0
0
$3.5
0
$0$5$10
$15
$20
$25
$30
$35
131
6191
121
151
181
211
241
271
301
331
361
Split-Year Average ($/MMBtu)
($/MMBtu)
Day
s ---
-->
Bas
is D
iffer
entia
ls: A
lgon
quin
City
gate
s -H
enry
Hub
2008
/200
9
2009
/201
0
2010
/201
1
2011
/201
2
2012
/201
3
Aver
age
2008
/200
9 =
$0.9
2
Aver
age
2009
/201
0 =
$0.6
8
Aver
age
2010
/201
1 =
$1.3
0
Aver
age
2011
/201
2 =
$0.8
1
Aver
age
2012
/201
3 =
$2.8
4
2008
/200
920
09/2
010
2010
/201
120
11/2
012
2012
/201
320
13/2
014*
Gre
ater
than
or e
qual
to$1
0.00
10
20
2528
Gre
ater
than
or e
qual
to$5
.00
131
243
5338
Gre
ater
than
or e
qual
to$2
.00
4027
6121
124
56G
reat
er th
an o
r equ
al to
$1.0
078
4311
385
164
64G
reat
er th
an o
r equ
al to
$0.5
015
411
819
121
820
779
Gre
ater
than
or e
qual
to$0
.25
339
360
323
295
257
85G
reat
er th
an$0
.00
362
365
365
365
334
86Le
ss th
an o
r equ
al to
$0.0
03
00
031
4
ALG
CG-H
enry
Hub
Ba
sis
Diffe
rent
ial (
$/M
MB
tu)
Num
ber o
f Day
s
32
Docket No. IR 15-124 Comments of Eversource Energy
Attachment 13 Page 33 of 65
000368

3. N
atur
al G
as P
rice
and
Bas
is A
naly
sis
(con
t.)
Th
e 20
12/2
013
win
ter p
rice
diffe
rent
ial b
etw
een
the
New
Eng
land
and
Gul
f of M
exic
o pr
icin
g in
dice
s av
erag
ed o
ver $
6.00
/MM
Btu
, whi
ch is
the
high
est l
evel
obs
erve
d ov
er th
e fiv
e-ye
ar h
isto
rical
per
iod
from
200
8/20
09 to
201
2/20
13
The
curr
ent 2
013/
2014
ALG
CG
to H
enry
Hub
bas
is a
vera
ged
$9.8
6/M
MB
tu, w
hich
is n
early
fo
ur ti
mes
hig
her t
han
the
five-
year
his
toric
al a
vera
ge o
f $2.
50/M
MB
tu
New
Eng
land
forw
ard
pric
es a
re e
xpec
ted
to c
ontin
ue to
be
at a
pre
miu
m to
Hen
ry H
ub a
nd
Mid
-Atla
ntic
nat
ural
gas
pric
es
The
high
nat
ural
gas
pre
miu
m (i
.e.,
basi
s di
ffere
ntia
l) be
twee
n th
e N
ew E
ngla
nd a
nd M
id-
Atla
ntic
mar
kets
refle
cts
the
exis
ting
pipe
line
cons
train
t bet
wee
n th
e M
id-A
tlant
ic m
arke
t, w
hich
has
sig
nific
ant a
cces
s to
nat
ural
gas
pro
duct
ion
from
Mar
cellu
s S
hale
, and
the
New
E
ngla
nd m
arke
t
Split
-Yea
r (N
ov-O
ct)
Win
ter (
Nov
-Mar
)Su
mm
er (A
pr-O
ct)
Annu
al (N
ov-O
ct)
TETM
3-H
enry
Hub
ALG
CG
-H
enry
Hub
ALG
CG
-TE
TM3
TETM
3-H
enry
Hub
ALG
CG
-H
enry
Hub
ALG
CG
-TE
TM3
TETM
3-H
enry
Hub
ALG
CG
-H
enry
Hub
ALG
CG
-TE
TM3
2008
/200
91.
511.
700.
190.
340.
370.
040.
820.
920.
1020
09/2
010
0.79
1.06
0.27
0.34
0.40
0.07
0.52
0.68
0.15
2010
/201
11.
882.
470.
590.
260.
480.
210.
931.
300.
3720
11/2
012
0.28
1.09
0.81
0.17
0.61
0.44
0.22
0.81
0.59
2012
/201
30.
676.
175.
500.
030.
480.
450.
292.
842.
5420
13/2
014
[1]
5.29
9.86
4.56
n/a
n/a
n/a
n/a
n/a
n/a
His
toric
al A
vera
ge
(200
8/09
-201
2/13
)1.
022.
501.
470.
230.
470.
240.
561.
310.
75
2013
/201
4 [2
]5.
1612
.34
7.17
(0.7
0)0.
461.
161.
745.
413.
6720
14/2
015
1.42
8.50
7.08
(0.9
1)0.
251.
160.
063.
693.
6320
15/2
016
1.20
7.95
6.75
(0.9
2)0.
141.
05(0
.08)
3.29
3.37
Forw
ard
Ave
rage
(2
013/
14-2
015/
16) [
2]2.
599.
597.
00(0
.84)
0.28
1.12
(0.5
7)4.
133.
55
[1] H
isto
rical
spl
it-ye
ar 2
013/
2014
incl
udes
dat
a th
roug
h Ja
nuar
y 29
, 201
4[2
] Win
ter 2
013/
2014
bas
ed o
n hi
stor
ical
mon
thly
ave
rage
s fo
r Nov
embe
r 201
3-Ja
nuar
y 20
14, a
nd fo
rwar
d se
ttlem
ent p
rices
for F
ebru
ary-
Mar
ch 2
014
Sou
rces
: His
toric
al p
rices
thr
ough
Jan
uary
29,
201
4 fro
m S
NL
Fina
ncia
l; an
d fo
rwar
d se
ttlem
ent p
rices
as
of J
anua
ry 2
8, 2
014
from
Blo
ombe
rg P
rofe
ssio
nal
33
Docket No. IR 15-124 Comments of Eversource Energy
Attachment 13 Page 34 of 65
000369

Con
tent
s
1.In
trodu
ctio
n
2.E
xecu
tive
Sum
mar
y
3.N
atur
al G
as M
arke
t Ove
rvie
w
4.N
atur
al G
as P
ipel
ine
Cap
acity
Opt
ions
N
orth
east
Pip
elin
e In
frast
ruct
ure
Act
ivity
P
roje
ct M
etric
s / I
nfor
mat
ion
5.C
ost /
Ben
efit
Ana
lysi
s
6.S
umm
ary
and
Con
clus
ions
34
Docket No. IR 15-124 Comments of Eversource Energy
Attachment 13 Page 35 of 65
000370
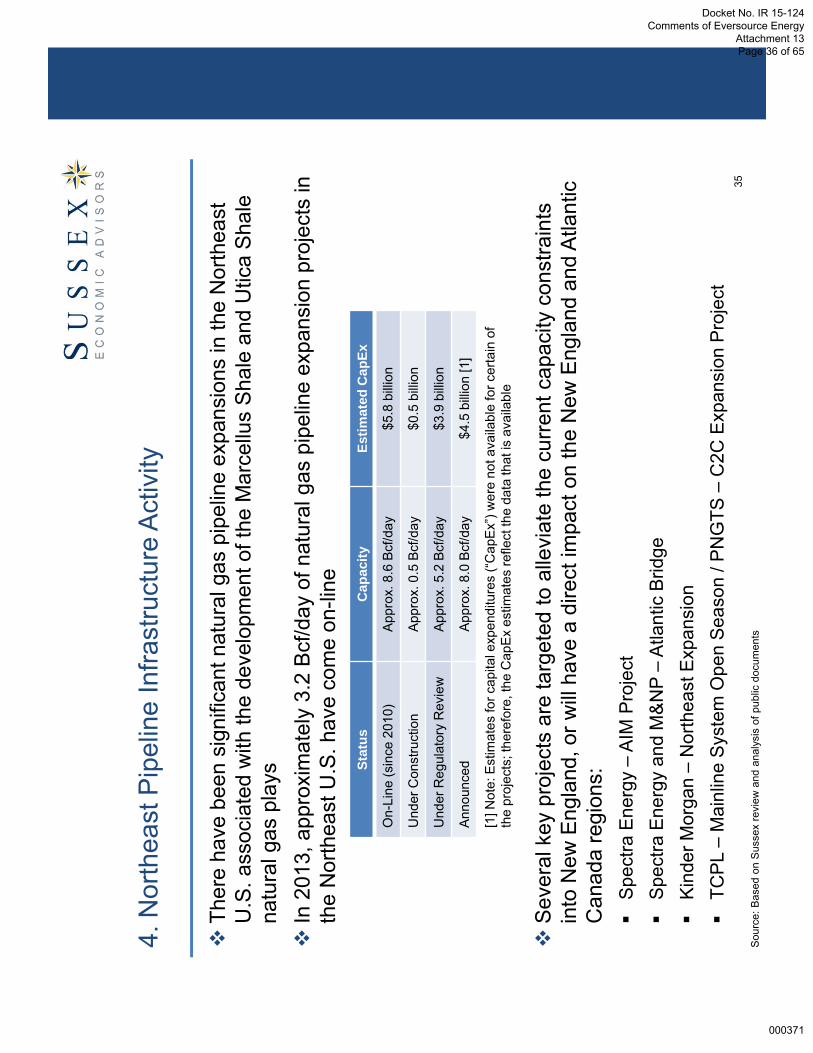
4. N
orth
east
Pip
elin
e In
frast
ruct
ure
Act
ivity
Th
ere
have
bee
n si
gnifi
cant
nat
ural
gas
pip
elin
e ex
pans
ions
in th
e N
orth
east
U
.S. a
ssoc
iate
d w
ith th
e de
velo
pmen
t of t
he M
arce
llus
Sha
le a
nd U
tica
Sha
le
natu
ral g
as p
lays
In
201
3, a
ppro
xim
atel
y 3.
2 B
cf/d
ay o
f nat
ural
gas
pip
elin
e ex
pans
ion
proj
ects
in
the
Nor
thea
st U
.S. h
ave
com
e on
-line
S
ever
al k
ey p
roje
cts
are
targ
eted
to a
llevi
ate
the
curre
nt c
apac
ity c
onst
rain
ts
into
New
Eng
land
, or w
ill ha
ve a
dire
ct im
pact
on
the
New
Eng
land
and
Atla
ntic
C
anad
a re
gion
s:
Spe
ctra
Ene
rgy
–AI
M P
roje
ct
S
pect
ra E
nerg
y an
d M
&N
P –
Atla
ntic
Brid
ge
Kin
der M
orga
n –
Nor
thea
st E
xpan
sion
TC
PL
–M
ainl
ine
Sys
tem
Ope
n S
easo
n / P
NG
TS –
C2C
Exp
ansi
on P
roje
ct
[1] N
ote:
Est
imat
es fo
r cap
ital e
xpen
ditu
res
(“C
apEx
”) w
ere
not a
vaila
ble
for c
erta
in o
f th
e pr
ojec
ts; t
here
fore
, the
Cap
Ex
estim
ates
refle
ct th
e da
ta th
at is
ava
ilabl
e
Stat
usC
apac
ityEs
timat
ed C
apEx
On-
Line
(sin
ce 2
010)
App
rox.
8.6
Bcf
/day
$5.8
billi
on
Und
er C
onst
ruct
ion
App
rox.
0.5
Bcf/d
ay$0
.5 b
illion
Und
er R
egul
ator
y R
evie
wAp
prox
. 5.2
Bcf
/day
$3.9
billi
on
Anno
unce
dAp
prox
. 8.0
Bcf
/day
$4.5
billi
on[1
]
Sou
rce:
Bas
ed o
n S
usse
x re
view
and
ana
lysi
s of
pub
lic d
ocum
ents
35
Docket No. IR 15-124 Comments of Eversource Energy
Attachment 13 Page 36 of 65
000371

4. S
pect
ra E
nerg
y –
AIM
Pro
ject
O
wne
r: S
pect
ra E
nerg
y / A
lgon
quin
Gas
Tra
nsm
issi
on
P
ropo
sed
Faci
litie
s:
A
ppro
xim
atel
y 36
.7 m
iles
of ta
ke-u
p an
d re
lay,
loop
and
late
ral p
ipel
ine
faci
litie
s, m
odifi
catio
ns to
five
co
mpr
esso
r sta
tions
, mod
ifica
tions
to 2
4 ex
istin
g M
&R
sta
tions
, and
con
stru
ctio
n of
thre
e ne
w M
&R
sta
tions
R
ecei
pt p
oint
s: M
illen
nium
at R
amap
o, N
Y a
nd T
GP
at M
ahw
ah, N
J
D
eliv
ery
poin
ts: M
ultip
le d
eliv
ery
poin
ts
S
hipp
ers:
10
LDC
s in
CT,
MA
and
RI (
i.e.,
Yank
ee G
as, N
STA
R G
as, C
onne
ctic
ut N
atur
al G
as, S
outh
ern
Con
nect
icut
Gas
, The
Nar
raga
nset
t Ele
ctric
Com
pany
, Col
onia
l Gas
, Bos
ton
Gas
, Col
umbi
a G
as o
f M
assa
chus
etts
, Nor
wic
h P
ublic
Util
ities
and
Mid
dleb
orou
gh G
as &
Ele
ctric
)
C
apac
ity: 3
42,0
00 D
th/d
ay
E
stim
ated
Cap
Ex:
$1
billio
n
A
ntic
ipat
ed In
-Ser
vice
Dat
e: N
ovem
ber 2
016
R
egul
ator
y S
tatu
s:
P
refil
ed w
ith F
ER
C: J
une
2013
C
T P
UR
A p
re-a
ppro
ved
CT
LDC
PA
s on
Nov
. 22,
201
3
M
assa
chus
etts
DP
U a
ppro
ved
MA
LD
C P
As
on J
an. 3
1, 2
014
Fi
le m
ajor
per
mit
appl
icat
ions
: Q1/
2014
R
ecei
ve F
ER
C c
ertif
icat
e: Q
1/20
15
B
egin
con
stru
ctio
n:Q
2/20
15
Sou
rce:
Bas
ed o
n S
usse
x re
view
and
ana
lysi
s of
pub
lic d
ocum
ents
36
Docket No. IR 15-124 Comments of Eversource Energy
Attachment 13 Page 37 of 65
000372

4. S
pect
ra E
nerg
y an
d M
&N
P –
Atla
ntic
Brid
ge
O
wne
rs: S
pect
ra E
nerg
y / A
lgon
quin
Gas
Tra
nsm
issi
on a
nd M
ariti
mes
& N
orth
east
Pip
elin
e
P
ropo
sed
Faci
litie
s:
R
ecei
pt p
oint
s: M
illen
nium
at R
amap
o, N
Y a
nd T
exas
Eas
tern
at L
ambe
rtvill
e, N
J
D
eliv
ery
poin
ts: E
xist
ing
and
new
del
iver
y po
ints
on
AG
T an
d M
&N
P
S
hipp
ers:
An
chor
shi
pper
–U
nitil
Cor
pora
tion
O
ther
shi
pper
s –
TBD
(rel
iant
on
open
sea
son)
C
apac
ity: 1
00,0
00 –
600,
000
Dth
/day
(Sca
labl
e)
E
stim
ated
Cap
Ex:
TB
D
A
ntic
ipat
ed In
-Ser
vice
Dat
e: N
ovem
ber 2
017
R
egul
ator
y S
tatu
s:
Ope
n se
ason
from
Feb
ruar
y 5,
201
4 to
Mar
ch 3
1, 2
014
Ta
rget
Mar
kets
:
N
ew E
ngla
nd a
nd A
tlant
ic C
anad
a
Sou
rce:
Bas
ed o
n S
usse
x re
view
and
ana
lysi
s of
pub
lic d
ocum
ents
37
Docket No. IR 15-124 Comments of Eversource Energy
Attachment 13 Page 38 of 65
000373

4. K
inde
r Mor
gan
–N
orth
east
Exp
ansi
on
O
wne
r: K
inde
r Mor
gan
/ Ten
ness
ee G
as P
ipel
ine
P
ropo
sed
Faci
litie
s:
App
rox.
179
mile
s of
pip
elin
e, la
tera
ls a
s ne
cess
ary,
ad
ditio
nal m
eter
sta
tions
, and
mod
ifica
tions
to e
xist
ing
faci
litie
s
Rec
eipt
poi
nt: I
GT
and
Con
stitu
tion
at W
right
, NY
D
eliv
ery
poin
t: M
&N
P at
Dra
cut,
MA
C
apac
ity: 6
00,0
00 –
2,20
0,00
0 D
th/d
ay
Est
imat
ed C
apE
x: $
1.75
-$2
.75
billio
n
Est
imat
ed R
ates
: Neg
otia
ted
rate
s
Ant
icip
ated
In-S
ervi
ce D
ate:
Nov
embe
r 201
8
Reg
ulat
ory
Sta
tus:
N
on-b
indi
ng o
pen
seas
on fr
om F
ebru
ary
13, 2
014
to M
arch
28,
201
4
File
maj
or p
erm
it ap
plic
atio
ns: Q
3/20
14
B
egin
con
stru
ctio
n: Q
2/20
17
Ups
tream
/Dow
nstre
am Is
sues
: Con
stitu
tion
Pip
elin
e w
ill pr
ovid
e a
sour
ce o
f gas
sup
ply
at W
right
, NY
S
hipp
ers:
Cab
ot O
il &
Gas
and
Sou
thw
este
rn E
nerg
y S
ervi
ces
Com
pany
FE
RC
fina
l env
ironm
enta
l ass
essm
ent t
o be
issu
ed b
y m
id-J
une
2014
A
ntic
ipat
ed In
-Ser
vice
Dat
e: M
arch
201
5
Sou
rce:
Bas
ed o
n S
usse
x re
view
and
ana
lysi
s of
pub
lic d
ocum
ents
38
Docket No. IR 15-124 Comments of Eversource Energy
Attachment 13 Page 39 of 65
000374

4. T
CP
L –
Mai
nlin
e S
yste
m O
pen
Sea
son
O
wne
r: Tr
ansC
anad
a P
ipeL
ines
Lim
ited
P
ropo
sed
Faci
litie
s:
Rec
eipt
poi
nts:
Em
pres
s, S
t. C
lair,
Daw
n, K
irkw
all,
Nia
gara
Fal
ls, C
hipp
awa,
Par
kway
and
Iroq
uois
D
eliv
ery
poin
t: A
ny d
eliv
ery
poin
t on
syst
em
E
stim
ated
Rat
es: S
ervi
ce is
offe
red
unde
r the
follo
win
g to
ll sc
hedu
les
(15
year
term
):
Thro
ugh
Dec
embe
r 31,
201
4 –
Cur
rent
tolls
will
rem
ain
in e
ffect
(“R
H-0
03-2
011
Com
plia
nce
Tolls
”)
Ja
nuar
y 1,
201
5 to
Dec
embe
r 31,
202
0 –
Tolls
to b
e fix
ed, o
ne ti
me
rese
t, an
d br
idgi
ng c
ontri
butio
n ch
arge
Ja
nuar
y 1,
202
1 to
Dec
embe
r 31,
203
0 –
Cos
t of s
ervi
ce fo
r TC
PL
segm
ents
util
ized
A
ntic
ipat
ed In
-Ser
vice
Dat
e: N
ovem
ber 2
016
R
egul
ator
y S
tatu
s:
Bin
ding
ope
n se
ason
from
Nov
embe
r 29,
201
3 to
Jan
uary
15,
201
4
O
pen
Sea
son
is p
rem
ised
on
NE
B a
ppro
val o
f the
Mai
nlin
e S
ettle
men
t Agr
eem
ent d
ated
Oct
ober
31,
20
13, a
s am
ende
d on
Nov
embe
r 15,
201
3 an
d D
ecem
ber 1
3, 2
013
amon
g U
nion
Gas
Lim
ited,
E
nbrid
ge G
as D
istri
butio
n In
c., G
az M
etro
Lim
ited
Par
tner
ship
and
TC
PL,
and
impl
emen
tatio
n by
TC
PL
of ta
riff c
hang
es, i
nclu
ding
TC
PL’
s Tr
ansp
orta
tion
Acc
ess
Pro
cedu
res,
nec
essa
ry to
giv
e ef
fect
to th
e M
ainl
ine
Set
tlem
ent A
gree
men
t as
appr
oved
Sou
rce:
Bas
ed o
n S
usse
x re
view
and
ana
lysi
s of
pub
lic d
ocum
ents
39
Docket No. IR 15-124 Comments of Eversource Energy
Attachment 13 Page 40 of 65
000375

4. P
NG
TS –
C2C
Exp
ansi
on P
roje
ct
O
wne
r: P
ortla
nd N
atur
al G
as T
rans
mis
sion
Sys
tem
P
ropo
sed
Faci
litie
s:
Rec
eipt
poi
nt: P
ittsb
urg,
NH
D
eliv
ery
poin
t: W
estb
rook
, ME
N
o in
crem
enta
l cap
acity
to D
racu
t, M
A
C
apac
ity: 1
20,0
00 –
150,
000
Dth
/day
E
stim
ated
Rat
es: $
0.60
/Dth
A
ntic
ipat
ed In
-Ser
vice
Dat
e: N
ovem
ber 2
016
R
egul
ator
y S
tatu
s:
Bin
ding
ope
n se
ason
from
Dec
embe
r 3, 2
013
to J
anua
ry 2
4, 2
014
U
pstre
am/D
owns
tream
Issu
es:
B
idde
rs w
ill be
resp
onsi
ble
for m
akin
g th
eir o
wn
upst
ream
arra
ngem
ents
eith
er d
irect
ly w
ith T
CP
L/TQ
M,
or th
roug
h co
ntra
ctua
l arra
ngem
ents
with
oth
er u
pstre
am s
hipp
ers
to E
ast H
eref
ord
(Pitt
sbur
g)
M
inim
um te
rm o
f 15
year
s
Sou
rce:
Bas
ed o
n S
usse
x re
view
and
ana
lysi
s of
pub
lic d
ocum
ents
40
Docket No. IR 15-124 Comments of Eversource Energy
Attachment 13 Page 41 of 65
000376

Con
tent
s
1.In
trodu
ctio
n
2.E
xecu
tive
Sum
mar
y
3.N
atur
al G
as M
arke
t Ove
rvie
w
4.N
atur
al G
as P
ipel
ine
Cap
acity
Opt
ions
5.C
ost /
Ben
efit
Ana
lysi
s
Ana
lysi
s O
verv
iew
B
enef
its E
stim
atio
n
Est
imat
ed C
ost R
ange
C
ost /
Ben
efit
Com
paris
on
6.S
umm
ary
and
Con
clus
ions
41
Docket No. IR 15-124 Comments of Eversource Energy
Attachment 13 Page 42 of 65
000377

5. C
ost
/ Ben
efit
Ana
lysi
s: O
verv
iew
S
usse
x re
view
ed th
e be
nefit
of n
ew p
ipel
ine
capa
city
into
New
Eng
land
rela
tive
to th
e as
soci
ated
cos
t of s
uch
capa
city
In
crem
enta
l pip
elin
e ca
paci
ty in
to th
e N
ew E
ngla
nd re
gion
wou
ld p
lace
do
wnw
ard
pres
sure
on
the
regi
onal
nat
ural
gas
pric
e in
dice
s an
d, th
eref
ore,
be
nefit
cus
tom
ers
who
use
thos
e pr
ice
sign
als
in tr
ansa
ctio
ns
Giv
en th
at th
e po
wer
gen
erat
ion
segm
ent i
s m
ost l
ikel
y th
e la
rges
t con
sum
er o
f na
tura
l gas
pur
chas
ed a
t the
New
Eng
land
nat
ural
gas
pric
e in
dex,
this
seg
men
t w
as th
e fo
cus
of th
e an
alys
is
Bas
ed o
n th
e hi
stor
ical
rela
tions
hip
betw
een
natu
ral g
as p
rices
and
ele
ctric
ity
LMP
s in
ISO
-NE
, Sus
sex
calc
ulat
ed th
e po
tent
ial r
educ
tion
in L
MP
s as
a re
sult
of a
redu
ctio
n in
who
lesa
le n
atur
al g
as p
rices
to e
stim
ate
the
pote
ntia
l ene
rgy
cost
sav
ings
to e
lect
ricity
cus
tom
ers
usin
g ac
tual
dat
a fo
r the
201
2/20
13 s
plit-
year
Th
e be
nefit
(i.e
., re
duce
d na
tura
l gas
cos
ts) a
ssoc
iate
d w
ith a
ny in
crem
enta
l pi
pelin
e ex
pans
ion
was
com
pare
d to
var
ious
cos
t est
imat
es (i
.e.,
cost
of
pipe
line
capa
city
)
42
Docket No. IR 15-124 Comments of Eversource Energy
Attachment 13 Page 43 of 65
000378

5. B
enef
its E
stim
atio
n: O
verv
iew
Th
e fir
st s
tep
in th
e an
alys
is (i
.e.,
the
bene
fits
of in
crem
enta
l pip
elin
e ca
paci
ty
into
the
New
Eng
land
regi
on) c
onsi
sted
of:
N
atur
al G
as B
asis
/ C
apac
ity U
tiliz
atio
n A
naly
sis:
An
estim
ate
of th
e po
tent
ial r
educ
tion
in th
e N
ew E
ngla
nd n
atur
al g
as b
asis
diff
eren
tials
sho
uld
new
infra
stru
ctur
e be
de
velo
ped
R
educ
tion
in N
atur
al G
as P
rices
: The
ass
umed
New
Eng
land
nat
ural
gas
bas
is re
duct
ion
was
use
d to
est
imat
e th
e re
duct
ion
in th
e N
ew E
ngla
nd w
hole
sale
pric
e of
nat
ural
gas
R
educ
tion
in L
MP
s: T
he re
sulti
ng e
stim
ated
New
Eng
land
nat
ural
gas
who
lesa
le p
rice
redu
ctio
n w
ould
like
ly re
sult
in lo
wer
LM
Ps
in th
e IS
O-N
E p
ower
mar
ket,
whi
ch w
ould
be
nefit
ele
ctric
ity c
usto
mer
s in
the
regi
on, i
nclu
ding
cus
tom
ers
in M
aine
•S
ince
nat
ural
gas
-fire
d ge
nera
tion
is s
ettin
g th
e IS
O-N
E L
MP
s fo
r the
maj
ority
of t
he h
ours
, thi
s re
duct
ion
in L
MP
s w
ould
pro
vide
a b
enef
it to
ele
ctric
ity c
usto
mer
s
•P
leas
e no
te, t
he h
ours
whe
n na
tura
l gas
fuel
ed g
ener
atio
n se
t the
LM
P w
as b
ased
on
info
rmat
ion
avai
labl
e fro
m IS
O-N
E a
nd c
erta
in d
ispa
tch
orde
r ass
umpt
ions
43
Docket No. IR 15-124 Comments of Eversource Energy
Attachment 13 Page 44 of 65
000379

5. B
enef
its E
stim
atio
n: N
atur
al G
as B
asis
/ C
apac
ity U
tiliz
atio
n A
naly
sis
In
ord
er to
est
imat
e th
e po
tent
ial r
educ
tion
in th
e N
ew E
ngla
nd n
atur
al g
as
basi
s di
ffere
ntia
ls a
s a
resu
lt of
incr
emen
tal p
ipel
ine
capa
city
into
the
regi
on,
Sus
sex
anal
yzed
the
hist
oric
al d
aily
New
Eng
land
nat
ural
gas
bas
is d
iffer
entia
ls
and
pipe
line
capa
city
util
izat
ion
from
Jan
uary
1, 2
011
to D
ecem
ber 1
7, 2
013,
sp
ecifi
cally
:
Sus
sex
calc
ulat
ed th
e hi
stor
ical
dai
ly n
atur
al g
as b
asis
diff
eren
tials
bet
wee
n th
e N
ew
Eng
land
nat
ural
gas
pric
e in
dex,
as
repr
esen
ted
by A
LGC
G, a
nd H
enry
Hub
•A
naly
sis
excl
uded
wee
kend
s, h
olid
ays,
and
day
s w
hen
the
ALG
CG
to H
enry
Hub
bas
is d
iffer
entia
l w
as z
ero
or n
egat
ive
Fo
r eac
h an
alys
is d
ay, S
usse
x re
view
ed th
e pi
pelin
e flo
ws
on A
GT
and
estim
ated
the
AG
T w
est-t
o-ea
st fl
ows
(i.e.
, AG
T W
est-e
nd U
tiliz
atio
n)
Ple
ase
note
, the
ana
lysi
s of
AG
T ca
paci
ty u
tiliz
atio
n is
ass
umed
to b
e a
prox
y fo
r the
cu
rren
t New
Eng
land
pip
elin
e ca
paci
ty u
tiliz
atio
n fro
m th
e S
outh
and
Wes
t (i.e
., A
GT
and
TGP)
Not
e: A
ll na
tura
l gas
pric
ing
and
pipe
line
flow
s da
ta fr
om S
NL
Fina
ncia
l44
Docket No. IR 15-124 Comments of Eversource Energy
Attachment 13 Page 45 of 65
000380

5. B
enef
its E
stim
atio
n: N
atur
al G
as B
asis
/ C
apac
ity U
tiliz
atio
n A
naly
sis
(con
t.)
A
s th
e A
GT
Wes
t-end
Util
izat
ion
reac
hes
80%
or h
ighe
r, th
e ch
ance
s of
si
gnifi
cant
bas
is p
rem
ium
s gr
eatly
incr
ease
s
Sou
rce:
His
toric
al p
rices
thro
ugh
Dec
embe
r 17,
201
3 fro
m S
NL
Fina
ncia
l45
Docket No. IR 15-124 Comments of Eversource Energy
Attachment 13 Page 46 of 65
000381
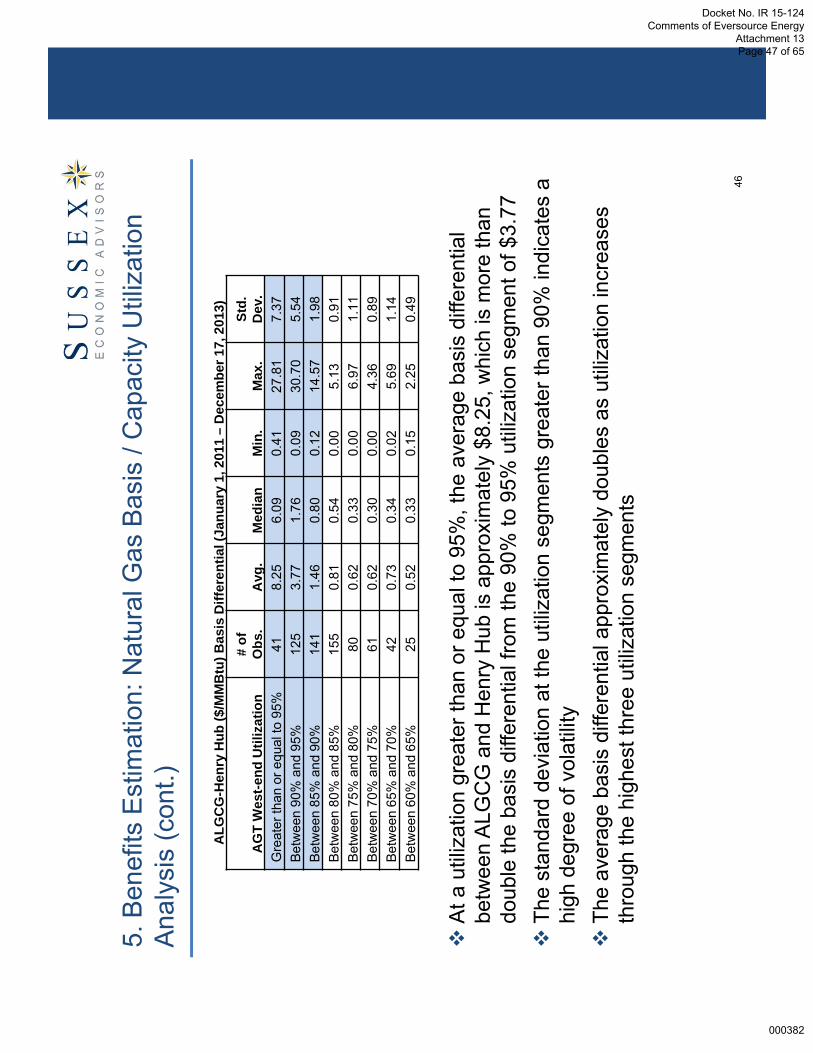
5. B
enef
its E
stim
atio
n: N
atur
al G
as B
asis
/ C
apac
ity U
tiliz
atio
n A
naly
sis
(con
t.)
A
t a u
tiliz
atio
n gr
eate
r tha
n or
equ
al to
95%
, the
ave
rage
bas
is d
iffer
entia
l be
twee
n A
LGC
G a
nd H
enry
Hub
is a
ppro
xim
atel
y $8
.25,
whi
ch is
mor
e th
an
doub
le th
e ba
sis
diffe
rent
ial f
rom
the
90%
to 9
5% u
tiliz
atio
n se
gmen
t of $
3.77
Th
e st
anda
rd d
evia
tion
at th
e ut
ilizat
ion
segm
ents
gre
ater
than
90%
indi
cate
s a
high
deg
ree
of v
olat
ility
Th
e av
erag
e ba
sis
diffe
rent
ial a
ppro
xim
atel
y do
uble
s as
util
izat
ion
incr
ease
s th
roug
h th
e hi
ghes
t thr
ee u
tiliz
atio
n se
gmen
ts
ALG
CG
-Hen
ry H
ub ($
/MM
Btu
) Bas
is D
iffer
entia
l (Ja
nuar
y 1,
2011
–D
ecem
ber 1
7, 2
013)
AG
T W
est-e
nd U
tiliz
atio
n#
of
Obs
.A
vg.
Med
ian
Min
.M
ax.
Std.
D
ev.
Gre
ater
than
or e
qual
to 9
5%41
8.25
6.09
0.41
27.8
17.
37Be
twee
n 90
% a
nd 9
5%12
53.
771.
760.
0930
.70
5.54
Betw
een
85%
and
90%
141
1.46
0.80
0.12
14.5
71.
98Be
twee
n 80
% a
nd 8
5%15
50.
810.
540.
005.
130.
91B
etw
een
75%
and
80%
800.
620.
330.
006.
971.
11Be
twee
n 70
% a
nd 7
5%61
0.62
0.30
0.00
4.36
0.89
Betw
een
65%
and
70%
420.
730.
340.
025.
691.
14Be
twee
n 60
% a
nd 6
5%25
0.52
0.33
0.15
2.25
0.49
46
Docket No. IR 15-124 Comments of Eversource Energy
Attachment 13 Page 47 of 65
000382

5. B
enef
its E
stim
atio
n: R
educ
tion
in N
atur
al G
as P
rices
To
est
imat
e th
e ef
fect
of i
ncre
men
tal p
ipel
ine
capa
city
on
New
Eng
land
w
hole
sale
nat
ural
gas
pric
es, S
usse
x re
view
ed a
rang
e of
bas
is d
iffer
entia
l re
duct
ions
bas
ed o
n th
e re
sults
of t
he N
atur
al G
as B
asis
/ C
apac
ity U
tiliz
atio
n A
naly
sis
disc
usse
d ab
ove,
as
wel
l as
a re
view
of t
he fo
llow
ing
case
stu
dies
:
Forw
ard
natu
ral g
as b
asis
diff
eren
tials
for t
he N
ew E
ngla
nd re
gion
Fo
rwar
d na
tura
l gas
bas
is d
iffer
entia
ls fo
r the
New
Yor
k C
ity re
gion
47
Docket No. IR 15-124 Comments of Eversource Energy
Attachment 13 Page 48 of 65
000383

5. B
enef
its E
stim
atio
n: A
LGC
G F
orw
ard
Pric
es
Th
e S
pect
ra E
nerg
y A
IM a
nd T
GP
Con
nect
icut
Exp
ansi
on p
roje
cts
are
expe
cted
to c
ome
on-li
ne o
n N
ovem
ber 1
, 201
6
Pro
vide
s in
crem
enta
l cap
acity
of 3
42,0
00 D
th/d
ay (S
pect
ra E
nerg
y) a
nd 7
2,10
0 D
th/d
ay (T
GP
) to
serv
e th
e N
ew E
ngla
nd L
DC
s
S
pect
ra A
IM S
hipp
ers:
10
LDC
s in
MA
, RI a
nd C
T (i.
e., N
STA
R G
as, C
olon
ial G
as, B
osto
n G
as,
Col
umbi
a G
as o
f Mas
sach
uset
ts, M
iddl
ebor
ough
Gas
& E
lect
ric, T
he N
arra
gans
ett E
lect
ric C
ompa
ny,
Nor
wic
h P
ublic
Util
ities
, Yan
kee
Gas
, Con
nect
icut
Nat
ural
Gas
, and
Sou
ther
n C
onne
ctic
ut G
as);
and
TGP
Con
nect
icut
Exp
ansi
on s
hipp
ers:
Con
nect
icut
Nat
ural
Gas
and
Yan
kee
Gas
S
ince
the
capa
city
ass
ocia
ted
with
the
Spe
ctra
Ene
rgy
AIM
and
TG
P C
onne
ctic
ut E
xpan
sion
pro
ject
s ar
e su
ppor
ted
by n
atur
al g
as u
tiliti
es (i
.e.,
LDC
fore
cast
ed g
row
th w
ill re
quire
the
AIM
and
Con
nect
icut
E
xpan
sion
cap
acity
), th
e av
aila
bilit
y of
the
AIM
and
Con
nect
icut
Exp
ansi
on c
apac
ity fo
r use
by
othe
r m
arke
t seg
men
ts (e
.g.,
pow
er g
ener
atio
n) w
ill lik
ely
decr
ease
ove
r tim
e
A
s sh
own
in th
e ta
ble
belo
w, th
e A
LGC
G to
Hen
ry H
ub fo
rwar
d ba
sis
for 2
016/
2017
is
appr
oxim
atel
y 30
% to
32%
low
er th
an th
e fo
rwar
d ba
sis
for 2
014/
2015
. W
hile
ther
e m
ay b
e se
vera
l mar
ket a
nd c
omm
erci
al is
sues
ass
ocia
ted
with
this
redu
ctio
n in
forw
ard
pric
es, t
he
expe
cted
incr
emen
tal c
apac
ity a
ssoc
iate
d w
ith th
e S
pect
ra E
nerg
y A
IM a
nd T
GP
Con
nect
icut
Exp
ansi
on p
roje
cts
in 2
016/
2017
are
like
ly k
ey c
ontri
buto
rs to
this
bas
is
redu
ctio
nSp
lit-Y
ear
(Nov
-Oct
)
Forw
ard
ALG
CG
-Hen
ry H
ub B
asis
($/M
MB
tu)
Nov
embe
rD
ecem
ber
Janu
ary
Nov
embe
r to
Ja
nuar
y20
14/2
015
3.68
8.16
12.0
67.
97
2015
/201
63.
447.
5211
.34
7.43
2016
/201
72.
555.
528.
195.
42
Perc
ent C
hang
e 20
14/2
015
to 2
016/
2017
(30.
7%)
(32.
4%)
(32.
1%)
(32.
0%)
Sou
rce:
For
war
d se
ttlem
ent p
rices
as
of J
anua
ry 2
, 201
4 fro
m B
loom
berg
Pro
fess
iona
l48
Docket No. IR 15-124 Comments of Eversource Energy
Attachment 13 Page 49 of 65
000384

5. B
enef
its E
stim
atio
n: N
YC
Cas
e S
tudy
Th
e S
pect
ra E
nerg
y N
J-N
Y E
xpan
sion
and
Tra
nsco
Nor
thea
st S
uppl
y Li
nk[1
]pr
ojec
ts w
ere
plac
ed in
ser
vice
on
Nov
embe
r 1, 2
013:
P
rovi
ded
incr
emen
tal c
apac
ity o
f 800
,000
Dth
/day
(Spe
ctra
Ene
rgy)
and
250
,000
Dth
/day
(Tra
nsco
) to
serv
e th
e N
ew J
erse
y an
d N
ew Y
ork
City
met
ropo
litan
are
as
A
s sh
own
in th
e ta
ble
belo
w, w
hich
refle
cts
the
mar
ket e
xpec
tatio
ns b
efor
e th
is w
inte
r, th
e Tr
ansc
o Zo
ne 6
New
Yor
k (“
TRZ6
NY
”) to
Hen
ry H
ub fo
rwar
d w
inte
r 201
3/20
14 b
asis
of
$0.6
8/M
MB
tu is
an
appr
oxim
atel
y 64
% re
duct
ion
from
the
hist
oric
al w
inte
r 200
8/20
09 to
20
12/2
013
aver
age
of $
1.88
/MM
Btu
and
a 7
8% re
duct
ion
from
the
2012
/201
3 w
inte
r bas
is
of $
3.04
/MM
Btu
W
hile
ther
e m
ay b
e se
vera
l mar
ket a
nd c
omm
erci
al is
sues
ass
ocia
ted
with
this
redu
ctio
n in
fo
rwar
d pr
ices
, the
incr
emen
tal p
ipel
ine
capa
city
ass
ocia
ted
with
the
Spe
ctra
Ene
rgy
NJ-
NY
Exp
ansi
on a
nd T
rans
co N
orth
east
Sup
ply
Link
pro
ject
s w
ere
likel
y ke
y co
ntrib
utor
s to
this
pr
ice
redu
ctio
n
Split
-Yea
r (N
ov-O
ct)
TRZ6
NY-
Hen
ry H
ub B
asis
($/M
MB
tu)
Win
ter
(Nov
-Mar
)Su
mm
er
(Apr
-Oct
)An
nual
(N
ov-O
ct)
2008
/200
91.
810.
380.
9720
09/2
010
1.22
0.35
0.71
2010
/201
12.
750.
491.
4320
11/2
012
0.59
0.19
0.36
2012
/201
33.
040.
201.
37H
isto
rical
Ave
rage
(2
008/
2009
-201
2/20
13)
1.88
0.32
0.97
2013
/201
40.
68(0
.52)
(0.0
2)20
14/2
015
0.42
(0.5
3)(0
.13)
2015
/201
60.
39(0
.45)
(0.1
0)Fo
rwar
d A
vera
ge
(201
3/20
14-2
015/
2016
)0.
50(0
.50)
(0.0
9)
Not
e: [1
] Hal
f of t
he T
rans
co N
orth
east
Sup
ply
Link
cap
acity
was
pla
ced
in s
ervi
ce in
Aug
ust 2
013,
with
the
rem
aind
er p
lace
d in
ser
vice
on
Nov
embe
r 1, 2
013
Sou
rce:
His
toric
al p
rices
from
SN
L Fi
nanc
ial;
and
forw
ard
settl
emen
t pric
es a
s of
Oct
ober
31,
201
3 fro
m B
loom
berg
Pro
fess
iona
l49
Docket No. IR 15-124 Comments of Eversource Energy
Attachment 13 Page 50 of 65
000385
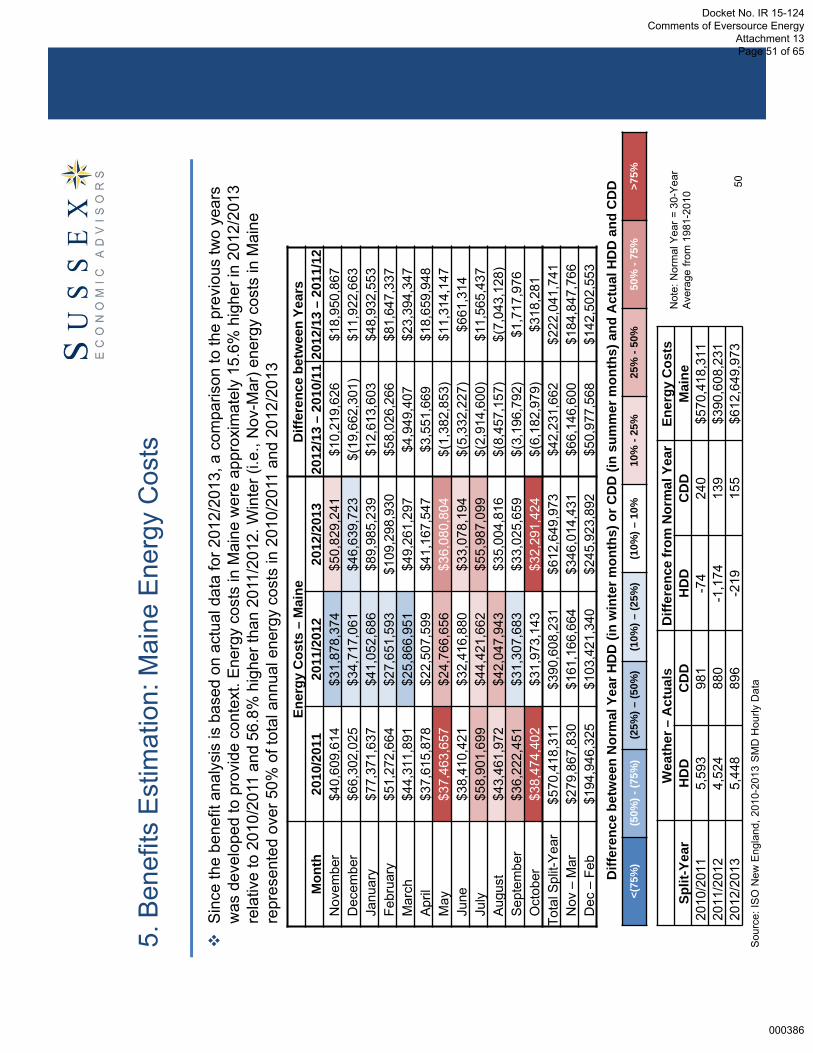
5. B
enef
its E
stim
atio
n: M
aine
Ene
rgy
Cos
ts
S
ince
the
bene
fit a
naly
sis
is b
ased
on
actu
al d
ata
for 2
012/
2013
, a c
ompa
rison
to th
e pr
evio
us tw
o ye
ars
was
dev
elop
ed to
pro
vide
con
text
. Ene
rgy
cost
s in
Mai
ne w
ere
appr
oxim
atel
y 15
.6%
hig
her i
n 20
12/2
013
rela
tive
to 2
010/
2011
and
56.
8% h
ighe
r tha
n 20
11/2
012.
Win
ter (
i.e.,
Nov
-Mar
) ene
rgy
cost
s in
Mai
ne
repr
esen
ted
over
50%
of t
otal
ann
ual e
nerg
y co
sts
in 2
010/
2011
and
201
2/20
13En
ergy
Cos
ts –
Mai
neD
iffer
ence
bet
wee
n Ye
ars
Mon
th20
10/2
011
2011
/201
220
12/2
013
2012
/13
–20
10/1
120
12/1
3 –
2011
/12
Nov
embe
r$4
0,60
9,61
4$3
1,87
8,37
4$5
0,82
9,24
1$1
0,21
9,62
6$1
8,95
0,86
7D
ecem
ber
$66,
302,
025
$34,
717,
061
$46,
639,
723
$(19
,662
,301
)$1
1,92
2,66
3Ja
nuar
y$7
7,37
1,63
7$4
1,05
2,68
6$8
9,98
5,23
9$1
2,61
3,60
3$4
8,93
2,55
3Fe
brua
ry$5
1,27
2,66
4$2
7,65
1,59
3$1
09,2
98,9
30$5
8,02
6,26
6$8
1,64
7,33
7M
arch
$44,
311,
891
$25,
866,
951
$49,
261,
297
$4,9
49,4
07$2
3,39
4,34
7Ap
ril$3
7,61
5,87
8$2
2,50
7,59
9 $4
1,16
7,54
7$3
,551
,669
$18,
659,
948
May
$37,
463,
657
$24,
766,
656
$36,
080,
804
$(1,
382,
853)
$11,
314,
147
June
$38,
410,
421
$32,
416,
880
$33,
078,
194
$(5,
332,
227)
$661
,314
July
$58,
901,
699
$44,
421,
662
$55,
987,
099
$(2,
914,
600)
$11,
565,
437
Augu
st$4
3,46
1,97
2$4
2,04
7,94
3$3
5,00
4,81
6$(
8,45
7,15
7)$(
7,04
3,12
8)Se
ptem
ber
$36,
222,
451
$31,
307,
683
$33,
025,
659
$(3,
196,
792)
$1,7
17,9
76O
ctob
er$3
8,47
4,40
2$3
1,97
3,14
3$3
2,29
1,42
4$(
6,18
2,97
9)$3
18,2
81To
tal S
plit-
Year
$570
,418
,311
$390
,608
,231
$612
,649
,973
$42,
231,
662
$222
,041
,741
Nov
–M
ar$2
79,8
67,8
30$1
61,1
66,6
64$3
46,0
14,4
31$6
6,14
6,60
0$1
84,8
47,7
66D
ec –
Feb
$194
,946
,325
$103
,421
,340
$245
,923
,892
$50,
977,
568
$142
,502
,553
<(75
%)
(50%
) -(7
5%)
(25%
) –(5
0%)
(10%
)–(2
5%)
(10%
) –10
%10
% -
25%
25%
-50
%50
% -
75%
>75%
Diff
eren
ce b
etw
een
Nor
mal
Yea
r HD
D (i
n w
inte
r mon
ths)
or C
DD
(in
sum
mer
mon
ths)
and
Act
ual H
DD
and
CD
D
Wea
ther
–A
ctua
lsD
iffer
ence
from
Nor
mal
Yea
rEn
ergy
Cos
tsSp
lit-Y
ear
HD
DC
DD
HD
DC
DD
Mai
ne20
10/2
011
5,59
398
1-7
424
0$5
70,4
18,3
1120
11/2
012
4,52
488
0-1
,174
139
$390
,608
,231
2012
/201
35,
448
896
-219
155
$612
,649
,973
Not
e: N
orm
al Y
ear =
30-
Year
A
vera
ge fr
om 1
981-
2010
Sou
rce:
ISO
New
Eng
land
, 201
0-20
13 S
MD
Hou
rly D
ata
50
Docket No. IR 15-124 Comments of Eversource Energy
Attachment 13 Page 51 of 65
000386

5. B
enef
its E
stim
atio
n: IS
O-N
E E
nerg
y C
osts
S
imila
r to
the
Mai
ne m
arke
t, a
revi
ew o
f the
last
thre
e ye
ars
of IS
O-N
E e
nerg
y co
sts
was
dev
elop
ed fo
r co
ntex
t. E
nerg
y co
sts
in IS
O-N
E w
ere
appr
oxim
atel
y 15
.9%
hig
her i
n 20
12/2
013
rela
tive
to 2
010/
2011
and
59
.5%
hig
her t
han
2011
/201
2. W
inte
r (i.e
., N
ov-M
ar) e
nerg
y co
sts
in IS
O-N
E re
pres
ente
d ap
prox
imat
ely
50%
of a
nnua
l ene
rgy
cost
s in
201
0/20
11 a
nd 2
012/
2013
Ener
gy C
osts
–IS
O-N
ED
iffer
ence
bet
wee
n Ye
ars
Mon
th20
10/2
011
2011
/201
220
12/2
013
2012
/13
–20
10/1
120
12/1
3 –
2011
/12
Nov
embe
r$4
47,6
42,3
70
$361
,138
,517
$5
66,7
47,9
47
$119
,105
,577
$2
05,6
09,4
30
Dec
embe
r$7
70,2
61,6
50
$395
,102
,819
$5
15,4
45,6
46
$(25
4,81
6,00
4)$1
20,3
42,8
27
Janu
ary
$852
,384
,171
$4
64,6
24,5
30
$1,0
37,7
86,7
16
$185
,402
,545
$5
73,1
62,1
86
Febr
uary
$581
,344
,475
$3
12,7
78,1
90
$1,2
72,8
47,8
70
$691
,503
,395
$9
60,0
69,6
79
Mar
ch$4
92,6
23,8
49
$267
,773
,347
$5
67,6
05,0
26
$74,
981,
177
$299
,831
,679
Ap
ril$4
17,2
54,0
84
$243
,522
,969
$4
06,5
28,2
40
$(10
,725
,844
)$1
63,0
05,2
72
May
$428
,755
,135
$2
65,3
68,0
61
$406
,414
,752
$(
22,3
40,3
83)
$141
,046
,691
Ju
ne$4
91,2
82,0
92
$421
,659
,561
$4
21,7
26,4
19
$(69
,555
,673
)$6
6,85
8 Ju
ly$7
71,9
46,2
93
$569
,821
,544
$7
73,1
14,4
88
$1,1
68,1
95
$203
,292
,944
Au
gust
$537
,252
,420
$5
15,2
17,6
93
$414
,658
,718
$(
122,
593,
702)
$(10
0,55
8,97
6)Se
ptem
ber
$441
,427
,969
$3
28,3
96,6
60
$441
,204
,360
$(
223,
609)
$112
,807
,701
O
ctob
er$4
13,9
89,8
64
$348
,054
,634
$3
40,8
02,7
81
$(73
,187
,083
)$(
7,25
1,85
3)To
tal
$6,6
46,1
64,3
72
$4,4
93,4
58,5
26
$7,1
64,8
82,9
63
$518
,718
,591
$2
,671
,424
,438
N
ov –
Mar
$3,1
44,2
56,5
15
$1,8
01,4
17,4
03
$3,9
60,4
33,2
05
$816
,176
,690
$2
,159
,015
,802
D
ec –
Feb
$2,2
03,9
90,2
95
$1,1
72,5
05,5
39
$2,8
26,0
80,2
31
$622
,089
,936
$1
,653
,574
,692
<(75
%)
(50%
) -(7
5%)
(25%
) –(5
0%)
(10%
)–(2
5%)
(10%
) –10
%10
% -
25%
25%
-50
%50
% -
75%
>75%
Wea
ther
–A
ctua
lsD
iffer
ence
from
Nor
mal
Yea
rEn
ergy
Cos
tsSp
lit-Y
ear
HD
DC
DD
HD
DC
DD
ISO
-NE
2010
/201
15,
593
981
-74
240
$6,6
46,1
64,3
7220
11/2
012
4,52
488
0-1
,174
139
$4,4
93,4
58,5
2620
12/2
013
5,44
889
6-2
1915
5$7
,164
,882
,963
Diff
eren
ce b
etw
een
Nor
mal
Yea
r HD
D (i
n w
inte
r mon
ths)
or C
DD
(in
sum
mer
mon
ths)
and
Act
ual H
DD
and
CD
D
Not
e: N
orm
al Y
ear =
30-
Year
A
vera
ge fr
om 1
981-
2010
Sou
rce:
ISO
New
Eng
land
, 201
0-20
13 S
MD
Hou
rly D
ata
51
Docket No. IR 15-124 Comments of Eversource Energy
Attachment 13 Page 52 of 65
000387

5. B
enef
its E
stim
atio
n: R
educ
tion
in L
MP
s
Fo
r the
201
2/20
13 s
plit-
year
, Sus
sex
estim
ated
the
pote
ntia
l pro
form
a be
nefit
s to
ele
ctric
ity c
usto
mer
s as
soci
ated
with
a re
duct
ion
in L
MP
for h
ours
whe
n na
tura
l gas
-fire
d ge
nera
tion
was
the
mar
gina
l fue
l [1]
Fi
rst,
Sus
sex
estim
ated
the
num
ber o
f hou
rs th
e LM
P in
New
Eng
land
was
set
by
natu
ral
gas-
fired
gen
erat
ors
usin
g w
eekl
y m
argi
nal f
uel t
ype
data
from
ISO
-NE
•A
ssum
ed m
argi
nal f
uel t
ype
data
for I
SO
-NE
as
a w
hole
was
repr
esen
tativ
e of
the
mar
gina
l fue
l for
th
e in
divi
dual
zon
es (e
.g.,
Mai
ne)
•C
onve
rted
the
repo
rted
wee
kly
perc
enta
ges
by fu
el ty
pe to
num
ber o
f hou
rs in
eac
h w
eek
•A
ssum
ed IS
O-N
E fo
llow
ed a
dis
patc
h cu
rve
whe
re o
il-fir
ed g
ener
atio
n se
t the
LM
P fo
r the
hou
rs in
th
e w
eek
with
the
high
est e
lect
ricity
dem
and,
follo
wed
by
natu
ral g
as-fi
red
gene
ratio
n
•U
sing
this
app
roac
h, S
usse
x as
sign
ed a
mar
gina
l fue
l typ
e fo
r eac
h ho
ur o
f eac
h da
y in
spl
it-ye
ar
2012
/201
3
Not
e: [1
] Ple
ase
note
that
the
anal
ysis
is b
ased
on
hist
oric
al d
ata;
resu
lts re
pres
ent t
he p
ro fo
rma
effe
ct re
duct
ion
in b
asis
diff
eren
tials
and
LM
Ps
Sou
rce:
ISO
New
Eng
land
, Wee
kly
Mar
ket R
epor
t Dat
a fo
r the
Wee
k E
ndin
g D
ecem
ber 8
, 201
352
Docket No. IR 15-124 Comments of Eversource Energy
Attachment 13 Page 53 of 65
000388

5. B
enef
its E
stim
atio
n: R
educ
tion
in L
MP
s (c
ont.)
N
ext,
Sus
sex
estim
ated
the
redu
ctio
n in
the
New
Eng
land
who
lesa
le p
rice
of n
atur
al g
as
(as
repr
esen
ted
by th
e A
LGC
G p
rice
inde
x) a
ssoc
iate
d w
ith a
redu
ctio
n in
the
New
E
ngla
nd n
atur
al g
as p
rice
prem
ium
(i.e
., ba
sis
diffe
rent
ial)
•B
ased
on
the
resu
lts o
f the
Nat
ural
Gas
Bas
is /
Cap
acity
Util
izat
ion
Ana
lysi
s, a
nd a
revi
ew o
f the
A
LGC
G fo
rwar
d pr
ices
and
NY
C C
ase
Stu
dy, S
usse
x an
alyz
ed a
rang
e of
bas
is d
iffer
entia
l re
duct
ions
from
25%
to 7
5%
•Th
e da
ily n
atur
al g
as p
rice
redu
ctio
n w
as e
stim
ated
bas
ed o
n th
e es
timat
ed N
ew E
ngla
nd b
asis
re
duct
ion
rang
e of
25%
to 7
5%.
For e
xam
ple,
if th
e N
ew E
ngla
nd b
asis
diff
eren
tial w
as re
duce
d by
50
% fr
om $
2/M
MB
tu to
$1/
MM
Btu
, the
n th
e N
ew E
ngla
nd n
atur
al g
as p
rice
(as
repr
esen
ted
by th
e A
LGC
G p
rice
inde
x) w
ould
be
redu
ced
from
$4/
MM
Btu
(for
exa
mpl
e) to
$3/
MM
Btu
, whi
ch is
equ
al to
a
natu
ral g
as p
rice
redu
ctio
n of
25%
•B
ased
on
the
Nat
ural
Gas
Bas
is /
Cap
acity
Util
izat
ion
Ana
lysi
s, S
usse
x as
sum
ed th
at a
redu
ctio
n in
na
tura
l gas
pric
es o
ccur
red
only
whe
n A
GT
Wes
t-end
Util
izat
ion
was
gre
ater
than
80%
and
the
New
E
ngla
nd b
asis
diff
eren
tial w
as g
reat
er th
an $
0.25
/MM
Btu
A
t AG
T W
est-e
nd U
tiliz
atio
n le
vels
bel
ow 8
0% a
nd b
asis
diff
eren
tials
low
er th
an $
0.25
/MM
Btu
, th
ere
was
a m
inim
al e
ffect
on
the
tota
l ene
rgy
cost
sav
ings
S
usse
x as
sum
ed th
at th
e re
duct
ion
in L
MP
wou
ld b
e eq
ual t
o th
e ca
lcul
ated
redu
ctio
n in
th
e N
ew E
ngla
nd n
atur
al g
as w
hole
sale
pric
e
For e
ach
hour
that
nat
ural
gas
was
the
mar
gina
l fue
l, S
usse
x es
timat
ed th
e en
ergy
cos
t sa
ving
s fo
r tha
t hou
r by
mul
tiply
ing
the
redu
ctio
n in
LM
P by
the
hour
ly d
eman
d
The
annu
al e
nerg
y co
st s
avin
gs to
ele
ctric
ity c
usto
mer
s w
as th
e su
m o
f the
ene
rgy
cost
sa
ving
s ov
er a
ll ho
urs
that
nat
ural
gas
-fire
d ge
nera
tion
was
set
ting
the
mar
gina
l pric
e of
el
ectri
city
for t
he s
plit-
year
201
2/20
13S
ourc
es: S
NL
Fina
ncia
l; an
d IS
O N
ew E
ngla
nd, 2
012-
2013
SM
D H
ourly
Dat
a53
Docket No. IR 15-124 Comments of Eversource Energy
Attachment 13 Page 54 of 65
000389
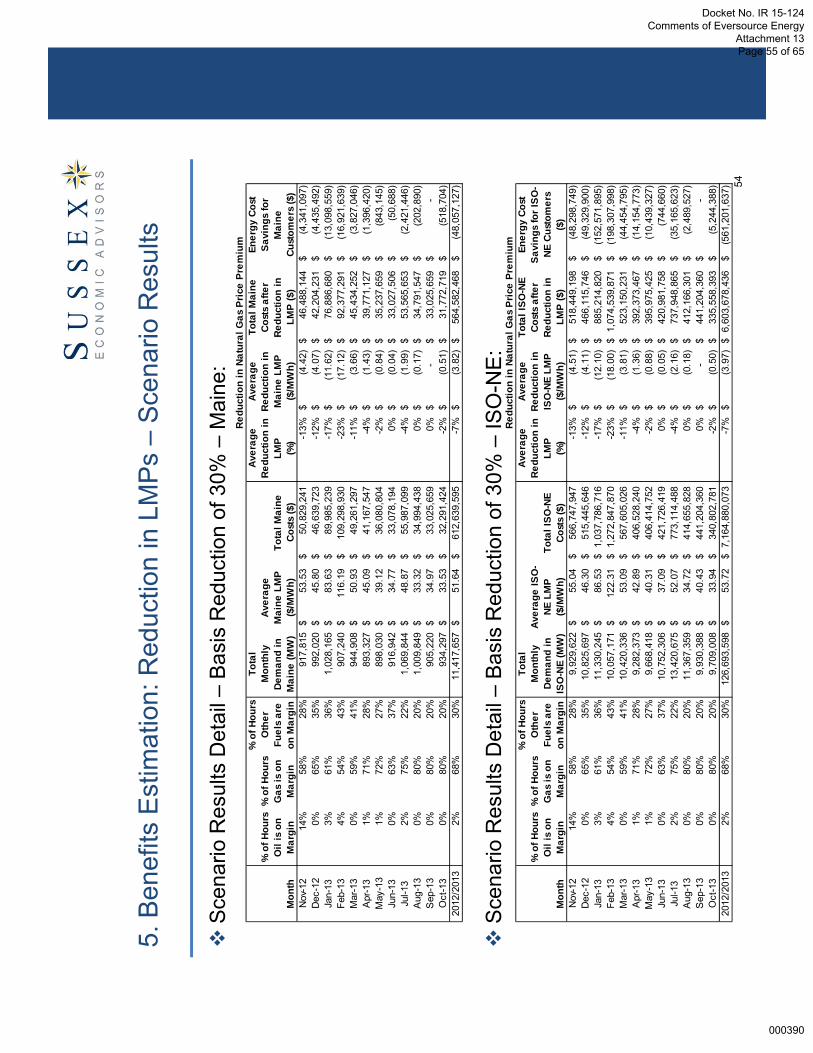
5. B
enef
its E
stim
atio
n: R
educ
tion
in L
MP
s –
Sce
nario
Res
ults
S
cena
rio R
esul
ts D
etai
l –B
asis
Red
uctio
n of
30%
–M
aine
:
S
cena
rio R
esul
ts D
etai
l –B
asis
Red
uctio
n of
30%
–IS
O-N
E:
Mon
th
% o
f Hou
rs
Oil
is o
n M
argi
n
% o
f Hou
rs
Gas
is o
n M
argi
n
% o
f Hou
rs
Oth
er
Fuel
s ar
e on
Mar
gin
Tota
l M
onth
ly
Dem
and
in
Mai
ne (M
W)
Aver
age
Mai
ne L
MP
($/M
Wh)
Tota
l Mai
ne
Cost
s ($
)
Aver
age
Red
uctio
n in
LM
P(%
)
Ave
rage
R
educ
tion
in
Mai
ne L
MP
($/M
Wh)
Tota
l Mai
ne
Cos
ts a
fter
Redu
ctio
n in
LM
P ($
)
Ener
gy C
ost
Sav
ings
for
Mai
ne
Cust
omer
s ($
)N
ov-1
214
%58
%28
%91
7,81
553
.53
$
50,8
29,2
41$
-13%
(4.4
2)$
46,4
88,1
44$
(4,3
41,0
97)
$
Dec
-12
0%65
%35
%99
2,02
045
.80
$
46,6
39,7
23$
-12%
(4.0
7)$
42,2
04,2
31$
(4,4
35,4
92)
$
Jan-
133%
61%
36%
1,02
8,16
583
.63
$
89,9
85,2
39$
-17%
(11.
62)
$
76,8
86,6
80$
(13,
098,
559)
$
Fe
b-13
4%54
%43
%90
7,24
011
6.19
$
109,
298,
930
$
-2
3%(1
7.12
)$
92
,377
,291
$
(1
6,92
1,63
9)$
Mar
-13
0%59
%41
%94
4,90
850
.93
$
49,2
61,2
97$
-11%
(3.6
6)$
45,4
34,2
52$
(3,8
27,0
46)
$
Apr
-13
1%71
%28
%89
3,32
745
.09
$
41,1
67,5
47$
-4%
(1.4
3)$
39,7
71,1
27$
(1,3
96,4
20)
$
May
-13
1%72
%27
%89
8,03
039
.12
$
36,0
80,8
04$
-2%
(0.8
4)$
35,2
37,6
59$
(843
,145
)$
Jun-
130%
63%
37%
916,
942
34.7
7$
33
,078
,194
$
0%
(0.0
4)$
33,0
27,5
06$
(50,
688)
$
Ju
l-13
2%75
%22
%1,
069,
844
48.8
7$
55
,987
,099
$
-4
%(1
.99)
$
53
,565
,653
$
(2
,421
,446
)$
A
ug-1
30%
80%
20%
1,00
9,84
933
.32
$
34,9
94,4
38$
0%(0
.17)
$
34
,791
,547
$
(2
02,8
90)
$
S
ep-1
30%
80%
20%
905,
220
34.9
7$
33
,025
,659
$
0%
-$
33,0
25,6
59$
-$
Oct
-13
0%80
%20
%93
4,29
733
.53
$
32,2
91,4
24$
-2%
(0.5
1)$
31,7
72,7
19$
(518
,704
)$
2012
/201
32%
68%
30%
11,4
17,6
5751
.64
$
612,
639,
595
$
-7
%(3
.82)
$
56
4,58
2,46
8$
(48,
057,
127)
$
Red
uctio
n in
Nat
ural
Gas
Pri
ce P
rem
ium
Mon
th
% o
f Hou
rs
Oil
is o
n M
argi
n
% o
f Hou
rs
Gas
is o
n M
argi
n
% o
f Hou
rs
Oth
er
Fuel
s ar
e on
Mar
gin
Tota
l M
onth
ly
Dem
and
in
ISO
-NE
(MW
)
Aver
age
ISO
-NE
LM
P ($
/MW
h)To
tal I
SO-N
E Co
sts
($)
Aver
age
Red
uctio
n in
LM
P(%
)
Ave
rage
R
educ
tion
in
ISO
-NE
LMP
($/M
Wh)
Tota
l ISO
-NE
Cos
ts a
fter
Redu
ctio
n in
LM
P ($
)
Ener
gy C
ost
Sav
ings
for
ISO
-N
E C
usto
mer
s ($
)N
ov-1
214
%58
%28
%9,
929,
622
55.0
4$
56
6,74
7,94
7$
-13%
(4.5
1)$
518,
449,
198
$
(4
8,29
8,74
9)$
Dec
-12
0%65
%35
%10
,825
,697
46.3
0$
51
5,44
5,64
6$
-12%
(4.1
1)$
466,
115,
746
$
(4
9,32
9,90
0)$
Jan-
133%
61%
36%
11,3
30,2
4586
.53
$
1,03
7,78
6,71
6$
-1
7%(1
2.10
)$
88
5,21
4,82
0$
(152
,571
,895
)$
Fe
b-13
4%54
%43
%10
,057
,171
122.
31$
1,
272,
847,
870
$
-23%
(18.
00)
$
1,07
4,53
9,87
1$
(1
98,3
07,9
98)
$
Mar
-13
0%59
%41
%10
,420
,336
53.0
9$
56
7,60
5,02
6$
-11%
(3.8
1)$
523,
150,
231
$
(4
4,45
4,79
5)$
Apr
-13
1%71
%28
%9,
282,
373
42.8
9$
40
6,52
8,24
0$
-4%
(1.3
6)$
392,
373,
467
$
(1
4,15
4,77
3)$
May
-13
1%72
%27
%9,
668,
418
40.3
1$
40
6,41
4,75
2$
-2%
(0.8
8)$
395,
975,
425
$
(1
0,43
9,32
7)$
Jun-
130%
63%
37%
10,7
52,3
0637
.09
$
421,
726,
419
$
0%
(0.0
5)$
420,
981,
758
$
(7
44,6
60)
$
Ju
l-13
2%75
%22
%13
,420
,675
52.0
7$
77
3,11
4,48
8$
-4%
(2.1
6)$
737,
948,
865
$
(3
5,16
5,62
3)$
Aug
-13
0%80
%20
%11
,367
,359
34.7
2$
41
4,65
5,82
8$
0%(0
.18)
$
41
2,16
6,30
1$
(2,4
89,5
27)
$
Sep
-13
0%80
%20
%9,
930,
388
40.4
3$
44
1,20
4,36
0$
0%-
$
44
1,20
4,36
0$
-$
Oct
-13
0%80
%20
%9,
709,
008
33.9
4$
34
0,80
2,78
1$
-2%
(0.5
0)$
335,
558,
393
$
(5
,244
,388
)$
20
12/2
013
2%68
%30
%12
6,69
3,59
853
.72
$
7,16
4,88
0,07
3$
-7
%(3
.97)
$
6,
603,
678,
436
$
(561
,201
,637
)$
Red
uctio
n in
Nat
ural
Gas
Pri
ce P
rem
ium
54
Docket No. IR 15-124 Comments of Eversource Energy
Attachment 13 Page 55 of 65
000390

5. B
enef
its E
stim
atio
n: R
educ
tion
in L
MP
s –
Sce
nario
Res
ults
(con
t.)
S
cena
rio R
esul
ts D
etai
l –B
asis
Red
uctio
n of
50%
–M
aine
:
S
cena
rio R
esul
ts D
etai
l –B
asis
Red
uctio
n of
50%
–IS
O-N
E:
Mon
th
% o
f Hou
rs
Oil
is o
n M
argi
n
% o
f Hou
rs
Gas
is o
n M
argi
n
% o
f Hou
rs
Oth
er
Fuel
s ar
e on
Mar
gin
Tota
l M
onth
ly
Dem
and
in
ISO
-NE
(MW
)
Aver
age
ISO
-NE
LM
P ($
/MW
h)To
tal I
SO-N
E Co
sts
($)
Aver
age
Red
uctio
n in
LM
P(%
)
Ave
rage
R
educ
tion
in
ISO
-NE
LMP
($/M
Wh)
Tota
l ISO
-NE
Cos
ts a
fter
Redu
ctio
n in
LM
P ($
)
Ener
gy C
ost
Sav
ings
for
ISO
-N
E C
usto
mer
s ($
)N
ov-1
214
%58
%28
%9,
929,
622
55.0
4$
56
6,74
7,94
7$
-22%
(7.5
2)$
486,
250,
032
$
(8
0,49
7,91
5)$
Dec
-12
0%65
%35
%10
,825
,697
46.3
0$
51
5,44
5,64
6$
-19%
(6.8
6)$
433,
229,
145
$
(8
2,21
6,50
1)$
Jan-
133%
61%
36%
11,3
30,2
4586
.53
$
1,03
7,78
6,71
6$
-2
9%(2
0.16
)$
78
3,50
0,22
3$
(254
,286
,492
)$
Fe
b-13
4%54
%43
%10
,057
,171
122.
31$
1,
272,
847,
870
$
-38%
(30.
00)
$
942,
334,
539
$
(3
30,5
13,3
30)
$
Mar
-13
0%59
%41
%10
,420
,336
53.0
9$
56
7,60
5,02
6$
-18%
(6.3
5)$
493,
513,
701
$
(7
4,09
1,32
5)$
Apr
-13
1%71
%28
%9,
282,
373
42.8
9$
40
6,52
8,24
0$
-7%
(2.2
7)$
382,
936,
952
$
(2
3,59
1,28
9)$
May
-13
1%72
%27
%9,
668,
418
40.3
1$
40
6,41
4,75
2$
-4%
(1.4
7)$
389,
015,
874
$
(1
7,39
8,87
8)$
Jun-
130%
63%
37%
10,7
52,3
0637
.09
$
421,
726,
419
$
0%
(0.0
8)$
420,
485,
318
$
(1
,241
,101
)$
Ju
l-13
2%75
%22
%13
,420
,675
52.0
7$
77
3,11
4,48
8$
-7%
(3.6
0)$
714,
505,
116
$
(5
8,60
9,37
2)$
Aug
-13
0%80
%20
%11
,367
,359
34.7
2$
41
4,65
5,82
8$
-1%
(0.2
9)$
410,
506,
616
$
(4
,149
,211
)$
S
ep-1
30%
80%
20%
9,93
0,38
840
.43
$
441,
204,
360
$
0%
-$
441,
204,
360
$
-
$
O
c t-1
30%
80%
20%
9,70
9,00
833
.94
$
340,
802,
781
$
-3
%(0
.83)
$
33
2,06
2,13
5$
(8,7
40,6
47)
$
2012
/201
32%
68%
30%
126,
693,
598
53.7
2$
7,
164,
880,
073
$
-12%
(6.6
2)$
6,22
9,54
4,01
1$
(9
35,3
36,0
62)
$
Red
uctio
n in
Nat
ural
Gas
Pri
ce P
rem
ium
Mon
th
% o
f Hou
rs
Oil
is o
n M
argi
n
% o
f Hou
rs
Gas
is o
n M
argi
n
% o
f Hou
rs
Oth
er
Fuel
s ar
e on
Mar
gin
Tota
l M
onth
ly
Dem
and
in
Mai
ne (M
W)
Aver
age
Mai
ne L
MP
($/M
Wh)
Tota
l Mai
ne
Cost
s ($
)
Aver
age
Red
uctio
n in
LM
P(%
)
Ave
rage
R
educ
tion
in
Mai
ne L
MP
($/M
Wh)
Tota
l Mai
ne
Cos
ts a
fter
Redu
ctio
n in
LM
P ($
)
Ener
gy C
ost
Sav
ings
for
Mai
ne
Cust
omer
s ($
)N
ov-1
214
%58
%28
%91
7,81
553
.53
$
50,8
29,2
41$
-22%
(7.3
7)$
43,5
94,0
80$
(7,2
35,1
61)
$
Dec
-12
0%65
%35
%99
2,02
045
.80
$
46,6
39,7
23$
-19%
(6.7
9)$
39,2
47,2
37$
(7,3
92,4
87)
$
Jan-
133%
61%
36%
1,02
8,16
583
.63
$
89,9
85,2
39$
-29%
(19.
37)
$
68,1
54,3
08$
(21,
830,
932)
$
Fe
b-13
4%54
%43
%90
7,24
011
6.19
$
109,
298,
930
$
-3
8%(2
8.53
)$
81
,096
,198
$
(2
8,20
2,73
1)$
Mar
-13
0%59
%41
%94
4,90
850
.93
$
49,2
61,2
97$
-18%
(6.1
0)$
42,8
82,8
88$
(6,3
78,4
09)
$
Apr
-13
1%71
%28
%89
3,32
745
.09
$
41,1
67,5
47$
-7%
(2.3
9)$
38,8
40,1
80$
(2,3
27,3
67)
$
May
-13
1%72
%27
%89
8,03
039
.12
$
36,0
80,8
04$
-4%
(1.4
0)$
34,6
75,5
63$
(1,4
05,2
41)
$
Jun-
130%
63%
37%
916,
942
34.7
7$
33
,078
,194
$
0%
(0.0
7)$
32,9
93,7
14$
(84,
480)
$
Ju
l-13
2%75
%22
%1,
069,
844
48.8
7$
55
,987
,099
$
-7
%(3
.32)
$
51
,951
,355
$
(4
,035
,744
)$
A
ug-1
30%
80%
20%
1,00
9,84
933
.32
$
34,9
94,4
38$
-1%
(0.2
8)$
34,6
56,2
87$
(338
,151
)$
Sep
-13
0%80
%20
%90
5,22
034
.97
$
33,0
25,6
59$
0%-
$
33
,025
,659
$
-
$
O
c t-1
30%
80%
20%
934,
297
33.5
3$
32
,291
,424
$
-3
%(0
.85)
$
31
,426
,916
$
(8
64,5
07)
$
20
12/2
013
2%68
%30
%11
,417
,657
51.6
4$
61
2,63
9,59
5$
-12%
(6.3
7)$
532,
544,
384
$
(8
0,09
5,21
1)$
Red
uctio
n in
Nat
ural
Gas
Pri
ce P
rem
ium
55
Docket No. IR 15-124 Comments of Eversource Energy
Attachment 13 Page 56 of 65
000391

5. B
enef
its E
stim
atio
n: R
educ
tion
in L
MP
s –
Sce
nario
Res
ults
(con
t.)
S
cena
rio R
esul
ts D
etai
l –B
asis
Red
uctio
n of
70%
–M
aine
:
S
cena
rio R
esul
ts D
etai
l –B
asis
Red
uctio
n of
70%
–IS
O-N
E:
56
Mon
th
% o
f Hou
rs
Oil
is o
n M
argi
n
% o
f Hou
rs
Gas
is o
n M
argi
n
% o
f Hou
rs
Oth
er
Fuel
s ar
e on
Mar
gin
Tota
l M
onth
ly
Dem
and
in
Mai
ne (M
W)
Aver
age
Mai
ne L
MP
($/M
Wh)
Tota
l Mai
ne
Cost
s ($
)
Aver
age
Red
uctio
n in
LM
P(%
)
Ave
rage
R
educ
tion
in
Mai
ne L
MP
($/M
Wh)
Tota
l Mai
ne
Cos
ts a
fter
Redu
ctio
n in
LM
P ($
)
Ener
gy C
ost
Sav
ings
for
Mai
ne
Cust
omer
s ($
)N
ov-1
214
%58
%28
%91
7,81
553
.53
$
50,8
29,2
41$
-30%
(10.
32)
$
40,7
00,0
15$
(10,
129,
226)
$
D
ec-1
20%
65%
35%
992,
020
45.8
0$
46
,639
,723
$
-2
7%(9
.50)
$
36
,290
,242
$
(1
0,34
9,48
1)$
Jan-
133%
61%
36%
1,02
8,16
583
.63
$
89,9
85,2
39$
-40%
(27.
12)
$
59,4
21,9
35$
(30,
563,
304)
$
Fe
b-13
4%54
%43
%90
7,24
011
6.19
$
109,
298,
930
$
-5
3%(3
9.94
)$
69
,815
,106
$
(3
9,48
3,82
4)$
Mar
-13
0%59
%41
%94
4,90
850
.93
$
49,2
61,2
97$
-25%
(8.5
4)$
40,3
31,5
24$
(8,9
29,7
73)
$
Apr
-13
1%71
%28
%89
3,32
745
.09
$
41,1
67,5
47$
-9%
(3.3
5)$
37,9
09,2
33$
(3,2
58,3
14)
$
May
-13
1%72
%27
%89
8,03
039
.12
$
36,0
80,8
04$
-5%
(1.9
7)$
34,1
13,4
66$
(1,9
67,3
37)
$
Jun-
130%
63%
37%
916,
942
34.7
7$
33
,078
,194
$
0%
(0.1
0)$
32,9
59,9
22$
(118
,272
)$
Jul-1
32%
75%
22%
1,06
9,84
448
.87
$
55,9
87,0
99$
-10%
(4.6
5)$
50,3
37,0
57$
(5,6
50,0
42)
$
Aug
-13
0%80
%20
%1,
009,
849
33.3
2$
34
,994
,438
$
-1
%(0
.39)
$
34
,521
,027
$
(4
73,4
11)
$
S
ep-1
30%
80%
20%
905,
220
34.9
7$
33
,025
,659
$
0%
-$
33,0
25,6
59$
-$
Oc t
-13
0%80
%20
%93
4,29
733
.53
$
32,2
91,4
24$
-4%
(1.2
0)$
31,0
81,1
13$
(1,2
10,3
10)
$
2012
/201
32%
68%
30%
11,4
17,6
5751
.64
$
612,
639,
595
$
-1
7%(8
.92)
$
50
0,50
6,30
0$
(112
,133
,295
)$
Red
uctio
n in
Nat
ural
Gas
Pri
ce P
rem
ium
Mon
th
% o
f Hou
rs
Oil
is o
n M
argi
n
% o
f Hou
rs
Gas
is o
n M
argi
n
% o
f Hou
rs
Oth
er
Fuel
s ar
e on
Mar
gin
Tota
l M
onth
ly
Dem
and
in
ISO
-NE
(MW
)
Aver
age
ISO
-NE
LM
P ($
/MW
h)To
tal I
SO-N
E Co
sts
($)
Aver
age
Red
uctio
n in
LM
P(%
)
Ave
rage
R
educ
tion
in
ISO
-NE
LMP
($/M
Wh)
Tota
l ISO
-NE
Cos
ts a
fter
Redu
ctio
n in
LM
P ($
)
Ener
gy C
ost
Sav
ings
for
ISO
-N
E C
usto
mer
s ($
)N
ov-1
214
%58
%28
%9,
929,
622
55.0
4$
56
6,74
7,94
7$
-30%
(10.
52)
$
454,
050,
866
$
(1
12,6
97,0
81)
$
Dec
-12
0%65
%35
%10
,825
,697
46.3
0$
51
5,44
5,64
6$
-27%
(9.6
0)$
400,
342,
545
$
(1
15,1
03,1
01)
$
Jan-
133%
61%
36%
11,3
30,2
4586
.53
$
1,03
7,78
6,71
6$
-4
0%(2
8.22
)$
68
1,78
5,62
6$
(356
,001
,089
)$
Fe
b-13
4%54
%43
%10
,057
,171
122.
31$
1,
272,
847,
870
$
-53%
(42.
00)
$
810,
129,
207
$
(4
62,7
18,6
62)
$
Mar
-13
0%59
%41
%10
,420
,336
53.0
9$
56
7,60
5,02
6$
-25%
(8.8
9)$
463,
877,
170
$
(1
03,7
27,8
56)
$
Apr
-13
1%71
%28
%9,
282,
373
42.8
9$
40
6,52
8,24
0$
-9%
(3.1
8)$
373,
500,
436
$
(3
3,02
7,80
4)$
May
-13
1%72
%27
%9,
668,
418
40.3
1$
40
6,41
4,75
2$
-5%
(2.0
6)$
382,
056,
322
$
(2
4,35
8,43
0)$
Jun-
130%
63%
37%
10,7
52,3
0637
.09
$
421,
726,
419
$
0%
(0.1
1)$
419,
988,
878
$
(1
,737
,541
)$
Ju
l-13
2%75
%22
%13
,420
,675
52.0
7$
77
3,11
4,48
8$
-10%
(5.0
4)$
691,
061,
367
$
(8
2,05
3,12
1)$
Aug
-13
0%80
%20
%11
,367
,359
34.7
2$
41
4,65
5,82
8$
-1%
(0.4
1)$
408,
846,
932
$
(5
,808
,896
)$
S
ep-1
30%
80%
20%
9,93
0,38
840
.43
$
441,
204,
360
$
0%
-$
441,
204,
360
$
-
$
O
c t-1
30%
80%
20%
9,70
9,00
833
.94
$
340,
802,
781
$
-4
%(1
.16)
$
32
8,56
5,87
6$
(12,
236,
905)
$
20
12/2
013
2%68
%30
%12
6,69
3,59
853
.72
$
7,16
4,88
0,07
3$
-1
7%(9
.27)
$
5,
855,
409,
587
$
(1,3
09,4
70,4
86)
$
Red
uctio
n in
Nat
ural
Gas
Pri
ce P
rem
ium
Docket No. IR 15-124 Comments of Eversource Energy
Attachment 13 Page 57 of 65
000392

5. E
stim
ated
Cos
t Ran
ge: P
ipel
ine
Cap
acity
S
usse
x de
velo
ped
Cos
t Ass
umpt
ions
for a
rang
e of
incr
emen
tal p
ipel
ine
capa
city
(i.e
., 35
0,00
0 D
th/d
ay, 7
00,0
00 D
th/d
ay a
nd 1
,000
,000
Dth
/day
) bas
ed
on ra
tes
rang
ing
from
$1.
00 to
$2.
00 p
er d
aily
MD
Q
Cos
t Ass
umpt
ions
(350
,000
Dth
)
Rat
e($
/Dth
)C
apac
ity (D
th)
Annu
al C
ost
($)
$1.0
035
0,00
0$1
27,7
50,0
00
$1.1
035
0,00
0$1
40,5
25,0
00
$1.2
035
0,00
0$1
53,3
00,0
00
$1.3
035
0,00
0$1
66,0
75,0
00
$1.4
035
0,00
0$1
78,8
50,0
00
$1.5
035
0,00
0$1
91,6
25,0
00
$1.6
035
0,00
0$2
04,4
00,0
00
$1.7
035
0,00
0$2
17,1
75,0
00
$1.8
035
0,00
0$2
29,9
50,0
00
$1.9
035
0,00
0$2
42,7
25,0
00
$2.0
035
0,00
0$2
55,5
00,0
00
Cos
t Ass
umpt
ions
(700
,000
Dth
)
Rat
e($
/Dth
)C
apac
ity (D
th)
Annu
al C
ost
($)
$1.0
070
0,00
0$2
55,5
00,0
00
$1.1
070
0,00
0$2
81,0
50,0
00
$1.2
070
0,00
0$3
06,6
00,0
00
$1.3
070
0,00
0$3
32,1
50,0
00
$1.4
070
0,00
0$3
57,7
00,0
00
$1.5
070
0,00
0$3
83,2
50,0
00
$1.6
070
0,00
0$4
08,8
00,0
00
$1.7
070
0,00
0$4
34,3
50,0
00
$1.8
070
0,00
0$4
59,9
00,0
00
$1.9
070
0,00
0$4
85,4
50,0
00
$2.0
070
0,00
0$5
11,0
00,0
00
Cos
t Ass
umpt
ions
(1,0
00,0
00 D
th)
Rat
e($
/Dth
)C
apac
ity (D
th)
Annu
al C
ost
($)
$1.0
01,
000,
000
$365
,000
,000
$1.1
01,
000,
000
$401
,500
,000
$1.2
01,
000,
000
$438
,000
,000
$1.3
01,
000,
000
$474
,500
,000
$1.4
01,
000,
000
$511
,000
,000
$1.5
01,
000,
000
$547
,500
,000
$1.6
01,
000,
000
$584
,000
,000
$1.7
01,
000,
000
$620
,500
,000
$1.8
01,
000,
000
$657
,000
,000
$1.9
01,
000,
000
$693
,500
,000
$2.0
01,
000,
000
$730
,000
,000
57
Docket No. IR 15-124 Comments of Eversource Energy
Attachment 13 Page 58 of 65
000393

5. C
ost /
Ben
efit
Ana
lysi
s: A
naly
tical
Est
imat
es –
New
Eng
land
U
sing
the
estim
ated
bas
is re
duct
ion
asso
ciat
ed w
ith p
oten
tial p
ipel
ine
infra
stru
ctur
e ad
ditio
ns, a
s di
scus
sed
on p
revi
ous
slid
es, S
usse
x de
velo
ped
a ba
sis
redu
ctio
n ta
ble
rang
ing
from
25%
to
75%
(i.e
., E
stim
ated
Ben
efits
); si
mila
rly, S
usse
x us
ed th
e co
st o
f pip
elin
e ca
paci
ty ta
ble
prev
ious
ly d
iscu
ssed
, whi
ch in
clud
ed ra
tes
rang
ing
from
$1.
00 to
$2.
00 p
er d
aily
MD
Q (i
.e.,
Cos
t A
ssum
ptio
ns)
A
s sh
own
belo
w, a
40%
bas
is re
duct
ion
wou
ld o
ffset
a 1
,000
,000
Dth
/day
of i
ncre
men
tal
pipe
line
capa
city
at a
$2.
00/D
th d
aily
rate
A
t a $
1.50
/Dth
dai
ly ra
te, t
he e
stim
ated
ben
efit
over
ann
ual c
ost i
s ap
prox
imat
ely
$200
,000
,000
Estim
ated
Ben
efits
Bas
is R
educ
tion
of:
Annu
al E
nerg
y C
ost S
avin
gs fo
r M
aine
Cus
tom
ers
($)
Annu
al E
nerg
y C
ost S
avin
gs fo
r IS
O-N
E C
usto
mer
s ($
)25
%$4
0,04
7,60
5$4
67,6
68,0
31
30%
$48,
057,
127
$561
,201
,637
35%
$56,
066,
648
$654
,735
,243
40%
$64,
076,
169
$748
,268
,849
45%
$72,
085,
690
$841
,802
,455
50%
$80,
095,
211
$935
,336
,062
55%
$88,
104,
732
$1,0
28,8
69,6
68
60%
$96,
114,
253
$1,1
22,4
03,2
74
65%
$104
,123
,774
$1,2
15,9
36,8
80
70%
$112
,133
,295
$1,3
09,4
70,4
86
75%
$120
,142
,816
$1,4
03,0
04,0
92
Cos
t Ass
umpt
ions
(1,0
00,0
00 D
th)
Rat
e($
/Dth
)C
apac
ity (D
th)
Annu
al C
ost
($)
$1.0
01,
000,
000
$365
,000
,000
$1.1
01,
000,
000
$401
,500
,000
$1.2
01,
000,
000
$438
,000
,000
$1.3
01,
000,
000
$474
,500
,000
$1.4
01,
000,
000
$511
,000
,000
$1.5
01,
000,
000
$547
,500
,000
$1.6
01,
000,
000
$584
,000
,000
$1.7
01,
000,
000
$620
,500
,000
$1.8
01,
000,
000
$657
,000
,000
$1.9
01,
000,
000
$693
,500
,000
$2.0
01,
000,
000
$730
,000
,000
58
Docket No. IR 15-124 Comments of Eversource Energy
Attachment 13 Page 59 of 65
000394

5. C
ost /
Ben
efit
Ana
lysi
s: A
naly
tical
Est
imat
es –
Mai
ne
Estim
ated
Ben
efits
Bas
is
Red
uctio
n of
:
Annu
al E
nerg
y C
ost S
avin
gs fo
r M
aine
Cus
tom
ers
($)
25%
$40,
047,
605
30%
$48,
057,
127
35%
$56,
066,
648
40%
$64,
076,
169
45%
$72,
085,
690
50%
$80,
095,
211
55%
$88,
104,
732
60%
$96,
114,
253
65%
$104
,123
,774
70%
$112
,133
,295
75%
$120
,142
,816
Cos
t Ass
umpt
ions
(200
,000
Dth
)
Rat
e($
/Dth
)C
apac
ity (D
th)
Annu
al C
ost
($)
$1.0
020
0,00
0$7
3,00
0,00
0$1
.10
200,
000
$80,
300,
000
$1.2
020
0,00
0$8
7,60
0,00
0
$1.3
020
0,00
0$9
4,90
0,00
0
$1.4
020
0,00
0$1
02,2
00,0
00
$1.5
020
0,00
0$1
09,5
00,0
00
$1.6
020
0,00
0$1
16,8
00,0
00
$1.7
020
0,00
0$1
24,1
00,0
00
$1.8
020
0,00
0$1
31,4
00,0
00
$1.9
020
0,00
0$1
38,7
00,0
00
$2.0
020
0,00
0$1
46,0
00,0
00
Cos
t Ass
umpt
ions
(50,
000
Dth
)
Rat
e($
/Dth
)C
apac
ity (D
th)
Annu
al C
ost
($)
$1.0
050
,000
$18,
250,
000
$1.1
050
,000
$20,
075,
000
$1.2
050
,000
$21,
900,
000
$1.3
050
,000
$23,
725,
000
$1.4
050
,000
$25,
550,
000
$1.5
050
,000
$27,
375,
000
$1.6
050
,000
$29,
200,
000
$1.7
050
,000
$31,
025,
000
$1.8
050
,000
$32,
850,
000
$1.9
050
,000
$34,
675,
000
$2.0
050
,000
$36,
500,
000
M
aine
cou
ld a
ct in
depe
nden
tly to
con
tract
for i
ncre
men
tal c
apac
ity to
Mai
ne, o
r ups
tream
of
Mai
ne
•S
usse
x re
view
ed tw
o sc
enar
ios:
(i) 5
0,00
0 D
th/d
ay; a
nd (i
i) 20
0,00
0 D
th/d
ay
•P
leas
e no
te th
at th
e ca
paci
ty a
mou
nts
(e.g
., 50
,000
Dth
/day
and
200
,000
Dth
/day
) may
be
part
of a
larg
er c
apac
ity a
dditi
on
•A
t a 4
0% b
asis
redu
ctio
n sc
enar
io (i
.e.,
Est
imat
ed B
enef
its),
the
Sta
te o
f Mai
ne w
ould
nee
d to
pay
less
than
$1.
00/D
th p
er d
ay fo
r pip
elin
e ca
paci
ty (i
.e.,
Cos
t Ass
umpt
ions
for 2
00,0
00
Dth
/day
of c
apac
ity);
conv
erse
ly, a
t the
low
er v
olum
e le
vel (
i.e.,
Cos
t Ass
umpt
ions
for
50,0
00 D
th) t
he S
tate
of M
aine
cou
ld p
ay a
bove
$2.
00/D
th fo
r cap
acity
59
Docket No. IR 15-124 Comments of Eversource Energy
Attachment 13 Page 60 of 65
000395

5. C
ost /
Ben
efit
Ana
lysi
s: S
umm
ary
Th
e in
trodu
ctio
n of
new
pip
elin
e ca
paci
ty in
to a
con
stra
ined
regi
on w
ill re
duce
th
e ba
sis
diffe
rent
ial b
etw
een
that
regi
on a
nd th
e H
enry
Hub
nat
ural
gas
pric
e in
dex
S
usse
x co
nsid
ered
two
case
s to
est
imat
e th
e po
tent
ial b
asis
redu
ctio
n as
soci
ated
with
incr
emen
tal p
ipel
ine
capa
city
into
the
New
Eng
land
regi
on:
1.Th
e ex
pect
ed a
dditi
on o
f the
Spe
ctra
Ene
rgy
AIM
Pro
ject
(342
,000
Dth
/day
) and
the
TGP
Con
nect
icut
Exp
ansi
on (7
2,00
0 D
th/d
ay) t
o th
e N
ew E
ngla
nd re
gion
in N
ovem
ber
2016
cor
resp
onde
d w
ith a
forw
ard
natu
ral g
as p
rice
redu
ctio
n of
app
roxi
mat
ely
35%
2.Th
e ad
ditio
n of
ove
r 1,0
00,0
00 D
th/d
ay o
f pip
elin
e ca
paci
ty in
to th
e N
ew Y
ork
City
re
gion
cor
resp
onde
d w
ith a
65%
to 7
0% re
duct
ion
in fo
rwar
d na
tura
l gas
pric
es
Whi
le o
ther
var
iabl
es m
ay a
ffect
the
basi
s, in
crem
enta
l pip
elin
e ca
paci
ty is
the
prin
cipa
l fac
tor
B
ecau
se it
is d
iffic
ult t
o id
entif
y al
l var
iabl
es a
ffect
ing
the
basi
s an
d gi
ven
that
qu
antif
ying
the
rela
tions
hip
betw
een
thos
e va
riabl
es a
nd th
e ba
sis
wou
ld re
quire
su
bsta
ntia
l jud
gmen
t and
like
ly b
e su
bjec
t to
estim
atio
n, S
usse
x be
lieve
s th
at
the
case
stu
dy m
etho
d is
a re
ason
able
app
roac
h
The
appl
icat
ion
of th
e tw
o ca
ses
to th
e N
ew E
ngla
nd re
gion
ther
efor
e as
sum
es
that
all
varia
bles
affe
ctin
g th
e ba
sis
redu
ctio
n, b
ut fo
r inc
rem
enta
l pip
elin
e ca
paci
ty, r
emai
n co
nsta
nt, a
nd th
at b
oth
case
s ca
n be
app
lied
to th
e N
ew
Engl
and
regi
on
60
Docket No. IR 15-124 Comments of Eversource Energy
Attachment 13 Page 61 of 65
000396

5. C
ost /
Ben
efit
Ana
lysi
s: S
umm
ary
–R
egio
nal C
apac
ity A
dditi
on
U
sing
the
two
case
s to
info
rm a
cos
t (ne
w p
ipel
ine
infra
stru
ctur
e) /
bene
fit
(low
er e
lect
ricity
cos
ts) a
naly
sis
prov
ides
the
follo
win
g:
If th
e fo
cus
is th
e N
ew E
ngla
nd re
gion
:•
A 40
0,00
0 D
th/d
ay p
ipel
ine
capa
city
add
ition
into
the
New
Eng
land
regi
on a
t a d
aily
cos
t of
$1.5
0/D
th (t
he m
id-p
oint
of t
he c
ost r
ange
revi
ewed
) res
ults
in a
n an
nual
cos
t of $
219
milli
on;
assu
min
g th
e ne
w c
apac
ity a
dditi
on re
duce
s th
e na
tura
l gas
pric
e in
dex
by 3
5% a
nd th
eref
ore,
the
ISO
-NE
LM
Ps
whe
n na
tura
l gas
-fire
d ge
nera
tion
is o
n th
e m
argi
n, m
ay re
duce
ele
ctric
ity c
osts
by
$655
milli
on, w
hich
yie
lds
an o
vera
ll an
nual
ben
efit
of $
436
milli
on (i
.e.,
$655
milli
on -
$219
milli
on)
•A
1,00
0,00
0 D
th/d
ay p
ipel
ine
capa
city
add
ition
into
the
New
Eng
land
regi
on a
t a d
aily
rate
of
$1.5
0/D
th (t
he m
id-p
oint
of t
he c
ost e
stim
ate
rang
e re
view
ed) r
esul
ts in
an
annu
al c
ost o
f $54
8 m
illion
; ass
umin
g th
e ne
w c
apac
ity a
dditi
on re
duce
s th
e na
tura
l gas
pric
e in
dex
by 6
5% a
nd
ther
efor
e th
e LM
Ps,
ele
ctric
ity c
osts
may
be
redu
ced
by $
1.2
billio
n, w
hich
yie
lds
an o
vera
ll an
nual
be
nefit
of $
652
milli
on (i
.e.,
$1.2
billi
on -
$548
milli
on)
If
the
focu
s is
the
Mai
ne re
gion
, ass
umin
g M
aine
’s c
apac
ity a
dditi
ons
are
part
of a
larg
er,
regi
onal
cap
acity
add
ition
:•
A 50
,000
Dth
/day
cap
acity
add
ition
at a
dai
ly ra
te o
f $1.
50/D
th w
ould
resu
lt in
an
annu
al c
ost o
f ap
prox
imat
ely
$27
milli
on; a
ssum
ing
a 35
% re
duct
ion
in M
aine
LM
Ps
wou
ld re
sult
in a
$56
milli
on
elec
trici
ty c
ost s
avin
gs –
an o
vera
ll be
nefit
of $
29 m
illion
•A
200,
000
Dth
/day
cap
acity
add
ition
at a
dai
ly ra
te o
f $1.
50/D
th w
ould
resu
lt in
an
annu
al c
ost o
f $1
10 m
illion
; ass
umin
g a
65%
redu
ctio
n in
Mai
ne L
MP
s w
ould
resu
lt in
a $
104
milli
on e
lect
ricity
cos
t sa
ving
s –
an o
vera
ll co
stof
$6
milli
on
61
Docket No. IR 15-124 Comments of Eversource Energy
Attachment 13 Page 62 of 65
000397

5. C
ost /
Ben
efit
Ana
lysi
s: S
umm
ary
–M
aine
Cap
acity
Add
ition
Th
e S
tate
of M
aine
cou
ld a
ct in
depe
nden
tly a
nd c
ontra
ct fo
r add
ition
al c
apac
ity
to M
aine
, on
a st
anda
lone
bas
is (i
.e.,
not p
art o
f a la
rger
pip
elin
e pr
ojec
t)
Ass
umin
g th
e S
tate
of M
aine
con
tract
s fo
r add
ition
al c
apac
ity:
•A
50,0
00 D
th/d
ay c
apac
ity a
dditi
on a
t a d
aily
rate
of $
1.50
/Dth
wou
ld re
sult
in a
n an
nual
cos
t of
appr
oxim
atel
y $2
7 m
illion
To
ach
ieve
$27
milli
on in
ele
ctric
ity c
ost s
avin
gs fo
r the
Sta
te o
f Mai
ne, a
bas
is re
duct
ion
of 1
5%
to 2
0% is
requ
ired
50
,000
Dth
/day
repr
esen
ts a
n in
crem
enta
l cap
acity
add
ition
of a
ppro
xim
atel
y 1%
of p
eak
day
dem
and
for N
ew E
ngla
nd.
A ca
paci
ty a
dditi
on o
f tha
t mag
nitu
de is
not
like
ly to
hav
e a
subs
tant
ial e
ffect
on
the
basi
s pr
emiu
m fo
r the
New
Eng
land
regi
on
•A
200,
000
Dth
/day
cap
acity
add
ition
at a
dai
ly ra
te o
f $1.
50/D
th w
ould
resu
lt in
an
annu
al c
ost o
f ap
prox
imat
ely
$110
milli
on
To
ach
ieve
$11
0 m
illion
in e
lect
ricity
cos
t sav
ings
for t
he S
tate
of M
aine
, a b
asis
redu
ctio
n of
65
% to
70%
is re
quire
d
B
y co
mpa
rison
, the
cap
acity
add
ition
of o
ver 1
,000
,000
Dth
/day
of p
ipel
ine
capa
city
into
the
New
Yo
rk C
ity re
gion
cor
resp
onde
d w
ith a
65%
to 7
0% re
duct
ion
in fo
rwar
d na
tura
l gas
pric
es.
•1,
000,
000
Dth
/day
repr
esen
ts a
n in
crem
enta
l add
ition
of a
ppro
xim
atel
y 23
% o
f pea
k da
y de
man
d fo
r the
New
Yor
k C
ity re
gion
.H
owev
er, 2
00,0
00 D
th/d
ay re
pres
ents
an
incr
emen
tal
addi
tion
of a
ppro
xim
atel
y 4%
to 5
% o
f pea
k da
y de
man
d fo
r the
New
Eng
land
regi
on
62
Docket No. IR 15-124 Comments of Eversource Energy
Attachment 13 Page 63 of 65
000398

Con
tent
s
1.In
trodu
ctio
n
2.E
xecu
tive
Sum
mar
y
3.N
atur
al G
as M
arke
t Ove
rvie
w
4.N
atur
al G
as P
ipel
ine
Cap
acity
Opt
ions
5.C
ost /
Ben
efit
Ana
lysi
s
6.Su
mm
ary
and
Con
clus
ions
63
Docket No. IR 15-124 Comments of Eversource Energy
Attachment 13 Page 64 of 65
000399

6. S
umm
ary
and
Con
clus
ions
Th
ere
is p
oten
tial f
or s
igni
fican
t gro
wth
in n
atur
al g
as d
eman
d in
the
New
Eng
land
re
gion
–pa
rticu
larly
giv
en th
e va
rious
sta
te/p
rovi
ncia
l nat
ural
gas
initi
ativ
es
Sev
eral
nat
ural
gas
infra
stru
ctur
e pr
ojec
ts h
ave
been
pro
pose
d by
var
ious
ent
ities
to
alle
viat
e th
e cu
rren
t cap
acity
con
stra
ints
into
the
New
Eng
land
regi
on
Incr
emen
tal n
atur
al g
as p
ipel
ine
capa
city
into
the
New
Eng
land
regi
on w
ould
pla
ce
dow
nwar
d pr
essu
re o
n th
e re
gion
al n
atur
al g
as p
rice
indi
ces
and,
ther
efor
e, b
enef
it cu
stom
ers
who
use
thos
e pr
ice
sign
als
in tr
ansa
ctio
ns (e
.g.,
elec
trici
ty g
ener
atio
n se
gmen
t)
Bas
ed o
n th
e hi
stor
ical
rela
tions
hip
betw
een
natu
ral g
as p
rices
and
ele
ctric
ity L
MP
s in
ISO
-NE
, Sus
sex
calc
ulat
ed th
e po
tent
ial r
educ
tion
in L
MP
s as
a re
sult
of a
n ex
pect
ed re
duct
ion
in w
hole
sale
nat
ural
gas
pric
es (a
ssoc
iate
d w
ith in
crem
enta
l pi
pelin
e ca
paci
ty) t
o es
timat
e th
e po
tent
ial e
nerg
y co
st s
avin
gs to
ele
ctric
ity
cust
omer
s fo
r the
201
2/20
13 s
plit-
year
Th
e be
nefit
(i.e
., re
duce
d na
tura
l gas
cos
ts a
nd, t
here
fore
, low
er L
MP
s) a
ssoc
iate
d w
ith in
crem
enta
l pip
elin
e ex
pans
ion
was
com
pare
d to
var
ious
cos
t est
imat
es (i
.e.,
cost
of p
ipel
ine
capa
city
)
For t
he N
ew E
ngla
nd re
gion
, the
est
imat
ed a
nnua
l ben
efits
und
er a
40%
bas
is re
duct
ion
scen
ario
wou
ld o
ffset
the
annu
al c
osts
of a
1,0
00,0
00 D
th/d
ay o
f inc
rem
enta
l pip
elin
e ca
paci
ty
at a
dai
ly p
ipel
ine
char
ge o
f $2.
00/D
th
At a
40%
bas
is re
duct
ion
scen
ario
, the
est
imat
ed a
nnua
l ben
efits
to th
e S
tate
of M
aine
wou
ld
mor
e th
an o
ffset
the
annu
al c
osts
of a
50,
000
Dth
/day
con
tract
ass
umin
g a
daily
rate
as
high
as
$2.
00/D
th; h
owev
er, t
he e
stim
ated
ben
efits
wou
ld n
ot o
ffset
the
annu
al c
osts
of a
200
,000
D
th/d
ay c
ontra
ct a
t a d
aily
rate
of a
$1.
00/D
th64
Docket No. IR 15-124 Comments of Eversource Energy
Attachment 13 Page 65 of 65
000400