making cycling irresistible: lessons from the netherlands, denmark
TRANSCRIPT

Pucher and Buehler “Making Cycling Irresistible” Transport Reviews, Vol. 28, 2008
1
Making Cycling Irresistible: Lessons from the Netherlands, Denmark, and Germany John Pucher and Ralph Buehler Bloustein School of Planning and Public Policy Rutgers University 33 Livingston Avenue, Room 363 New Brunswick, New Jersey 08904 USA Tel: 001-732-932-3822, ext. 722 Fax: 001-732-932-2253 Email: [email protected]; [email protected]; [email protected]; [email protected] http://www.policy.rutgers.edu/faculty/pucher.html Abstract
This paper shows how the Netherlands, Denmark, and Germany have made bicycling a safe, convenient, and practical way to get around their cities. The analysis relies on national aggregate data as well as case studies of large and small cities in each country. The key to achieving high levels of cycling appears to be the provision of separate cycling facilities along heavily traveled roads and at intersections, combined with traffic calming of most residential neighborhoods. Extensive cycling rights of way in the Netherlands, Denmark, and Germany are complemented by ample bike parking, full integration with public transport, comprehensive traffic education and training of both cyclists and motorists, and a wide range of promotional events intended to generate enthusiasm and wide public support for cycling. In addition to their many pro-bike policies and programs, the Netherlands, Denmark, and Germany make driving expensive as well as inconvenient in central cities through a host of taxes and restrictions on car ownership, use, and parking. Moreover, strict land use policies foster compact, mixed-use developments that generate shorter and thus more bikeable trips. It is the coordinated implementation of this multi-faceted, mutually reinforcing set of policies that best explains the success of these three countries in promoting cycling. For comparison, the paper portrays the marginal status of cycling in the UK and USA, where only about one percent of trips are by bike. Revised version: 12 November 2007 Paper accepted for publication in Transport Reviews, Vol. 28, No. 4, July 2008.

Pucher and Buehler “Making Cycling Irresistible” Transport Reviews, Vol. 28, 2008
2
Making Cycling Irresistible: Lessons from the Netherlands, Denmark, and Germany
by John Pucher and Ralph Buehler Rutgers University
Email: [email protected]; [email protected]; [email protected]; [email protected]
http://www.policy.rutgers.edu/faculty/pucher.html
Abstract
This paper shows how the Netherlands, Denmark, and Germany have made bicycling a safe, convenient, and practical way to get around their cities. The analysis relies on national aggregate data as well as case studies of large and small cities in each country. The key to achieving high levels of cycling appears to be the provision of separate cycling facilities along heavily traveled roads and at intersections, combined with traffic calming of most residential neighborhoods. Extensive cycling rights of way in the Netherlands, Denmark, and Germany are complemented by ample bike parking, full integration with public transport, comprehensive traffic education and training of both cyclists and motorists, and a wide range of promotional events intended to generate enthusiasm and wide public support for cycling. In addition to their many pro-bike policies and programs, the Netherlands, Denmark, and Germany make driving expensive as well as inconvenient in central cities through a host of taxes and restrictions on car ownership, use, and parking. Moreover, strict land use policies foster compact, mixed-use developments that generate shorter and thus more bikeable trips. It is the coordinated implementation of this multi-faceted, mutually reinforcing set of policies that best explains the success of these three countries in promoting cycling. For comparison, the paper portrays the marginal status of cycling in the UK and USA, where only about one percent of trips are by bike.
Introduction
For readers in many countries, the title of this paper might sound so impossible as to
seem absurd. Most Britons and Americans, for example, must find cycling quite resistible
indeed, since they make only about one percent of their trips by bike. Cycling conditions in most
countries—including the UK and USA—are anything but safe, convenient, and attractive (Tolley
2003; McClintock, 2002; Pucher and Dijkstra, 2003; Pucher et al, 1999). Bicycling in much of
the industrialized world is a marginal mode of transport, occasionally used for recreational
Pucher and Buehler “Making Cycling Irresistible” Transport Reviews, Vol. 28, 2008
3
purposes but rarely used for practical, everyday travel needs. Moreover, the social distribution
of cycling tends to be very uneven, with young men doing most of the cycling, while women
cycle far less, and the elderly hardly cycle at all.
Thus, it may come as a surprise to skeptical readers that there are technologically
advanced, affluent countries that have managed to make cycling a mainstream mode of transport,
a perfectly normal way to get around cities. In the Netherlands, Germany, and Denmark, cycling
levels are more than ten times higher than in the UK and USA. Dutch, German, and Danish
women cycle as often as men, and rates of cycling fall only slightly with age. Moreover, cycling
is distributed evenly across all income groups. In the Netherlands, Germany, and Denmark,
cycling is truly for everyone and for all trip purposes.
Moreover, cycling in those countries is not viewed as requiring expensive equipment,
advanced training, or a high degree of physical fitness. Nor are cyclists forced to muster the
courage and willingness to battle motor vehicles on streets without separate bike lanes or paths.
On the contrary, Dutch, German, and Danish cyclists ride on simple, inexpensive bikes, almost
never wear special cycling outfits, and rarely use safety helmets. Even timid, risk-averse, and
safety-conscious individuals can be found cycling, unlike the many millions of Americans and
Britons who are terrified by the mere thought of getting on a bike.
As documented in this article, cycling was not always thriving in the Netherlands,
Germany, and Denmark. Cycling levels plummeted in all three countries from about 1950 to
1975 (Dutch Bicycling Council, 2006). It was only through a massive reversal in transport and
urban planning policies in the mid 1970s that cycling was revived to its current successful state.
In 1950, cycling levels were higher in the UK than they are now in Germany: almost 15% of all
trips. Just as in these other countries, cycling in the UK plummeted from 1950 to 1975, but

Pucher and Buehler “Making Cycling Irresistible” Transport Reviews, Vol. 28, 2008
4
British cycling never recovered. It continued to fall to its current level of 1.3% of trips, only
slightly higher than the 0.9% bike share of trips in the USA (Department for Transport, 2007;
U.S. Department of Transportation, 2003).
While history, culture, topography, and climate are important, they do not necessarily
determine the fate of cycling. Government policies are at least as important: transport policies,
land use policies, urban development policies, housing policies, environmental policies, taxation
policies, and parking policies. In many respects, the UK and USA have given the green light to
the private car, almost regardless of its economic, social, and environmental costs. In sharp
contrast, cycling has prospered in the Netherlands, Germany, and Denmark over the past three
decades precisely because these countries have given the red light, or at least the yellow warning
light, to private cars. Instead of catering to ever more motor vehicles by expanding roadways
and parking facilities, Dutch, German, and Danish cities have focused on serving people, making
their cities people-friendly rather than car-friendly, and thus more livable and more sustainable
than American, British, and Australian cities.
There are many good reasons to encourage more cycling. It causes virtually no noise or
air pollution and consumes far less nonrenewable resources than any motorized transport mode.
The only energy cycling requires is provided directly by the traveler, and the very use of that
energy offers valuable cardiovascular exercise. Cycling requires only a small fraction of the
space needed for the use and parking of cars. Moreover, cycling is economical, costing far less
than both the private car and public transport, both in direct user costs and public infrastructure
costs. Precisely because it is affordable by virtually everyone, cycling is among the most
equitable of all transport modes. In short, it is hard to beat cycling when it comes to
environmental, social, and economic sustainability. Consequently, both the European Union and

Pucher and Buehler “Making Cycling Irresistible” Transport Reviews, Vol. 28, 2008
5
the United States have officially recognized the importance of cycling as a practical mode of
urban transport and endorse the dual objectives of raising cycling levels while increasing cycling
safety (European Conference of the Ministers of Transport, 2004; U.S. Department of
Transportation, 1994 and 2004).
As shown in this paper, countries vary greatly in the degree to which these stated
objectives have been met. The Netherlands, Denmark, and Germany have been at the forefront
of policies to make cycling safe, convenient, and attractive, while the UK and USA have lagged
far behind. Differences between these countries in cycling levels are enlightening because all
five of them are democratic, capitalist, affluent societies with nearly universal car ownership.
The success of cycling does not depend on poverty, dictatorial regimes, or the lack of motorized
transport options to force people onto bikes. This paper shows how the Netherlands, Denmark,
and Germany have managed to make cycling a popular, mainstream way of getting around cities.
First, however, we document differences among countries in their overall levels of
cycling, in bike trip purposes, and in the gender, age, and income levels of cyclists. Differences
in cycling safety explain some of the difference in cycling levels among countries; thus, the
paper contains an entire section with comparisons of cycling fatality and injury rates and trends
over time. Subsequent sections summarize the range of policies and programs used in the
Netherlands, Denmark, and Germany to promote cycling by a broad spectrum of society and at
the same time improve cycling safety. The paper concludes with an overall assessment of the
lessons that can be learned from these countries to make cycling safer, more convenient, and
more attractive in other countries as well.

Pucher and Buehler “Making Cycling Irresistible” Transport Reviews, Vol. 28, 2008
6
Variations among Countries in Overall Cycling Levels
As shown in Figure 1, there are large differences between Australia, the United States,
Canada, and European countries in the bike share of trips, ranging from a low of 1% in Australia,
the UK, and the USA to 27% in the Netherlands. These differences in the bike share of trips
roughly parallel differences in the average distance cycled per person per day, an alternative way
of measuring and comparing cycling levels among countries. Averaging over the entire
population of each country, the European Conference of the Ministers of Transport (2004)
estimated that per capita cycling per day ranges from 0.1 km in Spain, Greece, and Portugal to
2.5 km in the Netherlands (see Figure 2). Denmark (1.6 km) and Germany (0.9 km) immediately
follow the Netherlands in distance cycled per inhabitant. The USA and UK are both at the low
end of the spectrum, averaging 0.1 km and 0.2 km of cycling per person per day, respectively.
These national averages hide large variations in cycling levels between cities within each
country, as shown in Figure 3. With only a few exceptions, however, even the most bike-
oriented cities in the UK, Australia, Canada, and USA generally have bike shares of travel that
are lower than the least bike-oriented cities in the Netherlands, Denmark, and Germany. No
British, Canadian, Australian, or American city even approaches the bike share of trips for most
Dutch and Danish cities. Only a few German cities have bike mode shares lower than 5%, while
all Canadian, Australian, and American cities, and most British cities, have bike shares that low.
These statistics on cycling levels reflect data from national ministries of transport, central
statistical bureaus, and supplementary city travel surveys. They are not entirely comparable
because travel surveys vary somewhat according to variable definitions, data collection method
and frequency, target population, sample size, and response rates (Kunert et al., 2002). At the
very least, however, such travel surveys facilitate approximate comparisons of different levels of

Pucher and Buehler “Making Cycling Irresistible” Transport Reviews, Vol. 28, 2008
7
cycling among countries and cities, and whatever their limitations, they are the best available
sources of information.
One might expect that Europeans cycle more than Americans due to shorter trip lengths
in European cities. Indeed, a considerably higher percentage of all trips in European cities are
shorter than 2.5 km: 44% in the Netherlands, 37% in Denmark, and 41% in Germany, compared
to 27% in the USA (Statistics Netherlands, 2007; National Statistical Office of Denmark, 2005;
German Federal Ministry of Transport, 2003; U.S. Department of Transportation, 2003). In the
UK, only 30% of trips are shorter than 2.5 km, much closer to the American level, perhaps due to
more extensive sprawl in Britain than in the Netherlands, Denmark, and Germany (Department
for Transport, 2007).
Even controlling for trip distance, however, the Dutch, Danes, and Germans make a
much higher percentage of their local trips by bike. As shown in Figure 4, both Americans and
Britons cycle for only 2% of their trips shorter than 2.5km, compared to 37% in the Netherlands,
27% in Denmark, and 14% in Germany. That pattern also holds for the progressively longer trip
distance categories shown in Figure 4. For trips between 2.5km and 4.4km, for example,
Americans and Britons make just 1% of their trips by bike, compared to much higher bike mode
shares for the same trip distance in the Netherlands (37%), Denmark (24%), and Germany
(11%).
Northern Europeans—even Britons—are far more likely than Americans to cycle for
practical, utilitarian purposes. Travel to work or school accounts for only 11% of all bike trips in
the USA, compared to 28% in Germany, 30% in the UK, 32% in the Netherlands, and 35% in
Denmark. Even more strikingly, shopping trips account for only 5% of all bike trips in the USA,
compared to 20% in Germany, 22% in the Netherlands, and 25% in Denmark (Department for
Pucher and Buehler “Making Cycling Irresistible” Transport Reviews, Vol. 28, 2008
8
Transport, 2007; Danish Ministry of Transport 2007; Netherlands Ministry of Transport, 2006;
German Ministry of Transport, 2004; U.S. Department of Transportation, 2003). Roughly three-
fourths of all bike trips in the USA are for recreation, compared to 38% in Germany, 35% in the
UK, 27% in the Netherlands, and only 10% in Denmark.
The Netherlands, Denmark, and Germany have been among the most successful countries
at promoting cycling for daily travel. Since all three countries are quite affluent, their high levels
of cycling are not due to an inability to afford more expensive transport modes. Indeed, levels of
car ownership in the three countries are among the highest in the world. The case of Germany is
particularly noteworthy. Although it has a much higher level of car ownership than the UK, the
bike share of trips in Germany is almost ten times higher in Germany than in the UK. Clearly,
high levels of car ownership do not preclude cycling. Thus, an examination of the successful
pro-cycling policies and programs in the Netherlands, Denmark, and Germany may provide
especially useful lessons for increasing cycling in other countries with high incomes and
widespread car ownership.
One can view the same information in another light. As shown in Figure 5, car
ownership per capita has increased in the Netherlands, Denmark, and Germany over the past few
decades but remains much lower than in the USA. That is partly due to high taxes on car
ownership and use in most European countries. But it is also due to excellent alternatives to the
private car in the Netherlands, Denmark, and Germany, including cycling as well as walking and
public transport. As is most evident in Denmark and the Netherlands, safe and convenient
cycling reduces the need for car ownership.
Some readers might assume that bicycling levels in Europe have been consistently high.
In fact, cycling fell sharply during the 1950s and 1960s, when car ownership surged and cities
Pucher and Buehler “Making Cycling Irresistible” Transport Reviews, Vol. 28, 2008
9
started spreading out. From 1950 to 1975, the bike share of trips fell by roughly two-thirds in a
sample of Dutch, Danish, and German cities, from 50-85% of trips in 1950 to only 14-35% of
trips in 1975 (Dutch Bicycling Council, 2006). Similarly, a study by the City of Berlin (2003)
found that the number of bike trips there fell by 78% from 1950 to 1975. During that 25-year
period, cities throughout the Netherlands, Denmark, and Germany focused on accommodating
and facilitating increased car use by vastly expanding roadway capacity and parking supply,
while largely ignoring the needs of pedestrians and cyclists (Hass-Klau, 1990).
In the mid-1970s, transport and land use policies in all three countries shifted
dramatically to favor walking, cycling, and public transport over the private car. The policy
reform was a reaction to the increasingly harmful environmental, energy, and safety impacts of
rising car use (Dutch Bicycling Council, 2006; European Conference of the Ministers of
Transport, 2004; Pucher, 1997; Hass-Klau, 1990). Most cities improved their bicycling
infrastructure while imposing restrictions on car use and making it more expensive. That policy
reversal led to turnarounds in the previous decline of bike use. From 1975 to 1995, the bicycling
share of trips in the same, previously cited sample of Dutch, Danish, and German cities rose by
roughly a fourth, resulting in 1995 bike shares of 20-43%. In Berlin, the total number of bike
trips nearly quadrupled from 1975 to 2001 (increasing by 275%), reaching 45% of the 1950
bicycling level (City of Berlin, 2003). The rebound in cycling from 1975 onward was not
enough to offset the huge declines from 1950 to 1975. Nevertheless, it was a significant
accomplishment and provides evidence of the powerful impact of policy on travel behavior. It is
especially impressive given continuing growth in per-capita income, car ownership and suburban
development in all three countries over the past three decades.

Pucher and Buehler “Making Cycling Irresistible” Transport Reviews, Vol. 28, 2008
10
The Netherlands and the UK provide striking contrasts in their long-term cycling trends
(see Figure 6). Over the period 1952 to 1975, cycling in the UK fell by 80%, compared to a drop
of 62% in the Netherlands. Cycling in both countries rebounded somewhat during the ten years
from 1975 to 1985. In the next 20 years, however, cycling resumed its long-term decline in the
UK, whereas cycling levels continued to increase in the Netherlands. The overall result is that
by 2006, the cycling level in the UK was less than a seventh of its 1952 level (13%), while
cycling in the Netherlands was at slightly more than half of its 1952 level (52%).
Analysis of nationwide aggregate data for the past few decades confirms a rebound in
cycling in the Netherlands, Denmark, and Germany since the 1970s. As shown in Figure 7,
average daily kilometers cycled per inhabitant rose in all three countries from 1978 to 2005:
from 0.6 to 1.0 in Germany, from 1.3 to 1.6 in Denmark, and from 1.7 to 2.5 in the Netherlands.
In both the Netherlands and Denmark, the strongest growth in cycling was from the mid 1970s
until the early 1990s. By comparison, average daily kilometers cycled in the UK have fallen
almost continuously since 1978, declining by a third: from 0.25 to 0.18.
Not only do the Netherlands, Denmark, and Germany have high and growing levels of
cycling, but their cyclists comprise virtually all segments of society (see Figure 8). Women are
just about as likely to cycle as men, making 45% of all bike trips in Denmark, 49% in Germany,
and 55% in the Netherlands. While cycling is gender-neutral in those three countries, men
dominate cycling in the UK and USA, where they make 72% and 76% of all bike trips,
respectively.
Another dimension of cycling’s universality in the Netherlands, Denmark, and Germany
is the representation of all age groups. Children and adolescents have the highest rates of cycling
in almost every country. As shown in Figure 9, however, cycling levels in the Netherlands,

Pucher and Buehler “Making Cycling Irresistible” Transport Reviews, Vol. 28, 2008
11
Denmark, and Germany remain high even among the elderly. In Germany, the bike share of
trips rises steadily from 7% among 18-24-year-olds to 12% for those 65 and older. The bike
share of trips declines with age in Denmark, but even among those aged 70-74 years old, cycling
accounts for 12% of all trips, the same as among Germans who are 65 and older. The Dutch
elderly double that percentage, making 24% of all their trips by bike.
Cycling rates are low for all age groups in the USA, but they also decline with age: from
3.2% among children 5-15 years old to only 0.4% of trips for those 40 and older (see Figure 9).
Similarly, the bike share of trips falls from 2% among British children to 1% among older age
groups. The bike share of trips for the Dutch elderly is 24 times higher than for British elderly
and 60 times higher than for American elderly. The bike share of trips for both the German and
Danish elderly is 12 times higher than for British elderly and 30 times higher than for American
elderly.
Rates of cycling are similar across different income classes, not only in the Netherlands,
Denmark and Germany, but also in the UK and USA (Danish Ministry of Transport, 2007;
Statistics Netherlands, 2007; Department for Transport, 2006; German Federal Ministry of
Transport, 2003; U.S. Department of Transportation, 2003). In the Netherlands, Germany and
the UK, low-income groups cycle only slightly more than high-income groups. By comparison,
the poor in the USA cycle for a slightly lower percentage of their trips than the affluent, but the
difference is negligible (0.8% vs. 0.9%). Thus, cycling appears to be the most equitable of all
transport modes, at least in terms of usage across income classes.
The remainder of this article examines how Germany, the Netherlands, and Denmark
have succeeded in making cycling a safe and convenient way to get around their cities.

Pucher and Buehler “Making Cycling Irresistible” Transport Reviews, Vol. 28, 2008
12
Trends in Cycling Safety
Perhaps the most important reason for the higher levels of cycling in the Netherlands,
Denmark, and Germany—especially among women, children, and the elderly—is that cycling is
much safer there than in the USA and the UK. Both fatality and injury rates are much higher for
cyclists in the USA and the UK than in Germany, Denmark, and the Netherlands. Averaged over
the years 2002 to 2005, the number of bicyclist fatalities per 100 million km cycled was 5.8 in
the USA and 3.6 in the UK, compared to 1.7 in Germany, 1.5 in Denmark, and 1.1 in the
Netherlands (see Figure 10). Thus, cycling is over five times as safe in the Netherlands as in the
USA and more than three times as safe as in the UK. That might explain why the Dutch do not
perceive cycling as a dangerous way to get around. Cycling in Germany and Denmark is not
quite as safe as in the Netherlands, but it is 3-4 times safer than in the USA and twice as safe as
in the UK.
Serious cycling injuries outnumber cycling fatalities roughly ten-fold in most countries
(Organisation for Economic Cooperation and Development, 2007). Thus, it is important to
consider non-fatal injury rates as well. Figure 10 compares non-fatal injury rates per 10 million
km cycled side by side with fatality rates per 100 million km cycled. For all five countries, these
statistics rely on police reports. Without exception, the cycling safety ranking for countries is the
same for injuries as for fatalities. Thus, the Netherlands has the lowest non-fatal injury rate as
well as the lowest fatality rate, while the USA has the highest non-fatal injury rate as well as the
highest fatality rate. Indeed, the non-fatal injury rate for the USA is about eight times higher
than for Germany and about 30 times higher than for the Netherlands and Denmark. The injury
rate in the UK is second highest, but much lower than in the USA.
Pucher and Buehler “Making Cycling Irresistible” Transport Reviews, Vol. 28, 2008
13
The cyclist injury rate for the USA seems extremely high relative to the other countries.
Yet it vastly underestimates total cycling injuries. It only includes cycling injuries resulting from
crashes with motor vehicles on roadways and reported by the police (U.S. Department of
Transportation, 2007). By comparison, the Center for Disease Control and Prevention (2007),
the official public health agency of the U.S. Government, reports ten times more cycling injuries
per year (479,963 vs. 45,000 in 2005), based on reports from emergency rooms of hospitals. As
documented by the Organisation for Economic Cooperation and Development (2007), the
official statistics of other countries also underestimate total cyclist injuries to varying degrees.
The documented 10-fold underreporting in the USA highlights the poor and variable quality of
data on cycling injuries.
There are always problems comparing injury statistics across different countries because
of differences in definitions and methodologies of data collection (Pucher and Dijkstra, 2000 and
2003). Whether a cycling injury is reported in official statistics depends on the type of injury,
where it occurs, whether it involves a motor vehicle, and whether it requires emergency medical
assistance or a hospital visit. Many, if not most, cycling injuries are not reported at all. Even
serious cycling injuries are underreported, as shown by the American case. Thus, the cycling
injury rates reported in Figure 10 are less accurate and less comparable than the corresponding
fatality rates. Nevertheless, both measures indicate much safer cycling in the Netherlands and
Denmark than in the UK and the USA, with Germany in between.
As shown in Figure 11, Germany, Denmark, and the Netherlands have greatly improved
cycling safety since 1970. Although levels of cycling have increased in all three countries over
the past 35 years (as already shown in Figure 7), the total number of cycling fatalities has
declined by over 70%. Fatalities fell by 60% in the UK over the same period, but the amount of

Pucher and Buehler “Making Cycling Irresistible” Transport Reviews, Vol. 28, 2008
14
cycling also decreased. The least improvement in cycling safety has been in the USA, where
fatalities fell by only 30%.
Longer-term data are available for the Netherlands. They dramatically portray the strong
relationship between cycling safety and levels of cycling (see Figure 12). During the 1950s and
1960s, car use rose rapidly in the Netherlands. Insufficient supply of both roadways and separate
cycling facilities generated dangerous traffic conflicts and an alarming increase in cycling
fatalities (Dutch Bicycling Council, 2006; Netherlands Ministry of Transport, 2006). As the
cyclist fatality rate per billion km cycled rose by 174% from 1950 to 1978, the average km
cycled per inhabitant fell by 65%. Since the mid-1970s, Dutch cities have undertaken massive
improvements to cycling infrastructure and restricted car use (Netherlands Ministry of Transport,
1999 and 2006). The result has been an 81% fall in the cyclist fatality rate from 1978 to 2006,
thus encouraging a 36% increase in km cycled per inhabitant. This statistical relationship, of
course, does not prove causation, but there is every reason to believe that increased safety is a
key to promoting more cycling (Rietveld and Daniel, 2004).
There is also reason to believe that more cycling facilitates safer cycling. The
phenomenon of ‘safety in numbers’ has consistently been found to hold over time and across
cities and countries. Fatality rates per trip and per km are much lower for countries and cities
with high bicycling shares of total travel, and fatality rates fall for any given country or city as
cycling levels rise (Jacobsen, 2003).
Most surveys show that the perceived traffic danger of cycling is an important deterrent
to more widespread cycling (Dutch Bicycling Council, 2006; Noland, 1994). Women and the
elderly appear to be especially sensitive to such traffic danger. Many American parents do not
allow their children to cycle for the same reason. As shown in Figure 10, cycling in the USA is

Pucher and Buehler “Making Cycling Irresistible” Transport Reviews, Vol. 28, 2008
15
indeed dangerous in comparison with other countries. Thus, making cycling safer is surely one
of the keys to increasing overall cycling levels in the USA, particularly among women, the
elderly, and children.
In the USA, much of the effort to improve cyclist safety has focused on increasing helmet
use, if necessary by law, especially for children. Thus, it is important to emphasize that the
much safer cycling in northern Europe is definitely not due to widespread use of safety helmets.
On the contrary, in the Netherlands, with the safest cycling of any country, less than one percent
of adult cyclists wear helmets, and even among children, only 3-5% wear helmets (Dutch
Bicycling Council, 2006; Netherlands Ministry of Transport, 2006). The Dutch cycling experts
and planners interviewed for this paper adamantly opposed the use of helmets, claiming that
helmets discourage cycling by making it less convenient, less comfortable, and less fashionable.
They also mention the possibility that helmets would make cycling more dangerous by giving
cyclists a false sense of safety and thus encouraging riskier riding behavior. At the same time,
helmets might reduce the consideration motorists give cyclists, since they might seem less
vulnerable if wearing helmets (Walker, 2007).
German and Danish cycling planners seem far more supportive of increased helmet use,
especially among children (Andersen, 2005; Boehme, 2005; City of Muenster, 2004; German
Federal Ministry of Transport, 2002; Danish Ministry of Transport, 2000). There have been
extensive promotional campaigns in these two countries to encourage more helmet use, but there
are no laws requiring helmet use, not even for young children. In 2002, 33% of German
children aged 6-10 years wore helmets while cycling, compared to 9% of adolescents aged 11-
16, and 2% of Germans aged 17 or older. In 2006, 66% of Danish school children aged 6-10
Pucher and Buehler “Making Cycling Irresistible” Transport Reviews, Vol. 28, 2008
16
wore helmets, compared to 12% among school children 11 years or older, and less than 5%
among adults.
Government Roles in Funding and Planning Cycling Facilities and Programs in the Netherlands, Denmark, and Germany
Due to the mostly local, short-distance trips made by bike, policies and programs to
promote safe and convenient cycling are usually carried out at the municipal level (European
Conference of the Ministers of Transport, 2004). Local governments in the Netherlands,
Germany, and Denmark have been planning, constructing, and funding bicycling facilities for
many decades, at least since the 1970s but much earlier in some cities. Municipalities are
responsible for making the specific plans that reflect the particular conditions and needs of the
local context. Cycling training, safety, and promotional programs are usually carried out at the
local level as well, even if they are mandated and funded by higher levels. At the intermediate
level, states, counties, and regional governments provide additional policy guidance,
coordination, and funding, as well as some direct planning and construction of cycling facilities
that serve rural areas or provide links between municipalities.
Central government involvement in cycling has been more recent, evolving gradually
since about 1980 and providing overall goals, design guidelines, research support, model
projects, coordination, and funding. The Netherlands, Denmark, and Germany all have official
National Bicycling Master Plans (German Federal Ministry of Transport, 2002; Danish Ministry
of Transport, 2000; Netherlands Ministry of Transport, 1999). Each of these plans sets forth the
overall goal of raising levels of cycling for daily travel while improving cycling safety. They
also propose various strategies to achieve these dual goals: better design of lanes, paths, and
intersections; more and better bike parking; coordination with public transport; and cycling
safety and promotion campaigns. Although the Master Plans vary from one country to another,
Pucher and Buehler “Making Cycling Irresistible” Transport Reviews, Vol. 28, 2008
17
they generally focus on the federal government’s role in fostering research, dissemination of best
practice information, and funding and evaluation of a wide range of experimental, innovative
projects.
Federal governments usually bear the cost of bicycling facilities built along national
highways and contribute significantly to financing long-distance bicycling routes that cross state
boundaries (European Conference of Ministers of Transport, 2004). In Germany, for example,
the federal government contributed over €1.1 billion to doubling the extent of bikeways along
federal highways from 1980 to 2000, and is now devoting €100 million per year for further
bikeway extensions, cycling research, and demonstration projects. In addition, about €2 billion a
year in revenues from the motor fuel tax are earmarked for a special urban transport investment
fund, which provides 70-85% federal matching funds for state and local governments wanting to
build cycling facilities (paths, lanes, bridges, traffic signals, signs, parking, etc.). From 1990 to
2006, the Dutch Central Government contributed an average of €60 million per year to various
cycling projects, including €25 million per year specifically for bike parking at train stations. In
addition, the Dutch Central Government provides €1.8 billion a year for provinces to spend on
transport projects, including cycling facilities. By comparison, the Danish Central Government
has no regular funding for cycling projects but since 2000 has contributed about €2 million a
year to various demonstration projects.
The European Union (EU) has been playing a modest but increasing role in promoting
cycling (European Conference of Ministry of Transport, 2004). Its Interreg program, for
example, helps finance transnational and cross-border bikeway projects. That EU funding fits in
nicely with the European Cyclists’ Federation’s (ECF) VeloEuro program to expand and
integrate long-distance bicycling routes throughout Europe. The EU contributes toward the

Pucher and Buehler “Making Cycling Irresistible” Transport Reviews, Vol. 28, 2008
18
funding of missing bike route connections between countries and of cycling facilities in
underdeveloped regions. The EU also facilitates bicycling research and the exchange of best
practice information among EU countries, just as national governments do this within each
country.
How to Make Cycling Safe and Convenient Many policies and programs are necessary to make cycling safe and feasible for a broad
spectrum of the population. Table 1 summarizes seven categories of measures that have been
widely adopted in Dutch, Danish and German cities. Their success in making cycling so
appealing is largely attributable to the coordinated implementation of all of these measures, so
that they reinforce the impact of each other in promoting cycling. Indeed, that is perhaps the key
lesson to be learned: the necessity of a coordinated, multi-faceted approach.
Due to space limitations, we can only provide a few details to describe the nature and
extent of the seven types of measures. The following discussion serves mainly to provide some
representative examples of what Dutch, Danish, and German cities have been doing to raise
cycling levels and make it safer. Most of the information cited below was provided directly to
the authors by bicycling coordinators and planners in the ministries of transport of the
Netherlands, Denmark, and Germany and in two case study cities in each country (Amsterdam
and Groningen; Copenhagen and Odense; Berlin and Muenster).
Bike Paths and Lanes. Especially from the mid-1970s to the mid-1990s, separate
facilities such as bike paths and lanes expanded greatly in all three countries. In Germany, the
bikeway network more than doubled in length, from 12,911km in 1976 to 31,236km in 1996
(German Federal Ministry of Transport, 1998). In the Netherlands, the bikeway network
doubled in length, from 9,282km in 1978 to 18,948km in 1996 (Pucher and Dijkstra, 2000;
Pucher and Buehler “Making Cycling Irresistible” Transport Reviews, Vol. 28, 2008
19
Statistics Netherlands, 1999). Nationwide, aggregate statistics for the period since the mid 1990s
are not available, but data for individual cities suggest continued expansion, albeit at a much
slower rate than previously. The main focus now appears to be on improving the specific design
of cycle paths and lanes to improve safety.
In 2004, for example, Berlin (3.4 million inhabitants) had 860km of completely separate
bike paths, 60km of bike lanes on streets, 50km of bike lanes on sidewalks, 100km of mixed-use
pedestrian-bike paths, and 70km of combined bus-bike lanes on streets (City of Berlin, 2007) .
Amsterdam (735,000 inhabitants) and Copenhagen (504,000 inhabitants) each have roughly
400km of completely separate bike paths and lanes (City of Amsterdam, 2003a; City of
Copenhagen, 2004). Even much smaller cities, however, have extensive cycling facilities. For
example, there are 320km of bike paths and lanes in Muenster, Germany (278,000 inhabitants),
over 500km in Odense, Denmark (185,000 inhabitants), and over 420km in Groningen,
Netherlands (181,000) (City of Odense, 2007; Dutch Bicycling Council, 2006; City of Muenster,
2004).
The bicycling networks in all these cities include numerous off-street short cut
connections for cyclists between streets and traversing city blocks to enable them to take the
most direct possible route from origin to destination. The result of such a wide range of facilities
is a complete, integrated system of bicycling routes that permit cyclists to cover almost any trip
either on completely separate paths and lanes or on lightly traveled, traffic-calmed residential
streets.
Not only has the network of separate cycling facilities greatly expanded since the 1970s,
but their design, quality, and maintenance have continually improved to ensure safer, more
convenient, and more attractive cycling with each passing year. In addition, many cities in the

Pucher and Buehler “Making Cycling Irresistible” Transport Reviews, Vol. 28, 2008
20
Netherlands, Denmark, and Germany have established a fully integrated system of directional
signs for cyclists, color-coded to correspond to different types of bike routes. That system of
signage often extends to entire regions, states, and even countries for long-distance routes (City
of Muenster, 2007; Andersen, 2005; City of Copenhagen, 2002).
All large cities and most medium-sized cities in the Netherlands, Denmark, and Germany
provide detailed maps of their cycling facilities. Some cities have recently introduced Internet
bike route planning to assist cyclists in choosing the route that best serves their needs. In Berlin
and Odense, for example, cyclists can enter their origin and destination as well as a range of
personal preferences, such as speed, on-street or off-street facility, avoiding intersections and
heavy traffic, etc. (City of Berlin, 2007; Andersen, 2005). The Internet program shows the
optimal route on a map and provides all relevant information about time, average speed, bike
parking, and public transport connections. This bike route planning is even possible while en
route, using the LCD display of a mobile phone.
The provision of separate cycling facilities is undoubtedly the cornerstone of Dutch,
Danish, and German policies to make cycling safe and attractive. They are designed to feel safe,
comfortable, and convenient for both young and old, for women as well as men, and for all levels
of cycling ability. Separate facilities are not sufficient but they are certainly necessary to ensure
that cycling is possible for a broad spectrum of the population (Garrard et al., 2007).
Traffic Calming. It is neither possible nor necessary to provide separate bike paths and
lanes on lightly traveled residential streets, but they constitute an important part of the overall
cycling route network. Thus, Dutch, Danish, and German cities have traffic-calmed most streets
in residential neighborhoods, reducing the legal speed limit to 30km/hr (19mph) and often
prohibiting any through traffic. In addition, many cities—especially in the Netherlands—

Pucher and Buehler “Making Cycling Irresistible” Transport Reviews, Vol. 28, 2008
21
introduced considerable alterations to the streets themselves, such as road narrowing, raised
intersections and crosswalks, traffic circles, extra curves and zigzag routes, speed humps, and
artificial deadends created by mid-block street closures. Cycling is almost always allowed in
both directions on all such traffic-calmed streets, even when they are restricted to one-way travel
for cars. That further enhances the flexibility of bike travel (City of Berlin, 2007; City of
Groningen, 2007; City of Odense, 2007; Boehme, 2005).
The most advanced form of traffic calming—the “woonerf” or “home zone”—imposes
even more restrictions, requiring cars to travel at walking speed. Pedestrians, cyclists, and
playing children have as much right to use such residential streets as motor vehicles; indeed,
motor vehicles are required to yield to non-motorized users.
In the Netherlands, Denmark, and Germany, traffic calming is usually area-wide and not
for isolated streets. That ensures that thru-traffic gets displaced to arterial roads designed to
handle it and not simply shifted from one residential street to another.
Related to traffic calming, almost every city has created extensive car-free zones in their
centers, mainly intended for pedestrian use but generally permitting cycling during off-peak
hours (City of Muenster, 2004; City of Amsterdam, 2003b; City of Copenhagen, 2002). In some
Dutch cities, these car-free zones specifically include cycling facilities such as bike lanes and
parking (Dutch Bicycling Council, 2006). The combination of traffic calming of residential
streets and prohibition of cars in city centers makes it virtually impossible in some cities for cars
to traverse the city center to get to the other side. Cars are forced to take various circumferential
routes instead, thus mitigating the congestion, pollution, and safety problems they would cause in
dense city centers.
Pucher and Buehler “Making Cycling Irresistible” Transport Reviews, Vol. 28, 2008
22
Another kind of traffic calming is the so-called “bicycle street,” which has been
increasingly adopted in Dutch and German cities. These are narrow streets where cyclists are
given absolute traffic priority over the entire width of the street. On normal streets, cyclists are
usually expected to keep as far to the curb (or lane of parked cars) as possible, so as not to
interfere with motor vehicle traffic. On bicycling streets, however, cyclists can ride anywhere
they want, even if that means obstructing cars. Cars are usually permitted to use the streets as
well, but they are limited to 30km/hr (or less) and must yield to cyclists and give special
consideration to avoid endangering them. In Muenster, for example, there were already 12
bicycling streets in 2007, and they have been so successful that the city has plans to add another
10 bicycling streets in the coming years (City of Muenster, 2007).
Traffic calmed residential neighborhoods, car-free city centers, and special bicycle streets
all greatly enhance the overall bicycling network in Dutch, Danish, and German cities. Most
importantly, they offer much safer, less stressful cycling than streets filled with fast-moving
motor vehicles. Since most bike trips start at home, traffic calming of neighborhood streets is
crucial to enabling bike trips to start off in a safe, pleasant environment on the way to the
separate bike paths and lanes that serve the rest of the trip.
The available empirical evidence shows that traffic calming improves overall traffic
safety. The benefits tend to be greatest for pedestrians, but serious cyclist injuries also fall
sharply. Moreover, most studies report large increases in overall levels of walking and cycling.
There are, of course, many different kinds of traffic calming. It is conceivable that one or
another specific kind of traffic calming measure (perhaps roundabouts or speed humps) might
detract from cycling safety in some circumstances. Overall, however, the evidence is
overwhelming that traffic calming enhances both pedestrian and cyclist safety by reducing

Pucher and Buehler “Making Cycling Irresistible” Transport Reviews, Vol. 28, 2008
23
speeds on secondary roads (Morrison et al., 2004; Transport for London, 2003; Webster et al.,
1996; Herrstedt, 1992).
Intersection modifications. While bike paths and lanes help protect cyclists from
exposure to traffic dangers between intersections, they can pose safety problems when crossing
intersections. Thus, Dutch, Danish, and German planners have worked continuously on
perfecting the designs of intersections to facilitate safe cyclist crossings (Dutch Bicycling
Council, 2006; City of Berlin, 2003; City of Copenhagen, 2002). The extent and specific design
of intersection modifications vary, of course, from city to city, but they generally include many
of the following:
• Special bike lanes leading up to the intersection, with advance stop lines for cyclists, far
ahead of waiting cars
• Advance green traffic signals for cyclists, and extra green signal phases for cyclists at
intersections with heavy cycling volumes
• Turn restrictions for cars, while all turns allowed for cyclists
• Highly visible, distinctively colored bike lane crossings at intersections
• Special cyclist-activated traffic lights
• Timing traffic lights to provide a “green wave” for cyclists instead of for cars, generally
assuming 14-22km/hr bike speed, depending on type of route
• Insertion of traffic islands and bollards in roadway to sharpen turning radius of cars and
thus force them to slow down when turning right
• Realigning bike pathways a bit further away from their parallel streets when they
approach intersections to help avoid collisions with right-turning cars

Pucher and Buehler “Making Cycling Irresistible” Transport Reviews, Vol. 28, 2008
24
Given the very nature of roadway intersections, it is virtually impossible to avoid all conflicts
between motor vehicles and cyclists, but Dutch, Danish, and German planners have done a
superb job of minimizing these dangers.
Bike Parking. Extensive bike parking of various sorts is available throughout most
Dutch, Danish, and German cities. Local governments and public transport systems themselves
directly provide a large number of bike parking facilities. Moreover, private developers and
building owners are required by local ordinances to provide specified minimum levels of bike
parking both within and adjacent to their buildings (Dutch Bicycling Council, 2006; City of
Berlin, 2005).
Aside from the large number of bike racks throughout these cities, the most visible and
most innovative aspect of bike parking policy is the provision of state-of-the-art parking facilities
at train stations. Immediately adjacent to Muenster’s main train station, for example, there is a
modern, attractive “bike station” (built in 1999) that offers secure, indoor parking for 3,300 bikes
as well as bike repairs, bike rentals, and direct access to all train platforms (Boehme, 2005).
Amsterdam, Groningen, and Odense offer similar, high-capacity bike parking facilities at their
main train stations (City of Odense, 2007; City of Groningen, 2007; Langenberg, 2000).
Moreover, virtually every train station throughout Dutch, Danish, and German metropolitan
areas offers bike parking of some sort. In the Berlin region, there were 24,600 bike-and-ride
parking spots at train stations in 2005 (including metro, suburban rail, and regional rail), with
7,000 additional bike parking spots planned by 2010 (City of Berlin, 2007).
Many city centers also offer special bike parking facilities. The City of Odense, for
example, recently added 400 sheltered bike racks near its main shopping area as well as a state-
of-the-art automatic, secure parking station (Andersen, 2005). Groningen offers 36 major bike

Pucher and Buehler “Making Cycling Irresistible” Transport Reviews, Vol. 28, 2008
25
parking facilities in its town center, including seven that are guarded to prevent bike theft (Dutch
Bicycling Council, 2006). Amsterdam has 15 guarded bike parking facilities in its downtown
shopping area (City of Amsterdam, 2007). In 2007, Muenster added a secured, indoor parking
facility for 290 bikes adjacent to its main shopping district (City of Muenster, 2007). The City of
Copenhagen installed 3,300 bike parking spaces in the town center to facilitate cycling for
shopping and entertainment trips (City of Copenhagen, 2007).
Clearly, the provision of convenient, secure, sheltered bike parking is essential to cyclists,
just as car drivers need parking for their cars. The current policy focus in Dutch, Danish, and
German cities is to increase the security of bike parking, since bike theft is a major problem.
The random parking of bikes in public spaces can obstruct pedestrians on sidewalks and
is considered by some to be a visual eyesore. Thus, the supply of bike parking is being expanded
not only for greater cyclist convenience but also to deal with the clutter of randomly parked
bikes. Somewhat similar to car parking in the USA, there never seems to be enough bike
parking. In spite of Muenster’s superb bike parking facility at the main train station, for
example, there are still over 10,000 bikes parked in the nearby sidewalks, plazas, and alleys, and
most of those are not in racks (City of Muenster, 2004).
Integration with Public Transport. Most Dutch, Danish and German cities have
integrated cycling with public transport. Public transport systems and city planners in northern
Europe have increasingly recognized the key role that bicycling plays as a feeder and distributor
service for public transport. Thus, copious bike parking is provided at train stations in the city
center as well as at outlying stations along the rail network (North-Rhine Westphalia Ministry of
Transport, 2004). In cities such as Muenster, many suburban residents use a bike to reach the
nearest suburban rail station, park it there, and then take the train to the city center, where they

Pucher and Buehler “Making Cycling Irresistible” Transport Reviews, Vol. 28, 2008
26
continue their trip with another bike they have parked at the main train station (City of Muenster,
2004). Most rail systems charge an additional fee for cyclists to take their bikes on suburban
trains, metros, and trams. Moreover, many systems prohibit bikes on vehicles during rush hours,
and even if permitted, it can sometimes be less convenient than keeping bikes at parking
facilities at both ends of the trip.
Most Dutch, Danish, and German cities we surveyed do not permit bikes to be taken
onboard regular city buses, and most buses do not come equipped with bike racks (City of
Amsterdam, 2007). That contrasts starkly with the USA, where over 50,000 urban transit buses
in 2007 had bike racks to facilitate bike and ride (American Public Transportation Association,
2007). It appears to be the one area where American transit systems do a better job of
coordinating cycling with transit. The northern European approach is to provide bike parking
facilities at major bus terminals, bus route interchanges, and even some suburban bus stops.
Bike-and-ride facilities at bus stops are not nearly as extensive, secure, and comfortable as those
at rail stations, but they help offset the lack of bike racks on buses.
Another form of bike-transit integration is the provision of bike rentals at virtually every
major Dutch, Danish, and German train station and many suburban stations as well. The German
Railways “Call a Bike” program in Berlin is especially innovative. It permits anyone with a
mobile phone and credit card to rent one of more than 3,000 German Rail bikes placed all over
the city. One simply calls up the “Call a Bike” number, provides credit card information
(charged per minute of bike use), and then receives the access code used to unlock the bike
(German Railways, 2007). The bike can be left at many different locations throughout the city
instead of being returned to the point of origin. The same “Call a Bike” service is offered by

Pucher and Buehler “Making Cycling Irresistible” Transport Reviews, Vol. 28, 2008
27
German Railways in other major cities such as Hamburg, Cologne, Frankfurt, and Munich, with
a total of over 10,000 such rental bikes.
There is an even more extensive public transport bike program in the Netherlands. In
2007, over a hundred Dutch railway stations provided quick and easy discount bike rentals,
operated by OV-Fiets. Payment is made via a special account linked to a season ticket for public
transport or a special OV-Fiets membership card (OV-Fiets, 2007).
Training and Education. Dutch, Danish, and German children receive extensive
training in safe and effective cycling techniques as part of their regular school curriculum. Most
children complete such a course by the fourth grade. It includes both classroom instruction and
“on the road” lessons, first on a cycling training track just for children, and then on regular
cycling facilities throughout the city. Real police officers test the children, who receive official
certificates, pennants, and stickers for their bikes if they pass the test. Since many children get to
school by bike, training in safe cycling is considered essential to ensure their safety (German
Federal Ministry of Transport, 2002). But it also gets kids off to a lifetime of safe cycling skills.
And since all schoolchildren are included, it means that girls as well as boys start cycling at an
early age.
Another crucial element in cyclist safety is training motorists to be aware of cyclists on
the roadway and to avoid endangering them. In general, motorist training in the Netherlands,
Denmark, and Germany is far more extensive, more thorough, and more expensive than in the
USA. Motorists are legally responsible for collisions with children and elderly cyclists
(Netherlands Ministry of Transport, 2006; German Federal Ministry of Transport, 2002), even if
they are jaywalking, cycling in the wrong direction, ignoring traffic signals, or otherwise
behaving contrary to traffic regulations. The priority legal status of non-motorists puts motorists

Pucher and Buehler “Making Cycling Irresistible” Transport Reviews, Vol. 28, 2008
28
on the defensive and forces them to drive with special attention to avoiding endangering cyclists
and pedestrians.
Traffic Laws. As suggested by the previous section, traffic laws in the Netherlands,
Denmark, and Germany give special consideration to the especially vulnerable situation of
cyclists vis-à-vis motor vehicles (German Federal Ministry of Transport, 2006). Thus, they
generally require the motorist to make special efforts to anticipate potentially dangerous
situations and pro-actively avoid hitting cyclists. Moreover, motorists are generally assumed to
be legally responsible for most collisions with cyclists unless it can be proven that the cyclist
deliberately caused the crash. Having the right of way by law does not excuse motorists from
hitting cyclists, especially children and elderly cyclists.
For the most part, traffic laws intended to protect cyclists and pedestrians from motor
vehicles are far more strictly enforced by the police and courts in the Netherlands, Denmark, and
Germany than in the USA. Moreover, cyclists disobeying traffic laws are also more likely to be
ticketed than in the USA. In combination with comprehensive and rigorous training of motorists
and cyclists, the strict enforcement of traffic laws surely contributes to safer driving behavior by
motorists and safer cycling by cyclists.
Promotional Events. Although the provision of safe and convenient cycling facilities is
the key approach to promoting cycling, virtually all Dutch, Danish, and German cities have
various programs to stimulate interest and enthusiasm for cycling by all groups. Table 2 includes
a partial listing of typical promotional measures used by six cities we specifically surveyed:
Amsterdam and Groningen (Netherlands), Copenhagen and Odense (Denmark), and Berlin and
Muenster (Germany). There were many other creative and interesting programs as well, but
Table 2 conveys the sorts of promotional measures undertaken.

Pucher and Buehler “Making Cycling Irresistible” Transport Reviews, Vol. 28, 2008
29
Promotional activities tend to be more extensive in Denmark and Germany than in the
Netherlands, where cycling levels are already so high that the focus is more on safer cycling than
on more cycling, although the two are directly related, as noted earlier.
Complementary taxation, parking, and land-use policies
Most of the above policies refer to measures that make cycling safer and more
convenient. Many other important government policies encourage cycling indirectly. Several
different categories of such complementary policies are listed in Table 3.
For example, many Dutch, Danish, and German cities impose a range of restrictions on
car use, including limits on speeds, turns, direction of travel, and in some cases prohibit car use
altogether, such as in car-free zones. Similarly, the provision of road capacity and parking
facilities is far less generous than in American cities (Transportation Research Board, 2001;
Newman and Kenworthy, 1999). Indeed, roadway and parking supply has been deliberately
reduced in many Dutch, Danish, and German cities over the past few decades in order to
discourage car use in the city center (Dutch Bicycling Council, 2006). The many restrictions on
car use and parking reduce the relative speed, convenience, and flexibility of car travel compared
to cycling (Rietveld and Daniel, 2004).
Moreover, sales taxes on petrol and new car purchases, import tariffs, registration fees,
license fees, driver training fees, and parking fees are generally much higher in Europe than in
the USA (European Union, 2006; Transportation Research Board, 2001; Nivola, 1999; Pucher,
1995). That results in overall costs of car ownership and use two to three times higher in Europe.
That higher cost discourages car use to some extent and thus promotes alternative ways of
getting around, including cycling, which is surely one of the cheapest of transport modes.

Pucher and Buehler “Making Cycling Irresistible” Transport Reviews, Vol. 28, 2008
30
Finally, land use and urban design policies in Dutch, Danish, and German cities are
generally much stricter than in the USA and provide more government controls on low-density
sprawl and the long trip distances that usually generates (;Schmidt and Buehler, 2007;
Transportation Research Board, 2001; Alterman, 2001; Nivola, 1999). Moreover, mixed-use
zoning and transit-oriented developments have a long history in Europe. They facilitate the
proximity of residential areas to commercial establishments, schools, churches, and a range of
services. The resulting trip distances are shorter and thus more bikeable than those in the USA.
For the most part, these complementary taxation, parking, and land use policies are not
specifically intended to promote cycling. Nevertheless, they provide dramatically more
favorable pre-conditions for cycling than in the USA.
The situation in the UK appears to be far less favorable to cycling than in the
Netherlands, Denmark, and Germany (Banister et al, 2007; Banister, 2005; Tolley, 2003;
McClintock, 2002; Goodwin, 1999). Interviews conducted by the authors in 2007 with a wide
range of transport specialists throughout the UK suggest that British metropolitan areas have a
greater supply of motorways and car parking than is typical of the Netherlands, Denmark, and
Germany. Car-free city centers are less common in the UK, traffic calming of residential
neighborhoods is far less widespread, speed limits are generally higher, and many firms provide
financial incentives to buy cars and drive them to work. Moreover, land use controls tend to be
less strict than in the rest of northern Europe. The lack of good coordination between land use
and transport has resulted in more low-density suburban sprawl, often strewn along the extensive
motorway system surrounding many British cities (Banister, 2005). Clearly, none of the above
factors is conducive to cycling. Combined with the lesser extent and inferior quality of cycling
Pucher and Buehler “Making Cycling Irresistible” Transport Reviews, Vol. 28, 2008
31
facilities in most British cities, these unfavorable conditions might help explain why only slightly
more than one percent of trips (1.3%) in the UK were made by bike in 2005.
One interesting exception in the UK is the congestion pricing scheme in London since
2003, which has produced large increases in cycling, up to 50% by some estimates (Transport for
London, 2007a and 2007b). Cycling in London has grown not only due to the restriction of car
use but also by the simultaneous provision of expanded and improved cycling facilities.
Conclusions: Policies to Make Cycling Irresistible
The most important approach to making cycling safe and convenient in Dutch, Danish,
and German cities is the provision of separate cycling facilities along heavily traveled roads and
at intersections, combined with extensive traffic calming of residential neighborhoods. Safe and
relatively stress-free cycling routes are especially important for children, the elderly, women, and
for anyone with special needs due to any sort of disability. Providing such separate facilities to
connect practical, utilitarian origins and destinations also promotes cycling for work, school, and
shopping trips, as opposed to the mainly recreational cycling in the USA, where most separate
cycling facilities are along urban parks, rivers, and lakes or in rural areas.
As noted in this article, separate facilities are only part of the solution. Dutch, Danish,
and German cities reinforce the safety, convenience, and attractiveness of excellent cycling
rights of way with extensive bike parking, integration with public transport, comprehensive
traffic education and training of both cyclists and motorists, and a wide range of promotional
events intended to generate enthusiasm and wide public support for cycling.
Would such pro-cycling policies as those listed in Tables 1 and 2 be possible in a country
as the USA? Some of the same policies are already used, but to a much lesser extent, in many
American cities (Pucher et al., 1999). Moreover, there has been considerable expansion of such
Pucher and Buehler “Making Cycling Irresistible” Transport Reviews, Vol. 28, 2008
32
measures in recent years, with even more expansion planned. Generous federal funding has
helped finance 6,165km of bike lanes, 3,483km of multi-use bike-ped paths, and 36,195 bike
parking racks in the 50 largest US cities (Thunderhead Alliance, 2007). Bike parking at rail
stations has been increasing, and as noted earlier, over 50,000 buses in the USA already come
equipped with bike racks to facilitate bike and ride. Moreover, all states now have federally
funded Safe Routes to School programs designed to help children walk or bike to school.
With the highest bike share of work trips (4%) of the 50 largest US cities, Portland,
Oregon probably has the country's most successful bicycling program (City of Portland, 2007a,
2007b, 2007c). Portland has more than tripled the total annual number of bike trips since 1991.
That is partly due to a range of pro-bike measures such as expanding its bikeway network,
increasing bike parking, and integrating cycling with bus and rail systems. In addition, bicycling
in Portland benefits from the country's most famous land use planning reforms, which
have restricted leapfrog suburban sprawl and encouraged compact, mixed-use development
conducive to shorter, more bikeable trips. Portland has also reduced the supply of car parking in
the city center while improving public transport services. Very few American cities can boast of
such an integrated range of policies to promote cycling.
While Portland has been a model bicycling city, Chicago and New York provide some
impressive examples of what can be done to promote cycling even in two megacities which for
decades had been extremely hostile to cycling. In the past ten years Chicago has added over
160km of bike lanes and paths, established a city-wide cycling network, installed 7,000 racks for
bike parking, and equipped over 2,000 buses with racks to encourage bike and ride. Moreover,
the latest official bicycling plan calls for further expansion to create an 800km bikeway network
(City of Chicago, 2007). New York has added 392km of bike paths and lanes in the past ten

Pucher and Buehler “Making Cycling Irresistible” Transport Reviews, Vol. 28, 2008
33
years and plans an additional 900km of bike paths and lanes in the coming ten years (New York
City Department of Transportation, 2007a). From 2001 to 2007, New York installed over 3,000
new bike racks. Official city plans call for a network of 2,880km of bike lanes and greenway
paths by 2030. Cycling levels in both Chicago and New York have increased considerably.
Annual cordon counts conducted by the City of New York at a wide range of locations
throughout Manhattan indicate that cycling levels more than doubled (116% increase) between
2000 and 2007 (New York City Department of Transportation, 2007b).
In short, such pro-bike ‘carrot’ policies are indeed possible even in a car-oriented country
as the USA. By comparison, there is almost no political support in the USA for adopting and
implementing the sorts of car-restrictive ‘stick’ policies listed in Table 3 that indirectly
encourage cycling in the Netherlands, Denmark, and Germany. In those three countries, car use
is far more expensive and much less convenient than in the USA due to a host of taxes and
restrictions on car ownership, use, and parking. Moreover, strict land use policies foster
relatively compact, mixed-use developments that generate more bikeable, shorter trips.
Promoting cycling is surely not the main purpose of such policies, but they clearly provide
important incentives and supportive conditions for cycling.
With very few exceptions, such as Portland Oregon, neither car-restrictive measures nor
stringent land use controls have yet been politically acceptable in American cities (Pucher et al,
1999; Banister et al., 2007). The public and the media vigorously oppose even slight increases in
the petrol tax, for example, and thus discourage politicians from even considering increased
taxation on car use. Similarly, there is little support for restrictions on car parking, speeds, and
passage of cars through city centers and residential neighborhoods. Thus, there appears to be

Pucher and Buehler “Making Cycling Irresistible” Transport Reviews, Vol. 28, 2008
34
only very limited potential for implementation in the USA of these crucial ‘stick’ approaches that
would encourage cycling.
Even in a city such as New York, where a majority of residents have no cars, it has been
an uphill battle trying to approve the proposed congestion pricing scheme for Manhattan. It
would involve a charge of $8 for cars and $21 for trucks to enter Manhattan south of 86th Street
on weekdays between 6am and 6pm (New York City Department of Transportation, 2007a).
Both Mayor Bloomberg (of New York City) and Governor Spitzer (of New York State) strongly
support congestion pricing, and the U.S. Department of Transportation has offered $353 million
in subsidy to help finance the program. The plan remains highly controversial, however, and a
combined state and city commission has been established to evaluate it. The federal government
has set a deadline of March 31, 2008 for final city and state approval of the congestion pricing
plan, and a deadline of March 31, 2009 for its implementation. Based on the London experience,
it seems likely that congestion pricing in New York would increase cycling levels, especially
since the city plans to greatly expand its cycling facilities at the same time.
The key to the success of cycling policies in the Netherlands, Denmark, and Germany is
the coordinated implementation of the multi-faceted, mutually reinforcing set of policies
summarized in Tables 1, 2, and 3. Not only do these countries implement far more of the pro-
bike measures, but they greatly reinforce their overall impact with highly restrictive policies that
make car use less convenient as well as more expensive. It is precisely that double-barreled
combination of ‘carrot’ and ‘stick’ policies that make cycling so irresistible.
Acknowledgements

Pucher and Buehler “Making Cycling Irresistible” Transport Reviews, Vol. 28, 2008
35
The authors are deeply indebted to a host of colleagues around the world for their assistance and
advice in writing this paper. They include national and local cycling coordinators, city planners,
transport researchers, national statistical experts, department of transport officials, and public
health experts, listed here alphabetically: Peter Berkeley, Mia Birk, Stefan Boehme, Frank
Borgman, Noah Budnick, Linda Christensen, Andy Clarke, Marie Demers, Lewis Dijkstra,
Jennifer Dill, Bernhard Ensink, Bent Flyvbjerg, Jan Garrard, Per Garder, Roger Geller, Martina
Guettler, Susan Handy, Peter Herwig, Ria Hilshorst, Peter Jacobsen, Roland Jannermann, Niels
Jensen, Cor van der Klaauw, Jutta Kloas, Thomas Krag, Patrick Lingwood, Hugh McClintock,
Piet Rietveld, Randy Neufeld, Harry Rutter, Warren Salomon, Birgit Schmidt, Kristen Steele,
Peter Strang, Steve Weber, John Whitelegg, and Bert Zinn. The authors also thank two
anonymous referees for their helpful suggestions on improving the original version of the paper.
References
Alterman, R. (2001). National-level planning in democratic countries: A comparative perspective, in: R. Alterman (ed.) National-level Planning in Democratic Countries: An International Comparison of City and Regional-Policy Making. Liverpool: Liverpool University Press. American Public Transportation Association (2007). Public Transportation Fact Book. Washington, DC: APTA. Andersen, T. (2005). Odense: the National Cycle City of Denmark, unpublished PowerPoint presentation made in October, 6, 2005, at the annual conference of the Bicycling Federation of Australia, Brisbane, Australia. Australian Bureau of Statistics (2007). 2001 Census of Population and Housing, Journey to Work Files. Canberra, Australia: Australian Bureau of Statistics. Available on-line at: http://www.abs.gov.au/websitedbs/d3310114.nsf/Home/census Banister, D. (2005). Unsustainable Transport: City Transport in the New Century. Oxford, UK: Routledge.

Pucher and Buehler “Making Cycling Irresistible” Transport Reviews, Vol. 28, 2008
36
Banister, D.; Pucher, J.; and Lee-Gosselin, M. (2007). Making sustainable transport politically and publicly acceptable. In Rietveld, P. and Stough, R. eds., Institutions and Sustainable Transport: Regulatory Reform in Advanced Economies. Cheltenham, England: Edward Elgar Publishing. Boehme, S. (2005). Fahrradfahren in Muenster, printout of unpublished PowerPoint presentation provided directly by City of Muenster’s Department of Transport Planning. Muenster, Germany: City of Muenster, 2005, pp. 86. Bratzel, S. (1999) Conditions of success in sustainable urban transport policy - Policy change in 'relatively successful' European cities. Transport Reviews. Vol. 19: 177-190. Centers for Disease Control and Prevention (2007). WISQARS: Web-based Injury Statistics Query and Reporting System. Atlanta: CDC. Accessible at: http://www.cdc.gov/ncipc/wisqars/ City of Amsterdam (2007). Choosing for the Cyclist: Bicycle Program 2007 – 2010. Amsterdam, The Netherlands: Gemeente Amsterdam. City of Amsterdam (2003a). The Amsterdam Bicycle Policy. Amsterdam, the Netherlands: Dienst Infrastructuur Verkeer en Vervoer. Gemeente Amsterdam. City of Amsterdam (2003b). Bicycling Facts and Figures. Amsterdam, The Netherlands: Gemeente Amsterdam. Accessible online at: http://www.amsterdam.nl/aspx/get.aspx?xdl=/views/amsterdamnl/xdl/catch&ItmIdt=00002496&SitIdt=00000005&VarIdt=00000002#Factsandfigures City of Berlin (2003). Urban Transport in Berlin: Focus on Bicycling. Berlin: Senatsverwaltung fuer Stadtentwicklung. City of Berlin (2005). Bauordnung fuer Berlin. City Construction Code. Berlin, Germany: Senatsverwaltung fuer Stadtentwicklung. City of Berlin (2007). Fahrradverkehr. Berlin, Germany: Senatsverwaltung fuer Stadtentwicklung. Accessible online at: http://www.stadtentwicklung.berlin.de/verkehr/radverkehr/index.shtml City of Chicago (2007). Bike 2015 Plan for the City of Chicago. http://www.bike2015plan.org/ City of Copenhagen (2002). Cycle Policy. Copenhagen, Denmark: City of Copenhagen. City of Copenhagen (2004). Bicycle Account. Copenhagen, Denmark: City of Copenhagen. City of Copenhagen (2007). City Profile. Copenhagen, Denmark: City of Copenhagen. Accessible online at: http://www3.kk.dk/Globalmenu/City%20of%20Copenhagen.aspx, accessed March 2007.

Pucher and Buehler “Making Cycling Irresistible” Transport Reviews, Vol. 28, 2008
37
City of Groningen (2007). Key Figures. Accessible at: http://www.groningen.nl/assets/pdf/kerncijfers_2006_engels.pdf City of Muenster (2004). Fahrradhauptstadt Muenster. Muenster, Germany: Department of City Planning, City of Muenster. City of Muenster (2007). Verkehrsplanung in Muenster. Webpage of the City of Muenster’s Department of Transport Planning. Accessible at: http://www.muenster.de/stadt/stadtplanung/index_verkehr.html City of Odense (2007). National Cycle City (Cycleby) Website. Accessible in English at: http://www.cykelby.dk/eng/index.asp City of Portland (2007a). Portland, Oregon: Creating a World-Class Bicycling City. Portland, Oregon: Portland Office of Transportation and Bicycle Transportation Alliance. City of Portland (2007b). Poised at the Threshold. Portland, Oregon: Portland Office of Transportation and Bicycle Transportation Alliance. City of Portland (2007c). Portland Bicycle Counts, 2007. Portland, Oregon: Portland Office of Transportation. Danish Ministry of Transport (2000). Promoting Safer Cycling: A Strategy. Copenhagen: Danish Ministry of Transport. Danish Ministry of Transport (2007). Danish National Travel Surveys. Copenhagen, DK: Danish Institute of Transport Research. Department for Transport (DfT) (2005). Cycling Fact Sheet. London: Department for Transport. Accessible online at: http://www.dft.gov.uk/. Accessed on 03. July 2007. Department for Transport (DfT) (2006). National Travel Survey 2005. London: Department for Transport. Accessible online at: http://www.dft.gov.uk/. Accessed on 03. July 2007. Department for Transport (DfT) (2007). National Travel Statistics. London: Department for Transport. Accessible online at: http://www.dft.gov.uk/. Accessed on 03. July 2007. Dutch Bicycling Council (2006). Continuous and Integral: The Cycling Policies of Groningen and other European Cities. Amsterdam, NL: Fietsberaad, April, 2006. Available in pdf format at: http://www.fietsberaad.nl/ European Conference of the Ministers of Transport (2004). National Policies to Promote Cycling. Paris, France: Organisation for Economic Cooperation and Development.

Pucher and Buehler “Making Cycling Irresistible” Transport Reviews, Vol. 28, 2008
38
European Union (2002). EU Energy and Transport in Figures, 2000. Brussels, Belgium: European Commission. European Union (2003). EU Energy and Transport in Figures, 2001. Brussels, Belgium: European Commission. European Union (2006). EU Energy and Transport in Figures, 2005. Brussels, Belgium: European Commission. Garrard, J, Rose, G, and Lo, S. (2007). Promoting transportation cycling for women: The role of bicycle infrastructure. Preventive Medicine, in press, 2007. German Federal Ministry of Transport (1998). Erster Bericht der Bundesregierung über die Situation des Fahrradverkehrs in der Bundesrepublik Deutschland 1998. Berlin: German Federal Ministry of Transport. German Federal Ministry of Transport (2002). FahrRad! Ride Your Bike! National Bicycle Plan. Berlin, Germany: German Federal Ministry of Transport. German Federal Ministry of Transport (2003). German Federal Travel Survey 2002 (MiD). Berlin, Germany: German Federal Ministry of Transport. German Federal Ministry of Transport (2006). Strassenverkehrsordnung. Berlin, Germany: German Federal Ministry of Transport. Accessible at: http://www.bmvbs.de/Anlage/original_987610/Strassenverkehrs-Ordnung.pdf German Federal Ministry of Transport (2007). German Transportation in Figures. Berlin, Germany: German Federal Ministry of Transport. German Railways (2007). Call a Bike. Berlin, Germany: Deutsche Bahn. Accessible online at: http://www.db.de/site/bahn/de/reisen/mobilitaetskette/callabike/callabike.html Goodwin, P. (1999). Transformation of transport policy in Great Britain. Transportation Research 33A, 7/8: 655-670. Hass-Klau, C. (1990). The Pedestrian and City Traffic. New York: Belhaven Press. Herrstedt, L. (1992) Traffic calming design—a speed management method: Danish experiences on environmentally adapted through roads. Accident Analysis and Prevention 24: 3-16. Jacobsen, P. (2003). Safety in numbers: more walkers and bicyclists, safer walking and bicycling. Injury Prevention 9: 205-209. Kunert, U., Kloas, J., and Kuhfeld, H. (2002). Design Characteristics of National Travel Surveys. Internationals Comparison for 10 countries. Transportation Research Record 1804. Washington, D.C.: TRB.
Pucher and Buehler “Making Cycling Irresistible” Transport Reviews, Vol. 28, 2008
39
Langenberg, P. (2000). Cycling in Amsterdam. Developments in the City. Amsterdam, The Netherlands: Velo Mondial 2000. McClintock, H., ed. (2002). Planning for Cycling: Principles, Practice, and Solutions for Urban Planners. Cambridge, UK: Woodhead Publishing Ltd. Morrison, D, Thomson, H, and Petticrew, M. (2004). Journal of Epidemiology and Community Health 58: 837-840. National Statistical Office of Denmark (2005). National Travel Statistics. Copenhagen, Denmark: National Statistical Office. Netherlands Ministry of Transport (1999). The Dutch Bicycle Master Plan. The Hague: Ministry of Transport, Public Works, and Water Management. Netherlands Ministry of Transport (2006). Cycling in the Netherlands. Rotterdam: Ministry of Transport, Public Works, and Water Management Netherlands Ministry of Transport (2007). Passenger Kilometers of Cycling and Fatality Rates. Data gathered directly from the ministry of transport. Rotterdam: Ministry of Transport, Public Works, and Water Management Newman, P. and Kenworthy, J. (1999). Sustainability and Cities: Overcoming Automobile Dependence. Washington, DC: Island Press. New York City Department of Transportation (2007a). PlaNYC: A Greener, Greater New York. New York: City of New York. http://home2.nyc.gov/html/planyc2030/downloads/pdf/full_report.pdf New York City Department of Transportation (2007b). NYC Bicycle Counts on a Single Weekday (7am to 7pm) at Selected Commuter Locations (1980-2007). City of New York: Department of Transportation. Nivola, P.S. (1999). Laws of the Landscape. How policies shape cities in Europe and America. Washington D.C.: Brookings Institution Press. Noland, R. (1994). Perceived risk and modal choice: Risk compensation in transportation systems. Accident Analysis and Prevention 27: 503–521. North-Rhine Westphalia Ministry of Transport (2004). Fahrradfreundliche Staedte und Gemeinden in Nordrhein-Westfalen: Eine Zwischenbilanz. Duesseldorf: Ministerium fuer Wirtschaft, Mittelstand, Technologie und Verkehr des Landes Nordrhein-Westfalen.
Pucher and Buehler “Making Cycling Irresistible” Transport Reviews, Vol. 28, 2008
40
Organisation for Economic Cooperation and Development (2005). OECD Statistics. Paris, France: Organisation for Economic Cooperation and Development. Organisation for Economic Cooperation and Development (2007). Underreporting of Road Traffic Casualties. ITRAD Special Report. International Traffic Safety Data and Analysis Group. Paris, France: OECD. http://cemt.org/IRTAD/IRTADPublic/publications/special_rep_underreporting.pdf OV-Fiets (2007). OV-Fiets: A fast and easy bike rental. http://www.ov-fiets.nl/engels/index.htm Pucher, J. (1995). Urban passenger transport in the United States and Europe: A comparative analysis of public policies. Part 1. Travel behavior, urban development and automobile use. Transport Reviews. Vol. 15: 99-117. Pucher, J. (1997). Bicycling boom in Germany: A revival engineered by public policy. Transportation Quarterly 51, 4: 31-46. Pucher, J, Komanoff, C, and Schimek, P. (1999). Bicycling renaissance in North America? Recent trends and alternative policies to promote bicycling. Transportation Research 33-A, 7/8: 625-654. Pucher, J. and Dijkstra (2000). Making walking and cycling safer: Lessons from Europe. Transportation Quarterly 54, 3: 25-50. Pucher J. and Dijkstra, L. (2003). Promoting safe walking and cycling to improve public health: Lessons from the Netherlands and Germany. American Journal of Public Health, Vol. 93,9: 1509-1517. Rietveld, P. and Daniel, V. (2004). Determinants of bicycle use: Do municipal policies matter? Transportation Research A 38: 531-550. Schmidt, S. and Buehler, R. (2007). The planning process in the US and Germany: A comparative analysis. International Planning Studies. Vol. 12: 55-75. Socialdata (2007). Verkehrsmittelwahl in Deutschland. Munich: Socialdata. Statistics Canada (2007). Where Canadians Work and How they Get There. Ottawa: Statistics Canada. Statistics Netherlands (1999). Staat der Wegen: Lengte van Fietspaden en –stoken, per Province. Voorburg/Heerlen, Netherlands: Central Bureau of Statistics. Statistics Netherlands (2005). Transportation Statistics. Amsterdam, NL: Statistics Netherlands. Statistics Netherlands (2007). Transportation Statistics. Amsterdam, NL: Statistics Netherlands.

Pucher and Buehler “Making Cycling Irresistible” Transport Reviews, Vol. 28, 2008
41
Thunderhead Alliance (2007). Bicycling and Walking in the US: Benchmarking Report, 2007. Prescott, Arizona: Thunderhead Alliance. Tolley, R., ed. (2003). Sustainable Transport: Planning for Walking and Cycling in Urban Environments. Cambridge, UK: Woodhead Publishing Ltd. Transport for London (2003). Impacts of 20 mph Zones in London Boroughs. TfL, London, UK. Transport for London (2007a). Congestion Charging: Fourth Annual Impacts Report. London: Transport for London. http://www.tfl.gov.uk/assets/downloads/FourthAnnualReportFinal.pdf Transport for London (2007b). Central London Congestion Charging Scheme: Ex-post Evaluation of the Quantified Impacts of the Original Scheme. London: Transport for London. http://www.tfl.gov.uk/assets/downloads/Ex-post-evaluation-of-quantified-impacts-of-original-scheme-07-June.pdf Transportation Research Board (2001). Making Transit Work: Insights from Western Europe, Canada, and the United States. TRB Special Report 257. Washington, DC: National Research Council. U.S. Department of Transportation (1994). National Bicycling and Walking Study: Transportation Choices for a Changing America. Washington, DC: Federal Highway Administration. U.S. Department of Transportation (2003). National Household Travel Survey, 2001. Washington, DC: Federal Highway Administration. U.S. Department of Transportation (2004). National Bicycling and Walking Study: Ten Year Status Report. Washington, DC: Federal Highway Administration. U.S. Department of Transportation (2007). Traffic Safety Fact Sheets. Washington, DC: National Highway Traffic Safety Administration. Available at: http://www-nrd.nhtsa.dot.gov Accessed March 15, 2007. Walker, I. (2007). Drivers overtaking bicyclists: Objective data on the effects of riding position, helmet use, vehicle type, and apparent gender. Accident Analysis and Prevention 39: 417-425. Webster, D.C. and Mackie, A. M. (1996). Review of Traffic Calming Schemes in 20mph zones. TRL Report 215. Transport Research Laboratory. Crowthorne, UK, 1996.

Pucher and Buehler “Making Cycling Irresistible” Transport Reviews, Vol. 28, 2008
42
LIST OF FIGURES AND TABLES
Figure 1. Bicycle share of trips in Europe, North America, and Australia (Percent of total trips by bicycle) Figure 2. Kilometers cycled per inhabitant per day in Europe and USA Figure 3. Bike share of trips in selected cities in the Netherlands, Denmark, Germany, UK, Australia, Canada, and USA, 2000-2005 Figure 4. Bicycling share of short trips in the Netherlands, Denmark, Germany, UK, and USA (2000-2005) Figure 5. Trend in car and light truck ownership per 1000 population in the Netherlands, Denmark, Germany, UK, and USA, 1970-2005 Figure 6. Trend in kilometers cycled per inhabitant per year in the Netherlands and UK 1952 - 2006 (percent relative to 1950 level) Figure 7. Trend in kilometers cycled per inhabitant per day in the Netherlands, Denmark, Germany and UK (1978-2005) Figure 8. Women's share of total bike trips in the Netherlands, Denmark, Germany, UK, Australia, and North America (2000 - 2005) Figure 9. Bicycling share of trips by age group in the Netherlands, Denmark, Germany, UK and USA (2000-2002) Figure 10. Fatality rates and non-fatal injury rates in the Netherlands, Denmark, Germany, UK and USA 2004-2005 Figure 11. Trend in cycling fatalities in the Netherlands, Denmark, Germany, UK and USA, 1970 - 2005 (Percent relative to 1970 level) Figure 12. Inverse trends in cycling fatality rates and annual kilometers cycled per inhabitant in the Netherlands, 1950 to 2005 Table 1. Key policies and innovative measures used in Dutch, Danish, and German cities to promote safe and convenient cycling Table 2. Cycling promotion in the Netherlands, Denmark, and Germany Table 3. Taxation, parking, and land use policies that encourage cycling indirectly

Pucher and Buehler “Making Cycling Irresistible” Transport Reviews, Vol. 28, 2008
43
Sources: Australian Bureau of Statistics (2007); Netherlands Ministry of Transport (2006); Department for Transport (2005); OECD (2005); European Conference of the Ministers of Transport (2004); European Union (2003); U.S. Department of Transportation (2003); German Federal Ministry of Transport (2003)
Figure 1. Bicycle share of trips in Europe, North America, and Australia (Percent of total trips by bicycle)

Pucher and Buehler “Making Cycling Irresistible” Transport Reviews, Vol. 28, 2008
44
Figure 2. Kilometers cycled per inhabitant per day in Europe and USASource: European Union (2002)

Pucher and Buehler “Making Cycling Irresistible” Transport Reviews, Vol. 28, 2008
45
Note: UK data are for counties
Figure 3. Bike share of trips in selected cities in the Netherlands, Denmark, Germany, UK, Australia, Canada, and USA, 2000-2005
Sources: Australian Bureau of Statistics (2007); Statistics Canada (2007); Netherlands Ministry of Transport (2007); Socialdata (2007); Dutch Bicycling Council (2006); Department for Transport (2006); Andersen (2005).

Pucher and Buehler “Making Cycling Irresistible” Transport Reviews, Vol. 28, 2008
46
Figure 4. Bicycling share of short trips in the Netherlands, Denmark, Germany, UK, and USA (2000-2005)
Sources: Danish Ministry of Transport (2007); Netherlands Ministry of Transport (2006); Department for Transport (2005); U.S. Department of Transportation (2003); German Federal Ministry of Transport (2003)
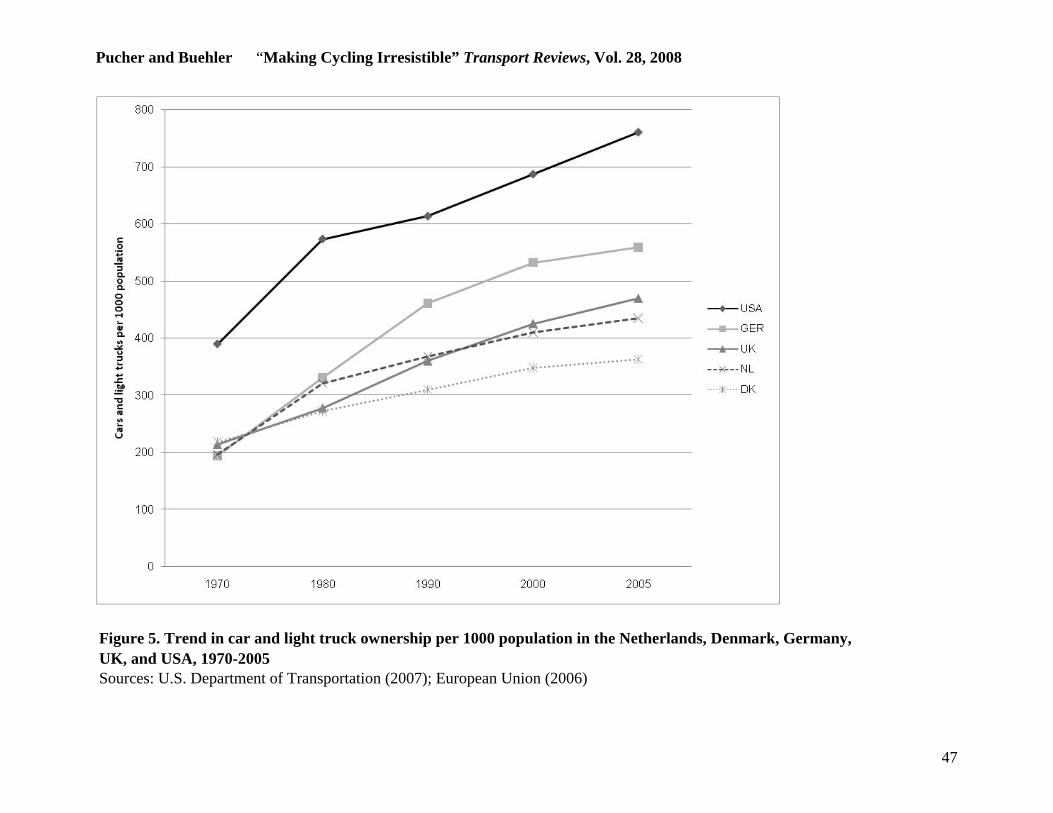
Pucher and Buehler “Making Cycling Irresistible” Transport Reviews, Vol. 28, 2008
47
Sources: U.S. Department of Transportation (2007); European Union (2006)
Figure 5. Trend in car and light truck ownership per 1000 population in the Netherlands, Denmark, Germany, UK, and USA, 1970-2005

Pucher and Buehler “Making Cycling Irresistible” Transport Reviews, Vol. 28, 2008
48
Sources: Netherlands Ministry of Transport (2007); Department for Transportation (2007)
Figure 6. Trend in kilometers cycled per inhabitant per year in the Netherlands and UK 1952 - 2006 (percent relative to 1950 level)

Pucher and Buehler “Making Cycling Irresistible” Transport Reviews, Vol. 28, 2008
49
Figure 7. Trend in kilometers cycled per inhabitant per day in the Netherlands, Denmark, Germany and UK (1978-2005)
Sources: Danish Ministry of Transport (2007), Netherlands Ministry of Transport (2007); German Federal Ministry of Transport (2007); Department for Transportation (2007)
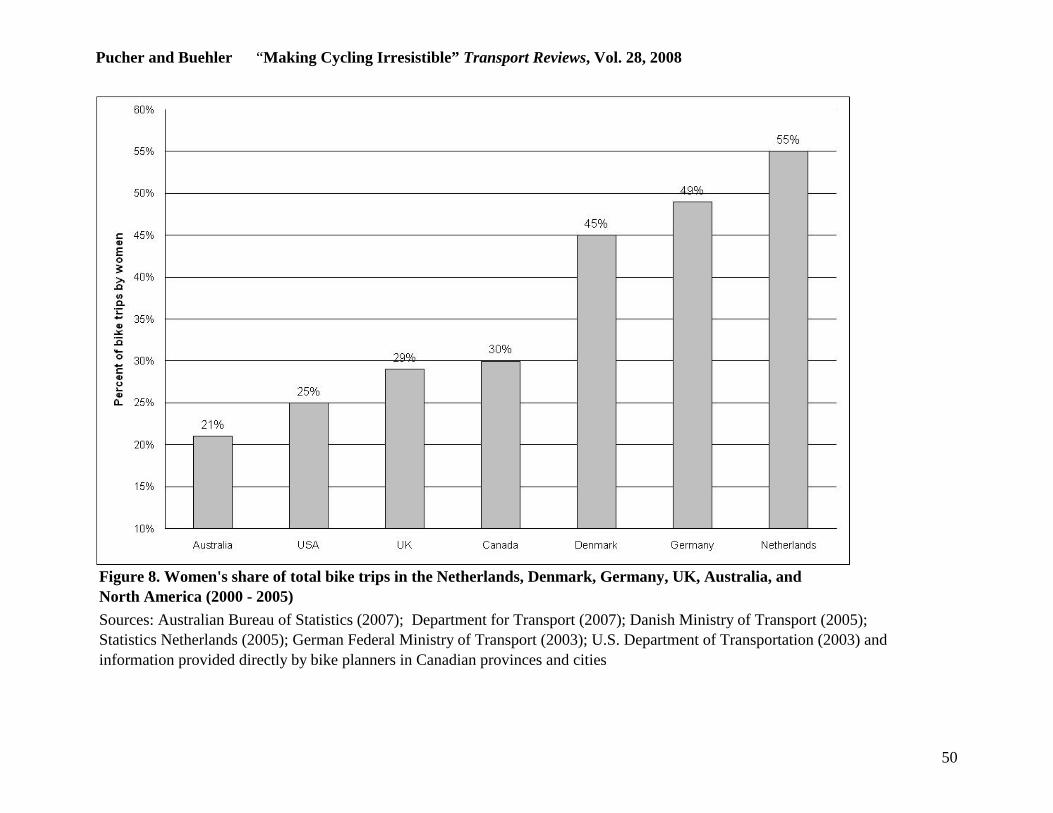
Pucher and Buehler “Making Cycling Irresistible” Transport Reviews, Vol. 28, 2008
50
Figure 8. Women's share of total bike trips in the Netherlands, Denmark, Germany, UK, Australia, and North America (2000 - 2005)Sources: Australian Bureau of Statistics (2007); Department for Transport (2007); Danish Ministry of Transport (2005); Statistics Netherlands (2005); German Federal Ministry of Transport (2003); U.S. Department of Transportation (2003) and information provided directly by bike planners in Canadian provinces and cities

Pucher and Buehler “Making Cycling Irresistible” Transport Reviews, Vol. 28, 2008
51
Figure 9. Bicycling share of trips by age group in the Netherlands, Denmark, Germany, UK and USA (2000-2002)Sources: Department for Transport (2007); Danish Ministry of Transport (2005); Statistics Netherlands (2005); German Federal Ministry of Transport (2003); U.S. Department of Transportation (2003)
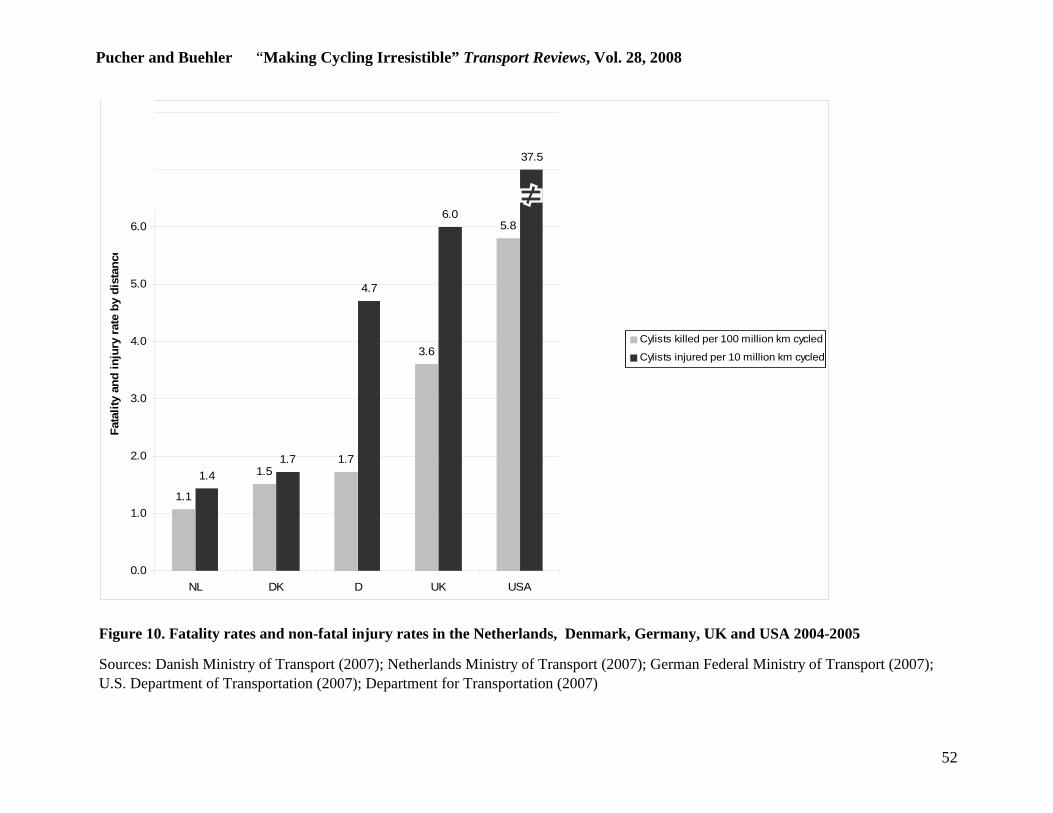
Pucher and Buehler “Making Cycling Irresistible” Transport Reviews, Vol. 28, 2008
52
1.1
1.51.7
3.6
5.8
1.41.7
4.7
6.0
37.5
0.0
1.0
2.0
3.0
4.0
5.0
6.0
7.0
8.0
NL DK D UK USA
Fata
lity
and
inju
ry ra
te b
y di
stan
ce
Cylists killed per 100 million km cycled
Cylists injured per 10 million km cycled
Figure 10. Fatality rates and non-fatal injury rates in the Netherlands, Denmark, Germany, UK and USA 2004-2005
Sources: Danish Ministry of Transport (2007); Netherlands Ministry of Transport (2007); German Federal Ministry of Transport (2007); U.S. Department of Transportation (2007); Department for Transportation (2007)

Pucher and Buehler “Making Cycling Irresistible” Transport Reviews, Vol. 28, 2008
53
Figure 11. Trend in cycling fatalities in the Netherlands, Denmark, Germany, UK and USA, 1970 - 2005 (Percent relative to 1970 level)
Sources: Danish Ministry of Transport (2007); Netherlands Ministry of Transport (2007); German Federal Ministry of Transport (2007); U.S. Department of Transportation (2007); Department for Transport (2007)
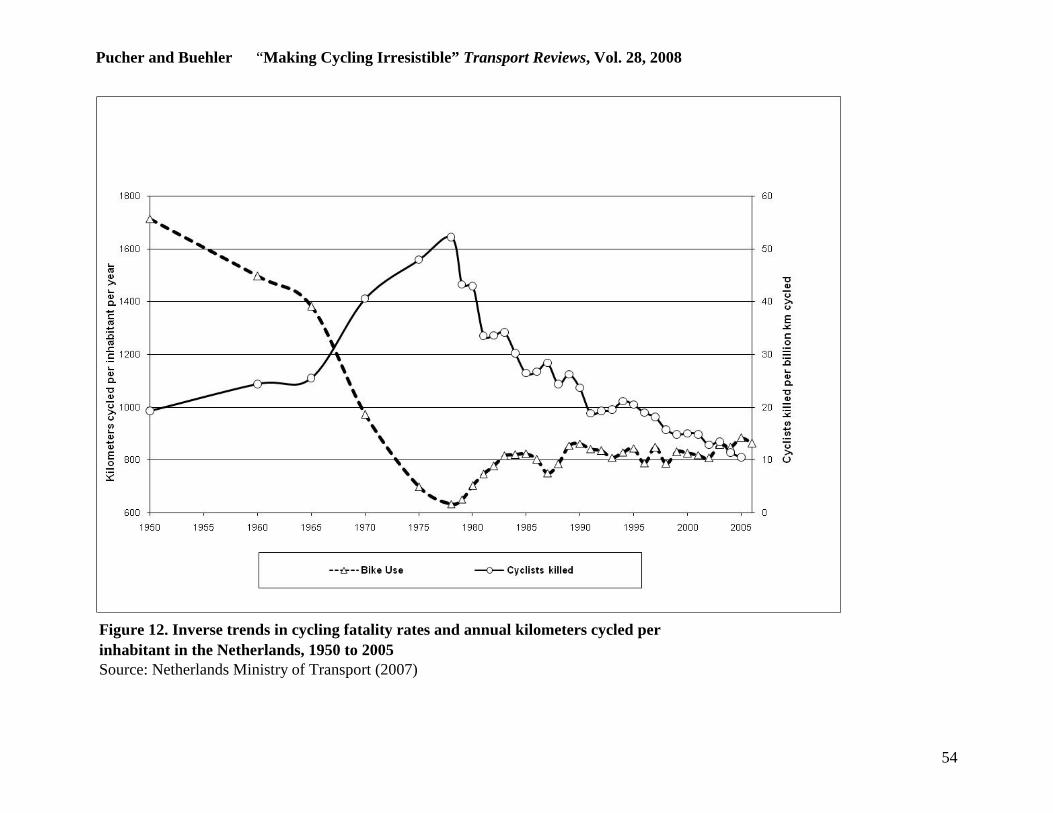
Pucher and Buehler “Making Cycling Irresistible” Transport Reviews, Vol. 28, 2008
54
Source: Netherlands Ministry of Transport (2007)
Figure 12. Inverse trends in cycling fatality rates and annual kilometers cycled per inhabitant in the Netherlands, 1950 to 2005

• Extensive bike parking at all metro, suburban, and regional train stations
• Advanced cyclist waiting positions (ahead of cars) fed by special bike lanes facilitate safer and quicker crossings and turns• Cyclist short cuts to make right-hand turns before intersections and exemption from red traffic signals at T-intersections, thus increasing cyclist speed and safety
Table 1. Key policies and innovative measures used in Dutch, Danish, and German cities to promote safe and convenient cycling
Extensive systems of separate cycling facilities• Well maintained, fully integrated paths, lanes and special bicycle streets in cities and surrounding regions• Fully coordinated system of color coded directional signs for bicyclists• Off-street short-cuts, such as mid-block connections, and passages through dead ends for cars
Intersection modifications and priority traffic signals• Advance green lights for cyclists at most intersections
• Large supply of good bike parking throughout the city• Improved lighting and security of bike parking facilities often featuring guards, video-surveillance, and priority parking for women
• Bike paths turn into brightly colored bike lanes when crossing intersections• Traffic signals are synchronized at cyclist speeds assuring consecutive green lights for cyclists (green wave)• Bollards with flashing lights along bike routes signal cyclists the right speed to reach the next intersection at a green light
Traffic calming • Traffic calming of all residential neighborhoods via speed limit (30km/hr) and physical infrastructure deterrents for cars
Traffic education and training • Comprehensive cycling training courses for virtually all school children with test by traffic police
• Bicycle streets, narrow roads where bikes have absolute priority over cars• "Home Zones" with 5 km/h speed limit, where cars must yield to pedestrians and cyclists using the road
Bike parking
Coordination with public transport
• "Call-a-Bike" programs: bikes can be rented by cell phone at transit stops, paid for by the minute and left at any busy intersection in the city• Bike rentals at most train stations• Deluxe bike parking garages at some train stations, with video surveillance, special lighting, music, repair services, and bike rentals
• Strict enforcement of cyclist rights by police and courtsSource: Information provided directly to authors by bicycling coordinators in the Netherlands, Denmark, and Germany.
• Special cycling training test tracks for children• Stringent training of motorists to respect pedestrians and cyclists and avoid hitting them
• Special legal protection for children and elderly cyclists• Motorists assumed by law to be responsible for almost all crashes with cyclists
Traffic laws
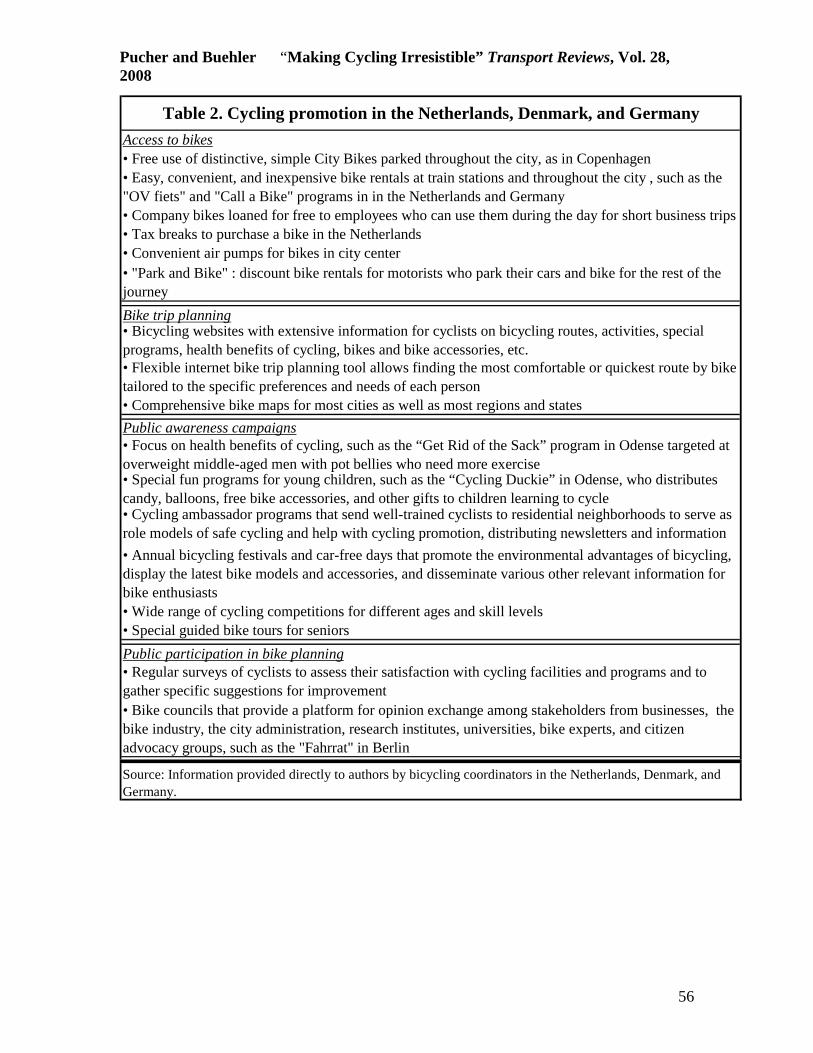
Pucher and Buehler “Making Cycling Irresistible” Transport Reviews, Vol. 28, 2008
56
Table 2. Cycling promotion in the Netherlands, Denmark, and GermanyAccess to bikes• Free use of distinctive, simple City Bikes parked throughout the city, as in Copenhagen• Easy, convenient, and inexpensive bike rentals at train stations and throughout the city , such as the "OV fiets" and "Call a Bike" programs in in the Netherlands and Germany • Company bikes loaned for free to employees who can use them during the day for short business trips• Tax breaks to purchase a bike in the Netherlands
• Wide range of cycling competitions for different ages and skill levels
• Convenient air pumps for bikes in city center• "Park and Bike" : discount bike rentals for motorists who park their cars and bike for the rest of the journeyBike trip planning• Bicycling websites with extensive information for cyclists on bicycling routes, activities, special programs, health benefits of cycling, bikes and bike accessories, etc.• Flexible internet bike trip planning tool allows finding the most comfortable or quickest route by bike tailored to the specific preferences and needs of each person• Comprehensive bike maps for most cities as well as most regions and states
Source: Information provided directly to authors by bicycling coordinators in the Netherlands, Denmark, and Germany.
Public awareness campaigns• Focus on health benefits of cycling, such as the “Get Rid of the Sack” program in Odense targeted at overweight middle-aged men with pot bellies who need more exercise• Special fun programs for young children, such as the “Cycling Duckie” in Odense, who distributes candy, balloons, free bike accessories, and other gifts to children learning to cycle• Cycling ambassador programs that send well-trained cyclists to residential neighborhoods to serve as role models of safe cycling and help with cycling promotion, distributing newsletters and information • Annual bicycling festivals and car-free days that promote the environmental advantages of bicycling, display the latest bike models and accessories, and disseminate various other relevant information for bike enthusiasts
• Special guided bike tours for seniorsPublic participation in bike planning• Regular surveys of cyclists to assess their satisfaction with cycling facilities and programs and to gather specific suggestions for improvement • Bike councils that provide a platform for opinion exchange among stakeholders from businesses, the bike industry, the city administration, research institutes, universities, bike experts, and citizen advocacy groups, such as the "Fahrrat" in Berlin

Pucher and Buehler “Making Cycling Irresistible” Transport Reviews, Vol. 28, 2008
57
Table 3. Taxation, parking, and land use policies that encourage cycling indirectly
Automobile speed limitations in cities• Traffic calming of residential neighborhoods limits cars to speeds of 30km/hr or less• "Home zones" in many neighborhoods give cyclists and pedestrians equal rights to road use and limit cars to walking speed (about 7km/hr)• Car-free zones, one-way streets, and artificial dead-ends make car travel through the city center slow and inconvenient• Turn restrictions for cars but not for cyclists• Almost no limited access highways (motorways) in city centers• Strictly enforced speed limits and traffic rules in cities (such as police cameras at red • Frequent random speed limit enforcement checks by the police• Advance stop lines and traffic signal priority for cyclistsRoad and parking capacity limitations• Limited number of parking places in city centers• Parking management schemes limit easy car access to urban neighborhoods, often with resident-only parking or strict time limits• Replacing car parking facilities with bike parking instead• Combined bus-bike lanes that permit bike use but prohibit car use• Deliberately narrowed roads in city centers force cars to drive slowly• Special bicycle streets that sharply limit car speeds and give cyclists priority in roadway use over the entire width of the road
Taxation of automobile ownership and use• High taxes and fees on car purchase, ownership, and use• Especially high excise and sales taxes on petrol
• Less strict separation of land uses than in USA, thus enabling natural development of mixed-use neighborhoods
Sources: Schmidt and Buehler (2007); Dutch Bicycling Council (2006); Netherlands Ministry of Transport (2006); Banister (2005); European Conference of the Ministers of Transport (2004); Pucher and Dijkstra (2003); Transportation Research Board (2001); Alterman (2001); Nivola (1999); Bratzel (1999); Pucher (1995)
• Many local governments specifically require cycling and walking facilities for new suburban developments, thus reducing the need for car use
• High hourly parking rates in city center, even in medium size cities
• Transport and land use planning are integrated at several levels of government, with regional coordination that fosters cooperation between adjacent communities in their
• Mixed use zoning keeps trip distances short and feasible by bicycle and on foot
• High fees and strict training requirements for obtaining a driver's license (over €1,500 in Germany)
Strict land use planning policies• Most land beyond already built-up areas is off-limits for new development• Most new development occurs adjacent to already built-up areas, which keeps overall population densities high compared to the USA