management presentation - Ülker · management presentation june 2012 happy moments . disclaimer 1...
TRANSCRIPT
Management Presentation
June 2012
happy moments

Disclaimer
1
• This presentation contains information and analysis on financial statements and is prepared for the sole purpose of providing
information relating to Ülker
• This presentation contains forward-looking statements which are based on certain expectations and assumptions at the time
of publication of this presentation and are subject to risks and uncertainties that could cause actual results to differ materially
from those expressed in these materials. Many of these risks and uncertainties relate to factors that are beyond Ülker’s
ability to control or estimate precisely, such as future market and economic conditions, the behavior of other market
participants, the ability to successfully integrate acquired businesses and achieve anticipated cost savings and productivity
gains as well as the actions of government regulators
• Readers are cautioned not to place undue reliance on these forward-looking statements, which apply only as of the date of
this presentation. Ülker does not undertake any obligation to publicly release any revisions to these forward-looking
statements to reflect events or circumstances after the date of these materials
• This presentation merely serves the purpose of providing information. It neither represents an offer for sale nor for
subscription of securities in any country, including Turkey. This presentation does not include an official offer of shares; an
offering circular will not be published
• This presentation is not allowed to be reproduced, distributed or published without permission or agreement of Ülker
• The figures in this presentation are rounded to provide a better overview. The calculation of deviations is based on figures
including fractions. Therefore rounding differences may occur
• Neither Ülker nor any of its managers or employees nor any other person shall have any liability whatsoever for any loss
arising from the use of this presentation

Ülker: Leading name in Turkish confectionery
2
Biscuits
† Ülker Çikolata: Consolidated for the last quarter; Fresh cake: Not consolidated
Revenue from others excluded
• Best recognized FMCG brand in the dynamic Turkish market
for 68 years
• Turkey’s leading producer of biscuits, chocolates, chocolate
covered products, crackers, wafers and cakes
• Spread out facilities representing the largest production
capacity in the domestic market and minimizing dependency
on single location
• Exports, mainly to the Middle East, Northern Africa and EU,
accounting for c.20% of sales volume
• Consolidated annual net sales of TL1.8 bn in 2011 and
estimated net sales of TL2.3-2.5 bn in 2012
• Yıldız Holding is the
parent company. It is
Turkey’s leading food
and beverages group
with annual gross
sales of TL11.6 bn as
at the end of 2011
• Yıldız Holding ranked
10th in “Global top 100
confectionery
producers list” by
Candy Industry in 2011
Shareholding Structure
• Net sales, 2011†: TL0.9 bn
• Market share 2011: 49%
• Capacity: 403 tons/year
• CUR: c.71% Biscuit
• Net sales, 2011†: TL0.1 bn
• Market share 2011: 40%
• Capacity: 45k tons/year
• CUR: c.73% Cake
• Net sales, 2011†: TL0.5 bn
• Market share 2011: 49%
• Capacity: 238k tons/year
• CUR: c.60% Chocolate
Topkapı: Biscuits,
c.62k tons/year
Topkapı: Chocolate,
c.203k tons/year
Hadımköy: Cake,
c.45k tons/year
Gebze: Biscuit &
cracker, c.49k
tons/year
Karaman: Biscuit, cracker,
chocolate, cake c.180k
tons/year
Ankara: Biscuit,
c.112k tons/year
In Figures†
Silivri: Chocolate,
chocolate covered
biscuit, c.35k tons/year Yıldız
Holding44%
Dynamic Growth
Fund21%
Free Float23%
Other12%

Long lasting
relationships
with end users
enhance
brand
perception
Ülker: the “Best Recognized” FMCG brand
The Best in the
Sweet and Salty
Category
(Silver Effie Award,
Ülker Rondo, 2011)
Most
Recognized
Company
(AC Nielsen,
2nd place,
2010)
The “Brand
Award”
(International
Brands
Conference,
2011)
Best Recognized
Brands
Brand One Feels
Close To
# 1
# 2
# 3
# 4
# 5
• Strength of the brand is proven by national
and international awards
• Ülker has always been the “most recognized”
brand and “closest to consumers”
• Ülker brand essence and campaign theme:
“Happy moments with Ülker”
• Highly-popular sub-brands are in the market
for many years
Consistently
ranks as one
of the best
recognized
brands in
Turkey
Source: ACNielsen, public data † Arçelik is a household durable goods brand
3
†

Corporate governance
4
• 9 members, 3 of which are independent
• Encompasses 3 proactive committees, Audit, Corporate Governance and Early Detection of Risk Committees, where independent members dominate
• Simplified corporate structure improving transparency
• Diversified communication channels with investors
• Proactive attendance in investor meetings with participation in 7 local and international investor conferences in 2011. 117 investor meetings were performed in 2011
• New investor relations materials and enriched corporate website
• Expanding coverage through active communication with sector analysts. Has been covered by 12 analysts
• Elimination of dividend privileges completed in 1Q 2012, giving equal dividend rights to each and every shareholder
• Employee rights are supported through comprehensive company-wide human resources policies
• Code of ethics regulating company – wide relations have been reviewed
• Improving environmental consciousness with the launch of green building project - carbon emission measurements confirm environment friendly production operations
Board of Directors
Public Disclosure
and Transparency
Shareholder Rights
Stakeholder Rights

Current
Structure
Corporate governance: Elimination of dividend-privileges of shares
Prior
Structure
5
• Cancellation of privilege
shares was done by a
capital increase from
internal resources after the
share capital register. There
was no cash outflow
• All C shares have the same
amount of dividend right
and there is no additional
dividend privilege attached
to any share class as of
April 2012
A 1,486 17.65% 4
B 732 17.65%
C 26,859,995,565 2
D 2,217 1
Total 26,860,000,000
Founder Certificates 22,171 11.76%
Share Class Number of Shares
Additional
Dividend
Privilege
Candidates
for Board
A 1,486 - 4
B 2,217 - 1
C 34,199,996,297 - 2
D - - -
Total 34,200,000,000
Founder Certificates - - -
Share Class Number of Shares
Additional
Dividend
Privilege
Candidates for
Board
Key Investment Highlights
Ülker story
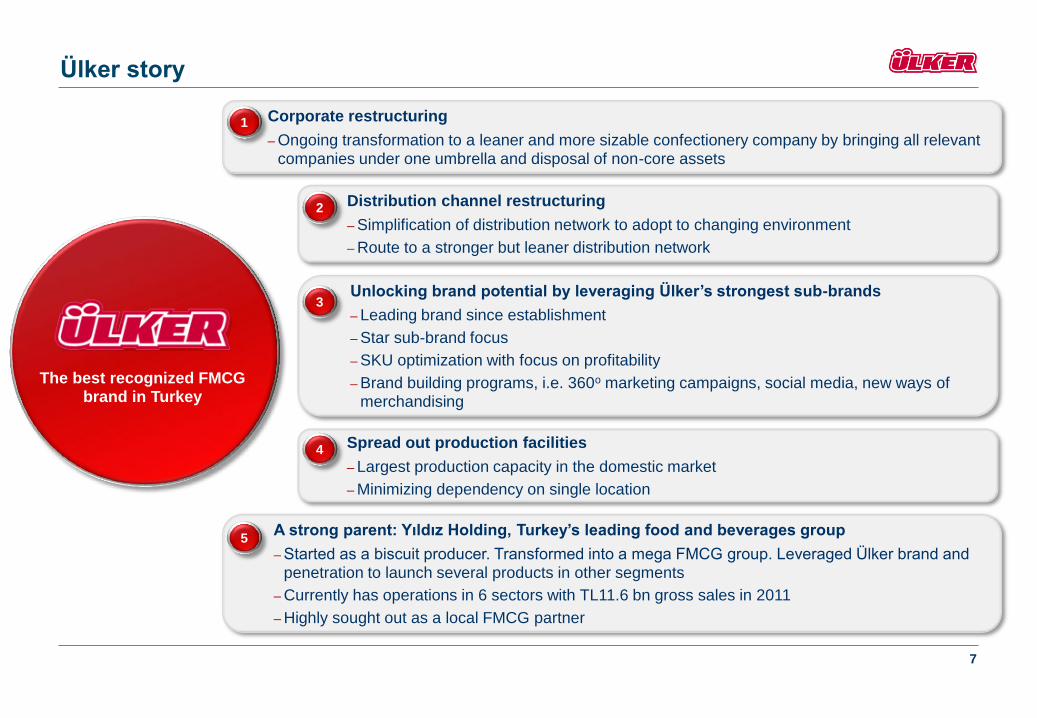
The best recognized FMCG brand in Turkey
7
Distribution channel restructuring
– Simplification of distribution network to adopt to changing environment
– Route to a stronger but leaner distribution network
2
Corporate restructuring
– Ongoing transformation to a leaner and more sizable confectionery company by bringing all relevant companies under one umbrella and disposal of non-core assets
1
Unlocking brand potential by leveraging Ülker’s strongest sub-brands
– Leading brand since establishment
– Star sub-brand focus
– SKU optimization with focus on profitability
– Brand building programs, i.e. 360o marketing campaigns, social media, new ways of merchandising
3
A strong parent: Yıldız Holding, Turkey’s leading food and beverages group
– Started as a biscuit producer. Transformed into a mega FMCG group. Leveraged Ülker brand and penetration to launch several products in other segments
– Currently has operations in 6 sectors with TL11.6 bn gross sales in 2011
– Highly sought out as a local FMCG partner
5
Spread out production facilities
– Largest production capacity in the domestic market
– Minimizing dependency on single location
4

Biscuit production
Biscuit production
Corporate restructuring: Ülker previous structure: Too many layers was transformed into a leaner, more transparent structure
8 Production companies
1
† Indirect ownership structures
Atlas * Domestic sales
İstanbul Exports: Ülker
branded products
Birleşik Exports: Non-Ülker branded products
Rekor Non-Ülker branded
products
Atlantik * Chocolate sales
Godiva
Biskot Non-Ülker branded products (Biscuit &
chocolate production)
Ülker Çikolata†† Chocolate producer
44%
92%
Stake owned by Ülker Sales companies
İdeal Ülker branded
products (Biscuit & cracker production)
Biskot Non-Ülker branded products (Biscuit &
chocolate production)
Birlik Flour producer
Fresh Cake Cake production
Godiva
BIM Retail
Pendik Nişasta Starch production
Sağlam GYO REIT
Besler Oil and margarine
production
Hero Baby Baby food
Atlas Domestic sales
İstanbul Exports: Ülker
branded products
Birleşik
Exports: Non-Ülker
branded products
Rekor Non-Ülker branded
products 47%
84%
10%
25%
7%
24%
40%
10%
11%
• Previous structure:
- Multiple sales channels to promote
competition amongst sales agents
- Portfolio investments in various companies
• Layered structure, evolved due to fast growth and add-on acquisitions,
led to restructuring need
Structure† as of 31.12.2010
19%
92%
42%
91%
78%
98%
• Steps already taken:
- Ülker Çikolata, Fresh Cake and Atlantik Gıda were
acquired from Yıldız Holding
- İdeal, Birlik and Fresh Cake merged with Ülker
- Non-core operations were divested (Besler, Hero Baby,
Pendik Nişasta, BIM, Sağlam GYO)
- Part of Godiva shares divested
Financial assets
Current Structure†
* Not operational as of March 1st, 2012 Will be merged with related production
companies by the end of 2012
Mavi Yeşil Ülker branded diet
products
74%
51%
99%
98% 78%
69%

Biscuit production
İstanbul Gıda
Exports: Ülker
branded products
Corporate restructuring:
Ülker target structure: Leaner with focus on core businesses
9
Target Structure
• Steps in progress:
- Merge of domestic sales subsidiaries to
related production companies
- Only export operations will remain as a
separate entity
- All domestic traditional channel sales
consolidated under single sales company
“Horizon”
1
Ülker Çikolata
Chocolate
producer
Biskot
Non-Ülker branded
products (Biscuit &
chocolate
production)
44%
92% 91%
Production companies Stake owned by Ülker Sales companies

Distribution channel restructuring:
Previous distribution system: Multichannel and layered sales network
10
• As confectionery goods remain at the
top spot for impulse purchases,
availability is the key factor
determining strength of a brand
• With c.220k sales points and c.70%
share in confectionery sales,
traditional channel dominates the
market
• Ülker’s previous domestic traditional
channel consisted of:
-235 distributors
-With c.90% nationwide coverage,
the largest food network in Turkey
• Changing market conditions dictate
restructuring in distributorship
system:
-Need for scale efficient and
organized distributors with
decreasing distributor margins
• Ülker aims to increase its operational
efficiency and margins through
restructure of its domestic traditional
distribution channel
% in domestic sales
Distribution
channels
İstanbul ††
(Ülker brand) Exports Channel Distributors
Biscuit,
Chocolate &
Cake Operations Birleşik ††
(Non-Ülker brand)
Pasifik † Domestic Modern
Channel
Organized
Retail
Chains
Biscuit,
Chocolate &
Cake Operations 25%
2
Other Food &
Beverage
Products
Atlantik
(Ülker brand)
Domestic
Traditional Channel
235
Distributors
Atlas
(Ülker brand)
Atlas
Chocolates
Biscuits
Cakes
Distributors
55%
†Yıldız Holding subsidiary ††Also responsible for sales of Yıldız Holding companies product portfolio
20%
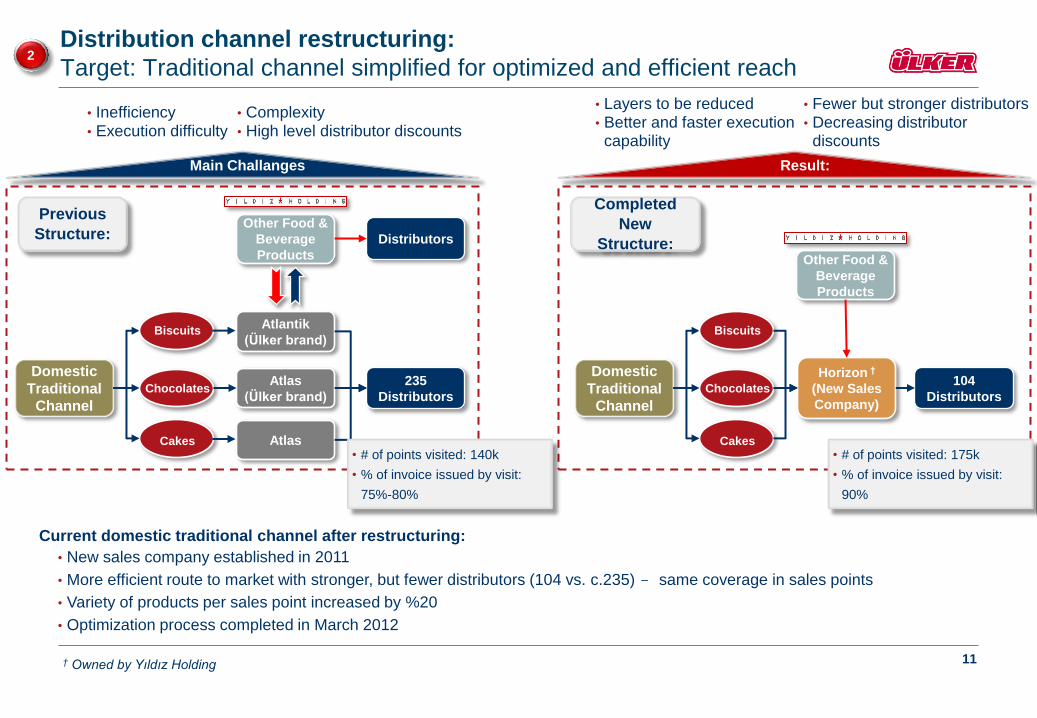
Distribution channel restructuring:
Target: Traditional channel simplified for optimized and efficient reach
11
2
Current domestic traditional channel after restructuring:
• New sales company established in 2011
• More efficient route to market with stronger, but fewer distributors (104 vs. c.235) - same coverage in sales points
• Variety of products per sales point increased by %20
• Optimization process completed in March 2012
• Inefficiency
• High level distributor discounts • Execution difficulty
• Complexity
Main Challanges
Other Food &
Beverage
Products
Distributors
Domestic
Traditional
Channel
Biscuits
Chocolates
Cakes
Atlas
(Ülker brand)
235
Distributors
Atlantik
(Ülker brand)
Atlas
Previous
Structure:
Other Food &
Beverage
Products
Domestic
Traditional
Channel
Biscuits
Chocolates
Cakes
Horizon †
(New Sales
Company)
104
Distributors
Completed
New
Structure:
Result:
• Layers to be reduced • Better and faster execution
capability
• Fewer but stronger distributors • Decreasing distributor
discounts
• # of points visited: 140k
• % of invoice issued by visit:
75%-80%
† Owned by Yıldız Holding
• # of points visited: 175k
• % of invoice issued by visit:
90%

47% 48%42% 40%43% 40%
46% 49%
9% 12% 12% 11%
2008 2009 2010 2011Ülker Eti Other
55% 56%51% 49%
10% 11% 11%11%6% 6% 9%
11%
29% 26% 29% 29%
2008 2009 2010 2011Ülker Nestle Eti Other
57% 54% 50% 49%
32% 35% 36% 39%
11% 12% 13% 12%
2008 2009 2010 2011Ülker Eti Other
Unlocking brand potential:
Strong market share across the categories
12 † Retail market, Source: ACNielsen, Euromonitor
Market Share Development, Volume Based†
• Total size of biscuit, chocolate and cake markets is
estimated to be TL4.7 bn in value and 269k tons in
volume terms
• Loss of market share caused mainly by aggressive
product launch strategy originated by the competition
- In the short run highly demanded popular products
shifted market shares from Ülker to competition
Biscuit, Chocolate & Cake Markets†
3
Bis
cu
it
Ch
oc
ola
te
Cak
e
-10%
-5%
0%
5%
10%
15%
2007 2008 2009 2010 2011
Market Volume GrowthReal GDP Growth

strategy to competition’s attack:
• Defending the position by matching aggressive product
launches - 178 new SKUs in 2009 - 9/2011 period
• Launches supported through consistent marketing
campaigns
Unlocking brand potential:
Ülker: Streamlining product portfolio
13
3
2009 2010 2011 Future
Co
mp
eti
tio
n
• Aggressive product launches in 2008-2011 period
• New tastes, hybrid products and new packaging forms
introduced to the market
Ülk
er
2012
SKU attacks for market share by the competition
x
x
Easing SKU wars Market trends:
• Short run results:
- Highly demanded popular products shifted market
shares
• Medium term results:
- Decreasing margins due to increasing operational costs
- Increasing sales and marketing expenses
- Crowded SKU portfolios difficult to control
Imp
ac
ts o
n t
he
mark
et
.’s changing strategy and prospects for
the future:
• SKU management: Portfolio restructuring started
in late 2011
- Focus on star SKUs
- Delisting of unprofitable SKUs – Reduction from
502 SKUs in 2010 to c.370 SKUs in 2011
• Packaging & pricing optimization:
- Formulizing cost effective sizes, packaging and
pricing to quickly respond to changes in
consumer choices and raw material costs
• Brand building:
- Increasing investment on star SKUs
• Innovation:
- Introduction of new trends in snack formats to
grasp market share from newly developed and
unpackaged segments
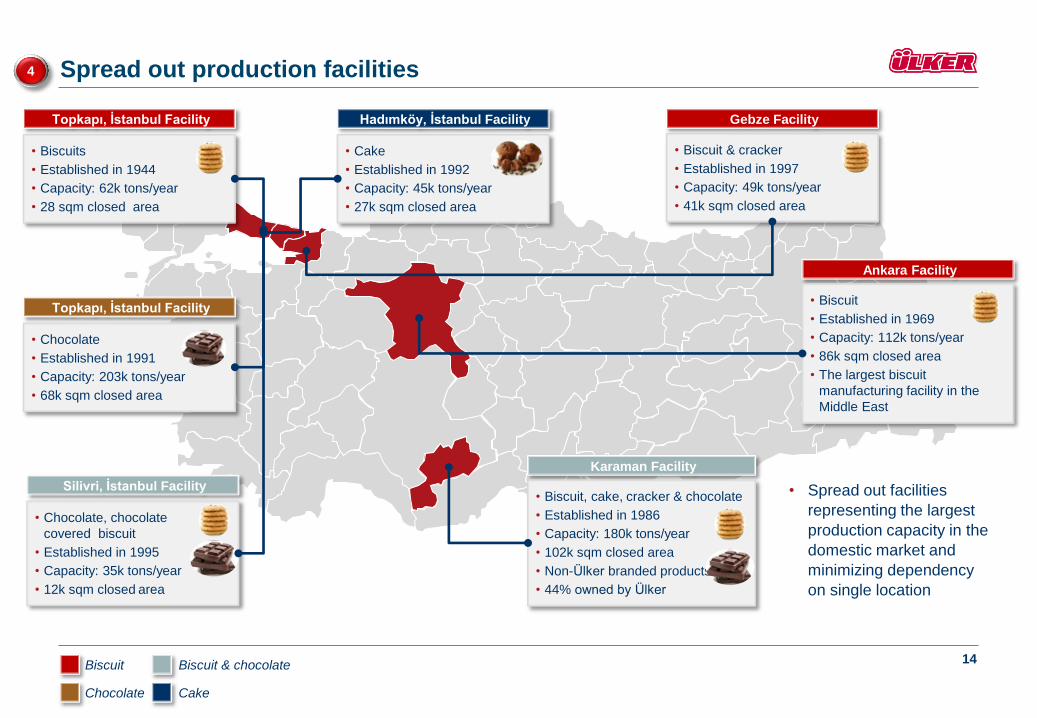
Spread out production facilities
14 Biscuit
Chocolate
Topkapı, İstanbul Facility
• Biscuits
• Established in 1944
• Capacity: 62k tons/year
• 28 sqm closed area
Hadımköy, İstanbul Facility
• Cake
• Established in 1992
• Capacity: 45k tons/year
• 27k sqm closed area
Topkapı, İstanbul Facility
• Chocolate
• Established in 1991
• Capacity: 203k tons/year
• 68k sqm closed area
Cake
Biscuit & chocolate
Gebze Facility
• Biscuit & cracker
• Established in 1997
• Capacity: 49k tons/year
• 41k sqm closed area
Ankara Facility
• Biscuit
• Established in 1969
• Capacity: 112k tons/year
• 86k sqm closed area
• The largest biscuit
manufacturing facility in the
Middle East
Karaman Facility
• Biscuit, cake, cracker & chocolate
• Established in 1986
• Capacity: 180k tons/year
• 102k sqm closed area
• Non-Ülker branded products
• 44% owned by Ülker
• Spread out facilities
representing the largest
production capacity in the
domestic market and
minimizing dependency
on single location
Silivri, İstanbul Facility
• Chocolate, chocolate
covered biscuit
• Established in 1995
• Capacity: 35k tons/year
• 12k sqm closed area
4
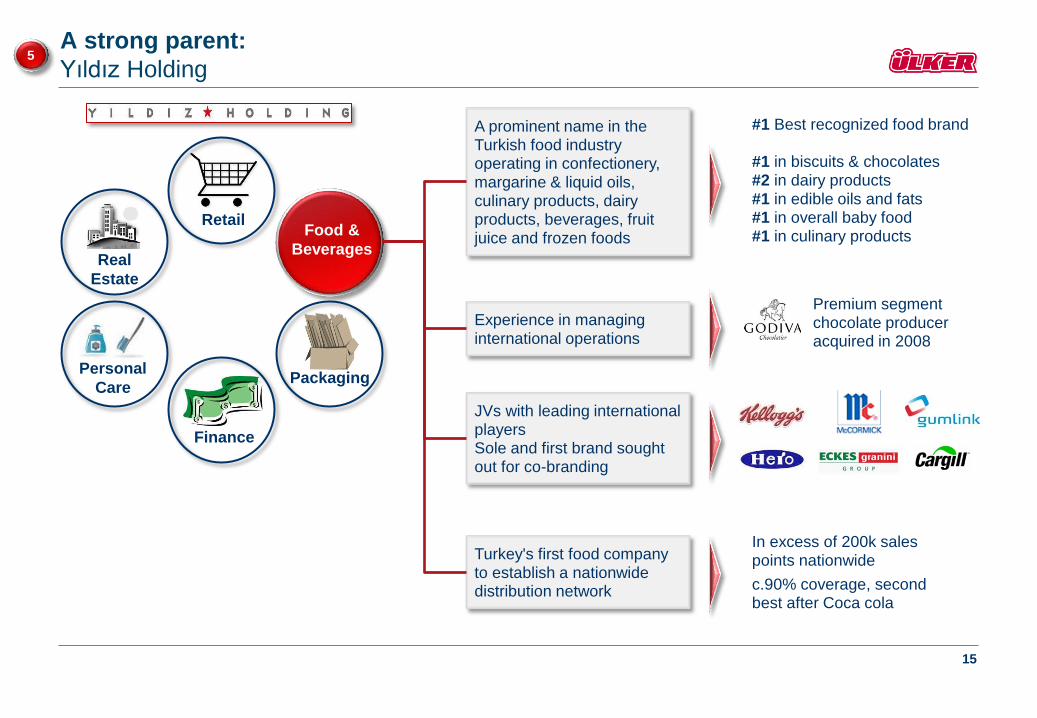
A strong parent:
Yıldız Holding
15
Food &
Beverages
Packaging
Finance
Retail
Real
Estate
Personal
Care
A prominent name in the Turkish food industry operating in confectionery,
margarine & liquid oils, culinary products, dairy products, beverages, fruit juice and frozen foods
Experience in managing international operations
JVs with leading international players Sole and first brand sought out for co-branding
Turkey's first food company to establish a nationwide distribution network
#1 Best recognized food brand #1 in biscuits & chocolates #2 in dairy products #1 in edible oils and fats #1 in overall baby food #1 in culinary products
Premium segment chocolate producer acquired in 2008
In excess of 200k sales points nationwide
c.90% coverage, second best after Coca cola
5

Financial Snapshot

62%52% 59%
38%
16%26% 17%
46%
10% 8% 11%11%
12% 13% 14%5%
FY10 FY11 1H11 1H12
Biscuit Chocolate Cake Other
Stable revenue generation
17
Sales Volume – (k tons*)
Net Sales, TL mn †
• Consolidated sales volume increased by 37.5% to 200,872 tonnes,
mainly driven by consolidation of the chocolate and cake businesses,
coupled with restructuring of the sales and distribution companies
• Consolidated revenues for the first half of 2012 were TL 1,141 million, an
increase of 55.7% when compared to revenues of TL 733 million
recorded in the same period of 2011
• Export sales accounted for 19.6% of total sales in 1H12
• Gross profit increased by 77% to TL 254 million compared to gross profit
of TL 143 million recorded in the first half of 2011
• Gross margin improved to 22.3% in the first six months of 2012, from
19.6% in the same period of 2011
• Consolidated adjusted EBITDA (excluding other operating
income/expense) for the first half of 2012 was TL 112 million compared to
TL 31 million in the same period of 2011
• Adjusted EBITDA margin was 9.8% compared to 4.2% recorded in the
same period of 2011
• Net income for the first half of 2012 totaled TL 115 million, a significant
increase compared to a net loss of TL 1.9 million recorded for the same
period of 2011 (excluding the gain on the sale of a financial asset
amounting to TL 610 million)
* Excluding the Non-confectionery sales volume; and 1Q11 flour sales volume
1H12 figures include chocolate and cake operations
† Following acquisition of Ülker Çikolata in 2011, chocolate operations has been consolidated in
2011 figures for the last quarter
• In 2012, Ülker is forecast to post net sales of TL2.3-TL2.5 bn with an
EBITDA margin of 8.5%
• EBITDA margin is expected to reach 12% levels in 2014
• Gross margin is expected to improve with stabilizing commodity prices
and increased control on cost base
301 328 146 201
1,523.5 1,798.8 732.8 1,141.0
Guidance
81%73%
85%
56%
8% 17%9%
30%
11% 10% 7% 14%
FY10 FY11 1H11 1H12
Biscuit Chocolate Cake

18
* EBITDA, excluding Net other operating income/expense 1h12 figures include chocolate and cake operations 2011 figures include 4Q chocolate results All figures in TL MM, except per share
Financial Summary 1
.41
2
1.5
06
1.5
24
1.7
99
73
3
1.1
41
2008 2009 2010 2011 1H11 1H12
Net Sales (TL mn)
30
6
37
9
32
6
36
4
14
3
25
4
2008 2009 2010 2011 1H11 1H12
Gross Profit (TL mn)
97 1
47
58 1
11
27
10
5
2008 2009 2010 2011 1H11 1H12
Operating Profit (TL mn)
95 1
44
67
75
31
11
2
2008 2009 2010 2011 1H11 1H12
EBITDA (TL mn)*
19
12
0 19
1
66
9
60
8
11
5
2008 2009 2010 2011 1H11 1H12
Net Profit (TL mn)
0,0
5
0,3 0
,54 1,9
2
1,7
7
0,2
9
2008 2009 2010 2011 1H11 1H12
EPS
19
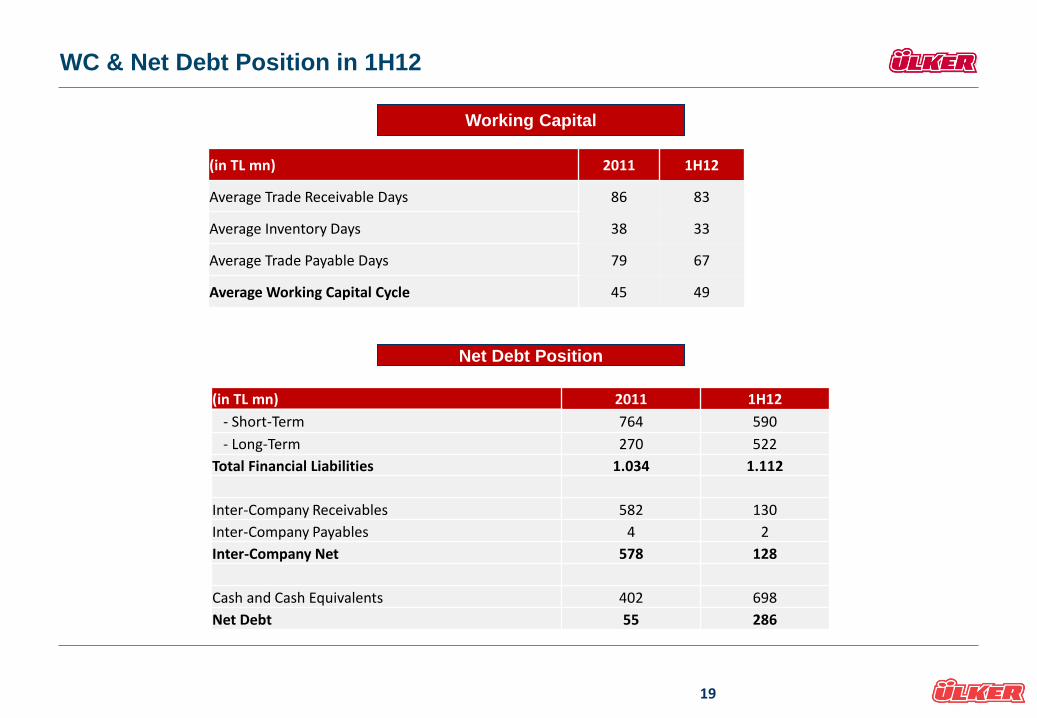
(in TL mn) 2011 1H12
Average Trade Receivable Days 86 83
Average Inventory Days 38 33
Average Trade Payable Days 79 67
Average Working Capital Cycle 45 49
(in TL mn) 2011 1H12
- Short-Term 764 590
- Long-Term 270 522
Total Financial Liabilities 1.034 1.112
Inter-Company Receivables 582 130
Inter-Company Payables 4 2
Inter-Company Net 578 128
Cash and Cash Equivalents 402 698
Net Debt 55 286
WC & Net Debt Position in 1H12
Net Debt Position
Working Capital
Ülker Strategy and Expectations
Ülker strategy and expectations
21
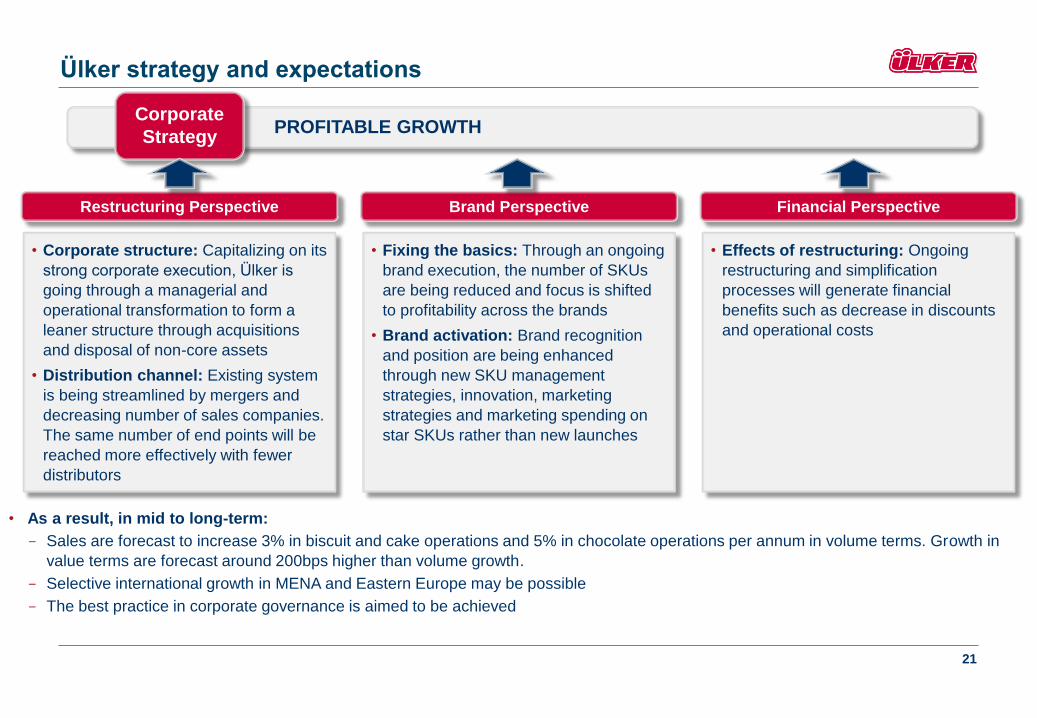
PROFITABLE GROWTH Corporate
Strategy
• As a result, in mid to long-term:
- Sales are forecast to increase 3% in biscuit and cake operations and 5% in chocolate operations per annum in volume terms. Growth in
value terms are forecast around 200bps higher than volume growth.
- Selective international growth in MENA and Eastern Europe may be possible
- The best practice in corporate governance is aimed to be achieved
Brand Perspective
• Fixing the basics: Through an ongoing
brand execution, the number of SKUs
are being reduced and focus is shifted
to profitability across the brands
• Brand activation: Brand recognition
and position are being enhanced
through new SKU management
strategies, innovation, marketing
strategies and marketing spending on
star SKUs rather than new launches
Restructuring Perspective
• Corporate structure: Capitalizing on its
strong corporate execution, Ülker is
going through a managerial and
operational transformation to form a
leaner structure through acquisitions
and disposal of non-core assets
• Distribution channel: Existing system
is being streamlined by mergers and
decreasing number of sales companies.
The same number of end points will be
reached more effectively with fewer
distributors
Financial Perspective
• Effects of restructuring: Ongoing
restructuring and simplification
processes will generate financial
benefits such as decrease in discounts
and operational costs

Appendices

A. Financial Statements

Income statements
24
Income Statement (in TL mn) 2008 2009 2010 2011* 1H11 1H12
Sales Revenue 1,412 1,506 1,524 1,799 733 1.141
Cost of Sales (1,106) (1,128) (1,197) (1,435) (589) (887)
Gross Profit 306 379 326 364 143 254
Gross Profit Margin 22% 25% 21% 20% 20% 22%
OPEX (235) (266) (286) (319) (127) (165)
Marketing, Sales and Distribution Expenses (182) (200) (228) (252) (100) (110)
General Administration Expenses (52) (65) (57) (65) (26) (51)
Research and Development Expenses (1) (1) (1) (3) (1) (4)
Other Operating Income /Expense 26 34 18 66 11 16
Operating Profit 97 146 58 111 27 105
Operating Profit Margin 7% 10% 4% 6% 4% 9%
Share in net profit of inv. accounted for equity method (15) (3) (14) (13) (8) -
Finance Income/Expenses (58) 2 179 621 628 40
Profit Before Taxation 24 145 224 720 647 145
Tax Charge from Continued Operations (4) (25) (32) (51) (40) (30)
Net Profit 19 120 191 669 608 115
EBITDA** 95 144 67 75 31 112
EBITDA Margin** 6.7% 9.5% 4.4% 4.2% 4,2% 9,8%
* 2011 Income Statement does not include Fresh Cake figures, whereas chocolate operations has been consolidated solely for the last quarter
** EBITDA, excluding Net other operating income/expense
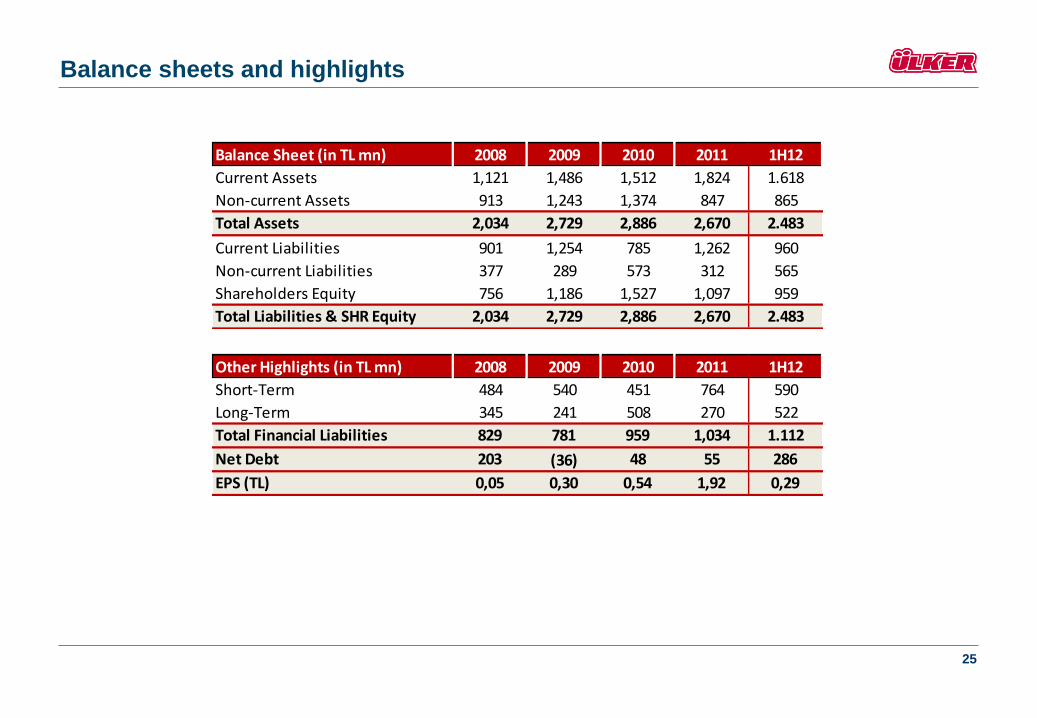
Balance sheets and highlights
25
Balance Sheet (in TL mn) 2008 2009 2010 2011 1H12
Current Assets 1,121 1,486 1,512 1,824 1.618
Non-current Assets 913 1,243 1,374 847 865
Total Assets 2,034 2,729 2,886 2,670 2.483
Current Liabilities 901 1,254 785 1,262 960
Non-current Liabilities 377 289 573 312 565
Shareholders Equity 756 1,186 1,527 1,097 959
Total Liabilities & SHR Equity 2,034 2,729 2,886 2,670 2.483
Other Highlights (in TL mn) 2008 2009 2010 2011 1H12
Short-Term 484 540 451 764 590
Long-Term 345 241 508 270 522
Total Financial Liabilities 829 781 959 1,034 1.112
Net Debt 203 (36) 48 55 286
EPS (TL) 0,05 0,30 0,54 1,92 0,29