managing for profitability - oerlikon group -purchasing program exceeds expectations ... consol 12...
TRANSCRIPT
Managing for profitability
Zurich, March 27, 2008

Page 2 2007 annual presentation
Disclaimer
This presentation is based on information currently available tomanagement. The forward-looking statements contained herein could be substantially impacted by risks and influences that are not foreseeable at present, so that actual results may vary materially from those anticipated, expected or projected.

Page 3 2007 annual presentation
Executive summary of fiscal year 2007
Fiscal year 2007 results
Business strategy and outlook
Agenda
Page 4 2007 annual presentation
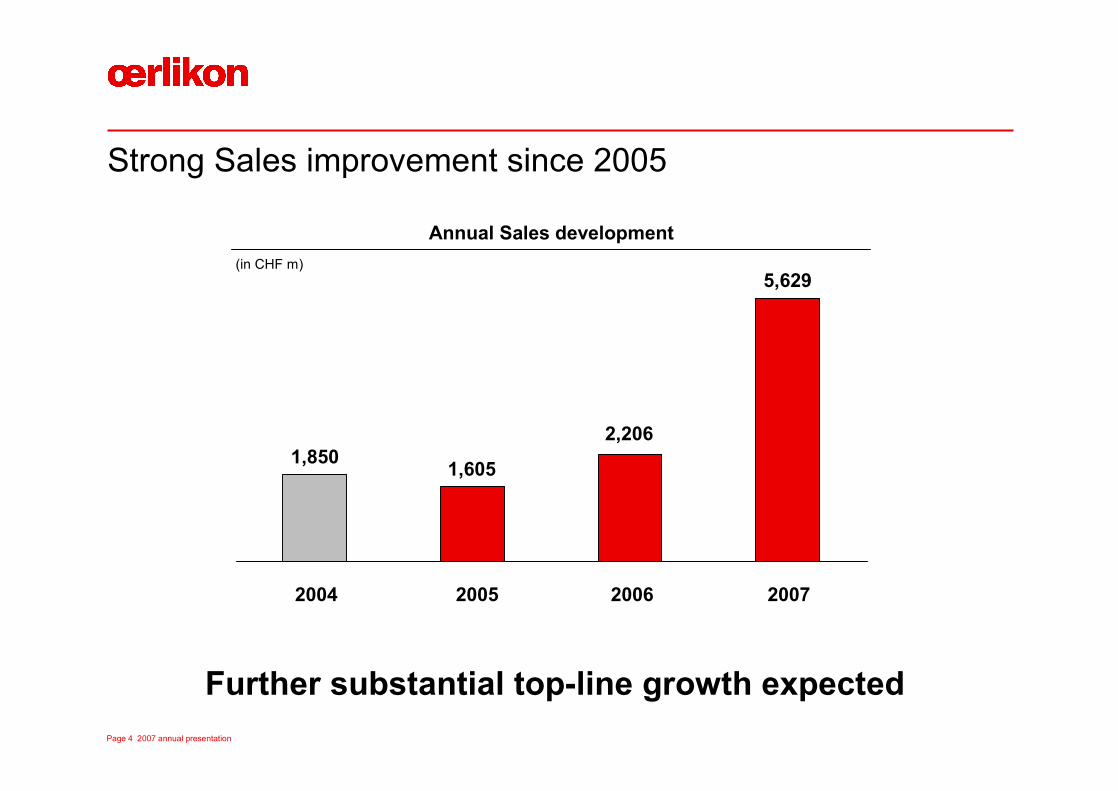
Strong Sales improvement since 2005
20072004 2005 2006
Annual Sales development
Further substantial top-line growth expected
(in CHF m)
1,850 1,605
2,206
5,629

Page 5 2007 annual presentation
Sustainable EBIT improvement since 2004
20072004
496
2005
-329
2006
Annual EBIT development
Three consecutive years with strong EBIT improvement
(in CHF m)
329
34
Page 6 2007 annual presentation
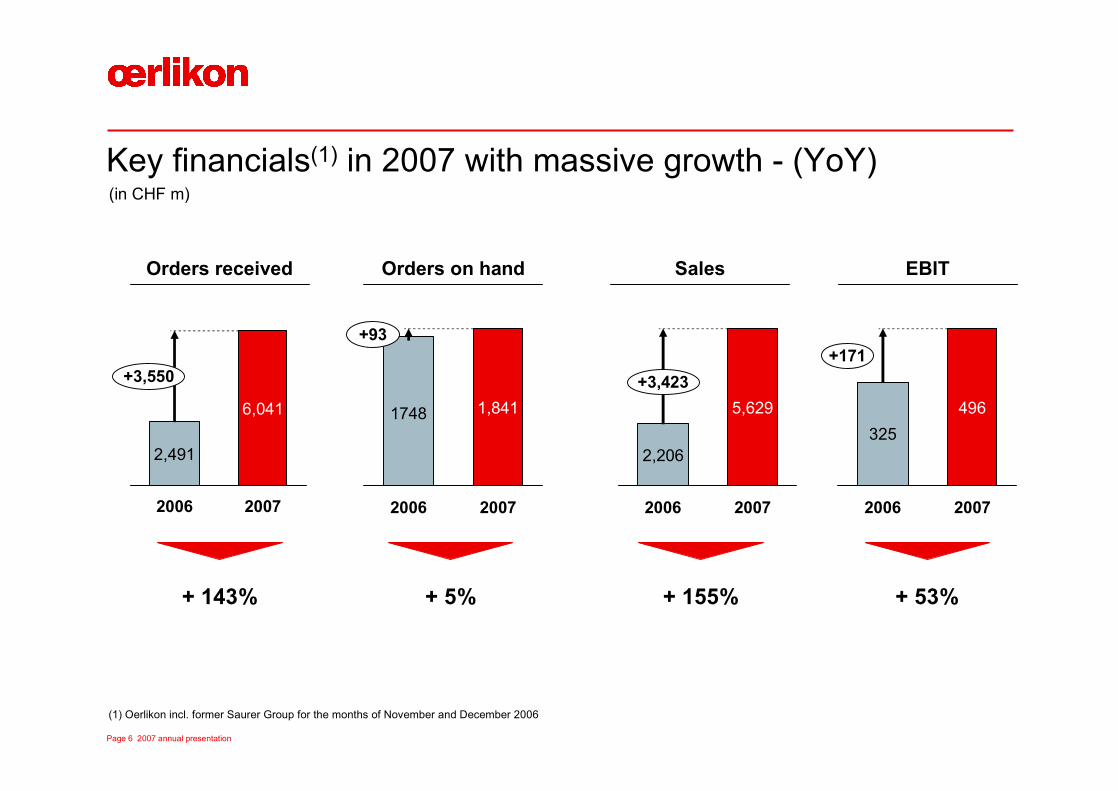
Key financials(1) in 2007 with massive growth - (YoY)
(1) Oerlikon incl. former Saurer Group for the months of November and December 2006
2,491
2006
6,041
2007
+3,550
Orders received Sales EBITOrders on hand
(in CHF m)
1748
2006
1,841
2007
+93
2,206
2006
5,629
2007
+3,423
325
2006
496
2007
+171
+ 143% + 5% + 155% + 53%

Page 7 2007 annual presentation
Pro forma(1) key financials with double digit growth
5,220
2006(1)
6,041
2007
+821
Orders received Sales EBITOrders on hand
(in CHF m)
1,748
20072006(1)
1,841
+93
4,684
20072006(1)
5,629
+945
510
+ 15.7% + 5.3% + 20.2% + 15.3%
430
2007
496
2006(1)
+66
(1) Pro forma presentation assuming an initial consolidation of the Saurer Group as per January 1, 2006

Page 8 2007 annual presentation
Strong cash conversion adds to financial leeway
§ Operative CF improved from CHF 382 m (2006) to CHF 682 m (2007)§ Total available liquidity at CHF 1.7 bn as of Dec. 31, 2007
Financial measures provide flexibility for the future
-35
credit
facili
ty
short t
erm fin
.
liabil
ities
long t
erm fin
.
liabil
ities av
ailable
debt
cash
mark. s
ec. inc
l.
treas
ury sh
ares
total
avail
able
liquid
ity
2,500
-1,748
717
484
504 1,705(in CHF m)
Page 9 2007 annual presentation
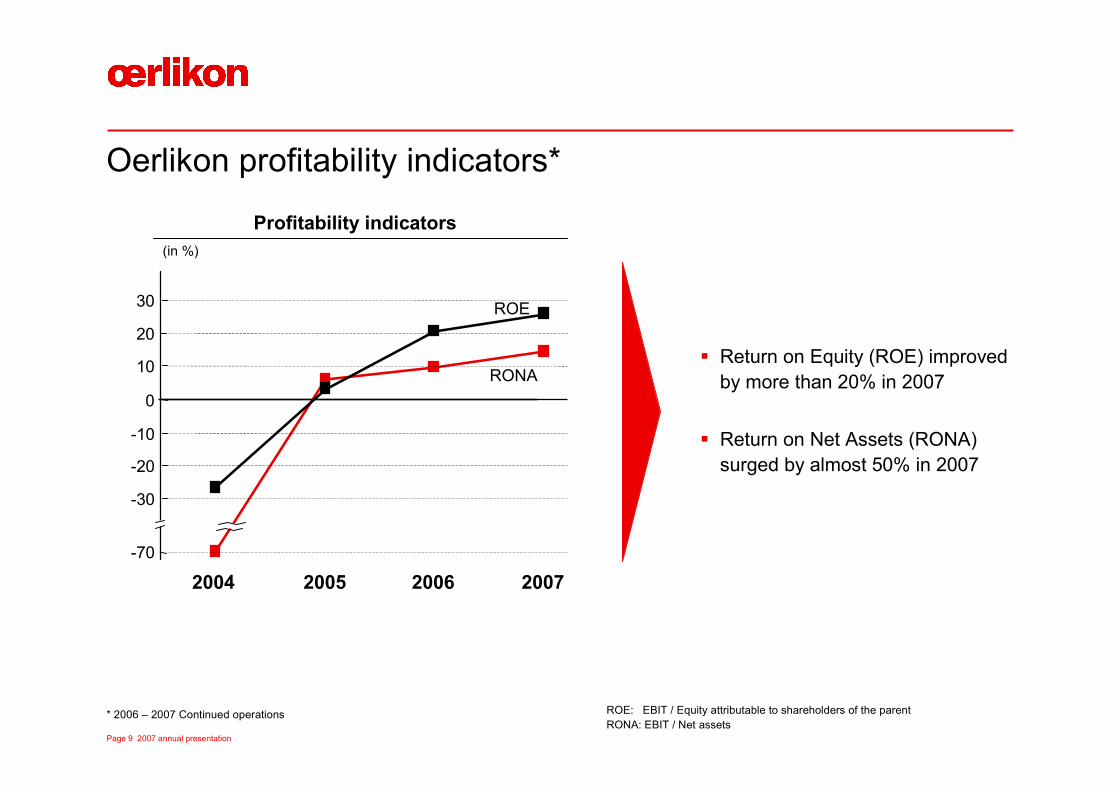
Oerlikon profitability indicators*
20
30
-10
-20
-30
2004 2005 2006
RONA0
10
-70
ROE
Profitability indicators (in %)
§ Return on Equity (ROE) improved by more than 20% in 2007
§ Return on Net Assets (RONA) surged by almost 50% in 2007
* 2006 – 2007 Continued operations
2007
ROE: EBIT / Equity attributable to shareholders of the parentRONA: EBIT / Net assets

Page 10 2007 annual presentation
80
90
100
110
120
130
140
150
01/07 02/07 03/07 04/07 05/07 06/07 07/07 08/07 09/07 10/07 11/07 12/07
Inde
x [D
ec.0
6 =
100]
Institutional Retail
Significant expansion of our shareholder base(1)
51%Others
28%Victory
14% Renova
7%
Oerlikon
§ Oerlikon treasury shares and 2 key shareholders hold around 49%
§ Free float increased to 29% from 25%
(1) As per Dec. 31, 2007
Currently > 9,000 investors in our share register
§ Total shareholder base rose by 20% or ~1,300 shareholders (2)
§ Institutional shareholder base increased by 42% (2)
§ Retail investor base plus 18% (2)
(2) Change in number of registered shareholders, Dec. 31 2006 vs. Dec. 31 2007
Shareholder base development
Page 11 2007 annual presentation
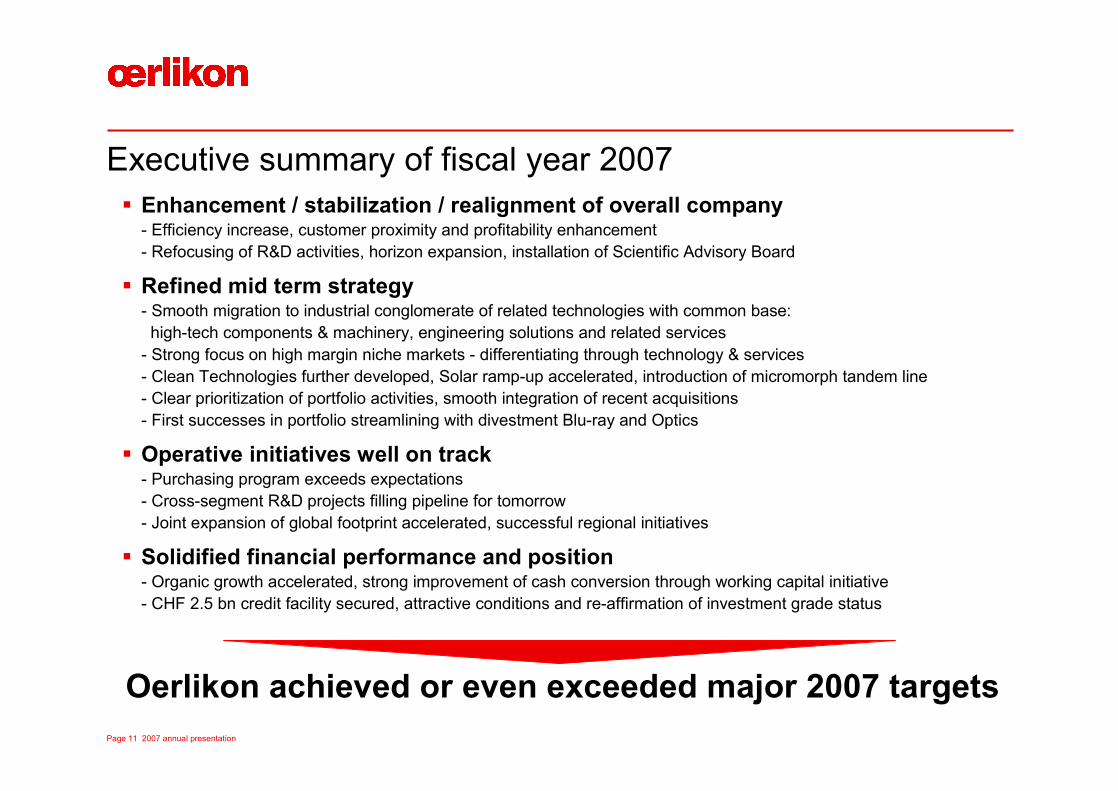
§ Enhancement / stabilization / realignment of overall company- Efficiency increase, customer proximity and profitability enhancement- Refocusing of R&D activities, horizon expansion, installation of Scientific Advisory Board
§ Refined mid term strategy- Smooth migration to industrial conglomerate of related technologies with common base:
high-tech components & machinery, engineering solutions and related services- Strong focus on high margin niche markets - differentiating through technology & services - Clean Technologies further developed, Solar ramp-up accelerated, introduction of micromorph tandem line - Clear prioritization of portfolio activities, smooth integration of recent acquisitions- First successes in portfolio streamlining with divestment Blu-ray and Optics
§ Operative initiatives well on track- Purchasing program exceeds expectations- Cross-segment R&D projects filling pipeline for tomorrow- Joint expansion of global footprint accelerated, successful regional initiatives
§ Solidified financial performance and position- Organic growth accelerated, strong improvement of cash conversion through working capital initiative- CHF 2.5 bn credit facility secured, attractive conditions and re-affirmation of investment grade status
Executive summary of fiscal year 2007
Oerlikon achieved or even exceeded major 2007 targets

Page 12 2007 annual presentation
Oerlikon priorities 2008 and beyond§ Realize potential of Solar business
- Further establish micromorph tandem cell as industry leader- Deliver grid parity by 2010 with today's technology- Drive global thin-film ramp-up (incl. expansion of offering)
§ Focused growth strategies – value generation in key businesses- Coating Services: drive global/offering scale – technology leadership- Drive Systems: full potential niche strategy- Vacuum: strategic growth – production and sales in Asia- Space: increase scale and scope in attractive niche
§ Manage cyclical businesses and improve profitability- Textile: completion of value chain - product portfolio and market segment expansion- Esec: leverage product innovations and improve sales and pricing
§ Portfolio: selected acquisitions in focus BUs – consequent portfolio streamlining- Coating: continue selected expansion- Blu-ray / DVD: Divestment completed, Optics divestment in progress
§ Center: Efficient center, wave 2 purchasing (i.e. LCC), R&D / innovations§ Leadership: further strengthen strong leadership – systematic approach to
continuously upgrade our talent pipeline, continued communication
Target 2008: Sales > CHF 6 bn, further EBIT increase

Page 13 2007 annual presentation
Executive summary of fiscal year 2007
Fiscal year 2007 results
Business strategy and outlook
Agenda
Page 14 2007 annual presentation
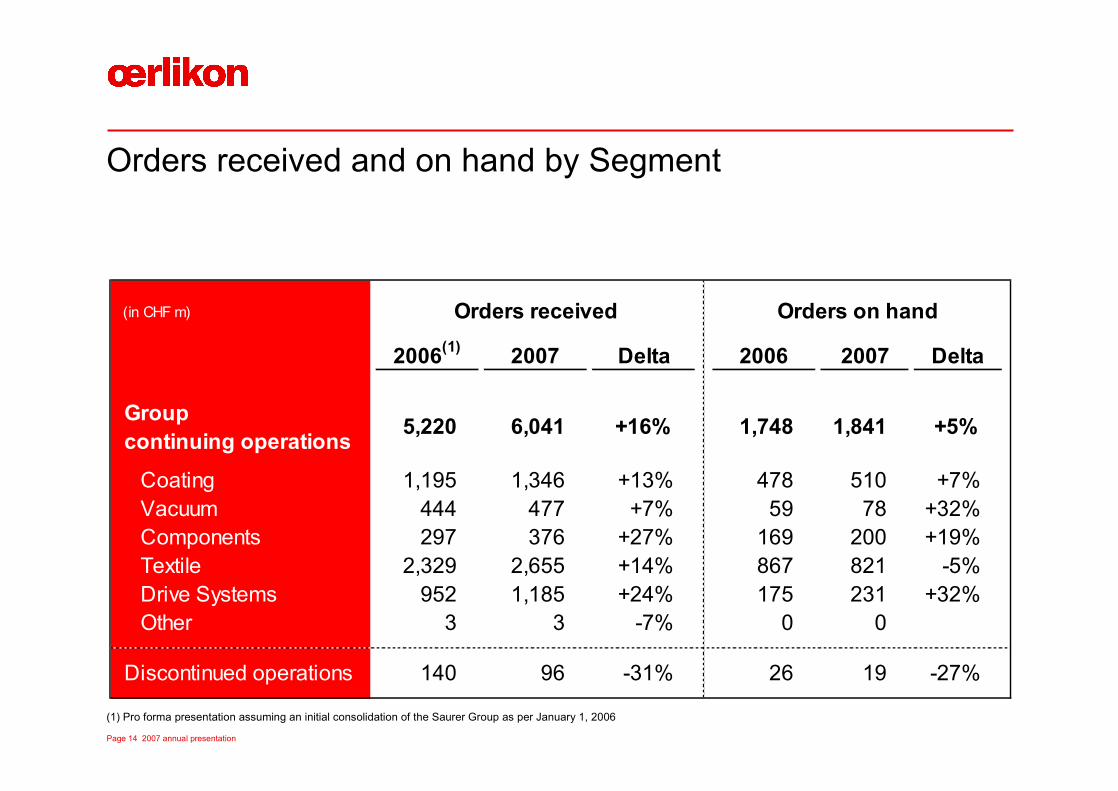
Orders received and on hand by Segment
(in CHF m)
2006(1) 2007 Delta 2006 2007 Delta
Groupcontinuing operations 5,220 6,041 +16% 1,748 1,841 +5%
Coating 1,195 1,346 +13% 478 510 +7%Vacuum 444 477 +7% 59 78 +32%Components 297 376 +27% 169 200 +19%Textile 2,329 2,655 +14% 867 821 -5%Drive Systems 952 1,185 +24% 175 231 +32%Other 3 3 -7% 0 0
Discontinued operations 140 96 -31% 26 19 -27%
Orders received Orders on hand
(1) Pro forma presentation assuming an initial consolidation of the Saurer Group as per January 1, 2006
Page 15 2007 annual presentation
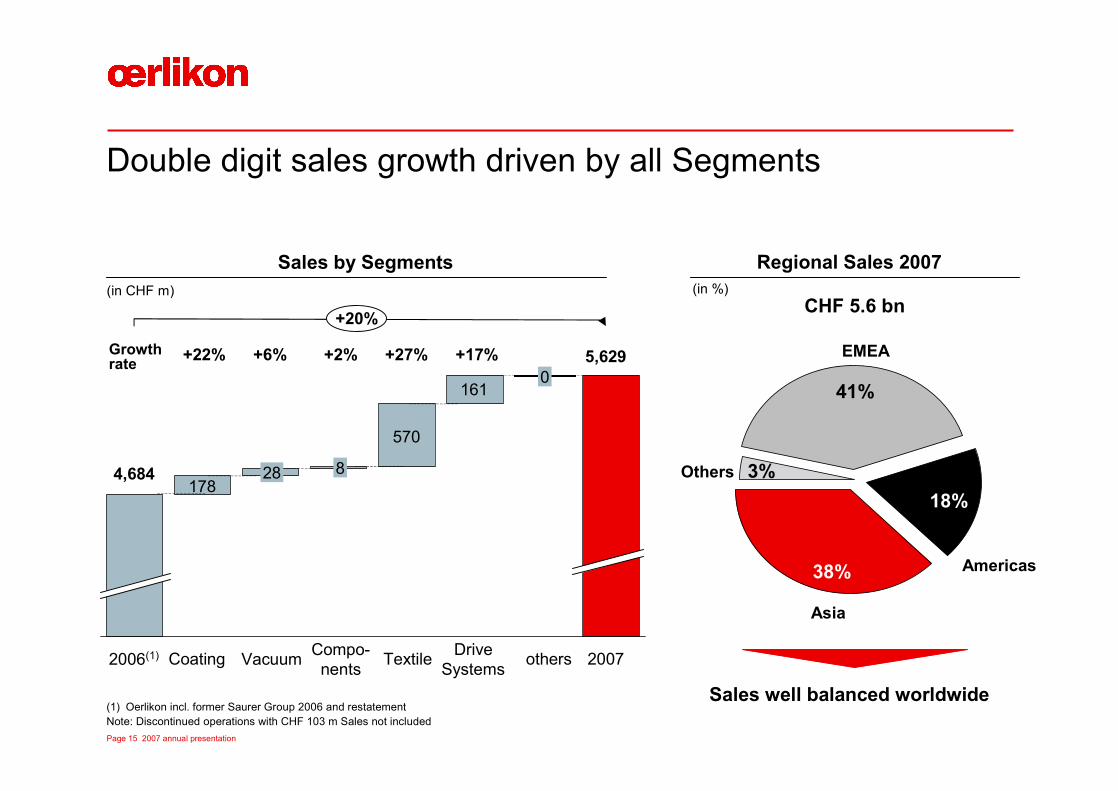
Double digit sales growth driven by all Segments
Textile
8
2006(1) Coating
28
0
DriveSystems 2007others Vacuum Compo-
nents
(1) Oerlikon incl. former Saurer Group 2006 and restatementNote: Discontinued operations with CHF 103 m Sales not included
+22% +6% +2% +27% +17%Growthrate
4,684
5,629
570
178
161
+20%
Asia
Regional Sales 2007
CHF 5.6 bn
Others
EMEA
18%
Americas38%
41%
3%
Sales by Segments
Sales well balanced worldwide
(in CHF m) (in %)

Page 16 2007 annual presentation
14080
Others/Consol
12
Coating
8
Vacuum
22
Components Textile
7
Drive Systems
430(1)
496
Keydrivers
(1) Pro forma presentation assuming an initial consolidation of the Saurer Group as per January 1, 2006Note: Continued operations
Double digit EBIT growth mainly driven by an extraordinarily successful year for Textile
20072006(1)
EBIT margin
430
496
Improvedvolume (+14%)
and marginof Balzers
Volume(+6%);
enhanced product portfolio
Excellent year for Space
(volume +16%);US$-impact on
Esec margin
Significantly improved volume of
Schlafhorstand Barmag
Improvementin volume(+17%);
clean tech new market
Non-recurring financial
gains in 2006
+15%(in CHF m)
+9% + 17% -39% +205% +10%
+15% +12% +10% +8% +7%
Growthrates
79

Page 17 2007 annual presentation
Cash flow – strong operating cash flow embedded in measurement matrix
(1) Before change in net current assets and tax
678
479
2006(2) 2007
+199
Operating cash flow(1)
Measurement matrixImplementation for FY 2007
§ Sales, EBIT and cash flow targets for incentive system
§ Incentive system harmonized, simplified and broadened:- Top management: 60% fix, 40% variable
- Senior management: 70% fix, 30% variable
(in CHF m)
(2) Pro forma presentation assuming an initial consolidation of the Saurer Group as per January 1, 2006

Page 18 2007 annual presentation
1,071
Cash flow – highly improved working capital intensity
20072006
1,160(3)
-89
Working capital(1)
7177
2006 2007
5054
20072006
4941
20072006
Working capital needs reduced by CHF 230 m
DIO(2) DSO(2) DPO(2)
(1) receivables gross – payables + inventory gross(2) DIO: Days Inventory Outstanding; DSO: Days Sales Outstanding; DPO: Days Payables Outstanding(3) Excluding CHF 277 m accounts payable for Saurer squeeze out
(in CHF m)

Page 19 2007 annual presentation
347349 235
202
(1) Pro forma presentation assuming an initial consolidation of the Saurer Group as per January 1, 2006; (2) w/o impairment
Cash flow - stable capex in growing business environment
Depreciation & amortizationCapex
+0%
2006(1) 2007 2006(1) 2007
+16%
1.7
1.5
2006(1) 2007
Capex / Depreciation ratio
(in CHF m) (in CHF m)

Page 20 2007 annual presentation
Group financing
§ Total CHF 2.5 bn: CHF 600 m term loan for 3 years, CHF 1,900 m revolving facility for 5 years
§ Very attractive margins: 40/45 BP indicate clear investment grade rating
§ One financial covenant (net debt/EBITDA)
§ No assets pledged
Successful syndication of credit facility
Successful tender offer for Saurer Bond
§ More than 95% of the outstanding nominal amount have been tendered
Benefits from interest and credit market developments
§ Financing based on floating interest rates – interest rate levels have decreased
§ Risk on increasing interest rates limited through interest rate cap
§ Oerlikon not affected by recently increased credit spreads: Oerlikon‘s credit margins were fixed at very attractive levels before credit crisis
Net debt / EBITDA ratio 1.8 (py 2.2) strongly supports investment grade rating of Oerlikon

Page 21 2007 annual presentation
Financial result20072006
-24
1
-19
-7
-4
-73
-20
-31
-49
-128
(in CHF m)
(1) Pro forma presentation assuming an initial consolidation of the Saurer Group as per January 1, 2006; (2) w/o impairment
(1)
Interest on provisions for post-employment benefit plans
FX result
Interest result§ 2007 increase: interest
expense for loans for Saurer acquisition
§ Normalization: favourable refinancing terms and conditions
2007normalized
-4
-20
-5
-68
Other financial result§ 2007 increase: one-time
financing fees for bridge loan Saurer acquisition
-97

Page 22 2007 annual presentation
Active tax management
Increase current income taxes
§ Following the acquisition of Saurer AG the current income taxes increased§ During the year 2007 activities were implemented to mitigate the increase of tax rate§ Full benefit in future years
Increase deferred tax income
§ Improved performance of Oerlikon allowed recognition and utilization of unrecognised tax loss carry forwards from previous periods, resulting in a high deferred tax income
Total income tax rate
§ Total income tax rate of 0,33% (2006) and 5.10% (2007) of Earnings Before Taxes (EBT)
Outlook § Expected total income tax rate for the upcoming years will step-by-step increase to 10-15%
Page 23 2007 annual presentation
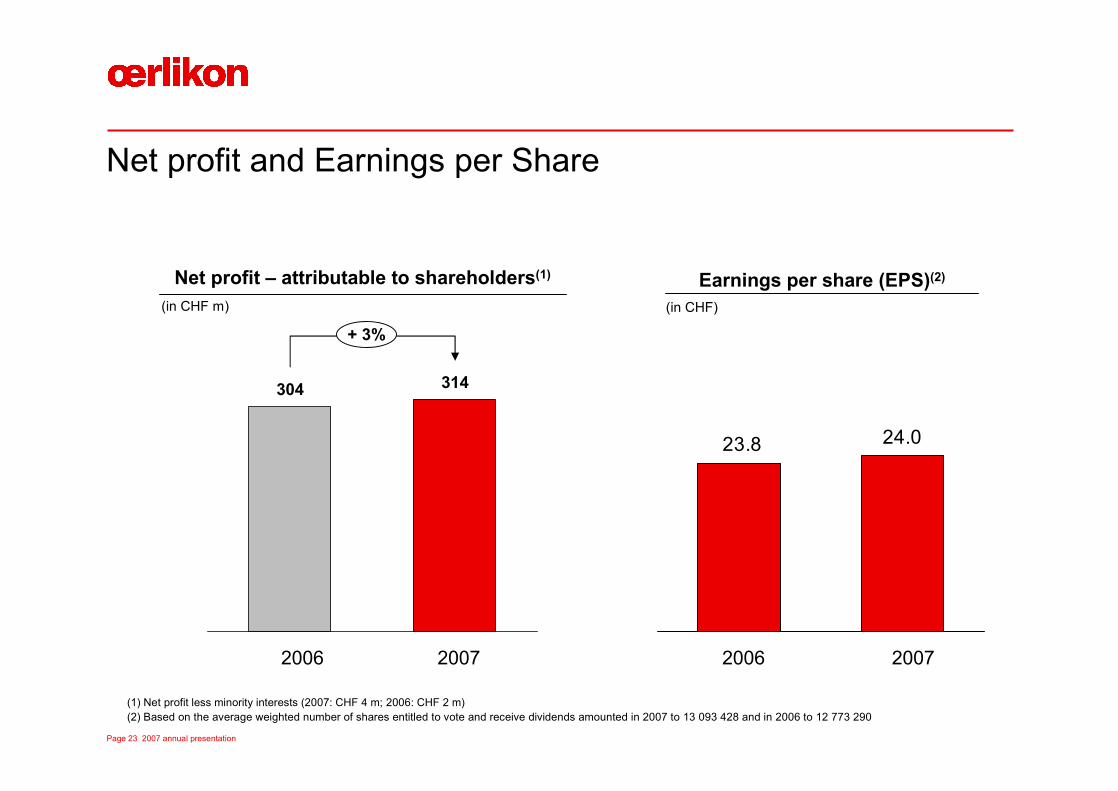
Net profit and Earnings per Share
2006 2007
(1) Net profit less minority interests (2007: CHF 4 m; 2006: CHF 2 m)(2) Based on the average weighted number of shares entitled to vote and receive dividends amounted in 2007 to 13 093 428 and in 2006 to 12 773 290
Net profit – attributable to shareholders(1) Earnings per share (EPS)(2)
24.023.8
20072006
304 314
+ 3%
(in CHF m) (in CHF)

Page 24 2007 annual presentation
Balance sheet shows strong equity basis – effective equity ratio of 35%
Equity
1,8871,512
2006 2007
2,229
2007TreasuryShares(1)
(in CHF m)
342
Equity ratio
2007 2007 incl. Treasuryshares
24% 30% 35%
2006
(in %)
(1) Calculated with share price of 326 CHF; number of treasury shares as of 31.12.2007: 1 048 146Note: Share buyback program started: Oerlikon repurchased 2 660 shares in total at an average price of CHF 395. As of December 31, 2007, the company held a total 1 048 146
shares (7.40 percent of the shares issued).
+ 25%
Page 25 2007 annual presentation
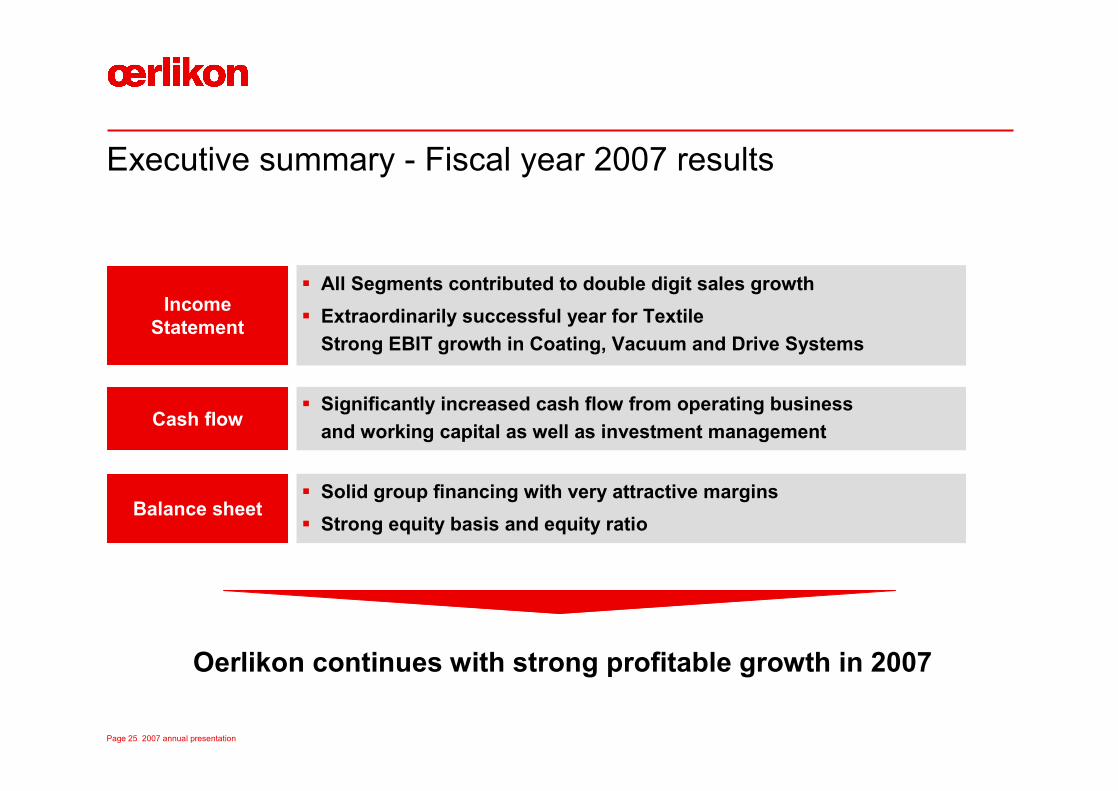
§ All Segments contributed to double digit sales growth§ Extraordinarily successful year for Textile
Strong EBIT growth in Coating, Vacuum and Drive Systems
§ Significantly increased cash flow from operating business and working capital as well as investment management
§ Solid group financing with very attractive margins§ Strong equity basis and equity ratio
Executive summary - Fiscal year 2007 results
Oerlikon continues with strong profitable growth in 2007
Income Statement
Cash flow
Balance sheet

Page 26 2007 annual presentation
Executive summary of fiscal year 2007
Fiscal year 2007 results
Business strategy and outlook
Agenda

Page 27 2007 annual presentation
Six areas of high tech competencies –serving customers around the globe
Oerlikon Vacuum
Oerlikon Textile
Oerlikon Coating
Oerlikon Solar
Oerlikon Drive Systems
Oerlikon Components
Suzhou(China)
Cordobà(Argentina)
Mönchengladb.(Germany)
Employees Asia5,000
Employees Europe11,900
Employees Americas2,100
Lafayette, IN(USA)
Balzers / Trübbach(Switzerland)
Oerlikon locations
Rivoli(Italy)
Greater Noida(India)
Červený Kostelec(Czech Republic)

Page 28 2007 annual presentation
Focus 2007: Build platform for profitable growth and seize opportunities for future expansion
Innovation + Cross Segment R&D
Close to core and beyond
Regional Expansion
Global competence with customer proximity
Our Employees
Training and development
1
3 4
Operational Excellence
Customer focus and competitiveness
2
Compliance ControlledProcesses
ContinousImprovement
OperationalExcellence
Integrated Supply Chain& Lean Manufacturing
Safe ty &Certifications
Business Process Management
Quality Circles
Operational Excellence
Customer focus and competitiveness
2
Compliance ControlledProcesses
ContinousImprovement
OperationalExcellence
Integrated Supply Chain& Lean Manufacturing
Safe ty &Certifications
Business Process Management
Quality Circles
Compliance ControlledProcesses
ContinousImprovement
OperationalExcellence
Compliance ControlledProcesses
ContinousImprovement
OperationalExcellence
Integrated Supply Chain& Lean Manufacturing
Safe ty &Certifications
Business Process Management
Quality Circles
Leveraging joint scale and scope
Positioning individual businesses for sustainable profitable growth
Focusing and strengthening portfolio
2008 priorities and outlook2007

Page 29 2007 annual presentation
Oerlikon Group - strong platform for key business levers
Innovation + Cross Segment R&D
Close to core and beyond
Regional Expansion
Global competence with customer proximity
Our Employees
Training and development
1
3 4
Operational Excellence
Customer focus and competitiveness
2
Compliance ControlledProcesses
ContinousImprovement
OperationalExcellence
Integrated Supply Chain& Lean Manufacturing
Safety &Certifications
Business Process Management
Quality Circles

Page 30 2007 annual presentation
2007 - another year full of great innovations
InnovationIntroductions1
§ Oerlikon Balzers: New high performance coating BALINIT®ALDURA allows for treatment of ultra durable steels and increases productivity by up to 50 percent.
§ Oerlikon Solar: Introduction of the micromorph tandem technology, which increases the productivity of thin-film solar modules by 50 percent and allows for efficiencies in excess of 10 percent.
§ Oerlikon Barmag: POY1-solution WINGS2 initiates paradigm shift through completely new plant concept. Faster commissioning and improved ergonomics will be achieved while space requirements are reduced.
§ Oerlikon Space: New laser system for data communicationtransmits information at a rate exceeding 10 Mbit/s over a distance of up to 1.5 million kilometres.
1 Partly Oriented Yarn2 Winder Integrated Godet System

Page 31 2007 annual presentation
Cross-segment R&D projects are gaining traction
InnovationCross Segment1
Nanotechnology applications for textiles
Vacuum pumps for Racetrack, Clusterline and Solar MFG
Magnetic bearings for turbomolecular vacuum pumpsGraphical control software
Advanced coating applications for automotive industry
§ Textile & Coating
§ Drive Systems & Coating
Cross-segment R&D projects –every day we are discovering more
§ Coating, Solar & Vacuum
§ Vacuum & Textile
Example: joint software platform for Textile, Coating and Solar machines
Applications:§ Oerlikon Coating “application INNOVA“§ Oerlikon Solar “application TCO 1200“§ Oerlikon Solar “application Sun Simulator“
Page 32 2007 annual presentation
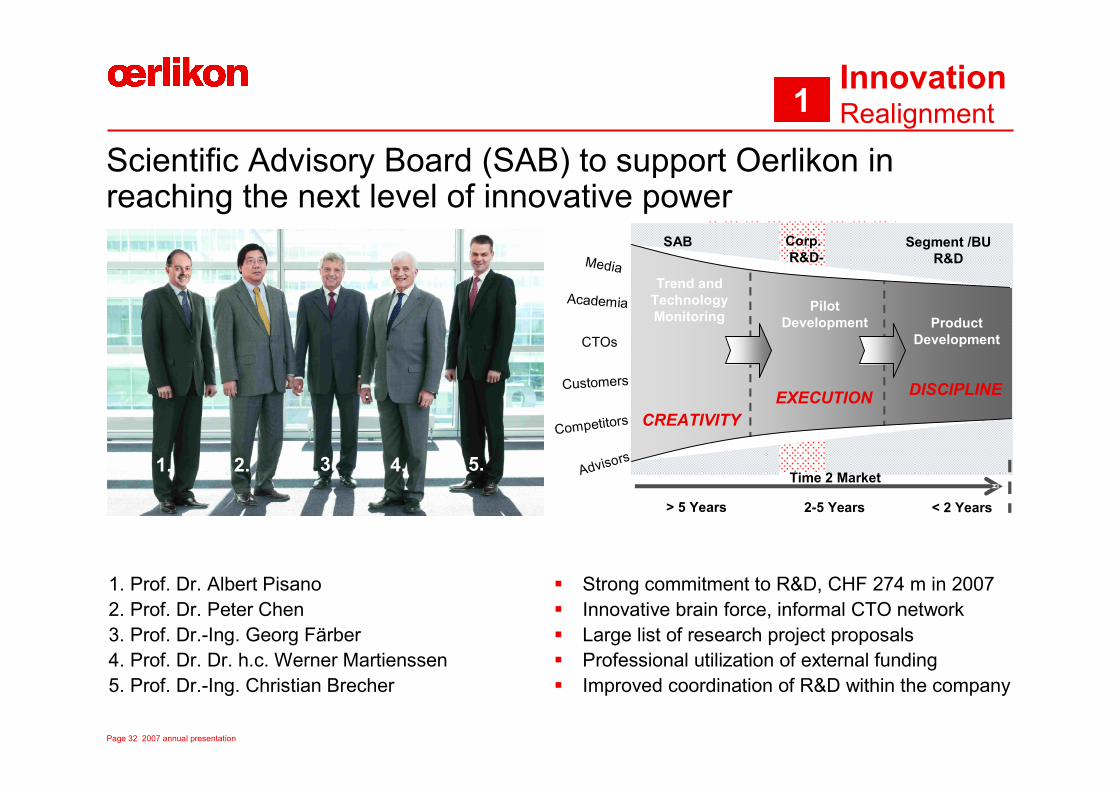
Scientific Advisory Board (SAB) to support Oerlikon in reaching the next level of innovative power
InnovationRealignment1
1. 2. 3. 4. 5.
1. Prof. Dr. Albert Pisano2. Prof. Dr. Peter Chen3. Prof. Dr.-Ing. Georg Färber4. Prof. Dr. Dr. h.c. Werner Martienssen5. Prof. Dr.-Ing. Christian Brecher
§ Strong commitment to R&D, CHF 274 m in 2007§ Innovative brain force, informal CTO network§ Large list of research project proposals§ Professional utilization of external funding§ Improved coordination of R&D within the company
EXECUTION DISCIPLINE
CREATIVITY
Media
Academia PilotDevelopment Product
Development
Trend and TechnologyMonitoring
Advisors
Competitors
CTOs
> 5 Years < 2 Years2-5 Years
Time 2 Market
SAB Segment /BUR&D
Corp.R&D-
Customers

Page 33 2007 annual presentation
“Clean Technologies“ offer huge potential for profitable growth
§ Oerlikon Balzers: High-tech coatings for engine parts increase lifetime 10-fold and reduce fuel consumption
§ Oerlikon Fairfield: Successful entrance into the fast growing market for wind turbines with signing of a multi-year contract for Winergy (Siemens).
§ Oerlikon Vacuum: Establishment as the preferred supplier of vacuum systems for the solar industry, both in crystalline wafer and thin-film technology
Market growth Solar
Market growth Wind
Market growth Hybrids
§ Oerlikon Solar: Turn-key mass manufacturing solutions and related services for thin-film silicon based solar modules, both amorphous or micromorph technology
Oerlikon offerings today
§ Oerlikon Graziano: Zero-emission vehicles made by Norwegian manufacturer TH!NK Technology will be equipped with customized gears from Oerlikon Graziano
>30%
>15%
>20%
2007 2010
2007 2010
2007 2010
Innovation”Clean Tech”1

Page 34 2007 annual presentation
“Nanotechnologies“ likely the next breakout story
“Smart Textile”
§ UV protection§ Water repellence§ Anti-bacteria § Anti-static§ Wrinkle resistant§ Electric conducting
Automotive
§ Fuel cells§ Self cleaning surfaces§ Noise and friction reducing coatings§ Anti-corrosion coatings § Lightweight machine and parts
Energy
§ 3rd GEN solar cells§ Hydrogen and electrical storage
devices§ Nano catalysts
Other “Clean Tech”Applications
§ Air cleaning filters and air qualitymonitoring sensors
§ Energy efficient lighting sources
Possible application fields:
Innovation”Nano Tech”1
ON THE FIBER / FILM
IN THE FIBER / FILM
Photonic crystals with wall widths <125 nm

Page 35 2007 annual presentation
*Savings calculated based on “Last Price” method, include all ~500 initiatives, do not necessarily include all other factors which change material or overhead cost
Extended group purchasing program 2007§ ~100 initiatives, 100% implemented§ Significant cross-BU synergies:
§ 12 direct cross-BU areas§ 10 indirect spend areas
§ Aggressive implementation within each BU§ Organization being adapted with
clear responsibilities by businessand dedicated commodity managers
Next wave complex sourcing –2008 and beyond§ 2008 target more aggressive
based on complex levers esp.§ enforced low cost country sourcing§ value engineering/design-to-cost§ structural improvements
Next wave global sourcing initiated
executed
0
100
200
300
400
2007
~120
2008
Carry over
>150
2008
>100
2009
Carry over
>180
Purchasing savings potential(in CHF m)
Implemented in 2007:Extended group
purchasing program
In preparation for 2008:Next wave –
complex sourcing
2007 20092008
ExcellenceSourcing2
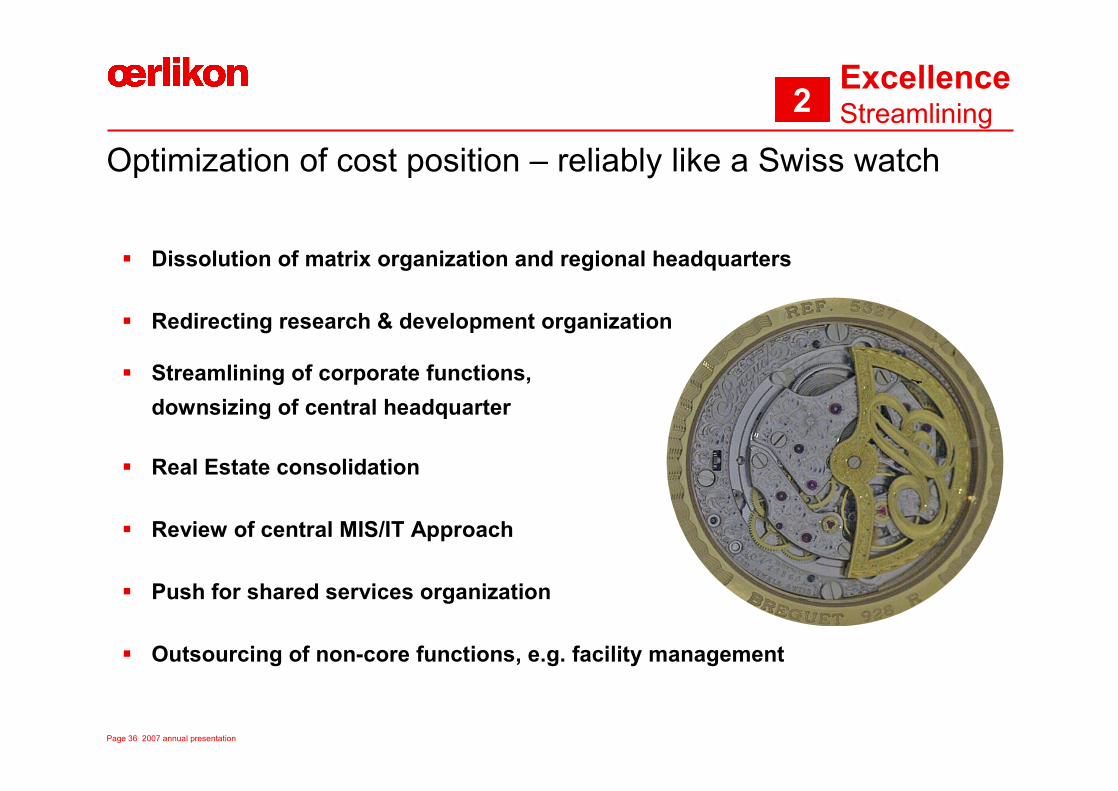
Page 36 2007 annual presentation
ExcellenceStreamlining2
Optimization of cost position – reliably like a Swiss watch
§ Dissolution of matrix organization and regional headquarters
§ Redirecting research & development organization
§ Streamlining of corporate functions, downsizing of central headquarter
§ Real Estate consolidation
§ Review of central MIS/IT Approach
§ Push for shared services organization
§ Outsourcing of non-core functions, e.g. facility management

Page 37 2007 annual presentation
Strong footprint in Asia and expanding in China
China China - Suzhou Expansion Phase II
India
§ Localization 1985, 2,500 employees§ CHF 1 bn sales (+40%) in 2007§ Textile: Staple yarn, chem. fiber § Coating: market growth >50%§ Vacuum: Mechanical TMP § Esec: Wire / die bonder§ Solar: Thin-film techn.
RegionsFocus Countries3
Russia
§ Sales initiative (2007: CHF 50 m)- Local Sales & Marketing- Coating Services & Systems- Textile (filament & nonwoven) - Drive Systems (synchro & axles)
§ Co-operation with Renova§ First Coating Center SOP Q1 2009
§ Establishment of legal entity in Moscow
§ 1500 employees§ 5 production sites, 5 coating centers§ Textile, Drive Syst., Coating, Vacuum§ Sourcing initiatives§ Prod. expansion Drive Systems (>30% growth)§ Sales initiative target 2007 of CHF 400 m
overachieved
§ 30,000 sqm expansion on schedule§ CHF 15-20m investment§ ~17 months construction time§ > CHF 40 m p. a. EBIT impact§ Business Units engaged:
Textile (Schlafhorst, Components)Graziano Drive SystemsCoating (new center, 2,000 sqm., 11.07)
Page 38 2007 annual presentation
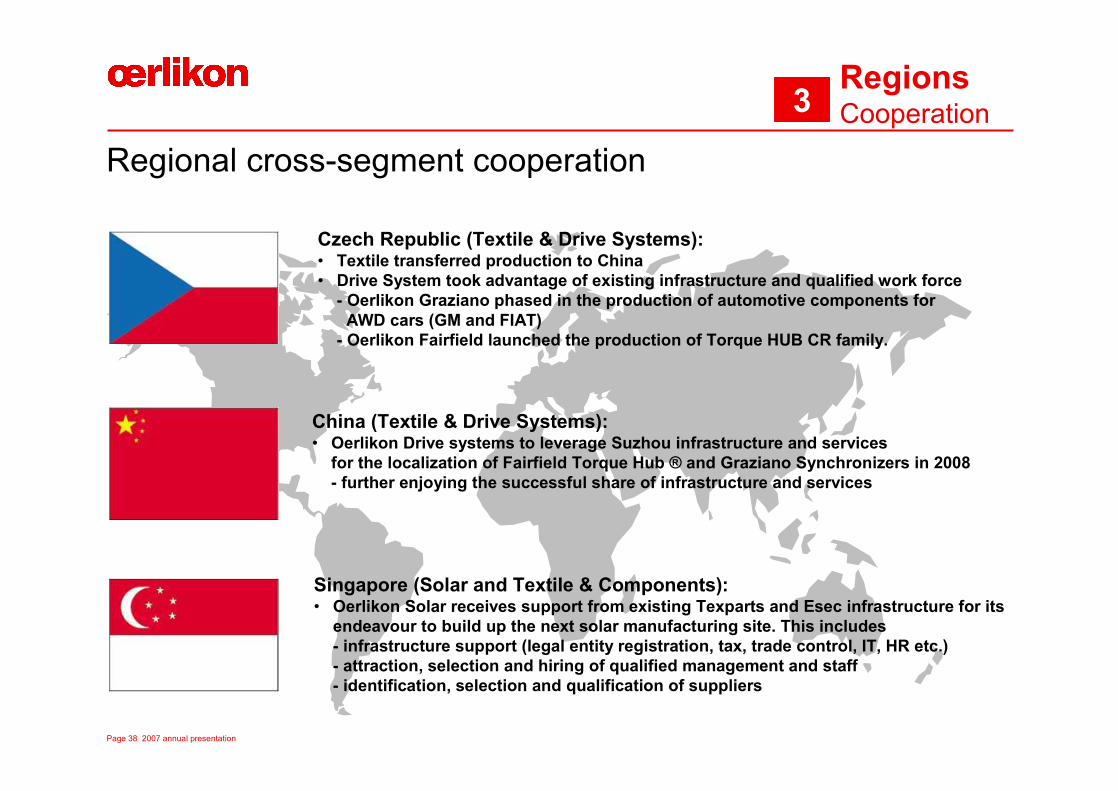
Regional cross-segment cooperation
RegionsCooperation3
Czech Republic (Textile & Drive Systems):• Textile transferred production to China• Drive System took advantage of existing infrastructure and qualified work force
- Oerlikon Graziano phased in the production of automotive components for AWD cars (GM and FIAT)
- Oerlikon Fairfield launched the production of Torque HUB CR family.
China (Textile & Drive Systems):• Oerlikon Drive systems to leverage Suzhou infrastructure and services
for the localization of Fairfield Torque Hub ® and Graziano Synchronizers in 2008- further enjoying the successful share of infrastructure and services
Singapore (Solar and Textile & Components):• Oerlikon Solar receives support from existing Texparts and Esec infrastructure for its
endeavour to build up the next solar manufacturing site. This includes- infrastructure support (legal entity registration, tax, trade control, IT, HR etc.)- attraction, selection and hiring of qualified management and staff- identification, selection and qualification of suppliers
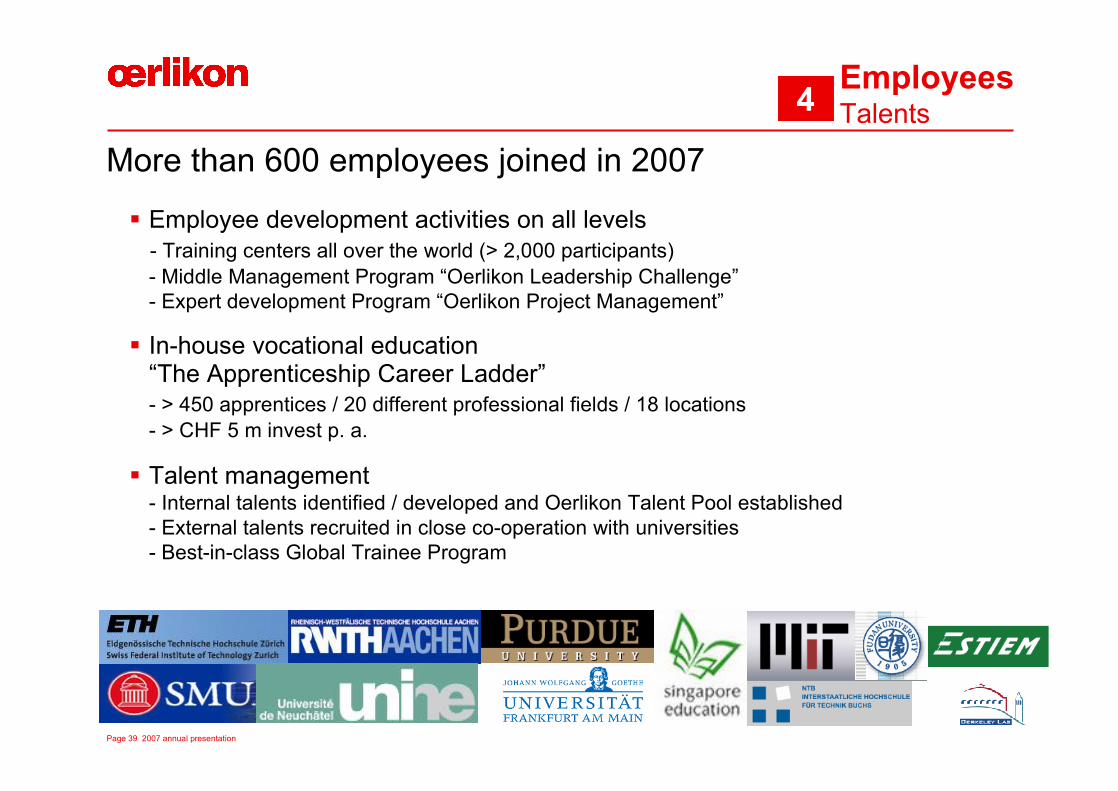
Page 39 2007 annual presentation
More than 600 employees joined in 2007
EmployeesTalents4
§ Employee development activities on all levels- Training centers all over the world (> 2,000 participants)- Middle Management Program “Oerlikon Leadership Challenge”- Expert development Program “Oerlikon Project Management”
§ In-house vocational education“The Apprenticeship Career Ladder”- > 450 apprentices / 20 different professional fields / 18 locations- > CHF 5 m invest p. a.
§ Talent management- Internal talents identified / developed and Oerlikon Talent Pool established- External talents recruited in close co-operation with universities- Best-in-class Global Trainee Program

Page 40 2007 annual presentation
Focus 2007: Build platform for profitable growth and seize opportunities for future expansion
Innovation + Cross Segment R&D
Close to core and beyond
Regional Expansion
Global competence with customer proximity
Our Employees
Training and development
1
3 4
Operational Excellence
Customer focus and competitiveness
2
Compliance ControlledProcesses
ContinousImprovement
OperationalExcellence
Integrated Supply Chain& Lean Manufacturing
Safe ty &Certifications
Business Process Management
Quality Circles
Innovation + Cross Segment R&D
Close to core and beyond
Regional Expansion
Global competence with customer proximity
Our Employees
Training and development
1
3 4
Operational Excellence
Customer focus and competitiveness
2
Compliance ControlledProcesses
ContinousImprovement
OperationalExcellence
Integrated Supply Chain& Lean Manufacturing
Safe ty &Certifications
Business Process Management
Quality Circles
Operational Excellence
Customer focus and competitiveness
2
Compliance ControlledProcesses
ContinousImprovement
OperationalExcellence
Integrated Supply Chain& Lean Manufacturing
Safe ty &Certifications
Business Process Management
Quality Circles
Compliance ControlledProcesses
ContinousImprovement
OperationalExcellence
Compliance ControlledProcesses
ContinousImprovement
OperationalExcellence
Integrated Supply Chain& Lean Manufacturing
Safe ty &Certifications
Business Process Management
Quality Circles
Leveraging joint scale and scope
Positioning individual businesses for sustainable profitable growth
Focusing and strengthening portfolio
2008 priorities and outlook2007

Page 41 2007 annual presentation
Market Dynamics / Growth Drivers
Business Priorities
Competitive situation
Sales
994+22% 816
2006 2007Margin: 17% 15%
Coating: Very strong business momentum – even accelerated by globalization and technology leadership
§ Oerlikon with strong market leadership in coating services
§ Differentiated engineering niche offering in Semiconductor
§ Continued double digit growth of Coating Services market, driven by increased penetration of high-end coatings and strong demand in emerging economies
§ Strong demand for high-tech coating equipment, innovations key to enter new application fields
§ Difficult market outlook for BU Systems with Semiconductor capex expectations reduced for 1HY 2008 - stronger replacement needs expected as of 2HY 2008
§ Further regional expansion through opening of new coating centers – focus on Asia (esp. China, Japan, India)
§ Additional acquisitions in adjacent markets
§ Further improvement of gross profit margin in job coating, optimized asset utilization
§ Downscaling of front end semiconductor business and data storage activities
(in CHF m)
Page 42 2007 annual presentation
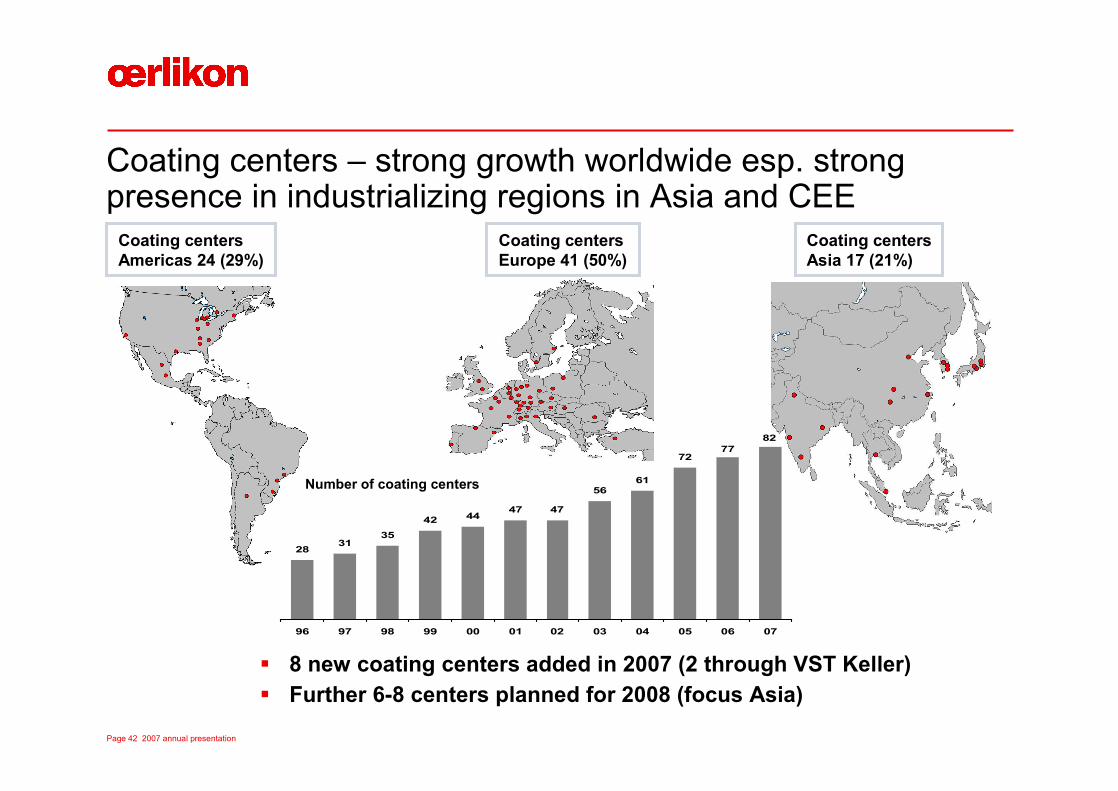
Coating centers – strong growth worldwide esp. strong presence in industrializing regions in Asia and CEE
Coating centersAsia 17 (21%)
Coating centersEurope 41 (50%)
Coating centersAmericas 24 (29%)
§ 8 new coating centers added in 2007 (2 through VST Keller)§ Further 6-8 centers planned for 2008 (focus Asia)
2831
3542 44
47 47
5661
8277
72
96 97 98 99 00 01 02 03 04 05 06 07
Number of coating centers

Page 43 2007 annual presentation
Market Dynamics / Growth Drivers
Business Priorities
Competitive situation
Sales
2006 2007Margin: 11% 12%
Vacuum: Further strengthened position in process industry, additional growth opportunity from Solar
458430+6%
§ Steady market growth well above GDP expected mainly driven by process industry and solar applications (thin-film and crystalline)
§ Above average growth expected in Asia and Europe
§ Gradual market shift from mechanical to magnetic turbomolecular pumps as well as from oil to dry in fore-vacuum
§ Oerlikon with confirmed leadership position
§ Strongholds in process industries and in Europe, increasingly in Solar applications
§ Further ramp up of Solar-related business as full vacuum solution provider
§ Shift of Solutions business to Asia
§ Provision of innovative solutions for our customers with new products and technologies
§ Extension of China factory providing the basis for significant and sustainable sales growth in China and the rest of Asia
(in CHF m)
Page 44 2007 annual presentation
Market Dynamics / Growth Drivers
Business Priorities
Competitive situation
Sales
2006* 2007Margin: 3% 8%
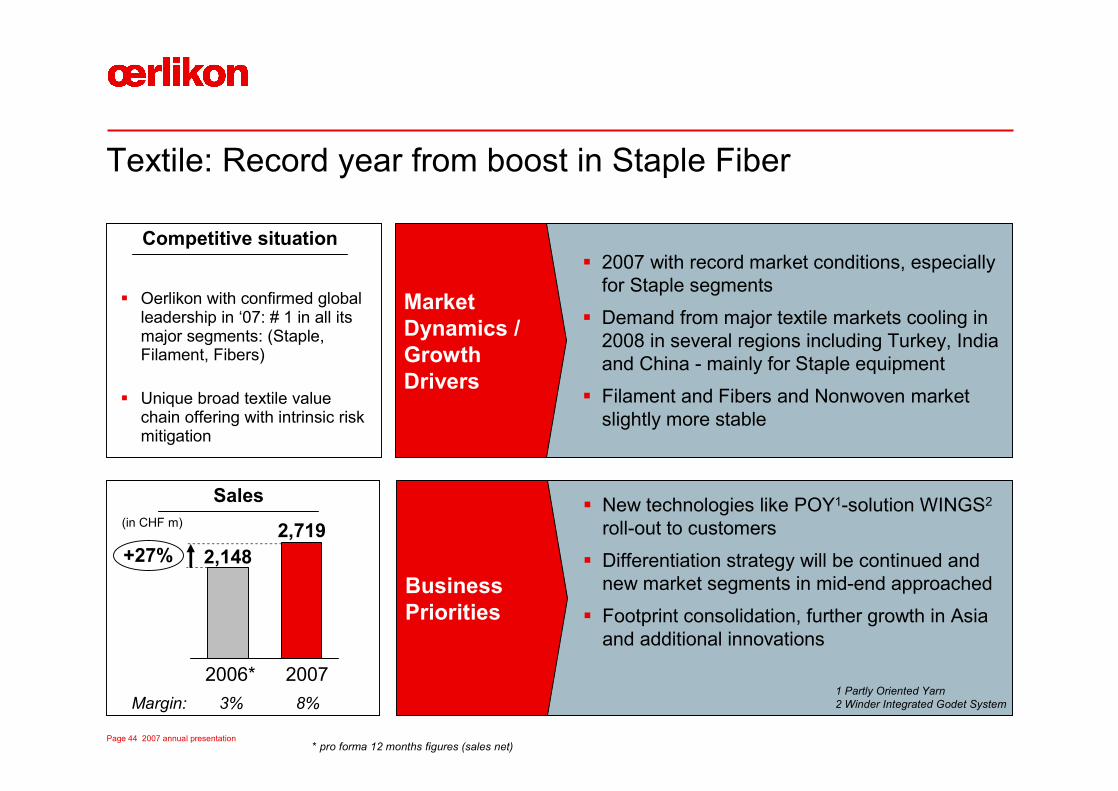
Textile: Record year from boost in Staple Fiber
2,7192,148+27%
* pro forma 12 months figures (sales net)
§ Oerlikon with confirmed global leadership in ‘07: # 1 in all its major segments: (Staple, Filament, Fibers)
§ Unique broad textile value chain offering with intrinsic risk mitigation
§ 2007 with record market conditions, especially for Staple segments
§ Demand from major textile markets cooling in 2008 in several regions including Turkey, India and China - mainly for Staple equipment
§ Filament and Fibers and Nonwoven market slightly more stable
§ New technologies like POY1-solution WINGS2
roll-out to customers
§ Differentiation strategy will be continued and new market segments in mid-end approached
§ Footprint consolidation, further growth in Asia and additional innovations
1 Partly Oriented Yarn2 Winder Integrated Godet System
(in CHF m)

Page 45 2007 annual presentation
Market Dynamics / Growth Drivers
Business Priorities
Competitive situation
Sales
2006* 2007Margin: 8% 7%
Drive Systems: Strengthened in agriculture and construction
* pro forma 12 months figures (sales net)
1,113952+17%
§Stable overall growth and strong growth of the agricultural tractor and machinery market expected§Above average growth in specialty industries including
wind power generation§Stable to improved pricing in high-tech niche markets
§ Increasing market share in gear systems for oil & gas exploration and wind-power systems
§ Expansion in the Asian market, esp. China§ Consolidation of low cost country supply chain
§ Integration of FAL (India) production with GrazianoIndia to meet demand and enhance profitability
§ Enhanced position in hybrid and zero emission vehicle markets
§ Oerlikon with stable market leadership in component niche markets (e.g. agriculture)
(in CHF m)
Page 46 2007 annual presentation
Market Dynamics / Growth Drivers
Business Priorities
Competitive situation
Sales*
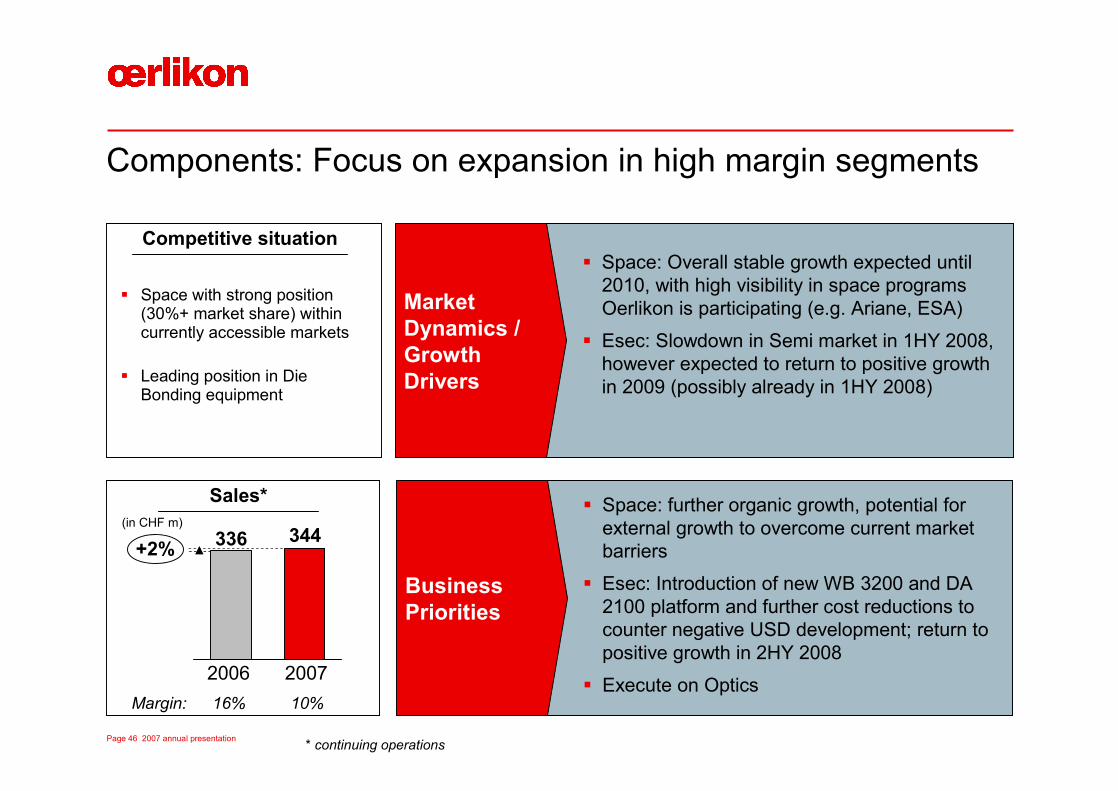
Components: Focus on expansion in high margin segments
2006 2007Margin: 16% 10%
344336+2%
* continuing operations
§ Space with strong position (30%+ market share) within currently accessible markets
§ Leading position in Die Bonding equipment
§ Space: Overall stable growth expected until 2010, with high visibility in space programs Oerlikon is participating (e.g. Ariane, ESA)
§ Esec: Slowdown in Semi market in 1HY 2008, however expected to return to positive growth in 2009 (possibly already in 1HY 2008)
§ Space: further organic growth, potential for external growth to overcome current market barriers
§ Esec: Introduction of new WB 3200 and DA 2100 platform and further cost reductions to counter negative USD development; return to positive growth in 2HY 2008
§ Execute on Optics
(in CHF m)

Page 47 2007 annual presentation
Market Dynamics / Growth Drivers
Business Priorities
Competitive situation
Sales*
Solar: Provider of cost-effective proven equipment, process and turnkey manufacturing solutions to the thin-film solar market
2006 2007
141+119%
309§ Sustainable ramp-up of global operations and
supply chain to match substantial demand growth
§ Continuous improvement / innovation of key components, further increase in module efficiency
§ Focused completion of offering along value chain§ CHF 700 m sales in 2008, CHF 1 bn level in 2009,
positive cash flow despite ramp-up phase
§ Implement Giga Campus concept
§ Solar equipment market growth in value expected in excess of 30% p. a.§ Thin-film new equipment installation in MW
expected to grow by as much as 60% p. a.§ Market will be characterized by cell efficiency
increases, throughput gains and cost decreases
§ Market leader with largest installed customer base in thin-film
§ Only Oerlikon Solar customers with thin-film SI factories in production today
Employees: 359 510
* Pro forma total Sales of future Solar Segment
(in CHF m)

Page 48 2007 annual presentation
Solar: Innovations and scale pave the way to grid parity
Cost of ownership
Capex per WattModule efficiency
Economies of scale through larger fabs
Grid parity
2010200920082006 2007
$/Wp
2012
2007for 20 MWp fabs < 1.5 $/Wp (<1.12€*/Wp)
2010for GWp fabs < 0.7 $/Wp (<0.52€*/Wp)
a-Si:H µc-Si:H
AmorphMicromorph Tandem

Page 49 2007 annual presentation
Installed solar cell manufacturing capacity
0
50
100
150
200
250
2006 2007 2008 2009 2010 2011 2012 2013 2014 2015
GW
p
Crystalline Silicon Thin-film
Solar will outpace the already fast growing PV market
0
200
400
600
800
1'000
1'200
2006 2007 2008p 2009p
(in CHF m)
Sales* targets
>1‘000
>700
>300
>140
Order intake 2007 > CHF 650 m
*Sales 06-07 pro forma, 08- Solar will be reported as separate segment
2006-2015 CAGRThin-film 74.8%C-Si 49.4%Total market 54.0%

Page 50 2007 annual presentation
Focus 2007: Build platform for profitable growth and seize opportunities for future expansion
Innovation + Cross Segment R&D
Close to core and beyond
Regional Expansion
Global competence with customer proximity
Our Employees
Training and development
1
3 4
Operational Excellence
Customer focus and competitiveness
2
Compliance ControlledProcesses
ContinousImprovement
OperationalExcellence
Integrated Supply Chain& Lean Manufacturing
Safe ty &Certifications
Business Process Management
Quality Circles
Innovation + Cross Segment R&D
Close to core and beyond
Regional Expansion
Global competence with customer proximity
Our Employees
Training and development
1
3 4
Operational Excellence
Customer focus and competitiveness
2
Compliance ControlledProcesses
ContinousImprovement
OperationalExcellence
Integrated Supply Chain& Lean Manufacturing
Safe ty &Certifications
Business Process Management
Quality Circles
Operational Excellence
Customer focus and competitiveness
2
Compliance ControlledProcesses
ContinousImprovement
OperationalExcellence
Integrated Supply Chain& Lean Manufacturing
Safe ty &Certifications
Business Process Management
Quality Circles
Compliance ControlledProcesses
ContinousImprovement
OperationalExcellence
Compliance ControlledProcesses
ContinousImprovement
OperationalExcellence
Integrated Supply Chain& Lean Manufacturing
Safe ty &Certifications
Business Process Management
Quality Circles
Leveraging joint scale and scope
Positioning individual businesses for sustainable profitable growth
Focusing and strengthening portfolio
2008 priorities and outlook2007

Page 51 2007 annual presentation
Oerlikon leverages all portfolio enhancement measures
Optimizebusiness
performance
Determine strategic position / options
Strengthen currentbusinesses
Divest / spin-offbusinesses
Add newbusinesses

Page 52 2007 annual presentation
Focus 2008: Focused profitable growth and rapid portfolio optimization
Innovation + Cross Segment R&D
Close to core and beyond
Regional Expansion
Global competence with customer proximity
Our Employees
Training and development
1
3 4
Operational Excellence
Customer focus and competitiveness
2
Compliance ControlledProcesses
ContinousImprovement
OperationalExcellence
Integrated Supply Chain& Lean Manufacturing
Safe ty &Certifications
Business Process Management
Quality Circles
Operational Excellence
Customer focus and competitiveness
2
Compliance ControlledProcesses
ContinousImprovement
OperationalExcellence
Integrated Supply Chain& Lean Manufacturing
Safe ty &Certifications
Business Process Management
Quality Circles
Compliance ControlledProcesses
ContinousImprovement
OperationalExcellence
Compliance ControlledProcesses
ContinousImprovement
OperationalExcellence
Integrated Supply Chain& Lean Manufacturing
Safe ty &Certifications
Business Process Management
Quality Circles
Leveraging joint scale and scope
Positioning individual businesses for sustainable profitable growth
Focusing and strengthening portfolio
2008 priorities and outlook2007

Page 53 2007 annual presentation
Oerlikon Textile
Oerlikon Coating
Oerlikon Solar
Oerlikon Vacuum
Oerlikon Drive Systems
Oerlikon Components
FY 2008 outlook – flexibility is of the essence!
Oerlikon SegmentsMarket outlook Outlook 2008
mixed
excellent
excellent
good
very good
mixed
§ Expected slow down in textile staple fibre market
§ Ongoing short term visibility and cyclicality in semicon industry
§ Strong demand in solar and coating
§ Solid growth in agriculture and construction
§ Uncertainty remains on FX and global GDP development
mixed
excellent
excellent
very good
very good
mixed
Market visibility
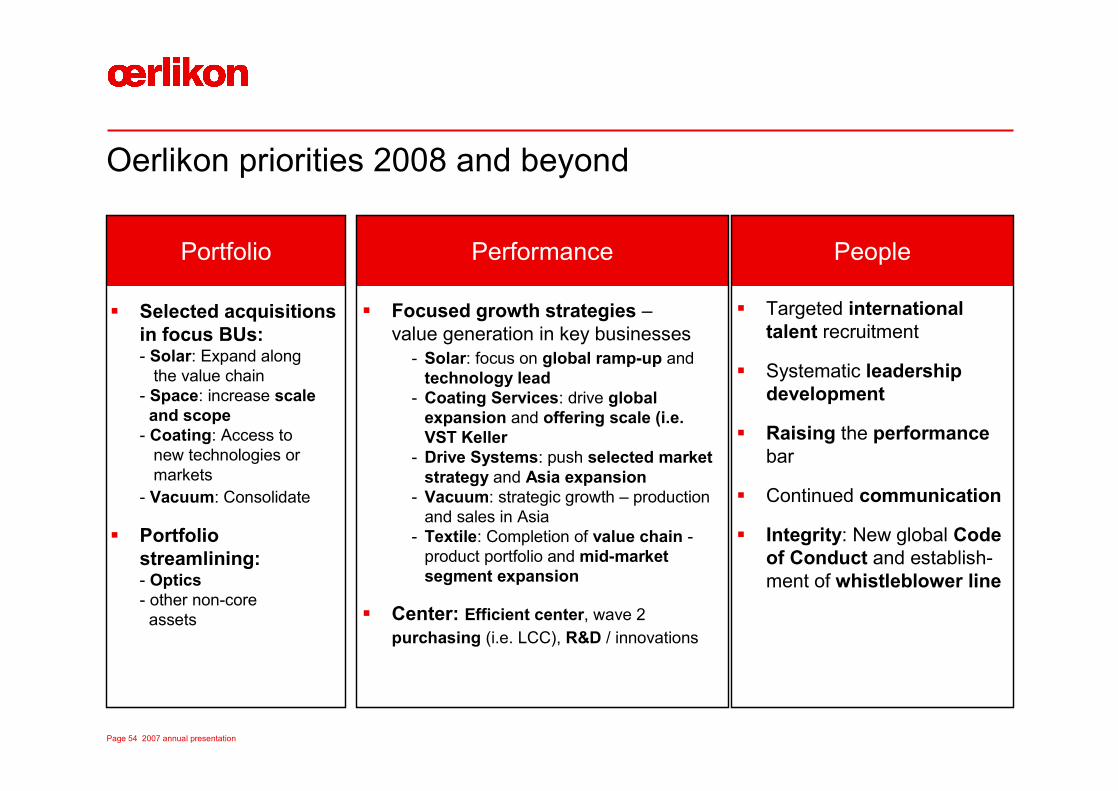
Page 54 2007 annual presentation
Oerlikon priorities 2008 and beyond
Portfolio Performance People
§ Focused growth strategies –value generation in key businesses
- Solar: focus on global ramp-up and technology lead
- Coating Services: drive global expansion and offering scale (i.e. VST Keller
- Drive Systems: push selected market strategy and Asia expansion
- Vacuum: strategic growth – production and sales in Asia
- Textile: Completion of value chain -product portfolio and mid-market segment expansion
§ Center: Efficient center, wave 2 purchasing (i.e. LCC), R&D / innovations
§ Selected acquisitions in focus BUs:- Solar: Expand along
the value chain- Space: increase scale
and scope- Coating: Access to
new technologies ormarkets
- Vacuum: Consolidate
§ Portfolio streamlining:- Optics- other non-core
assets
§ Targeted international talent recruitment
§ Systematic leadership development
§ Raising the performance bar
§ Continued communication
§ Integrity: New global Code of Conduct and establish-ment of whistleblower line

Page 55 2007 annual presentation
Key take away - Oerlikon set up for sustainable profitable growth
§ 2007 a record year for Oerlikon with sales exceeding CHF 5.6 bn, +20% vs. 2006
§ Oerlikon well positioned in attractive high-margin segments – leveraging joint scale as one of the largest Swiss industrial groups
§ Special focus on booming clean technology
§ Portfolio streamlining and strengthening under way
§ Operative platforms strengthened, securing innovative power through optimized R&D and reinstalling cost consciousness, bottom line and cash orientation
§ 2008 Sales expected to exceed CHF 6 bn, mainly driven by Solar, Coating
§ 2008 EBIT adversely impacted by exchange rates and raw material prices; still expectation to further increase earnings
§ Mid to long term perspectives for all segments very positive;10% EBIT margin targeted in 2009

Page 56 2007 annual presentation
Calendar of events and contact details
April 23, 2008Key figures for the first quarter of 2008
May 13, 2008Annual general meeting
August 26, 2008Semi-annual media and analyst conference
October 22, 2008Key figures for the third quarter of 2008
Calendar of events Contact details
Corporate Investor Relations
Frank HeffterT: +41 58 360 96 22
Roland BischofbergerT: +41 58 360 97 14
F: +41 58 360 91 93
www.oerlikon.com/ir