manufacturing and characterization of polyurethane …web.mst.edu/~vbirman/papers/manufacturing and...
TRANSCRIPT
Composite Structures 123 (2015) 169–179
Contents lists available at ScienceDirect
Composite Structures
journal homepage: www.elsevier .com/locate /compstruct
Manufacturing and characterization of polyurethane based sandwichcomposite structures
http://dx.doi.org/10.1016/j.compstruct.2014.12.0420263-8223/� 2014 Elsevier Ltd. All rights reserved.
⇑ Corresponding author. Tel.: +1 573 341 4587.E-mail address: [email protected] (K. Chandrashekhara).
M. Mohamed a, S. Anandan a, Z. Huo a, V. Birman a,c, J. Volz b, K. Chandrashekhara a,⇑a Department of Mechanical and Aerospace Engineering, Missouri University of Science and Technology, Rolla, MO 65409, United Statesb Department of Civil, Architectural and Environmental Engineering, Missouri University of Science and Technology, Rolla, MO 65409, United Statesc Engineering Education Center, Missouri University of Science and Technology, Rolla, MO 65409, United States
a r t i c l e i n f o a b s t r a c t
Article history:Available online 26 December 2014
Keywords:Polyurethane resinTrapezoid foamComposite sandwich structureVARTM
Demand has been growing for structural systems utilizing new materials that are more durable andrequire less maintenance during the service lifetime. In particular, sandwich composite structures attractattention due to many advantages such as light weight, high strength, corrosion resistance, durability andspeedy construction. In this study, three designs of glass reinforced composite sandwich structures,namely boxes (web-core W1), trapezoid and polyurethane rigid foam, are fabricated using new genera-tion of two-part thermoset polyurethane resin systems as matrix materials with vacuum assisted resintransfer molding (VARTM) process. The stiffness, load-carrying capacity and compressive strength wereevaluated. Core shear, flatwise and edgewise compression tests were carried out for these three models.The mechanical response of three designs of sandwich structures under flexural loading were analyzedusing commercial finite element method (FEM) software ABAQUS. The simulation results of flexuralbehavior were validated by experimental findings.
� 2014 Elsevier Ltd. All rights reserved.
1. Introduction
Composite sandwich structures are increasingly used in civilinfrastructures due to their many advantages such as light weight,high stiffness to weight ratio, corrosion resistance, good fatigueresistance and high durability. The main advantage of a sandwichconstruction in civil engineering applications is its ability to pro-vide increased flexural strength without a significant increase inweight.
With the development of composite manufacturing processes,such as resin transfer molding (RTM), pultrusion and VARTM, sand-wich structures fabricated using polymer matrix composites havebeen explored since early 1980s. In particular, VARTM is a low-costcomposite manufacturing process that has been employed to man-ufacture various large components including turbine blades, boats,rail cars and bridge decks [1,2].
Out of many applications of sandwich composite structures incivil infrastructures, using sandwich composite materials in civilinfrastructures to replace the conventional materials significantlyreduces dead load. Furthermore, in new constructions, lower deadload can translate into savings throughout the structure, as the size
of structural members and foundation is reduced accordingly. Theother reason for the use of composite materials is their higher cor-rosion resistance [3].
The necessity to study the structural behavior and failure char-acteristics of sandwich structures has increased during recentyears. Recent applications have demonstrated that fiber reinforcedcomposite sandwich construction can be effectively and economi-cally used in the civil infrastructure and several critical weightapplications. A combination of good flexural and compressivestrength coupled with high weight savings is critical in these appli-cations. A number of research papers have been presented onexperimental and numerical investigation on the mechanicalbehavior of sandwich composites.
Manalo et al. [4] investigated the flexural behavior of a newgeneration composite sandwich beams made up of glass fiber rein-forced polymer facesheet and modified phenolic core materialexperimentally and numerically. The results showed that the com-posite sandwich beams tested in the edgewise position failed at ahigher load with less deflection compared to specimens tested inthe flatwise position. Finally, the result of the study showed thehigh potential of this innovative composite sandwich panel forstructural laminated beam. Dai et al. [5] investigated the failurebehavior of sandwich beams manufactured using VARTM processin static 3-point and in 4-point bending using two different core
170 M. Mohamed et al. / Composite Structures 123 (2015) 169–179
materials. The results showed long beams failed in the face on thetension side when the tensile strength of the face was exceeded.The wood core was predicted to fail laterally in the thickness direc-tion before the face failure because of the relatively high tensilestress in the core. Reisa et al. [6] studied the delamination prob-lems typically faced in traditional glass fiber reinforced polymer(GFRP) sandwich panels. The influence of the panel thickness,through-thickness fiber configuration and density, and otherparameters on the tension, compression, flexure and shear behav-ior of the panels were discussed. The results showed the behaviorof the face sheets under tension is bi-linear which could be causedby the presence of the fibers in the perpendicular direction.
A series of analytical and experimental investigations is pre-sented to study the response and failure of truss core sandwichpanels. Xiong et al. [7] studied the response of carbon fiber com-posite pyramidal truss core sandwich panels subjected to axialcompression using analytical models and experiments. The resultsshow after initial peak load, the bond strength was one of the mainfactors in the performance of the panels. Debonding between thefacesheet and core were observed, leading to reduction in the loadcarrying capacity of the structure. The measured peak loadsobtained in the experiments showed good agreement with theanalytical predictions. Humpreys et al. [8] studied the structuralbehavior of monocoque fiber composite truss joints. The jointswere subjected to static loading of the diagonal tension member.From the results presented, it can be seen that strong monocoquefiber composite trusses can be produced. Canning et al. [9] pro-posed a hybrid box section consisting of glass fiber reinforced poly-mer pultruded box with an upper layer of concrete in thecompression side. Cartie and Fleck [10] studied the effects of tita-nium and carbon fiber pins inserted into the polymethacrylimidefoam core of a sandwich panel (with carbon fiber face sheets) inorder to increase the through-thickness strength. The results showthat the compressive strength is governed by elastic buckling ofthe pins, with the foam core behaving as an elastic Winkler foun-dation in supporting the pins. The peak strength of the pin-rein-forced core is increased. Aref and Alampalli [11] conducted fieldtests and studied the dynamic response of the first FRP compositebridge built in USA. The same authors also developed a finite ele-ment model using MSC-PATRAN and analyzed the dynamic behav-ior using ABAQUS. The results indicated that the longitudinal jointis performing as intended, and only high degradation of the jointcan be detected using the measured vibration characteristic ofthe sandwich bridge deck.
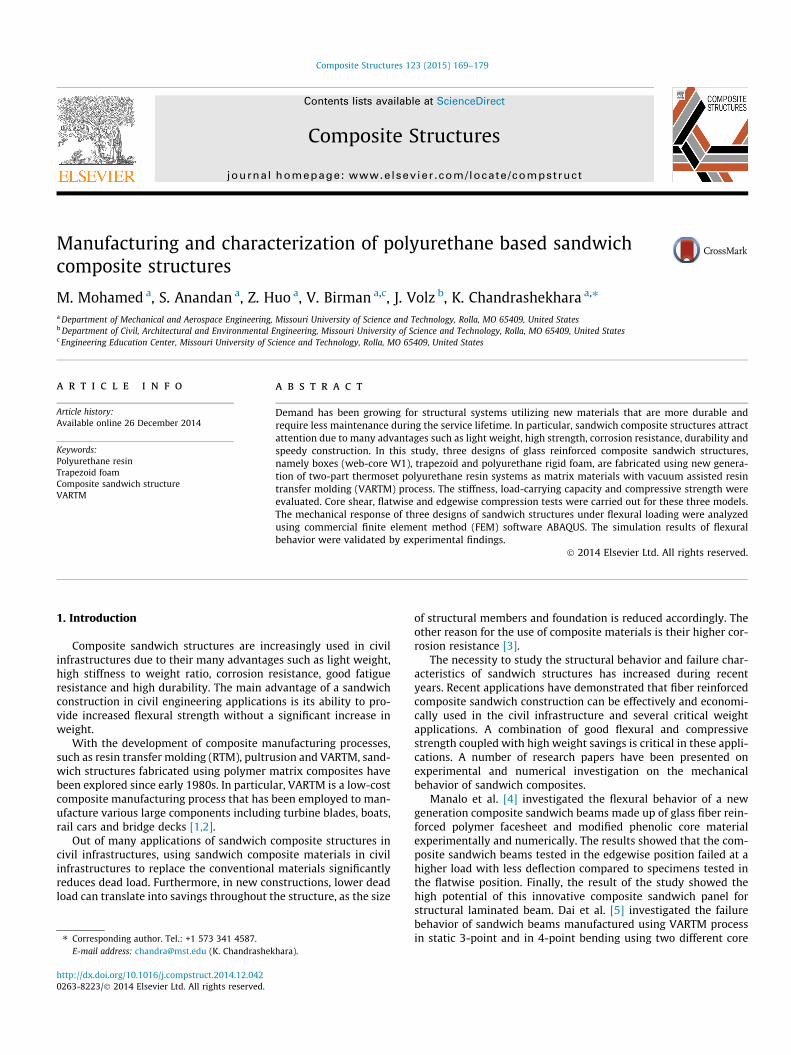
(b)(a)
Fig. 1. Three types of foam cores. (a) Type-1 high density PU foam, (b) Type-2 trapezoireinforcement.
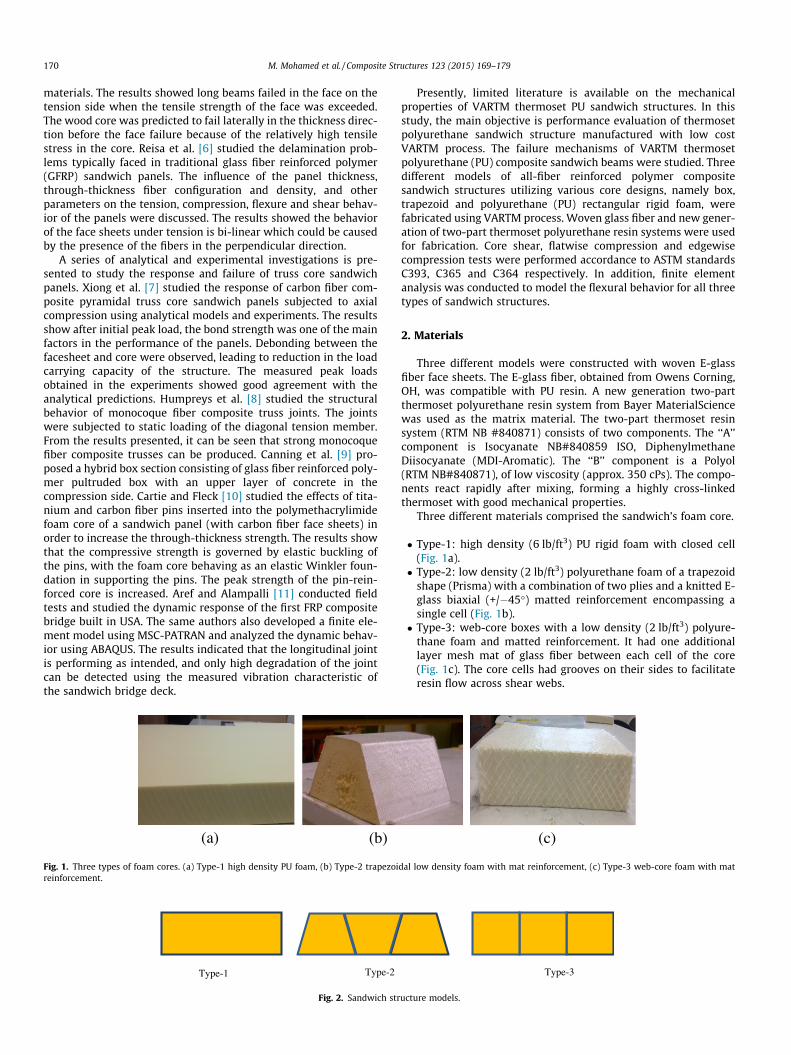
Type-1 Type-2
Fig. 2. Sandwich str
Presently, limited literature is available on the mechanicalproperties of VARTM thermoset PU sandwich structures. In thisstudy, the main objective is performance evaluation of thermosetpolyurethane sandwich structure manufactured with low costVARTM process. The failure mechanisms of VARTM thermosetpolyurethane (PU) composite sandwich beams were studied. Threedifferent models of all-fiber reinforced polymer compositesandwich structures utilizing various core designs, namely box,trapezoid and polyurethane (PU) rectangular rigid foam, werefabricated using VARTM process. Woven glass fiber and new gener-ation of two-part thermoset polyurethane resin systems were usedfor fabrication. Core shear, flatwise compression and edgewisecompression tests were performed accordance to ASTM standardsC393, C365 and C364 respectively. In addition, finite elementanalysis was conducted to model the flexural behavior for all threetypes of sandwich structures.
2. Materials
Three different models were constructed with woven E-glassfiber face sheets. The E-glass fiber, obtained from Owens Corning,OH, was compatible with PU resin. A new generation two-partthermoset polyurethane resin system from Bayer MaterialSciencewas used as the matrix material. The two-part thermoset resinsystem (RTM NB #840871) consists of two components. The ‘‘A’’component is Isocyanate NB#840859 ISO, DiphenylmethaneDiisocyanate (MDI-Aromatic). The ‘‘B’’ component is a Polyol(RTM NB#840871), of low viscosity (approx. 350 cPs). The compo-nents react rapidly after mixing, forming a highly cross-linkedthermoset with good mechanical properties.
Three different materials comprised the sandwich’s foam core.
� Type-1: high density (6 lb/ft3) PU rigid foam with closed cell(Fig. 1a).� Type-2: low density (2 lb/ft3) polyurethane foam of a trapezoid
shape (Prisma) with a combination of two plies and a knitted E-glass biaxial (+/�45�) matted reinforcement encompassing asingle cell (Fig. 1b).� Type-3: web-core boxes with a low density (2 lb/ft3) polyure-
thane foam and matted reinforcement. It had one additionallayer mesh mat of glass fiber between each cell of the core(Fig. 1c). The core cells had grooves on their sides to facilitateresin flow across shear webs.
(c)
dal low density foam with mat reinforcement, (c) Type-3 web-core foam with mat
Type-3
ucture models.
M. Mohamed et al. / Composite Structures 123 (2015) 169–179 171
3. Experiments
3.1. Manufacturing sandwich composites using VARTM
Three sandwich designs considered in this study are depicted inFig. 2 that illustrates the model sections for the rectangular PUrigid foam, trapezoid shape profile and boxes. Sandwich specimenswith E-glass/PU face sheets were manufactured at Missouri S&Tcomposites lab. VARTM, a cost-effective method, was used to fab-ricate small to large size FRP composite systems. The overall depthwas fixed at 54.61 mm (2.15 in.). Each face sheet consisted of threelayers of woven E-glass fibers.
Three shear layers (E-BXM1715-10) were added during themanufacturing process to the Type-2 model between the trapezoi-dal sections. The resin was initially cured at room temperature for6 h followed by 70 �C for 1 h. It was then post-cured at 80 �C for
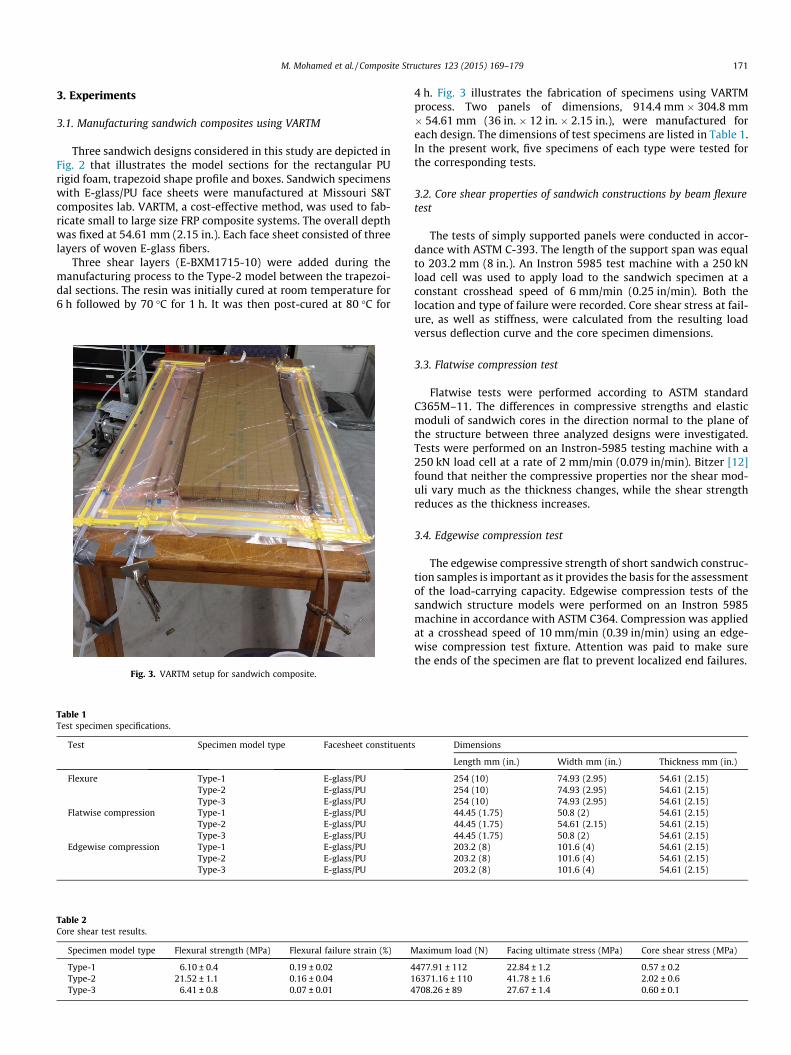
Fig. 3. VARTM setup for sandwich composite.
Table 1Test specimen specifications.
Test Specimen model type Facesheet constituent
Flexure Type-1 E-glass/PUType-2 E-glass/PUType-3 E-glass/PU
Flatwise compression Type-1 E-glass/PUType-2 E-glass/PUType-3 E-glass/PU
Edgewise compression Type-1 E-glass/PUType-2 E-glass/PUType-3 E-glass/PU
Table 2Core shear test results.
Specimen model type Flexural strength (MPa) Flexural failure strain (%) M
Type-1 6.10 ± 0.4 0.19 ± 0.02 4Type-2 21.52 ± 1.1 0.16 ± 0.04 1Type-3 6.41 ± 0.8 0.07 ± 0.01 4
4 h. Fig. 3 illustrates the fabrication of specimens using VARTMprocess. Two panels of dimensions, 914.4 mm � 304.8 mm� 54.61 mm (36 in. � 12 in. � 2.15 in.), were manufactured foreach design. The dimensions of test specimens are listed in Table 1.In the present work, five specimens of each type were tested forthe corresponding tests.
3.2. Core shear properties of sandwich constructions by beam flexuretest
The tests of simply supported panels were conducted in accor-dance with ASTM C-393. The length of the support span was equalto 203.2 mm (8 in.). An Instron 5985 test machine with a 250 kNload cell was used to apply load to the sandwich specimen at aconstant crosshead speed of 6 mm/min (0.25 in/min). Both thelocation and type of failure were recorded. Core shear stress at fail-ure, as well as stiffness, were calculated from the resulting loadversus deflection curve and the core specimen dimensions.
3.3. Flatwise compression test
Flatwise tests were performed according to ASTM standardC365M–11. The differences in compressive strengths and elasticmoduli of sandwich cores in the direction normal to the plane ofthe structure between three analyzed designs were investigated.Tests were performed on an Instron-5985 testing machine with a250 kN load cell at a rate of 2 mm/min (0.079 in/min). Bitzer [12]found that neither the compressive properties nor the shear mod-uli vary much as the thickness changes, while the shear strengthreduces as the thickness increases.
3.4. Edgewise compression test
The edgewise compressive strength of short sandwich construc-tion samples is important as it provides the basis for the assessmentof the load-carrying capacity. Edgewise compression tests of thesandwich structure models were performed on an Instron 5985machine in accordance with ASTM C364. Compression was appliedat a crosshead speed of 10 mm/min (0.39 in/min) using an edge-wise compression test fixture. Attention was paid to make surethe ends of the specimen are flat to prevent localized end failures.
s Dimensions
Length mm (in.) Width mm (in.) Thickness mm (in.)
254 (10) 74.93 (2.95) 54.61 (2.15)254 (10) 74.93 (2.95) 54.61 (2.15)254 (10) 74.93 (2.95) 54.61 (2.15)44.45 (1.75) 50.8 (2) 54.61 (2.15)44.45 (1.75) 54.61 (2.15) 54.61 (2.15)44.45 (1.75) 50.8 (2) 54.61 (2.15)203.2 (8) 101.6 (4) 54.61 (2.15)203.2 (8) 101.6 (4) 54.61 (2.15)203.2 (8) 101.6 (4) 54.61 (2.15)
aximum load (N) Facing ultimate stress (MPa) Core shear stress (MPa)
477.91 ± 112 22.84 ± 1.2 0.57 ± 0.26371.16 ± 110 41.78 ± 1.6 2.02 ± 0.6708.26 ± 89 27.67 ± 1.4 0.60 ± 0.1
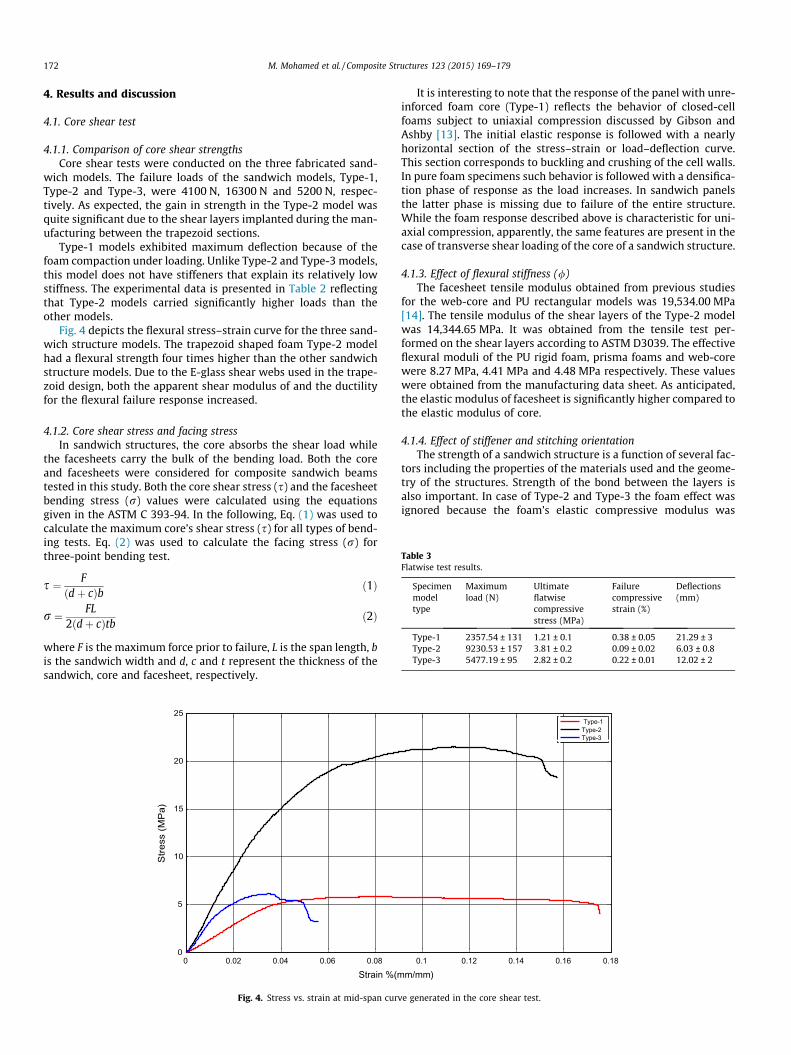
Table 3Flatwise test results.
Specimenmodeltype
Maximumload (N)
Ultimateflatwisecompressivestress (MPa)
Failurecompressivestrain (%)
Deflections(mm)
Type-1 2357.54 ± 131 1.21 ± 0.1 0.38 ± 0.05 21.29 ± 3Type-2 9230.53 ± 157 3.81 ± 0.2 0.09 ± 0.02 6.03 ± 0.8Type-3 5477.19 ± 95 2.82 ± 0.2 0.22 ± 0.01 12.02 ± 2
172 M. Mohamed et al. / Composite Structures 123 (2015) 169–179
4. Results and discussion
4.1. Core shear test
4.1.1. Comparison of core shear strengthsCore shear tests were conducted on the three fabricated sand-
wich models. The failure loads of the sandwich models, Type-1,Type-2 and Type-3, were 4100 N, 16300 N and 5200 N, respec-tively. As expected, the gain in strength in the Type-2 model wasquite significant due to the shear layers implanted during the man-ufacturing between the trapezoid sections.
Type-1 models exhibited maximum deflection because of thefoam compaction under loading. Unlike Type-2 and Type-3 models,this model does not have stiffeners that explain its relatively lowstiffness. The experimental data is presented in Table 2 reflectingthat Type-2 models carried significantly higher loads than theother models.
Fig. 4 depicts the flexural stress–strain curve for the three sand-wich structure models. The trapezoid shaped foam Type-2 modelhad a flexural strength four times higher than the other sandwichstructure models. Due to the E-glass shear webs used in the trape-zoid design, both the apparent shear modulus of and the ductilityfor the flexural failure response increased.
4.1.2. Core shear stress and facing stressIn sandwich structures, the core absorbs the shear load while
the facesheets carry the bulk of the bending load. Both the coreand facesheets were considered for composite sandwich beamstested in this study. Both the core shear stress (s) and the facesheetbending stress (r) values were calculated using the equationsgiven in the ASTM C 393-94. In the following, Eq. (1) was used tocalculate the maximum core’s shear stress (s) for all types of bend-ing tests. Eq. (2) was used to calculate the facing stress (r) forthree-point bending test.
s ¼ Fðdþ cÞb ð1Þ
r ¼ FL2ðdþ cÞtb ð2Þ
where F is the maximum force prior to failure, L is the span length, bis the sandwich width and d, c and t represent the thickness of thesandwich, core and facesheet, respectively.
0 0.02 0.04 0.06 0.080
5
10
15
20
25
Strain %(m
Stre
ss (M
Pa)
Fig. 4. Stress vs. strain at mid-span curv
It is interesting to note that the response of the panel with unre-inforced foam core (Type-1) reflects the behavior of closed-cellfoams subject to uniaxial compression discussed by Gibson andAshby [13]. The initial elastic response is followed with a nearlyhorizontal section of the stress–strain or load–deflection curve.This section corresponds to buckling and crushing of the cell walls.In pure foam specimens such behavior is followed with a densifica-tion phase of response as the load increases. In sandwich panelsthe latter phase is missing due to failure of the entire structure.While the foam response described above is characteristic for uni-axial compression, apparently, the same features are present in thecase of transverse shear loading of the core of a sandwich structure.
4.1.3. Effect of flexural stiffness (/)The facesheet tensile modulus obtained from previous studies
for the web-core and PU rectangular models was 19,534.00 MPa[14]. The tensile modulus of the shear layers of the Type-2 modelwas 14,344.65 MPa. It was obtained from the tensile test per-formed on the shear layers according to ASTM D3039. The effectiveflexural moduli of the PU rigid foam, prisma foams and web-corewere 8.27 MPa, 4.41 MPa and 4.48 MPa respectively. These valueswere obtained from the manufacturing data sheet. As anticipated,the elastic modulus of facesheet is significantly higher compared tothe elastic modulus of core.
4.1.4. Effect of stiffener and stitching orientationThe strength of a sandwich structure is a function of several fac-
tors including the properties of the materials used and the geome-try of the structures. Strength of the bond between the layers isalso important. In case of Type-2 and Type-3 the foam effect wasignored because the foam’s elastic compressive modulus was
0.1 0.12 0.14 0.16 0.18
m/mm)
Type-1Type-2Type-3
e generated in the core shear test.
M. Mohamed et al. / Composite Structures 123 (2015) 169–179 173
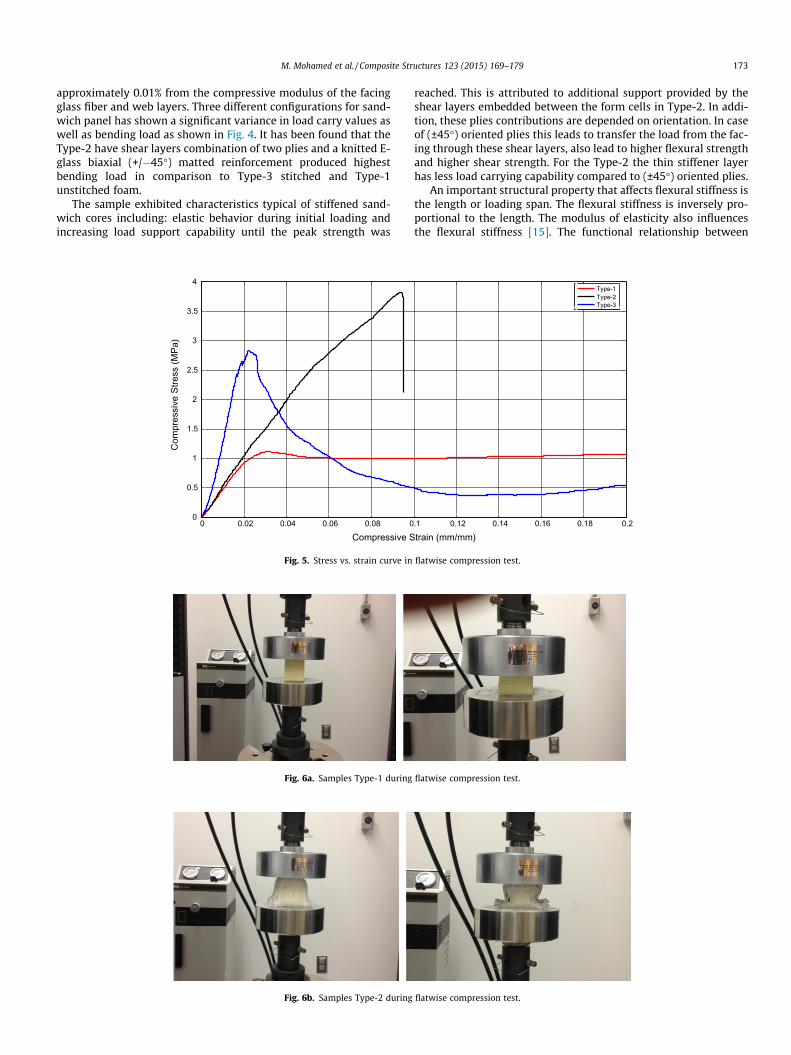
approximately 0.01% from the compressive modulus of the facingglass fiber and web layers. Three different configurations for sand-wich panel has shown a significant variance in load carry values aswell as bending load as shown in Fig. 4. It has been found that theType-2 have shear layers combination of two plies and a knitted E-glass biaxial (+/�45�) matted reinforcement produced highestbending load in comparison to Type-3 stitched and Type-1unstitched foam.
The sample exhibited characteristics typical of stiffened sand-wich cores including: elastic behavior during initial loading andincreasing load support capability until the peak strength was
0 0.02 0.04 0.06 0.08 00
0.5
1
1.5
2
2.5
3
3.5
4
Compressive S
Com
pres
sive
Stre
ss (M
Pa)
Fig. 5. Stress vs. strain curve in
Fig. 6a. Samples Type-1 during
Fig. 6b. Samples Type-2 during
reached. This is attributed to additional support provided by theshear layers embedded between the form cells in Type-2. In addi-tion, these plies contributions are depended on orientation. In caseof (±45�) oriented plies this leads to transfer the load from the fac-ing through these shear layers, also lead to higher flexural strengthand higher shear strength. For the Type-2 the thin stiffener layerhas less load carrying capability compared to (±45�) oriented plies.
An important structural property that affects flexural stiffness isthe length or loading span. The flexural stiffness is inversely pro-portional to the length. The modulus of elasticity also influencesthe flexural stiffness [15]. The functional relationship between
.1 0.12 0.14 0.16 0.18 0.2
train (mm/mm)
Type-1Type-2Type-3
flatwise compression test.
flatwise compression test.
flatwise compression test.
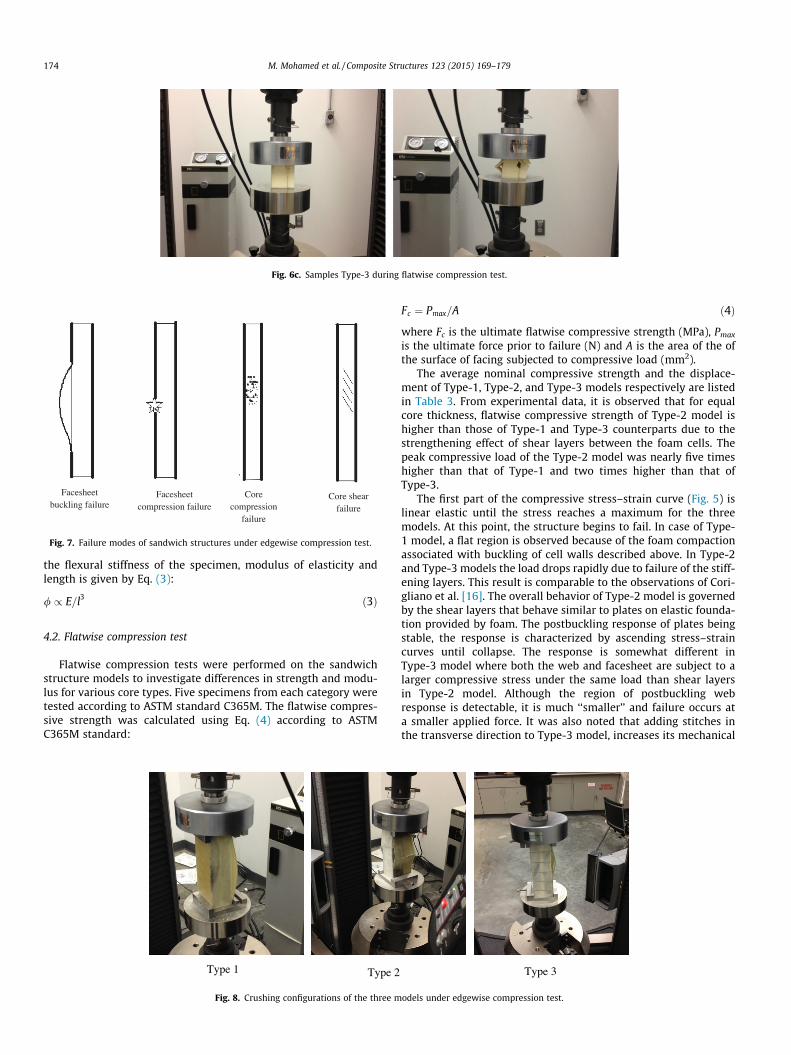
Fig. 6c. Samples Type-3 during flatwise compression test.
Facesheetbuckling failure
Core shear failure
Facesheetcompression failure
Corecompression
failure
Fig. 7. Failure modes of sandwich structures under edgewise compression test.
174 M. Mohamed et al. / Composite Structures 123 (2015) 169–179
the flexural stiffness of the specimen, modulus of elasticity andlength is given by Eq. (3):
/ / E=l3 ð3Þ
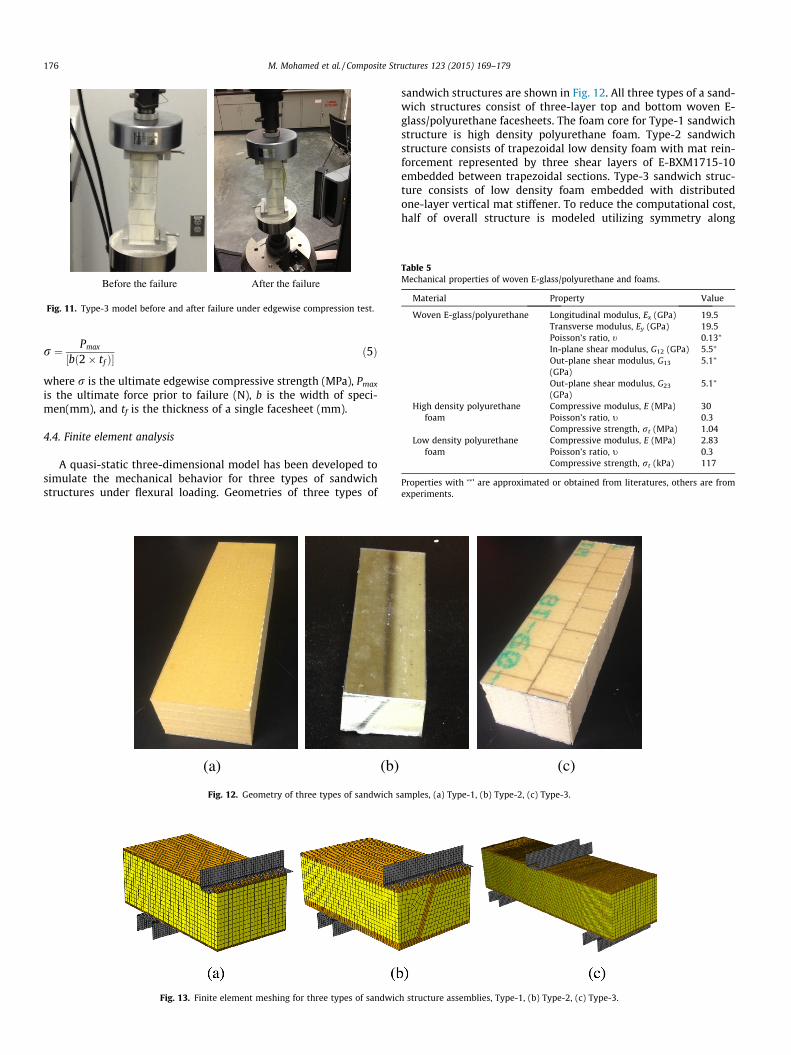
4.2. Flatwise compression test
Flatwise compression tests were performed on the sandwichstructure models to investigate differences in strength and modu-lus for various core types. Five specimens from each category weretested according to ASTM standard C365M. The flatwise compres-sive strength was calculated using Eq. (4) according to ASTMC365M standard:
Type 2Type 1
Fig. 8. Crushing configurations of the three m
Fc ¼ Pmax=A ð4Þ
where Fc is the ultimate flatwise compressive strength (MPa), Pmax
is the ultimate force prior to failure (N) and A is the area of the ofthe surface of facing subjected to compressive load (mm2).
The average nominal compressive strength and the displace-ment of Type-1, Type-2, and Type-3 models respectively are listedin Table 3. From experimental data, it is observed that for equalcore thickness, flatwise compressive strength of Type-2 model ishigher than those of Type-1 and Type-3 counterparts due to thestrengthening effect of shear layers between the foam cells. Thepeak compressive load of the Type-2 model was nearly five timeshigher than that of Type-1 and two times higher than that ofType-3.
The first part of the compressive stress–strain curve (Fig. 5) islinear elastic until the stress reaches a maximum for the threemodels. At this point, the structure begins to fail. In case of Type-1 model, a flat region is observed because of the foam compactionassociated with buckling of cell walls described above. In Type-2and Type-3 models the load drops rapidly due to failure of the stiff-ening layers. This result is comparable to the observations of Cori-gliano et al. [16]. The overall behavior of Type-2 model is governedby the shear layers that behave similar to plates on elastic founda-tion provided by foam. The postbuckling response of plates beingstable, the response is characterized by ascending stress–straincurves until collapse. The response is somewhat different inType-3 model where both the web and facesheet are subject to alarger compressive stress under the same load than shear layersin Type-2 model. Although the region of postbuckling webresponse is detectable, it is much ‘‘smaller’’ and failure occurs ata smaller applied force. It was also noted that adding stitches inthe transverse direction to Type-3 model, increases its mechanical
Type 3
odels under edgewise compression test.
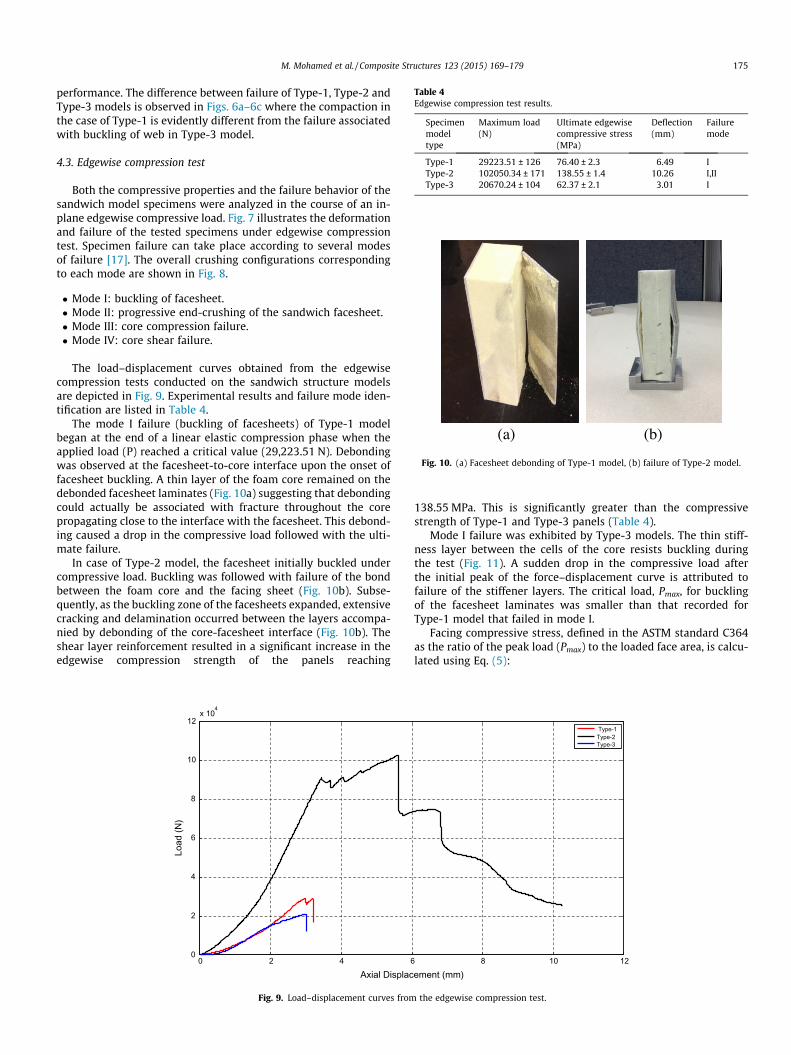
Table 4Edgewise compression test results.
Specimenmodeltype
Maximum load(N)
Ultimate edgewisecompressive stress(MPa)
Deflection(mm)
Failuremode
Type-1 29223.51 ± 126 76.40 ± 2.3 6.49 IType-2 102050.34 ± 171 138.55 ± 1.4 10.26 I,IIType-3 20670.24 ± 104 62.37 ± 2.1 3.01 I
(a) (b)
Fig. 10. (a) Facesheet debonding of Type-1 model, (b) failure of Type-2 model.
M. Mohamed et al. / Composite Structures 123 (2015) 169–179 175
performance. The difference between failure of Type-1, Type-2 andType-3 models is observed in Figs. 6a–6c where the compaction inthe case of Type-1 is evidently different from the failure associatedwith buckling of web in Type-3 model.
4.3. Edgewise compression test
Both the compressive properties and the failure behavior of thesandwich model specimens were analyzed in the course of an in-plane edgewise compressive load. Fig. 7 illustrates the deformationand failure of the tested specimens under edgewise compressiontest. Specimen failure can take place according to several modesof failure [17]. The overall crushing configurations correspondingto each mode are shown in Fig. 8.
� Mode I: buckling of facesheet.� Mode II: progressive end-crushing of the sandwich facesheet.� Mode III: core compression failure.� Mode IV: core shear failure.
The load–displacement curves obtained from the edgewisecompression tests conducted on the sandwich structure modelsare depicted in Fig. 9. Experimental results and failure mode iden-tification are listed in Table 4.
The mode I failure (buckling of facesheets) of Type-1 modelbegan at the end of a linear elastic compression phase when theapplied load (P) reached a critical value (29,223.51 N). Debondingwas observed at the facesheet-to-core interface upon the onset offacesheet buckling. A thin layer of the foam core remained on thedebonded facesheet laminates (Fig. 10a) suggesting that debondingcould actually be associated with fracture throughout the corepropagating close to the interface with the facesheet. This debond-ing caused a drop in the compressive load followed with the ulti-mate failure.
In case of Type-2 model, the facesheet initially buckled undercompressive load. Buckling was followed with failure of the bondbetween the foam core and the facing sheet (Fig. 10b). Subse-quently, as the buckling zone of the facesheets expanded, extensivecracking and delamination occurred between the layers accompa-nied by debonding of the core-facesheet interface (Fig. 10b). Theshear layer reinforcement resulted in a significant increase in theedgewise compression strength of the panels reaching
0 2 4 60
2
4
6
8
10
12x 10
4
Axial Displac
Load
(N)
Fig. 9. Load–displacement curves from
138.55 MPa. This is significantly greater than the compressivestrength of Type-1 and Type-3 panels (Table 4).
Mode I failure was exhibited by Type-3 models. The thin stiff-ness layer between the cells of the core resists buckling duringthe test (Fig. 11). A sudden drop in the compressive load afterthe initial peak of the force–displacement curve is attributed tofailure of the stiffener layers. The critical load, Pmax, for bucklingof the facesheet laminates was smaller than that recorded forType-1 model that failed in mode I.
Facing compressive stress, defined in the ASTM standard C364as the ratio of the peak load (Pmax) to the loaded face area, is calcu-lated using Eq. (5):
8 10 12
ement (mm)
Type-1Type-2Type-3
the edgewise compression test.
Before the failure After the failure
Fig. 11. Type-3 model before and after failure under edgewise compression test.
Table 5Mechanical properties of woven E-glass/polyurethane and foams.
Material Property Value
Woven E-glass/polyurethane Longitudinal modulus, Ex (GPa) 19.5Transverse modulus, Ey (GPa) 19.5Poisson’s ratio, t 0.13⁄
In-plane shear modulus, G12 (GPa) 5.5⁄
Out-plane shear modulus, G13
(GPa)5.1⁄
Out-plane shear modulus, G23
(GPa)5.1⁄
High density polyurethanefoam
Compressive modulus, E (MPa) 30Poisson’s ratio, t 0.3Compressive strength, rt (MPa) 1.04
Low density polyurethanefoam
Compressive modulus, E (MPa) 2.83Poisson’s ratio, t 0.3Compressive strength, rt (kPa) 117
Properties with ‘⁄’ are approximated or obtained from literatures, others are fromexperiments.
176 M. Mohamed et al. / Composite Structures 123 (2015) 169–179
r ¼ Pmax
½bð2� tf Þ�ð5Þ
where r is the ultimate edgewise compressive strength (MPa), Pmax
is the ultimate force prior to failure (N), b is the width of speci-men(mm), and tf is the thickness of a single facesheet (mm).
4.4. Finite element analysis
A quasi-static three-dimensional model has been developed tosimulate the mechanical behavior for three types of sandwichstructures under flexural loading. Geometries of three types of
(a) (b)
Fig. 12. Geometry of three types of sandwich s
Fig. 13. Finite element meshing for three types of sandwic
sandwich structures are shown in Fig. 12. All three types of a sand-wich structures consist of three-layer top and bottom woven E-glass/polyurethane facesheets. The foam core for Type-1 sandwichstructure is high density polyurethane foam. Type-2 sandwichstructure consists of trapezoidal low density foam with mat rein-forcement represented by three shear layers of E-BXM1715-10embedded between trapezoidal sections. Type-3 sandwich struc-ture consists of low density foam embedded with distributedone-layer vertical mat stiffener. To reduce the computational cost,half of overall structure is modeled utilizing symmetry along
(c)
amples, (a) Type-1, (b) Type-2, (c) Type-3.
h structure assemblies, Type-1, (b) Type-2, (c) Type-3.
M. Mohamed et al. / Composite Structures 123 (2015) 169–179 177
length direction for Type-1 and Type-2 sandwich structures, and afull modeling is adopted for Type-3 sandwich structure due to itsasymmetric distribution of vertical stiffener. The finite elementmeshing for three types of sandwich structures are shown inFig. 13.
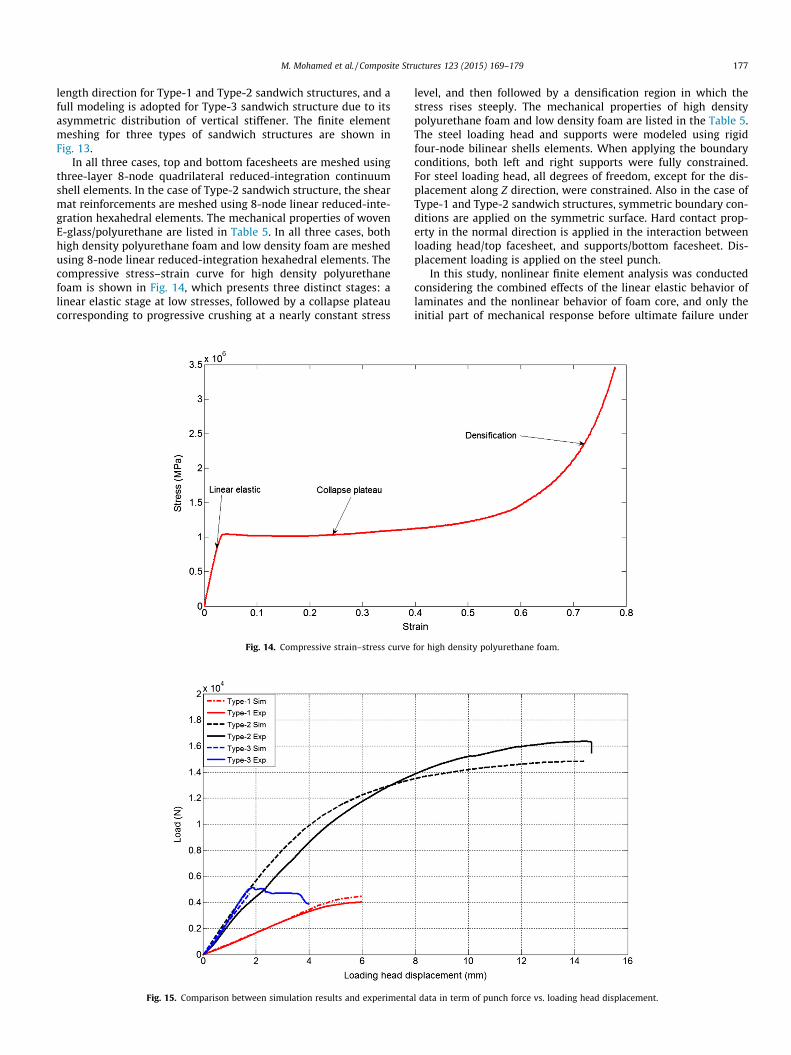
In all three cases, top and bottom facesheets are meshed usingthree-layer 8-node quadrilateral reduced-integration continuumshell elements. In the case of Type-2 sandwich structure, the shearmat reinforcements are meshed using 8-node linear reduced-inte-gration hexahedral elements. The mechanical properties of wovenE-glass/polyurethane are listed in Table 5. In all three cases, bothhigh density polyurethane foam and low density foam are meshedusing 8-node linear reduced-integration hexahedral elements. Thecompressive stress–strain curve for high density polyurethanefoam is shown in Fig. 14, which presents three distinct stages: alinear elastic stage at low stresses, followed by a collapse plateaucorresponding to progressive crushing at a nearly constant stress
Fig. 14. Compressive strain–stress curve
Fig. 15. Comparison between simulation results and experimenta
level, and then followed by a densification region in which thestress rises steeply. The mechanical properties of high densitypolyurethane foam and low density foam are listed in the Table 5.The steel loading head and supports were modeled using rigidfour-node bilinear shells elements. When applying the boundaryconditions, both left and right supports were fully constrained.For steel loading head, all degrees of freedom, except for the dis-placement along Z direction, were constrained. Also in the case ofType-1 and Type-2 sandwich structures, symmetric boundary con-ditions are applied on the symmetric surface. Hard contact prop-erty in the normal direction is applied in the interaction betweenloading head/top facesheet, and supports/bottom facesheet. Dis-placement loading is applied on the steel punch.
In this study, nonlinear finite element analysis was conductedconsidering the combined effects of the linear elastic behavior oflaminates and the nonlinear behavior of foam core, and only theinitial part of mechanical response before ultimate failure under
for high density polyurethane foam.
l data in term of punch force vs. loading head displacement.
178 M. Mohamed et al. / Composite Structures 123 (2015) 169–179
flexural loading is investigated. Comparison between simulationresults and experimental data in term of punch force versus load-ing head displacement for three types of sandwich structuresbefore ultimate rupture is illustrated in Fig. 15. In the case ofType-1 and Type-3 sandwich structures, the simulation results
Fig. 16. Von-mises stress contour in PU foam core when the
Fig. 17. Von-mises stress contour when the displacement of loadin
Fig. 18. Von-mises stress contour in the foam core when the
matched well with experimental data before ultimate collapse,the deviation in the later stage is due to the buckling and compres-sion failure in laminates and foam core’s compression collapse,which needs further investigation. The relatively clear deviationbetween simulation and experimental results in the case of
displacement of loading head equals 2.1 mm (Type-1).
g head equals 2.2 mm (Type-2). Foam core, (b) shear stiffener.
displacement of loading head equals 1.75 mm (Type-3).

M. Mohamed et al. / Composite Structures 123 (2015) 169–179 179
Type-2 could be due to the simplification of shear stiffener layersand uneven facesheet surface yielded from manufacturing processresulting in the incomplete contact between steel loading head andfacesheets. Another reason is the lack of consideration of the pro-gressive damage in composite laminates.
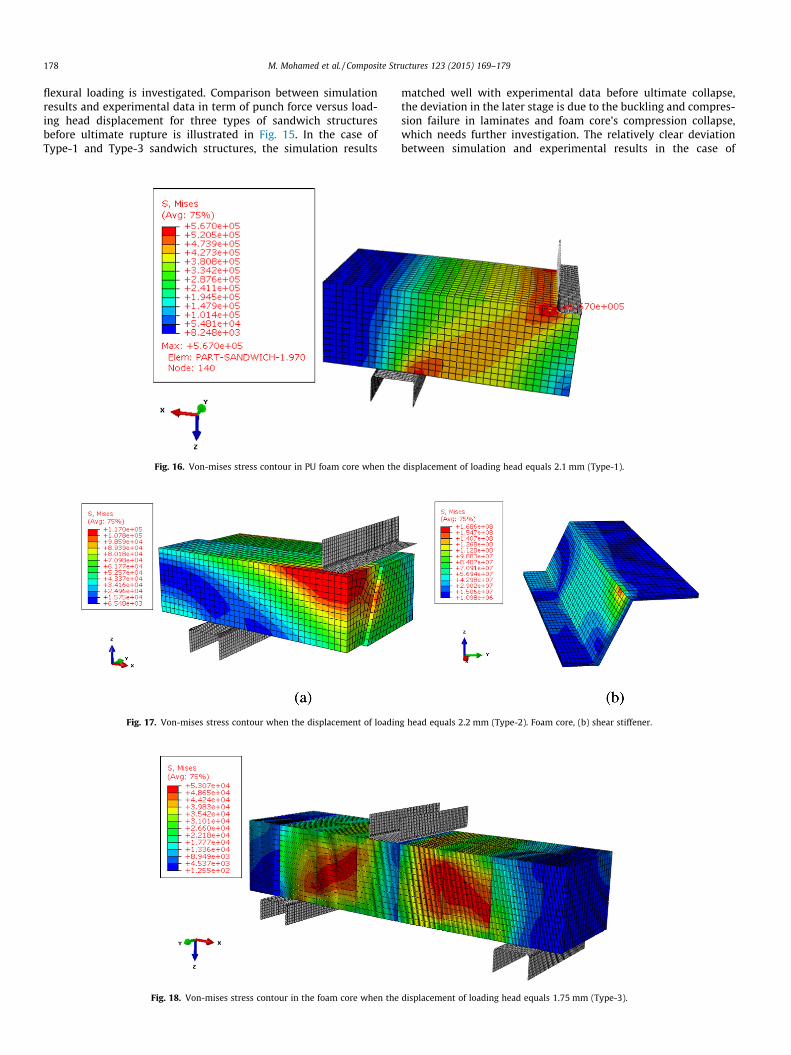
Fig. 16 presents Von-mises stress contour distribution in highdensity PU foam core when the displacement of loading headequals 2.1 mm. It is found that the maximum Von-mises stress is0.57 MPa, which is located at the top foam surface near the loadinghead. Also the maximum compressive stress along X-axis S11 onthe top most ply of top facesheet is found to be 6.06 MPa, whichis much larger than the maximum Von-mises stress in the foamcore. Fig. 17 presents Von-mises stress contour in trapezoidal foamcore and shear stiffener when the displacement of loading headequals 2.2 mm. It was found that the maximum Von-mises stressis 0.12 MPa for foam core and 168.6 MPa for shear stiffener, whichindicates that shear stiffener carries most of loading passing fromthe punch. Fig. 18 presents Von-mises stress contour distributionin foam core when the displacement of loading head equals1.75 mm in the case of Type-3 sandwich structure. It is found thatthe maximum Von-mises stress in foam core is 53.1 kPa, while themaximum compressive stress S22 in the vertical thin stiffener lam-inates is 98.62 MPa, which indicates the vertical stiffener carriesmost of loading passing from the punch.
5. Conclusion
Glass fiber/polyurethane sandwich composite structure withthree types of foam cores, namely rigid PU foam, prisma foam,and web-core, were successfully manufactured using VARTM pro-cess. Performance evaluation of E-glass fiber/PU sandwich compos-ites models was conducted using flexure, flatwise compression andedgewise compression tests to determine the respective stiffnessand strength of the models.
Core shear testing of the manufactured sandwich panels provedthat Type-2 models have the highest load carrying capacity inbending. In addition, Type-2 model carried the maximum loadunder flatwise and edgewise compression due to the presence ofshear layers. A three-dimensional finite element model was devel-oped for three types of sandwich structures under flexural loadingand validated by the experimental results. Based on the experi-mental results, it is suggested that sandwich panels with prismacores represent a feasible design for full scale bridge decks. Futurework will include the construction of a full scale composite bridgedecks using the prisma core and two-part thermoset polyurethaneas well as experimental verification of the stresses in the facingsand reinforcing laminates (truss).
Acknowledgements
The authors gratefully acknowledge the financial support pro-vided by the Missouri Department of Transportation (MoDOT)and the National University Transportation Center (NUTC) at Mis-souri University of Science and Technology. The conclusions andopinions expressed in this paper are those of the authors and donot necessarily reflect the official views or policies of the fundinginstitutions. The authors would like to thank Mr. Craig Snyder,Dr. Usama Younes, and Dr. John Hayes from Bayer MaterialSciencefor their help.
References
[1] Younes U. Development of PU-based RTM and VARTM technology. In:Proceedings of the ACMA composites conference. Las Vegas, NV: 2010. p. 1–17.
[2] Berggreen C, Branner K, Jensen JF, Schultz JP. Application and analysis ofsandwich elements in the primary structure of large wind turbine blades. JSandwich Struct Mater 2007;9:525–52.
[3] Alagusundaramoorthy P, Reddy RVS. Testing and evaluation of GFRP compositedeck panels. Ocean Eng 2008;35:287–93.
[4] Manalo AC, Aravinthan T, Karunasena W, Islam MM. Flexural behavior ofstructural fiber composite sandwich beams in flatwise and edgewise positions.Compos Struct 2010;92:984–95.
[5] Dai J, Hahn HT. Flexural behavior of sandwich beams fabricated by vacuum-assisted resin transfer molding. Compos Struct 2003;61:247–53.
[6] Reisa EM, Rizkalla S. Material characteristics of 3-D FRP sandwich panels.Constr Build Mater 2008;22:1009–18.
[7] Xiong J, Ma L, Wu L, Liu J, Vaziri A. Mechanical behavior and failure ofcomposite pyramidal truss core sandwich columns. Compos B 2011;42:938–45.
[8] Humphreys MF, Erp GV, Tranberg CH. The structural behavior of monocoquefiber composite truss joints. Adv Compos Lett 1999;8(4):173–80.
[9] Canning L, Hollaway L, Thorne AM. Manufacture, testing and numericalanalysis of an innovative polymer composite/concrete structural unit. Proc ICEStruct Build 1999;134(3):231–41.
[10] Cartie DD, Fleck NA. The effect of pin reinforcement upon the through-thickness compressive strength of foam-cored sandwich panels. Compos SciTechnol 2003;63:2401–9.
[11] Aref AJ, Alampalli S. Vibration characteristics of a fiber–reinforced polymerbridge superstructure. Des Manuf Compos Struct 2001;52:467–74.
[12] Bitzer T. Honeycomb technology. California: Chapman and Hall; 1997. p. 98–116.
[13] Gibson LJ, Ashby MF. Cellular solids: structure andproperties. Cambridge: Cambridge University Press; 1997.
[14] Mohamed M, Vuppalapati RR, Hawkins S, Chandrashekhara K, Schuman T.Impact characterization of polyurethane composites manufactured usingvacuum assisted resin transfer molding, Houston: International MechanicalEngineering Congress & Exposition; Texas IMECE2012-88267, 2012, p. 1–8.
[15] Santhanakrishnan R, Dash PK, Stanley AJ, Sabarish M. Flexural propertyevaluation of GFRP-foam sandwich composite – an experimental approach.ARPN J Eng Appl Sci 2012;7:1300–6.
[16] Corigliano A, Rizzi E, Papa E. Experimental characterization and numericalsimulations of a syntactic-foam/glass–fiber composite sandwich. Compos SciTechnol 2000;60:2169–80.
[17] ASTM C364/C364M-07 2007, Standard test method for edgewise compressivestrength of sandwich constructions. West Conshohocken, PA: ASTMInternational; 2007. Available from: <www.astm.org>.