mapping climate mitigation technologies and associated - ictsd
TRANSCRIPT

1
ICTSD Programme on Trade and Environment
Mapping Climate Mitigation Technologies and Associated
Goods within the Transport Sector
Jiang KejunEnergy Research Institute (ERI),National Development and ReformCommission (NDRC), Chinaand coordinating lead author of theIPCC Fifth Assessment Report
International Centre for Trade and Sustainable Development (ICTSD)

2
Acknowledgement:
This report has been prepared based on existing ERI research dealing withenergy efficiency in the transport sector.
The authors and ICTSD are grateful for the valuable comments andrecommendations received from Shigeki Kobayashi and Suzana Kahn Ribeiro(both IPCC coordinating lead authors), Haifeng Wang (International Councilfor Clean Transportation), and Joachim Monkelbaan and Mahesh Sugathan(ICTSD)

3
CONTENTS
List of tables and figures……………………………………………………………………………………………….5Executive Summary......................................................................................................................................6
CH A P T E R 1: An Overview of the Findings on Transport and Climate Change…….................................8
1.1 Findings from the IPCC............................................................... …………………………….…...8
1.2 GHG mitigation technologies in the transport sector........................................................................9
1.3 Road transport………………………………………………......................................................... .9
1.4 Rail transport................................................................................................................................... 11
1.5 Air transport…………………………………………………………………………………….….121.6 Shipping…...................................................................................................................................... 12
1.7 ‘Wedges’ Analysis by Pacala and Socolow……………..………………….………………………14
CH A P T E R 2: Key mitigation technologies/goods within the transport sector that are commerciallyavailable………………………....................................................................................................................15
Introduction .......................................................................................................................................... 15
2.1 Road transport..................................................................................................................................162.1.1 Load reducing technologies………................................................................................. 162.1.2 High efficiency vehicles…………………………………………...………..............……212.1.3 Hybrid vehicles…………………………………………………………….……………..262.1.4 All-electric vehicles………………………………………………………………………282.1.5 Alternative fuels……………………………………………………….…………………30
2.2 Railways: high efficiency locomotive and train……………………………………….…………342.3 Air: high efficiency aircraft……………………………………………….…………….………..36
2.4 Shipping: energy saving ships……………………………….…………….……………………..41
CH A P T E R 3: Key mitigation technologies/goods subject to R&D but with strong prospects of
near to medium term deployment……………………………............................................. …... 44Introduction ......................................................................................................................................... 44
Hydrogen/Fuel Cell Vehicles (FCVs)……………………………………………………………...…44
ANNEX I – Abbreviations and acronyms................................................................................................. 50
ANNEX II - Transport Sector Goods with a Short Technical Description………………………………..53
References ..................................................................................................................................................61
Internet references.......................................................................................................................................64

4
List of tables and figures
Table 1: Climate Mitigation Goods Available on a Commercial Basis……………………55
Table 2: Climate Mitigation Goods Undergoing R&D with Strong Prospects forCommercialisation………………………………………………………………………….61
Figure 1: High-strength and ultra-high-strength steels are used for more than 90 percent of a car’s bodystructure..................................................................................................................................................... 19
Figure 2: The body-in-white for the 2008 Mercedes C-Class..................................................................19
Figure 3: A typical ICE......................................................................................................................... 22
Figure 4: Description of ICE’s operation................................................................................................. 23
Figure 5: Direct injection diesel engines.................................................................................................. 24
Figure 6: A new GM diesel engine………………………………………….…………………………...............25
Figure 7: Different parts of a PEM fuel cell used to power hydrogen cars…………………………..………47Figure 8: Hydrogen station………………………………………………………………………..………………..48Figure 9: Overview of an FCV…………………………………………….……………….……………………….49Figure 10: BMW’s hydrogen car……………………………………………….………….……………………….49

5
Executive Summary
Global climate change is becoming an important force that drives technology development innew directions. The change in technology will have a strong impact on trade due to demandfor new technologies and reallocation of technology manufacturing.
The purpose of this study is to present an overview of climate-mitigation technologies andassociated goods within the transport sector. The study was commissioned by theInternational Centre for Trade and Sustainable Development (ICTSD) and looks at alltransport modes including road, air, ocean and railway. This study offers a substantialperspective for reduction of greenhouse gas (GHG) emissions, and gives a broad overview oftechnologies that are commercially available today in both industrialized and developingcountries as well as technologies that need 5 to 10 years before commercialization.
In this study, the newly published Intergovernmental Panel Panel on Climate Change (IPCC)Fourth Assessment Report by Working Group III was reviewed on transport technologyassessment, which covers a wide range of recent progress and analysis on transporttechnology and mitigation potential. The IPCC’s report is viewed as the most comprehensiveassessment on GHG mitigation related research activities, providing a strong basis for thepolicy making process and supporting further research.
Due to the importance of transport for the environment, energy security and GHG emissions,transport technologies have made rapid progress in recent decades. Many transporttechnologies are currently commercially available or just have just started to be applied on amore or less commercial base, e.g. in demonstration projects followed by diffusion to themarket. Some emerging technologies are still less mature and require perhaps another 5 to 10years before commercialization (or less than that in case of concerted action by governmentsand private companies).
Road transport
While road transport is the biggest source of GHG emissions in the transport sector,technology progress in this field is significant. GHG emissions associated with vehicles canbe reduced by four types of measures:
1). Reducing the loads (weight, rolling and air resistance and accessory loads) on the vehicle,thus reducing the work needed to operate it;
2). Increasing the efficiency of converting the fuel energy to work, by improving drive trainefficiency and recapturing energy losses;
3.) Changing to a less carbon-intensive fuel; and
4). Reducing emissions of non-CO2 GHGs from vehicle exhaust and climate controls.

6
Railway transport
R&D programmes aimed at CO2 reduction for trains include:
Reducing aerodynamic resistance. Aerodynamic resistance is determined by the shapeof the train. Therefore, research has been carried out to find the optimum shape byusing computer simulation and wind tunnel testing. The latest series 700 Shinkansentrain has reduced aerodynamic resistance by 30 percent compared with the firstgeneration Shinkansen.
Reducing train weight. Aluminium car bodies, lightweight bogies and lighterpropulsion equipments are proven weight reduction measures.
Regenerative braking. For current systems, the electric energy generated by braking isused through a catenary (overhead wire) for powering other trains, reducing energyconsumption and CO2 emissions.
Higher efficiency propulsion system. Recent research on rail propulsion has focusedon superconducting on-board transformers and permanent magnet synchronoustraction motors.
Apart from the above technologies mainly for electric trains, there are several promisingtechnologies for diesel switchers, including common rail injection systems andhybridization/onboard use of braking energy in diesel-electric vehicles.
Air transport
Fuel efficiency is a major consideration for aircraft operators as fuel currently representsaround 20 percent of total operating costs for modern aircraft. Both aircraft and enginemanufacturers pursue technological developments to reduce fuel consumption to a practicalminimum. There are no fuel efficiency certification standards for civil aviation. Marketpressures therefore determine fuel efficiency and CO2 emissions of aircrafts.
Biofuel is another key option for mitigation in air transport. A potential non-carbon fuel ishydrogen and there have been several studies on its use in aviation.
The introduction of biofuels could mitigate some of aviation’s carbon emissions, if biofuelscan be developed to meet the demanding specifications of the aviation industry. Both thecosts of such fuels and the emissions from their production process are uncertain at this time.

7
Shipping
The potential of technical measures to reduce CO2 emissions was estimated at up to 30percent in new ships and up to 20 percent in old ships. These reductions could be achieved byapplying current energy-saving technologies vis-à-vis hydrodynamics (hull and propeller) andmachinery on new and existing ships.
The vast majority of marine propulsion and auxiliary plants onboard ocean-going ships arediesel engines. These engines typically have service lives of 30 years or more. It willtherefore take a long time before technical measures can be implemented in the fleet on anysignificant scale. This implies that operational emission abatement measures on existing ships,such as speed reduction, load optimization, maintenance, fleet planning, etc., should play animportant role if policy is to be effective before 2020.
In a long-term span, fuel cells could also be used in ships in water transport. The introductionof hydrogen-propelled ships and the use of fuel cell power at least for the auxiliary enginesseem to be a possibility as well. For larger vessels capable and reliable fuel-cell-based shippropulsion systems are still a long way into the future, but might be possible in 2050. Fuelcells offer the potential for significant environmental improvements both in air quality andclimate protection. Local pollutant emissions and GHG emissions can be eliminated almostentirely over the full life cycle using renewable primary energies.

8
CHAPTER 1:An Overview of the Findings on Transport and Climate Change
Findings from the IPCC
The transport sector plays a crucial and growing role in world energy use and GHGemissions. In 2004, transport energy use amounted to 26 percent of the world’s total energyuse, and the transport sector was responsible for about 23 percent of world energy-related
GHG emissions. The 1990–2002 growth rate of energy consumption in the transport
sector was the highest among all the end-use sectors. Of a total of 77 Exa Joule (EJ) oftotal transport energy use, road vehicles account for more than three-quarters, with light-duty vehicles and freight trucks having the lion’s share. Virtually all (95 percent) oftransport energy comes from oil-based fuels, largely diesel (23.6 EJ, or about 31 percent oftotal energy) and gasoline (36.4 EJ, 47 percent). One consequence of this dependence,coupled with the only moderate differences in carbon content of the various oil-based fuels,is that the CO2 emissions from the different transport sub-sectors are approximatelyproportional to their energy use (IPCC, 2007).
Economic development and transport are inextricably linked. Economic developmentincreases transport demand, while availability of transport stimulates even moredevelopment by allowing trade and economic specialization. Industrialization and growingspecialization have created the need for large shipments of goods and materials oversubstantial distances, and accelerating globalization has greatly increased these flows.
Urbanization has been extremely rapid in the past century. About 75 percent of people inthe industrialized world and 40 percent in the developing world now live in urban areas.Cities have also grown larger, with 19 cities now having a population over 10 million. A
parallel trend has been the decentralization of cities – they have spread out faster than
they have grown in population, with rapid growth in suburban areas and the rise of‘edge
cities’ in the outer suburbs. This decentralization has created both a growing demand fortravel and an urban pattern that is not easily served by public transport. The result has been
a rapid increase in personal vehicles – not only cars but also 2-wheelers – and a
declining share of transit. Further, the lower-density development and the greater distancesneeded to access jobs and services have seen the decline of walking and bicycling as ashare of total travel (WBCSD, 2002).
Another crucial aspect of our transport system is that much of the world is not yetmotorized because of low incomes. The majority of the world’s population does not haveaccess to personal vehicles, and many do not even have access to motorized public

9
transport services of any sort. 33 percent of China’s population and 75 percent ofEthiopia’s still did not have access to all-weather transport.
GHG mitigation technologies in the transport sector
Many technologies and strategies are at hand to reduce the growth or even, eventually,reverse transport GHG emissions. Most of the technology options discussed here werementioned in the IPCC Third Assessment Report (TAR). The most promising strategy forthe near term is incremental improvements in current vehicle technologies. Advancedtechnologies that provide great energy and emissions savings include greater use ofelectric-drive technologies, including hybrid-electric power trains, fuel cells and batteryelectric vehicles. The use of alternative fuels such as natural gas, biofuels, electricity andhydrogen, in combination with improved conventional and advanced technologies,provides the potential for even larger reductions in energy demand and GHG emissions(IPCC, 2007).
Even with all these improved technologies and fuels, it is expected that oil based transporttechnology will remain the dominant mode of transport and that transport energy use andGHG emissions will continue to increase into the foreseeable future. Only with sharpchanges in economic growth, major behavioral shifts, and/or major policy interventionwould transport GHG emissions decrease substantially.
Road transport
GHG emissions associated with vehicles can be reduced by four types of measures:
1). Reducing the loads (weight, rolling and air resistance and accessory loads) on thevehicle, thus reducing the work needed to operate it;
2). Increasing the efficiency of converting the fuel energy to work, by improving drivetrain efficiency and recapturing energy losses;
3) . Changing to a less carbon-intensive fuel; and
4). Reducing emissions of non-CO2 GHGs from vehicle exhaust and climate controls.
The loads on the vehicle arise largely from five forces; specifically, (a) the force needed toaccelerate the vehicle, to overcome inertia; (b) vehicle weight when climbing slopes; (c)the rolling resistance of the tyres; (d) aerodynamic forces; and (e) accessory loads. In urbanstop-and-go driving, aerodynamic forces play a little role, but rolling resistance andespecially inertial forces are critical. In steady highway driving, aerodynamic forcesdominate, because these forces increase with the square of velocity; aerodynamic forces at90 km/h are four times the forces at 45 km/h. Reducing inertial loads is accomplished byreducing vehicle weight, with improved design and greater use of lightweight materials.Reducing tyre losses is accomplished by improving tyre design and materials, to reduce the

10
tyres’ rolling resistance coefficient, as well as by maintaining proper tyre pressure; weightreduction also contributes, because tyre losses are a linear function of vehicle weight. Andreducing aerodynamic forces is accomplished by changing the shape of the vehicle,smoothing vehicle surfaces, reducing the vehicle’s cross-section, controlling airflow underthe vehicle and other measures. Measures to reduce the heating and cooling needs of thepassengers, for example by changing window glass to reflect incoming solar radiation, areincluded in the group of measures.
Increasing the efficiency with which the chemical energy in the fuel is transformed intowork (that is, to move the vehicle and provide comforts like air conditioning and otherservices to passengers), will also reduce GHG emissions. Such efficiency increases includemeasures to improve engine efficiency and the efficiency of the rest of the drive train andaccessories, including air conditioning and heating. The range of measures here is quitegreat; for example, engine efficiency can be improved by three different kinds of measures,increasing thermodynamic efficiency, reducing frictional losses and reducing pumpinglosses (these losses are the energy needed to pump air and fuel into the cylinders and pushout the exhaust) and each kind of measure can be addressed by a great number of design,material and technology changes. Improvements in transmissions can reduce losses in thetransmission itself and help engines to operate in their most efficient modes. Also, some of
the energy used to overcome inertia and accelerate the vehicle – normally lost when the
vehicle is slowed, to aerodynamic forces and rolling resistance as well to the mechanical
brakes (as heat) – may be recaptured as electrical energy if regenerative braking is
available (see the discussion of hybrid electric drive trains).
Some fuel improvements would require changes to vehicles, while others would not. Forexample, the use of different liquid fuels, either in blends with gasoline and diesel or as‘neat fuels’, requires minimal or no changes to the vehicle, while a variety of gaseous fuelsand electricity would require major changes. Alternative liquid fuels include ethanol,biodiesel and methanol, and synthetic gasoline and diesel made from natural gas, coal, orother feedstocks. Gaseous fuels include natural gas, propane, dimethyl ether (a dieselsubstitute) and hydrogen. Each fuel can be made from multiple sources, with a wide rangeof GHG emission consequences. In evaluating the effects of different fuels on GHGemissions, it is crucial to consider GHG emissions associated with fuel production anddistribution in addition to vehicle tailpipe emissions (see the section on well-to-wheelsanalysis). For example, the consumption of hydrogen produces no emissions aside fromwater directly from the vehicle, but GHG emissions from hydrogen production can be quitehigh if the hydrogen is produced from fossil fuels (unless the carbon dioxide from thehydrogen production is sequestered).

11
Rail
Railway transport is widely used in many countries. In Europe and Japan, electricity is amajor energy source for rail, while diesel is a major source in North America. Coal is alsostill used in some developing countries. Rail’s main roles are high speed passengertransport between large (remote) cities, high density commuter transport in the city andfreight transport over long distances. Railway transport competes with other transportmodes, such as air, ship, trucks and private vehicles. Major R&D goals for railwaytransport are higher speeds, improved comfort, cost reductions, better safety and betterpunctuality.
Many energy efficiency technologies for railways are discussed in the web site of theInternational Union of Railways. Some of their 29 R&D programmes aimed at CO2
reduction include:
Reducing aerodynamic resistance
For high speed trains such as the Japanese Shinkansen, French TGV and German ICE,aerodynamic resistance dominates vehicle loads. It is important to reduce this resistance toreduce energy consumption and CO2 emissions. Aerodynamic resistance is determined bythe shape of the train. Therefore, research has been carried out to find the optimum shapeby using computer simulation and wind tunnel testing. The latest series 700 Shinkansentrain has reduced aerodynamic resistance by 31 percent compared with the first generationShinkansen.
Reducing train weight
Reduction of train weight is an effective way to reduce energy consumption and CO2
emission. Aluminium car bodies, lightweight bogies and lighter propulsion equipments areproven weight reduction measures.
Regenerative braking
Regenerative brakes have been used in railways for three decades, but with limitedapplications. For current systems, the electric energy generated by braking is used througha catenary for powering other trains, reducing energy consumption and CO2 emissions.However, regenerative braking energy cannot be effectively used when there is no trainrunning near a braking train. Recently, research in energy storage devices, be they onboardor trackside, is progressing in several countries. Lithium ion batteries, ultracapacitors andflywheels are candidates for such energy storage devices.

12
Higher efficiency propulsion system
Recent research on rail propulsion has focused on superconducting onboard transformersand permanent magnet synchronous traction motors.
Apart from the above technologies mainly for electric trains, there are several promisingtechnologies for diesel switchers, including common rail injection system andhybridization/onboard use of braking energy in diesel-electric vehicles.
Aviation
Fuel efficiency is a major consideration for aircraft operators as fuel currently representsaround 20 percent of total operating costs for modern aircraft (2005 data, according toICAO estimates for the scheduled airlines of Contracting States). Both aircraft and enginemanufacturers pursue technological developments to reduce fuel consumption to a practicalminimum. There are no fuel efficiency certification standards for civil aviation. On thequestion of whether such a standard would be desirable, ICAO has discussed the issue buthas been unable to develop any form of parameter from the information available thatcorrelates sufficiently well with the aircraft/engine performance. As a result, ICAO hasbeen unable to define a fuel efficiency parameter that might be used for a standard at this
time. ‘Point’ certification could drive manufacturers to comply with the regulatory
requirement, possibly at the expense of fuel consumption for other operational conditionsand missions. Market pressures therefore determine fuel efficiency and CO2 emissions.
Some operational measures can be used immediately. One is speed reduction and the otheris improved air traffic management (ATM).
Shipping
In the past few years, the International Maritime Organization (IMO) has started researchand discussions on the mitigation of GHG emissions by the shipping industry. Thepotential of technical measures to reduce CO2 emissions was estimated at up to 30 percentin new ships and up to 20 percent in old ships. These reductions could be achieved byapplying current energy-saving technologies vis-à-vis hydrodynamics (hull and propeller)and machinery on new and existing ships.
The vast majority of marine propulsion and auxiliary plants onboard ocean-going ships arediesel engines. In terms of the maximum installed engine output of all civilian ships above100 gross tonnes (GT), 96 percent of this energy is produced by diesel power. Theseengines typically have service lives of up to 30 year. It will therefore take a long timebefore technical measures can be implemented in the fleet on any significant scale. As aresult of this delay, operational emission abatement measures on existing ships, such asspeed reduction, load optimization, maintenance, fleet planning, etc., should play animportant role if policy is to be effective before 2020.

13
The IPCC estimates the short-term potential of operational measures at up to 40%. TheseCO2 reductions could in particular be achieved by fleet optimization and routing and speedreduction. A general quantification of the potential is uncertain, because ship utilizationvaries across different segments of shipping and the operational aspects of shipping are notwell defined.
The IPCC also estimated the long-term CO2 reduction potential for the world shippingfleet , assuming implementation of technical or operational measures, 17.6 percent in 2010and 28.2 percent in 2020. Even though this potential is significant, it was noted that thiswould not be sufficient to compensate for the effects of projected fleet growth (Marintek,2000). Speed reduction was found to offer the greatest potential for reduction, followed bythe implementation of new and improved technology (such as main engine retrofit andpropeller upgrade). Speed reduction is probably only economically feasible if policyincentives, such as CO2 trading or emissions charges are introduced.
A significant shift from a primarily diesel-only fleet to a fleet that uses alternative fuels andenergy sources cannot be expected until 2020, as most of the promising alternativetechniques are not yet tested to an extent that they can compete with diesel engines (Eyringet al., 2005b). Furthermore, the availability of alternative fuels is currently limited and timeis needed to establish the infrastructure for alternative fuels.
For these reasons, in the short term switching to alternative fuels provides a limitedpotential in general, but a significant potential for segments where a switch from diesel tonatural gas is possible. Switching from diesel to natural gas has a 20 percent CO2 reductionpotential and is being pursued as a measure in Norway for inland ferries and offshoresupply vessels operating on the Norwegian Continental Shelf. Main obstacles to theincreased utilization of natural gas is the access to LNG (Liquefied Natural Gas), thetechnology’s level of costs compared to traditional ship solutions based on traditional fuel,and storage and safety concerns. A co-benefit of a switch from diesel to natural gas is thatit also reduces emissions of SOx and NOx, gases which contribute to air pollution aroundports.
For the long-term (2050), the economical CO2 reduction potential in the shipping sectormight be large. One potential option is a combination of solar panels and sails (wind kitesand wind engines). The use of large sails for super tankers is currently being tested inGermany and looks promising and may even be a cost-effective measure in the short termin case oil prices continue to soar. The use of large sails does not require fleet turnover butcan be retrofitted to existing vessels. Other possibilities include the introduction ofhydrogen-propelled ships and the use of fuel cell power for the auxiliary engines. Forlarger vessels, capable and reliable fuel-cell-based ship propulsion systems are still a longway into the future, but might be possible in 2050. Local pollutant emissions and GHGemissions can be eliminated almost entirely over the full life cycle using renewableprimary energies. The direct use of natural gas in high temperature fuel cells employed inlarge ships and the use of natural gas derived hydrogen in fuel cells installed in small ships
allows for a GHG emission reduction of 20–40 percent.

14
‘Wedges’ Analysis by Pacala and Socolow
Pacala and Socolow (2004) mention three options related to mitigation of GHG emissionsin the transportation sector:
Improved fuel economy
Reduced reliance on cars
Biofuels.
A wedge is defined as (a group of) technologies that enable a reduction of GHG emissionsequal to 1 GtC-eq/yr (giga-tonne carbon equivalent per year) in 50 years from 2004. Intheir paper, Pacala and Socolow say that three options could contribute to the wedges in thetransport sector:
Option 1: Improving fuel economy. Suppose that in 2054, two billion cars (roughly fourtimes as many as today) average 10,000 miles per year (as they do today). One wedgewould be achieved if, instead of averaging 30 miles per gallon (mpg) on conventional fuel,cars in 2054 averaged 60 mpg, with fuel type and distance traveled unchanged.
Option 2: Reducing reliance on cars. A wedge would also be achieved if the average fueleconomy of the two billion 2054 cars were 30 mpg, but the annual distance traveled were5,000 miles instead of 10,000 miles.
Option 3: Using biofuels. Fossil-carbon fuels can also be replaced by biofuels such asethanol. A wedge of biofuel would be achieved by the production of about 34 millionbarrels per day of ethanol in 2054 that could displace gasoline, provided the ethanol itselfwere fossil-carbon free. This ethanol production rate would be about 50 times larger thantoday’s global production rate, almost all of which can be attributed to Brazilian sugarcaneand United States corn. An ethanol wedge would require 250 million hectares committed tohigh-yield (15 dry tons per hectare) plantations by 2054, an area equal to about one-sixth ofthe world’s cropland. An even larger area would be required to the extent that the biofuelsrequire fossil-carbon inputs. Because land suitable for annually harvested biofuels crops isalso often suitable for conventional agriculture, biofuels production could compromiseagricultural productivity.
In the paper, these three options are inside the technology options from IPCC report. Andthis report will provide more detailed technology description for the options here.

15
CHAPTER 2: Key mitigation technologies/goodswithin the transport sector that are commerciallyavailable
Introduction
This chapter will give an overview of ‘key mitigation technologies and associated goodswithin the transport sector that are commercially available’. This description is specified asfollows:
Technologies and associated goods are assumed to be commercially available if they aremature or if they are in the pre-commercial stage after having been demonstrated. Thisspecification is meant as a differentiation from technologies that are currently not mature,viz. assumed to become commercially available about five to ten years from now. However,this demarcation is not straightforward. Some technologies may be in the demonstrationstage, but are hampered by economic infeasibility and may therefore not be commercial onshort notice. Other technologies may not yet be considered as commercial or sufficientlydemonstrated and must wait a couple years to enter the commercial stage.
Technologies that are covered in this Chapter include:
- Load reducing technologies- High efficiency vehicles- Hybrid vehicles- Electric vehicles- Alternative fuels- High efficiency high speed trains- High efficiency aircraft- Energy saving ships

16
2.1 Road transport
In the road transport sub-sector, a wide array of technologies is available for saving energyand reducing GHG emissions: technologies for load reduction and efficiency improvement,hybrid and electric vehicles and alternative fuels.
2.1.1 Load reducing technologies
There are two ways to reduce load: lightweight materials and aerodynamics improvement.A ten percent weight reduction from a total vehicle weight can improve fuel economy byfour to eight percent, depending on changes in vehicle size and whether or not the engine isdownsized. There are several ways to reduce vehicle weight, such as switching to highstrength steels (HSS), replacing steel with lighter materials such as aluminium, magnesiumand plastics and devising lighter design concepts and forming technologies.
While the amount of lighter materials in vehicles has been progressively increasing overtime, the expected gain to fuel economy has been often wiped away by increasing vehiclesizes and performance. In fact, the average weight of a vehicle in the USA and Japan hasincreased by ten to twenty percent in the last ten years, partly due to increased concern forsafety and customers’ desire for comfort (IPCC, 2007).
Steel is still the main material used in vehicles, currently averaging 70 percent of kerbweight. Aluminium usage has grown to roughly 100 kg per average passenger car, mainlyin the engine, drive train and chassis in the form of castings and forgings. Aluminium istwice as strong as an equal weight of steel, allowing the designer to provide strong yetlightweight structures. Aluminium use in body structures is limited, but there are a fewcommercial vehicles with all aluminium bodies (like Audi’s A2 and A8). In more than 11cases where more than 200 kg of aluminium is used and secondary weight reductions aregained by down-sizing the engine and suspension, 13 percent weight reduction has beenachieved. Ford’s P2000 concept car has demonstrated that up to 300 kg of aluminium canbe used in a 900 kg vehicle.
Magnesium has a density of 1.8 grams per cubic centimeter (g/cc) or about a quarter of thatof steel, while attaining a similar volumetric strength. Major hurdles for automobileapplication of magnesium include its high cost, as well as performances issues such as lowcreep strength and contact corrosion susceptibility. At present, the use of magnesium in
vehicle is limited to only 0.1–0.3 percent of the whole weight. However, its usage in
North American-built family vehicles has been expanding by ten to fourteen percentannually in recent years. Aluminium has grown at four to six percent; plastics by one totwo percent; and high strength steels by three to four percent. Since the amount of energyrequired to produce magnesium and aluminium is large compared with steel, life cycleanalysis is important in evaluating these materials’ potential for CO2 emission reduction.Also, the extent of recycling is an important issue for these metals.
The use of plastics in vehicles has increased to about eight percent of total vehicle weight,which corresponds to 100-120 kg per vehicle. The growth rate of plastics content has been

17
decreasing in recent years, however, probably due to concerns about recycling, given thatmost of the plastic goes to the automobile shredder residue (ASR) at the end of vehicle life.Fibrereinforced plastic (FRP) is now widely used in aviation, but its application toautomobiles is limited due to its high cost and long processing time. Nevertheless, itsweight reduction potential is very high, maybe as much as 60 percent.
Examples of FRP structures manufactured using resin transfer method (RTM) technologyare wheel housings or entire floor assemblies. For a compact size car, these FRP structureswould make it possible to reduce the weight of a floor assembly (including wheel housings)by 60 percent, or 22 kg per car compared to a steel floor assembly. Research examples ofplastics use in the chassis are leaf or coil springs manufactured from fibre composite plastic.Weight reduction potentials of up to 63 percent have been achieved in demonstrators usingglass and/or carbon fibre structures.
Aside from the effect of the growing use of non-steel materials, the growing shift fromconventional steels to high strength steels (HSS) drives the reduction in the average steelweight of a car. HSS is low carbon steel with minute amounts of molybdenum, niobium,titanium, and/or vanadium included;it is also known as high strength alloy steel or high-strength, low-alloy steel. Their properties allow thinner gauges to be applied throughout anauto body and thereby produce a stronger, lighter vehicle without significant changes incost structure. As HSS content rises, its positive impact on fuel economy, emissions andsafety will give OEMs the vital breathing room needed to build cars and trucks that stillappeal to consumers.
There are various types of HSS, from relatively low strength grade (around 400 megapascal (MPa), such as solution-hardened and precipitation-hardened HSS, to very highstrength grade (980–1400 MPa), such as transformation induced plasticity (TRIP) steel andtempered martensitic HSS. At present, the average usage per vehicle of HSS is 160 kg(eleven percent of whole weight) in the USA and 75 kg (seven percent) in Japan. In thelatest Mercedes A-class vehicle, HSS comprises 67 percent of body structure weight. The
international ULSAB-AVC (Ultra Light Steel Auto Body – Advanced Vehicle Concept)
project investigated intensive use of HSS, including advanced HSS, and demonstrated that
using HSS as much as possible can reduce vehicle weight by 214 kg (–19 percent) and
472 kg (–32 percent) for small and medium passenger cars, respectively (IPCC, 2007).
In this concept, the total usage of HSS in body and closures structures is 280–330 kg, of
which over 80 percent is advanced HSS (Nippon Steel, 2002) and has the potential for over90 percent. Since heavy-duty vehicles such as articulated trucks are much heavier thanpassenger vehicles, their weight reduction potential is much larger. It is possible to reducethe weight of a tractor and trailer combination by more than 3000 kg by replacing steelwith aluminium (EAA, 2001).
In the quest for safer and lighter cars, automotive and steel companies are rapidlyintroducing new advanced high-strength steels (AHSS) for body structures. AHSS alloysinclude high tensile strengths--500 MPa or greater--with good formability, and include

18
grades like dual phase (DP), complex phase (CP), transformation-induced plasticity (TRIP)and some martensitic steels (see figure 1). The high strengths of these materials allow formass-efficient designs for improved fuel economy, while simultaneously increasingcrashworthiness. Unlike many competitive materials, AHSS can accomplish theseobjectives with little or no overall cost to the manufacturer. Several full-vehicle conceptdesigns and subsystem concept designs, such as the steel industry’s UltraLight family ofresearch, have demonstrated 25 percent mass savings over conventional steel designs whileimproving crash performance, without increasing cost.
Figure 1 High-strength and ultra-high-strength steels are used for more than 90 percent ofthe body structure (colored parts), which allows designers to reduce weight and increasestrength (internet source 1).
Advanced high-strength steels (AHSS) including dual-phase (DP) alloys andtransformation-induced-plasticity (TRIP) steels. TRIP steels contain martensite andretained austenite and have higher formability than DP steels, which contain primarilyferrite and martensite.
Many vehicles on the road today contain significant amounts of AHSS, one of which is the2008 Mercedes C-Class whose body-in-white contains 70 percent high-strength steels and20 percent advanced high-strength steels. Mercedes-Benz states in an S-Class mediarelease that advanced high-strength steels are indispensable when it comes to meeting thestringent Mercedes requirements with respect to durability and safety (figure 2).
Figure 2 The body-in-white for the 2008 Mercedes C-Class contains 70 percent high-strength steels and 20 percent advanced high-strength steels.

19
Aerodynamics improvement
Improvements have been made in the aerodynamic performance of vehicles over the pastdecade, but substantial additional improvements are still possible. Enhancement inaerodynamic performance offers important gains for vehicles operating at higher speeds,e.g., long-distance trucks and light-duty vehicles operating outside congested urban areas.For example, a 10% reduction in the coefficient of drag (CD) of a medium sized passengercar would yield only about a 1% reduction in average vehicle forces on the US city cycle(with 31.4 km/h average speed), whereas the same drag reduction on the US highway cycle,with average speed of 77.2 km/h, would yield about a 4% reduction in average forces.These reductions in vehicle forces translate reasonably well into similar reductions in fuelconsumption for most vehicles, but variation in engine efficiency with vehicle force maynegate some of the benefit from drag reduction unless engine power and gearing areadjusted to take full advantage of the reduction.
There are numerous methods to improve the aerodynamic efficiency of a car. An importantone is to use the modern technology to test the aerodynamic efficiency of a particular car.This leads to a potential improvement in car design. The possible testing technologies arewing tunnel data, on track data, and even computational methods, such as ComputationalFluid Dynamic (CFD).
For highway driving conditions, driveline uses about 15 percent of the total energyrequired to push a vehicle down the highway, and tire rolling resistance represents about 25percent and air drag about 60 percent. There are greater gains that can be made bymodifying the aerodynamics, engine, and rolling resistance of a vehicle. Thesemodifications are not without cost, but are within reach of even those of with meagerincomes.
For light-duty vehicles, styling and functional requirements (especially for light-dutytrucks) may limit the scope of improvement. However, some vehicles introduced within thepast five years demonstrate that improvement potential still remains for the fleet. TheLexus 430, a conservatively styled sedan, attains a coefficient of aerodynamic drag (CD) of0.26 versus a fleet average of over 0.3 for the US passenger car fleet.
Other fleet-leading examples are:
• Toyota Prius, Mercedes E-class sedans, 0.26
• Volkswagen Passat, Mercedes C240, BMW 320i, 0.27
For light trucks, General Motors’ 2005 truck fleet has reduced average CD by five to sevenpercent by sealing unnecessary holes in the front of the vehicles, lowering their air dams,smoothing their undersides, and so forth (SAE International, 2004).
The current generation of heavy-duty trucks in the United States has average CDs rangingfrom 0.55 for tractor-trailers to 0.65 for tractor-tandem trailers. These trucks generally havespoilers at the top of their cabs to reduce air drag, but substantial further improvements are
20
available. CD reductions of about 0.15, or 25 percent or so (worth about 12 percentreduced fuel consumption at a steady 65 mph), can be obtained with a package of baseflaps (that is, simple flat plates mounted on the edges of the back end of a trailer) and sideskirts. The US Department of Energy’s 2012 research goals for heavy-duty trucks (USDOE,2000) include a 20 percent reduction (from a 2002 baseline, with CD of 0.625) inaerodynamic drag for a ‘class 8’ tractor-trailer combination.
Coefficient drag reductions of 50% and higher, coupled with potential benefits in safety(from better braking and roll and stability control), may be possible with pneumatic (airblowing) devices. A complete package of aerodynamic improvements for a heavy-duty
truck, including pneumatic blowing, might save about 15–20 percent of fuel for trucks
operating primarily on uncongested highways, with substantial cost reductions possibleover time (IPCC,2007).
The importance of aerodynamic forces at higher speeds implies that reduction of vehiclehighway cruising speeds can save fuel and some nations have used speed limits as fuelconservation measures, such as the US during the period following the 1973 oil embargo.US tests on nine vehicles with model years from 1988 to 1997 demonstrated an average17.1 percent fuel economy loss in driving at 70 mph compared to 55 mph. Recent tests on
six contemporary vehicles, including two hybrids, showed similar results – the average
fuel economy loss was 26.5 percent in driving at 80 mph compared to 60 mph, and 27.2percent in driving at 70 mph compared to 50 mph.

21
2.1.2 High efficiency vehicles
By improving drive train efficiency and recapturing energy losses, a high efficiencyvehicle increases the efficiency of converting fuel energy to work.
Internal combustion engines (ICE)
The internal combustion engine is an engine in which the combustion of a fuel occurs withan oxidiser (usually air) in a combustion chamber. In an internal combustion engine theexpansion of the high temperature and pressure gases, that are produced by the combustion,directly apply force to a movable component of the engine, such as the pistons or turbineblades and by moving it over a distance, generate useful mechanical energy (figure 3 andfigure 4).
Figure 3 A typical ICE

22
Figure 4 Description of ICE’s operation
The term internal combustion engine usually refers to an engine in which combustion isintermittent, such as the more familiar four-stroke and two-stroke piston engines, alongwith variants, such as the Wankel rotary engine. A second class of internal combustionengines use continuous combustion: gas turbines, jet engines and most rocket engines, eachof which are internal combustion engines on the same principle as previously described.
Over the next 30 years ICE technology will continue to improve, given the availability ofsuitable and appropriate cleaner enabling fuels. For gasoline technology, downsized sparkignition engines are expected to take a much greater share of the gasoline engine market inthe near future. Static downsizing with redesigned engines can reduce engine displacementby up to 30 percent, which in turn leads to significant reductions in fuel consumption andCO2.
New engine and transmission technologies have entered the light-duty vehicle fleets ofEurope, the US and Japan, and could yield substantial reductions in carbon emissions ifmore widely used.
Direct injection diesel engines
Direct injection diesel engines yielding about 35 percent greater fuel economy thanconventional gasoline engines are being used in about half the light-duty vehicles beingsold in European markets, but are little used in Japan and the US (European taxes on dieselfuel generally are substantially lower than on gasoline, which boosts diesel share). Euro 4emission standards were enforced in 2005, with Euro 5 (still undefined) to follow around
2009–2010. These standards, plus Tier 2 standards in the US, will challenge diesel NOx
controls, adding cost and possibly reducing fuel efficiency somewhat. Euro 4/Tier 2compliant diesels for light-duty vehicles, obtaining 30 percent better fuel efficiency than

23
conventional gasoline engines, may cost about 2000–3000 US$ more than gasoline
engines (IPCC, 2007).
Direct injection injectors mount in the top of the combustion chamber. The problem withthese vehicles was the harsh noise that they made. Fuel consumption was about 15 to 20percent lower than indirect injection diesels, which for some buyers was enough tocompensate for the extra noise (Figure 5).
This type of engine was transformed by electronic control of the injection pump, pioneeredby the Volkswagen Group in 1989. The injection pressure was still only around 300 bar(4350 psi), but the injection timing, fuel quantity, EGR and turbo boost were allelectronically controlled. This gave more precise control of these parameters which maderefinement more acceptable and emissions lower.
Mercedes’ M271 turbocharged direct injection engine is estimated to attain 18 percentreduced fuel consumption, part of which is due to intake valve control and other enginetechnologies (SAE International, 2003a); cylinder shutoff during low load conditions(Honda Odyssey V6, Chrysler Hemi, GM V8s) (SAE International, 2003a) and improvedvalve timing and lift controls (Figure 6).
Figure 5 Direct injection diesel engines (internet source 4)

24
Figure 6 A new GM diesel engine
Transmissions are also being substantially improved. Mercedes, GM, Ford, Chrysler,Volkswagen and Audi are introducing advanced 6 and 7 speed automatics in their luxuryvehicles, with strong estimated fuel economy improvements ranging from four to eightpercent over a four-speed automatic for the Ford/GM six-speed to a claimed 13 percentover a manual, plus faster acceleration, for the VW/Audi BorgWarner six-speed. The sixand seven speed automatics have an extra cog in the gearbox, but the new transmission issmaller and lighter. A wet starting clutch with dual-mass flywheel replaces theconventional torque converter. This, in combination with the seventh gear, allows forimproved acceleration and reduced fuel consumption. Also improving performance, theadvanced seven speed automatic is designed for today’s high power and torque engines,and is able to safely accept 443 lb-ft of torque. With fewer components on board, and theabsence of the torque converter, the transmission housing can be shortened by up to 0.8inches (20 mm).
If they follow the traditional path for such technology, these transmissions will eventuallybe rolled into the fleet. Also, continuously variable transmissions (CVTs), whichpreviously had been limited to low power drive trains, are gradually rising in their power-handling capabilities and are moving into large vehicles.
The best diesel engines currently used in heavy-duty trucks are very efficient, achieving
peak efficiencies in the 45–46 percent range. Although recent advances in engine and
drive train technology for heavy-duty trucks have focused on emissions reductions, current
research programmes in the US Department of Energy are aiming at 10–20 percent
improvements in engine efficiency within ten years, with further improvements of up to 25percent foreseen if significant departures from the traditional diesel engine platform can beachieved.
Engines and drive trains can also be made more efficient by turning off the engine whileidling and drawing energy from other sources. The potential for reducing idling emissions

25
in heavy-duty trucks is significant. In the US, a nationwide survey found that, on average, along-haul truck consumed about 1,600 gallons, or 6,100 litres, per year from idling duringdriver rest periods. A variety of behavioral and technological practices could be pursued tosave fuel. One technological fix is to switch to grid connections or use onboard auxiliarypower units during idling (IPCC, 2007).
Despite the continued tightening of emissions standards for both light-duty vehicles andfreight trucks, there are remaining concerns about the gap between tested emissions andon-road emissions, particularly for diesel engines. Current EU emissions testing uses testcycles that are considerably gentler than seen in actual driving, allowing manufacturers todesign drive trains so that they pass emissions tests but ‘achieve better fuel efficiency orother performance enhancement at the cost of higher emissions during operation on theroad’ (ECMT, 2006).
Other concerns involve excessive threshold limits demanded of onboard diagnosticssystems, aftermarket mechanical changes (replacement of computer chips, disconnection ofexhaust gas recirculation systems) and failure to maintain required fluid levels in SelectiveCatalytic Reduction systems (ECMT, 2006).
Low-rolling resistance tires
Tires play a key role in improving safety. Within a few years tires will be fitted withpressure sensors preventing the risk of a burst, consequence of leakage, or underinflation.Low-rolling resistance tires capable of providing information on adherence to the road (bysensors embedded in the tire) are under development. In this case data provided could beprocessed instantaneously allowing ESP or ABS to prevent adherence loss (WBCSD,2005).
For a given vehicle, the percentage of fuel consumption accounted for by rolling resistancedepends on the speed and acceleration at each moment of the driving cycle in question, thevehicle's characteristics (mass, streamlining, internal friction, transmission), and the tires'rolling resistance coefficient. The consumption caused by rolling resistance (in litres per100 km) also depends on the engine's efficiency at each moment in a cycle. From one typeof driving cycle to another, a tire with a rolling resistance coefficient of 12 kg/t accountsfor between 20% (motorway cycle) and 30% (urban cycle) of fuel consumption. Expressedas an absolute value, the tire's contribution varies between 1.4 litres per 100 kilometres(motorway cycle) and 2.6 litres per 100 kilometres (urban cycle) for a small size passengercar (Renault Clio type, 51 kW).
Low-rolling resistance tires are designed to minimize the energy wasted as heat as the tirerolls down the road. This improves the fuel efficiency of a vehicle or reduces the effortrequired in the case of human-powered ones. Approximately 5–15% of the fuel consumedby a typical car may be used to overcome rolling resistance. A 2003 California Energy
Commission (CEC) preliminary study estimated that adoption of low-rolling resistance tirescould save 1.5–4.5% of all gasoline consumption, but that current data were also

26
insufficient to compare safety and other characteristics (CEC,2006). A database of muchmore complete data will be released by the CEC pending completion of an ongoingstudy.(internet source 5)
In 2003, California signed into law the "World's First Fuel-Efficient Tires Law" and theCalifornia Energy Commission had until July 7, 2007 to develop the standards. The lawgoes into effect in July of 2008.
2.1.3 Hybrid vehicles
A hybrid vehicle is driven by a hybrid engine, which is any engine that combines two ormore sources of power, generally gasoline and electricity. There are two types of gasoline-electric hybrid cars; the parallel hybrid, and the series hybrid. Both use gasoline-electrichybrid technology, but in radically different ways (IPCC 2007; internet source 7; internetsource 8).
In a parallel hybrid car, a gasoline engine and an electric motor work together to move thecar forward, while in a series hybrid, the gasoline engine either directly powers an electricmotor that powers the vehicle, or charges batteries that will power the motor. Both types ofhybrids also use a process called regenerative braking to store the kinetic energy generatedby brake use in the batteries, which will in turn power the electric motor.
Both parallel and series hybrids have small gasoline engines, and produce much lesspollution than standard gasoline cars, but also produce much less power; hybrids generallyproduce between 60-90 horsepower, while the average gasoline engine probably producesabout double that. To overcome this power gap, hybrid cars are constructed with ultralightweight materials like carbon fiber or aluminum. Hybrid cars are also designed to bemore aerodynamic than most cars, allowing them to "slice" through air instead of pushingit out of the way. All these factors combined equate to a super efficient form of car thatfetches excellent fuel economy and helps the environment by cutting down on pollution.
Hydraulic and pneumatic hybrid vehicles use an engine to charge a pressure accumulator todrive the wheels via hydraulic or pneumatic (i.e. compressed air) drive units. The energyrecovery rate is higher and therefore the system is more efficient than battery chargedhybrids, demonstrating a 60% to 70% increase in energy economy in EPA testing. Undertests done by the EPA, a hydraulic hybrid Ford Expedition returned 32 miles per US gallon(7.4 L/100 km; 38 mpg-imp) City, and 22 miles per US gallon (11 L/100 km; 26 mpg-imp)highway.
While the system has faster and more efficient charge/discharge cycling and is cheaperthan gas-electric hybrids, the accumulator size dictates total energy storage capacity andrequires more space than a battery.

27
In current hybrids, the battery is recharged only by regenerative braking and enginecharging, without external charging from the grid. ’Plug-in hybrids’, which would obtainpart of their energy from the electric grid, can be an option but require a larger battery andperhaps a larger motor. Hybrids save energy by:
• Shutting the engine down when the vehicle is stopped (and possibly during braking orcoasting);
• Recovering braking losses by using the electric motor to brake and using the electricitygenerated to recharge the battery;
• Using the motor to boost power during acceleration, allowing engine downsizing andimproving average engine efficiency;
• Using the motor instead of the engine at low load (in some configurations), eliminatingengine operation during its lowest efficiency mode;
• Allowing the use of a more efficient cycle than the standard cycle (in some hybrids);
• Shifting power steering and other accessories to (more efficient) electric operation.
Since the 1998 introduction of the Toyota Prius hybrid in the Japanese market, hybridelectric drive train technology has advanced substantially, expanding its markets anddeveloping in alternative forms that offer different combinations of costs and benefits andimproving component technologies and system designs. Hybrids now range from simplebelt-drive alternator-starter systems offering perhaps 8 percent fuel economy benefit under
US driving conditions to ‘full hybrids’ such as the Prius offering perhaps 40–50
percent fuel economy benefits (the Prius itself more than doubles the fuel economy average
– on the US test – of the combined 2010 US model year compact and medium size
classes, although some portion of this gain is due to additional efficiency measures). Also,hybrids may improve fuel efficiency by substantially more than this in congested urbandriving conditions, and so might be particularly useful for urban taxis and other vehiclesmaking frequent stops. Hybrid sales have expanded rapidly: in the US, sales were about7,800 in 2000 and have risen rapidly, to 352,000 in 2007.
Improvements made to the Prius since its introduction demonstrate how hybrid technologyis developing. For example, the power density of the Prius’ nickel metal hydride batterieshas improved from 600 W/kg1 in 1998 to 1310 W/kg1 in 2009 - a 120 percentimprovement. Similarly, the batteries’ specific energy has increased 37 percent during thesame period (EEA, 2003).
Higher voltage in the 2004 Prius allows higher motor power with reduced electrical lossesand a new braking-by-wire system maximizes recapture of braking energy. The 1998 Prius
compact sedan attained 42 mpg on the US CAFE cycle, with 0–60 mph acceleration time
of 14.5 seconds; the 2004 version is larger (medium size) but attains 55 mpg and a 0–60

28
of 10.5 seconds. Prius-type hybrid systems will add about 4,000 US$ to the price of amedium sized sedan (EEA, 2003), but continued cost reduction and development effortsshould gradually reduce costs.
Hybrid drive trains’ strong benefits in congested stop-and-go travel mesh well with someheavier-duty applications, including urban buses and urban delivery vehicles. An initialgeneration of hybrid buses in New York City obtained about a 10 percent improvement infuel economy as well as improved acceleration capacity and substantially reducedemissions (Foyt, 2005).
Hybrid applications extend to two and three-wheelers, as well, because these often operatein crowded urban areas in stop-and-go operation. Honda has developed a 50 cc hybridscooter prototype that offers about a one-third reduction in fuel use and GHG emissionscompared to similar 50 cc scooters. However, sales of two and three-wheeled vehicles inmost markets are extremely price sensitive, so the extent of any potential market for hybridtechnology may be quite limited. Plug-in hybrid electric vehicles (PHEVs), merge hybridelectric and battery electric systems. PHEVs get some of their energy from the electricitygrid. Plug-in hybrid technology could be useful for both light-duty vehicles and for avariety of medium duty vehicles, including urban buses and delivery vehicles.
Substantial market success of PHEV technology is, however, likely to depend strongly onfurther battery development, in particular on reducing battery cost and specific energy and
increasing battery lifetimes. PHEVs’ potential to reduce oil use is clear – they can use
electricity to‘fuel’ a substantial portion of miles driven.
The US Electric Power Research Institute estimates that 30 km hybrids (those that have thecapability to operate up to 30 km solely on electricity from the battery) can substitute
electricity for gasoline for approximately 30–40 percent of miles driven in the USA. With
larger batteries and motors, the vehicles could replace even more mileage. However, theirpotential to reduce GHG emissions more than that achieved by current hybrids depends ontheir sources of electricity. For regions that rely on relatively low-carbon electricity for off-peak power, e.g., natural gas combined cycle power, GHG reductions over the PHEV’slifecycle will be substantial; in contrast, PHEVs in areas that rely on coal-fired powercould have increased lifecycle carbon emissions. In the long-term, movement to a low-carbon electricity sector could allow PHEVs to play a major role in reducing transportsector GHG emissions.
2.1.4 All-electric vehicles
Fuel cell and hybrid vehicles gain their energy from chemical fuels, converting them intoelectricity onboard. All-electric vehicles operating today are either powered from off-board
electricity delivered through a conductive contact – usually buses with overhead wires or
trains with electrified‘third rails’– or by electricity acquired from the grid and stored
on-board in batteries. Future all-electric vehicles might use inductive charging to acquire

29
electricity, or use ultracapacitors or flywheels in combination with batteries to storeelectricity on board.
The plug-in-electric-vehicle (PEV) is becoming more and more common. It has the rangeneeded in locations where there are wide gaps with no services. The batteries can beplugged in to house (mains) electricity for charging, as well being charged while the engineis running.
The electric vehicles are driven by electric motors with high efficiencies of more than 90%,but their short driving range and short battery life have limited the market penetration.Even a limited driving range of 300 km requires a large volume of batteries weighing morethan 400 kg (JHFC, 2006). Although the potential of CO2 reduction strongly depends onthe power mix, well-to-wheels CO2 emission can be reduced by more than 50% comparedto conventional gasoline-ICE (JHFC, 2006).
Vehicle electrification requires a more powerful, sophisticated and reliable energy-storagecomponent than lead-acid batteries. These storage components will be used to start the carand also operate powerful by-wire control systems, store regenerative braking energy andto operate the powerful motor drives needed for hybrid or electric vehicles. Nickel metalhydride (NiMH) batteries currently dominate the power-assist hybrid market and Li ionbatteries dominate the portable battery business.
Ultracapacitors offer long life and high power, but low energy density and high currentcost. Prospects for cost reduction and energy enhancement and the possibility of couplingthe capacitor with the battery are attracting the attention of energy storage developers andautomotive power technologists alike.
The energy density of ultracapacitors has increased to 15–20 Wh kg–1 (Power System,
2005), compared with 40–60 Wh kg–1 for NiMH batteries. The cost of these advanced
capacitors is in the range of several 10s of dollars/Wh, about one order of magnitude higherthan Lithium batteries.
Given suitable infrastructure, permissions and vehicles, battery electric vehicle (BEV) canbe recharged while the user drives. The BEV establishes contact with an electrified rail,plate or overhead wires on the highway via an attached conducting wheel or other similarmechanism (see Conduit currassent collection). The BEV's batteries are recharged by thisprocess—on the highway—and can then be used normally on other roads until the batteryis discharged.
This provides the advantage, in principle, of virtually unrestricted highway range as long asyou stay where you have BEV infrastructure access. Since many destinations are within100 km of a major highway, this may reduce the need for expensive battery systems.Unfortunately, private use of the existing electrical system is nearly universally prohibited.
The technology for such electrical infrastructure is old and, outside of some cities, is notwidely distributed (see Conduit current collection, trams, electric rail, trolleys, third rail).

30
Updating the required electrical and infrastructure costs can be funded, in principle, by tollrevenue, gasoline or other taxes.
2.1.5 Alternative fuels
Biofuels
The term biofuel describes fuel produced from biomass. A variety of techniques can beused to convert a variety of CO2 neutral biomass feedstocks into a variety of fuels. Thesefuels include carbon-containing liquids such as ethanol, methanol, biodiesel, di-methylesters (DME) and Fischer-Tropsch liquids, as well as carbon-free hydrogen. Figure 5.8shows some main routes to produce biofuels: extraction of vegetable oils, fermentation ofsugars to alcohol, gasification and chemical synthetic diesel, biodiesel and bio oil. Inaddition, there are more experimental processes, such as photobiological processes thatproduce hydrogen directly (IPCC, 2007).
Biofuels can be used either‘pure’ or as a blend with other automotive fuels. There is a
large interest in developing biofuel technologies, not only to reduce GHG emission butmore so to decrease the enormous transport sector dependence on imported oil. There aretwo biofuels currently used in the world for transport purposes: ethanol and biodiesel.
Ethanol is currently made primarily by the fermentation of sugars produced by plants suchas sugar cane, sugar beet and corn. Ethanol is used in large quantities in Brazil where it ismade from sugar cane, in the US where it is made from corn, but only in very smallquantities elsewhere.
Ethanol is blended with gasoline at concentrations of five to ten percent on a volume basisin North America and Europe. In Brazil, ethanol is used either in its pure form, replacing
gasoline, or as a blend with gasoline at a concentration of 20–25 percent. The production
of ethanol fuelled cars in Brazil achieved 96 percent market share in 1985, but sharplydeclined shortly thereafter to near zero. Ethanol vehicle sales declined because ethanolproducers shifted to sugar production and consumers lost confidence in reliable ethanolsupply. A 25 percent blend of ethanol has continued to be used. With the subsequentintroduction of flexfuel cars, ethanol fuel sales have increased.
For the future, the conversion of ligno-cellulosic sources into biofuels is the most attractivebiomass option. Ligno-cellulosic sources are grasses and woody material. These includecrop residues, such as wheat and rice straw, and corn stalks and leaves, as well as dedicatedenergy crops. Cellulosic crops are attractive because they have much higher yields perhectare than sugar and starch crops, they may be grown in areas unsuitable for grains andother food/feed crops (and thus do not compete with food), and their energy use is far less,resulting in much greater GHG reductions than with corn and most food crops (IEA,2006a).

31
A few small experimental cellulosic conversion plants were being built in the USA in 2006to convert crop residues (e.g., wheat straw) into ethanol, but considerably more R&Dinvestment is needed to make these processes commercial. These investments arebeginning to be made. In 2006, BP announced it was committing 1 billion US$ to developnew biofuels, with special emphasis on bio-butanol, a liquid that can be easily blended withgasoline. Other large energy companies were also starting to invest substantial sums inbiofuels R&D in 2006, along with the US Department of Energy, to increase plant yields,develop plants that are better matched with process conversion technologies and toimprove the conversion processes. The energy companies in particular are seeking biofuelsother than ethanol that would be more compatible with the existing petroleum distributionsystem.Biodiesel is less promising in terms of cost and production potential than cellulosicfuels but is receiving increasing attention. Bioesters are produced by a chemical reactionbetween vegetable or animal oil and alcohol, such as ethanol or methanol. Their propertiesare similar to those of diesel oil, allowing blending of bioesters with diesel or the use of100 percent bioesters in diesel engines, and they are all called biodiesel.
Blends of 20 percent biodiesel with 80 percent petroleum diesel (B20) can generally beused in unmodified diesel engines. Diesel fuel can also be produced throughthermochemical hydrocracking of vegetable oil and animal fats. This technology hasreached the demonstration stage. In Finland and Brazil a commercial production project isunder way. The advantage of the hydrocracked biodiesel is its stability and compatibilitywith conventional diesel (Koyama et al., 2006).
A large drawback of biodiesel fuels is the very high cost of feedstocks. If waste oils areused the cost can be competitive, but the quantity of waste oils is miniscule compared totransport energy consumption. If crops are used, the feedstock costs are generally farhigher than for sugar, starch or cellulosic materials. These costs are unlikely to drop sincethey are the same highly developed crops used for foods and food processing. Indeed, ifdiverted to energy use, the oil feedstock costs are likely to increase still further, creating adirect conflict with food production. The least expensive oil feedstock at present is palm oil.Research is ongoing into new ways of producing oils. The promising feedstock seems to bealgae, but cost and scale issues are still uncertain.
For 2030, IEA (2009) reports mitigation potentials for bioethanol between 500–1200
MtCO2, with possibly up to 100– 300 MtCO2 of that for ligno-cellulosic ethanol (or some
other bio-liquid). The long-term potential for ligno-cellulosic fuels beyond 2030 is even
greater. For biodiesel, it reports mitigation potential between 100–300 MtCO2.
The GHG reduction potential of biofuels, especially with cellulosic materials, is very largebut uncertain. IEA estimated the total mitigation potential of biofuels in the transport sectorin 2050 to range from 1800 to 2300 MtCO2 at 25 US$/tCO2- eq. based on scenarios with arespective replacement of 13 and 25% of transport energy demand by biofuels (IEA, 2009).The reduction uncertainty is huge because of uncertainties related to costs and GHGimpacts.

32
Only in Brazil is biofuel competitive with oil at 50 US$ per barrel or less. All others costmore. Biofuel production costs are expected to drop considerably, especially withcellulosic feedstocks. But even if the processing costs are reduced, the scale issue isproblematic. These facilities have large economies of scale. However, there are largediseconomies of scale in feedstock production.
The cost of transporting bulky feedstock materials to a central point increasesexponentially, and it is difficult assembling large amount of contiguous land to serve singlelarge processing facilities.
Another uncertainty is the well-to-wheel reduction in GHGs by these various biofuels. Thecalculations are very complex because of uncertainties in how to allocate GHG emissionsacross the various products likely to be produced in the biorefinery facilities, uncertaintiesin how to handle the effects of alternative uses of land, as well as the large variations inhow the crops are grown and harvested and the uncertain efficiencies and designconfigurations of future process technologies.
Particularly in Brazil where there is large ethanol availability as an automotive fuel, therehas been a substantial increase in sales of flexfuel vehicles (FFV). Flexfuel vehicle sales inBrazil represent about 81 percent (Nov. 2006) of the market share of light-duty vehicles.The use of FFVs facilitates the introduction of new fuels. The incremental vehicle cost issmall, about 100 US$.
The FFVs were developed with systems that allow the use of one or more liquid fuels,stored in the same tank. This system is applied to OTTO cycle engines and enables thevehicles to run on gasoline, ethanol or both in a mixture, according to the fuel availability.The combustion control is done through an electronic device, which identifies the fuelbeing used and then the engine control system makes the suitable adjustments allowing therunning of the engine in the most adequate condition.
One of the greatest advantages of FFVs is their flexibility to choose their fuel dependingmainly on price. The disadvantage is that the engine cannot be optimized for the attributesof a single fuel, and therefore results in foregone efficiency and higher pollutant emissions(though the latter problem can be largely addressed with sophisticated sensors andcomputer controls, as it is in the US).
In the US, the number of FFVs is close to six million and some US manufacturers areplanning to expand their sales. However, unlike in the Brazilian experience, ethanol has notbeen widely available at fuel stations (other than as a ten percent blend) and thus thevehicles rarely fuel with ethanol. Their popularity in the US is due to special fuel economycredits available to the manufacturer.

33
Natural Gas (CNG / LNG / GTL)
Natural gas, which is mainly methane (CH4), can be used directly in vehicles or convertedinto more compact fuels. It may be stored in compressed (CNG) or liquefied (LNG) formon the vehicle. Also, natural gas may be converted in large petrochemical plants intopetroleum-like fuels (the process is known as GTL, or gas-to-liquid). The use of natural gasas a feedstock for hydrogen is described in the hydrogen section.
CNG and LNG combustion characteristics are appropriate for spark ignition engines. Theirhigh octane rating, about 120, allows a higher compression ratio than is possible usinggasoline, which can increase engine efficiency. However, this requires that the vehicle bededicated to CNG or LNG. Many current vehicles using CNG are converted from gasolinevehicles or manufactured as bifuel vehicles, with two fuel tanks. Bifuel vehicles cannottake full advantage of CNG’s high octane ratio.
CNG has been popular in polluted cities because of its good emission characteristics.However, in modern vehicles with exhaust gas after-treatment devices, the non-CO2emissions from gasoline engines are similar to CNG, and consequently CNG loses itsemission advantages in term of local pollutants; however it produces less CO2.
Important constraints on its use are the need for a separate refuelling infrastructure system
and higher vehicle costs – because CNG is stored under high pressure in larger and
heavier fuel tanks. Gas-to-liquids (GTL) processes can produce a range of liquid transportfuels using Fischer-Tropsch or other conversion technologies. The main GTL fuelproduced will be synthetic sulphur-free diesel fuel, although other fuels can also beproduced. GTL processes may be a major source of liquid fuels if conventional oilproduction cannot keep up with growing demand, but the current processes are relatively
inefficient: 61–65 percent and would lead to increased GHG emissions unless the CO2
generated is sequestered.
DME can be made from natural gas, but it can also be produced by gasifying biomass, coalor even waste. It can be stored in liquid form at five to ten bar pressure at normaltemperature. This pressure is considerably lower than that required to store natural gas onboard vehicles. A major advantage of DME is its high cetane rating, which means that self-ignition will be easier. The high cetane rating makes DME suitable for use in efficientdiesel engines.
DME is still at the experimental stage and it is still too early to say whether it will becommercially viable. During experiments, DME has been shown to produce loweremissions of hydrocarbons, nitric oxides and carbon monoxide than diesel and zeroemissions of soot. There is no current developed distribution network for DME, although ithas similarities to LPG and can use a similar distribution system. DME has a potential toreduce GHG emissions since it has a lower carbon intensity (15 tC/TJ) than petroleum
products (18.9–20.2 tC/TJ) (IPCC, 1996).

34
2.2 Railway: high efficiency locomotive and train
High efficiency low emission locomotive
Railroads are already four times more fuel efficient than any land-based form oftransportation, but new developments are underway. GenSet locomotives are locomotivesthat have three smaller, separate engines compared with one large engine in conventionallocomotives. The locomotive uses the three engines when required, but will automaticallyshut down the engines that are not required, thereby efficiently conserving fuel. TheGenSet enters "sleep" mode after a certain length of inactivity to eliminatethe environmental unfriendliness of idling. The engines can also be turned on as quicklyas that of a truck, further eliminating the need to leave the engines running whenunnecessary. The maintenance requirements have even been reduced by as much as 35percent thanks to the engine load sharing system. The GenSets also address the issue ofnoise pollution and is substantially quieter than traditional locomotives. GenSetlocomotives have been certified as ultra-low emitting, as outlined by EPA standards. Theinternational transportation company CSX has managed to achieve an 80 per cent reductionin nitrous oxide and particulate matter emissions with these trains.
General Electric made progress on a new model of locomotive to meet the more stringentTier II emissions requirements from the US Environmental Protection Agency. GE’s newGEVO 12-cylinder diesel engine in the Evolution™ Series Locomotive produces the same4,400 horsepower as its 16-cylinder predecessor. And it does so using less fuel. TheGEVO-12 engine produces 40 percent fewer emissions than our prior models. TheEvolution™ Series Locomotive incorporates our most advanced cooling system in railtransport to increase reliability while lowering maintenance costs.
Reducing aerodynamic resistance
For high speed trains such as the Japanese Shinkansen, the French TGV and the GermanICE, aerodynamic resistance dominates vehicle loads. It is important to reduce thisresistance to reduce energy consumption and CO2 emissions. Aerodynamic resistance isdetermined by the shape of the train. Therefore, research has been carried out to find theoptimum shape by using computer simulation and wind tunnel testing. The latest series 700Shinkansen train has reduced aerodynamic resistance by 31 percent compared with the firstgeneration Shinkansen.

35
Reducing train weight
Reduction of train weight is an effective way to reduce energy consumption and CO2
emissions. There are two ways to achieve weight reduction:
component-based lightweight design, which focuses on the elements of the system"train" without any changes to basic principle of the train configuration
system-based lightweight design, which tries to find the weight-optimised solution forthe whole system
Aluminium car bodies, lightweight bogies, lighter propulsion equipments, single-axlerunning gears, and sandwich structures are proven weight reduction measures.
Regenerative braking
Energy recovery from braking power is powerful on local and regional lines with frequentstops. Nevertheless, even on high speed traffic regenerative braking offers potential forenergy efficiency. For current systems, the electric energy generated by braking is usedthrough a catenary for powering other trains. Recent research in energy storage devices, bethey on-board or trackside devices, is progressing in several countries. Lithium ionbatteries, ultracapacitors and flywheels are candidates for such energy storage devices.
Higher efficiency propulsion system
Recent research on rail propulsion has focused on superconducting on-board transformersand permanent magnet synchronous traction motors.
Apart from the above technologies mainly for electric trains, there are several promisingtechnologies for diesel switchers, such as common rail injection systems, as well ashybridization and on-board use of braking energy in diesel-electric vehicles (also see theweb site of the International Union of Railways).

36
2.3 Air: high efficiency aircraft
Aviation’s dependence on fossil fuels, likely to continue for the foreseeable future, drives acontinuing trend of fuel efficiency improvement through aerodynamic improvements,weight reductions and engine fuel efficient developments. New technology is developednot only to be introduced into new engines, but also, where possible, to be incorporatedinto engines in current production. Fuel efficiency improvements also confer greater rangecapability and extend the operability of aircraft. Evolutionary developments of engine andairframe technology have resulted in a positive trend of fuel efficiency improvements sincethe passenger jet aircraft entered service, but more radical technologies are now beingexplored to continue this trend.
Engine developments
Engine developments require a balancing of the emissions produced to both satisfyoperational need (fuel efficiency) and regulatory need (reducing NOx, CO2, smoke andHC). This emissions performance balance must also reflect the need to deliver safety,reliability, cost and noise performance for the industry.
Several manufactures made effort on new technology design. GE and Pratt & Whitneyhave spent two decades developing the geared turbofan engine (GEnx) that burns 12 to 15percent less fuel than other jet engines and cuts carbon dioxide emissions by 1,500 tons perplane per year. A gearbox lets the fan and turbine spin independently. The fan is larger andit spins at one-third the speed of the turbine, creating a quieter, more powerful engine.
Based on GE90 architecture, the GEnx represents proven and advanced GE propulsiontechnology. With innovations like the TAPS combustor, high-pressure 10-stagecompressor, lightweight composite fan case and fan blades, and a virtually maintenance-free fan module.
For example, the GEnx provides up to 15 percent better specific fuel consumption than theengine it replaces—helping operators save whenever they fly. The GEnx is also designedto stay on wing 20 percent longer, while using 30 percent fewer parts, and keepingmaintenance costs in check.
Developments that can reduce weight, reduce aerodynamic drag or improve the operationof the aircraft offer all-round benefits. Regulatory compliance for emissions and noisehinders the quest for improved fuel efficiency, and is often most difficult for those engineshaving the highest pressure ratios (PR). Higher PRs increase the temperature of the air usedfor combustion in the engine, and exacerbate the NOx emissions challenge. Increasing anengine’s pressure ratio is one of the options engine manufacturers use to improve engineefficiency. Higher pressure ratios are likely to be a continuing trend in engine development,possibly requiring revolutionary NOx control techniques to maintain compliance with NOxcertification standards.

37
A further consideration is the need to balance not only emissions trade-offs, but theinevitable trade-off between emissions and noise performance from the engine and aircraft.
Aircraft developments
Fuel efficiency improvements are also available through improvements to the airframe.Most modern civil jet aircraft have low-mounted swept wings and are powered by two orfour turbofan engines mounted beneath the wings. Such subsonic aircraft are about 70percent more fuel efficient per passenger-km than 40 years ago. The majority of this gainhas been achieved through engine improvements and the remainder from airframe designimprovements. Relative to equivalent aircraft produced today, a 20 percent improvement in
fuel efficiency of individual aircraft types is projected by 2015 with a further 40–50
percent improvement by 2050 (IPCC, 2007; internet source 10).
The current aircraft configuration is highly evolved, but has scope for further improvement.Technological developments have to be demonstrated to offer proven benefits before theywill be adopted in the aviation industry, and this, coupled with the overriding safetyrequirements and a product lifetime that has 60 percent of aircraft in service at 30 years age,results in slower change than might be seen in other transport forms.
For the near term, lightweight composite materials for the majority of the aircraft structureare beginning to appear and promise significant weight reductions and fuel burn benefits.The use of composites, for example in the Boeing 787 aircraft (that has yet to enter service),could reduce fuel consumption by 20 percent below that of the aircraft the B787 willreplace. Other developments, such as the use of winglets, the use of fuselage airflowcontrol devices, and weight reductions, have been studied by aircraft manufacturers andcan reduce fuel consumption by around seven percent. But these can have limited practical
applicability – for example, the additional fuel burn imposed by the weight of winglets
can negate any fuel efficiency advantage for short haul operations.
Longer term, some studies suggest that a new aircraft configuration might be necessary torealize a step change in aircraft fuel efficiency. Alternative aircraft concepts such asblended wing bodies or high aspect ratio/low sweep configuration aircraft designs mightaccomplish major fuel savings for some operations. The blended wing body (flying wing)is not a new concept and in theory holds the prospect of significant fuel burn reductions;estimates suggest 20–30 percent reductions compared with an equivalent sizedconventional aircraft carrying the same payload. The benefits of this tailless design resultfrom the minimised skin friction drag, as the tail surfaces and some engine/fuselageintegration can be eliminated. Its development for the future will depend on a viablemarket case and will incur significant design, development and production costs.
Laminar flow technology (reduced airframe drag through control of the boundary layer) islikely to provide additional aerodynamic efficiency potential for the airframe, especiallyfor long-range aircraft. This technology extends the smooth boundary layer of undisturbed

38
airflow over more of the aerodynamic structure, in some cases requiring artificial means topromote laminar flow beyond its natural extent by suction of the disturbed flow through theaerodynamic surface. Such systems have been the subject of research work in recent times,but are still far from a flight-worthy application. Long-term technical and economicviability have yet to be proven, despite studies suggesting that fuel burn could be reducedby between 10 and 20 percent for suitable missions.
In 2001 the Greener by Design (GbD) technology subgroup of the Royal AeronauticalSociety considered a range of possible future technologies for the long-term developmentof the aviation industry and their possible environmental benefits. It offered a view of thefuel burn reduction benefits that some advanced concepts might offer. Concepts consideredincluded alternative aircraft configurations, such as the blended wing body and the laminarflying wing, and the use of an un-ducted fan (open rotor) power plant. The study concludedthat these two aircraft concepts could offer significant fuel burn reduction potentialcompared with a conventional aircraft design carrying an equivalent payload. Other studies(Leifsson and Mason, 2005) have suggested similar results.
In summary, airframe and engine technology developments, weight reduction throughincreased used of advanced structural composites, and drag reduction, particularly throughthe application of laminar flow control, hold the promise of further aviation fuel burnreductions over the long term. Such developments will only be accepted by the aviationindustry should they offer an advantage over existing products and meet demanding safetyand reliability criteria.
Recently some new airplane models from Boeing and Airbus made progress on efficiency.The Boeing 787 uses lightweight composites for 50 percent of the aircraft’s body. It isestimated that aircraft entering service today are 70 percent more fuel efficient than the jetsof the 1960s, and engine technology is largely responsible for the savings. The 787 will usenext-generation engines developed by General Electric and Rolls Royce, meaning theDreamliner will produce 20 percent fewer emissions and consume 20 percent less fuel thanother comparably sized aircraft.
The manufacturing process that happens before an aircraft even leaves the ground is animportant part of its overall efficiency, and the 787’s assembly line is employing someinnovative techniques. For example, the use of larger component sections for the airframespeeds production and requires 80 percent fewer fasteners than before. As a result of thislower requirement, just 10,000 holes need to be drilled, compared to a million for a 747jumbo jet. Fewer parts and more efficient designs also mean 30 percent less maintenance isrequired once the aircraft enters service. And because it is costly and inefficient to fly half-full planes or to use long-range jets for short trips, Boeing will produce three uniqueversions of the Dreamliner that will be optimized for different passenger loads anddistances.

39
Alternative fuels for aviation
Kerosene is the primary fuel for civil aviation, but alternative fuels have been examined. Apotential non-carbon fuel is hydrogen and there have been several studies on its use inaviation. An EU study (Airbus, 2004) developed a conceptual basis for applicability, safety,and the full environmental compatibility for a transition from kerosene to hydrogen foraviation. The study concluded that conventional aircraft designs could be modified toaccommodate the larger tank sizes necessary for hydrogen fuels. However, the increaseddrag due to the increased fuselage volume would increase the energy consumption of theaircraft by between nine percent and fourteen percent. The weight of the aircraft structuremight increase by around 23 percent as a result, and the maximum take-off weight would
vary between +4.4 percent to –14.8 percent dependent on aircraft size, configuration and
mission. The hydrogen production process would produce CO2 unless renewable energywas used and the lack of hydrogen production and delivery infrastructure would be a majorobstacle.
The primary environmental benefit from the use of hydrogen fuel would be the preventionof CO2 emissions during aircraft operation. But hydrogen fuelled aircraft would producearound 2.6 times more water vapour than the use of kerosene and water vapour is a GHG.
The earliest implementation of this technology was suggested as between 15–20 years,
provided that research work was pursued at an appropriate level. The operating cost ofhydrogen-powered aircraft remains unattractive under today’s economic conditions.
The introduction of biofuels could mitigate some of aviation’s carbon emissions, if biofuelscan be developed to meet the demanding specifications of the aviation industry, althoughboth the costs of such fuels and the emissions from their production process are uncertainat this time.
Continental Airlines successfully flew a Boeing 737 with a 50-50 mix of regular fuel andan organic biofuel. Prior to that, a similar test saw Virgin Atlantic send a jet from Londonto Amsterdam with one of its fuel tanks filled entirely with organic, oil-based fuel.Additionally, two other airlines, Air New Zealand and Japan Airlines, have recently runbiofuel test flights (internet source 11).
Although these test flights were all relatively short in duration, they proved a largepassenger plane could run efficiently with alternative fuel options. This is a big stepconsidering most of the usual biofuels, like ethanol, are not viable for airplane flight. So,researchers had to come up with other biofuel types.
An Airbus A380 aircraft has successfully completed the world’s first ever flight by acommercial aircraft using a liquid fuel processed from gas (Gas to Liquids - GTL) in thefirst stage of a test flight programme to evaluate the environmental impact of alternativefuels in the airline market.
The limitations of biofuel should also be taken into account though. First, biofuel cancompete with food corpland; second, the life cycle emissions analysis is uncertain and

40
varied depending on biofuel sources; and third, it will be a long time until biofuel can becommercially used in airplanes.
Aviation potential practices
The operational system for aviation is principally governed by air traffic management(ATM) constraints. If aircraft were to operate for minimum fuel use (and CO2 emissions),the following constraints would be modified: taxi-time would be minimized; aircraft wouldfly at their optimum cruising altitude (for load and mission distance); aircraft would flyminimum distance between departure and destination (i.e., great circle distances) butmodified to take account of prevailing winds; no holding/ stacking would be applied.
Another type of operational system/mitigation potential is to consider the total climateimpact of aviation. Such studies are in their infancy but were the subject of a major
European project ‘TRADE-OFF’. In this project different methods were devised to
minimize the total radiative forcing impact of aviation; in practice this implies varying thecruise altitudes as O3 formation, contrails (and presumably cirrus cloud enhancement) areall sensitive to this parameter. For example, Fichter et al. (2005) found in a parametricstudy that contrail coverage could be reduced by approximately 45 percent by flying theglobal fleet 6,000 feet lower, but at a fuel penalty of six percent compared with a base case.Williams et al. (2003) also found that regional contrail coverage was reduced by flyinglower with a penalty on fuel usage. By flying lower, NOx emissions tend to increase also,but the removal rate of NOx is more efficient at lower altitudes: this, compounded with alower radiative efficiency of O3 at lower altitudes meant that flying lower could also implylower O3 forcing (Grewe et al., 2002). Impacts on cirrus cloud enhancement cannotcurrently be modeled in the same way, since current estimates of aviation effects on cirrusare rudimentary and based upon statistical analyses of air traffic and satellite data of cloudcoverage (Stordal et al., 2005) rather than on modeling. However, as Fichter et al. (2005)note, to a first order, one might expect aviation-induced cirrus cloud to scale with contrails.
The overall‘trade-offs’ are complex to analyse since CO2 forcing is long lasting, being
an integral over time.
Moreover, the uncertainties on some aviation forcings (notably contrail and cirrus) are stillhigh, such that the overall radiative forcing consequences of changing cruise altitudes needto be considered as a time-integrated scenario, which has not yet been done. However, ifcontrails prove to be worth avoiding, then such drastic action of reducing all aircraftcruising altitudes need not be done, as pointed out by Mannstein et al. (2005), since
contrails can be easily avoided– in principle– by relatively small changes in flight level,
due to the shallowness of ice supersaturation layers. However, this more finely tunedoperational change would not necessarily apply to O3 formation as the magnitude is acontinuous process rather than the case of contrails that are either short-lived or persistent.Further intensive research of the impacts is required to determine whether such operationalmeasures can be environmentally beneficial.

41
2.3 Shipping: energy saving ships
The vast majority of marine propulsion and auxiliary plants onboard ocean-going ships arediesel engines. In terms of the maximum installed engine output of all civilian ships above100 gross tonnes (GT), 96 percent of this energy is produced by diesel power. Theseengines typically have service lives of 30 years or more. It will therefore be a long timebefore technical measures can be implemented in the fleet on any significant scale. Thisimplies that operational emission abatement measures on existing ships, such as speedreduction, load optimization, maintenance, fleet planning, etc., should play an importantrole if policy is to be effective before 2020(IPCC, 2007; internet source 12).
Short-term potential of operational measures at 1–40 percent. These CO2 reductions could
in particular be achieved by fleet optimization and routing and speed reduction. A generalquantification of the potential is uncertain, because ship utilization varies across differentsegments of shipping and the operational aspects of shipping are not well defined.
The long-term reduction potential, assuming implementation of technical or operationalmeasures, was estimated for the major fuel consuming segments of the world fleet asspecific case studies. The result of this analysis was that the estimated
CO2 emission reduction potential of the world fleet would be 17.6 percent in 2010 and28.2 percent in 2020. Even though this potential is significant, it was noted that this wouldnot be sufficient to compensate for the effects of projected fleet growth. Speed reductionwas found to offer the greatest potential for reduction, followed by implementation of newand improved technology. Speed reduction is probably only economically feasible if policyincentives, such as CO2 trading or emissions charges, are introduced.
Diesel engines are the principle source of power in the vast majority of the world’s ships.In the optimum operating range, fuel efficiency is considerably higher and pollution lowerthan at low speeds. Therefore, the solution is to keep engines operating in this optimumrange in all situations. With traditional mechanical transmission this is not possible, asengine speed is rigidly coupled to propeller speed. Using electric transmission (generatorsand motors connected by cables), this is no longer the case. Additionally, power reservescan be shared with the vessel’s on-board service supply, which decreases the total powerinstalled while raising reliability. Furthermore, cables are more flexible than shafts andpermit greater freedom in the location of the engines. This can increase the vessel’spayload or permit more efficient loading and unloading. All these advantages translate intogreater productivity and savings for the owner.
When diesel engines are operating at constant and optimum service speed, fuelconsumption is lower than running the same engines at variable speed. In addition, with a“geared” propulsion system, which involves the slowing down and changing from two-engine mode to single engine mode, the propeller speed and pitch has to be controlled toavoid overloading the diesel engines. This need for control lowers the efficiency of thepropeller, which must be compensated by additional installed power.

42
In a diesel-electric power plant, the propulsion motor is capable of providing the requiredtorque at all times, over the entire speed range, even through zero speed and into reverse. Itis therefore ideally suited for driving a fixed pitch propeller. This contributes to systemefficiency: when the vessel speed is low, a controllable pitch propeller consumes energyjust to maintain its rotation.
The machinery on ocean-going container ships consists of a low-speed main enginedirectly connected to a fixed pitch propeller. As the ship speed is relatively high, therequired propulsion power becomes very high for the larger vessels, and the biggest 2-stroke engines (80 MW) on the market are used in container vessels. Particular attentionhas to be paid to the design of the propeller blades to ensure good cavitation performanceand high efficiency
The high power levels in propulsion make the possibility of utilizing waste heat from themain engine exhaust gas very attractive. The energy in the exhaust can be recovered withpower turbines and heat economisers producing steam for steam turbines.
Another contribution to fuel efficiency is provided by Counter-Rotating Propellers (CRP).These improve the hydrodynamic properties of the propulsion system, further reducing fuelconsumption.
A significant shift from a primarily diesel-only fleet to a fleet that uses alternative fuels andenergy sources cannot be expected until 2020, as most of the promising alternativetechniques are not yet tested to an extent that they can compete with diesel engines (Eyringet al., 2005b). Furthermore, the availability of alternative fuels is currently limited, andtime is needed to establish the infrastructure for alternative fuels. Besides biofuels, thereare also tests with LNG, wind engines and solar powered engines.
In the short term switching to alternative fuels provides a limited potential in general, but asignificant potential for segments where a switch from diesel to natural gas is possible(Skjølsvik, 2005). Switching from diesel to natural gas has a 20 percent CO2 reductionpotential and is being pursued as a measure in Norway for inland ferries and offshoresupply vessels operating on the Norwegian Continental Shelf. The main obstacle to theincreased utilization of natural gas is the access to LNG and the technology’s level of costscompared to traditional ship solutions based on traditional fuel (Skjølsvik, 2005). A co-benefit of a switch from diesel to natural gas is that it also reduces emissions of SOx andNOx, which both contribute to local air pollution in the vicinity of ports.
For the long-term (2050), the economic CO2 reduction potential might be large. Onepotential option is a combination of solar panels and sails. The use of large sails for supertankers is currently being tested in Germany and looks promising, and may even be a cost-effective measure in the short term in case oil prices continue to soar. The use of large sailsdoes not require fleet turnover but can be added to existing vessels (retrofit). Theintroduction of hydrogen-propelled ships and the use of fuel cell power at least for theauxiliary engines seem to be a possibility as well. For larger vessels capable and reliablefuel-cell-based ship propulsion systems are still a long way into the future, but might be

43
possible in 2050 (Eyring et al., 2005b). Altmann et al. (2004) concluded that fuel cellsoffer the potential for significant environmental improvements both in air quality andclimate protection. Local pollutant emissions
and GHG emissions can be eliminated almost entirely over the full life cycle usingrenewable primary energies. The direct use of natural gas in high temperature fuel cellsemployed in large ships, and the use of natural gas derived hydrogen in fuel cells
installed in small ships, allows for a GHG emission reduction of 20–40 percent.
Areas of engagement are for example:
Designing environmentally sustainable ships Hull optimisation Alternative propulsion methods Energy saving devices Trim optimisation Ballast water treatment systems Cost-benefit analysis of operating the ship
Container vessels are usually equipped to carry a certain number of reefer containers,which are then the biggest electric power consumers on the ship. Auxiliary engineconfiguration is typically three or four generating sets, depending on the electrical load andnumber of reefer plugs.
Container vessels have a demanding steel structure to ensure sufficient longitudinalstrength, with the shallow depth of the hull and the wide openings on deck (hatch covers).It is important to keep the steel weight down so as to minimize propulsion powerrequirements. Extensive use should be made of high tensile steel, and aluminium can alsobe utilized in deck house structures to keep the weight down.(internet source 13)

44
CHAPTER 3: Key mitigation technologies/goodssubject to R&D but with strong prospects of near tomedium term deployment in developing countries
Introduction
Some emerging transport technology could be expected to have strong prospects inmedium term deployment, notably in a period of 5 to 10 years from now. In general, thetechnologies described below have not been demonstrated on a commercial scale. Fuel cellvehicles or hydrogen vehicles could be considered the most important technology for thetransport sector in the medium term. In related long-term GHG mitigation studies, fuel cellvehicles or hydrogen vehicles are identified as a key component of transport to reachgoblal climate change targets (IEA, 2009; Jiang et al., 2009)
Hydrogen/Fuel Cell Vehicles (FCVs)
A hydrogen vehicle is a vehicle that uses hydrogen as its on-board fuel for motive power.The term may refer to a personal transportation vehicle, such as an automobile, or anyother vehicle that uses hydrogen in a similar fashion, such as an aircraft. The power plantsof such vehicles convert the chemical energy of hydrogen to mechanical energy (torque) inone of two methods: combustion, or electrochemical conversion in a fuel-cell:
In hydrogen internal combustion engine vehicles, the hydrogen is combusted inengines in fundamentally the same method as traditional internal combustionengine vehicles.
In fuel-cell conversion, the hydrogen is reacted with oxygen to produce water andelectricity, the latter being used to power an electric traction motor.
During the last decade, fuel cell vehicles (FCVs) have attracted growing attention andhave made significant technological progress. Drivers for development of FCVs are globalwarming (FCVs fuelled by hydrogen have zero CO2 emission and high efficiency), airquality (zero tailpipe emissions), and energy security (hydrogen will be produced from awide range of sources), and the potential to provide new desirable customer attributes (lownoise, new designs)(IPCC, 2007).
There are several types of FCVs; direct-drive and hybrid power train architecturesfuelled by pure hydrogen, methanol and hydrocarbons (gasoline, naphtha). FCVs with

45
liquid fuels have advantages in terms of fuel storage and infrastructure, but they need on-
board fuel reformers (fuel processors), which leads to lower vehicle efficiency (30–50%
loss), longer start-up time, slower response and higher cost. Because of these disadvantagesand rapid progress on direct hydrogen systems, nearly all auto manufacturers are nowfocused on the pure hydrogen FCV (IPCC, 2007).
Hydrogen engine
Hydrogen engines come in two varieties, electric engines powered directly by hydrogenfuel cells and those engines that are converted from traditional gasoline poweredcombustion engines and powered by compressed hydrogen. The natural transitional vehicle,on a consumer level, most likely will be to have a car that has a hydrogen engine that hasbeen converted from a gasoline powered engine and is fueled by pressurized hydrogen.Hydrogen-fueled internal combustion engines (H2 ICEs) as they are called will most likelyhit the consumer market first (internet source 14; internet source 15).
This "transitional" hydrogen H2 ICE engine is already taking hold as both Mazda andBMW have introduced into limited production "dual-fuel" engines. With the flip of aswitch, each car can switch back and forth between gasoline and hydrogen fuel. The MazdaRX-8 uses a RENESIS Hydrogen Rotary Engine, which is ideally suited to burn hydrogenwithout inviting the backfiring that can occur when hydrogen is burned in a traditionalpiston engine. Twin hydrogen injectors and a separate induction chamber help maintainsafer temperatures with the hot running hydrogen fuel.
Hydrogen fuel cells
Hydrogen fuel cells are what will power the 'Hydrogen Highway' of the future. Hydrogenfuel cells are electrochemical engines that come in several different varieties with the mostcommon being the Proton Exchange Membrane (PEM) fuel cells, also called PolymerElectrolyte Membrane fuel cells. PEM fuel cells use oxygen from the air and pressurizedhydrogen to create electricity, heat and water (steam) as byproducts (figure 7).

46
Figure 7 different parts of a PEM fuel cell used to power hydrogen cars (internet source 16)
Most hydrogen fuel cells do not produce enough voltage to power a car so fuel cells aretypically arranged in "stacks." Because of recent engineering advances, a hydrogen fuelcell about the size of a small piece of luggage can power a car.
The difference between hydrogen fuel cells and typical batteries is that batteries eventuallygo dead. The hydrogen fuel cell keeps going as long as hydrogen and oxygen areintroduced to the cell, producing electricity continuously.
The hydrogen car's electric induction motor/transaxle and electric power inverter will usethe electricity generated from the PEM fuel cells to produce up to 90 kilowatts of power.The inverter turns the direct current (DC) into alternating current (AC) which can thenpower the electric motor that turns the wheels of the car. Most likely, other features of thecar like air conditioning and electrical system will still be powered by a traditional carbattery.
Hydrogen storage tanks are an issue for H2 cars. Unlike gasoline tanks, hydrogen storagetanks need to be pressurized, perhaps cooled and contained with special materials.

47
Hydrogen storage tanks come in three popular kinds: compressed hydrogen, liquidhydrogen and metal hydride tanks. Figure 8 gives a picture of a hydrogen station.
Figure 8 hydrogen station
Fuel Cell Vehicles
FCVs look like conventional vehicles from the outside, but inside they containtechnologically advanced components not found in today's vehicles. The most obviousdifference is the fuel cell stack that converts hydrogen gas stored onboard with oxygenfrom the air into electricity to drive the electric motor that propels the vehicle. The majorcomponents of a typical FCV are illustrated below (internet source 17; internet source 18).

48
Figure 9 overview of the FCV
Figure 10 BMW’s hydrogen car
Recent significant technological progress has been made including: improved fuel celldurability, cold start (sub-freezing) operation, increased range of operation, anddramatically reduced costs (although FCV drive train costs remain at least an order ofmagnitude greater than internal combustion engine (ICE) drive train costs) (IPCC,2007).
Although the potential of FCVs for reducing GHG emissions is very high there arecurrently many barriers to be overcome before that potential can be realized in acommercial market. These are:
• To develop durable, safe, and environmentally desirable fuel cell systems and hydrogenstorage systems and reduce the cost of fuel cell and storage components to be competitivewith today’s ICEs;

49
• To develop the infrastructure to provide hydrogen for the light-duty vehicle user;
• To sharply reduce the costs of hydrogen production from renewable energy sources overa time frame of decades.
Or to capture and store (sequester) the carbon dioxide byproduct of hydrogen productionfrom fossil fuels.
The GHG impact of FCVs depends on the hydrogen production path and the technicalefficiency achieved by vehicles and H2 production technology. At the present technologylevel with FCV tank-to-wheel efficiency of about 50 percent and where hydrogen can beproduced from natural gas at 60 percent efficiency, well-to-wheel (WTW) CO2 emissions
can be reduced by 50– 60 percent compared to current conventional gasoline vehicles. In
the future, those efficiencies will increase and the potential of WTW CO2 reduction can beincreased to nearly 70 percent. If hydrogen is derived from water by electrolysis usingelectricity produced using renewable energy such as solar and wind, or nuclear energy, theentire system from fuel production to end-use in the vehicle has the potential to be a truly‘zero emissions’. The same is almost true for hydrogen derived from fossil sources whereas much as 90 percent of the CO2 produced during hydrogen manufacture is captured andstored.
FCV costs are expected to be much higher than conventional ICE vehicles, at least in theyears immediately following their introduction and H2 costs may exceed gasoline costs.Costs for both the vehicles and fuel will almost certainly fall over time with larger-scaleproduction and the effects of learning, but the long-term costs are highly uncertain. Figure5.11 shows both well-to-wheels emissions estimates for several FCV pathways and theircompeting conventional pathways, as well as cost estimates for some of the hydrogenpathways.
Although fuel cells have been the primary focus of research on potential hydrogen use inthe transport sector, some automakers envision hydrogen ICEs as a useful bridgetechnology for introducing hydrogen into the sector and have built prototype vehicles usinghydrogen. Mazda has started to lease bi-fuel (hydrogen or gasoline) vehicles using rotaryengines and BMW has also converted a 7-series sedan to bi-fuel operation using liquefiedhydrogen (Kiesgen et al., 2006). Available research implies that a direct injectedturbocharged hydrogen engine could potentially achieve efficiency greater than a directinjection (DI) diesel, although research and development challenges remain, includingadvanced sealing technology to insure against leakage with high pressureinjection(IPCC,2007).

50
Appendix A Abbreviations and acronyms
ABS
AEV
Antilock Braking System
All Electric Vehicle
AFDC Alternative Fuels and Advanced Vehicles Data Center (US Department of Energy).
AFV Alternative fuel vehicle
AHSS Advanced high-strength steels
ASR
BAT
Automobile shredder residue
Best available technology
BEV Battery electric vehicle
BTL Biomass-to-liquids (fuels)
CAFE 1. Corporate Average Fuel Economy
CD Coefficient of drag
CEC California Energy Commission
CFD Computational Fluid Dynamic
CH4 Methane
CNG Compressed natural gas
CORBEV Continuously outboard recharged battery electric vehicle
CO2 Carbon dioxide
CP Complex process
CRP Counter-Rotating Propellers
DME Di-methyl esters
DP Dual Phase
EJ Exa joule
EPA Environmental Protection Agency (United States)
ERI Energy Research Institute, National Development and Reform Commission, China
ESP Electronic Stabilization Programme
EU European Union
FCV Fuel Cell Vehicles
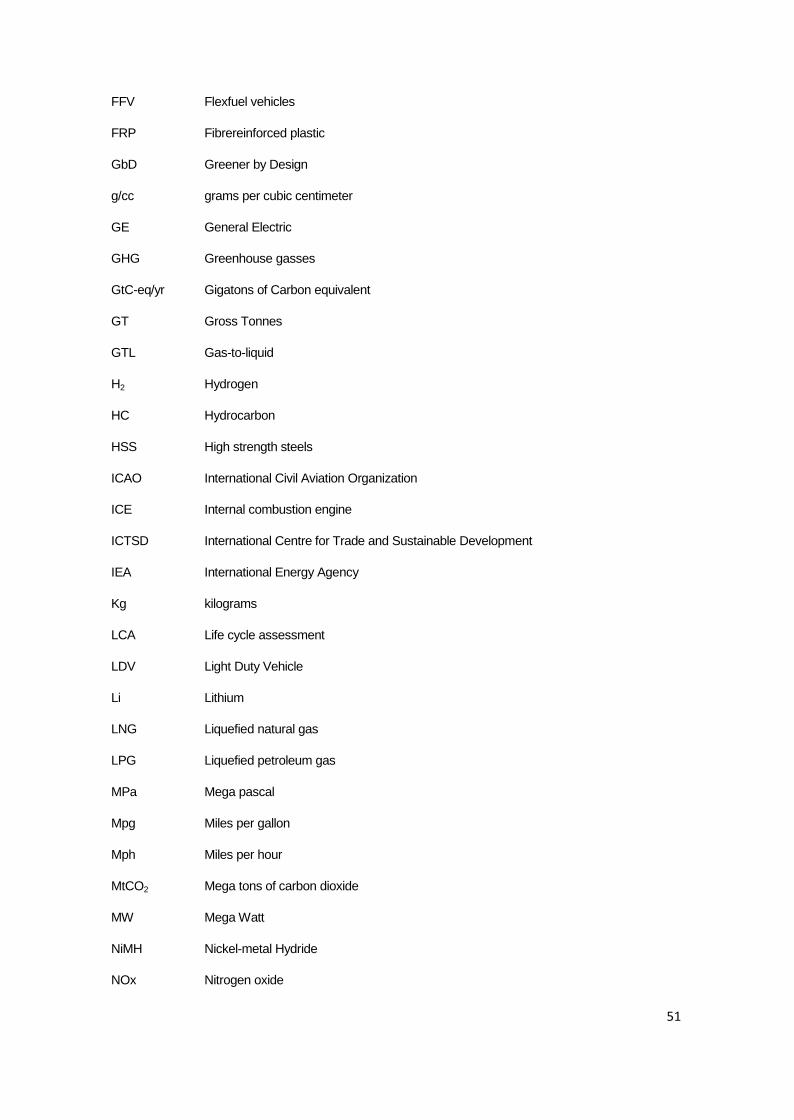
51
FFV Flexfuel vehicles
FRP Fibrereinforced plastic
GbD Greener by Design
g/cc grams per cubic centimeter
GE General Electric
GHG Greenhouse gasses
GtC-eq/yr Gigatons of Carbon equivalent
GT Gross Tonnes
GTL Gas-to-liquid
H2 Hydrogen
HC Hydrocarbon
HSS High strength steels
ICAO International Civil Aviation Organization
ICE Internal combustion engine
ICTSD International Centre for Trade and Sustainable Development
IEA International Energy Agency
Kg kilograms
LCA Life cycle assessment
LDV Light Duty Vehicle
Li Lithium
LNG Liquefied natural gas
LPG Liquefied petroleum gas
MPa Mega pascal
Mpg Miles per gallon
Mph Miles per hour
MtCO2 Mega tons of carbon dioxide
MW Mega Watt
NiMH Nickel-metal Hydride
NOx Nitrogen oxide

52
PEV Plug-in-electric-vehicle
PHEV Plug-in hybrid electric vehicle
RTM Resin transfer method
SOx Sulfur oxide
tC/TJ Tons of carbon per Tera-Joule
TRIP Transformation-induced plasticity
TRIPs Trade-related Aspects of Intellectual Property Rights
ULSAB-AVC Ultra Light Steel Auto Body – Advanced Vehicle Concept
WBCSD World Business Council for Sustainable Development
Wh kg-1 Watt-hours per kilogram

53
Appendix B Transport Sector Goods with a Short Technical Description
Table 1: Climate Mitigation Goods Available on a Commercial Basis
ROAD TRANSPORT
Technology/
Function
Technology sub-category andGoods (With TechnicalDescription)
HS-Code/Ex-out
(To be providedby trade expert)
Reducing VehicleLoads
Lightweight Materials
Vehicles switching to highstrength steels : includingrelatively low strength grade(around 400 MPa) such assolution-hardened andprecipitation-hardened HSS tovery high strength grade (980–1400 MPa) such as TRIP steeland tempered martensitic HSS,which has the potential ofweight reduction by 19% to32%
Vehicles with replacing steelby lighter materials: includingaluminum, magnesium andplastic, which has the potentialof weight reduction by 19% to21%.
Mobile Air-ConditioningSystems
Mobile Air-ConditioningSystems using new refrigerantssuch as HFC-152a or CO2
Internal combustion engines(ICE)
Advanced Direct Injection(DI)Gasoline / Diesel Engines andTransmissions.
Direct injection diesel engines,yielding about 35% greater fueleconomy than conventionalgasoline engines.
electronic control of the

54
injection pump in DI is the keycomponent. The injectiontiming, fuel quantity, EGR andturbo boost were allelectronically controlled
advanced 6 and 7 speedautomatics transmission system
continuously variabletransmissions (CVTs)
Hybrid-Drive Trains Hybrid Cars Mild Parallel hybrid: use a
generally compact electricmotor to give extra outputduring the acceleration, and togenerate on the decelerationphase
Powersplit hybrid, there aretwo electric motors and oneinternal combustion engine
Series Hybrid, uses an electricmotor(s), which is powered bya single-speed internalcombustion engine
Plug-in hybrid electricalvehicle (PHEV), is a generalfuel-electric (parallel or serial)hybrid with increased energystorage capacity (usually Li-ionbatteries).
870322/ex-out
Improving Drive-Train efficiency
Biofuels
Flexible fuel engine: the enginecould use fuel with ethanolmixed with gasoline fromrange 0% to 100%.
Natural Gas
Natural gas engine:
Alternative Fuels Hydrogen/Fuel Cells
hydrogen internal combustionengine, burn fuel in the samemanner that gasoline enginesdo.
Fuel cells, create electricity topower an electric motor usinghydrogen fuel and oxygen from
850680/ex-out

55
the air
Hydrogen storage by cryogenictank
Hydrogen storage bycompressed hydrogen storagetank
Electric Vehicles Nickel metal hydride (NiMH)
batteries lithium-ion iron phosphate
battery, uses LiFePO4 as acathode material
870390/ex-out
Lithium-Ion Batteries

56
RAIL TRANSPORT
Technology/Function
Technology sub-categoryand Goods (WithTechnical Description)
HS-Code/Ex-out
(To be provided bytrade expert)
ReducingAerodynamicResistance
Locomotives withshielding with anexterior cover, is provento cut the train’s air dragby about 10%
Locomotives withaerodynamicoptimisation ofpantograp
Reducing TrainWeight
Trains with component-based lightweight design
System-basedlightweight design
RegenerativeBraking
On-board energy storagein DC systems
Stationary energystorage
Batteries (storagetechnology)
SuperconductingMagnetic EnergyStorage (storagetechnology)
Higher EfficiencyPropulsionSystems
superconducting on-board transformers
permanent magnetsynchronous tractionmotors

57
AVIATION
Technology/Function Technology sub-category and Goods(With TechnicalDescription)
HS-Code/Ex-out
(To be provided by tradeexpert)
Engines geared turbofanengine, fan andturbine spinindependently, Thefan is larger and itspins at one-third thespeed of the turbine,creating a quieter,more powerful engine
TAPS combustor
high-pressure 10-stage compressor
AircraftDevelopments
lightweight compositematerials
Laminar flowtechnology, reducedairframe drag throughcontrol of theboundary layer
blended wing bodies

58
SHIPPING
Technology/Function Technology sub-category andGoods (With TechnicalDescription)
HS-Code/Ex-out
(To beprovided bytrade expert)
Engines “geared” propulsion system,changing from two-enginemode to single engine modewhen slowing down
electric transmission,generators and motorsconnected by cables
waste heat recoverytechnology, from the mainengine exhaust gas
Ship Design andHydrodynamics (Hulland Propeller)
Counter-Rotating Propellers(CRP)

59
Table 2: Climate Mitigation Goods Undergoing R&D with Strong Prospects forCommercialisation- Same format as Table 1
ROAD TRANSPORT
AVIATION
Technonolgy/
Function
Technology sub-category andGoods (With TechnicalDescription)
HS-Code/Ex-out
(To be providedby trade expert)
Hydrogen/Fuel Cells
hydrogen internal combustionengine, burn fuel in thesame manner that gasolineengines do.
Fuel cells, create electricity topower an electric motorusing hydrogen fuel andoxygen from the air
850680/ex-out
Hydrogen storage by cryogenictank
Hydrogen storage bycompressed hydrogen storagetank
Technology/Function
Technology sub-categoryand Goods (WithTechnical Description)
HS-Code/Ex-out
(To be provided bytrade expert)
Alternative Fuelsfor Aviation
Hydrogen engine
Hydrogen fuel cell
biofuels

60
SHIPPING
Technology/Function Technology sub-categoryand Goods (WithTechnical Description)
HS-Code/Ex-out
(To be provided by tradeexpert)
Alternative Fuels forShipping
natural gas
Biofuel utilization:Bio-diesel, ethanol
Solar PV

61
References
Airbus, 2004: Global Market Forecast 2004-2023.<http://www.airbus.com/store/mm_repository/pdf/att00003033/media_object_file_GMF2004_full_issue.pdf> accessed 30/05/07.
CEC, 2006:Tire and Fuel Efficiency, California Energy Commission(CEC), June 2006.
Chandler, K., E. Eberts, and L. Eudy, 2006: New York City Transit Hybrid and CNGBuses: Interim Evaluation Results. National Renewable Energy Laboratory TechnicalReport NREL/TP-540-38843.
EAA, 2001: Moving up to aluminium -The future of road transport. European AluminiumAssociation, Brussels, 19 pp.
ECMT, 2006: Reducing NOx Emissions on the Road; Ensuring Future Exhausts EmissionLimits Deliver Air Quality Standards, OECD, 50pp.
EIA (Energy Information Administration) 1994b: Energy use and carbon emissions:Some international comparison, DOE/EIA-0579. US Department of Energy,Energy Information Administration, Washington, DC
Emissions of Greenhouse Gases Report, Energy Information Administration,2006 http://www.eia.doe.gov/oiaf/1605/ggrpt/ last accessed on 4th Nov 2008
EPRI, 2001: Comparing the Benefits and Impacts of Hybrid Electric Vehicle Options.Report 1000349, Electric Power Research Institute, Palo Alto, CA, July 2001.
Eyring, V., H.W. Köhler, J. van Aardenne, and A. Lauer, 2005a: Emissions frominternational shipping: 1. The last 50 years. Journal of Geophysical Research, 110, D17305,doi: 10.1029/2004JD005619.

62
Eyring, V., H.W. Köhler, A. Lauer, and B. Lemper, 2005b: Emissions from internationalshipping: 2. Impact of future technologies on scenarios until 2050. Journal of GeophysicalResearch, 110, D17306, doi:10.1029/2004JD005620.
Foyt, G., 2005: Demonstration and Evaluation of Hybrid Diesel-Electric Transit Buses -Final Report. Connecticut Academy of Science and Engineering report CT-170-1884-F-05-10, Hartford, CT, 33 pp.
Intergovernmental Panel on Climate Change (IPCC), 2007a. Climate Change 2007: ThePhysical Science, Basis, Summary for Policymakers, IPCC WG1, Paris, February
Intergovernmental Panel on Climate Change (IPCC), 2007: Fourth Assessment Report:Mitigation, WGIII, Cambridge University Press, UK.
International Energy Agency (IEA), 2006a: World Energy Outlook, IEA/OECD, Paris
International Energy Agency (IEA), 2009: Technology Perspectives 2008, IEA publication,Paris.
International Energy Agency (IEA), 2006b: Energy Technology Perspectives –Scenarios and Strategies to 2050, IEA/OECD, Paris
HFC, 2006: JHFC Well-to-Wheel Efficiency Analysis Results. JARI, Tsukuba, 114 pp.Jiang Kejun, Liu Qiang, Zhuang Xing, Hu Xiulian(2009)Technology Roadmap for Low-Carbon Society in China, Renewable Energy Journal, Vol 28, No.11, 2009
Jochem, E. and R. Madlener, 2003: The forgotten benefits of climate changemitigation: Innovation, technological leapfrogging, employment, andsustainable development. In Workshop on the Benefits of Climate Policy: ImprovingInformation for Policy Makers.
Koyama, A., H. Iki, Y. Ikawa, M. Hirose, K. Tsurutani, and H. Hayashi, 2006: Proceedingsof the JSAE Annual Congress, #20065913.
63
Leifsson, L.T. and W.H. Mason, 2005: The Blended Wing Body Aircraft, VirginiaPolytechnic Institute and State University Blacksburg, VA,<http://www.aoe.vt.edu/research/groups/bwb/papers/TheBWBAircraft.pdf>
Nippon Steel, 2002: Advanced technology of Nippon Steel contributes to ULSAB-AVCProgram. Nippon Steel News, 295, September 2002.
Pacala, S. and Socolow, R., 2004: ‘Stabalization Wedges: Solving the ClimateProblem for the Next 50 years With Current Technology’, Science, vol. 305, p 968.
Philibert, Cédric, 2003, Technology innovation, development and diffusion. OECDand IEA Information, Paper, Paris
SAE International, 2003a: A powerful mix. Automotive Engineering International, 111(5),pp. 50-56.
SAE International, 2003b: A different automatic. Automotive Engineering International,111(7), pp. 32-36.
SAE International, 2004: Trucks get aerodynamic touch. Automotive EngineeringInternational, 112(7), pp. 67-69.
Skjølsvik, K.O., 2005: Natural gas used as ship fuel; Norway heads the development. InNavigare, February 2005, Oslo, Norway.
Stabilization Wedges: Mitigation Tools for the Next Half-Century , Presentation byRobert Socolow, Princeton University, at World Bank’s Energy Week, Washington,DC, March 6, 2006,
www.princeton.edu/~cmi/research/Integration/ Presentations/06%2003-06%, accessed June 2008
WBCSD, 2005: Mobility 2030: Meeting the challenges to sustainability, WBCSD report.

64
Website References:
1) http://www.autosteel.org/AM/Template.cfm?Section=Content_Recycle_Bin&CONTENTID=7093&TEMPLATE=/CM/ContentDisplay.cfm
2) http://www.worldautosteel.org/Environment/GHGEmissions/GHGReduction.aspx3) http://en.wikipedia.org/wiki/Internal_combustion_engine4) http://en.wikipedia.org/wiki/Diesel_engine5) http://en.wikipedia.org/wiki/Low-rolling_resistance_tires6) http://green.autoblog.com/2008/01/03/california-has-low-resistance-tire-laws/7) http://auto.howstuffworks.com/hybrid-car-pictures1.htm8) http://en.wikipedia.org/wiki/Hybrid_vehicle9) http://en.wikipedia.org/wiki/Internal_combustion_engine10) http://www.geae.com/engines/commercial/genx/11) http://airplanes.suite101.com/article.cfm/aviation_adopts_alternative_fuel12) http://www.wartsila.com/,en,solutions,0,generalcontent,988A8801-F5BE-4228-AE83-
2EB8ADA108F2,54C19742-1106-4925-A8ED-3B47E7F6FFED,,.htm13) http://www.wartsila.com/,en,solutions,0,generalcontent,988A8801-F5BE-4228-AE83-
2EB8ADA108F2,54C19742-1106-4925-A8ED-3B47E7F6FFED,,.htm14) http://www.hydrogencarsnow.com/hydrogen-engines.htm15) http://en.wikipedia.org/wiki/Hydrogen_vehicle16) http://en.wikipedia.org/wiki/Fuel_cell_vehicle17) http://www.fueleconomy.gov/feg/fuelcell.shtml18) http://ecotality.com/life/wp-content/uploads/2007/11/fuel-cell-car.jpg