mapping the evolution of science - indiana...
TRANSCRIPT
1
Mapping the Evolution of Science
Dr. Katy BörnerCyberinfrastructure for Network Science Center, DirectorInformation Visualization Laboratory, DirectorSchool of Library and Information ScienceIndiana University, Bloomington, [email protected]
Heraeus Seminar on the Evolution of Physics, Bad Honnef, GermanyJanuary 22, 2008
Börner: “Mapping the Evolution of Science”2
Overview
Concepts -> Conceptualization
Models -> Descriptive Models-> Process Models
CI Design -> IVC, NWB, SDB
Communication -> “Mapping Science” Exhibit
2
Börner: “Mapping the Evolution of Science”3
Overview
Concepts -> Conceptualization
Models -> Descriptive Models-> Process Models
CI Design -> IVC, NWB, SDB
Communication -> “Mapping Science” Exhibit
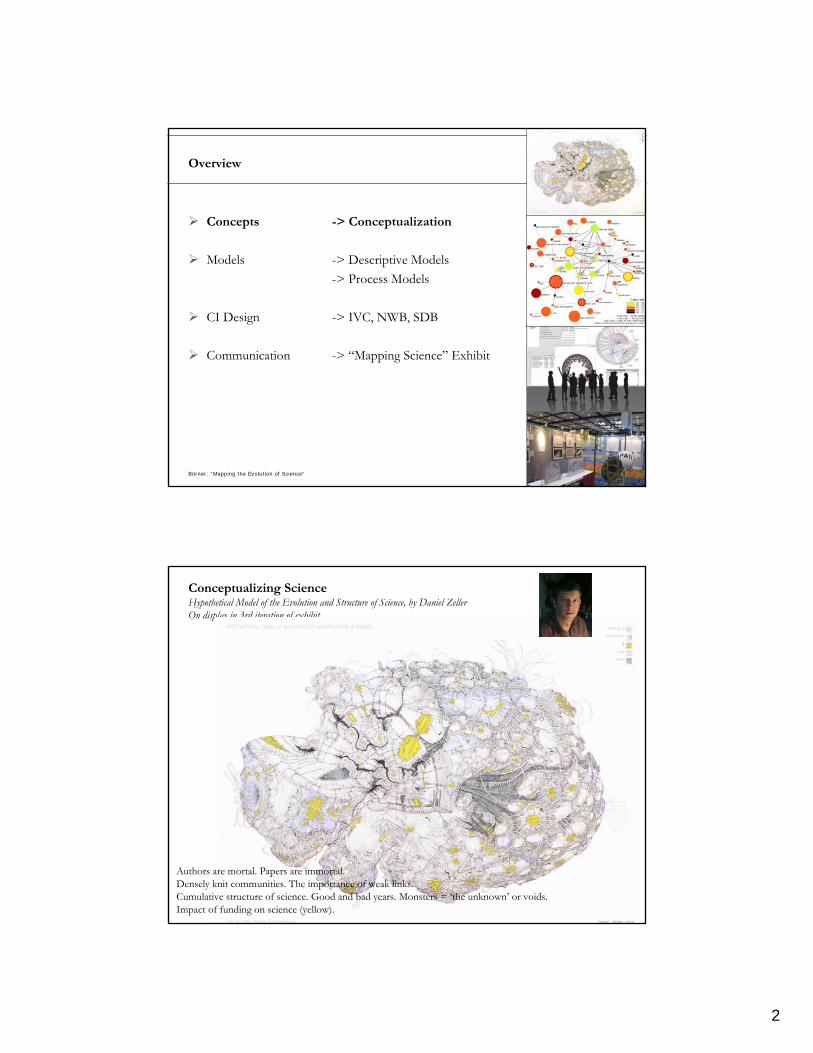
Conceptualizing ScienceHypothetical Model of the Evolution and Structure of Science, by Daniel ZellerOn display in 3rd iteration of exhibit.
Authors are mortal. Papers are immortal.Densely knit communities. The importance of weak links.Cumulative structure of science. Good and bad years. Monsters = ‘the unknown’ or voids. Impact of funding on science (yellow).
3
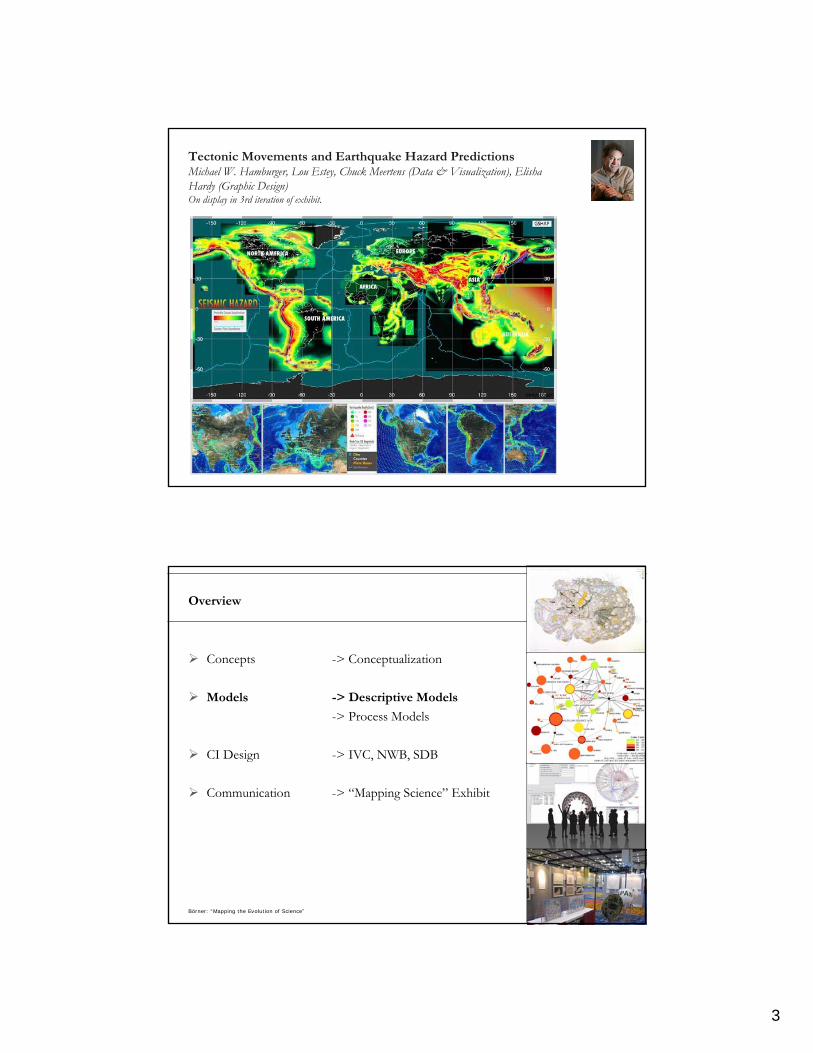
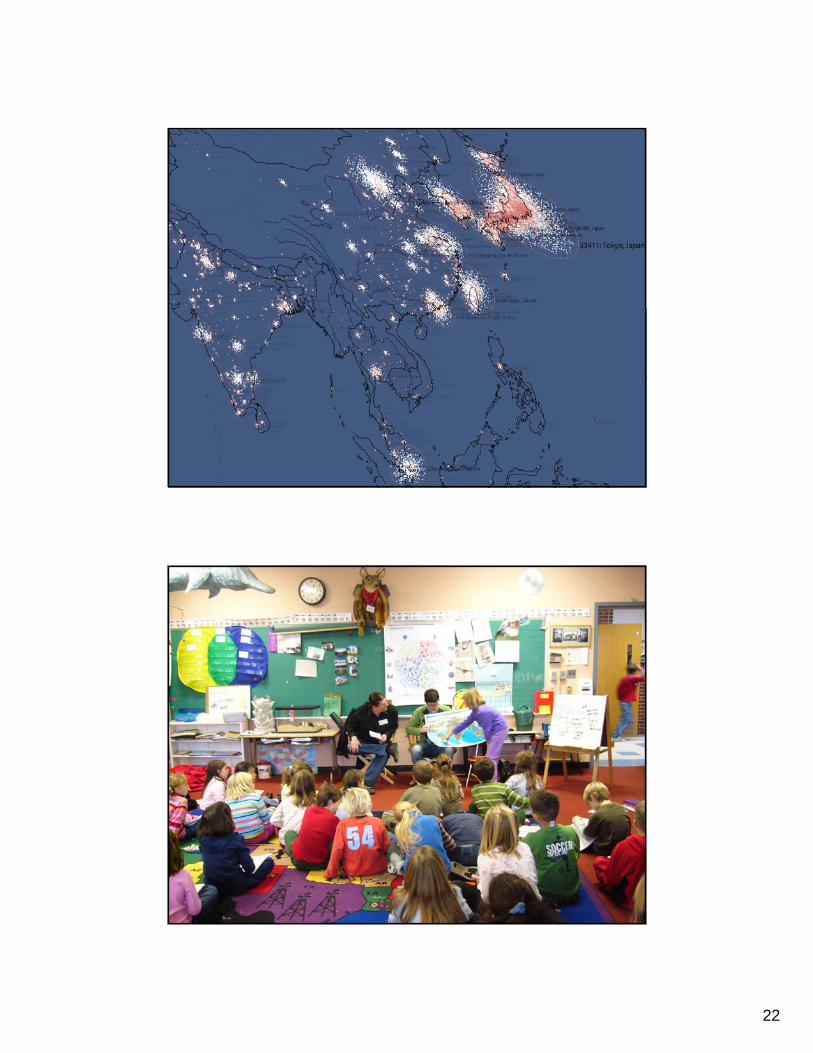
Tectonic Movements and Earthquake Hazard PredictionsMichael W. Hamburger, Lou Estey, Chuck Meertens (Data & Visualization), Elisha Hardy (Graphic Design)On display in 3rd iteration of exhibit.
Börner: “Mapping the Evolution of Science”6
Overview
Concepts -> Conceptualization
Models -> Descriptive Models
-> Process Models
CI Design -> IVC, NWB, SDB
Communication -> “Mapping Science” Exhibit
4
Börner: “Mapping the Evolution of Science”7
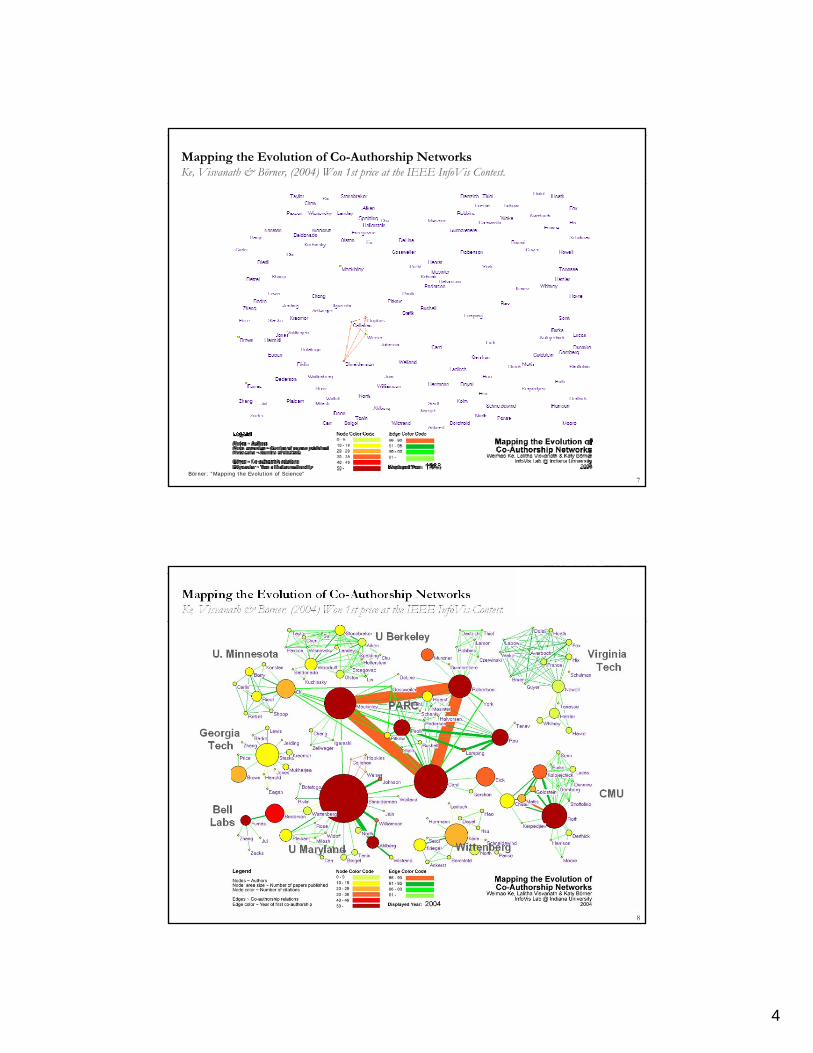
Mapping the Evolution of Co-Authorship Networks Ke, Visvanath & Börner, (2004) Won 1st price at the IEEE InfoVis Contest.
7
Börner: “Mapping the Evolution of Science”88
5
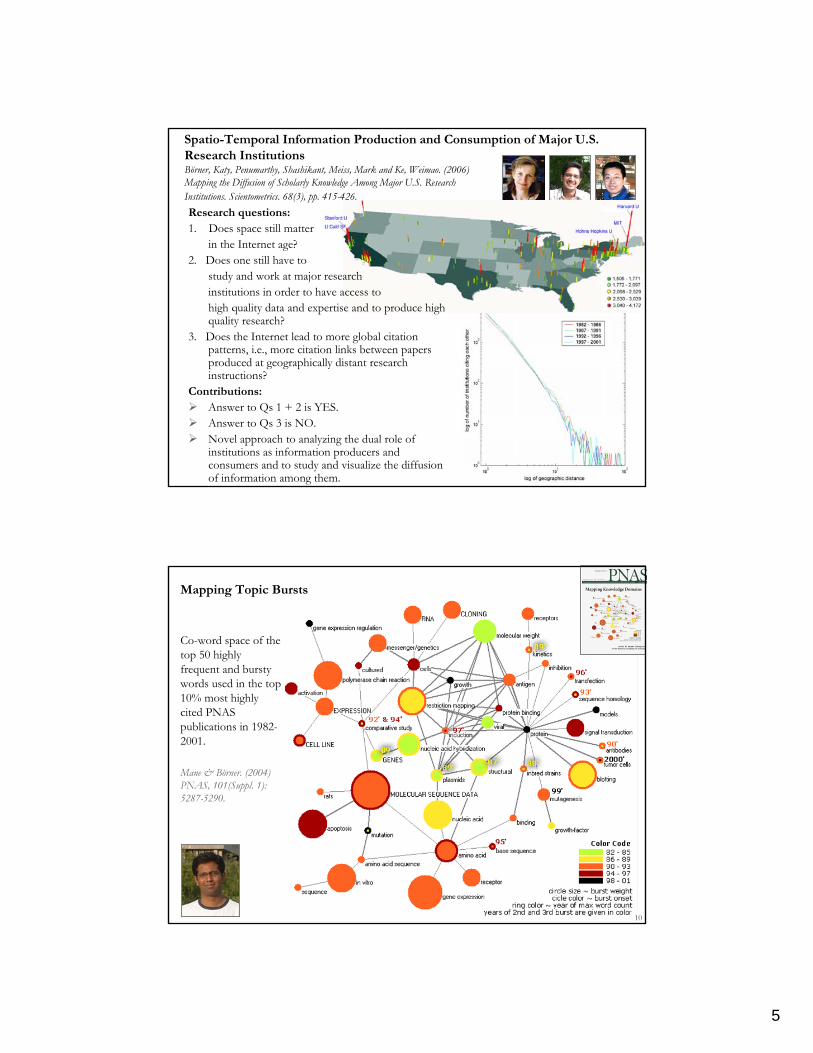
Spatio-Temporal Information Production and Consumption of Major U.S. Research InstitutionsBörner, Katy, Penumarthy, Shashikant, Meiss, Mark and Ke, Weimao. (2006) Mapping the Diffusion of Scholarly Knowledge Among Major U.S. Research Institutions. Scientometrics. 68(3), pp. 415-426.Research questions:1. Does space still matter
in the Internet age? 2. Does one still have to
study and work at major research institutions in order to have access to high quality data and expertise and to produce high quality research?
3. Does the Internet lead to more global citation patterns, i.e., more citation links between papers produced at geographically distant research instructions?
Contributions:Answer to Qs 1 + 2 is YES.Answer to Qs 3 is NO.Novel approach to analyzing the dual role of institutions as information producers and consumers and to study and visualize the diffusion of information among them.
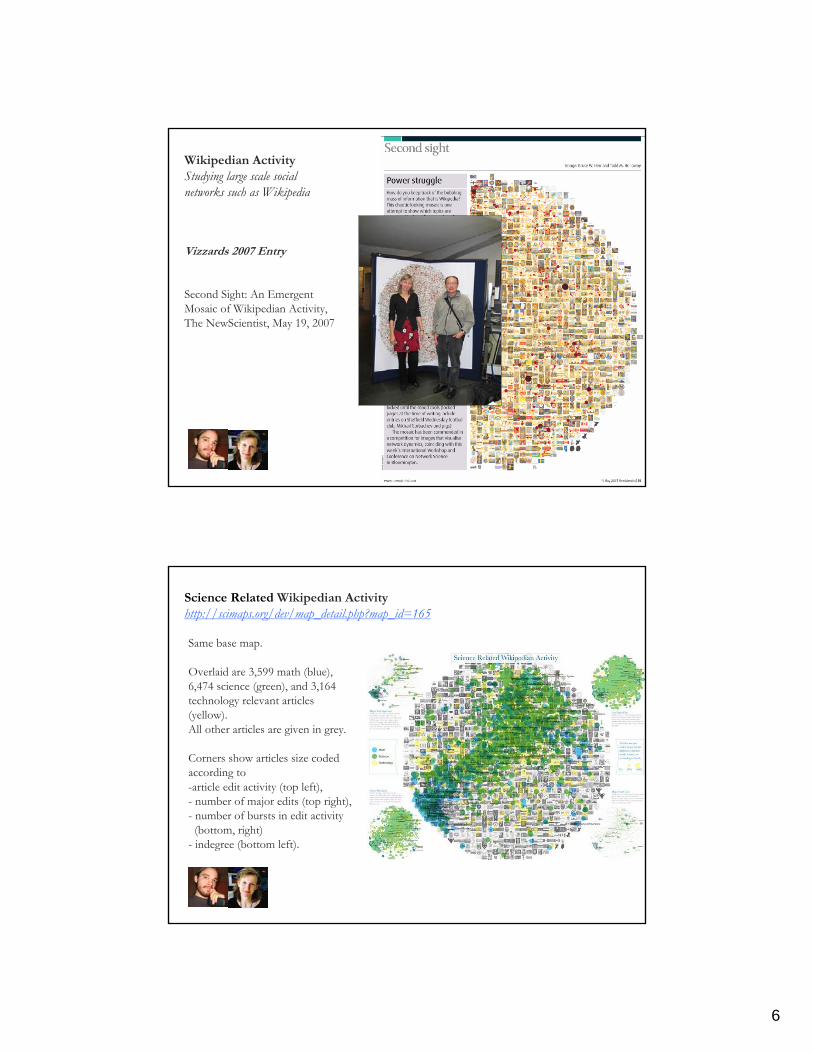
Co-word space of the top 50 highly frequent and burstywords used in the top 10% most highly cited PNAS publications in 1982-2001.
Mane & Börner. (2004) PNAS, 101(Suppl. 1):5287-5290.
Mapping Topic Bursts
10
6
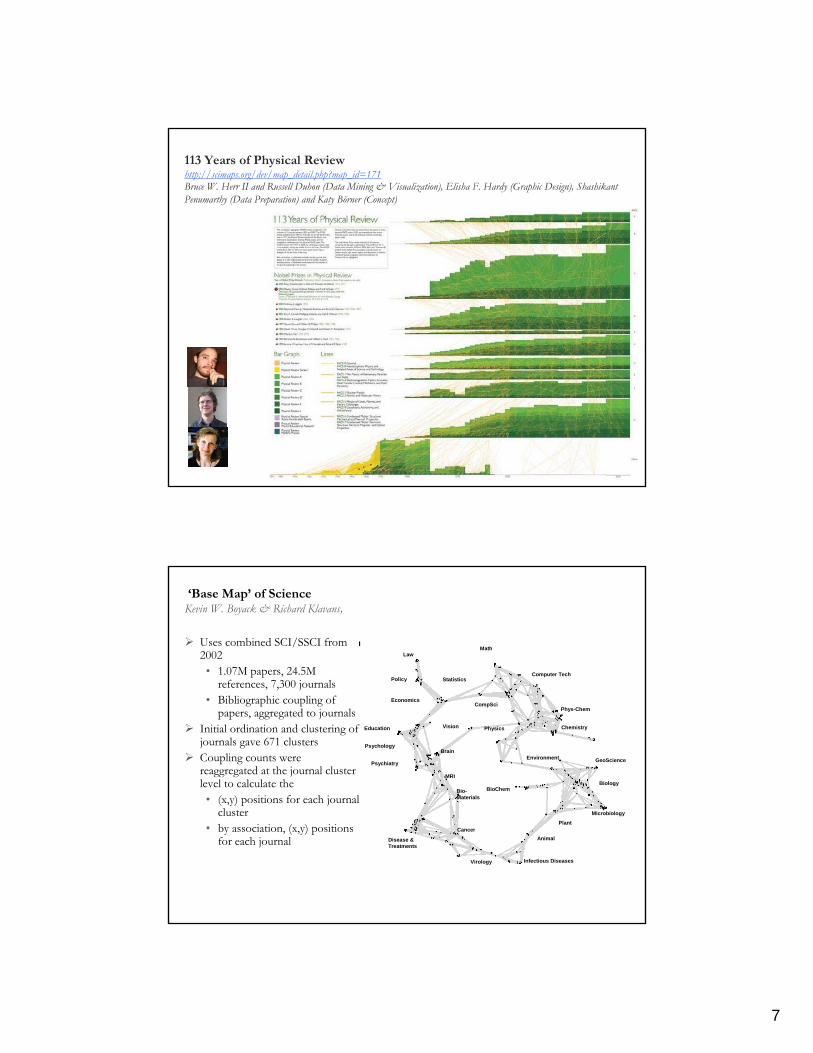
Wikipedian ActivityStudying large scale social networks such as Wikipedia
Vizzards 2007 Entry
Second Sight: An Emergent Mosaic of Wikipedian Activity, The NewScientist, May 19, 2007
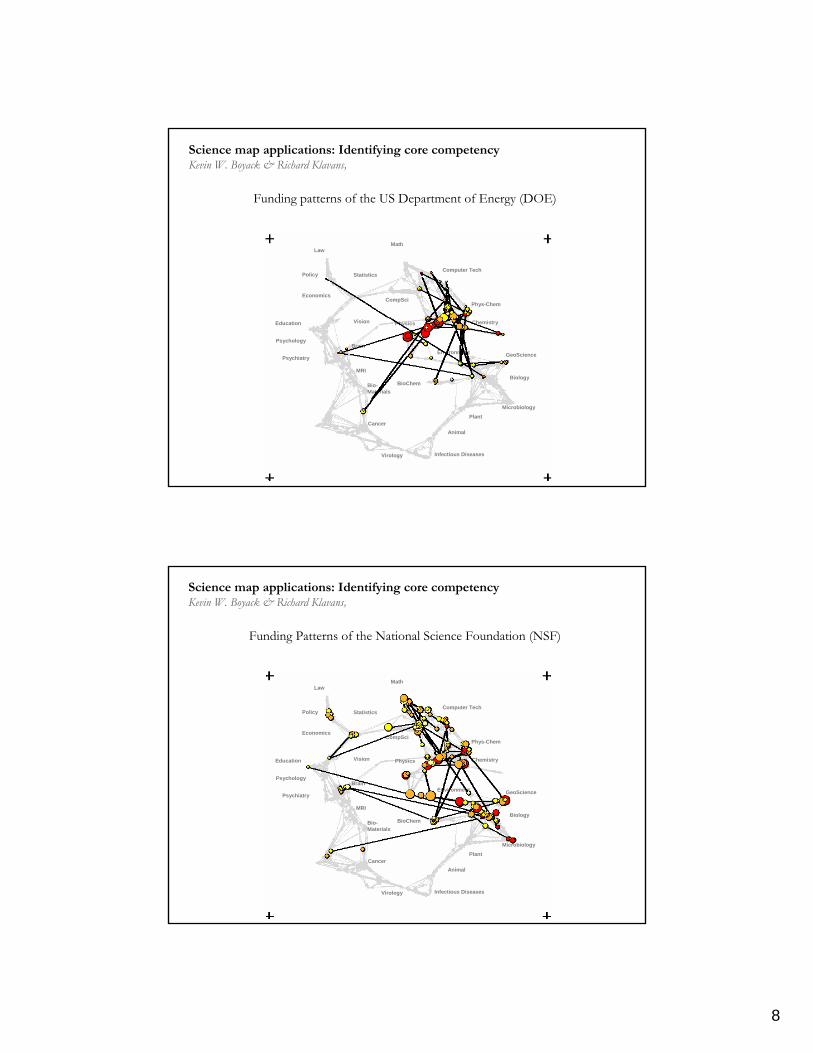
Science Related Wikipedian Activityhttp://scimaps.org/dev/map_detail.php?map_id=165
Same base map.
Overlaid are 3,599 math (blue), 6,474 science (green), and 3,164 technology relevant articles (yellow). All other articles are given in grey.
Corners show articles size coded according to -article edit activity (top left), - number of major edits (top right), - number of bursts in edit activity
(bottom, right) - indegree (bottom left).
7
113 Years of Physical Reviewhttp://scimaps.org/dev/map_detail.php?map_id=171Bruce W. Herr II and Russell Duhon (Data Mining & Visualization), Elisha F. Hardy (Graphic Design), Shashikant Penumarthy (Data Preparation) and Katy Börner (Concept)
‘Base Map’ of ScienceKevin W. Boyack & Richard Klavans,
Uses combined SCI/SSCI from 2002• 1.07M papers, 24.5M
references, 7,300 journals• Bibliographic coupling of
papers, aggregated to journalsInitial ordination and clustering of journals gave 671 clustersCoupling counts were reaggregated at the journal cluster level to calculate the • (x,y) positions for each journal
cluster• by association, (x,y) positions
for each journal
Policy
Economics
Statistics
Math
CompSci
Physics
Biology
GeoScience
Microbiology
BioChem
Brain
PsychiatryEnvironment
Vision
Virology Infectious Diseases
Cancer
Disease &Treatments
MRI
Bio-Materials
Law
Plant
Animal
Phys-Chem
Chemistry
Psychology
Education
Computer Tech
8
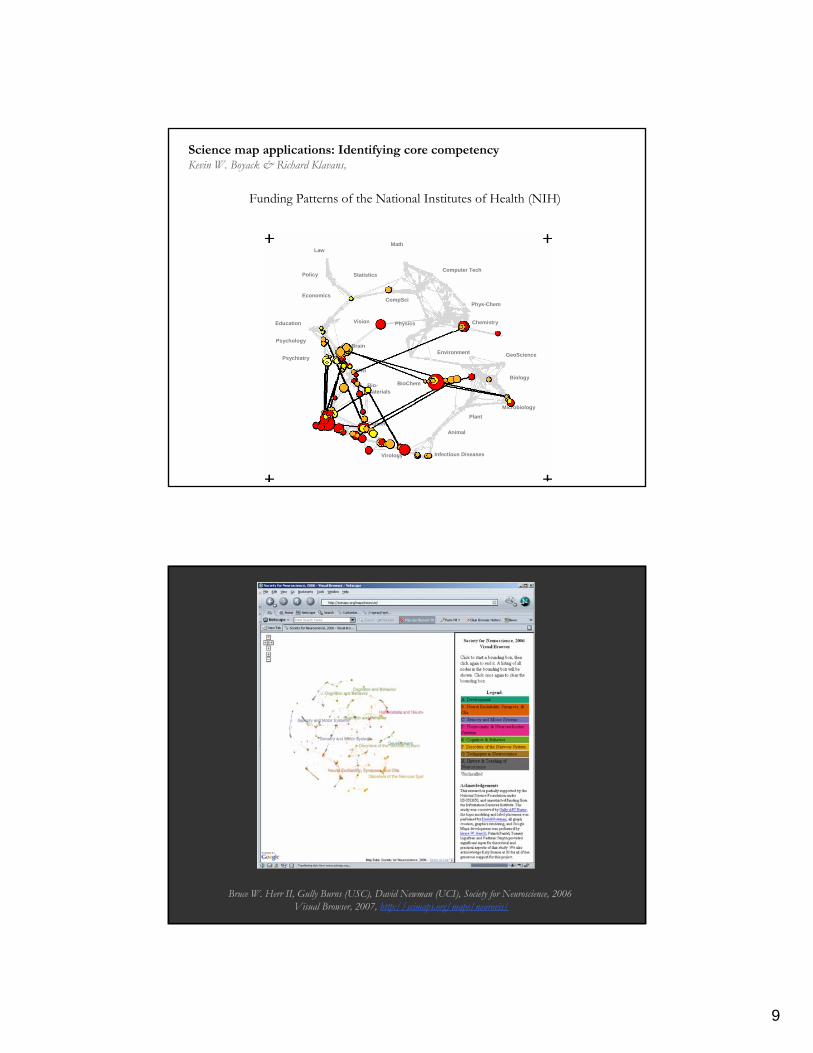
Science map applications: Identifying core competencyKevin W. Boyack & Richard Klavans,
Policy
Economics
Statistics
Math
CompSci
Physics
Biology
GeoScience
Microbiology
BioChem
Brain
PsychiatryEnvironment
Vision
Virology Infectious Diseases
Cancer
MRI
Bio-Materials
Law
Plant
Animal
Phys-Chem
Chemistry
Psychology
Education
Computer Tech
GI
Funding patterns of the US Department of Energy (DOE)
Policy
Economics
Statistics
Math
CompSci
Physics
Biology
GeoScience
Microbiology
BioChem
Brain
PsychiatryEnvironment
Vision
Virology Infectious Diseases
Cancer
MRI
Bio-Materials
Law
Plant
Animal
Phys-Chem
Chemistry
Psychology
Education
Computer Tech
GI
Funding Patterns of the National Science Foundation (NSF)
Science map applications: Identifying core competencyKevin W. Boyack & Richard Klavans,
9
Policy
Economics
Statistics
Math
CompSci
Physics
Biology
GeoScience
Microbiology
BioChem
Brain
PsychiatryEnvironment
Vision
Virology Infectious Diseases
Cancer
MRI
Bio-Materials
Law
Plant
Animal
Phys-Chem
Chemistry
Psychology
Education
Computer Tech
GI
Funding Patterns of the National Institutes of Health (NIH)
Science map applications: Identifying core competencyKevin W. Boyack & Richard Klavans,
Bruce W. Herr II, Gully Burns (USC), David Newman (UCI), Society for Neuroscience, 2006 Visual Browser, 2007, http://scimaps.org/maps/neurovis/
10
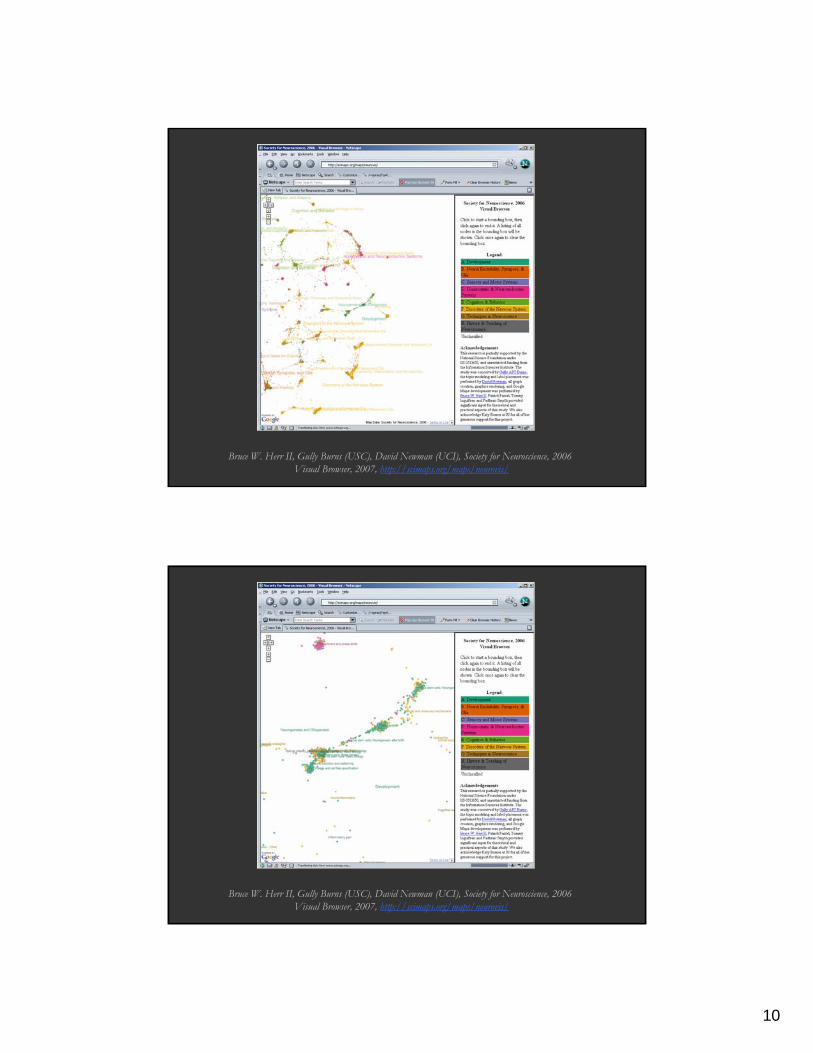
Bruce W. Herr II, Gully Burns (USC), David Newman (UCI), Society for Neuroscience, 2006 Visual Browser, 2007, http://scimaps.org/maps/neurovis/
Bruce W. Herr II, Gully Burns (USC), David Newman (UCI), Society for Neuroscience, 2006 Visual Browser, 2007, http://scimaps.org/maps/neurovis/
11
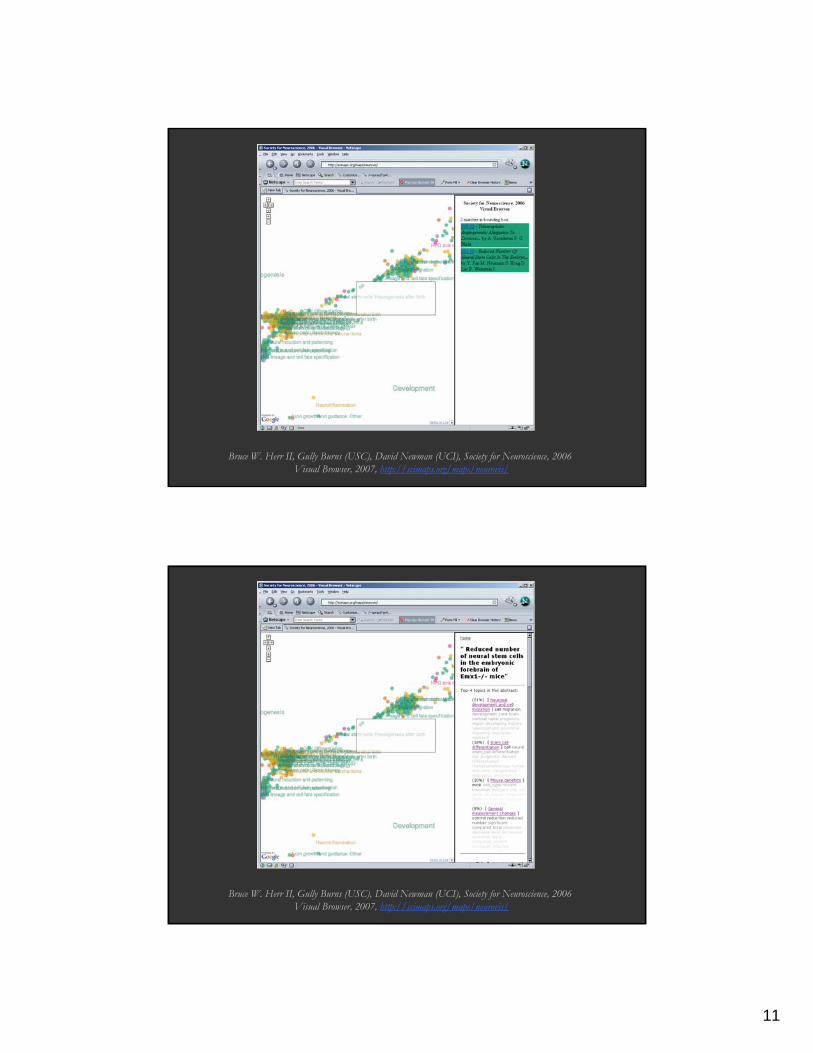
Bruce W. Herr II, Gully Burns (USC), David Newman (UCI), Society for Neuroscience, 2006 Visual Browser, 2007, http://scimaps.org/maps/neurovis/
Bruce W. Herr II, Gully Burns (USC), David Newman (UCI), Society for Neuroscience, 2006 Visual Browser, 2007, http://scimaps.org/maps/neurovis/
12
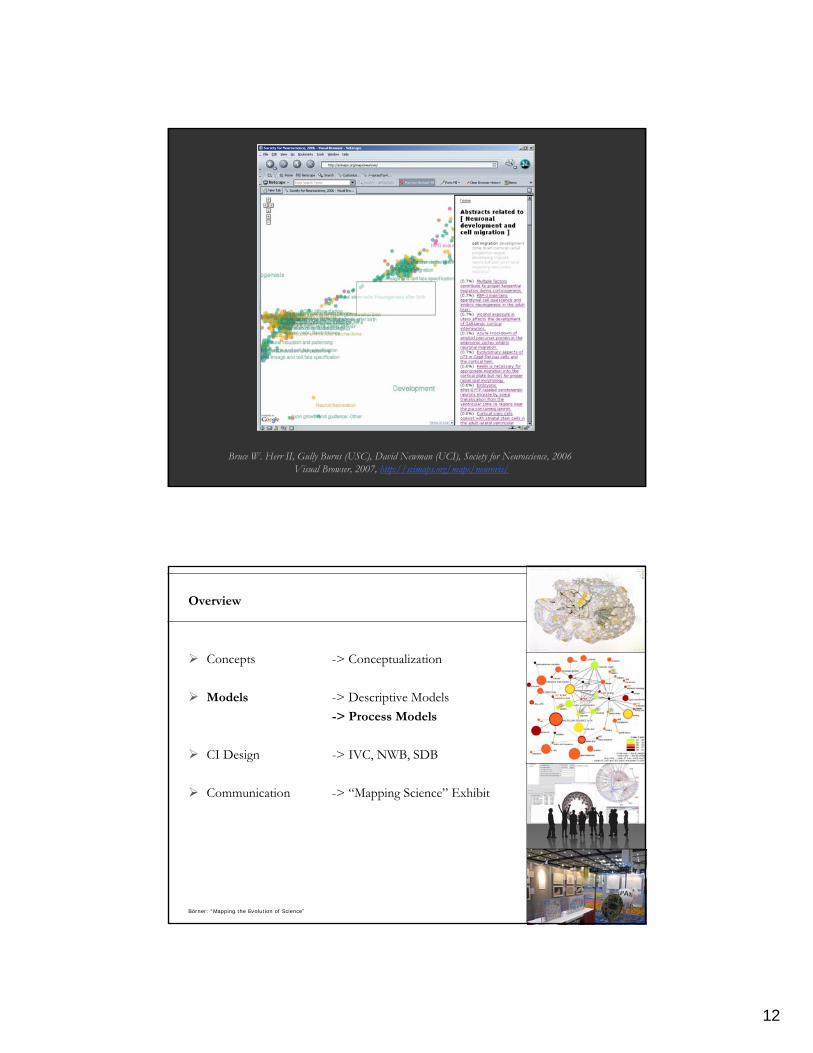
Bruce W. Herr II, Gully Burns (USC), David Newman (UCI), Society for Neuroscience, 2006 Visual Browser, 2007, http://scimaps.org/maps/neurovis/
Börner: “Mapping the Evolution of Science”24
Overview
Concepts -> Conceptualization
Models -> Descriptive Models-> Process Models
CI Design -> IVC, NWB, SDB
Communication -> “Mapping Science” Exhibit
13
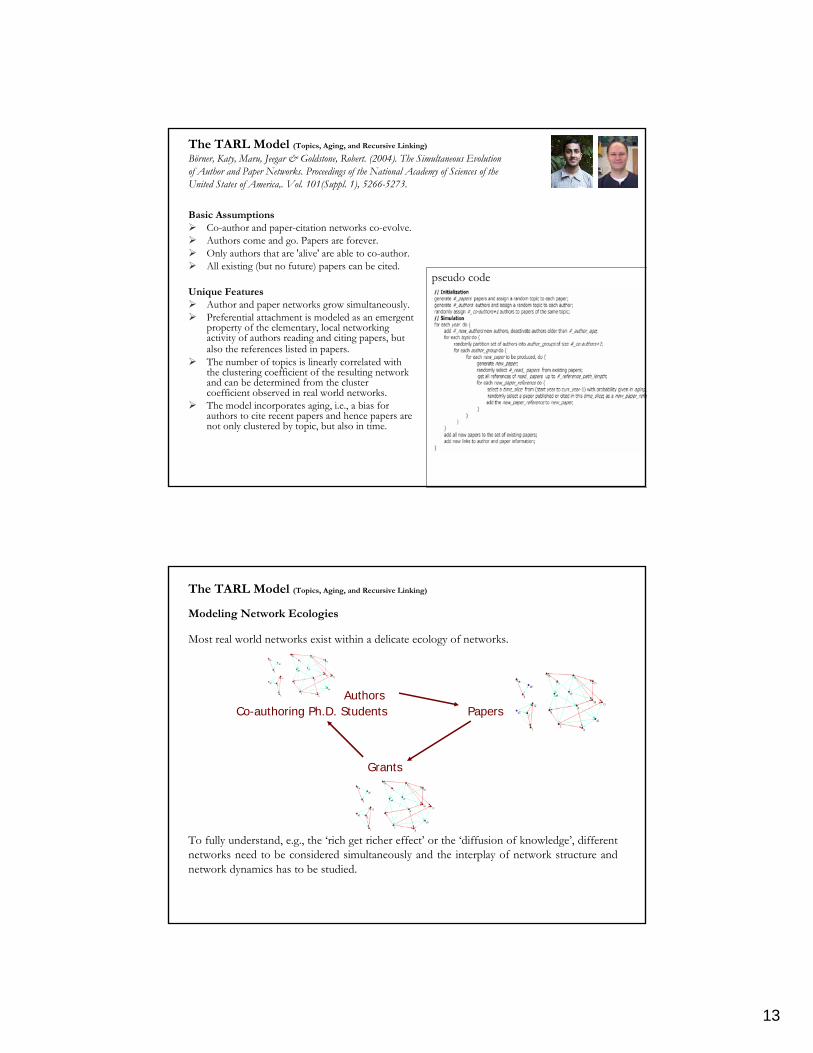
The TARL Model (Topics, Aging, and Recursive Linking)
Börner, Katy, Maru, Jeegar & Goldstone, Robert. (2004). The Simultaneous Evolution of Author and Paper Networks. Proceedings of the National Academy of Sciences of the United States of America,. Vol. 101(Suppl. 1), 5266-5273.
Basic AssumptionsCo-author and paper-citation networks co-evolve.Authors come and go. Papers are forever. Only authors that are 'alive' are able to co-author.All existing (but no future) papers can be cited.
Unique FeaturesAuthor and paper networks grow simultaneously.Preferential attachment is modeled as an emergent property of the elementary, local networking activity of authors reading and citing papers, but also the references listed in papers. The number of topics is linearly correlated with the clustering coefficient of the resulting network and can be determined from the cluster coefficient observed in real world networks. The model incorporates aging, i.e., a bias for authors to cite recent papers and hence papers are not only clustered by topic, but also in time.
pseudo code
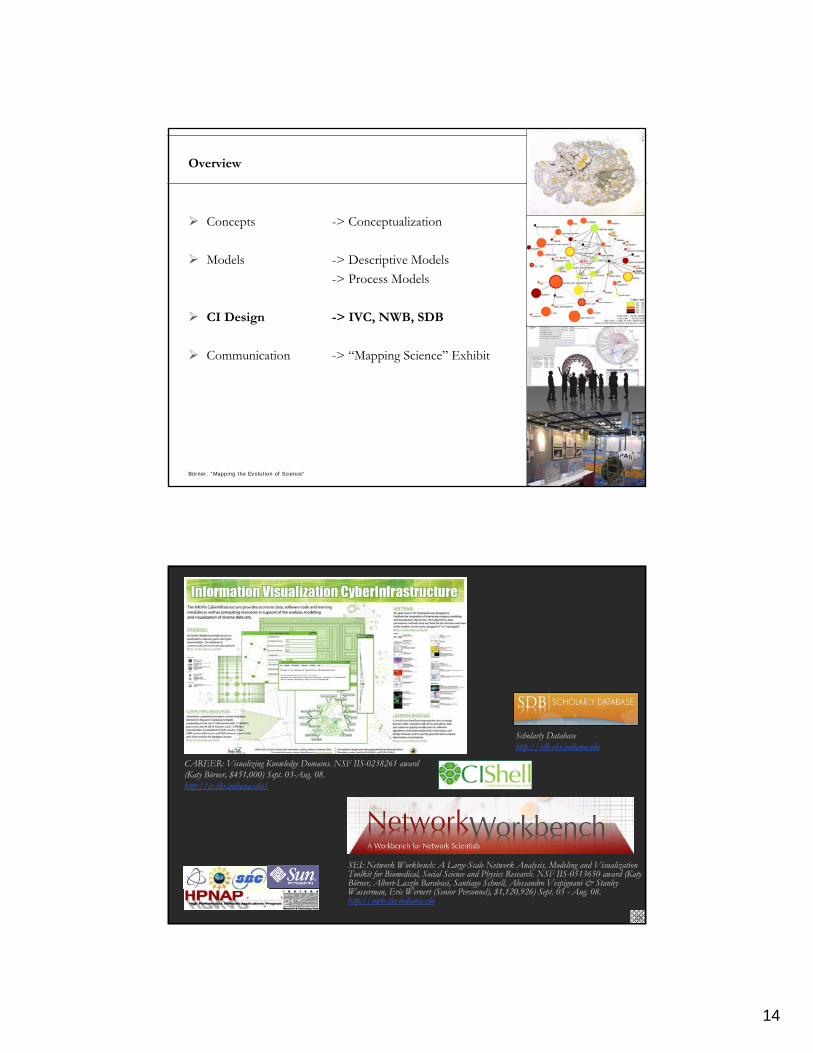
The TARL Model (Topics, Aging, and Recursive Linking)
Modeling Network Ecologies
Most real world networks exist within a delicate ecology of networks.
To fully understand, e.g., the ‘rich get richer effect’ or the ‘diffusion of knowledge’, different networks need to be considered simultaneously and the interplay of network structure and network dynamics has to be studied.
Grants
Co-authoring Ph.D. Students PapersAuthors
14
Börner: “Mapping the Evolution of Science”27
Overview
Concepts -> Conceptualization
Models -> Descriptive Models-> Process Models
CI Design -> IVC, NWB, SDB
Communication -> “Mapping Science” Exhibit
SEI: Network Workbench: A Large-Scale Network Analysis, Modeling and Visualization Toolkit for Biomedical, Social Science and Physics Research. NSF IIS-0513650 award (Katy Börner, Albert-Laszlo Barabasi, Santiago Schnell, Alessandro Vespignani & Stanley Wasserman, Eric Wernert (Senior Personnel), $1,120,926) Sept. 05 - Aug. 08. http://nwb.slis.indiana.edu
CAREER: Visualizing Knowledge Domains. NSF IIS-0238261 award (Katy Börner, $451,000) Sept. 03-Aug. 08. http://iv.slis.indiana.edu/
28
Scholarly Databasehttp://sdb.slis.indiana.edu

15
Börner: “Mapping the Evolution of Science”29
Overview
Concepts -> Conceptualization
Models -> Descriptive Models-> Process Models
CI Design -> IVC, NWB, SDB
Communication -> “Mapping Science” Exhibit
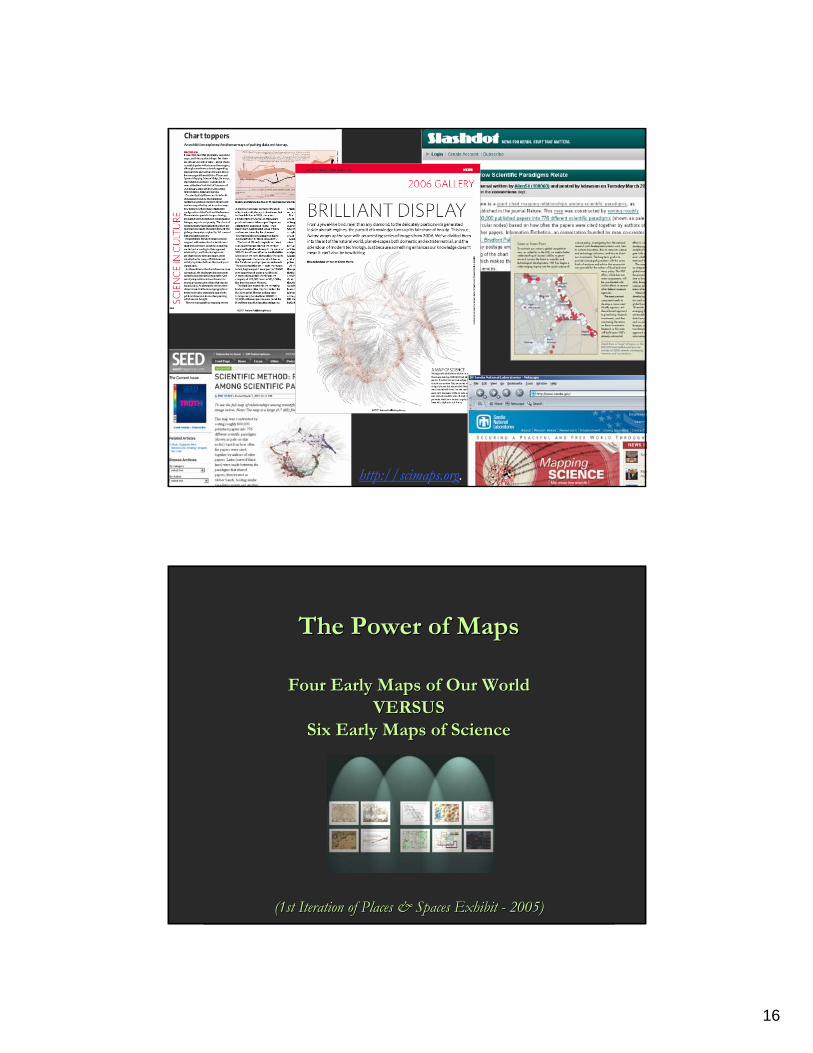
Places & Spaces: Mapping Science exhibit, see also http://scimaps.org.
16
http://scimaps.org.
The Power of MapsThe Power of Maps
Four Early Maps of Our World Four Early Maps of Our World VERSUS VERSUS
Six Early Maps of ScienceSix Early Maps of Science
(1st Iteration of Places & Spaces Exhibit (1st Iteration of Places & Spaces Exhibit -- 2005)2005)
17
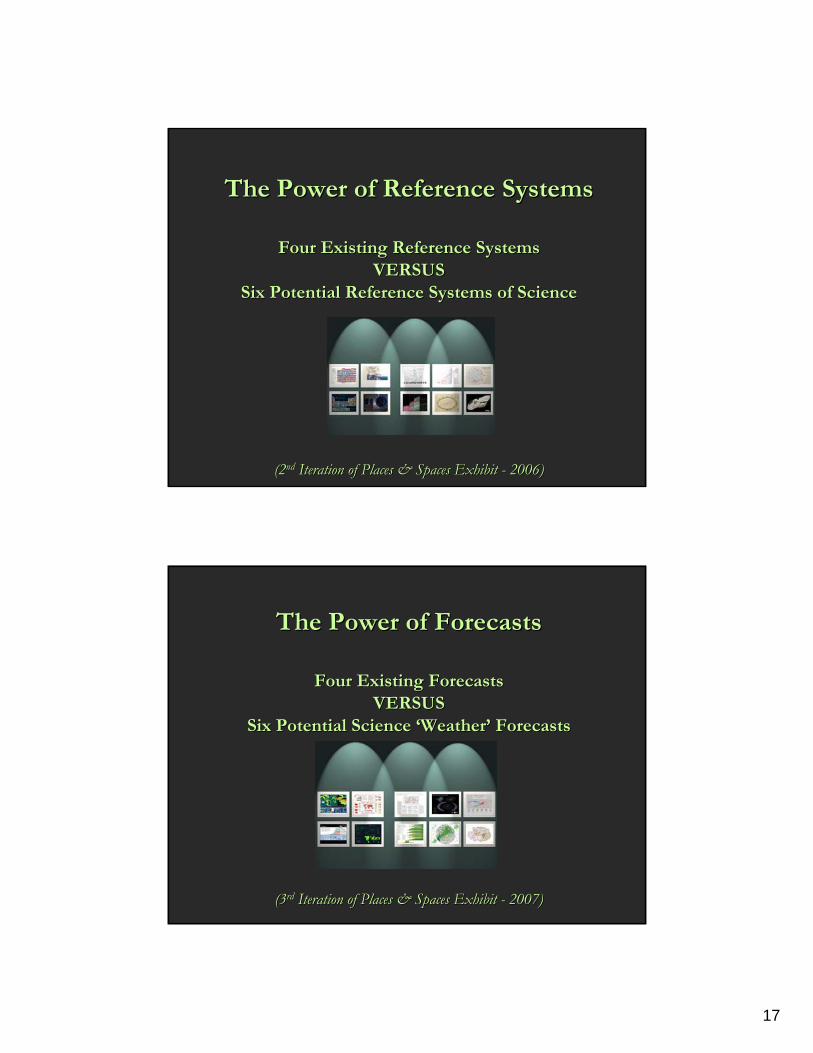
The Power of Reference SystemsThe Power of Reference Systems
Four Existing Reference Systems Four Existing Reference Systems VERSUS VERSUS
Six Potential Reference Systems of ScienceSix Potential Reference Systems of Science
(2(2ndnd Iteration of Places & Spaces Exhibit Iteration of Places & Spaces Exhibit -- 2006)2006)
The Power of ForecastsThe Power of Forecasts
Four Existing Forecasts Four Existing Forecasts VERSUS VERSUS
Six Potential Science Six Potential Science ‘‘WeatherWeather’’ ForecastsForecasts
(3(3rdrd Iteration of Places & Spaces Exhibit Iteration of Places & Spaces Exhibit -- 2007)2007)
18
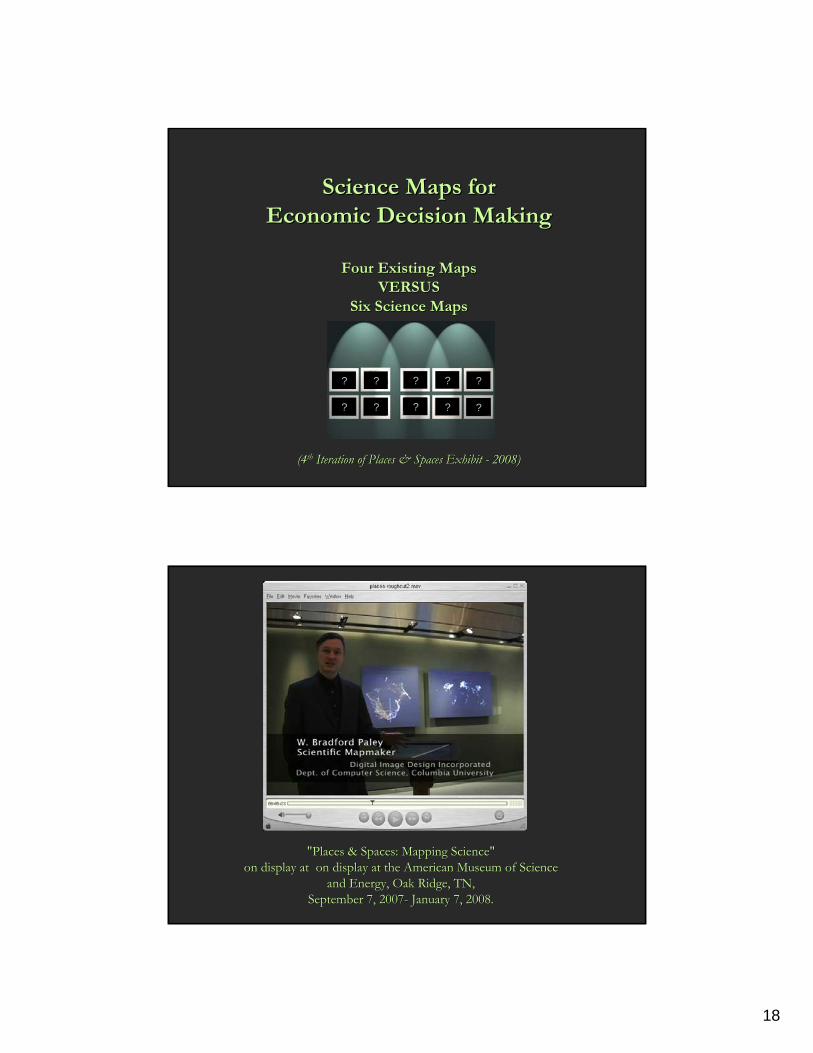
Science Maps for Science Maps for Economic Decision Making Economic Decision Making
Four Existing Maps Four Existing Maps VERSUS VERSUS
Six Science MapsSix Science Maps
(4(4thth Iteration of Places & Spaces Exhibit Iteration of Places & Spaces Exhibit -- 2008)2008)
? ?
? ?
? ?
? ?
?
?
"Places & Spaces: Mapping Science""Places & Spaces: Mapping Science"on display at on display at the American Museum of Science on display at on display at the American Museum of Science
and Energy, Oak Ridge, TN, and Energy, Oak Ridge, TN, September 7, 2007September 7, 2007-- January 7, 2008.January 7, 2008.
19
20
21
22
Börner: “Mapping the Evolution of Science”44
23
Börner: “Mapping the Evolution of Science”45
References
Shiffrin, Richard M. and Börner, Katy. (April 2004). Mapping Knowledge Domains. Proceedings of the National Academy of Sciences of the United States of America, 101(Suppl_1). http://www.pnas.org/content/vol101/suppl_1/
Börner, Katy, Chen, Chaomei, and Boyack, Kevin. (2003). Visualizing Knowledge Domains. In Blaise Cronin (Ed.), Annual Review of Information Science & Technology, Information Today, Inc./American Society for Information Science and Technology, Medford, NJ, volume 37, chapter 5, pp. 179-255. http://ivl.slis.indiana.edu/km/pub/2003-borner-arist.pdf
Börner, Katy, Sanyal, Soma and Vespignani, Alessandro (2007). Network Science. In Blaise Cronin (Ed.), Annual Review of Information Science & Technology, Information Today, Inc./American Society for Information Science and Technology, Medford, NJ, volume 41, chapter 12, pp. 537-607. http://ivl.slis.indiana.edu/km/pub/2007-borner-arist.pdf
Boyack, Kevin W, Börner, Katy & Klavans, Richard. (2007). Mapping the Structure and Evolution of Chemistry Research. Proceedings of the 11th International Conference on Scientometrics and Informetrics (ISSI 2007), Madrid, Spain, June 25-27, pp. 112-123.
Boyack, Kevin W., Klavans, Richard and Börner, Katy. (2005). Mapping the Backbone of Science. Scientometrics. 64(3), 351-374.
These and more papers are linked from http://ivl.slis.indiana.edu/publications/
The End.The End.