mapping the world. the importance of proper map research case study #1: titanic
TRANSCRIPT
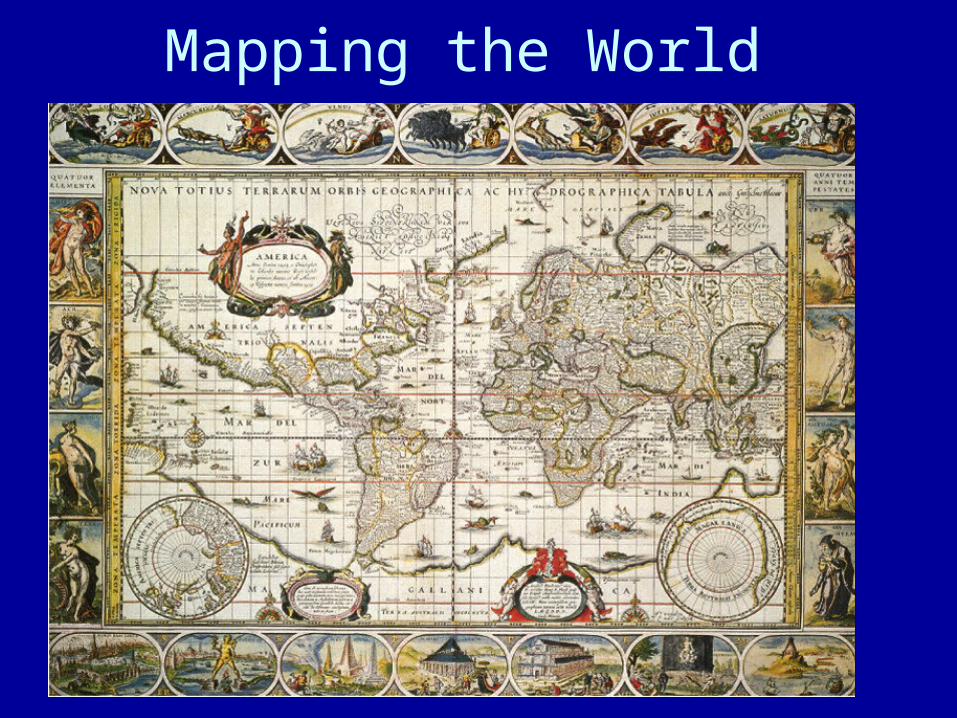
Mapping the World

The importance of proper map research
Case study #1:
Titanic

The tragic outcome

The importance of proper map use
Case study #2:
Blair Witch Project

The fatal error

The result

If you know how to read a map…
• You will get along with your friends.
• You will find your way back home.
• You will live to a ripe old age.
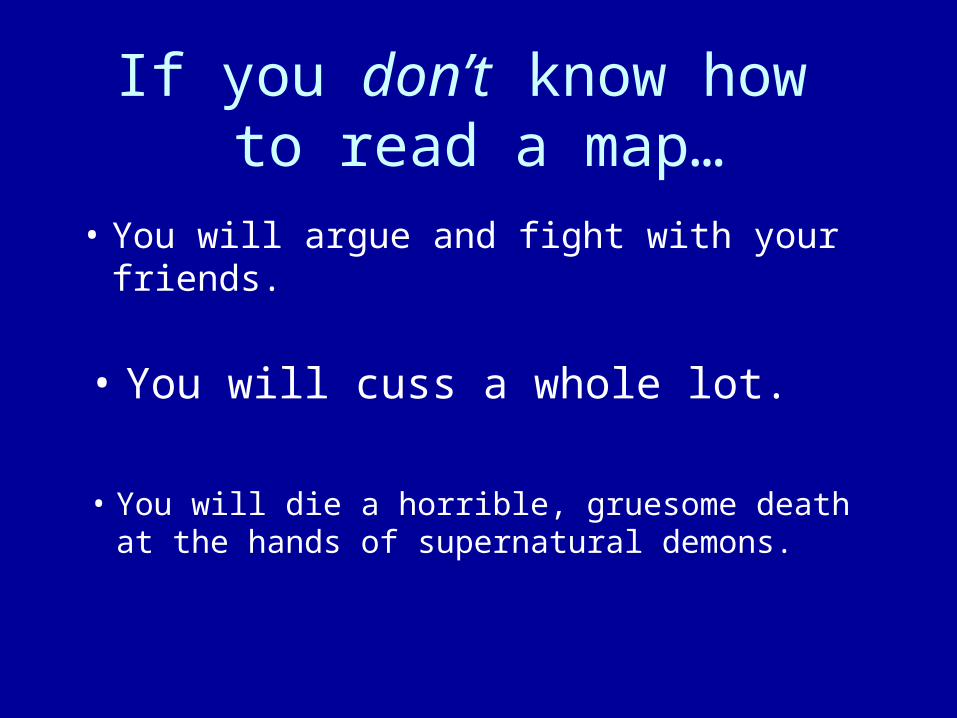
If you don’t know how to read a map…
• You will argue and fight with your friends.
• You will cuss a whole lot.
• You will die a horrible, gruesome death at the hands of supernatural demons.

MAPS = LIFE

Maps
• Elements of a map
• Latitude and longitude
• Scale
• Map projection
• Types of maps
• Mental maps

Elements of a map
• POINTS – cities, sites, etc.
• LINES– boundaries, routes, etc.
• FILLS– political colors, thematic patterns, etc.
• TYPE/SYMBOLS– Labels, statistical charts, etc.

Spatial Change Over Time: Baseball Teams, 1952 and 1998

Spatial Interaction: Flows of Foreign Investment

Shuttle Columbia, Feb. 1, 2003

Latitude and Longitude
Latitude lines(parallels)
run East-West, labeled N or S
90 ˚ N
Longitude lines(meridians)
run North-South, labeled E or W.
Santiago, Chile33 ˚ 26’ S, 70 ˚ 40’ W
Poniatowski, Wisconsin
45˚ N, 90˚ W
InternationalDate Line
180˚
Degree ˚Minutes ‘
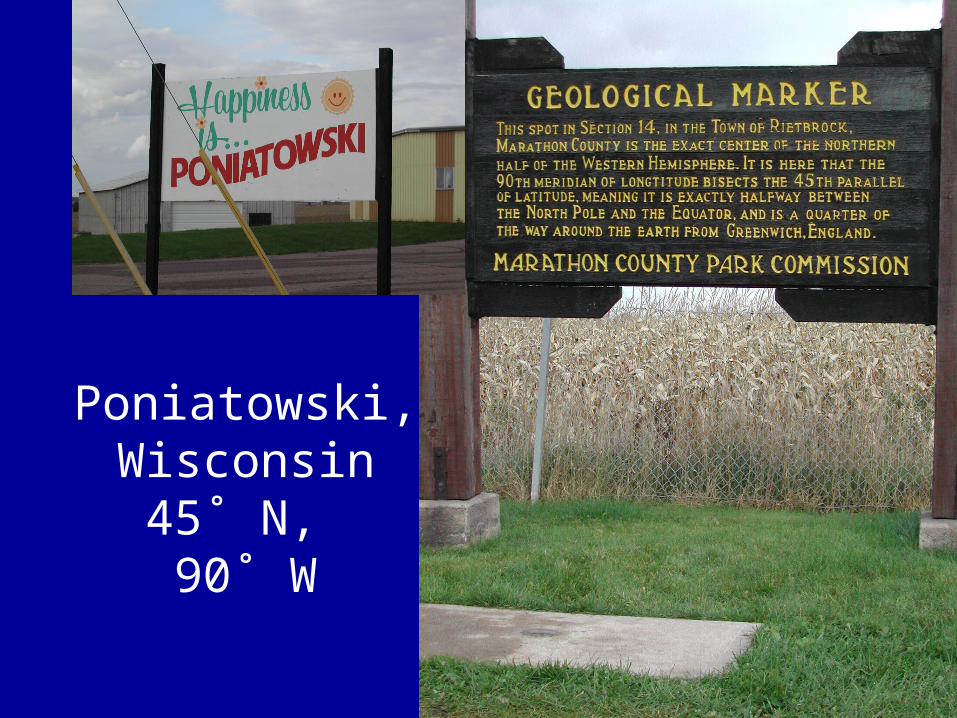
Poniatowski,Wisconsin
45˚ N, 90˚ W


Projections: Turning a globe into a map

World Map Projections

All Map Projections Distort…
• Distance, or
• Direction, or
• Shape, or
• A combination of the above.

Mercator Projection

Goode’s Homolosine Projection

Peters Projection

Robinson Projection

Shape distortionsof projections
Molleweide
Mercator
CylindricalEqual-Area

Scale

Scale: Meaning #1
• The size/scope of places being studied
• Local Global
• Think in terms of local issues vs
regional, national, or global issues

Scale: Meaning #2• Shows the ratio of distance and area on Earth to the distance and area on a map
• Example: one cm on map equals 1 km
• Representations:– proportional fraction (1/100,000)– ratio (1:100,000)– bar scale– verbal statement

BAR SCALES
RATIO

Opposite meaning of “scale”
• A large-scale map shows a small area
• A small-scale map shows a larger area
• A scale of 1/5,000 is a large-scale map compared to a scale of 1/1,000,000.


Types of maps
• Choroplethic– Uses choropleths, or existing (political) units
• Isometric– Uses isolines, or data lines (such as contours)
• Symbolic– Proportional representation, located charts, etc.
• Cartograms• Or a combination of the above

Choroplethic map : Calorie supply

Isometric map : Spatial Diffusion of College Soccer

Isometric map:Time-Space Compression
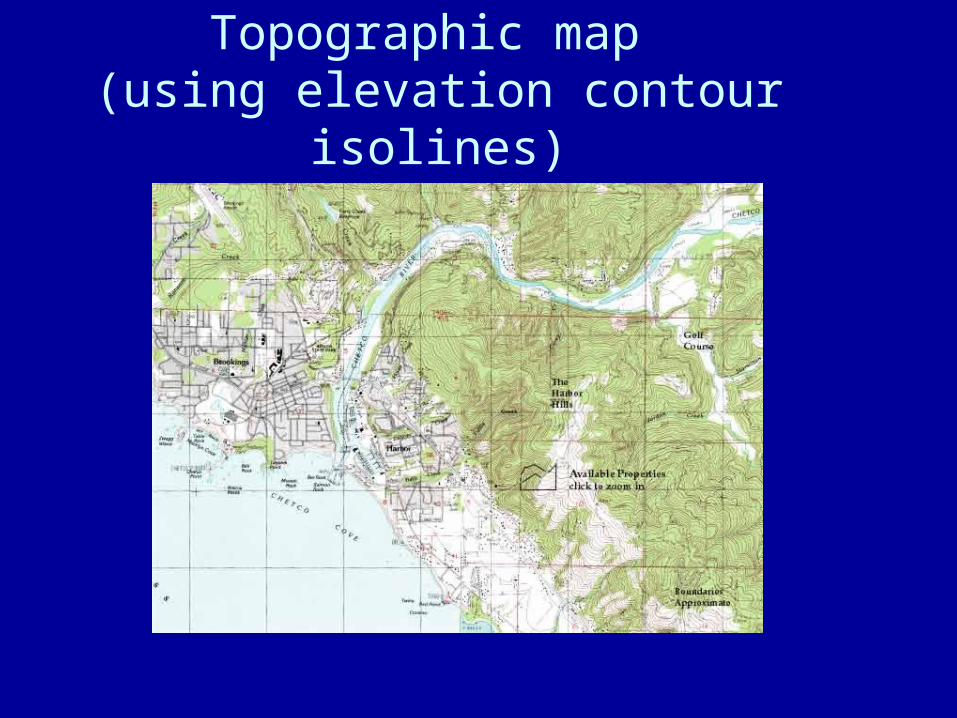
Topographic map (using elevation contour isolines)

Proportional symbols map :AIDS victims
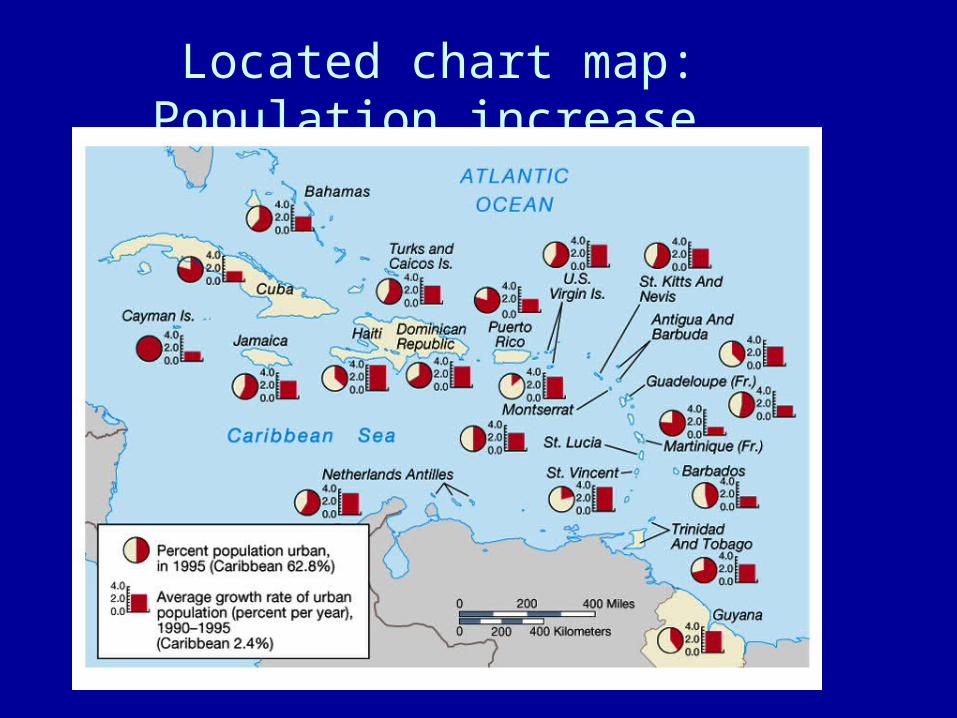
Located chart map: Population increase

Cartogram: Population growth rates

Geographic InformationSystems (GIS)
• Data-driven systems
• Allows merging (comparison) of data using layers of information on a map.
• Fastest growing area of geographic jobs
• Highly technical, centered in government and business

Mental(cognitive)maps of our geographical perceptions

New Yorker’s View of
the World
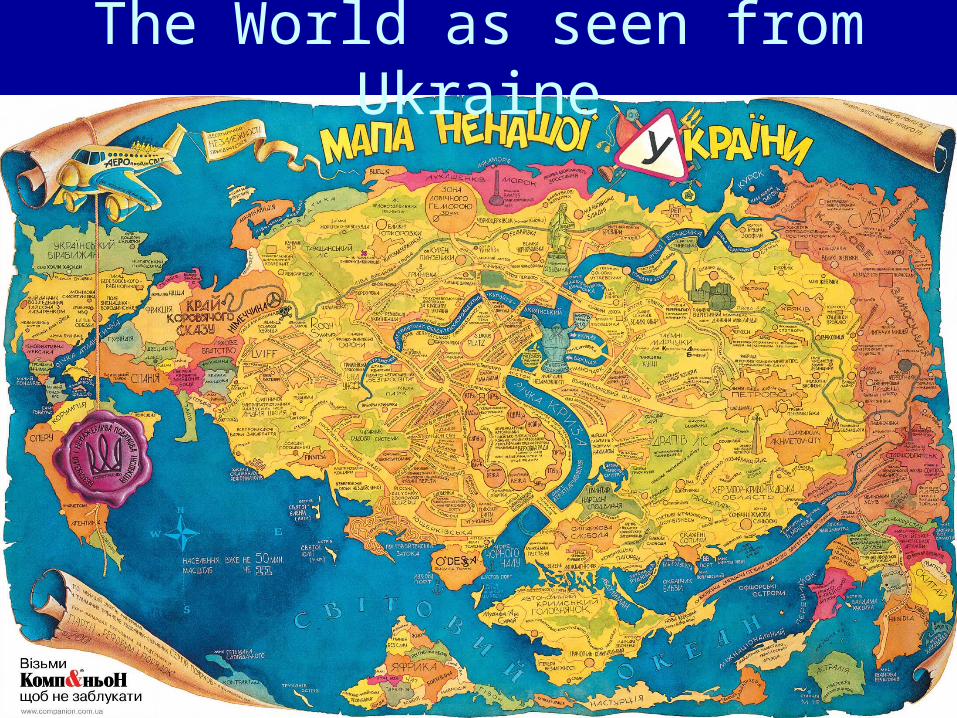
The World as seen from Ukraine
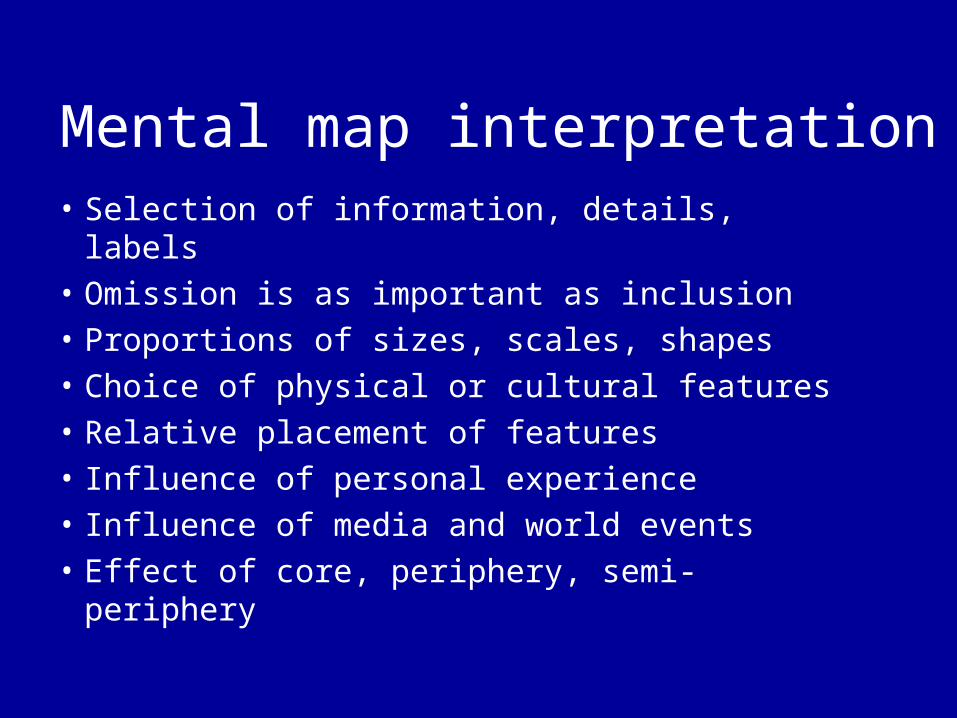
Mental map interpretation• Selection of information, details, labels
• Omission is as important as inclusion
• Proportions of sizes, scales, shapes
• Choice of physical or cultural features
• Relative placement of features
• Influence of personal experience
• Influence of media and world events
• Effect of core, periphery, semi-periphery