march 23-26 washington, dc - sas customer...
TRANSCRIPT

SAS® Global Forum 2014
March 23-26 Washington, DC

3
TYING IT ALL TOGETHER
A story of
Size Optimization
at

4
Agenda
The Financial Evolution of DSW
The DSW Story: Who We Are
SAS Size Optimization
Overview
The Financial Evolution of
DSW

Evolution of DSW HISTORIC GROWTH
Origination Transformation Infrastructure Execution
Years 1991 – 1997 1998 – 2004 2005 – 2008 2009 – present
Stores 39 172 298 393
Sales $135M $961M $1.5B $2.0B
Op Income % N/A 1 – 6% 3 – 8% 11%
Key Events First store July ’91 Build Merch Team Build Mgmt Team Full Time CEO (2009)
80% Close-out 20% Opportunistic IPO (2005) Strategic Focus
dsw.com (2008) Merger with RVI

Consistent Track Record of Growth
NET INCOME ($M)
19% CAGR
10% CAGR
10% CAGR
REVENUES ($M)
NUMBER OF DSW
STORES

POISED FOR GROWTH
394 DSW stores in 42 states as of Dec. 31, 2013
Plan to open 35 stores in 2014
Sales by Region
Northeast 31%
Southeast 19%
Midwest 23%
Southwest 15%
West 12%
1 2
27 15
7
1
4
38
1
1
3 2
8
2
2 11
33
21
16
16 19
15
14
26
3
9
1
5
1
3
6
8
3
5
1 4
2
15
13
7
1
8 2
1

9
THE DSW STORY

The Savvy ShoeLover 2013 Fall Campaign
Commercial


The DSW Formula THE DSW FORMULA
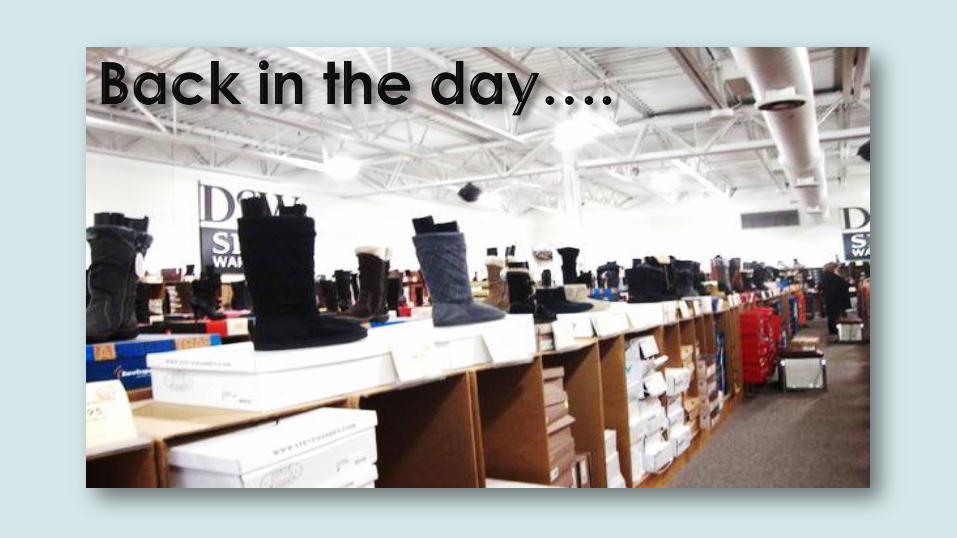
Breathtaking Assortment
Irresistible Value
Simple Convenience

Breathtaking Assortment THE DSW FORMULA

Strong Vendor Relationships THE DSW FORMULA
Sperry
Top-Sider
Clarks of
England
Jessica Simpson Minnetonka Steve Madden Bostonian Nike Adidas Mizuno
Aerosoles Coach Keen Moda Spana Sofft Shoe
Company
Bass Kenneth Cole And 1 New Balance
AK Anne Klein
DKNY Liz Claiborne Naturalizer Sperry Born Shoe Co. Lacoste Asics Tsubo
Charles Jourdan Easy Spirit Madden Girl Carlos Santana Kenneth Cole Tommy Hilfiger Margaritaville Avia Puma
Ugg Ed Hardy Marc Jacobs Nine West Stuart Weitzman Nunn Cole Haan Brooks Reebok
BCBG Paris Ellen Tracy Matisse Prada Tahari Columbia Original Penguin Converse Rider
Blowfish
Enzo Max Studio Ralph Lauren Teva Dockers Rockport Fila Ryka
Calvin Klein Franco Sarto Me Too Reaction
Kenneth Cole
Tommy Hilfiger Dr. Martens Frye K-Swiss Saucony
John Varvatos
G by Guess Merrell Report Bare Traps Dr. Scholls Sorel Keds Skechers
Chinese Laundry Giuseppe
Zanotti
Kurt Geiger Rocket Dog Via Spiga Ecco Timberland Bass Sebago
Clarks Guess Michael Michael
Kors
Roxy Yellow Box Florsheim Wolverine Levi’s Vans
Gucci Michael Kors Ralph Lauren Prada Guiseppe
Zanotti
Sergio Rossi Dolce &
Gabbana
Bottega Veneta Givenchy
Yves Saint
Laurent
Valentino Tod’s Salvatore
Ferragama
Miu Miu Marc by Marc
Jacobs
Givenchy Lanvin Jimmy Choo
400 Brands 2000 Styles
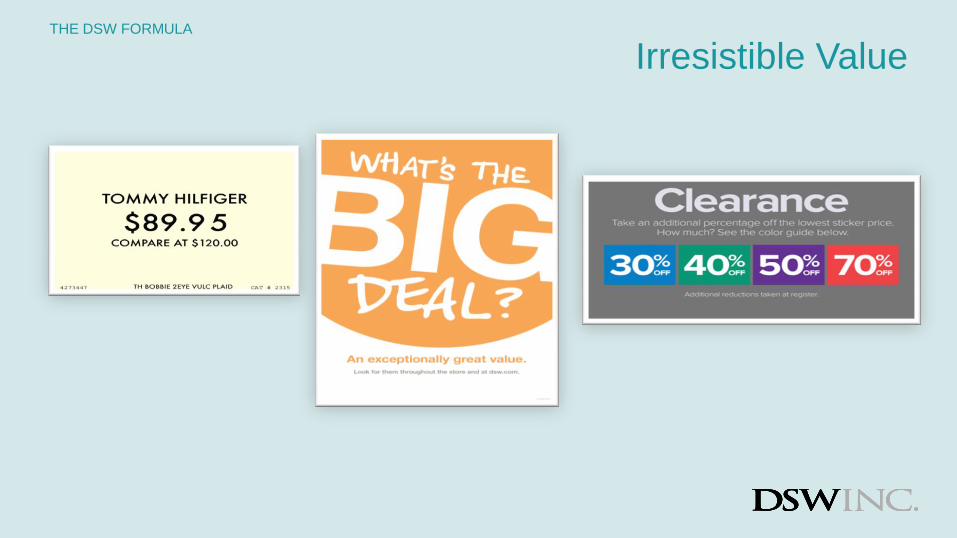
Irresistible Value THE DSW FORMULA

Simple Convenience THE DSW FORMULA
Accessible Stores
Easy to Shop
Assisted Self Select Model

Excite – Cultivate the treasure hunt, inject excitement, urgency & fun into the shopping experience
Relate – Provide a personalized experience to each Shoe Lover at every point along the customer journey
Inform – Become THE Shoe Authority on shoes, providing robust product and trend information
Delight – Provide the best value
Inspire – Build and fuel the Shoe Lover Community
DSW’s Omnichannel Vision

18
OMNI: WE ACT AS ONE
Omni Overview
Present
MORE PRODUCT
Make it
EASIER TO SHOP Make the experience
RELEVANT
Explode our Assortment • Expose Store Only Product • Expand Drop Ship
Empower our Customer • Buy Online, Pickup in Store • Endless Aisle • Mobile Application • Associate Tools
Upgrade our Commerce
Platform • Personalization • Site Search • SEO • Social Community
Build a FOUNDATION for the future
• Data/Analytics • Change Management • Blended Organization

19
TYING IT ALL TOGETHER
A story of
Size Optimization
at


2014 &
Beyond
2004
2009
2012
Allocation
2010
2011
Intelligent Models
Item Planning
Size Optimization
Store Planning
Size Enablement
Omni Assortment
Planning
Size Replenishment
2013
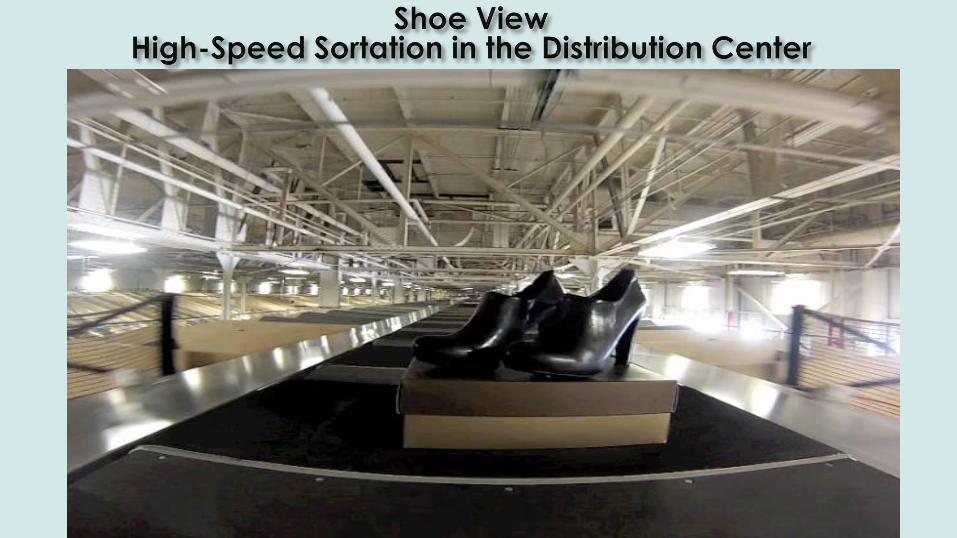
Shoephoria!
High Speed Sortation
Big
Data
Charge Send

Breadth of Assortment
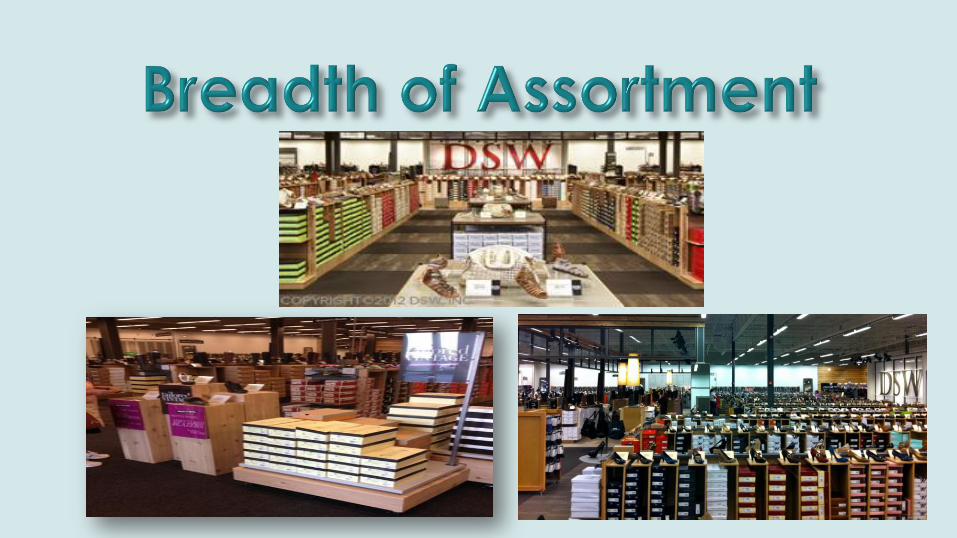

Breadth of Assortment

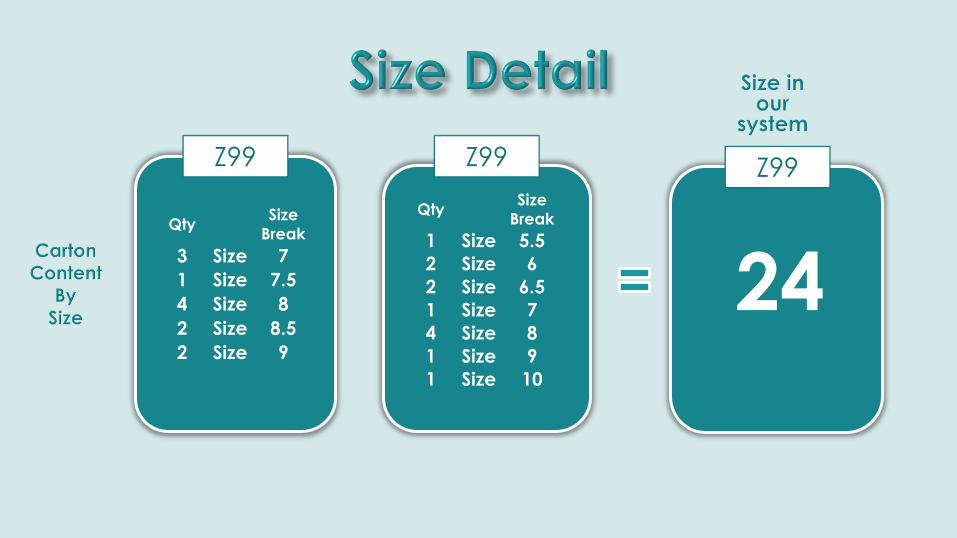
Qty Size
Break
3 Size 7
1 Size 7.5
4 Size 8
2 Size 8.5
2 Size 9
Z99
Qty Size
Break
1 Size 5.5
2 Size 6
2 Size 6.5
1 Size 7
4 Size 8
1 Size 9
1 Size 10
24
Z99 Z99

Z99
3 Size 7
1 Size 7.5
4 Size 8
2 Size 8.5
2 Size 9
Z99
1 Size 5.5
2 Size 6
2 Size 6.5
1 Size 7
4 Size 8
1 Size 9
1 Size 10
4 Size 7
4 Size 8
4 Size 9
Quality/Size Break Quality/Size Break Quality/Size Break
Qty Size
Break
3 Size 7
1 Size 7.5
4 Size 8
2 Size 8.5
2 Size 9
Qty Size
Break
1 Size 5.5
2 Size 6
2 Size 6.5
1 Size 7
4 Size 8
1 Size 9
1 Size 10
Qty Size
Break
1 Size 5.5
2 Size 6
2 Size 6.5
4 Size 7
1 Size 7.5
8 Size 8
2 Size 8.5
3 Size 9
1 Size 10


0
5000
10000
15000
20000
25000
May June July August
Men's
Athletic
Boots
Sandals
Women's

0
5000
10000
15000
20000
25000
30000
May June July August
Men's
Athletic
Boots
Sandals
Women's


Projected Sales
• WOS by store grades & merch type/strategy
• Intelligent projection of future demand
Conformance Modifiers
• Plan conformance for class/subclass
• Footwear capacity conformance for store
Event lift • Additional event lift, if
applicable
Need


Size Break Minimum
Presentation
Seasonal
Sales Curve
Rate of Sale Forward Weeks of
Cover Store
Inventory
Inventory Receipt
Flow

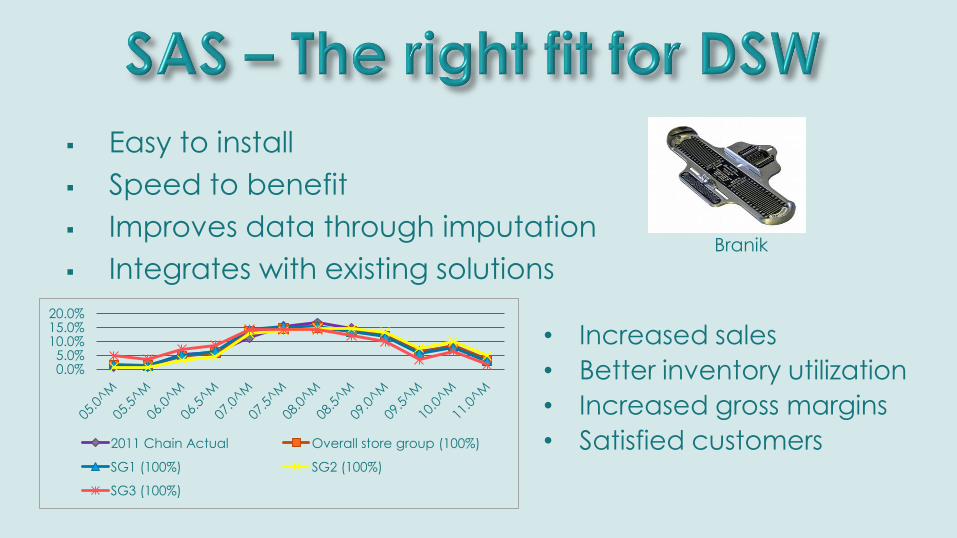
Easy to install
Speed to benefit
Improves data through imputation
Integrates with existing solutions
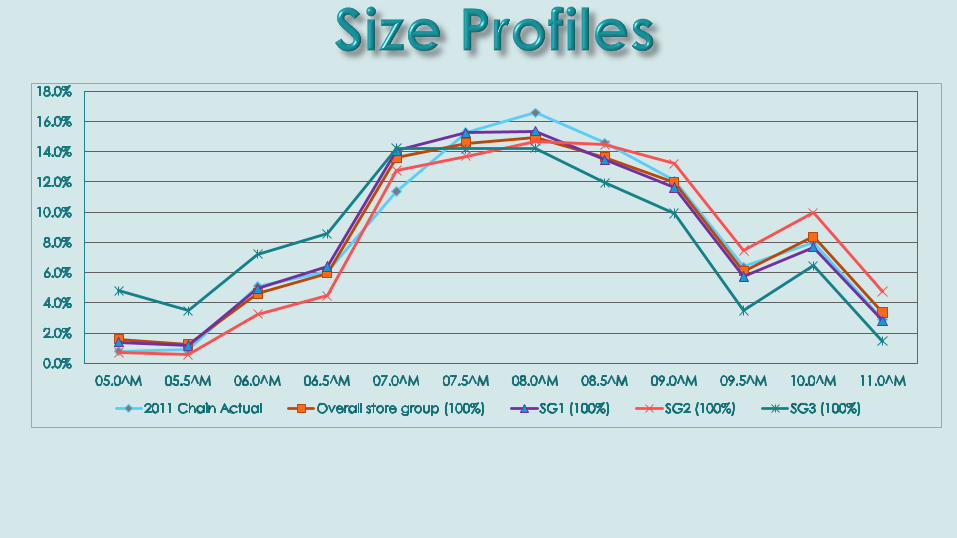
0.0% 5.0%
10.0% 15.0% 20.0%
2011 Chain Actual Overall store group (100%)
SG1 (100%) SG2 (100%)
SG3 (100%)
• Increased sales
• Better inventory utilization
• Increased gross margins
• Satisfied customers
Branik
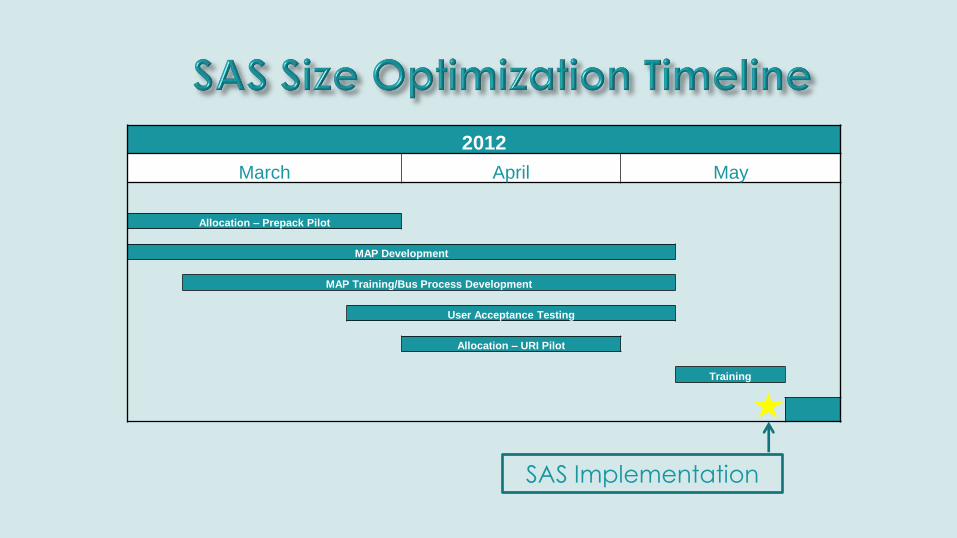
SAS Implementation
2012
March April May
Allocation – Prepack Pilot
MAP Development
MAP Training/Bus Process Development
User Acceptance Testing
Allocation – URI Pilot
Training

SAS imputes sales when inventory position by
size is not optimal…generating better size curves.
SAS profiles are used to purchase merchandise
and to allocate to stores…creating consistency between buying and allocation.
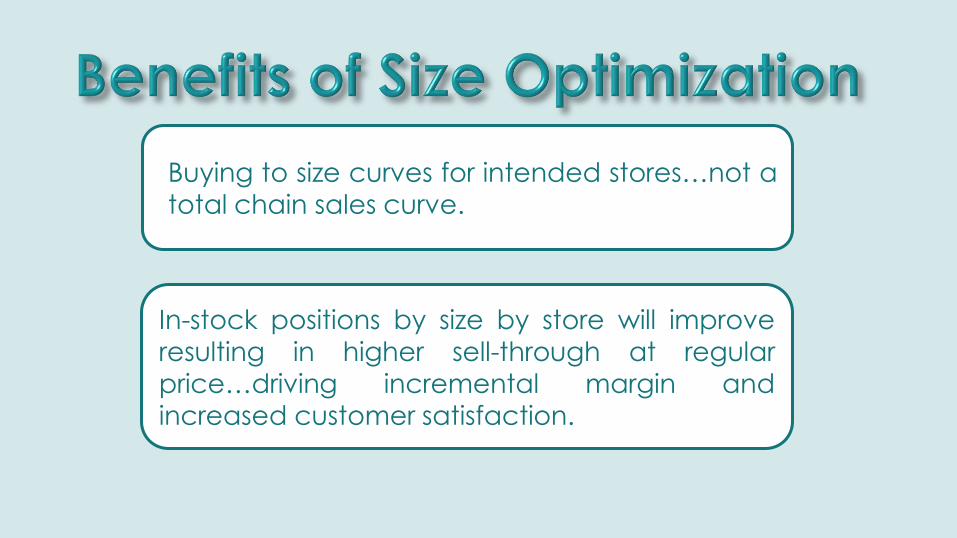
Buying to size curves for intended stores…not a total chain sales curve.
In-stock positions by size by store will improve
resulting in higher sell-through at regular price…driving incremental margin and increased customer satisfaction.
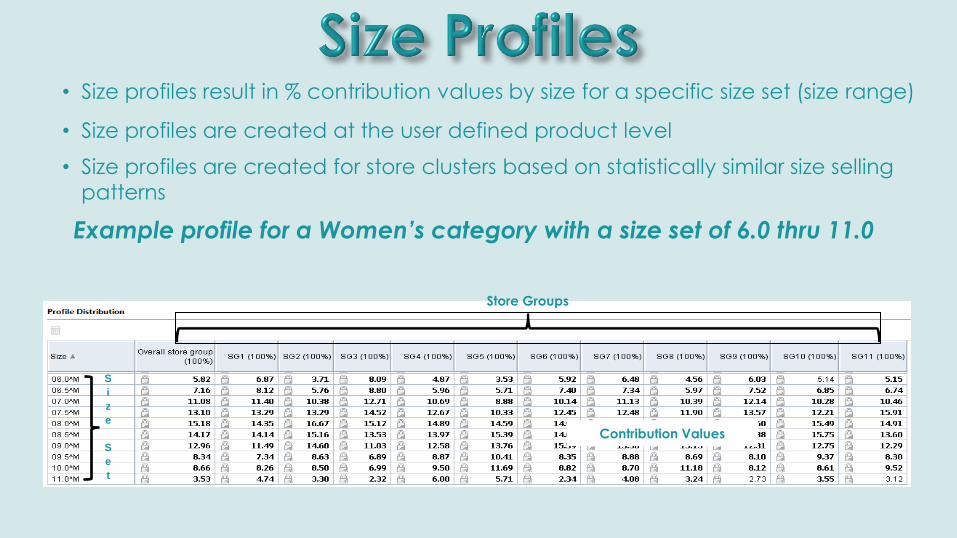
• Size profiles result in % contribution values by size for a specific size set (size range)
• Size profiles are created at the user defined product level
• Size profiles are created for store clusters based on statistically similar size selling
patterns
Example profile for a Women’s category with a size set of 6.0 thru 11.0
Store Groups
Contribution Values
S
i
z
e
S
e
t

DSW updates profiles on a rolling quarterly basis using 6 months of data
Run profiling generation steps
Delete size sets based on:
•Imputed sales thresholds
•Number of products included in size set
Review size sets:
•Utilize graphing by store group feature
•Ensure there are no data anomalies
Create any necessary independent profiles:
•i.e. new product introduction and no supporting historical data to create size sets
Publish profiles
End of Q1 End of Q3 End of Q4 End of Q2
Target Publish Period
Historical Data Used
Last Two Completed Qtrs (i.e. Q2/Q1)
Corresponding Future Qtrs
Last Two Completed Qtrs
(i.e. Q4/Q3)
Last Two Completed Qtrs
(i.e. Q3/Q2)
Last Two Completed Qtrs
(i.e. Q1/Q4)
Corresponding Future Qtrs
Corresponding Future Qtrs
Corresponding Future Qtrs

First Profiles Created
Allocation to SAS Profiles
Delivery of orders to SAS Profiles


1 Import Store List & Size
Profiles
2 Apply Minimum
Presentation
3 Apply Item Plan Defined
Forward Cover
Store Inventories Dynamically
Aligned to Item Plan
1. Store list from MAP is used to generate respective store profiles (new model).
2. Store’s receive a minimum presentation of 1 unit per size for sizes defined in
the buy with special consideration for fringe sizes.
3. Forward cover is calculated using each store’s actual rate of sale multiplied against the item’s planned weeks of cover.
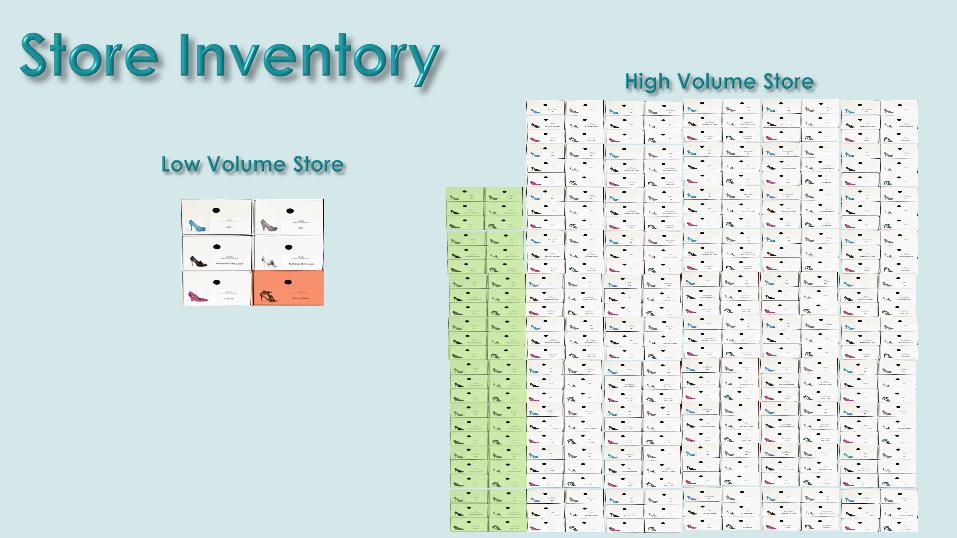
Old Process: • Fixed store inventory levels based on
volume group designation.
• Size distribution based on a chain
selling curve applied to all stores.
New
Process:
• Store inventories built dynamically
based on actual store performance.
• Store inventories aggregate in
alignment with the item plan.
• Size distribution based on store profiles
generated from the size optimization
solution (SAS).
Benefits: • Increased productivity based on aligning inventory with actual store
performance.
• Improved in-stock%’s from allocating
by size in alignment with size
optimization store profiles.

Size Break Minimum
Presentation
Seasonal
Sales Curve
Rate of Sale Forward Weeks of
Cover
Perfect
Store
Inventory
Inventory Receipt
Flow


The Beginning
Stand alone Allocation
An Excel spreadsheet (or two)
The acknowledgement “We Can Do Better”
The Transition
Develop a plan
Develop the process
Foundation first
Change management
Today
Fully integrated process
Supported by systems
Improved efficiencies
Impact on financial metrics
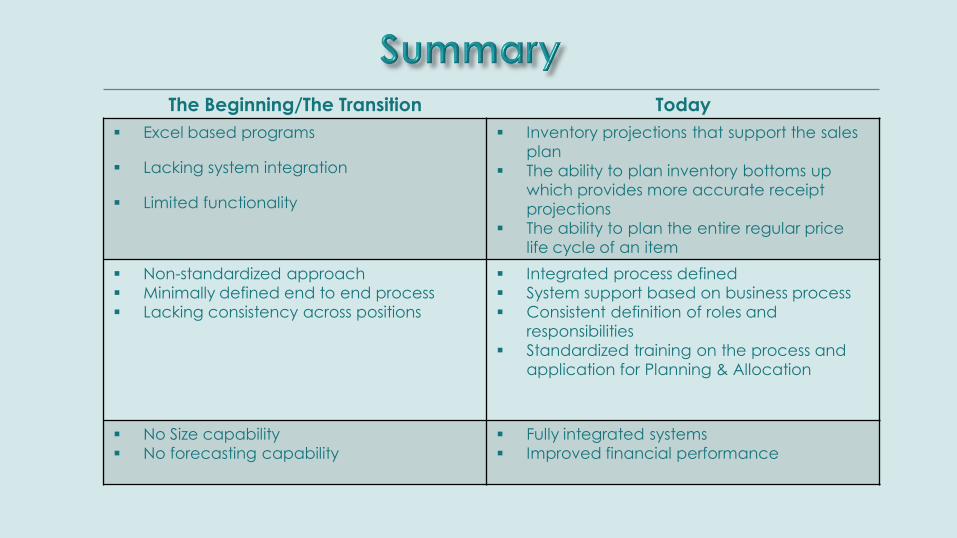
The Beginning/The Transition Today
Excel based programs
Lacking system integration
Limited functionality
Inventory projections that support the sales
plan
The ability to plan inventory bottoms up
which provides more accurate receipt
projections
The ability to plan the entire regular price
life cycle of an item
Non-standardized approach
Minimally defined end to end process
Lacking consistency across positions
Integrated process defined
System support based on business process
Consistent definition of roles and
responsibilities
Standardized training on the process and
application for Planning & Allocation
No Size capability
No forecasting capability
Fully integrated systems
Improved financial performance

2014 &
Beyond
2004
2009
2012
Allocation
2010
2011
Intelligent Models
Item Planning
Size Optimization
Store Planning
Size Enablement
Omni Assortment
Planning
Size Replenishment
2013
Shoephoria!
High Speed Sortation
Big
Data
Charge Send