market survey uk agricultural land - savills · the survey is a general indicator of market...
TRANSCRIPT

Market SurveyUK Agricultural Land 2015
Savills World Research UK Rural
savills.co.uk/research

The farmland values are derived from Savills Farmland Value Survey, which is a comprehensive record of the value of a range of types and quality of bare agricultural land by region since 1992. It is based on the quarterly valuation of a static portfolio of 9 types of bare land with vacant possession in 25 regions across Great Britain by a panel of Savills agricultural valuers and others who are experts in their region. It is based on local knowledge, which is sourced primarily from local transaction information, but also takes into account special purchasers, unusual properties, and the tone of the market in the area at that time.
The survey is a general indicator of market conditions at the time of the survey, with no reference to future market conditions. The data is for general informative purposes only and should not be used as the basis of any property valuation or appraisal. Range values are not definitive and they do not indicate realisable values on a forced sale.
Savills accepts no liability whatsoever for any direct or consequential loss arising from the use of this data.
savills.co.uk/research 03
2015
A clear understanding of local conditions is critical in an increasingly diverse marketplace
At 131,000 acres, the amount of land publicly marketed across Great Britain during 2014 was the
smallest since our records began in 1995. Compare that to the years immediately following the end of World War II, when we know that around 650,000 acres were traded annually in England alone.
Conversely, multifaceted buyer types fuelled strong demand and Savills Farmland Value Survey shows that the average value of prime arable farmland nationally strengthened by 14% to almost £10,000 per acre in 2014. This follows a 12.3% rise in 2013 and a substantial 277% increase in average prime arable values during the past 10 years.
However, average values conceal regional variations and the farmland market is increasingly diverse in terms of value and the prices achieved. Factors including land quality, position and local demand are key to achieving the best prices.
Farmers, as would be expected, continue to be the predominant buyers of farmland but they are not alone. They are competing with non farmers or ‘lifestyle’ buyers and institutions. For farmers – expanding the farming business remains the core reason for purchase. Buying land, providing it is strategically located, enhances the opportunity for economies of scale and therefore greater influence over suppliers and customers. The use of larger machinery helps to drive costs down and margins up.
We expect further growth in UK farmland values in 2015 but the market will become more diverse and a clear understanding of local market conditions will be critical to buyers and sellers to ensure realistic price expectations are established. There will be factors that are likely to
dampen the average rate of growth, which has been a significant feature of this market for the past decade.
Agricultural incomes are inversely correlated to economic growth and continued improvements in the economy will put some pressure on farm incomes and therefore capital and rental values across all types of land and farming businesses.
We are already seeing pressure on commodity prices and this is likely to continue this year, affecting farm profits and cash flows, which may lead to increased supply in some local markets.
Political uncertainty will be a key market factor in 2015. During 2014 the Scottish Referendum and the publication of the Land Reforms had a significant effect on the Scottish market, both in terms of reduced activity and stifled value growth. The political agenda in Scotland will continue to be of influence this year, but the early indications are of a higher volume of land coming to the market than in 2014. In 2014, 32,000 acres of farmland were publicly marketed in Scotland – a quarter of that recorded in 2000. History also shows that the run-up to a General Election will add a layer of uncertainty to the market.
In conclusion, additional farmland remains an obvious target for business expansion and a key element for diversification and risk mitigation in investment portfolios but equally, following very substantial gains in recent years, the current strength of the market offers an opportunity to release capital. n
2014 SUmmARy
Supply of publicly marketed farmland reaches historically low levels, while
values continue to strengthenSee pages 04/05
The proportion of farmer buyers continues to fall, with lifestyle buyers
becoming increasingly activeSee pages 06/07
Strong capital growth was a key theme in 2014 across all real estate asset sectors,
including agricultureSee page 08
Quality remains vital for investors in 2015. Top picks include large commercial
farms and rural estates See page 9
Further growth in farmland values
is expected in 2015, but the market continues to be diverse
See page 10
ForewordGETTING TO KNOW yOUR mARKET
Alex LawsonDirector,Farms and estates020 7409 [email protected]

04
Market Survey | Agricultural Land
Supply 2014 The smallest number of acres (131,000) was publicly marketed across Great Britain during 2014 since our records began in 1995 and at least since the end of World War 2, when we know that around 650,000 acres were traded in England alone. Graph 1
illustrates the long term contraction of the farmland market and shows it has generally plateaued since 2003.
We estimate that the private market currently adds around an additional 30% of acres and therefore total activity is about 170,000 acres which is still a long way off historical levels.
In England, levels of supply have
remained fairly constant over the past three years at around 90,000 acres (see Graph 2). However, this is still 16% less than the amount of farmland marketed in England in 2011, 33% less than in 2008 and 56% less than in the year 2000.
In 2014, across England increased activity was recorded in the East of England, the South West of England and the West Midlands. There was a decrease in activity in the East Midlands, the North of England and the South East of England
In contrast, the Scottish Referendum, the proposed Land Reforms and the latest CAP reforms had a significant effect on the Scottish market in 2014 where supply was only three quarters of that recorded in 2013 and a quarter of that recorded in 2000; at just 32,000 acres.
Similarly, the volume of publicly marketed farmland significantly decreased in Wales to 7,300 acres. A decrease of -21% on 2013 and a significant 58% lower than the volume marketed in 2000. The latest CAP reforms and the introduction of a regional based subsidy system contributed towards uncertainty in the Welsh market.
GRAPH 1
Long term contraction of the farmland market
Source: Savills Research
250,000
200,000
150,000
100,000
50,000
0
800,000
700,000
600,000
500,000
400,000
300,000
200,000
100,000
0
Acr
esA
cres
1998
1999
2000
2001
2002
2003
2004
2005
2006
2007
2008
2009
2010
2011
2012
2013
2014
Agricultural LandSupply and Values 2014
GRAPH 2
The prospect of change impacts on market activity
Source: Savills Research
2014 witnessed the smallest number of acres publicly marketed since
records began
Average value of prime arable farmland has increased by 277% over past 10 years
n England n Scotland n Wales
Traded in England Publicly marketed in England Publicly marketed in Scotland Publicly marketed in Wales
1945
1950
1955
1960
1965
1970
1975
1980
1985
1990
1995
2000
2005
2010
Low supply supports values
savills.co.uk/research 05
2015
Values 2014
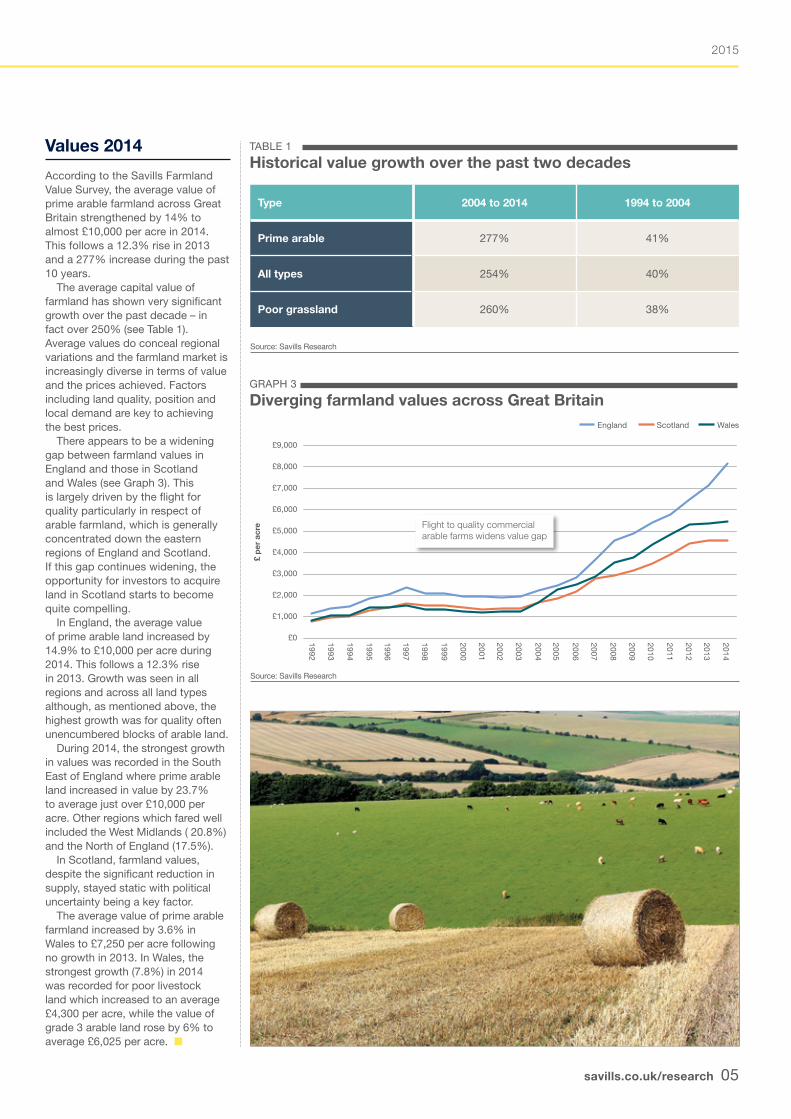
According to the Savills Farmland Value Survey, the average value of prime arable farmland across Great Britain strengthened by 14% to almost £10,000 per acre in 2014. This follows a 12.3% rise in 2013 and a 277% increase during the past 10 years.
The average capital value of farmland has shown very significant growth over the past decade – in fact over 250% (see Table 1). Average values do conceal regional variations and the farmland market is increasingly diverse in terms of value and the prices achieved. Factors including land quality, position and local demand are key to achieving the best prices.
There appears to be a widening gap between farmland values in England and those in Scotland and Wales (see Graph 3). This is largely driven by the flight for quality particularly in respect of arable farmland, which is generally concentrated down the eastern regions of England and Scotland. If this gap continues widening, the opportunity for investors to acquire land in Scotland starts to become quite compelling.
In England, the average value of prime arable land increased by 14.9% to £10,000 per acre during 2014. This follows a 12.3% rise in 2013. Growth was seen in all regions and across all land types although, as mentioned above, the highest growth was for quality often unencumbered blocks of arable land.
During 2014, the strongest growth in values was recorded in the South East of England where prime arable land increased in value by 23.7% to average just over £10,000 per acre. Other regions which fared well included the West Midlands ( 20.8%)and the North of England (17.5%).
In Scotland, farmland values, despite the significant reduction in supply, stayed static with political uncertainty being a key factor.
The average value of prime arable farmland increased by 3.6% in Wales to £7,250 per acre following no growth in 2013. In Wales, the strongest growth (7.8%) in 2014 was recorded for poor livestock land which increased to an average £4,300 per acre, while the value of grade 3 arable land rose by 6% to average £6,025 per acre. n
£9,000
£8,000
£7,000
£6,000
£5,000
£4,000
£3,000
£2,000
£1,000
£0
£ p
er a
cre
GRAPH 3
Diverging farmland values across Great Britain
Source: Savills Research
Type 2004 to 2014 1994 to 2004
Prime arable 277% 41%
All types 254% 40%
Poor grassland 260% 38%
TABLE 1
Historical value growth over the past two decades
Source: Savills Research
England Scotland Wales
1992
1993
1994
1995
1996
1997
1998
1999
2000
2001
2002
2003
2004
2005
2006
2007
2008
2009
2010
2011
2012
2013
2014
Flight to quality commercial arable farms widens value gap
06
Market Survey | Agricultural Land
Our analysis of farm transactions across Great Britain, where Savills acted for the buyer or seller, shows that the demand for UK farmland is diverse – both in the types of buyer and seller and their motives.
Sellers
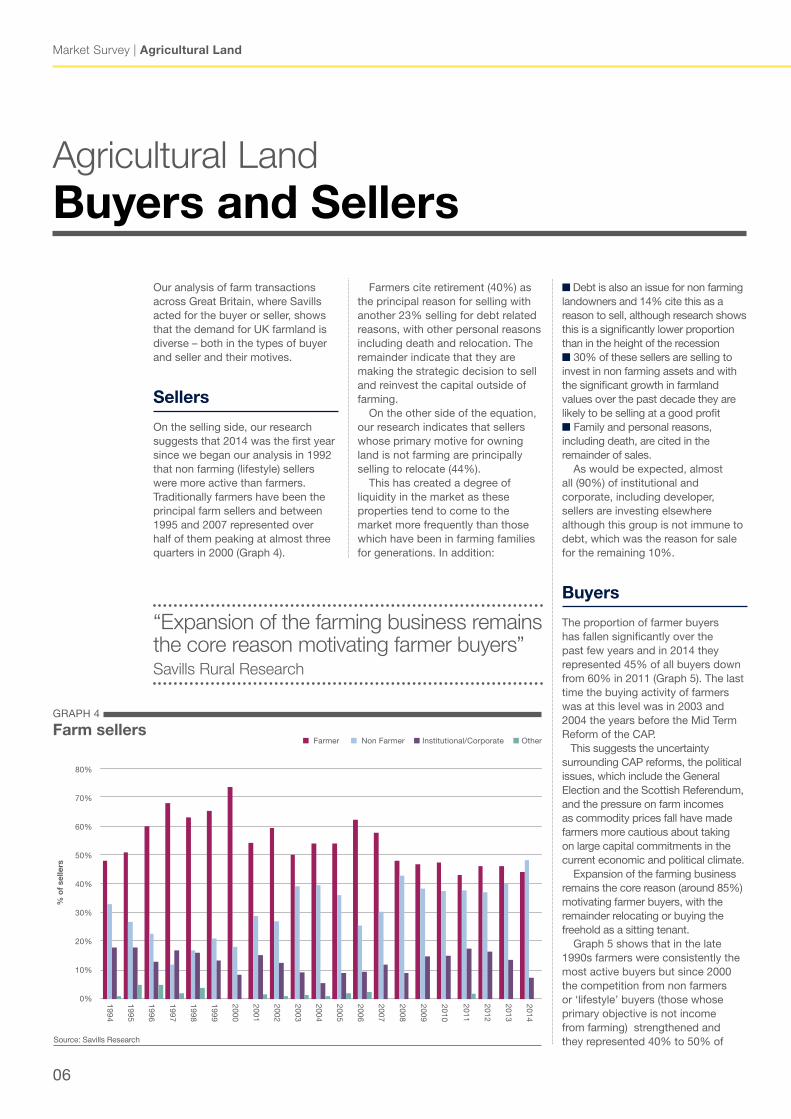
On the selling side, our research suggests that 2014 was the first year since we began our analysis in 1992 that non farming (lifestyle) sellers were more active than farmers. Traditionally farmers have been the principal farm sellers and between 1995 and 2007 represented over half of them peaking at almost three quarters in 2000 (Graph 4).
Farmers cite retirement (40%) as the principal reason for selling with another 23% selling for debt related reasons, with other personal reasons including death and relocation. The remainder indicate that they are making the strategic decision to sell and reinvest the capital outside of farming.
On the other side of the equation, our research indicates that sellers whose primary motive for owning land is not farming are principally selling to relocate (44%).
This has created a degree of liquidity in the market as these properties tend to come to the market more frequently than those which have been in farming families for generations. In addition:
n Debt is also an issue for non farming landowners and 14% cite this as a reason to sell, although research shows this is a significantly lower proportion than in the height of the recession n 30% of these sellers are selling to invest in non farming assets and with the significant growth in farmland values over the past decade they are likely to be selling at a good profit n Family and personal reasons, including death, are cited in the remainder of sales.
As would be expected, almost all (90%) of institutional and corporate, including developer, sellers are investing elsewhere although this group is not immune to debt, which was the reason for sale for the remaining 10%.
Buyers
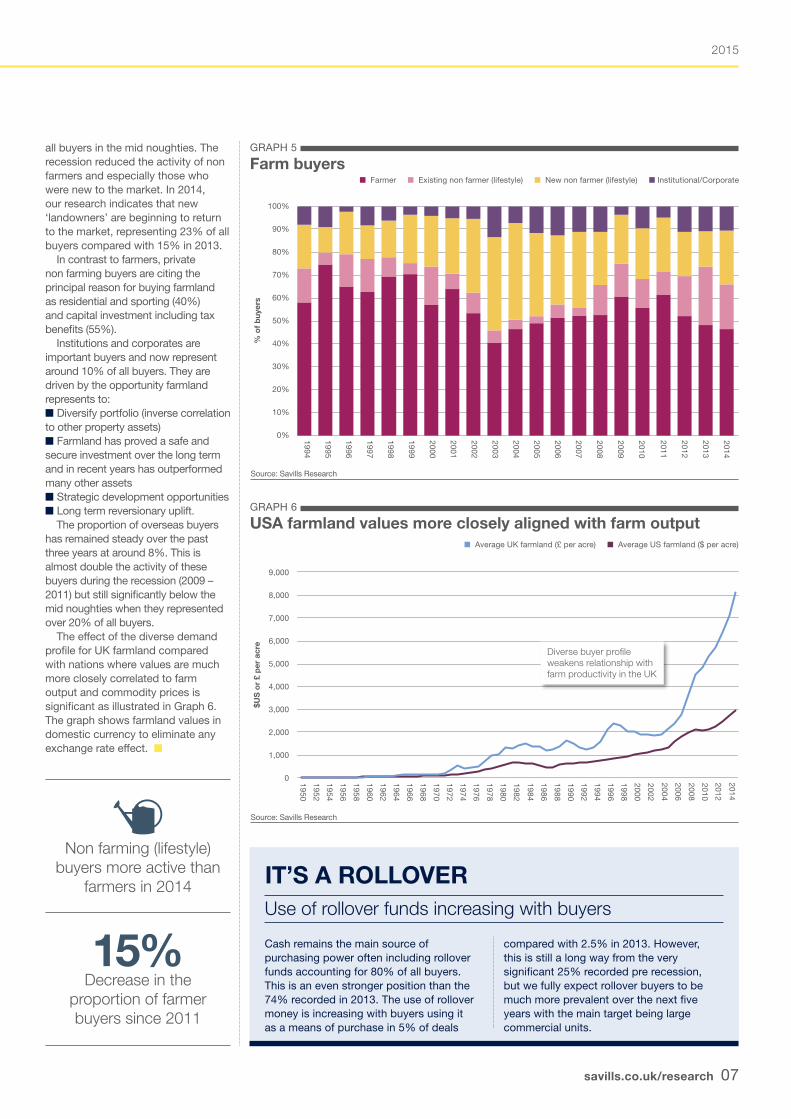
The proportion of farmer buyers has fallen significantly over the past few years and in 2014 they represented 45% of all buyers down from 60% in 2011 (Graph 5). The last time the buying activity of farmers was at this level was in 2003 and 2004 the years before the Mid Term Reform of the CAP. This suggests the uncertainty surrounding CAP reforms, the political issues, which include the General Election and the Scottish Referendum, and the pressure on farm incomes as commodity prices fall have made farmers more cautious about taking on large capital commitments in the current economic and political climate.
Expansion of the farming business remains the core reason (around 85%) motivating farmer buyers, with the remainder relocating or buying the freehold as a sitting tenant.
Graph 5 shows that in the late 1990s farmers were consistently the most active buyers but since 2000 the competition from non farmers or ‘lifestyle’ buyers (those whose primary objective is not income from farming) strengthened and they represented 40% to 50% of
Agricultural LandBuyers and Sellers
GRAPH 4
Farm sellers
Source: Savills Research
“Expansion of the farming business remains the core reason motivating farmer buyers” Savills Rural Research
80%
70%
60%
50%
40%
30%
20%
10%
0%
% o
f se
llers
n Farmer n Non Farmer n Institutional/Corporate n Other
1994
1995
1996
1997
1998
1999
2000
2001
2002
2003
2004
2005
2006
2007
2008
2009
2010
2011
2012
2013
2014
savills.co.uk/research 07
2015
all buyers in the mid noughties. The recession reduced the activity of non farmers and especially those who were new to the market. In 2014, our research indicates that new ‘landowners’ are beginning to return to the market, representing 23% of all buyers compared with 15% in 2013.
In contrast to farmers, private non farming buyers are citing the principal reason for buying farmland as residential and sporting (40%) and capital investment including tax benefits (55%).
Institutions and corporates are important buyers and now represent around 10% of all buyers. They are driven by the opportunity farmland represents to:n Diversify portfolio (inverse correlation to other property assets)n Farmland has proved a safe and secure investment over the long term and in recent years has outperformed many other assetsn Strategic development opportunitiesn Long term reversionary uplift.
The proportion of overseas buyers has remained steady over the past three years at around 8%. This is almost double the activity of these buyers during the recession (2009 – 2011) but still significantly below the mid noughties when they represented over 20% of all buyers.
The effect of the diverse demand profile for UK farmland compared with nations where values are much more closely correlated to farm output and commodity prices is significant as illustrated in Graph 6. The graph shows farmland values in domestic currency to eliminate any exchange rate effect. n
GRAPH 5
Farm buyers
Source: Savills Research
GRAPH 6
USA farmland values more closely aligned with farm output
Source: Savills Research
IT’S A ROLLOVERUse of rollover funds increasing with buyers
Cash remains the main source of purchasing power often including rollover funds accounting for 80% of all buyers. This is an even stronger position than the 74% recorded in 2013. The use of rollover money is increasing with buyers using it as a means of purchase in 5% of deals
compared with 2.5% in 2013. However, this is still a long way from the very significant 25% recorded pre recession, but we fully expect rollover buyers to be much more prevalent over the next five years with the main target being large commercial units.
Non farming (lifestyle) buyers more active than
farmers in 2014
15%Decrease in the
proportion of farmer buyers since 2011
100%
90%
80%
70%
60%
50%
40%
30%
20%
10%
0%
% o
f b
uyer
s
1994
1995
1996
1997
1998
1999
2000
2001
2002
2003
2004
2005
2006
2007
2008
2009
2010
2011
2012
2013
2014
n Farmer n Existing non farmer (lifestyle) n New non farmer (lifestyle) n Institutional/Corporate
9,000
8,000
7,000
6,000
5,000
4,000
3,000
2,000
1,000
0
$US
or
£ p
er a
cre
n Average UK farmland (£ per acre) n Average US farmland ($ per acre)
1950
1952
1954
1956
1958
1960
1962
1964
1966
1968
1970
1972
1974
1976
1978
1980
1982
1984
1986
1988
1990
1992
1994
1996
1998
2000
2002
2004
2006
2008
2010
2012
2014
Diverse buyer profile weakens relationship with farm productivity in the UK
08
Market Survey | Agricultural Land
Strong capital value growth was undoubtedly the key theme of 2014, with growth across all sectors stronger than we were forecasting at the beginning of the year. We expect to see continuing capital value growth across all prime sectors in 2015, albeit at a slower rate.
The general election in May will definitely have some effect on sentiment, though in the agricultural and commercial sectors we expect the effects to be relatively muted. In the residential markets the spectre of mansion tax, combined with the Mortgage Market Review could lead to a more sustained hiatus in capital value growth in 2015.
Generally, we expect that the macroeconomic story for the UK will remain benign, with base rates remaining unchanged until the
second half of the year or possibly 2016, and the combination of low oil prices and recovering incomes giving a boost to the UK consumer.
The high returns that will be thrown off by all property sectors in the UK will continue to attract attention, and we expect that UK real estate will continue to deliver high returns in comparison to other asset classes.
This will mean that domestic and international demand for prime and good secondary assets will be strong, though we expect to see more focus on supply and demand fundamentals in 2015, rather than just the potential for yield shift.
Overall, we expect that 2015 will be another strong year for UK real estate, but investors are going to have to work harder to identify markets and sectors that will deliver high returns.
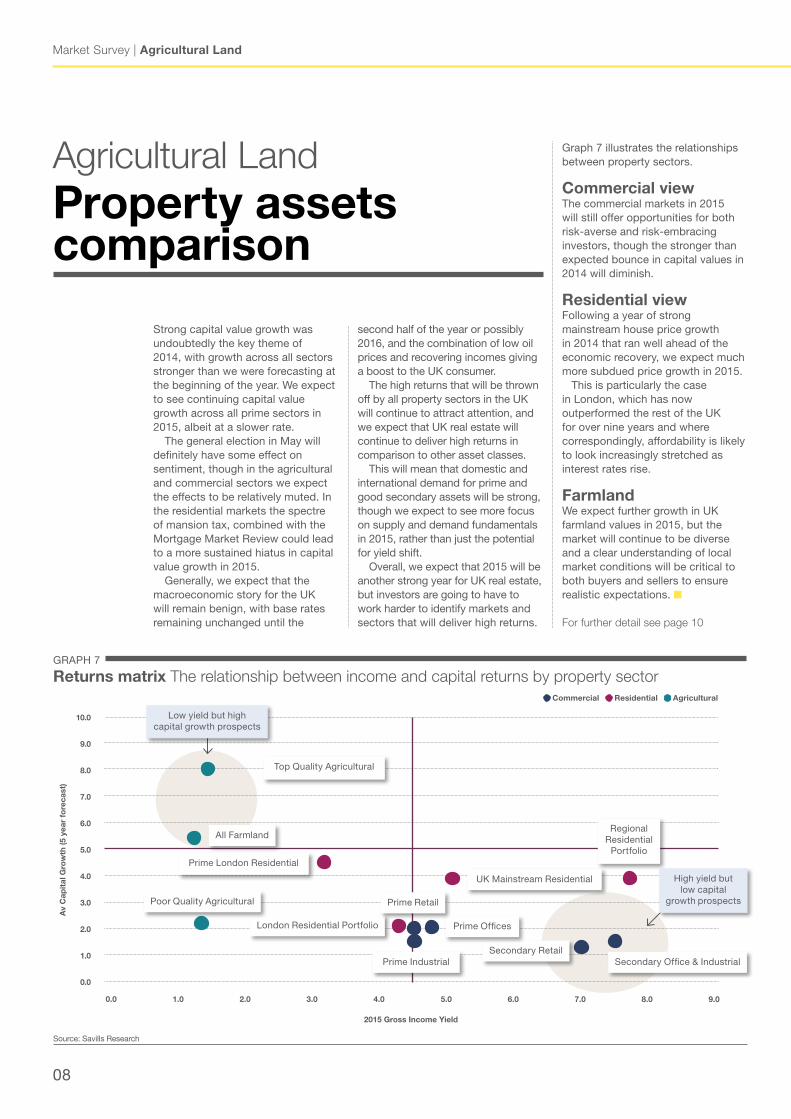
Graph 7 illustrates the relationships between property sectors.
Commercial viewThe commercial markets in 2015 will still offer opportunities for both risk-averse and risk-embracing investors, though the stronger than expected bounce in capital values in 2014 will diminish.
Residential viewFollowing a year of strong mainstream house price growth in 2014 that ran well ahead of the economic recovery, we expect much more subdued price growth in 2015. This is particularly the case in London, which has now outperformed the rest of the UK for over nine years and where correspondingly, affordability is likely to look increasingly stretched as interest rates rise.
FarmlandWe expect further growth in UK farmland values in 2015, but the market will continue to be diverse and a clear understanding of local market conditions will be critical to both buyers and sellers to ensure realistic expectations. n
For further detail see page 10
Agricultural LandProperty assets comparison
GRAPH 7
Returns matrix The relationship between income and capital returns by property sector
Source: Savills Research
2015 Gross Income yield
Av
Cap
ital
Gro
wth
(5 y
ear
fore
cast
)
0.0 1.0 2.0 3.0 4.0 5.0 6.0 7.0 8.0 9.0
10.0
9.0
8.0
7.0
6.0
5.0
4.0
3.0
2.0
1.0
0.0
Commercial Residential Agricultural
Top Quality Agricultural
Prime London Residential
London Residential Portfolio
Poor Quality Agricultural
UK Mainstream Residential
Regional Residential
Portfolio
Secondary Office & IndustrialSecondary Retail
Prime Industrial
Prime Offices
Prime Retail
Low yield but high capital growth prospects
All Farmland
High yield but low capital
growth prospects

savills.co.uk/research 09
2015
Agricultural
n Large quality commercial farms Scale and the opportunity for top quartile income potential whilst owning a tax efficient asset for the transfer of wealth will ensure demand remains strong for these properties.
n Quality rural estates A diverse portfolio of property assets offering good income potential, that is free of commodity price volatility, will continue to be a safe purchase.
n Residential farms These may offer opportunities as the economy improves and especially so where recognised as good value when compared to arable land and where improvements will enhance future value.
Residential
WHAT ARE THE TOP PICKS FOR 2015?Commercial
n London offices and retail Low vacancy rates and strong rental growth prospects support the low yields. Best growth to come in "future core" locations and high quality transport nodes.
n Retail Secondary pitches in prime locations, and London suburbs. Secondary markets with affordable rents to witness rental growth from mid 2015 as housing markets recover.
n Industrial Lack of supply investment stock across the country will see investors move up the risk curve so units let to strong covenants outside of core locations will become attractive.
n London commuter towns The price differential between London and these towns widened further in 2014 and is likely to present opportunities for those looking to upsize without incurring significant additional cost.
n The £750k-£1.5m market Largely unaffected by risks of mansion tax and less dependent on mortgage finance than the mainstream, this market can benefit from those looking to relocate and buy a property below potential tax thresholds.
n 3 bedroom investment stock Increasingly households are renting in later life stages, which enables investors to buy small family housing to bring diversity to their residential investment portfolio.
Market Survey | Agricultural Land
10
OutlookForecasts
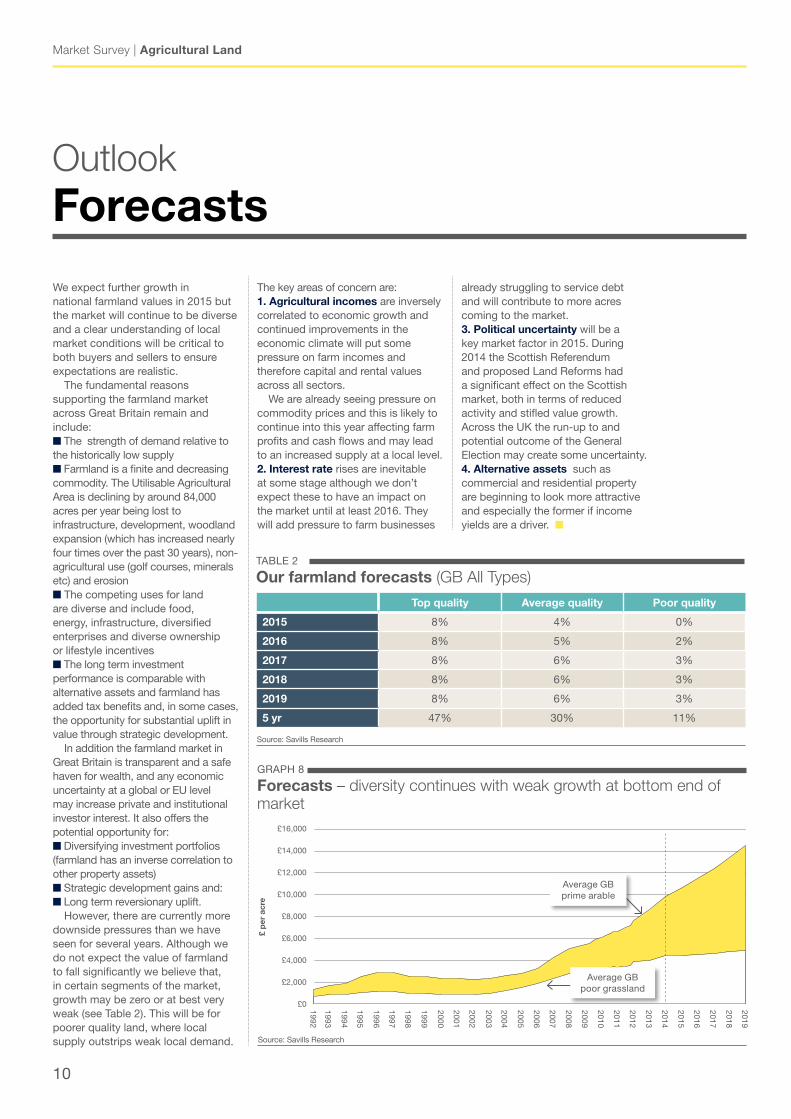
We expect further growth in national farmland values in 2015 but the market will continue to be diverse and a clear understanding of local market conditions will be critical to both buyers and sellers to ensure expectations are realistic.
The fundamental reasons supporting the farmland market across Great Britain remain and include:n The strength of demand relative to the historically low supplyn Farmland is a finite and decreasing commodity. The Utilisable Agricultural Area is declining by around 84,000 acres per year being lost to infrastructure, development, woodland expansion (which has increased nearly four times over the past 30 years), non-agricultural use (golf courses, minerals etc) and erosionn The competing uses for land are diverse and include food, energy, infrastructure, diversified enterprises and diverse ownership or lifestyle incentivesn The long term investment performance is comparable with alternative assets and farmland has added tax benefits and, in some cases, the opportunity for substantial uplift in value through strategic development.
In addition the farmland market in Great Britain is transparent and a safe haven for wealth, and any economic uncertainty at a global or EU level may increase private and institutional investor interest. It also offers the potential opportunity for: n Diversifying investment portfolios (farmland has an inverse correlation to other property assets)n Strategic development gains and: n Long term reversionary uplift.
However, there are currently more downside pressures than we have seen for several years. Although we do not expect the value of farmland to fall significantly we believe that, in certain segments of the market, growth may be zero or at best very weak (see Table 2). This will be for poorer quality land, where local supply outstrips weak local demand.
The key areas of concern are:1. Agricultural incomes are inversely correlated to economic growth and continued improvements in the economic climate will put some pressure on farm incomes and therefore capital and rental values across all sectors.
We are already seeing pressure on commodity prices and this is likely to continue into this year affecting farm profits and cash flows and may lead to an increased supply at a local level. 2. Interest rate rises are inevitable at some stage although we don’t expect these to have an impact on the market until at least 2016. They will add pressure to farm businesses
GRAPH 8
Forecasts – diversity continues with weak growth at bottom end of market
Source: Savills Research
Top quality Average quality Poor quality
2015 8% 4% 0%
2016 8% 5% 2%
2017 8% 6% 3%
2018 8% 6% 3%
2019 8% 6% 3%
5 yr 47% 30% 11%
TABLE 2
Our farmland forecasts (GB All Types)
Source: Savills Research
already struggling to service debt and will contribute to more acres coming to the market. 3. Political uncertainty will be a key market factor in 2015. During 2014 the Scottish Referendum and proposed Land Reforms had a significant effect on the Scottish market, both in terms of reduced activity and stifled value growth. Across the UK the run-up to and potential outcome of the General Election may create some uncertainty.4. Alternative assets such as commercial and residential property are beginning to look more attractive and especially the former if income yields are a driver. n
£16,000
£14,000
£12,000
£10,000
£8,000
£6,000
£4,000
£2,000
£0
£ p
er a
cre
1992
1993
1994
1995
1996
1997
1998
1999
2000
2001
2002
2003
2004
2005
2006
2007
2008
2009
2010
2011
2012
2013
2014
2015
2016
2017
2018
2019
Average GB prime arable
Average GB poor grassland
savills.co.uk/research 011
Date
Savills plcSavills is a leading global real estate service provider listed on the London Stock Exchange. The company, established in 1855, has a rich heritage with unrivalled growth. It is a company that leads rather than follows, and now has over 600 offices and associates throughout the Americas, Europe, Asia Pacific, Africa and the Middle East.
This report is for general informative purposes only. It may not be published, reproduced or quoted in part or in whole, nor may it be used as a basis for any contract, prospectus, agreement or other document without prior consent. Whilst every effort has been made to ensure its accuracy, Savills accepts no liability whatsoever for any direct or consequential loss arising from its use. The content is strictly copyright and reproduction of the whole or part of it in any form is prohibited without written permission from Savills Research.
Savills Farm Agency team Please contact us for further information
EastChristopher miles01603 229 [email protected]
Ian BaileyHead of Rural Research01797 230 [email protected]
midlandsWill Parry01522 508 [email protected]
ScotlandCharles Dudgeon0131 247 [email protected]
NationalAlex Lawson020 7409 [email protected]
SouthDavid Cross01722 426 [email protected]
Central/WestRichard Binning01865 269 [email protected]
South WestPenny Dart01392 455 [email protected]
NorthAndrew Pearce01522 508 [email protected]
WalesDaniel Rees029 2036 [email protected]

33 Margaret StreetLondon W1G 0JD020 7499 8644
savills.co.uk