SUMMARY КРАТКИЙ ОБЗОРhelliphelliphelliphelliphelliphelliphelliphelliphelliphelliphelliphelliphelliphelliphelliphelliphelliphelliphelliphelliphelliphelliphelliphelliphelliphelliphelliphelliphelliphelliphelliphelliphelliphelliphelliphelliphelliphelliphelliphelliphelliphelliphelliphelliphelliphelliphelliphelliphelliphelliphelliphelliphelliphelliphelliphelliphellip MACRO REVIEW МАКРОЭКОНОМИКАhelliphelliphelliphelliphelliphelliphelliphelliphelliphelliphelliphelliphelliphelliphelliphelliphelliphelliphelliphelliphelliphelliphelliphelliphelliphelliphelliphelliphelliphelliphelliphelliphelliphelliphelliphelliphelliphelliphelliphelliphelliphelliphelliphelliphelliphelliphelliphelliphelliphelliphelliphelliphelliphelliphellip CAPITAL MARKETS ИНВЕСТИЦИИhelliphelliphelliphelliphelliphelliphelliphelliphelliphelliphelliphelliphelliphelliphelliphelliphelliphelliphelliphelliphelliphelliphelliphelliphelliphelliphelliphelliphelliphelliphelliphelliphelliphelliphelliphelliphelliphelliphelliphelliphelliphelliphelliphelliphelliphelliphelliphelliphelliphelliphelliphelliphelliphelliphelliphelliphelliphellip RETAIL ТОРГОВАЯ НЕДВИЖИМОСТЬhelliphelliphelliphelliphelliphelliphelliphelliphelliphelliphelliphelliphelliphelliphelliphelliphelliphelliphelliphelliphelliphelliphelliphelliphelliphelliphelliphelliphelliphelliphelliphelliphelliphelliphelliphelliphelliphelliphelliphelliphelliphelliphelliphelliphelliphelliphelliphelliphelliphelliphellip OFFICES ОФИСНАЯ НЕДВИЖИМОСТЬhelliphelliphelliphelliphelliphelliphelliphelliphelliphelliphelliphelliphelliphelliphelliphelliphelliphelliphelliphelliphelliphelliphelliphelliphelliphelliphelliphelliphelliphelliphelliphelliphelliphelliphelliphelliphelliphelliphelliphelliphelliphelliphelliphelliphelliphelliphelliphelliphelliphelliphellip HOSPITALITY ГОСТИНИЧНАЯ НЕДВИЖИМОСТЬhelliphelliphelliphelliphelliphelliphelliphelliphelliphelliphelliphelliphelliphelliphelliphelliphelliphelliphelliphelliphelliphelliphelliphelliphelliphelliphelliphelliphelliphelliphelliphelliphelliphelliphelliphelliphelliphelliphelliphellip WAREHOUSE amp INDUSTRIAL СКЛАДСКАЯ НЕДВИЖИМОСТЬhelliphelliphelliphelliphelliphelliphelliphelliphelliphelliphelliphelliphelliphelliphelliphelliphelliphelliphelliphelliphelliphelliphelliphelliphelliphelliphelliphelliphelliphelliphelliphelliphelliphelliphelliphelliphelliphelliphelliphelliphelliphelliphelliphelliphelliphelliphelliphelliphelliphellip APPENDIX I MOSCOW MARKET INDICATORS ПРИЛОЖЕНИЕ I ИНДИКАТОРЫ РЫНКА МОСКВЫhelliphelliphelliphelliphelliphelliphelliphelliphelliphelliphelliphelliphelliphelliphelliphelliphelliphelliphelliphelliphelliphelliphelliphelliphelliphelliphelliphelliphelliphelliphelliphelliphelliphelliphelliphelliphelliphelliphelliphelliphellip APPENDIX II NOTABLE INVESTMENT TRANSACTIONS IN RUSSIA IN 2013 ПРИЛОЖЕНИЕ II ОСНОВНЫЕ ИНВЕСТИЦИОННЫЕ СДЕЛКИ В РОССИИ В 2012 - 2013 Гhelliphelliphelliphelliphelliphelliphelliphelliphelliphelliphelliphelliphelliphelliphelliphelliphelliphelliphelliphelliphelliphelliphelliphellip APPENDIX III PROPERTY MARKET INDICATORS IN KEY EUROPEAN MARKETS ПРИЛОЖЕНИЕ III ИНДИКАТОРЫ РЫНКА НЕДВИЖИМОСТИ В НЕКОТОРЫХ СТРАНАХ ЕВРОПЫhelliphelliphelliphelliphelliphelliphelliphelliphelliphelliphelliphelliphelliphelliphelliphelliphelliphelliphelliphellip
In Q3 Russian economy entered stagnation phase Government admitted lower than expected GDP growth at less than 2 IMF also reviewed its outlook for Russian economy down to 18 So far Russia is still ahead of Eurozone with its 03 growth rate but is way below other BRIC partners and even USA with their 25
Business in Russia is facing new challenge Until now there were either periods of fast growth or decline Similar growth rates were usual for late USSR Government officials admit that 2013 will be the slowest year in all modern history
Economy is supported primarily by consumer market which is fuelled by increase of pensions and salaries in public sector Retail trade turnover is growing at about 4 - much faster than economy in general Shopping centers footfall is similar to last year
However rental rates are still solid and year on year growth across sectors is expected at 6 which is similar to inflation levels
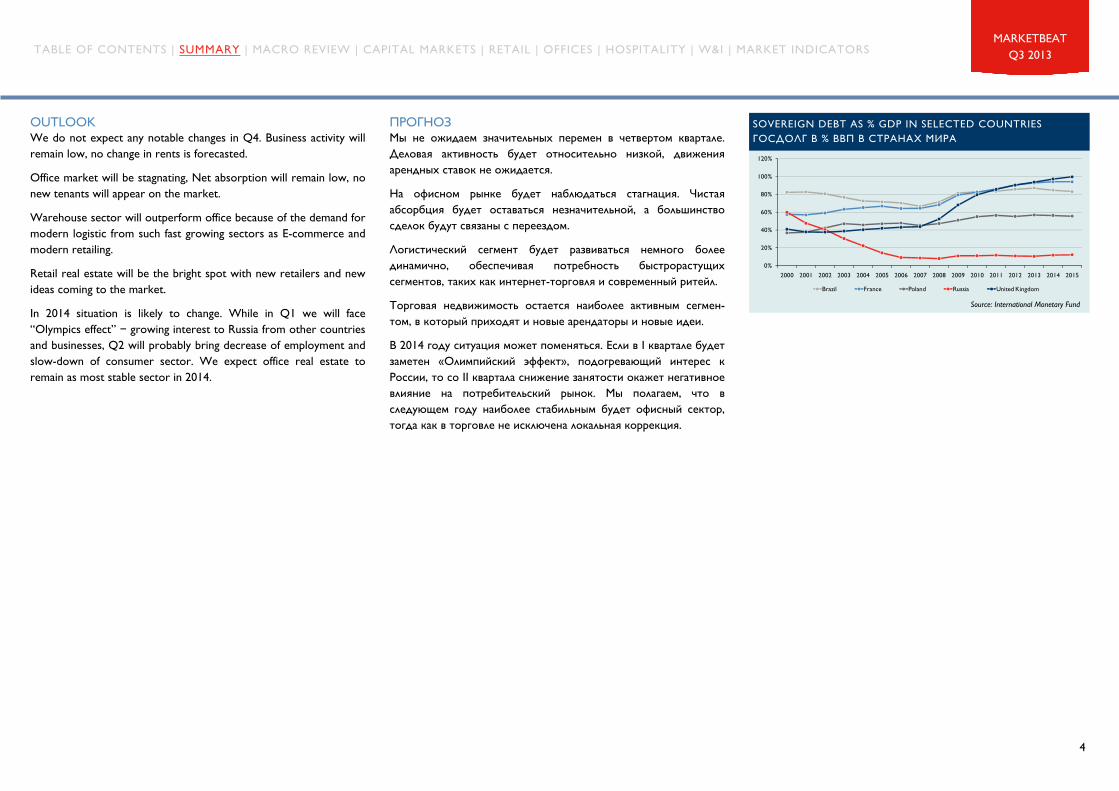
OUTLOOK We do not expect any notable changes in Q4 Business activity will remain low no change in rents is forecasted
Office market will be stagnating Net absorption will remain low no new tenants will appear on the market
Warehouse sector will outperform office because of the demand for modern logistic from such fast growing sectors as E-commerce and modern retailing
Retail real estate will be the bright spot with new retailers and new ideas coming to the market
In 2014 situation is likely to change While in Q1 we will face ldquoOlympics effectrdquo - growing interest to Russia from other countries and businesses Q2 will probably bring decrease of employment and slow-down of consumer sector We expect office real estate to remain as most stable sector in 2014
IumlETHIcircAtildeIacuteIcircCcedil Мы не ожидаем значительных перемен в четвертом квартале Деловая активность будет относительно низкой движения арендных ставок не ожидается
На офисном рынке будет наблюдаться стагнация Чистая абсорбция будет оставаться незначительной а большинство сделок будут связаны с переездом
Логистический сегмент будет развиваться немного более динамично обеспечивая потребность быстрорастущих сегментов таких как интернет-торговля и современный ритейл
Торговая недвижимость остается наиболее активным сегмен-том в который приходят и новые арендаторы и новые идеи
В 2014 году ситуация может поменяться Если в I квартале будет заметен laquoОлимпийский эффектraquo подогревающий интерес к России то со II квартала снижение занятости окажет негативное влияние на потребительский рынок Мы полагаем что в следующем году наиболее стабильным будет офисный сектор тогда как в торговле не исключена локальная коррекция
SOVEREIGN DEBT AS GDP IN SELECTED COUNTRIES ГОСДОЛГ В ВВП В СТРАНАХ МИРА
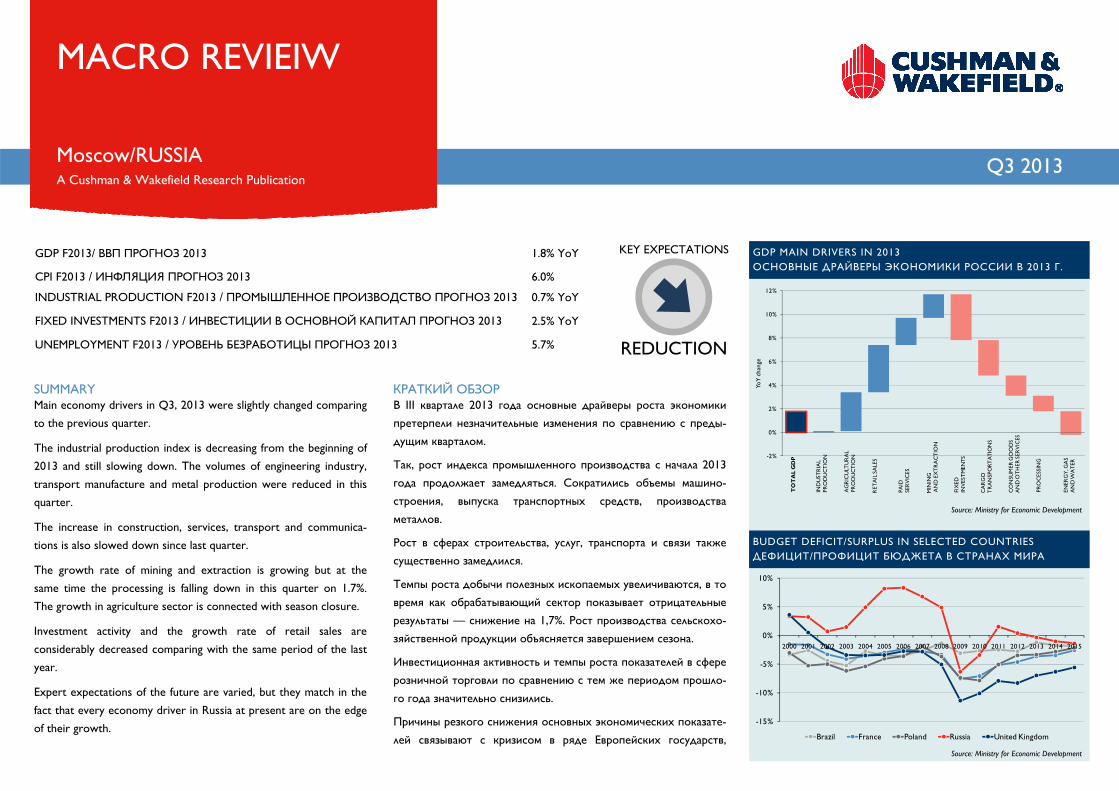
EcircETHAgraveOgraveEcircEgraveEacute IcircAacuteCcedilIcircETH В III квартале 2013 года основные драйверы роста экономики претерпели незначительные изменения по сравнению с преды-дущим кварталом
Так рост индекса промышленного производства с начала 2013 года продолжает замедляться Сократились объемы машино-строения выпуска транспортных средств производства металлов
Рост в сферах строительства услуг транспорта и связи также существенно замедлился
Темпы роста добычи полезных ископаемых увеличиваются в то время как обрабатывающий сектор показывает отрицательные результаты mdash снижение на 17 Рост производства сельскохо-зяйственной продукции объясняется завершением сезона
Инвестиционная активность и темпы роста показателей в сфере розничной торговли по сравнению с тем же периодом прошло-го года значительно снизились
Причины резкого снижения основных экономических показате-лей связывают с кризисом в ряде Европейских государств
Source Ministry for Economic Development
Source Ministry for Economic Development
SUMMARY Main economy drivers in Q3 2013 were slightly changed comparing to the previous quarter
The industrial production index is decreasing from the beginning of 2013 and still slowing down The volumes of engineering industry transport manufacture and metal production were reduced in this quarter
The increase in construction services transport and communica-tions is also slowed down since last quarter
The growth rate of mining and extraction is growing but at the same time the processing is falling down in this quarter on 17 The growth in agriculture sector is connected with season closure
Investment activity and the growth rate of retail sales are considerably decreased comparing with the same period of the last year
Expert expectations of the future are varied but they match in the fact that every economy driver in Russia at present are on the edge of their growth
BUDGET DEFICITSURPLUS IN SELECTED COUNTRIES ДЕФИЦИТПРОФИЦИТ БЮДЖЕТА В СТРАНАХ МИРА
MINISTRY FOR ECONOMIC DEVELOPMENT URALSIB CAPITAL RENAISSANCE CAPITALROSSTATS ACTUAL
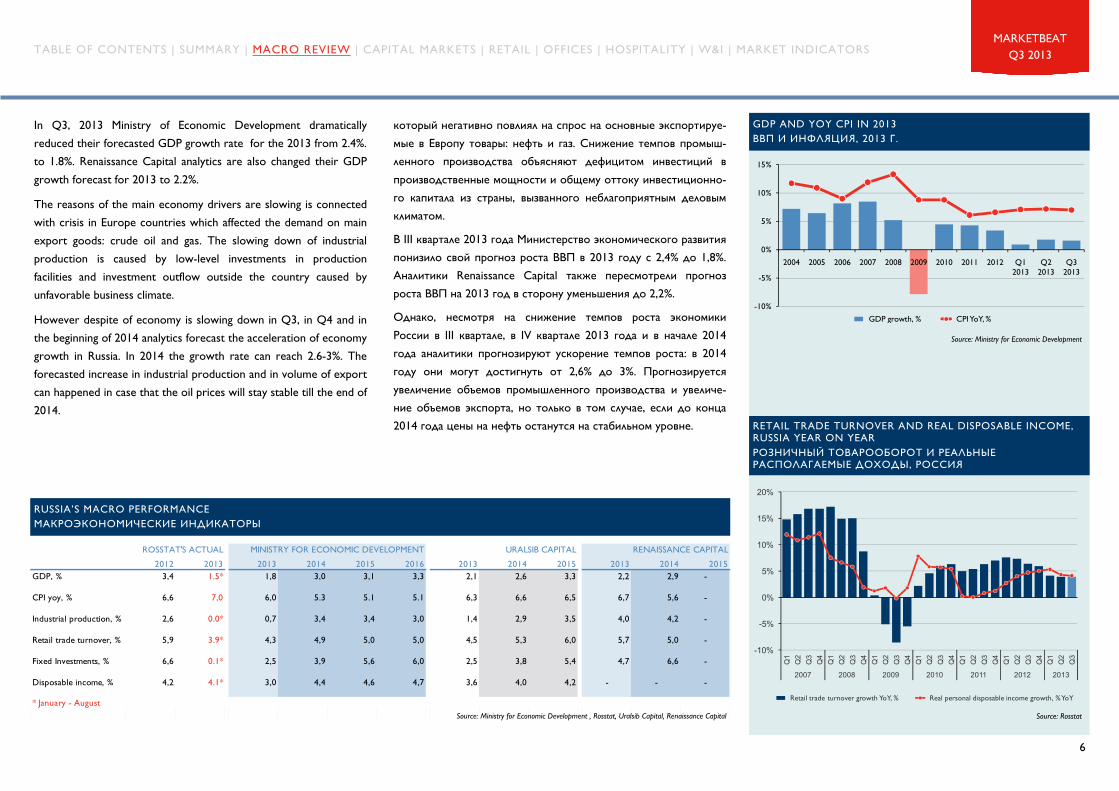
который негативно повлиял на спрос на основные экспортируе-мые в Европу товары нефть и газ Снижение темпов промыш-ленного производства объясняют дефицитом инвестиций в производственные мощности и общему оттоку инвестиционно-го капитала из страны вызванного неблагоприятным деловым климатом
В III квартале 2013 года Министерство экономического развития понизило свой прогноз роста ВВП в 2013 году с 24 до 18 Аналитики Renaissance Capital также пересмотрели прогноз роста ВВП на 2013 год в сторону уменьшения до 22
Однако несмотря на снижение темпов роста экономики России в III квартале в IV квартале 2013 года и в начале 2014 года аналитики прогнозируют ускорение темпов роста в 2014 году они могут достигнуть от 26 до 3 Прогнозируется увеличение объемов промышленного производства и увеличе-ние объемов экспорта но только в том случае если до конца 2014 года цены на нефть останутся на стабильном уровне
In Q3 2013 Ministry of Economic Development dramatically reduced their forecasted GDP growth rate for the 2013 from 24 to 18 Renaissance Capital analytics are also changed their GDP growth forecast for 2013 to 22
The reasons of the main economy drivers are slowing is connected with crisis in Europe countries which affected the demand on main export goods crude oil and gas The slowing down of industrial production is caused by low-level investments in production facilities and investment outflow outside the country caused by unfavorable business climate
However despite of economy is slowing down in Q3 in Q4 and in the beginning of 2014 analytics forecast the acceleration of economy growth in Russia In 2014 the growth rate can reach 26-3 The forecasted increase in industrial production and in volume of export can happened in case that the oil prices will stay stable till the end of 2014
GDP AND YOY CPI IN 2013 ВВП И ИНФЛЯЦИЯ 2013 Г
Source Ministry for Economic Development
Source Ministry for Economic Development Rosstat Uralsib Capital Renaissance Capital
Q3 2013 MoscowRUSSIA A Cushman amp Wakefield Research Publication
CAPITAL MARKETS
Source Cushman amp Wakefield
TOTAL INVESTMENTS BY SECTOR ИНВЕСТИЦИИ ПО СЕКТОРАМ
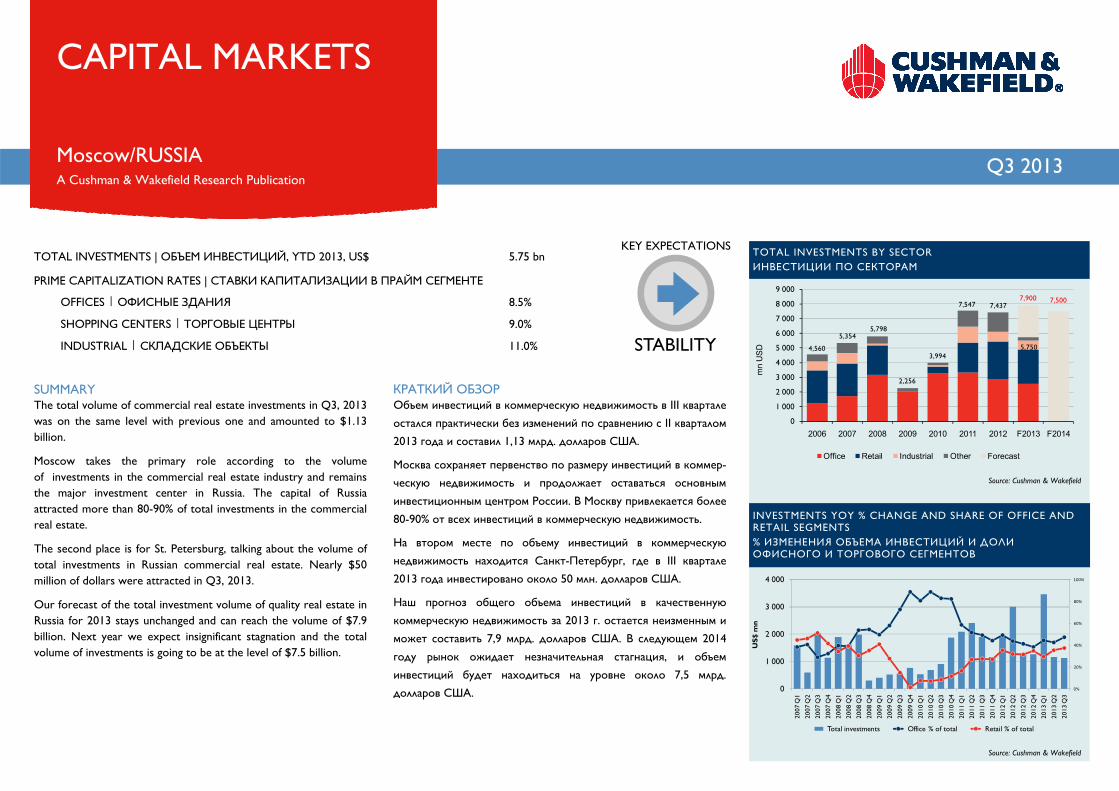
EcircETHAgraveOgraveEcircEgraveEacute IcircAacuteCcedilIcircETH Объем инвестиций в коммерческую недвижимость в III квартале остался практически без изменений по сравнению с II кварталом 2013 года и составил 113 млрд долларов США
Москва сохраняет первенство по размеру инвестиций в коммер-ческую недвижимость и продолжает оставаться основным инвестиционным центром России В Москву привлекается более 80-90 от всех инвестиций в коммерческую недвижимость
На втором месте по объему инвестиций в коммерческую недвижимость находится Санкт-Петербург где в III квартале 2013 года инвестировано около 50 млн долларов США
Наш прогноз общего объема инвестиций в качественную коммерческую недвижимость за 2013 г остается неизменным и может составить 79 млрд долларов США В следующем 2014 году рынок ожидает незначительная стагнация и объем инвестиций будет находиться на уровне около 75 млрд долларов США
Source Cushman amp Wakefield
TOTAL INVESTMENTS | IcircAacuteUacuteAringIgrave EgraveIacuteAcircAringNtildeOgraveEgraveOumlEgraveEacute YTD 2013 US$ 575 bn
PRIME CAPITALIZATION RATES | NtildeOgraveAgraveAcircEcircEgrave EcircAgraveIumlEgraveOgraveAgraveEumlEgraveCcedilAgraveOumlEgraveEgrave Acirc IumlETHAgraveEacuteIgrave NtildeAringAtildeIgraveAringIacuteOgraveAring
INVESTMENTS YOY CHANGE AND SHARE OF OFFICE AND RETAIL SEGMENTS ИЗМЕНЕНИЯ ОБЪЕМА ИНВЕСТИЦИЙ И ДОЛИ ОФИСНОГО И ТОРГОВОГО СЕГМЕНТОВ
SUMMARY The total volume of commercial real estate investments in Q3 2013 was on the same level with previous one and amounted to $113 billion
Moscow takes the primary role according to the volume of investments in the commercial real estate industry and remains the major investment center in Russia The capital of Russia attracted more than 80-90 of total investments in the commercial real estate
The second place is for St Petersburg talking about the volume of total investments in Russian commercial real estate Nearly $50 million of dollars were attracted in Q3 2013
Our forecast of the total investment volume of quality real estate in Russia for 2013 stays unchanged and can reach the volume of $79 billion Next year we expect insignificant stagnation and the total volume of investments is going to be at the level of $75 billion
0
1 000
2 000
3 000
4 000
5 000
6 000
7 000
8 000
9 000
2006 2007 2008 2009 2010 2011 2012 F2013 F2014
mn
USD
Office Retail Industrial Other Forecast
4560
53545798
2256
3994
7547 74377900
5750
7500
0
20
40
60
80
100
0
1 000
2 000
3 000
4 000
2007
Q1
2007
Q2
2007
Q3
2007
Q4
2008
Q1
2008
Q2
2008
Q3
2008
Q4
2009
Q1
2009
Q2
2009
Q3
2009
Q4
2010
Q1
2010
Q2
2010
Q3
2010
Q4
2011
Q1
2011
Q2
2011
Q3
2011
Q4
2012
Q1
2012
Q2
2012
Q3
2012
Q4
2013
Q1
2013
Q2
2013
Q3
US
$ m
n
Total investments Office of total Retail of total
KEY EXPECTATIONS
STABILITY
8
MARKETBEAT Q3 2013
IcircNtildeIacuteIcircAcircIacuteUcircAring IumlIcircEumlIcircAEligAringIacuteEgraveszlig В регионах доля качественных проектов коммерческой недви-жимости в настоящее время крайне мала инвесторы в большей степени заинтересованы в laquoгородах-миллионникахraquo где рынок коммерческой недвижимости наиболее развит
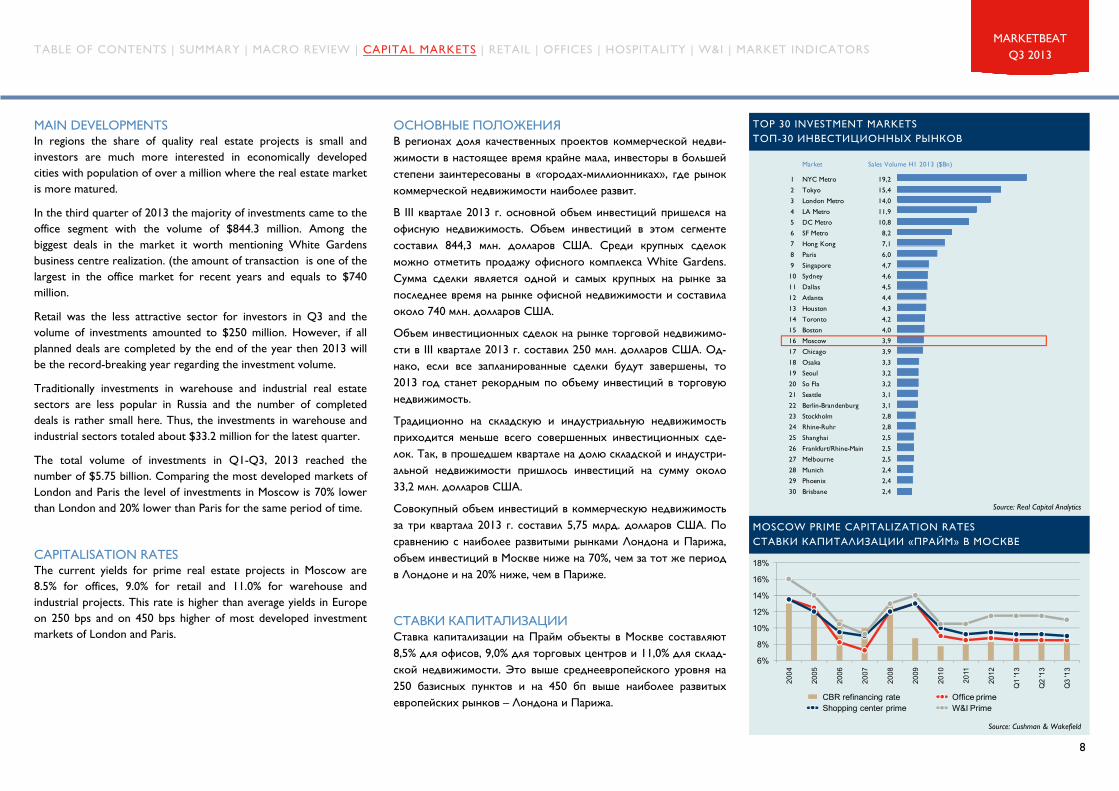
В III квартале 2013 г основной объем инвестиций пришелся на офисную недвижимость Объем инвестиций в этом сегменте составил 8443 млн долларов США Среди крупных сделок можно отметить продажу офисного комплекса White Gardens Сумма сделки является одной и самых крупных на рынке за последнее время на рынке офисной недвижимости и составила около 740 млн долларов США
Объем инвестиционных сделок на рынке торговой недвижимо-сти в III квартале 2013 г составил 250 млн долларов США Од-нако если все запланированные сделки будут завершены то 2013 год станет рекордным по объему инвестиций в торговую недвижимость
Традиционно на складскую и индустриальную недвижимость приходится меньше всего совершенных инвестиционных сде-лок Так в прошедшем квартале на долю складской и индустри-альной недвижимости пришлось инвестиций на сумму около 332 млн долларов США
Совокупный объем инвестиций в коммерческую недвижимость за три квартала 2013 г составил 575 млрд долларов США По сравнению с наиболее развитыми рынками Лондона и Парижа объем инвестиций в Москве ниже на 70 чем за тот же период в Лондоне и на 20 ниже чем в Париже
NtildeOgraveAgraveAcircEcircEgrave EcircAgraveIumlEgraveOgraveAgraveEumlEgraveCcedilAgraveOumlEgraveEgrave Ставка капитализации на Прайм объекты в Москве составляют 85 для офисов 90 для торговых центров и 110 для склад-ской недвижимости Это выше среднеевропейского уровня на 250 базисных пунктов и на 450 бп выше наиболее развитых европейских рынков ndash Лондона и Парижа
TOP 30 INVESTMENT MARKETS ТОП-30 ИНВЕСТИЦИОННЫХ РЫНКОВ
MOSCOW PRIME CAPITALIZATION RATES СТАВКИ КАПИТАЛИЗАЦИИ laquoПРАЙМraquo В МОСКВЕ
Source Cushman amp Wakefield
MAIN DEVELOPMENTS In regions the share of quality real estate projects is small and investors are much more interested in economically developed cities with population of over a million where the real estate market is more matured
In the third quarter of 2013 the majority of investments came to the office segment with the volume of $8443 million Among the biggest deals in the market it worth mentioning White Gardens business centre realization (the amount of transaction is one of the largest in the office market for recent years and equals to $740 million
Retail was the less attractive sector for investors in Q3 and the volume of investments amounted to $250 million However if all planned deals are completed by the end of the year then 2013 will be the record-breaking year regarding the investment volume
Traditionally investments in warehouse and industrial real estate sectors are less popular in Russia and the number of completed deals is rather small here Thus the investments in warehouse and industrial sectors totaled about $332 million for the latest quarter
The total volume of investments in Q1-Q3 2013 reached the number of $575 billion Comparing the most developed markets of London and Paris the level of investments in Moscow is 70 lower than London and 20 lower than Paris for the same period of time
CAPITALISATION RATES The current yields for prime real estate projects in Moscow are 85 for offices 90 for retail and 110 for warehouse and industrial projects This rate is higher than average yields in Europe on 250 bps and on 450 bps higher of most developed investment markets of London and Paris
1 NYC Metro 1922 Tokyo 1543 London Metro 1404 LA Metro 1195 DC Metro 1086 SF Metro 827 Hong Kong 718 Paris 609 Singapore 4710 Sydney 4611 Dallas 4512 Atlanta 4413 Houston 4314 Toronto 4215 Boston 4016 Moscow 3917 Chicago 3918 Osaka 3319 Seoul 3220 So Fla 3221 Seattle 3122 Berlin-Brandenburg 3123 Stockholm 2824 Rhine-Ruhr 2825 Shanghai 2526 FrankfurtRhine-Main 2527 Melbourne 2528 Munich 2429 Phoenix 2430 Brisbane 24
6
8
10
12
14
16
18
2004
2005
2006
2007
2008
2009
2010
2011
2012
Q1
13
Q2
13
Q3
13
CBR refinancing rate Office primeShopping center prime WampI Prime
9
MARKETBEAT Q3 2013
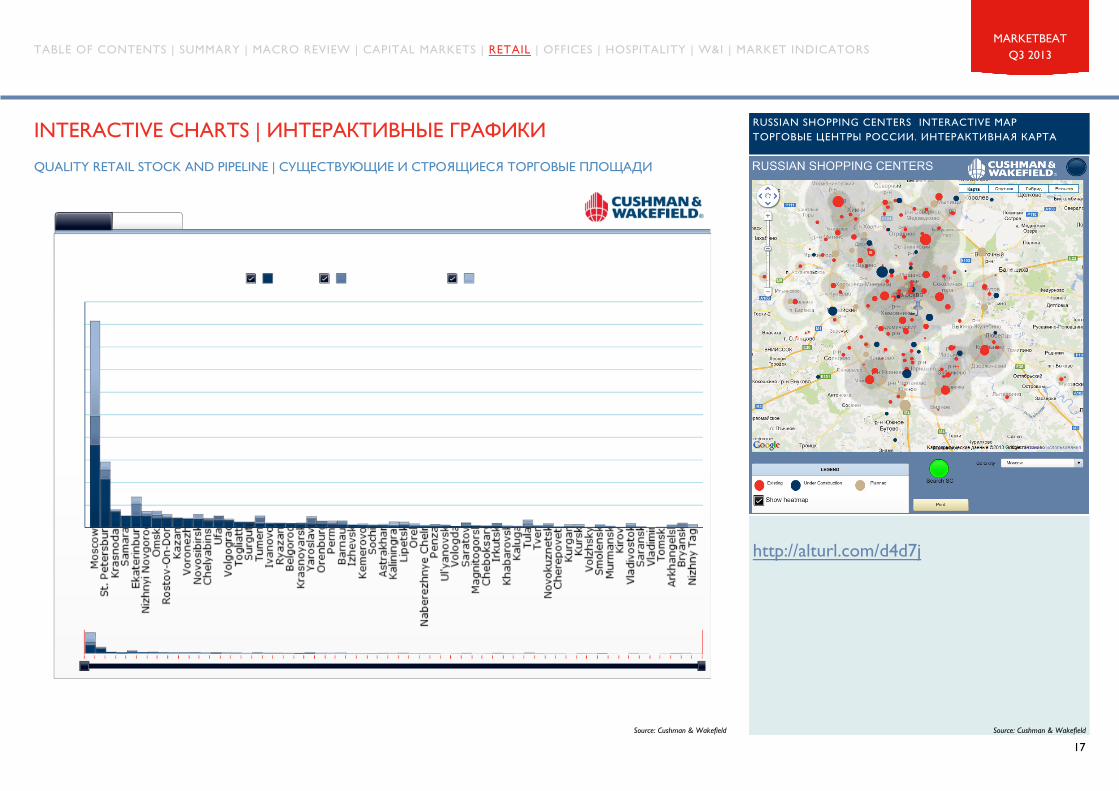
INTERACTIVE CHARTS I EgraveIacuteOgraveAringETHAgraveEcircOgraveEgraveAcircIacuteUcircAring AtildeETHAgraveOcircEgraveEcircEgrave
RUSSIAN PROPERTY INVESTMENT MARKET I EgraveIacuteAcircAringNtildeOgraveEgraveOumlEgraveEgrave Acirc EcircIcircIgraveIgraveAringETHtimesAringNtildeEcircOacuteTHORN IacuteAringAumlAcircEgraveAEligEgraveIgraveIcircNtildeOgraveUuml ETHIcircNtildeNtildeEgraveEgrave
Q3 2013 MoscowRUSSIA A Cushman amp Wakefield Research Publication
RETAIL
Source Rosstat
RETAIL TRADE TURNOVER AND REAL DISPOSABLE INCOME RUSSIA YOY РОЗНИЧНЫЙ ТОВАРООБОРОТ И РЕАЛЬНЫЕ РАСПОЛАГАЕМЫЕ ДОХОДЫ РОССИЯ
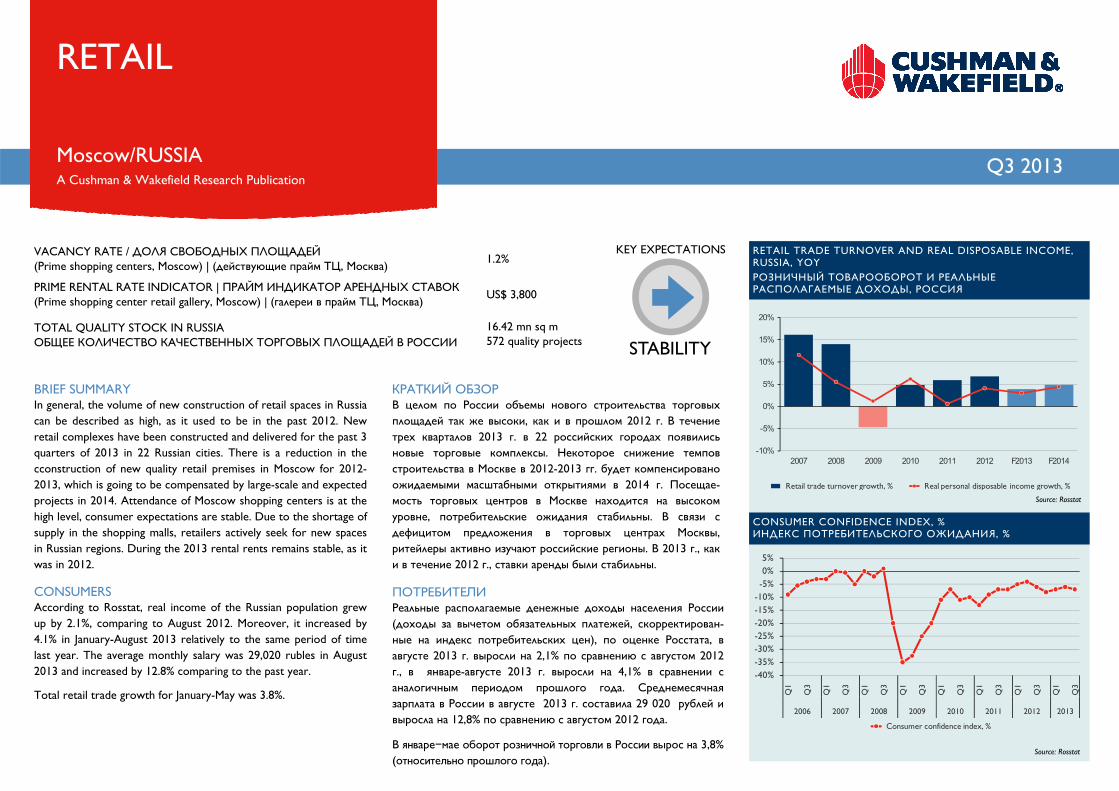
EcircETHAgraveOgraveEcircEgraveEacute IcircAacuteCcedilIcircETH В целом по России объемы нового строительства торговых площадей так же высоки как и в прошлом 2012 г В течение трех кварталов 2013 г в 22 российских городах появились новые торговые комплексы Некоторое снижение темпов строительства в Москве в 2012-2013 гг будет компенсировано ожидаемыми масштабными открытиями в 2014 г Посещае-мость торговых центров в Москве находится на высоком уровне потребительские ожидания стабильны В связи с дефицитом предложения в торговых центрах Москвы ритейлеры активно изучают российские регионы В 2013 г как и в течение 2012 г ставки аренды были стабильны
CONSUMER CONFIDENCE INDEX ИНДЕКС ПОТРЕБИТЕЛЬСКОГО ОЖИДАНИЯ
IumlIcircOgraveETHAringAacuteEgraveOgraveAringEumlEgrave Реальные располагаемые денежные доходы населения России (доходы за вычетом обязательных платежей скорректирован-ные на индекс потребительских цен) по оценке Росстата в августе 2013 г выросли на 21 по сравнению с августом 2012 г в январе-августе 2013 г выросли на 41 в сравнении с аналогичным периодом прошлого года Среднемесячная зарплата в России в августе 2013 г составила 29 020 рублей и выросла на 128 по сравнению с августом 2012 года
BRIEF SUMMARY In general the volume of new construction of retail spaces in Russia can be described as high as it used to be in the past 2012 New retail complexes have been constructed and delivered for the past 3 quarters of 2013 in 22 Russian cities There is a reduction in the сconstruction of new quality retail premises in Moscow for 2012-2013 which is going to be compensated by large-scale and expected projects in 2014 Attendance of Moscow shopping centers is at the high level consumer expectations are stable Due to the shortage of supply in the shopping malls retailers actively seek for new spaces in Russian regions During the 2013 rental rents remains stable as it was in 2012
CONSUMERS According to Rosstat real income of the Russian population grew up by 21 comparing to August 2012 Moreover it increased by 41 in January-August 2013 relatively to the same period of time last year The average monthly salary was 29020 rubles in August 2013 and increased by 128 comparing to the past year
Total retail trade growth for January-May was 38
Source Rosstat
VACANCY RATE ДОЛЯ СВОБОДНЫХ ПЛОЩАДЕЙ (Prime shopping centers Moscow) | (действующие прайм ТЦ Москва) 12
PRIME RENTAL RATE INDICATOR | ПРАЙМ ИНДИКАТОР АРЕНДНЫХ СТАВОК (Prime shopping center retail gallery Moscow) | (галереи в прайм ТЦ Москва) US$ 3800
1642 mn sq m 572 quality projects
TOTAL QUALITY STOCK IN RUSSIA ОБЩЕЕ КОЛИЧЕСТВО КАЧЕСТВЕННЫХ ТОРГОВЫХ ПЛОЩАДЕЙ В РОССИИ
KEY EXPECTATIONS
STABILITY
-10
-5
0
5
10
15
20
2007 2008 2009 2010 2011 2012 F2013 F2014
Retail trade turnover growth Real personal disposable income growth
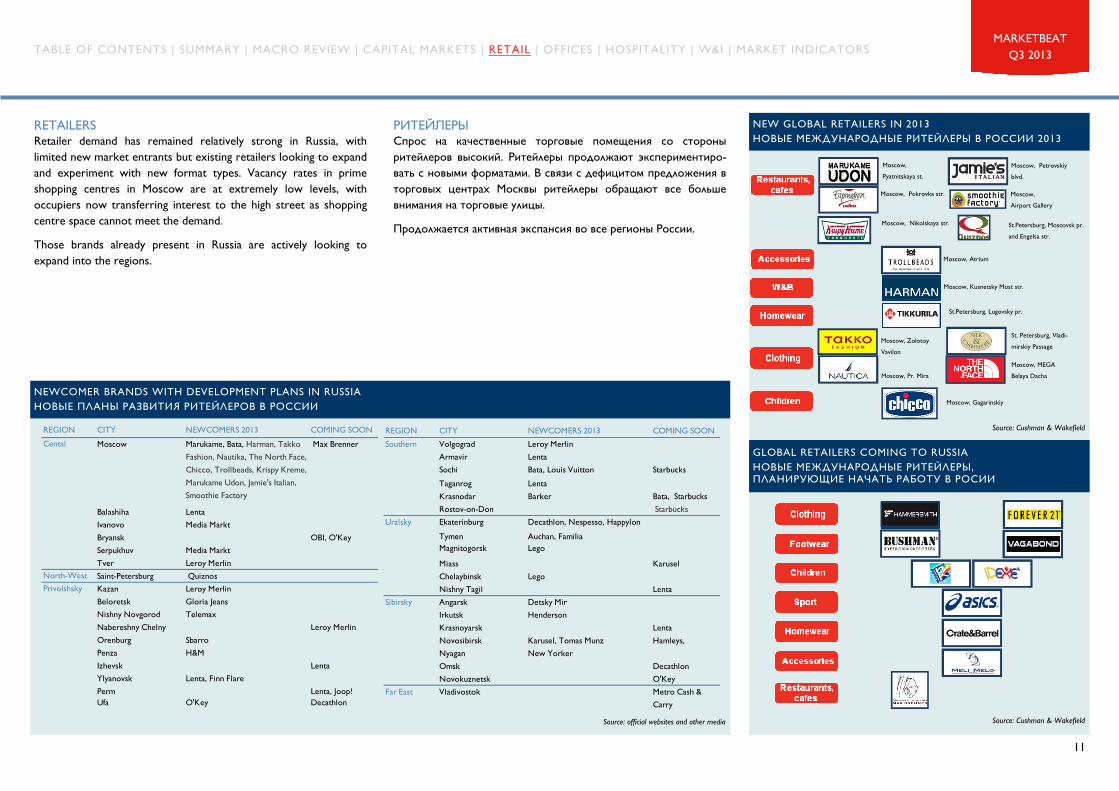
RETAILERS Retailer demand has remained relatively strong in Russia with limited new market entrants but existing retailers looking to expand and experiment with new format types Vacancy rates in prime shopping centres in Moscow are at extremely low levels with occupiers now transferring interest to the high street as shopping centre space cannot meet the demand
Those brands already present in Russia are actively looking to expand into the regions
NEWCOMER BRANDS WITH DEVELOPMENT PLANS IN RUSSIA НОВЫЕ ПЛАНЫ РАЗВИТИЯ РИТЕЙЛЕРОВ В РОССИИ
Source official websites and other media
REGION CITY NEWCOMERS 2013 COMING SOONSouthern Volgograd Leroy Merlin
Armavir LentaSochi Bata Louis Vuitton StarbucksTaganrog LentaKrasnodar Barker Bata StarbucksRostov-on-Don Starbucks
ETHEgraveOgraveAringEacuteEumlAringETHUcirc Спрос на качественные торговые помещения со стороны ритейлеров высокий Ритейлеры продолжают экспериментиро-вать с новыми форматами В связи с дефицитом предложения в торговых центрах Москвы ритейлеры обращают все больше внимания на торговые улицы
Продолжается активная экспансия во все регионы России
GLOBAL RETAILERS COMING TO RUSSIA НОВЫЕ МЕЖДУНАРОДНЫЕ РИТЕЙЛЕРЫ ПЛАНИРУЮЩИЕ НАЧАТЬ РАБОТУ В РОСИИ
NEW GLOBAL RETAILERS IN 2013 НОВЫЕ МЕЖДУНАРОДНЫЕ РИТЕЙЛЕРЫ В РОССИИ 2013
CushmanampWakefield Research quarterly monitoring of 9 quality shopping centers (total GLA - 05 mn sq m) These shopping centers have been opened more than one year ago and have a clear catchment area
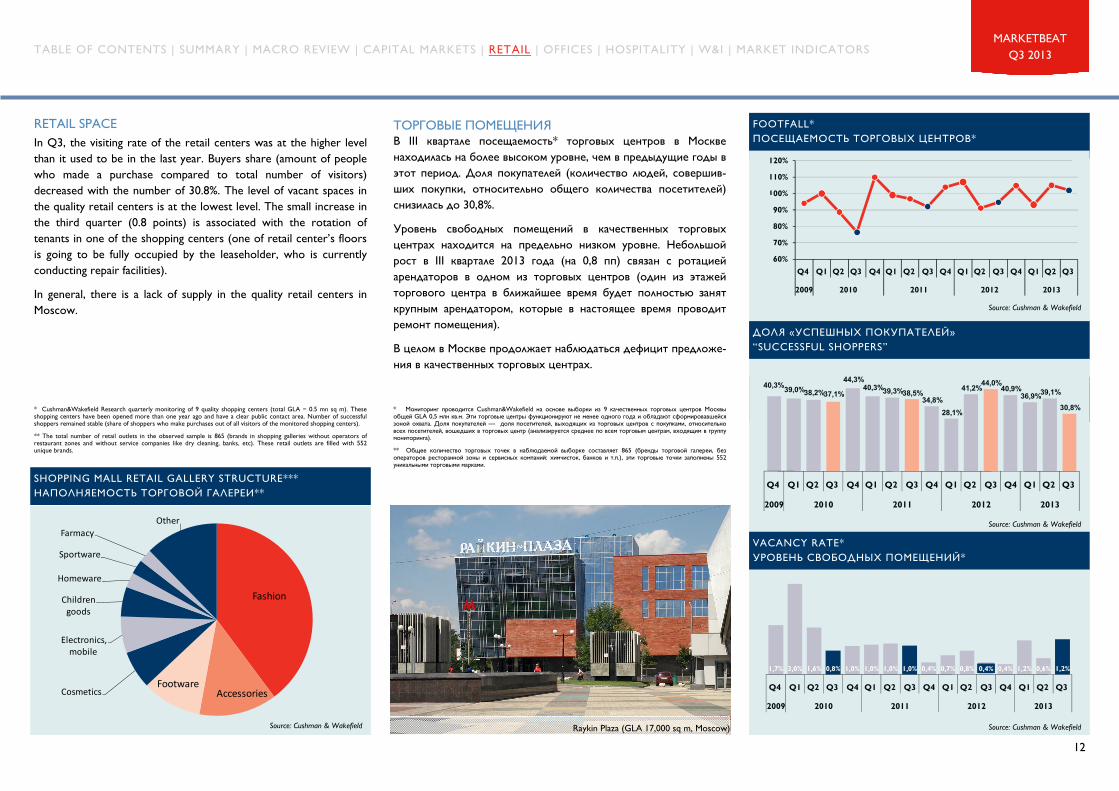
OgraveIcircETHAtildeIcircAcircUcircAring IumlIcircIgraveAringUgraveAringIacuteEgraveszlig В III квартале посещаемость торговых центров в Москве находилась на более высоком уровне чем в предыдущие годы в этот период Доля покупателей (количество людей совершив-ших покупки относительно общего количества посетителей) снизилась до 308
Уровень свободных помещений в качественных торговых центрах находится на предельно низком уровне Небольшой рост в III квартале 2013 года (на 08 пп) связан с ротацией арендаторов в одном из торговых центров (один из этажей торгового центра в ближайшее время будет полностью занят крупным арендатором которые в настоящее время проводит ремонт помещения)
В целом в Москве продолжает наблюдаться дефицит предложе-ния в качественных торговых центрах
ДОЛЯ laquoУСПЕШНЫХ ПОКУПАТЕЛЕЙraquo ldquoSUCCESSFUL SHOPPERSrdquo
FOOTFALL ПОСЕЩАЕМОСТЬ ТОРГОВЫХ ЦЕНТРОВ
Source Cushman amp Wakefield
Source Cushman amp Wakefield
Source Cushman amp Wakefield
CushmanampWakefield Research quarterly monitoring of 9 quality shopping centers (total GLA - 05 mn sq m) These shopping centers have been opened more than one year ago and have a clear public contact area Number of successful shoppers remained stable (share of shoppers who make purchases out of all visitors of the monitored shopping centers)
The total number of retail outlets in the observed sample is 865 (brands in shopping galleries without operators of restaurant zones and without service companies like dry cleaning banks etc) These retail outlets are filled with 552 unique brands
VACANCY RATE УРОВЕНЬ СВОБОДНЫХ ПОМЕЩЕНИЙ
Petrovsky Passage
RETAIL SPACE
In Q3 the visiting rate of the retail centers was at the higher level than it used to be in the last year Buyers share (amount of people who made a purchase compared to total number of visitors) decreased with the number of 308 The level of vacant spaces in the quality retail centers is at the lowest level The small increase in the third quarter (08 points) is associated with the rotation of tenants in one of the shopping centers (one of retail centerrsquos floors is going to be fully occupied by the leaseholder who is currently conducting repair facilities)
In general there is a lack of supply in the quality retail centers in Moscow
Announced developers plans CW Forecast New construction YTD
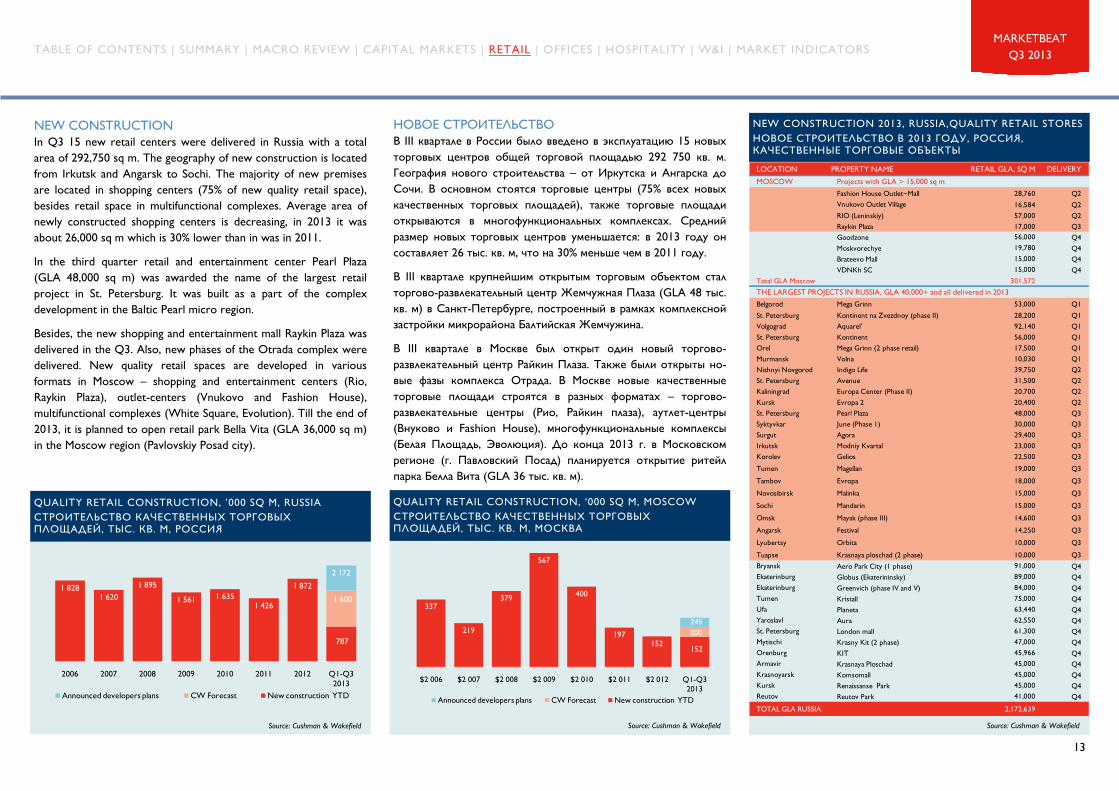
НОВОЕ СТРОИТЕЛЬСТВО В III квартале в России было введено в эксплуатацию 15 новых торговых центров общей торговой площадью 292 750 кв м География нового строительства ndash от Иркутска и Ангарска до Сочи В основном стоятся торговые центры (75 всех новых качественных торговых площадей) также торговые площади открываются в многофункциональных комплексах Средний размер новых торговых центров уменьшается в 2013 году он составляет 26 тыс кв м что на 30 меньше чем в 2011 году
В III квартале крупнейшим открытым торговым объектом стал торгово-развлекательный центр Жемчужная Плаза (GLA 48 тыс кв м) в Санкт-Петербурге построенный в рамках комплексной застройки микрорайона Балтийская Жемчужина
В III квартале в Москве был открыт один новый торгово-развлекательный центр Райкин Плаза Также были открыты но-вые фазы комплекса Отрада В Москве новые качественные торговые площади строятся в разных форматах ndash торгово-развлекательные центры (Рио Райкин плаза) аутлет-центры (Внуково и Fashion House) многофункциональные комплексы (Белая Площадь Эволюция) До конца 2013 г в Московском регионе (г Павловский Посад) планируется открытие ритейл парка Белла Вита (GLA 36 тыс кв м)
NEW CONSTRUCTION 2013 RUSSIAQUALITY RETAIL STORES НОВОЕ СТРОИТЕЛЬСТВО В 2013 ГОДУ РОССИЯ КАЧЕСТВЕННЫЕ ТОРГОВЫЕ ОБЪЕКТЫ
Source Cushman amp Wakefield
QUALITY RETAIL CONSTRUCTION rsquo000 SQ M RUSSIA СТРОИТЕЛЬСТВО КАЧЕСТВЕННЫХ ТОРГОВЫХ ПЛОЩАДЕЙ ТЫС КВ М РОССИЯ
NEW CONSTRUCTION In Q3 15 new retail centers were delivered in Russia with a total area of 292750 sq m The geography of new construction is located from Irkutsk and Angarsk to Sochi The majority of new premises are located in shopping centers (75 of new quality retail space) besides retail space in multifunctional complexes Average area of newly constructed shopping centers is decreasing in 2013 it was about 26000 sq m which is 30 lower than in was in 2011
In the third quarter retail and entertainment center Pearl Plaza (GLA 48000 sq m) was awarded the name of the largest retail project in St Petersburg It was built as a part of the complex development in the Baltic Pearl micro region
Besides the new shopping and entertainment mall Raykin Plaza was delivered in the Q3 Also new phases of the Otrada complex were delivered New quality retail spaces are developed in various formats in Moscow ndash shopping and entertainment centers (Rio Raykin Plaza) outlet-centers (Vnukovo and Fashion House) multifunctional complexes (White Square Evolution) Till the end of 2013 it is planned to open retail park Bella Vita (GLA 36000 sq m) in the Moscow region (Pavlovskiy Posad city)
Standard lease terms for gallery tenants are between 3-5 years break options are rare For anchor tenants (including fashion anchors) lease terms are up to 20 -25 years and break options are becoming popular
Rents are typically payable monthly in advance Turnover percentage rents are increasingly seen in shopping centres Rental rates are generally calculated in USD Euricirc or commercial units are used In less quality shopping centres rental rates are calculated in RUR
Annual indexation is typical between 3-10 or at a level of USD EU CPI The practice of premium key money payments is seldom seen in Russia Rent reviews are rare on the market
Service ChargesIcirciumlaringethagraveoumlegraveicirciacuteiacuteucircaring iumleumlagraveogravearingaeligegrave
Service charge is payable by tenants at either an ldquoopen bookrdquo basis or more common as a fixed cost Utilities payments are charged on consumption Building insurance is normally charged back to tenant via service charge
Local property taxes are not payed separately they are generally included in the service charges Iacuteagraveeumlicircatilde iacuteagrave iacutearingaumlacircegraveaeligegraveigraveicircntildeograveuuml icircaacuteucircdivideiacuteicirc acirceumlthorndivideagravearingograventildeyuml acirc icirciumlaringethagraveoumlegraveicirciacuteiacuteucircaring iumleumlagraveogravearingaeligegrave
Other costsAumlethoacuteatildeegravearing iumleumlagraveogravearingaeligegrave
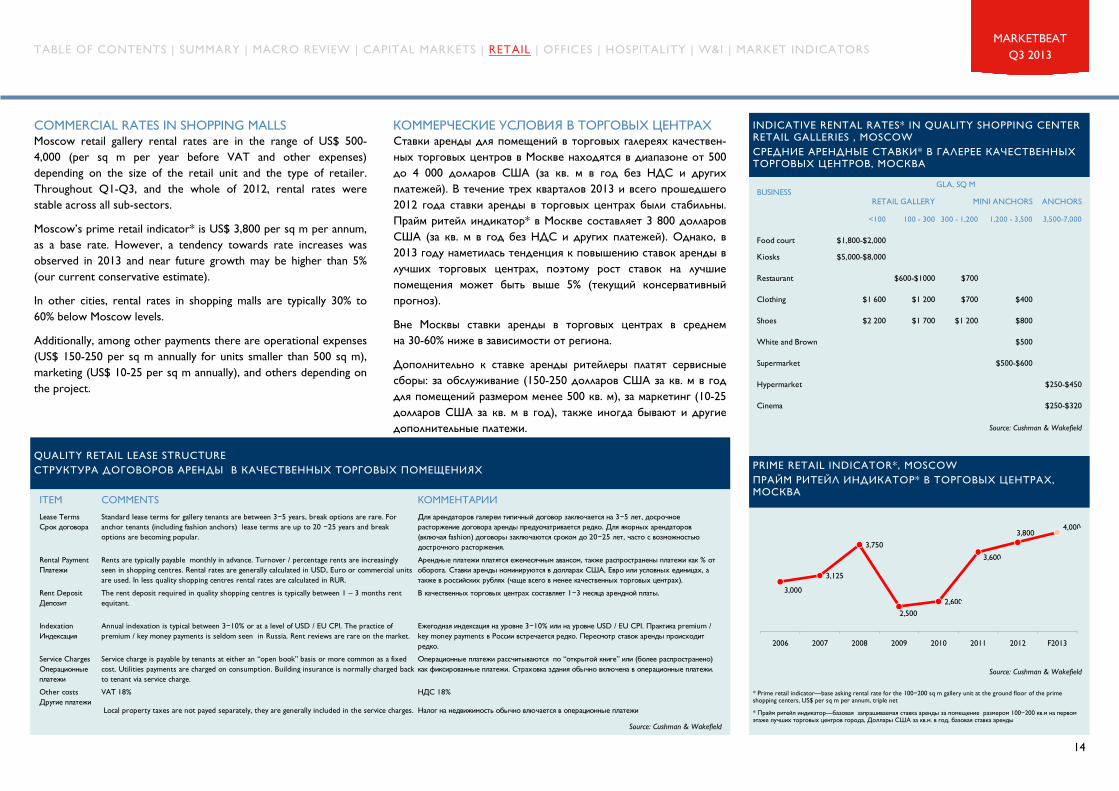
EcircIcircIgraveIgraveAringETHtimesAringNtildeEcircEgraveAring OacuteNtildeEumlIcircAcircEgraveszlig Acirc OgraveIcircETHAtildeIcircAcircUcircOtilde OumlAringIacuteOgraveETHAgraveOtilde Ставки аренды для помещений в торговых галереях качествен-ных торговых центров в Москве находятся в диапазоне от 500 до 4 000 долларов США (за кв м в год без НДС и других платежей) В течение трех кварталов 2013 и всего прошедшего 2012 года ставки аренды в торговых центрах были стабильны Прайм ритейл индикатор в Москве составляет 3 800 долларов США (за кв м в год без НДС и других платежей) Однако в 2013 году наметилась тенденция к повышению ставок аренды в лучших торговых центрах поэтому рост ставок на лучшие помещения может быть выше 5 (текущий консервативный прогноз)
Вне Москвы ставки аренды в торговых центрах в среднем на 30-60 ниже в зависимости от региона
Дополнительно к ставке аренды ритейлеры платят сервисные сборы за обслуживание (150-250 долларов США за кв м в год для помещений размером менее 500 кв м) за маркетинг (10-25 долларов США за кв м в год) также иногда бывают и другие дополнительные платежи
Source Cushman amp Wakefield
Source Cushman amp Wakefield
PRIME RETAIL INDICATOR MOSCOW ПРАЙМ РИТЕЙЛ ИНДИКАТОР В ТОРГОВЫХ ЦЕНТРАХ МОСКВА
Prime retail indicatormdashbase asking rental rate for the 100-200 sq m gallery unit at the ground floor of the prime shopping centers US$ per sq m per annum triple net
INDICATIVE RENTAL RATES IN QUALITY SHOPPING CENTER RETAIL GALLERIES MOSCOW СРЕДНИЕ АРЕНДНЫЕ СТАВКИ В ГАЛЕРЕЕ КАЧЕСТВЕННЫХ ТОРГОВЫХ ЦЕНТРОВ МОСКВА
COMMERCIAL RATES IN SHOPPING MALLS Moscow retail gallery rental rates are in the range of US$ 500- 4000 (per sq m per year before VAT and other expenses) depending on the size of the retail unit and the type of retailer Throughout Q1-Q3 and the whole of 2012 rental rates were stable across all sub-sectors
Moscowrsquos prime retail indicator is US$ 3800 per sq m per annum as a base rate However a tendency towards rate increases was observed in 2013 and near future growth may be higher than 5 (our current conservative estimate)
In other cities rental rates in shopping malls are typically 30 to 60 below Moscow levels
Additionally among other payments there are operational expenses (US$ 150-250 per sq m annually for units smaller than 500 sq m) marketing (US$ 10-25 per sq m annually) and others depending on the project
QUALITY RETAIL LEASE STRUCTURE СТРУКТУРА ДОГОВОРОВ АРЕНДЫ В КАЧЕСТВЕННЫХ ТОРГОВЫХ ПОМЕЩЕНИЯХ
ANCHORS
lt100 100 - 300 300 - 1200 1200 - 3500 3500-7000
Food court $1800-$2000
Kiosks $5000-$8000
Restaurant $600-$1000 $700
Clothing $1 600 $1 200 $700 $400
Shoes $2 200 $1 700 $1 200 $800
White and Brown $500
Supermarket $500-$600
Hypermarket $250-$450
Cinema $250-$320
BUSINESSGLA SQ M
RETAIL GALLERY MINI ANCHORS
Source Cushman amp Wakefield
15
MARKETBEAT Q3 2013
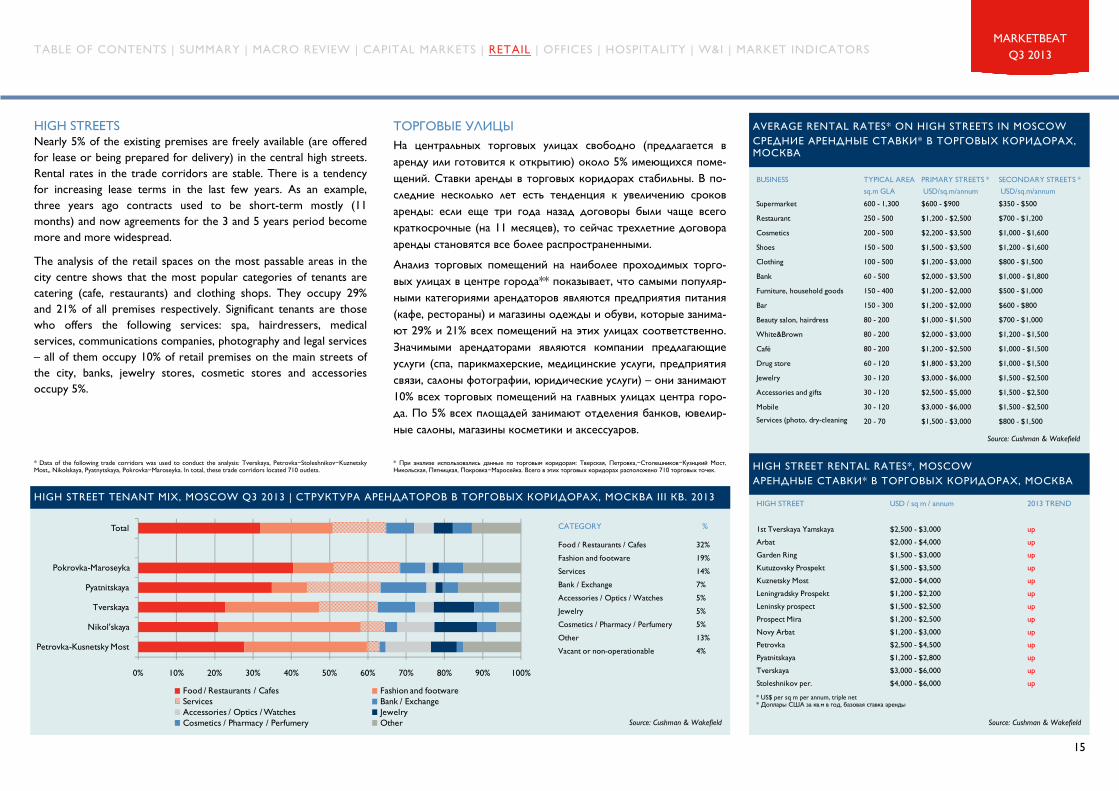
ТОРГОВЫЕ УЛИЦЫ На центральных торговых улицах свободно (предлагается в аренду или готовится к открытию) около 5 имеющихся поме-щений Ставки аренды в торговых коридорах стабильны В по-следние несколько лет есть тенденция к увеличению сроков аренды если еще три года назад договоры были чаще всего краткосрочные (на 11 месяцев) то сейчас трехлетние договора аренды становятся все более распространенными
Анализ торговых помещений на наиболее проходимых торго-вых улицах в центре города показывает что самыми популяр-ными категориями арендаторов являются предприятия питания (кафе рестораны) и магазины одежды и обуви которые занима-ют 29 и 21 всех помещений на этих улицах соответственно Значимыми арендаторами являются компании предлагающие услуги (спа парикмахерские медицинские услуги предприятия связи салоны фотографии юридические услуги) ndash они занимают 10 всех торговых помещений на главных улицах центра горо-да По 5 всех площадей занимают отделения банков ювелир-ные салоны магазины косметики и аксессуаров
Source Cushman amp Wakefield
HIGH STREETS Nearly 5 of the existing premises are freely available (are offered for lease or being prepared for delivery) in the central high streets Rental rates in the trade corridors are stable There is a tendency for increasing lease terms in the last few years As an example three years ago contracts used to be short-term mostly (11 months) and now agreements for the 3 and 5 years period become more and more widespread
The analysis of the retail spaces on the most passable areas in the city centre shows that the most popular categories of tenants are catering (cafe restaurants) and clothing shops They occupy 29 and 21 of all premises respectively Significant tenants are those who offers the following services spa hairdressers medical services communications companies photography and legal services ndash all of them occupy 10 of retail premises on the main streets of the city banks jewelry stores cosmetic stores and accessories occupy 5
AVERAGE RENTAL RATES ON HIGH STREETS IN MOSCOW СРЕДНИЕ АРЕНДНЫЕ СТАВКИ В ТОРГОВЫХ КОРИДОРАХ МОСКВА
HIGH STREET TENANT MIX MOSCOW Q3 2013 | СТРУКТУРА АРЕНДАТОРОВ В ТОРГОВЫХ КОРИДОРАХ МОСКВА III КВ 2013
Food Restaurants Cafes Fashion and footwareServices Bank ExchangeAccessories Optics Watches JewelryCosmetics Pharmacy Perfumery Other
HIGH STREET RENTAL RATES MOSCOW АРЕНДНЫЕ СТАВКИ В ТОРГОВЫХ КОРИДОРАХ МОСКВА
Data of the following trade corridors was used to conduct the analysis Tverskaya Petrovka-Stoleshnikov-Kuznetsky Most Nikolskaya Pyatnytskaya Pokrovka-Maroseyka In total these trade corridors located 710 outlets
US$ per sq m per annum triple net Aumlicirceumleumlagraveethucirc NtildeOslashAgrave ccedilagrave ecircacircigrave acirc atildeicircauml aacuteagraveccedilicircacircagraveyuml ntildeograveagraveacircecircagrave agraveetharingiacuteaumlucirc
OgraveIcircETHAtildeIcircAcircUcircAring OacuteEumlEgraveOumlUcirc mdash IumlAringOslashAringOtildeIcircAumlIacuteUcircAring CcedilIcircIacuteUcirc Важнейшим событием для торговых улиц стала программа развития пешеходных зон в Москве активно поддерживаемая Правительством города На тех улицах где уже отменили движение транспорта (в первую очередь Большая Дмитровка) происходит смена потоков посетителей (от пассажиров к пешеходам) Пешеходные улицы имеют огромный потенциал с точки зрения торговли и уже сейчас ритейлеры проявляют большой интерес к пешеходным районам Расширение пешеходных районов значительно увечит предложение качественных торговых помещений на улицах в Москве
HIGH STREETS mdash PEDESTRIAN AREA The most important event for the high streets became the development of pedestrian zones in Moscow which is actively supported by the city government There is a change of visitor flows (from passengers to pedestrians) on those streets where the driving was cancelled (it concerns Bolshaya Dmitrovka street first of all) There is a huge potential for retail activity talking about pedestrian streets and retailers show great interest in developing of those areas The expansion of pedestrian zones will significantly increase the supply of the quality retail premises in Moscow
HIGH STREETS mdash PEDESTRIAN AREA ТОРГОВЫЕ УЛИЦЫ mdash ПЕШЕХОДНЫЕ ЗОНЫ
With vehicular traffic restriction | Oacuteeumlegraveoumlucirc atildeaumlaring icircatildeethagraveiacuteegravedividearingiacuteicirc aumlacircegraveaeligaringiacuteegravearing ograveethagraveiacutentildeiumlicircethograveagrave
Opened for vehicles | Oacuteeumlegraveoumlucirc atildeaumlaring icircograveecircethucircograveicirc aumlacircegraveaeligaringiacuteegravearing ograveethagraveiacutentildeiumlicircethograveagrave
Q3 2013 MoscowRUSSIA A Cushman amp Wakefield Research Publication
OFFICE MARKET
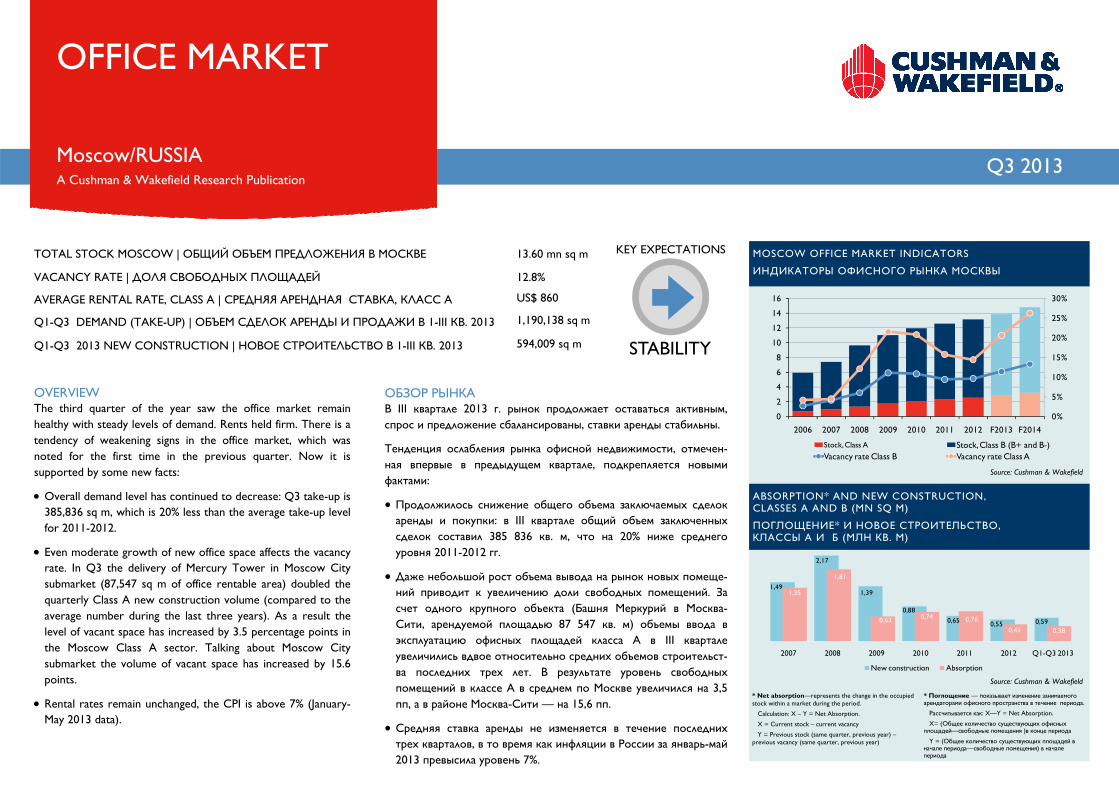
IcircAacuteCcedilIcircETH ETHUcircIacuteEcircAgrave В III квартале 2013 г рынок продолжает оставаться активным спрос и предложение сбалансированы ставки аренды стабильны
Тенденция ослабления рынка офисной недвижимости отмечен-ная впервые в предыдущем квартале подкрепляется новыми фактами
Продолжилось снижение общего объема заключаемых сделок аренды и покупки в III квартале общий объем заключенных сделок составил 385 836 кв м что на 20 ниже среднего уровня 2011-2012 гг
Даже небольшой рост объема вывода на рынок новых помеще-ний приводит к увеличению доли свободных помещений За счет одного крупного объекта (Башня Меркурий в Москва-Сити арендуемой площадью 87 547 кв м) объемы ввода в эксплуатацию офисных площадей класса А в III квартале увеличились вдвое относительно средних объемов строительст-ва последних трех лет В результате уровень свободных помещений в классе А в среднем по Москве увеличился на 35 пп а в районе Москва-Сити mdash на 156 пп
Средняя ставка аренды не изменяется в течение последних трех кварталов в то время как инфляции в России за январь-май 2013 превысила уровень 7
ABSORPTION AND NEW CONSTRUCTION CLASSES A AND B (MN SQ M)
OVERVIEW The third quarter of the year saw the office market remain healthy with steady levels of demand Rents held firm There is a tendency of weakening signs in the office market which was noted for the first time in the previous quarter Now it is supported by some new facts
Overall demand level has continued to decrease Q3 take-up is 385836 sq m which is 20 less than the average take-up level for 2011-2012
Even moderate growth of new office space affects the vacancy rate In Q3 the delivery of Mercury Tower in Moscow City submarket (87547 sq m of office rentable area) doubled the quarterly Class A new construction volume (compared to the average number during the last three years) As a result the level of vacant space has increased by 35 percentage points in the Moscow Class A sector Talking about Moscow City submarket the volume of vacant space has increased by 156 points
Rental rates remain unchanged the CPI is above 7 (January-May 2013 data)
Source Cushman amp Wakefield
TOTAL STOCK MOSCOW | ОБЩИЙ ОБЪЕМ ПРЕДЛОЖЕНИЯ В МОСКВЕ 1360 mn sq m
VACANCY RATE | ДОЛЯ СВОБОДНЫХ ПЛОЩАДЕЙ 128
US$ 860 AVERAGE RENTAL RATE CLASS A | СРЕДНЯЯ АРЕНДНАЯ СТАВКА КЛАСС А
Q1-Q3 DEMAND (TAKE-UP) | ОБЪЕМ СДЕЛОК АРЕНДЫ И ПРОДАЖИ В 1-III КВ 2013 1190138 sq m
Q1-Q3 2013 NEW CONSTRUCTION | НОВОЕ СТРОИТЕЛЬСТВО В 1-III КВ 2013 594009 sq m
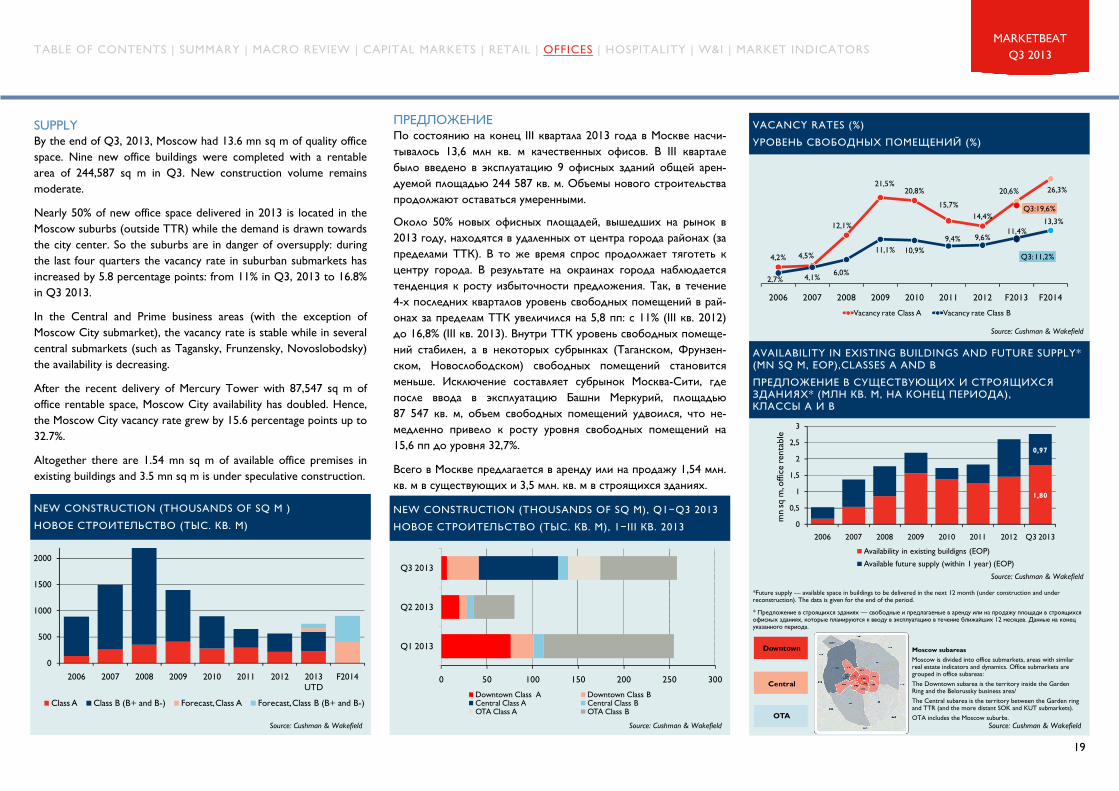
SUPPLY By the end of Q3 2013 Moscow had 136 mn sq m of quality office space Nine new office buildings were completed with a rentable area of 244587 sq m in Q3 New construction volume remains moderate
Nearly 50 of new office space delivered in 2013 is located in the Moscow suburbs (outside TTR) while the demand is drawn towards the city center So the suburbs are in danger of oversupply during the last four quarters the vacancy rate in suburban submarkets has increased by 58 percentage points from 11 in Q3 2013 to 168 in Q3 2013
In the Central and Prime business areas (with the exception of Moscow City submarket) the vacancy rate is stable while in several central submarkets (such as Tagansky Frunzensky Novoslobodsky) the availability is decreasing
After the recent delivery of Mercury Tower with 87547 sq m of office rentable space Moscow City availability has doubled Hence the Moscow City vacancy rate grew by 156 percentage points up to 327
Altogether there are 154 mn sq m of available office premises in existing buildings and 35 mn sq m is under speculative construction
IumlETHAringAumlEumlIcircAEligAringIacuteEgraveAring По состоянию на конец III квартала 2013 года в Москве насчи-тывалось 136 млн кв м качественных офисов В III квартале было введено в эксплуатацию 9 офисных зданий общей арен-дуемой площадью 244 587 кв м Объемы нового строительства продолжают оставаться умеренными
Около 50 новых офисных площадей вышедших на рынок в 2013 году находятся в удаленных от центра города районах (за пределами ТТК) В то же время спрос продолжает тяготеть к центру города В результате на окраинах города наблюдается тенденция к росту избыточности предложения Так в течение 4-х последних кварталов уровень свободных помещений в рай-онах за пределам ТТК увеличился на 58 пп с 11 (III кв 2012) до 168 (III кв 2013) Внутри ТТК уровень свободных помеще-ний стабилен а в некоторых субрынках (Таганском Фрунзен-ском Новослободском) свободных помещений становится меньше Исключение составляет субрынок Москва-Сити где после ввода в эксплуатацию Башни Меркурий площадью 87 547 кв м объем свободных помещений удвоился что не-медленно привело к росту уровня свободных помещений на 156 пп до уровня 327
Всего в Москве предлагается в аренду или на продажу 154 млн кв м в существующих и 35 млн кв м в строящихся зданиях
Future supply mdash available space in buildings to be delivered in the next 12 month (under construction and under reconstruction) The data is given for the end of the period
Source Cushman amp Wakefield Source Cushman amp Wakefield Moscow Research Forum
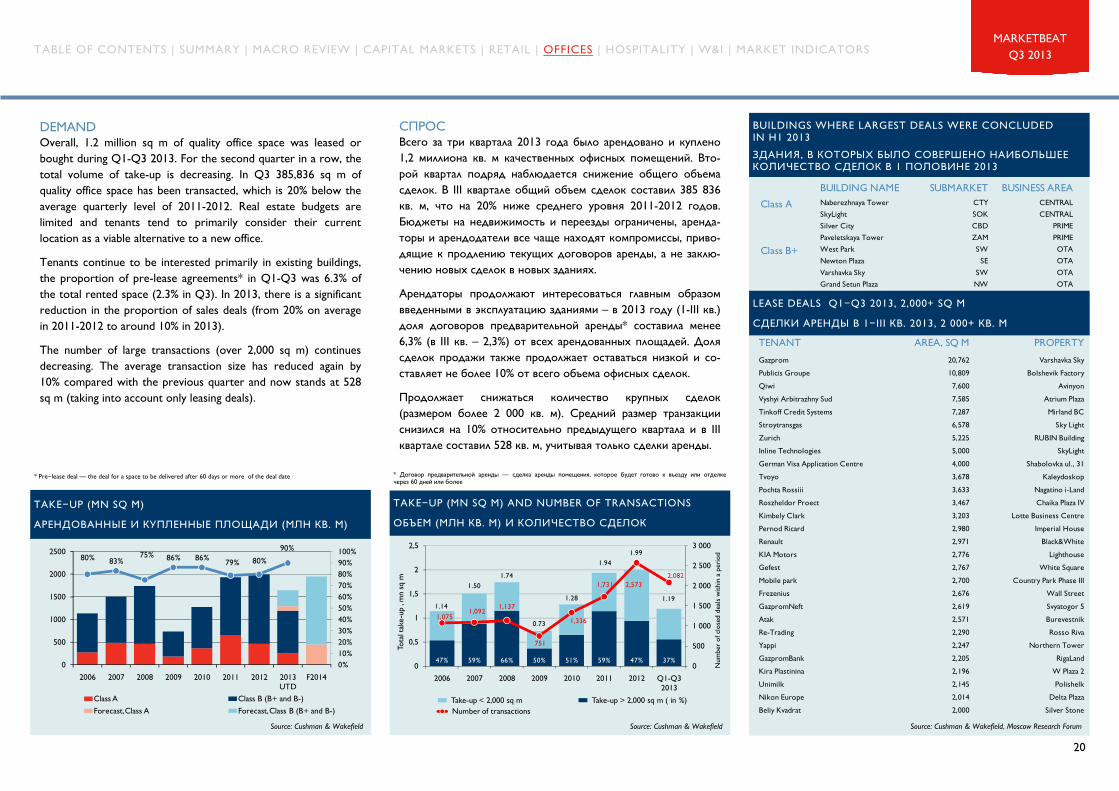
DEMAND Overall 12 million sq m of quality office space was leased or bought during Q1-Q3 2013 For the second quarter in a row the total volume of take-up is decreasing In Q3 385836 sq m of quality office space has been transacted which is 20 below the average quarterly level of 2011-2012 Real estate budgets are limited and tenants tend to primarily consider their current location as a viable alternative to a new office
Tenants continue to be interested primarily in existing buildings the proportion of pre-lease agreements in Q1-Q3 was 63 of the total rented space (23 in Q3) In 2013 there is a significant reduction in the proportion of sales deals (from 20 on average in 2011-2012 to around 10 in 2013)
The number of large transactions (over 2000 sq m) continues decreasing The average transaction size has reduced again by 10 compared with the previous quarter and now stands at 528 sq m (taking into account only leasing deals)
NtildeIumlETHIcircNtilde Всего за три квартала 2013 года было арендовано и куплено 12 миллиона кв м качественных офисных помещений Вто-рой квартал подряд наблюдается снижение общего объема сделок В III квартале общий объем сделок составил 385 836 кв м что на 20 ниже среднего уровня 2011-2012 годов Бюджеты на недвижимость и переезды ограничены аренда-торы и арендодатели все чаще находят компромиссы приво-дящие к продлению текущих договоров аренды а не заклю-чению новых сделок в новых зданиях
Арендаторы продолжают интересоваться главным образом введенными в эксплуатацию зданиями ndash в 2013 году (1-III кв) доля договоров предварительной аренды составила менее 63 (в III кв ndash 23) от всех арендованных площадей Доля сделок продажи также продолжает оставаться низкой и со-ставляет не более 10 от всего объема офисных сделок
Продолжает снижаться количество крупных сделок (размером более 2 000 кв м) Средний размер транзакции снизился на 10 относительно предыдущего квартала и в III квартале составил 528 кв м учитывая только сделки аренды
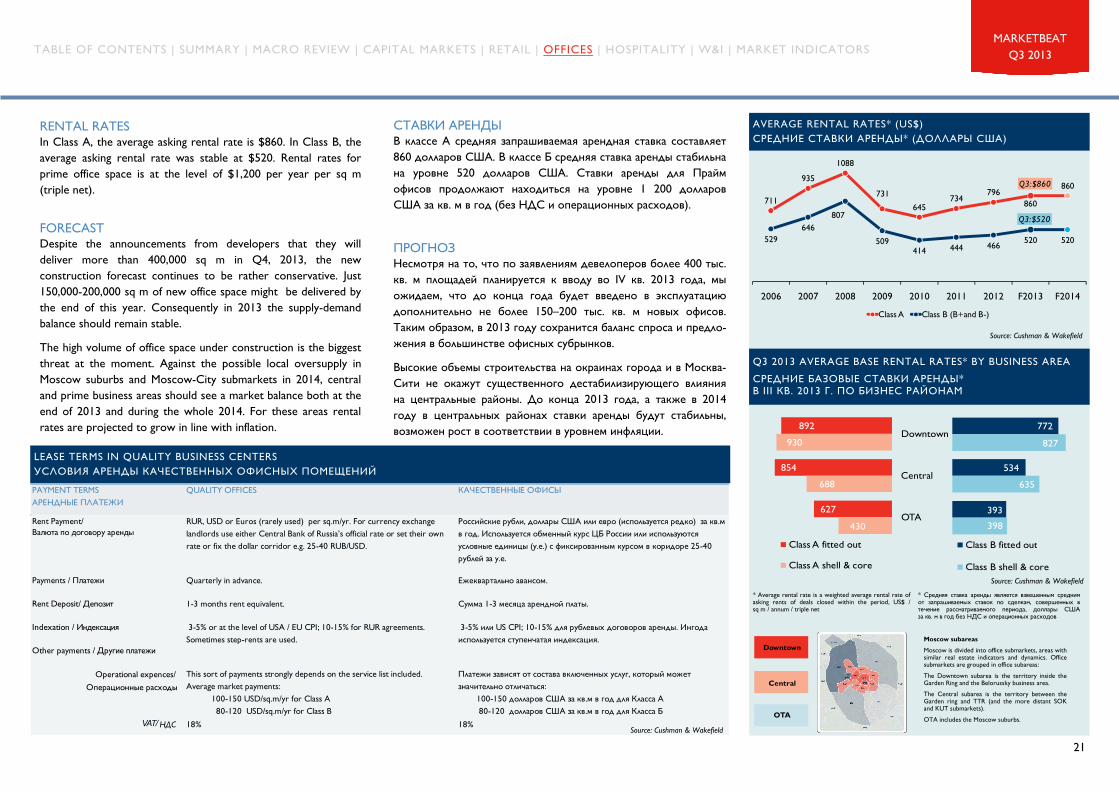
NtildeOgraveAgraveAcircEcircEgrave AgraveETHAringIacuteAumlUcirc В классе А средняя запрашиваемая арендная ставка составляет 860 долларов США В классе Б средняя ставка аренды стабильна на уровне 520 долларов США Ставки аренды для Прайм офисов продолжают находиться на уровне 1 200 долларов США за кв м в год (без НДС и операционных расходов)
Source Cushman amp Wakefield
Source Cushman amp Wakefield
Q3 2013 AVERAGE BASE RENTAL RATES BY BUSINESS AREA СРЕДНИЕ БАЗОВЫЕ СТАВКИ АРЕНДЫ В III КВ 2013 Г ПО БИЗНЕС РАЙОНАМ
AVERAGE RENTAL RATES (US$) СРЕДНИЕ СТАВКИ АРЕНДЫ (ДОЛЛАРЫ США)
Downtown
Central
OTA
Moscow subareas
Moscow is divided into office submarkets areas with similar real estate indicators and dynamics Office submarkets are grouped in office subareas
The Downtown subarea is the territory inside the Garden Ring and the Belorussky business area
The Central subarea is the territory between the Garden ring and TTR (and the more distant SOK and KUT submarkets)
OTA includes the Moscow suburbs
RENTAL RATES In Class A the average asking rental rate is $860 In Class B the average asking rental rate was stable at $520 Rental rates for prime office space is at the level of $1200 per year per sq m (triple net)
IumlETHIcircAtildeIacuteIcircCcedil Несмотря на то что по заявлениям девелоперов более 400 тыс кв м площадей планируется к вводу во IV кв 2013 года мы ожидаем что до конца года будет введено в эксплуатацию дополнительно не более 150ndash200 тыс кв м новых офисов Таким образом в 2013 году сохранится баланс спроса и предло-жения в большинстве офисных субрынков
Высокие объемы строительства на окраинах города и в Москва-Сити не окажут существенного дестабилизирующего влияния на центральные районы До конца 2013 года а также в 2014 году в центральных районах ставки аренды будут стабильны возможен рост в соответствии в уровнем инфляции
LEASE TERMS IN QUALITY BUSINESS CENTERS УСЛОВИЯ АРЕНДЫ КАЧЕСТВЕННЫХ ОФИСНЫХ ПОМЕЩЕНИЙ
RUR USD or Euros (rarely used) per sqmyr For currency exchange landlords use either Central Bank of Russiarsquos official rate or set their own rate or fix the dollar corridor eg 25-40 RUBUSD
Российские рубли доллары США или евро (используется редко) за квм в год Используется обменный курс ЦБ России или используются условные единицы (уе) с фиксированным курсом в коридоре 25-40 рублей за уе
Payments Iumleumlagraveogravearingaeligegrave Quarterly in advance Ежеквартально авансом
Indexation Egraveiacuteaumlaringecircntildeagraveoumlegraveyuml 3-5 or at the level of USA EU CPI 10-15 for RUR agreements Sometimes step-rents are used
3-5 или US CPI 10-15 для рублевых договоров аренды Ингода используется ступенчатая индексация
Other payments Aumlethoacuteatildeegravearing iumleumlagraveogravearingaeligegrave
Operational expences
Операционные расходыThis sort of payments strongly depends on the service list included Average market payments 100-150 USDsqmyr for Class A 80-120 USDsqmyr for Class B
Платежи зависят от состава включенных услуг который может значительно отличаться 100-150 долларов США за квм в год для Класса A 80-120 долларов США за квм в год для Класса Б
VATНДС 18 18Source Cushman amp Wakefield
FORECAST Despite the announcements from developers that they will deliver more than 400000 sq m in Q4 2013 the new construction forecast continues to be rather conservative Just 150000-200000 sq m of new office space might be delivered by the end of this year Consequently in 2013 the supply-demand balance should remain stable
The high volume of office space under construction is the biggest threat at the moment Against the possible local oversupply in Moscow suburbs and Moscow-City submarkets in 2014 central and prime business areas should see a market balance both at the end of 2013 and during the whole 2014 For these areas rental rates are projected to grow in line with inflation
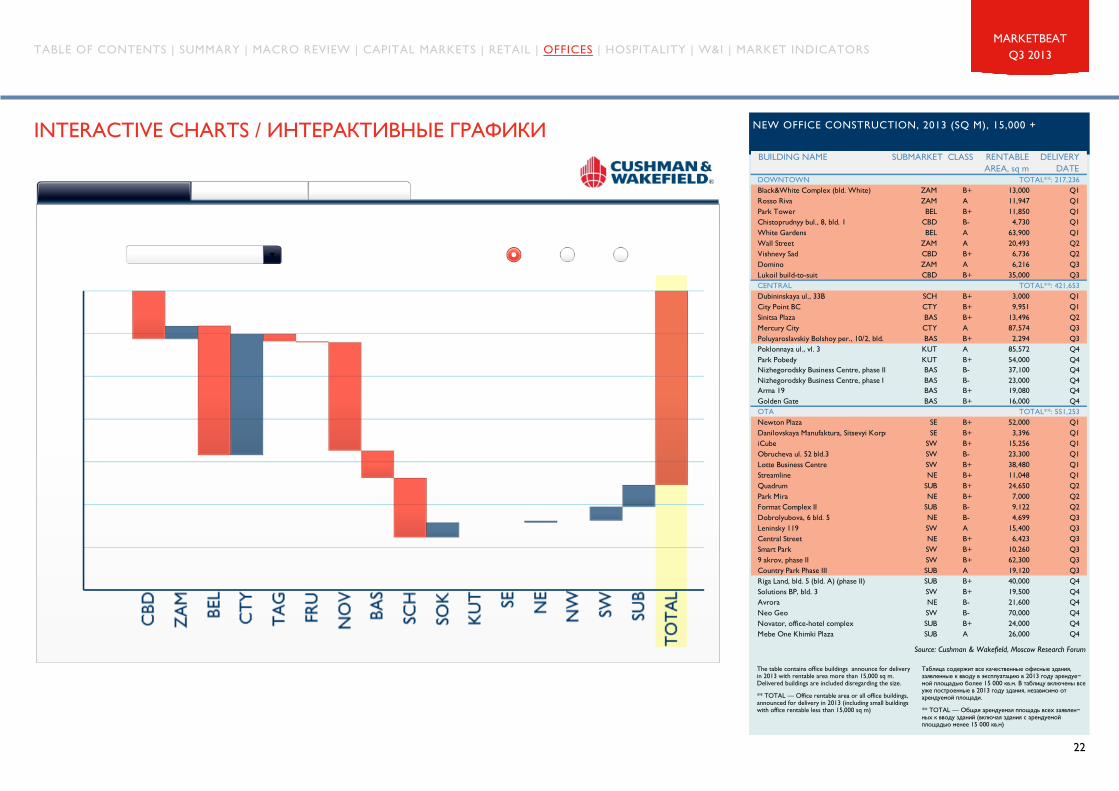
The table contains office buildings announce for delivery in 2013 with rentable area more than 15000 sq m Delivered buildings are included disregarding the size
TOTAL mdash Office rentable area or all office buildings announced for delivery in 2013 (including small buildings with office rentable less than 15000 sq m)
DOWNTOWNBlackampWhite Complex (bld White) ZAM B+ 13000 Q1Rosso Riva ZAM A 11947 Q1Park Tower BEL B+ 11850 Q1Chistoprudnyy bul 8 bld 1 CBD B- 4730 Q1White Gardens BEL A 63900 Q1Wall Street ZAM A 20493 Q2Vishnevy Sad CBD B+ 6736 Q2Domino ZAM A 6216 Q3Lukoil build-to-suit CBD B+ 35000 Q3CENTRALDubininskaya ul 33B SCH B+ 3000 Q1City Point BC CTY B+ 9951 Q1Sinitsa Plaza BAS B+ 13496 Q2Mercury City CTY A 87574 Q3Poluyaroslavskiy Bolshoy per 102 bld BAS B+ 2294 Q3Poklonnaya ul vl 3 KUT A 85572 Q4Park Pobedy KUT B+ 54000 Q4Nizhegorodsky Business Centre phase II BAS B- 37100 Q4Nizhegorodsky Business Centre phase I BAS B- 23000 Q4Arma 19 BAS B+ 19080 Q4Golden Gate BAS B+ 16000 Q4OTANewton Plaza SE B+ 52000 Q1Danilovskaya Manufaktura Sitsevyi Korpu SE B+ 3396 Q1iCube SW B+ 15256 Q1Obrucheva ul 52 bld3 SW B- 23300 Q1Lotte Business Centre SW B+ 38480 Q1Streamline NE B+ 11048 Q1Quadrum SUB B+ 24650 Q2Park Mira NE B+ 7000 Q2Format Complex II SUB B- 9122 Q2Dobrolyubova 6 bld 5 NE B- 4699 Q3Leninsky 119 SW A 15400 Q3Central Street NE B+ 6423 Q3Smart Park SW B+ 10260 Q39 akrov phase II SW B+ 62300 Q3Country Park Phase III SUB A 19120 Q3Riga Land bld 5 (bld A) (phase II) SUB B+ 40000 Q4Solutions BP bld 3 SW B+ 19500 Q4Avrora NE B- 21600 Q4Neo Geo SW B- 70000 Q4Novator office-hotel complex SUB B+ 24000 Q4Mebe One Khimki Plaza SUB A 26000 Q4
TOTAL 217236
TOTAL 421653
TOTAL 551253
Q3 2013 MoscowRUSSIA A Cushman amp Wakefield Research Publication
HOSPITALITY
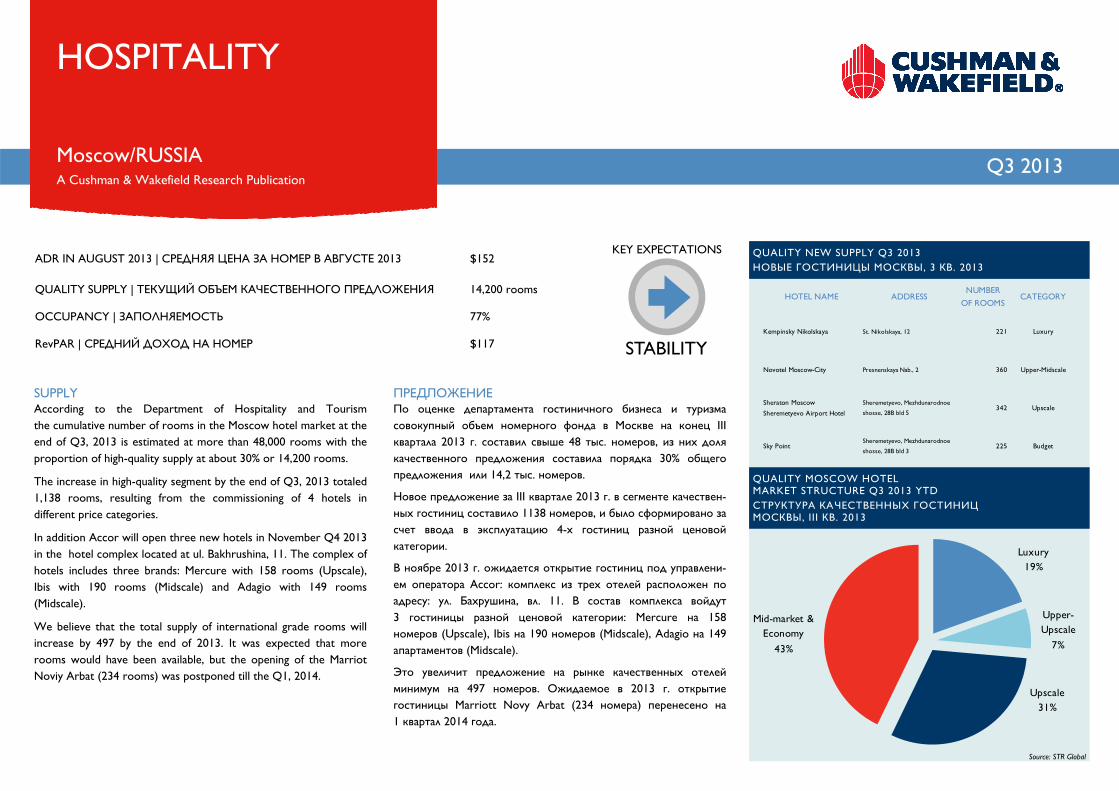
ADR IN AUGUST 2013 | СРЕДНЯЯ ЦЕНА ЗА НОМЕР В АВГУСТЕ 2013 $152
QUALITY SUPPLY | ТЕКУЩИЙ ОБЪЕМ КАЧЕСТВЕННОГО ПРЕДЛОЖЕНИЯ 14200 rooms
OCCUPANCY | ЗАПОЛНЯЕМОСТЬ 77
RevPAR | СРЕДНИЙ ДОХОД НА НОМЕР $117
IumlETHAringAumlEumlIcircAEligAringIacuteEgraveAring По оценке департамента гостиничного бизнеса и туризма совокупный объем номерного фонда в Москве на конец III квартала 2013 г составил свыше 48 тыс номеров из них доля качественного предложения составила порядка 30 общего предложения или 142 тыс номеров
Новое предложение за III квартале 2013 г в сегменте качествен-ных гостиниц составило 1138 номеров и было сформировано за счет ввода в эксплуатацию 4-х гостиниц разной ценовой категории
В ноябре 2013 г ожидается открытие гостиниц под управлени-ем оператора Accor комплекс из трех отелей расположен по адресу ул Бахрушина вл 11 В состав комплекса войдут 3 гостиницы разной ценовой категории Mercure на 158 номеров (Upscale) Ibis на 190 номеров (Midscale) Adagio на 149 апартаментов (Midscale)
Это увеличит предложение на рынке качественных отелей минимум на 497 номеров Ожидаемое в 2013 г открытие гостиницы Marriott Novy Arbat (234 номера) перенесено на 1 квартал 2014 года
SUPPLY According to the Department of Hospitality and Tourism the cumulative number of rooms in the Moscow hotel market at the end of Q3 2013 is estimated at more than 48000 rooms with the proportion of high-quality supply at about 30 or 14200 rooms
The increase in high-quality segment by the end of Q3 2013 totaled 1138 rooms resulting from the commissioning of 4 hotels in different price categories
In addition Accor will open three new hotels in November Q4 2013 in the hotel complex located at ul Bakhrushina 11 The complex of hotels includes three brands Mercure with 158 rooms (Upscale) Ibis with 190 rooms (Midscale) and Adagio with 149 rooms (Midscale)
We believe that the total supply of international grade rooms will increase by 497 by the end of 2013 It was expected that more rooms would have been available but the opening of the Marriot Noviy Arbat (234 rooms) was postponed till the Q1 2014
QUALITY MOSCOW HOTEL MARKET STRUCTURE Q3 2013 YTD
NtildeOgraveETHOacuteEcircOgraveOacuteETHAgrave EcircAgravetimesAringNtildeOgraveAcircAringIacuteIacuteUcircOtilde AtildeIcircNtildeOgraveEgraveIacuteEgraveOuml IgraveIcircNtildeEcircAcircUcirc III EcircAcirc 2013
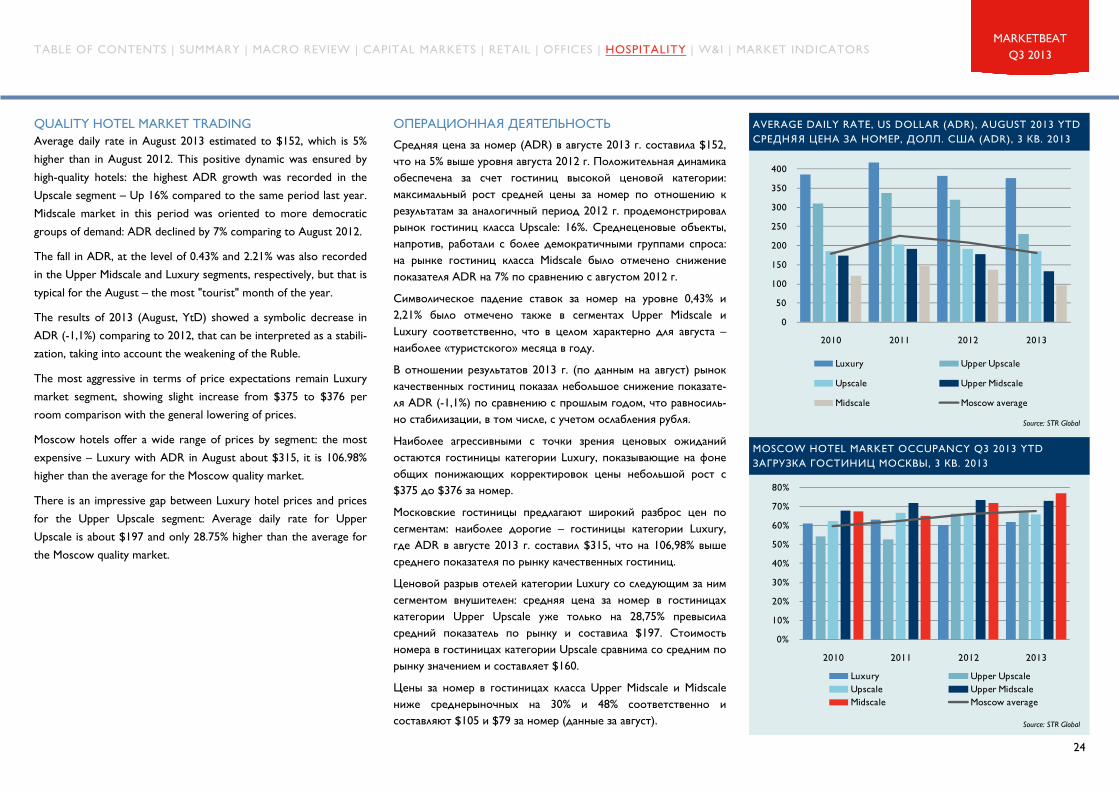
Средняя цена за номер (ADR) в августе 2013 г составила $152 что на 5 выше уровня августа 2012 г Положительная динамика обеспечена за счет гостиниц высокой ценовой категории максимальный рост средней цены за номер по отношению к результатам за аналогичный период 2012 г продемонстрировал рынок гостиниц класса Upscale 16 Среднеценовые объекты напротив работали с более демократичными группами спроса на рынке гостиниц класса Midscale было отмечено снижение показателя ADR на 7 по сравнению с августом 2012 г
Символическое падение ставок за номер на уровне 043 и 221 было отмечено также в сегментах Upper Midscale и Luxury соответственно что в целом характерно для августа ndash наиболее laquoтуристскогоraquo месяца в году
В отношении результатов 2013 г (по данным на август) рынок качественных гостиниц показал небольшое снижение показате-ля ADR (-11) по сравнению с прошлым годом что равносиль-но стабилизации в том числе с учетом ослабления рубля
Наиболее агрессивными с точки зрения ценовых ожиданий остаются гостиницы категории Luxury показывающие на фоне общих понижающих корректировок цены небольшой рост с $375 до $376 за номер
Московские гостиницы предлагают широкий разброс цен по сегментам наиболее дорогие ndash гостиницы категории Luxury где ADR в августе 2013 г составил $315 что на 10698 выше среднего показателя по рынку качественных гостиниц
Ценовой разрыв отелей категории Luxuгy со следующим за ним сегментом внушителен средняя цена за номер в гостиницах категории Upper Upscale уже только на 2875 превысила средний показатель по рынку и составила $197 Стоимость номера в гостиницах категории Upscale сравнима со средним по рынку значением и составляет $160
Цены за номер в гостиницах класса Upper Midscale и Midscale ниже среднерыночных на 30 и 48 соответственно и составляют $105 и $79 за номер (данные за август)
AVERAGE DAILY RATE US DOLLAR (ADR) AUGUST 2013 YTD
QUALITY HOTEL MARKET TRADING Average daily rate in August 2013 estimated to $152 which is 5 higher than in August 2012 This positive dynamic was ensured by high-quality hotels the highest ADR growth was recorded in the Upscale segment ndash Up 16 compared to the same period last year Midscale market in this period was oriented to more democratic groups of demand ADR declined by 7 comparing to August 2012
The fall in ADR at the level of 043 and 221 was also recorded in the Upper Midscale and Luxury segments respectively but that is typical for the August ndash the most tourist month of the year
The results of 2013 (August YtD) showed a symbolic decrease in ADR (-11) comparing to 2012 that can be interpreted as a stabili-zation taking into account the weakening of the Ruble
The most aggressive in terms of price expectations remain Luxury market segment showing slight increase from $375 to $376 per room comparison with the general lowering of prices
Moscow hotels offer a wide range of prices by segment the most expensive ndash Luxury with ADR in August about $315 it is 10698 higher than the average for the Moscow quality market
There is an impressive gap between Luxury hotel prices and prices for the Upper Upscale segment Average daily rate for Upper Upscale is about $197 and only 2875 higher than the average for the Moscow quality market
0
50
100
150
200
250
300
350
400
2010 2011 2012 2013
Luxury Upper Upscale
Upscale Upper Midscale
Midscale Moscow average
0
10
20
30
40
50
60
70
80
2010 2011 2012 2013
Luxury Upper UpscaleUpscale Upper MidscaleMidscale Moscow average
25
MARKETBEAT Q3 2013
NtildeIumlETHIcircNtilde
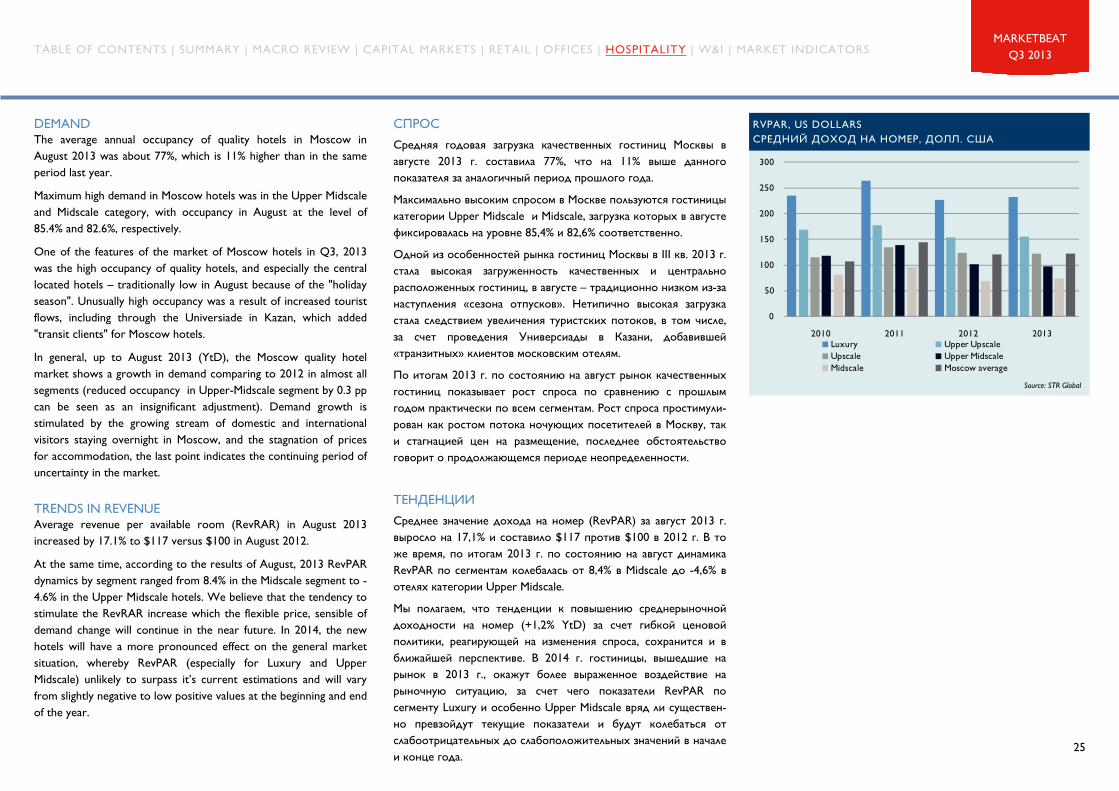
Средняя годовая загрузка качественных гостиниц Москвы в августе 2013 г составила 77 что на 11 выше данного показателя за аналогичный период прошлого года
Максимально высоким спросом в Москве пользуются гостиницы категории Upper Midscale и Midscale загрузка которых в августе фиксировалась на уровне 854 и 826 соответственно
Одной из особенностей рынка гостиниц Москвы в III кв 2013 г стала высокая загруженность качественных и центрально расположенных гостиниц в августе ndash традиционно низком из-за наступления laquoсезона отпусковraquo Нетипично высокая загрузка стала следствием увеличения туристских потоков в том числе за счет проведения Универсиады в Казани добавившей laquoтранзитныхraquo клиентов московским отелям
По итогам 2013 г по состоянию на август рынок качественных гостиниц показывает рост спроса по сравнению с прошлым годом практически по всем сегментам Рост спроса простимули-рован как ростом потока ночующих посетителей в Москву так и стагнацией цен на размещение последнее обстоятельство говорит о продолжающемся периоде неопределенности
OgraveAringIacuteAumlAringIacuteOumlEgraveEgrave
Среднее значение дохода на номер (RevPAR) за август 2013 г выросло на 171 и составило $117 против $100 в 2012 г В то же время по итогам 2013 г по состоянию на август динамика RevPAR по сегментам колебалась от 84 в Midscale до -46 в отелях категории Upper Midscale
Мы полагаем что тенденции к повышению среднерыночной доходности на номер (+12 YtD) за счет гибкой ценовой политики реагирующей на изменения спроса сохранится и в ближайшей перспективе В 2014 г гостиницы вышедшие на рынок в 2013 г окажут более выраженное воздействие на рыночную ситуацию за счет чего показатели RevPAR по сегменту Luxury и особенно Upper Midscale вряд ли существен-но превзойдут текущие показатели и будут колебаться от слабоотрицательных до слабоположительных значений в начале и конце года
DEMAND The average annual occupancy of quality hotels in Moscow in August 2013 was about 77 which is 11 higher than in the same period last year
Maximum high demand in Moscow hotels was in the Upper Midscale and Midscale category with occupancy in August at the level of 854 and 826 respectively
One of the features of the market of Moscow hotels in Q3 2013 was the high occupancy of quality hotels and especially the central located hotels ndash traditionally low in August because of the holiday season Unusually high occupancy was a result of increased tourist flows including through the Universiade in Kazan which added transit clients for Moscow hotels
In general up to August 2013 (YtD) the Moscow quality hotel market shows a growth in demand comparing to 2012 in almost all segments (reduced occupancy in Upper-Midscale segment by 03 pp can be seen as an insignificant adjustment) Demand growth is stimulated by the growing stream of domestic and international visitors staying overnight in Moscow and the stagnation of prices for accommodation the last point indicates the continuing period of uncertainty in the market
TRENDS IN REVENUE Average revenue per available room (RevRAR) in August 2013 increased by 171 to $117 versus $100 in August 2012
At the same time according to the results of August 2013 RevPAR dynamics by segment ranged from 84 in the Midscale segment to -46 in the Upper Midscale hotels We believe that the tendency to stimulate the RevRAR increase which the flexible price sensible of demand change will continue in the near future In 2014 the new hotels will have a more pronounced effect on the general market situation whereby RevPAR (especially for Luxury and Upper Midscale) unlikely to surpass itrsquos current estimations and will vary from slightly negative to low positive values at the beginning and end of the year
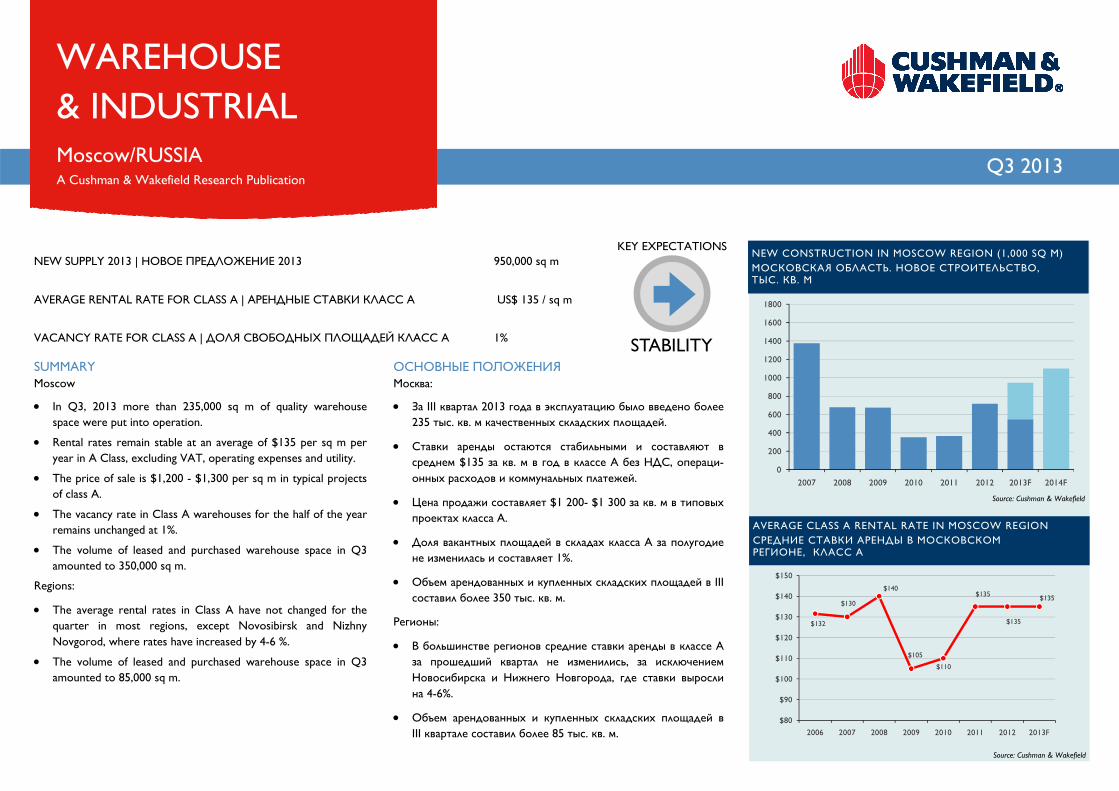
За III квартал 2013 года в эксплуатацию было введено более 235 тыс кв м качественных складских площадей
Ставки аренды остаются стабильными и составляют в среднем $135 за кв м в год в классе А без НДС операци-онных расходов и коммунальных платежей
Цена продажи составляет $1 200- $1 300 за кв м в типовых проектах класса А
Доля вакантных площадей в складах класса А за полугодие не изменилась и составляет 1
Объем арендованных и купленных складских площадей в III составил более 350 тыс кв м
Регионы
В большинстве регионов средние ставки аренды в классе А за прошедший квартал не изменились за исключением Новосибирска и Нижнего Новгорода где ставки выросли на 4-6
Объем арендованных и купленных складских площадей в III квартале составил более 85 тыс кв м
SUMMARY Moscow
In Q3 2013 more than 235000 sq m of quality warehouse space were put into operation
Rental rates remain stable at an average of $135 per sq m per year in A Class excluding VAT operating expenses and utility
The price of sale is $1200 - $1300 per sq m in typical projects of class A
The vacancy rate in Class A warehouses for the half of the year remains unchanged at 1
The volume of leased and purchased warehouse space in Q3 amounted to 350000 sq m
Regions
The average rental rates in Class A have not changed for the quarter in most regions except Novosibirsk and Nizhny Novgorod where rates have increased by 4-6
The volume of leased and purchased warehouse space in Q3 amounted to 85000 sq m
$132
$130
$140
$105
$110
$135
$135
$135
$80
$90
$100
$110
$120
$130
$140
$150
2006 2007 2008 2009 2010 2011 2012 2013F
KEY EXPECTATIONS
STABILITY
0
200
400
600
800
1000
1200
1400
1600
1800
2007 2008 2009 2010 2011 2012 2013F 2014F
27
MARKETBEAT Q3 2013
Source Cushman amp Wakefield
Source Cushman amp Wakefield
Source Cushman amp Wakefield
Source Cushman amp Wakefield
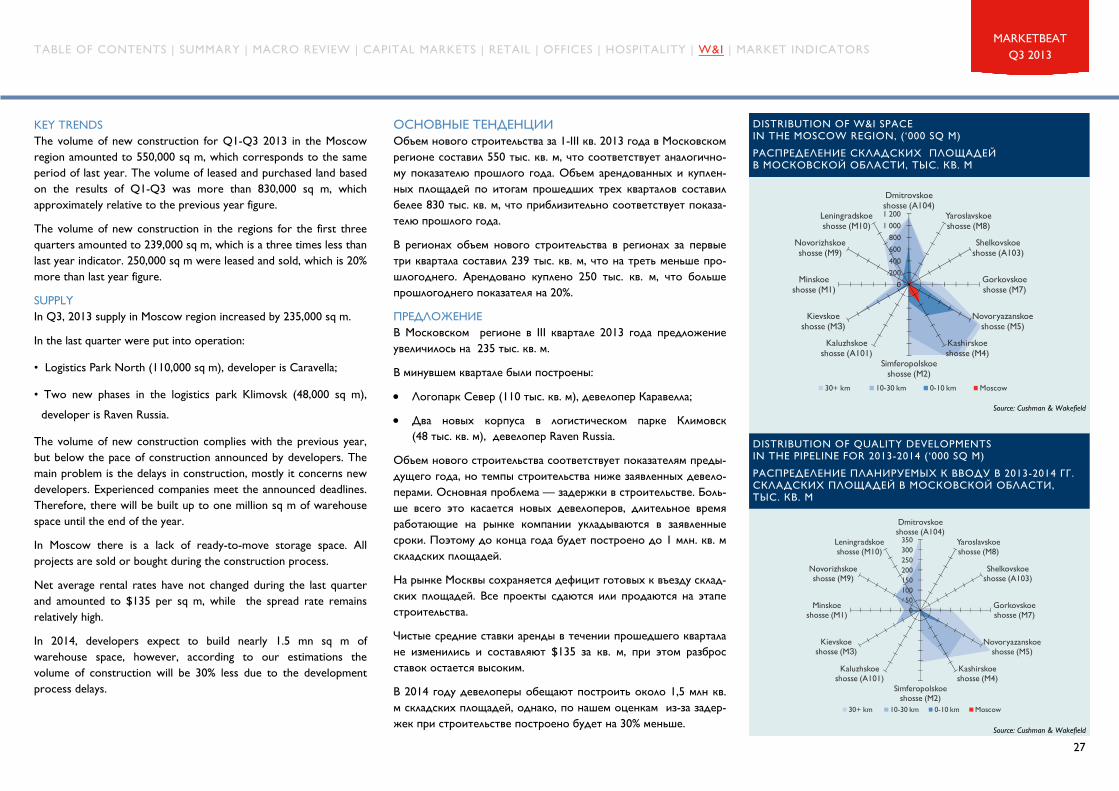
ОСНОВНЫЕ ТЕНДЕНЦИИ Объем нового строительства за 1-III кв 2013 года в Московском регионе составил 550 тыс кв м что соответствует аналогично-му показателю прошлого года Объем арендованных и куплен-ных площадей по итогам прошедших трех кварталов составил белее 830 тыс кв м что приблизительно соответствует показа-телю прошлого года
В регионах объем нового строительства в регионах за первые три квартала составил 239 тыс кв м что на треть меньше про-шлогоднего Арендовано куплено 250 тыс кв м что больше прошлогоднего показателя на 20
ПРЕДЛОЖЕНИЕ В Московском регионе в III квартале 2013 года предложение увеличилось на 235 тыс кв м
В минувшем квартале были построены
Логопарк Север (110 тыс кв м) девелопер Каравелла
Два новых корпуса в логистическом парке Климовск (48 тыс кв м) девелопер Raven Russia
Объем нового строительства соответствует показателям преды-дущего года но темпы строительства ниже заявленных девело-перами Основная проблема mdash задержки в строительстве Боль-ше всего это касается новых девелоперов длительное время работающие на рынке компании укладываются в заявленные сроки Поэтому до конца года будет построено до 1 млн кв м складских площадей
На рынке Москвы сохраняется дефицит готовых к въезду склад-ских площадей Все проекты сдаются или продаются на этапе строительства
Чистые средние ставки аренды в течении прошедшего квартала не изменились и составляют $135 за кв м при этом разброс ставок остается высоким
В 2014 году девелоперы обещают построить около 15 млн кв м складских площадей однако по нашем оценкам из-за задер-жек при строительстве построено будет на 30 меньше
KEY TRENDS The volume of new construction for Q1-Q3 2013 in the Moscow region amounted to 550000 sq m which corresponds to the same period of last year The volume of leased and purchased land based on the results of Q1-Q3 was more than 830000 sq m which approximately relative to the previous year figure
The volume of new construction in the regions for the first three quarters amounted to 239000 sq m which is a three times less than last year indicator 250000 sq m were leased and sold which is 20 more than last year figure
SUPPLY In Q3 2013 supply in Moscow region increased by 235000 sq m
In the last quarter were put into operation
bull Logistics Park North (110000 sq m) developer is Caravella
bull Two new phases in the logistics park Klimovsk (48000 sq m) developer is Raven Russia
The volume of new construction complies with the previous year but below the pace of construction announced by developers The main problem is the delays in construction mostly it concerns new developers Experienced companies meet the announced deadlines Therefore there will be built up to one million sq m of warehouse space until the end of the year
In Moscow there is a lack of ready-to-move storage space All projects are sold or bought during the construction process
Net average rental rates have not changed during the last quarter and amounted to $135 per sq m while the spread rate remains relatively high
In 2014 developers expect to build nearly 15 mn sq m of warehouse space however according to our estimations the volume of construction will be 30 less due to the development process delays
DISTRIBUTION OF QUALITY DEVELOPMENTS IN THE PIPELINE FOR 2013-2014 (lsquo000 SQ M) РАСПРЕДЕЛЕНИЕ ПЛАНИРУЕМЫХ К ВВОДУ В 2013-2014 ГГ СКЛАДСКИХ ПЛОЩАДЕЙ В МОСКОВСКОЙ ОБЛАСТИ ТЫС КВ М
DISTRIBUTION OF WampI SPACE IN THE MOSCOW REGION (lsquo000 SQ M) РАСПРЕДЕЛЕНИЕ СКЛАДСКИХ ПЛОЩАДЕЙ В МОСКОВСКОЙ ОБЛАСТИ ТЫС КВ М
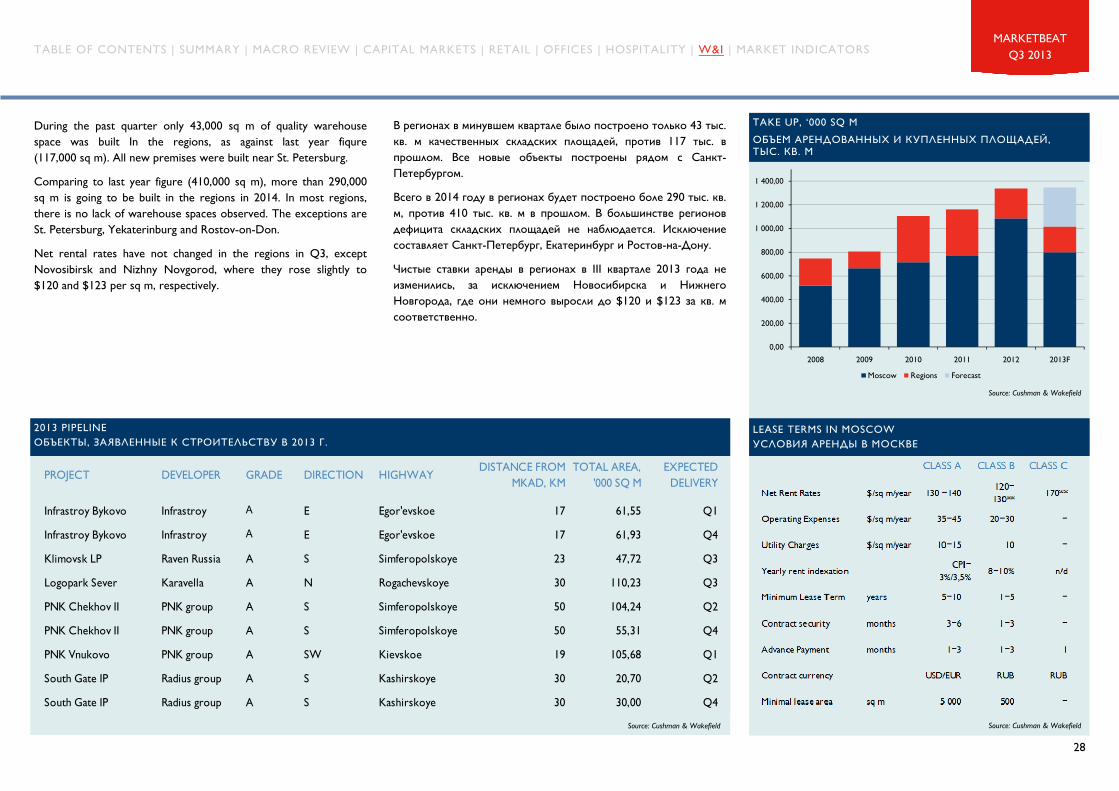
В регионах в минувшем квартале было построено только 43 тыс кв м качественных складских площадей против 117 тыс в прошлом Все новые объекты построены рядом с Санкт-Петербургом
Всего в 2014 году в регионах будет построено боле 290 тыс кв м против 410 тыс кв м в прошлом В большинстве регионов дефицита складских площадей не наблюдается Исключение составляет Санкт-Петербург Екатеринбург и Ростов-на-Дону
Чистые ставки аренды в регионах в III квартале 2013 года не изменились за исключением Новосибирска и Нижнего Новгорода где они немного выросли до $120 и $123 за кв м соответственно
Source Cushman amp Wakefield
TAKE UP lsquo000 SQ M ОБЪЕМ АРЕНДОВАННЫХ И КУПЛЕННЫХ ПЛОЩАДЕЙ ТЫС КВ М
Source Cushman amp Wakefield
During the past quarter only 43000 sq m of quality warehouse space was built In the regions as against last year fiqure (117000 sq m) All new premises were built near St Petersburg
Comparing to last year figure (410000 sq m) more than 290000 sq m is going to be built in the regions in 2014 In most regions there is no lack of warehouse spaces observed The exceptions are St Petersburg Yekaterinburg and Rostov-on-Don
Net rental rates have not changed in the regions in Q3 except Novosibirsk and Nizhny Novgorod where they rose slightly to $120 and $123 per sq m respectively
2013 PIPELINE ОБЪЕКТЫ ЗАЯВЛЕННЫЕ К СТРОИТЕЛЬСТВУ В 2013 Г
PROJECT DEVELOPER GRADE DIRECTION HIGHWAYDISTANCE FROM
MKAD KMTOTAL AREA
000 SQ MEXPECTED
DELIVERY
Infrastroy Bykovo Infrastroy А E Egorevskoe 17 6155 Q1
Infrastroy Bykovo Infrastroy А E Egorevskoe 17 6193 Q4
Klimovsk LP Raven Russia A S Simferopolskoye 23 4772 Q3
Logopark Sever Karavella A N Rogachevskoye 30 11023 Q3
PNK Chekhov II PNK group A S Simferopolskoye 50 10424 Q2
PNK Chekhov II PNK group A S Simferopolskoye 50 5531 Q4
PNK Vnukovo PNK group A SW Kievskoe 19 10568 Q1
South Gate IP Radius group A S Kashirskoye 30 2070 Q2
South Gate IP Radius group A S Kashirskoye 30 3000 Q4
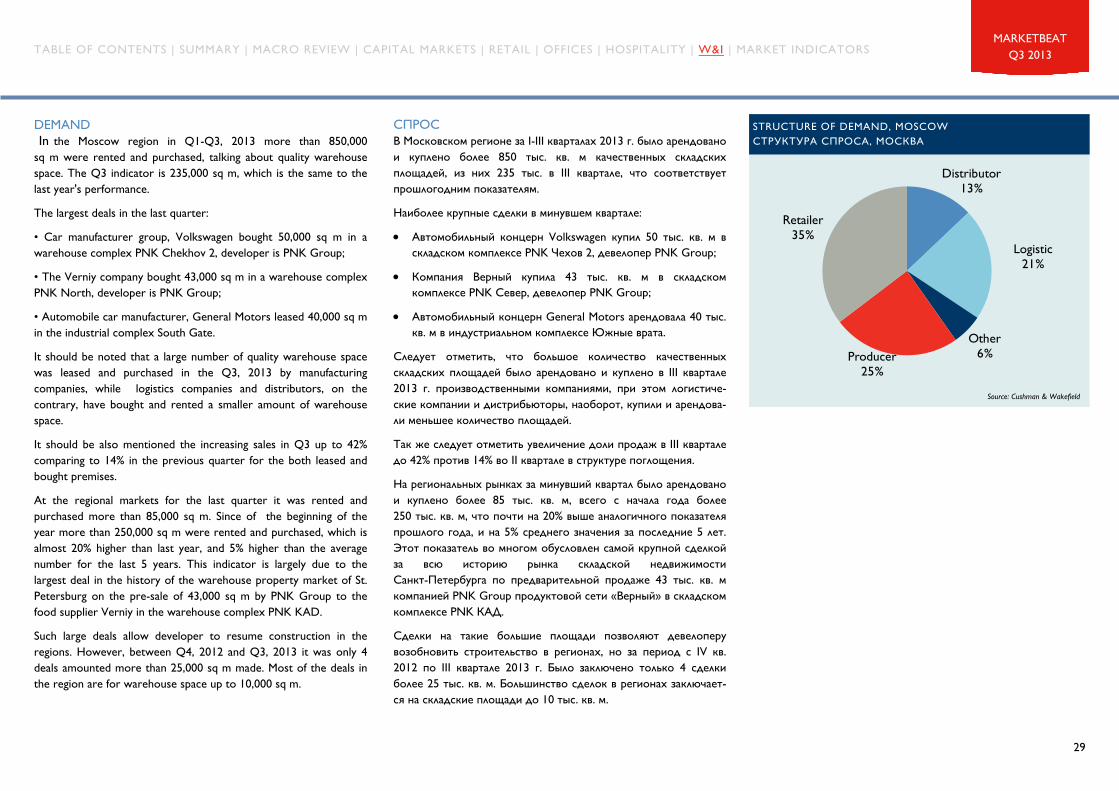
СПРОС В Московском регионе за I-III кварталах 2013 г было арендовано и куплено более 850 тыс кв м качественных складских площадей из них 235 тыс в III квартале что соответствует прошлогодним показателям
Наиболее крупные сделки в минувшем квартале
Автомобильный концерн Volkswagen купил 50 тыс кв м в складском комплексе PNK Чехов 2 девелопер PNK Group
Компания Верный купила 43 тыс кв м в складском комплексе PNK Север девелопер PNK Group
Автомобильный концерн General Motors арендовала 40 тыс кв м в индустриальном комплексе Южные врата
Следует отметить что большое количество качественных складских площадей было арендовано и куплено в III квартале 2013 г производственными компаниями при этом логистиче-ские компании и дистрибьюторы наоборот купили и арендова-ли меньшее количество площадей
Так же следует отметить увеличение доли продаж в III квартале до 42 против 14 во II квартале в структуре поглощения
На региональных рынках за минувший квартал было арендовано и куплено более 85 тыс кв м всего с начала года более 250 тыс кв м что почти на 20 выше аналогичного показателя прошлого года и на 5 среднего значения за последние 5 лет Этот показатель во многом обусловлен самой крупной сделкой за всю историю рынка складской недвижимости Санкт-Петербурга по предварительной продаже 43 тыс кв м компанией PNK Group продуктовой сети laquoВерныйraquo в складском комплексе PNK КАД
Сделки на такие большие площади позволяют девелоперу возобновить строительство в регионах но за период с IV кв 2012 по III квартале 2013 г Было заключено только 4 сделки более 25 тыс кв м Большинство сделок в регионах заключает-ся на складские площади до 10 тыс кв м
STRUCTURE OF DEMAND MOSCOW СТРУКТУРА СПРОСА МОСКВА
DEMAND In the Moscow region in Q1-Q3 2013 more than 850000 sq m were rented and purchased talking about quality warehouse space The Q3 indicator is 235000 sq m which is the same to the last years performance
The largest deals in the last quarter
bull Car manufacturer group Volkswagen bought 50000 sq m in a warehouse complex PNK Chekhov 2 developer is PNK Group
bull The Verniy company bought 43000 sq m in a warehouse complex PNK North developer is PNK Group
bull Automobile сar manufacturer General Motors leased 40000 sq m in the industrial complex South Gate
It should be noted that a large number of quality warehouse space was leased and purchased in the Q3 2013 by manufacturing companies while logistics companies and distributors on the contrary have bought and rented a smaller amount of warehouse space
It should be also mentioned the increasing sales in Q3 up to 42 comparing to 14 in the previous quarter for the both leased and bought premises
At the regional markets for the last quarter it was rented and purchased more than 85000 sq m Since of the beginning of the year more than 250000 sq m were rented and purchased which is almost 20 higher than last year and 5 higher than the average number for the last 5 years This indicator is largely due to the largest deal in the history of the warehouse property market of St Petersburg on the pre-sale of 43000 sq m by PNK Group to the food supplier Verniy in the warehouse complex PNK KAD
Such large deals allow developer to resume construction in the regions However between Q4 2012 and Q3 2013 it was only 4 deals amounted more than 25000 sq m made Most of the deals in the region are for warehouse space up to 10000 sq m
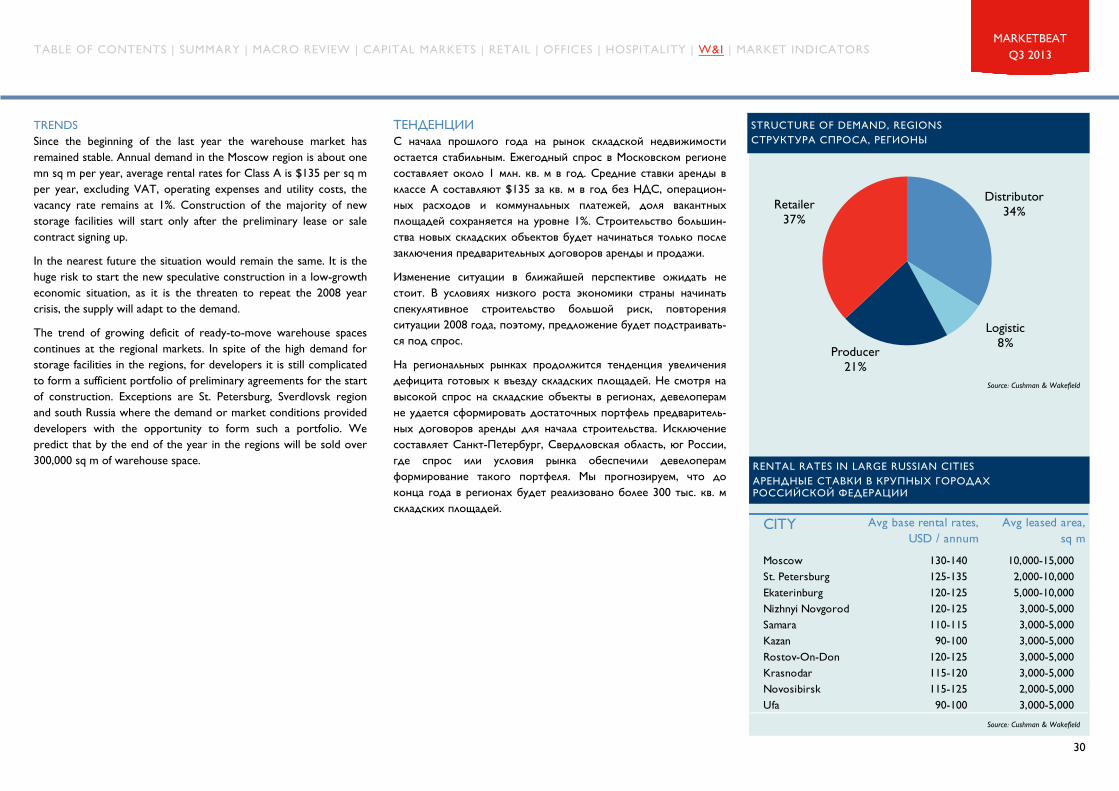
ТЕНДЕНЦИИ С начала прошлого года на рынок складской недвижимости остается стабильным Ежегодный спрос в Московском регионе составляет около 1 млн кв м в год Средние ставки аренды в классе А составляют $135 за кв м в год без НДС операцион-ных расходов и коммунальных платежей доля вакантных площадей сохраняется на уровне 1 Строительство большин-ства новых складских объектов будет начинаться только после заключения предварительных договоров аренды и продажи
Изменение ситуации в ближайшей перспективе ожидать не стоит В условиях низкого роста экономики страны начинать спекулятивное строительство большой риск повторения ситуации 2008 года поэтому предложение будет подстраивать-ся под спрос
На региональных рынках продолжится тенденция увеличения дефицита готовых к въезду складских площадей Не смотря на высокой спрос на складские объекты в регионах девелоперам не удается сформировать достаточных портфель предваритель-ных договоров аренды для начала строительства Исключение составляет Санкт-Петербург Свердловская область юг России где спрос или условия рынка обеспечили девелоперам формирование такого портфеля Мы прогнозируем что до конца года в регионах будет реализовано более 300 тыс кв м складских площадей
Source Cushman amp Wakefield
STRUCTURE OF DEMAND REGIONS СТРУКТУРА СПРОСА РЕГИОНЫ
TRENDS Since the beginning of the last year the warehouse market has remained stable Annual demand in the Moscow region is about one mn sq m per year average rental rates for Class A is $135 per sq m per year excluding VAT operating expenses and utility costs the vacancy rate remains at 1 Construction of the majority of new storage facilities will start only after the preliminary lease or sale contract signing up
In the nearest future the situation would remain the same It is the huge risk to start the new speculative construction in a low-growth economic situation as it is the threaten to repeat the 2008 year crisis the supply will adapt to the demand
The trend of growing deficit of ready-to-move warehouse spaces continues at the regional markets In spite of the high demand for storage facilities in the regions for developers it is still complicated to form a sufficient portfolio of preliminary agreements for the start of construction Exceptions are St Petersburg Sverdlovsk region and south Russia where the demand or market conditions provided developers with the opportunity to form such a portfolio We predict that by the end of the year in the regions will be sold over 300000 sq m of warehouse space
WampI MARKET IN RUSSIA ETHUcircIacuteIcircEcirc NtildeEcircEumlAgraveAumlNtildeEcircEgraveOtilde IumlIcircIgraveAringUgraveAringIacuteEgraveEacute Acirc ETHIcircNtildeNtildeEgraveEgrave
VACANCY RATE (EOY) Paris (Ile de France) 89 81 99 126 102 84 81 89 804
Budapest 59 172 173 188 195 208 194 217 2283
Warsaw 89 74 112 171 194 173 146 1621 1592
Madrid 55 38 37 55 73 84 93 95 972
TAKE UP 000 SQ MParis (Ile de France) 1 005 700 640 601 814 837 563 208 58
Budapest 152 229 308 280 210 327 355 31 21
Warsaw 260 445 556 216 451 743 483 183 112
Madrid 1 225 918 630 325 390 270 225 60 47
2013
36
MARKETBEAT Q3 2013
RESEARCH DEPARTMENT IcircOgraveAumlAringEuml EgraveNtildeNtildeEumlAringAumlIcircAcircAgraveIacuteEgraveEacute
Further information and copies of this report are available from Ellina Krylova
EllinaKrylovaeurcushwakecom
The information provided in this report is intended for informational purposes only and should not be relied on by any party without further independent verification Classifications of individual buildings are reviewed on a continuing basis and are subject to change The standards used in this process are consistent with those used by Moscow Research Forum and in the United States by the Society of Industrial and Office Realtors (SIOR) and BOMA International Reproduction of this report in whole or part is permitted only with written consent of Cushman amp Wakefield Data from this report may be cited with proper acknowledgment given
copy 2013 Cushman amp Wakefield All rights reserved
MORE INFORMATION AND CONTACTS ARE AVAILABLE ON WWWMARKETBEATRU EgraveIacuteOcircIcircETHIgraveAgraveOumlEgraveszlig IcircAacute IcircOgraveAumlAringEumlAring EgraveNtildeNtildeEumlAringAumlIcircAcircAgraveIacuteEgraveEacute Egrave IumlOacuteAacuteEumlEgraveEcircAgraveOumlEgraveEgrave AumlIcircNtildeOgraveOacuteIumlIacuteUcirc IacuteAgrave WWWMARKETBEATRU
DENIS SOKOLOV PARTNER RESEARCH DIRECTOR DenisSokoloveurcushwakecom
LADA BELAYCHUK ASSOCIATE DIRECTOR DEPUTY RESEARCH DIRECTOR LadaBelaychukeurcushwakecom
MAXIM ILYIN CONSULTANT CAPITAL MARKETS Maximilyineurcushwakecom
ALEXANDER KUNTSEVICH ANALYST WampI PROJECT MANAGEMENT AlexanerKuntsevicheurcushwakecom
SUMMARY КРАТКИЙ ОБЗОРhelliphelliphelliphelliphelliphelliphelliphelliphelliphelliphelliphelliphelliphelliphelliphelliphelliphelliphelliphelliphelliphelliphelliphelliphelliphelliphelliphelliphelliphelliphelliphelliphelliphelliphelliphelliphelliphelliphelliphelliphelliphelliphelliphelliphelliphelliphelliphelliphelliphelliphelliphelliphelliphelliphelliphelliphellip MACRO REVIEW МАКРОЭКОНОМИКАhelliphelliphelliphelliphelliphelliphelliphelliphelliphelliphelliphelliphelliphelliphelliphelliphelliphelliphelliphelliphelliphelliphelliphelliphelliphelliphelliphelliphelliphelliphelliphelliphelliphelliphelliphelliphelliphelliphelliphelliphelliphelliphelliphelliphelliphelliphelliphelliphelliphelliphelliphelliphelliphelliphellip CAPITAL MARKETS ИНВЕСТИЦИИhelliphelliphelliphelliphelliphelliphelliphelliphelliphelliphelliphelliphelliphelliphelliphelliphelliphelliphelliphelliphelliphelliphelliphelliphelliphelliphelliphelliphelliphelliphelliphelliphelliphelliphelliphelliphelliphelliphelliphelliphelliphelliphelliphelliphelliphelliphelliphelliphelliphelliphelliphelliphelliphelliphelliphelliphelliphellip RETAIL ТОРГОВАЯ НЕДВИЖИМОСТЬhelliphelliphelliphelliphelliphelliphelliphelliphelliphelliphelliphelliphelliphelliphelliphelliphelliphelliphelliphelliphelliphelliphelliphelliphelliphelliphelliphelliphelliphelliphelliphelliphelliphelliphelliphelliphelliphelliphelliphelliphelliphelliphelliphelliphelliphelliphelliphelliphelliphelliphellip OFFICES ОФИСНАЯ НЕДВИЖИМОСТЬhelliphelliphelliphelliphelliphelliphelliphelliphelliphelliphelliphelliphelliphelliphelliphelliphelliphelliphelliphelliphelliphelliphelliphelliphelliphelliphelliphelliphelliphelliphelliphelliphelliphelliphelliphelliphelliphelliphelliphelliphelliphelliphelliphelliphelliphelliphelliphelliphelliphelliphellip HOSPITALITY ГОСТИНИЧНАЯ НЕДВИЖИМОСТЬhelliphelliphelliphelliphelliphelliphelliphelliphelliphelliphelliphelliphelliphelliphelliphelliphelliphelliphelliphelliphelliphelliphelliphelliphelliphelliphelliphelliphelliphelliphelliphelliphelliphelliphelliphelliphelliphelliphelliphellip WAREHOUSE amp INDUSTRIAL СКЛАДСКАЯ НЕДВИЖИМОСТЬhelliphelliphelliphelliphelliphelliphelliphelliphelliphelliphelliphelliphelliphelliphelliphelliphelliphelliphelliphelliphelliphelliphelliphelliphelliphelliphelliphelliphelliphelliphelliphelliphelliphelliphelliphelliphelliphelliphelliphelliphelliphelliphelliphelliphelliphelliphelliphelliphelliphellip APPENDIX I MOSCOW MARKET INDICATORS ПРИЛОЖЕНИЕ I ИНДИКАТОРЫ РЫНКА МОСКВЫhelliphelliphelliphelliphelliphelliphelliphelliphelliphelliphelliphelliphelliphelliphelliphelliphelliphelliphelliphelliphelliphelliphelliphelliphelliphelliphelliphelliphelliphelliphelliphelliphelliphelliphelliphelliphelliphelliphelliphelliphellip APPENDIX II NOTABLE INVESTMENT TRANSACTIONS IN RUSSIA IN 2013 ПРИЛОЖЕНИЕ II ОСНОВНЫЕ ИНВЕСТИЦИОННЫЕ СДЕЛКИ В РОССИИ В 2012 - 2013 Гhelliphelliphelliphelliphelliphelliphelliphelliphelliphelliphelliphelliphelliphelliphelliphelliphelliphelliphelliphelliphelliphelliphelliphellip APPENDIX III PROPERTY MARKET INDICATORS IN KEY EUROPEAN MARKETS ПРИЛОЖЕНИЕ III ИНДИКАТОРЫ РЫНКА НЕДВИЖИМОСТИ В НЕКОТОРЫХ СТРАНАХ ЕВРОПЫhelliphelliphelliphelliphelliphelliphelliphelliphelliphelliphelliphelliphelliphelliphelliphelliphelliphelliphelliphellip
In Q3 Russian economy entered stagnation phase Government admitted lower than expected GDP growth at less than 2 IMF also reviewed its outlook for Russian economy down to 18 So far Russia is still ahead of Eurozone with its 03 growth rate but is way below other BRIC partners and even USA with their 25
Business in Russia is facing new challenge Until now there were either periods of fast growth or decline Similar growth rates were usual for late USSR Government officials admit that 2013 will be the slowest year in all modern history
Economy is supported primarily by consumer market which is fuelled by increase of pensions and salaries in public sector Retail trade turnover is growing at about 4 - much faster than economy in general Shopping centers footfall is similar to last year
However rental rates are still solid and year on year growth across sectors is expected at 6 which is similar to inflation levels
OUTLOOK We do not expect any notable changes in Q4 Business activity will remain low no change in rents is forecasted
Office market will be stagnating Net absorption will remain low no new tenants will appear on the market
Warehouse sector will outperform office because of the demand for modern logistic from such fast growing sectors as E-commerce and modern retailing
Retail real estate will be the bright spot with new retailers and new ideas coming to the market
In 2014 situation is likely to change While in Q1 we will face ldquoOlympics effectrdquo - growing interest to Russia from other countries and businesses Q2 will probably bring decrease of employment and slow-down of consumer sector We expect office real estate to remain as most stable sector in 2014
IumlETHIcircAtildeIacuteIcircCcedil Мы не ожидаем значительных перемен в четвертом квартале Деловая активность будет относительно низкой движения арендных ставок не ожидается
На офисном рынке будет наблюдаться стагнация Чистая абсорбция будет оставаться незначительной а большинство сделок будут связаны с переездом
Логистический сегмент будет развиваться немного более динамично обеспечивая потребность быстрорастущих сегментов таких как интернет-торговля и современный ритейл
Торговая недвижимость остается наиболее активным сегмен-том в который приходят и новые арендаторы и новые идеи
В 2014 году ситуация может поменяться Если в I квартале будет заметен laquoОлимпийский эффектraquo подогревающий интерес к России то со II квартала снижение занятости окажет негативное влияние на потребительский рынок Мы полагаем что в следующем году наиболее стабильным будет офисный сектор тогда как в торговле не исключена локальная коррекция
SOVEREIGN DEBT AS GDP IN SELECTED COUNTRIES ГОСДОЛГ В ВВП В СТРАНАХ МИРА
EcircETHAgraveOgraveEcircEgraveEacute IcircAacuteCcedilIcircETH В III квартале 2013 года основные драйверы роста экономики претерпели незначительные изменения по сравнению с преды-дущим кварталом
Так рост индекса промышленного производства с начала 2013 года продолжает замедляться Сократились объемы машино-строения выпуска транспортных средств производства металлов
Рост в сферах строительства услуг транспорта и связи также существенно замедлился
Темпы роста добычи полезных ископаемых увеличиваются в то время как обрабатывающий сектор показывает отрицательные результаты mdash снижение на 17 Рост производства сельскохо-зяйственной продукции объясняется завершением сезона
Инвестиционная активность и темпы роста показателей в сфере розничной торговли по сравнению с тем же периодом прошло-го года значительно снизились
Причины резкого снижения основных экономических показате-лей связывают с кризисом в ряде Европейских государств
Source Ministry for Economic Development
Source Ministry for Economic Development
SUMMARY Main economy drivers in Q3 2013 were slightly changed comparing to the previous quarter
The industrial production index is decreasing from the beginning of 2013 and still slowing down The volumes of engineering industry transport manufacture and metal production were reduced in this quarter
The increase in construction services transport and communica-tions is also slowed down since last quarter
The growth rate of mining and extraction is growing but at the same time the processing is falling down in this quarter on 17 The growth in agriculture sector is connected with season closure
Investment activity and the growth rate of retail sales are considerably decreased comparing with the same period of the last year
Expert expectations of the future are varied but they match in the fact that every economy driver in Russia at present are on the edge of their growth
BUDGET DEFICITSURPLUS IN SELECTED COUNTRIES ДЕФИЦИТПРОФИЦИТ БЮДЖЕТА В СТРАНАХ МИРА
MINISTRY FOR ECONOMIC DEVELOPMENT URALSIB CAPITAL RENAISSANCE CAPITALROSSTATS ACTUAL
который негативно повлиял на спрос на основные экспортируе-мые в Европу товары нефть и газ Снижение темпов промыш-ленного производства объясняют дефицитом инвестиций в производственные мощности и общему оттоку инвестиционно-го капитала из страны вызванного неблагоприятным деловым климатом
В III квартале 2013 года Министерство экономического развития понизило свой прогноз роста ВВП в 2013 году с 24 до 18 Аналитики Renaissance Capital также пересмотрели прогноз роста ВВП на 2013 год в сторону уменьшения до 22
Однако несмотря на снижение темпов роста экономики России в III квартале в IV квартале 2013 года и в начале 2014 года аналитики прогнозируют ускорение темпов роста в 2014 году они могут достигнуть от 26 до 3 Прогнозируется увеличение объемов промышленного производства и увеличе-ние объемов экспорта но только в том случае если до конца 2014 года цены на нефть останутся на стабильном уровне
In Q3 2013 Ministry of Economic Development dramatically reduced their forecasted GDP growth rate for the 2013 from 24 to 18 Renaissance Capital analytics are also changed their GDP growth forecast for 2013 to 22
The reasons of the main economy drivers are slowing is connected with crisis in Europe countries which affected the demand on main export goods crude oil and gas The slowing down of industrial production is caused by low-level investments in production facilities and investment outflow outside the country caused by unfavorable business climate
However despite of economy is slowing down in Q3 in Q4 and in the beginning of 2014 analytics forecast the acceleration of economy growth in Russia In 2014 the growth rate can reach 26-3 The forecasted increase in industrial production and in volume of export can happened in case that the oil prices will stay stable till the end of 2014
GDP AND YOY CPI IN 2013 ВВП И ИНФЛЯЦИЯ 2013 Г
Source Ministry for Economic Development
Source Ministry for Economic Development Rosstat Uralsib Capital Renaissance Capital
Q3 2013 MoscowRUSSIA A Cushman amp Wakefield Research Publication
CAPITAL MARKETS
Source Cushman amp Wakefield
TOTAL INVESTMENTS BY SECTOR ИНВЕСТИЦИИ ПО СЕКТОРАМ
EcircETHAgraveOgraveEcircEgraveEacute IcircAacuteCcedilIcircETH Объем инвестиций в коммерческую недвижимость в III квартале остался практически без изменений по сравнению с II кварталом 2013 года и составил 113 млрд долларов США
Москва сохраняет первенство по размеру инвестиций в коммер-ческую недвижимость и продолжает оставаться основным инвестиционным центром России В Москву привлекается более 80-90 от всех инвестиций в коммерческую недвижимость
На втором месте по объему инвестиций в коммерческую недвижимость находится Санкт-Петербург где в III квартале 2013 года инвестировано около 50 млн долларов США
Наш прогноз общего объема инвестиций в качественную коммерческую недвижимость за 2013 г остается неизменным и может составить 79 млрд долларов США В следующем 2014 году рынок ожидает незначительная стагнация и объем инвестиций будет находиться на уровне около 75 млрд долларов США
Source Cushman amp Wakefield
TOTAL INVESTMENTS | IcircAacuteUacuteAringIgrave EgraveIacuteAcircAringNtildeOgraveEgraveOumlEgraveEacute YTD 2013 US$ 575 bn
PRIME CAPITALIZATION RATES | NtildeOgraveAgraveAcircEcircEgrave EcircAgraveIumlEgraveOgraveAgraveEumlEgraveCcedilAgraveOumlEgraveEgrave Acirc IumlETHAgraveEacuteIgrave NtildeAringAtildeIgraveAringIacuteOgraveAring
INVESTMENTS YOY CHANGE AND SHARE OF OFFICE AND RETAIL SEGMENTS ИЗМЕНЕНИЯ ОБЪЕМА ИНВЕСТИЦИЙ И ДОЛИ ОФИСНОГО И ТОРГОВОГО СЕГМЕНТОВ
SUMMARY The total volume of commercial real estate investments in Q3 2013 was on the same level with previous one and amounted to $113 billion
Moscow takes the primary role according to the volume of investments in the commercial real estate industry and remains the major investment center in Russia The capital of Russia attracted more than 80-90 of total investments in the commercial real estate
The second place is for St Petersburg talking about the volume of total investments in Russian commercial real estate Nearly $50 million of dollars were attracted in Q3 2013
Our forecast of the total investment volume of quality real estate in Russia for 2013 stays unchanged and can reach the volume of $79 billion Next year we expect insignificant stagnation and the total volume of investments is going to be at the level of $75 billion
0
1 000
2 000
3 000
4 000
5 000
6 000
7 000
8 000
9 000
2006 2007 2008 2009 2010 2011 2012 F2013 F2014
mn
USD
Office Retail Industrial Other Forecast
4560
53545798
2256
3994
7547 74377900
5750
7500
0
20
40
60
80
100
0
1 000
2 000
3 000
4 000
2007
Q1
2007
Q2
2007
Q3
2007
Q4
2008
Q1
2008
Q2
2008
Q3
2008
Q4
2009
Q1
2009
Q2
2009
Q3
2009
Q4
2010
Q1
2010
Q2
2010
Q3
2010
Q4
2011
Q1
2011
Q2
2011
Q3
2011
Q4
2012
Q1
2012
Q2
2012
Q3
2012
Q4
2013
Q1
2013
Q2
2013
Q3
US
$ m
n
Total investments Office of total Retail of total
KEY EXPECTATIONS
STABILITY
8
MARKETBEAT Q3 2013
IcircNtildeIacuteIcircAcircIacuteUcircAring IumlIcircEumlIcircAEligAringIacuteEgraveszlig В регионах доля качественных проектов коммерческой недви-жимости в настоящее время крайне мала инвесторы в большей степени заинтересованы в laquoгородах-миллионникахraquo где рынок коммерческой недвижимости наиболее развит
В III квартале 2013 г основной объем инвестиций пришелся на офисную недвижимость Объем инвестиций в этом сегменте составил 8443 млн долларов США Среди крупных сделок можно отметить продажу офисного комплекса White Gardens Сумма сделки является одной и самых крупных на рынке за последнее время на рынке офисной недвижимости и составила около 740 млн долларов США
Объем инвестиционных сделок на рынке торговой недвижимо-сти в III квартале 2013 г составил 250 млн долларов США Од-нако если все запланированные сделки будут завершены то 2013 год станет рекордным по объему инвестиций в торговую недвижимость
Традиционно на складскую и индустриальную недвижимость приходится меньше всего совершенных инвестиционных сде-лок Так в прошедшем квартале на долю складской и индустри-альной недвижимости пришлось инвестиций на сумму около 332 млн долларов США
Совокупный объем инвестиций в коммерческую недвижимость за три квартала 2013 г составил 575 млрд долларов США По сравнению с наиболее развитыми рынками Лондона и Парижа объем инвестиций в Москве ниже на 70 чем за тот же период в Лондоне и на 20 ниже чем в Париже
NtildeOgraveAgraveAcircEcircEgrave EcircAgraveIumlEgraveOgraveAgraveEumlEgraveCcedilAgraveOumlEgraveEgrave Ставка капитализации на Прайм объекты в Москве составляют 85 для офисов 90 для торговых центров и 110 для склад-ской недвижимости Это выше среднеевропейского уровня на 250 базисных пунктов и на 450 бп выше наиболее развитых европейских рынков ndash Лондона и Парижа
TOP 30 INVESTMENT MARKETS ТОП-30 ИНВЕСТИЦИОННЫХ РЫНКОВ
MOSCOW PRIME CAPITALIZATION RATES СТАВКИ КАПИТАЛИЗАЦИИ laquoПРАЙМraquo В МОСКВЕ
Source Cushman amp Wakefield
MAIN DEVELOPMENTS In regions the share of quality real estate projects is small and investors are much more interested in economically developed cities with population of over a million where the real estate market is more matured
In the third quarter of 2013 the majority of investments came to the office segment with the volume of $8443 million Among the biggest deals in the market it worth mentioning White Gardens business centre realization (the amount of transaction is one of the largest in the office market for recent years and equals to $740 million
Retail was the less attractive sector for investors in Q3 and the volume of investments amounted to $250 million However if all planned deals are completed by the end of the year then 2013 will be the record-breaking year regarding the investment volume
Traditionally investments in warehouse and industrial real estate sectors are less popular in Russia and the number of completed deals is rather small here Thus the investments in warehouse and industrial sectors totaled about $332 million for the latest quarter
The total volume of investments in Q1-Q3 2013 reached the number of $575 billion Comparing the most developed markets of London and Paris the level of investments in Moscow is 70 lower than London and 20 lower than Paris for the same period of time
CAPITALISATION RATES The current yields for prime real estate projects in Moscow are 85 for offices 90 for retail and 110 for warehouse and industrial projects This rate is higher than average yields in Europe on 250 bps and on 450 bps higher of most developed investment markets of London and Paris
1 NYC Metro 1922 Tokyo 1543 London Metro 1404 LA Metro 1195 DC Metro 1086 SF Metro 827 Hong Kong 718 Paris 609 Singapore 4710 Sydney 4611 Dallas 4512 Atlanta 4413 Houston 4314 Toronto 4215 Boston 4016 Moscow 3917 Chicago 3918 Osaka 3319 Seoul 3220 So Fla 3221 Seattle 3122 Berlin-Brandenburg 3123 Stockholm 2824 Rhine-Ruhr 2825 Shanghai 2526 FrankfurtRhine-Main 2527 Melbourne 2528 Munich 2429 Phoenix 2430 Brisbane 24
6
8
10
12
14
16
18
2004
2005
2006
2007
2008
2009
2010
2011
2012
Q1
13
Q2
13
Q3
13
CBR refinancing rate Office primeShopping center prime WampI Prime
9
MARKETBEAT Q3 2013
INTERACTIVE CHARTS I EgraveIacuteOgraveAringETHAgraveEcircOgraveEgraveAcircIacuteUcircAring AtildeETHAgraveOcircEgraveEcircEgrave
RUSSIAN PROPERTY INVESTMENT MARKET I EgraveIacuteAcircAringNtildeOgraveEgraveOumlEgraveEgrave Acirc EcircIcircIgraveIgraveAringETHtimesAringNtildeEcircOacuteTHORN IacuteAringAumlAcircEgraveAEligEgraveIgraveIcircNtildeOgraveUuml ETHIcircNtildeNtildeEgraveEgrave
Q3 2013 MoscowRUSSIA A Cushman amp Wakefield Research Publication
RETAIL
Source Rosstat
RETAIL TRADE TURNOVER AND REAL DISPOSABLE INCOME RUSSIA YOY РОЗНИЧНЫЙ ТОВАРООБОРОТ И РЕАЛЬНЫЕ РАСПОЛАГАЕМЫЕ ДОХОДЫ РОССИЯ
EcircETHAgraveOgraveEcircEgraveEacute IcircAacuteCcedilIcircETH В целом по России объемы нового строительства торговых площадей так же высоки как и в прошлом 2012 г В течение трех кварталов 2013 г в 22 российских городах появились новые торговые комплексы Некоторое снижение темпов строительства в Москве в 2012-2013 гг будет компенсировано ожидаемыми масштабными открытиями в 2014 г Посещае-мость торговых центров в Москве находится на высоком уровне потребительские ожидания стабильны В связи с дефицитом предложения в торговых центрах Москвы ритейлеры активно изучают российские регионы В 2013 г как и в течение 2012 г ставки аренды были стабильны
CONSUMER CONFIDENCE INDEX ИНДЕКС ПОТРЕБИТЕЛЬСКОГО ОЖИДАНИЯ
IumlIcircOgraveETHAringAacuteEgraveOgraveAringEumlEgrave Реальные располагаемые денежные доходы населения России (доходы за вычетом обязательных платежей скорректирован-ные на индекс потребительских цен) по оценке Росстата в августе 2013 г выросли на 21 по сравнению с августом 2012 г в январе-августе 2013 г выросли на 41 в сравнении с аналогичным периодом прошлого года Среднемесячная зарплата в России в августе 2013 г составила 29 020 рублей и выросла на 128 по сравнению с августом 2012 года
BRIEF SUMMARY In general the volume of new construction of retail spaces in Russia can be described as high as it used to be in the past 2012 New retail complexes have been constructed and delivered for the past 3 quarters of 2013 in 22 Russian cities There is a reduction in the сconstruction of new quality retail premises in Moscow for 2012-2013 which is going to be compensated by large-scale and expected projects in 2014 Attendance of Moscow shopping centers is at the high level consumer expectations are stable Due to the shortage of supply in the shopping malls retailers actively seek for new spaces in Russian regions During the 2013 rental rents remains stable as it was in 2012
CONSUMERS According to Rosstat real income of the Russian population grew up by 21 comparing to August 2012 Moreover it increased by 41 in January-August 2013 relatively to the same period of time last year The average monthly salary was 29020 rubles in August 2013 and increased by 128 comparing to the past year
Total retail trade growth for January-May was 38
Source Rosstat
VACANCY RATE ДОЛЯ СВОБОДНЫХ ПЛОЩАДЕЙ (Prime shopping centers Moscow) | (действующие прайм ТЦ Москва) 12
PRIME RENTAL RATE INDICATOR | ПРАЙМ ИНДИКАТОР АРЕНДНЫХ СТАВОК (Prime shopping center retail gallery Moscow) | (галереи в прайм ТЦ Москва) US$ 3800
1642 mn sq m 572 quality projects
TOTAL QUALITY STOCK IN RUSSIA ОБЩЕЕ КОЛИЧЕСТВО КАЧЕСТВЕННЫХ ТОРГОВЫХ ПЛОЩАДЕЙ В РОССИИ
KEY EXPECTATIONS
STABILITY
-10
-5
0
5
10
15
20
2007 2008 2009 2010 2011 2012 F2013 F2014
Retail trade turnover growth Real personal disposable income growth
RETAILERS Retailer demand has remained relatively strong in Russia with limited new market entrants but existing retailers looking to expand and experiment with new format types Vacancy rates in prime shopping centres in Moscow are at extremely low levels with occupiers now transferring interest to the high street as shopping centre space cannot meet the demand
Those brands already present in Russia are actively looking to expand into the regions
NEWCOMER BRANDS WITH DEVELOPMENT PLANS IN RUSSIA НОВЫЕ ПЛАНЫ РАЗВИТИЯ РИТЕЙЛЕРОВ В РОССИИ
Source official websites and other media
REGION CITY NEWCOMERS 2013 COMING SOONSouthern Volgograd Leroy Merlin
Armavir LentaSochi Bata Louis Vuitton StarbucksTaganrog LentaKrasnodar Barker Bata StarbucksRostov-on-Don Starbucks
ETHEgraveOgraveAringEacuteEumlAringETHUcirc Спрос на качественные торговые помещения со стороны ритейлеров высокий Ритейлеры продолжают экспериментиро-вать с новыми форматами В связи с дефицитом предложения в торговых центрах Москвы ритейлеры обращают все больше внимания на торговые улицы
Продолжается активная экспансия во все регионы России
GLOBAL RETAILERS COMING TO RUSSIA НОВЫЕ МЕЖДУНАРОДНЫЕ РИТЕЙЛЕРЫ ПЛАНИРУЮЩИЕ НАЧАТЬ РАБОТУ В РОСИИ
NEW GLOBAL RETAILERS IN 2013 НОВЫЕ МЕЖДУНАРОДНЫЕ РИТЕЙЛЕРЫ В РОССИИ 2013
CushmanampWakefield Research quarterly monitoring of 9 quality shopping centers (total GLA - 05 mn sq m) These shopping centers have been opened more than one year ago and have a clear catchment area
OgraveIcircETHAtildeIcircAcircUcircAring IumlIcircIgraveAringUgraveAringIacuteEgraveszlig В III квартале посещаемость торговых центров в Москве находилась на более высоком уровне чем в предыдущие годы в этот период Доля покупателей (количество людей совершив-ших покупки относительно общего количества посетителей) снизилась до 308
Уровень свободных помещений в качественных торговых центрах находится на предельно низком уровне Небольшой рост в III квартале 2013 года (на 08 пп) связан с ротацией арендаторов в одном из торговых центров (один из этажей торгового центра в ближайшее время будет полностью занят крупным арендатором которые в настоящее время проводит ремонт помещения)
В целом в Москве продолжает наблюдаться дефицит предложе-ния в качественных торговых центрах
ДОЛЯ laquoУСПЕШНЫХ ПОКУПАТЕЛЕЙraquo ldquoSUCCESSFUL SHOPPERSrdquo
FOOTFALL ПОСЕЩАЕМОСТЬ ТОРГОВЫХ ЦЕНТРОВ
Source Cushman amp Wakefield
Source Cushman amp Wakefield
Source Cushman amp Wakefield
CushmanampWakefield Research quarterly monitoring of 9 quality shopping centers (total GLA - 05 mn sq m) These shopping centers have been opened more than one year ago and have a clear public contact area Number of successful shoppers remained stable (share of shoppers who make purchases out of all visitors of the monitored shopping centers)
The total number of retail outlets in the observed sample is 865 (brands in shopping galleries without operators of restaurant zones and without service companies like dry cleaning banks etc) These retail outlets are filled with 552 unique brands
VACANCY RATE УРОВЕНЬ СВОБОДНЫХ ПОМЕЩЕНИЙ
Petrovsky Passage
RETAIL SPACE
In Q3 the visiting rate of the retail centers was at the higher level than it used to be in the last year Buyers share (amount of people who made a purchase compared to total number of visitors) decreased with the number of 308 The level of vacant spaces in the quality retail centers is at the lowest level The small increase in the third quarter (08 points) is associated with the rotation of tenants in one of the shopping centers (one of retail centerrsquos floors is going to be fully occupied by the leaseholder who is currently conducting repair facilities)
In general there is a lack of supply in the quality retail centers in Moscow
Announced developers plans CW Forecast New construction YTD
НОВОЕ СТРОИТЕЛЬСТВО В III квартале в России было введено в эксплуатацию 15 новых торговых центров общей торговой площадью 292 750 кв м География нового строительства ndash от Иркутска и Ангарска до Сочи В основном стоятся торговые центры (75 всех новых качественных торговых площадей) также торговые площади открываются в многофункциональных комплексах Средний размер новых торговых центров уменьшается в 2013 году он составляет 26 тыс кв м что на 30 меньше чем в 2011 году
В III квартале крупнейшим открытым торговым объектом стал торгово-развлекательный центр Жемчужная Плаза (GLA 48 тыс кв м) в Санкт-Петербурге построенный в рамках комплексной застройки микрорайона Балтийская Жемчужина
В III квартале в Москве был открыт один новый торгово-развлекательный центр Райкин Плаза Также были открыты но-вые фазы комплекса Отрада В Москве новые качественные торговые площади строятся в разных форматах ndash торгово-развлекательные центры (Рио Райкин плаза) аутлет-центры (Внуково и Fashion House) многофункциональные комплексы (Белая Площадь Эволюция) До конца 2013 г в Московском регионе (г Павловский Посад) планируется открытие ритейл парка Белла Вита (GLA 36 тыс кв м)
NEW CONSTRUCTION 2013 RUSSIAQUALITY RETAIL STORES НОВОЕ СТРОИТЕЛЬСТВО В 2013 ГОДУ РОССИЯ КАЧЕСТВЕННЫЕ ТОРГОВЫЕ ОБЪЕКТЫ
Source Cushman amp Wakefield
QUALITY RETAIL CONSTRUCTION rsquo000 SQ M RUSSIA СТРОИТЕЛЬСТВО КАЧЕСТВЕННЫХ ТОРГОВЫХ ПЛОЩАДЕЙ ТЫС КВ М РОССИЯ
NEW CONSTRUCTION In Q3 15 new retail centers were delivered in Russia with a total area of 292750 sq m The geography of new construction is located from Irkutsk and Angarsk to Sochi The majority of new premises are located in shopping centers (75 of new quality retail space) besides retail space in multifunctional complexes Average area of newly constructed shopping centers is decreasing in 2013 it was about 26000 sq m which is 30 lower than in was in 2011
In the third quarter retail and entertainment center Pearl Plaza (GLA 48000 sq m) was awarded the name of the largest retail project in St Petersburg It was built as a part of the complex development in the Baltic Pearl micro region
Besides the new shopping and entertainment mall Raykin Plaza was delivered in the Q3 Also new phases of the Otrada complex were delivered New quality retail spaces are developed in various formats in Moscow ndash shopping and entertainment centers (Rio Raykin Plaza) outlet-centers (Vnukovo and Fashion House) multifunctional complexes (White Square Evolution) Till the end of 2013 it is planned to open retail park Bella Vita (GLA 36000 sq m) in the Moscow region (Pavlovskiy Posad city)
Standard lease terms for gallery tenants are between 3-5 years break options are rare For anchor tenants (including fashion anchors) lease terms are up to 20 -25 years and break options are becoming popular
Rents are typically payable monthly in advance Turnover percentage rents are increasingly seen in shopping centres Rental rates are generally calculated in USD Euricirc or commercial units are used In less quality shopping centres rental rates are calculated in RUR
Annual indexation is typical between 3-10 or at a level of USD EU CPI The practice of premium key money payments is seldom seen in Russia Rent reviews are rare on the market
Service ChargesIcirciumlaringethagraveoumlegraveicirciacuteiacuteucircaring iumleumlagraveogravearingaeligegrave
Service charge is payable by tenants at either an ldquoopen bookrdquo basis or more common as a fixed cost Utilities payments are charged on consumption Building insurance is normally charged back to tenant via service charge
Local property taxes are not payed separately they are generally included in the service charges Iacuteagraveeumlicircatilde iacuteagrave iacutearingaumlacircegraveaeligegraveigraveicircntildeograveuuml icircaacuteucircdivideiacuteicirc acirceumlthorndivideagravearingograventildeyuml acirc icirciumlaringethagraveoumlegraveicirciacuteiacuteucircaring iumleumlagraveogravearingaeligegrave
Other costsAumlethoacuteatildeegravearing iumleumlagraveogravearingaeligegrave
EcircIcircIgraveIgraveAringETHtimesAringNtildeEcircEgraveAring OacuteNtildeEumlIcircAcircEgraveszlig Acirc OgraveIcircETHAtildeIcircAcircUcircOtilde OumlAringIacuteOgraveETHAgraveOtilde Ставки аренды для помещений в торговых галереях качествен-ных торговых центров в Москве находятся в диапазоне от 500 до 4 000 долларов США (за кв м в год без НДС и других платежей) В течение трех кварталов 2013 и всего прошедшего 2012 года ставки аренды в торговых центрах были стабильны Прайм ритейл индикатор в Москве составляет 3 800 долларов США (за кв м в год без НДС и других платежей) Однако в 2013 году наметилась тенденция к повышению ставок аренды в лучших торговых центрах поэтому рост ставок на лучшие помещения может быть выше 5 (текущий консервативный прогноз)
Вне Москвы ставки аренды в торговых центрах в среднем на 30-60 ниже в зависимости от региона
Дополнительно к ставке аренды ритейлеры платят сервисные сборы за обслуживание (150-250 долларов США за кв м в год для помещений размером менее 500 кв м) за маркетинг (10-25 долларов США за кв м в год) также иногда бывают и другие дополнительные платежи
Source Cushman amp Wakefield
Source Cushman amp Wakefield
PRIME RETAIL INDICATOR MOSCOW ПРАЙМ РИТЕЙЛ ИНДИКАТОР В ТОРГОВЫХ ЦЕНТРАХ МОСКВА
Prime retail indicatormdashbase asking rental rate for the 100-200 sq m gallery unit at the ground floor of the prime shopping centers US$ per sq m per annum triple net
INDICATIVE RENTAL RATES IN QUALITY SHOPPING CENTER RETAIL GALLERIES MOSCOW СРЕДНИЕ АРЕНДНЫЕ СТАВКИ В ГАЛЕРЕЕ КАЧЕСТВЕННЫХ ТОРГОВЫХ ЦЕНТРОВ МОСКВА
COMMERCIAL RATES IN SHOPPING MALLS Moscow retail gallery rental rates are in the range of US$ 500- 4000 (per sq m per year before VAT and other expenses) depending on the size of the retail unit and the type of retailer Throughout Q1-Q3 and the whole of 2012 rental rates were stable across all sub-sectors
Moscowrsquos prime retail indicator is US$ 3800 per sq m per annum as a base rate However a tendency towards rate increases was observed in 2013 and near future growth may be higher than 5 (our current conservative estimate)
In other cities rental rates in shopping malls are typically 30 to 60 below Moscow levels
Additionally among other payments there are operational expenses (US$ 150-250 per sq m annually for units smaller than 500 sq m) marketing (US$ 10-25 per sq m annually) and others depending on the project
QUALITY RETAIL LEASE STRUCTURE СТРУКТУРА ДОГОВОРОВ АРЕНДЫ В КАЧЕСТВЕННЫХ ТОРГОВЫХ ПОМЕЩЕНИЯХ
ANCHORS
lt100 100 - 300 300 - 1200 1200 - 3500 3500-7000
Food court $1800-$2000
Kiosks $5000-$8000
Restaurant $600-$1000 $700
Clothing $1 600 $1 200 $700 $400
Shoes $2 200 $1 700 $1 200 $800
White and Brown $500
Supermarket $500-$600
Hypermarket $250-$450
Cinema $250-$320
BUSINESSGLA SQ M
RETAIL GALLERY MINI ANCHORS
Source Cushman amp Wakefield
15
MARKETBEAT Q3 2013
ТОРГОВЫЕ УЛИЦЫ На центральных торговых улицах свободно (предлагается в аренду или готовится к открытию) около 5 имеющихся поме-щений Ставки аренды в торговых коридорах стабильны В по-следние несколько лет есть тенденция к увеличению сроков аренды если еще три года назад договоры были чаще всего краткосрочные (на 11 месяцев) то сейчас трехлетние договора аренды становятся все более распространенными
Анализ торговых помещений на наиболее проходимых торго-вых улицах в центре города показывает что самыми популяр-ными категориями арендаторов являются предприятия питания (кафе рестораны) и магазины одежды и обуви которые занима-ют 29 и 21 всех помещений на этих улицах соответственно Значимыми арендаторами являются компании предлагающие услуги (спа парикмахерские медицинские услуги предприятия связи салоны фотографии юридические услуги) ndash они занимают 10 всех торговых помещений на главных улицах центра горо-да По 5 всех площадей занимают отделения банков ювелир-ные салоны магазины косметики и аксессуаров
Source Cushman amp Wakefield
HIGH STREETS Nearly 5 of the existing premises are freely available (are offered for lease or being prepared for delivery) in the central high streets Rental rates in the trade corridors are stable There is a tendency for increasing lease terms in the last few years As an example three years ago contracts used to be short-term mostly (11 months) and now agreements for the 3 and 5 years period become more and more widespread
The analysis of the retail spaces on the most passable areas in the city centre shows that the most popular categories of tenants are catering (cafe restaurants) and clothing shops They occupy 29 and 21 of all premises respectively Significant tenants are those who offers the following services spa hairdressers medical services communications companies photography and legal services ndash all of them occupy 10 of retail premises on the main streets of the city banks jewelry stores cosmetic stores and accessories occupy 5
AVERAGE RENTAL RATES ON HIGH STREETS IN MOSCOW СРЕДНИЕ АРЕНДНЫЕ СТАВКИ В ТОРГОВЫХ КОРИДОРАХ МОСКВА
HIGH STREET TENANT MIX MOSCOW Q3 2013 | СТРУКТУРА АРЕНДАТОРОВ В ТОРГОВЫХ КОРИДОРАХ МОСКВА III КВ 2013
Food Restaurants Cafes Fashion and footwareServices Bank ExchangeAccessories Optics Watches JewelryCosmetics Pharmacy Perfumery Other
HIGH STREET RENTAL RATES MOSCOW АРЕНДНЫЕ СТАВКИ В ТОРГОВЫХ КОРИДОРАХ МОСКВА
Data of the following trade corridors was used to conduct the analysis Tverskaya Petrovka-Stoleshnikov-Kuznetsky Most Nikolskaya Pyatnytskaya Pokrovka-Maroseyka In total these trade corridors located 710 outlets
US$ per sq m per annum triple net Aumlicirceumleumlagraveethucirc NtildeOslashAgrave ccedilagrave ecircacircigrave acirc atildeicircauml aacuteagraveccedilicircacircagraveyuml ntildeograveagraveacircecircagrave agraveetharingiacuteaumlucirc
OgraveIcircETHAtildeIcircAcircUcircAring OacuteEumlEgraveOumlUcirc mdash IumlAringOslashAringOtildeIcircAumlIacuteUcircAring CcedilIcircIacuteUcirc Важнейшим событием для торговых улиц стала программа развития пешеходных зон в Москве активно поддерживаемая Правительством города На тех улицах где уже отменили движение транспорта (в первую очередь Большая Дмитровка) происходит смена потоков посетителей (от пассажиров к пешеходам) Пешеходные улицы имеют огромный потенциал с точки зрения торговли и уже сейчас ритейлеры проявляют большой интерес к пешеходным районам Расширение пешеходных районов значительно увечит предложение качественных торговых помещений на улицах в Москве
HIGH STREETS mdash PEDESTRIAN AREA The most important event for the high streets became the development of pedestrian zones in Moscow which is actively supported by the city government There is a change of visitor flows (from passengers to pedestrians) on those streets where the driving was cancelled (it concerns Bolshaya Dmitrovka street first of all) There is a huge potential for retail activity talking about pedestrian streets and retailers show great interest in developing of those areas The expansion of pedestrian zones will significantly increase the supply of the quality retail premises in Moscow
HIGH STREETS mdash PEDESTRIAN AREA ТОРГОВЫЕ УЛИЦЫ mdash ПЕШЕХОДНЫЕ ЗОНЫ
With vehicular traffic restriction | Oacuteeumlegraveoumlucirc atildeaumlaring icircatildeethagraveiacuteegravedividearingiacuteicirc aumlacircegraveaeligaringiacuteegravearing ograveethagraveiacutentildeiumlicircethograveagrave
Opened for vehicles | Oacuteeumlegraveoumlucirc atildeaumlaring icircograveecircethucircograveicirc aumlacircegraveaeligaringiacuteegravearing ograveethagraveiacutentildeiumlicircethograveagrave
Q3 2013 MoscowRUSSIA A Cushman amp Wakefield Research Publication
OFFICE MARKET
IcircAacuteCcedilIcircETH ETHUcircIacuteEcircAgrave В III квартале 2013 г рынок продолжает оставаться активным спрос и предложение сбалансированы ставки аренды стабильны
Тенденция ослабления рынка офисной недвижимости отмечен-ная впервые в предыдущем квартале подкрепляется новыми фактами
Продолжилось снижение общего объема заключаемых сделок аренды и покупки в III квартале общий объем заключенных сделок составил 385 836 кв м что на 20 ниже среднего уровня 2011-2012 гг
Даже небольшой рост объема вывода на рынок новых помеще-ний приводит к увеличению доли свободных помещений За счет одного крупного объекта (Башня Меркурий в Москва-Сити арендуемой площадью 87 547 кв м) объемы ввода в эксплуатацию офисных площадей класса А в III квартале увеличились вдвое относительно средних объемов строительст-ва последних трех лет В результате уровень свободных помещений в классе А в среднем по Москве увеличился на 35 пп а в районе Москва-Сити mdash на 156 пп
Средняя ставка аренды не изменяется в течение последних трех кварталов в то время как инфляции в России за январь-май 2013 превысила уровень 7
ABSORPTION AND NEW CONSTRUCTION CLASSES A AND B (MN SQ M)
OVERVIEW The third quarter of the year saw the office market remain healthy with steady levels of demand Rents held firm There is a tendency of weakening signs in the office market which was noted for the first time in the previous quarter Now it is supported by some new facts
Overall demand level has continued to decrease Q3 take-up is 385836 sq m which is 20 less than the average take-up level for 2011-2012
Even moderate growth of new office space affects the vacancy rate In Q3 the delivery of Mercury Tower in Moscow City submarket (87547 sq m of office rentable area) doubled the quarterly Class A new construction volume (compared to the average number during the last three years) As a result the level of vacant space has increased by 35 percentage points in the Moscow Class A sector Talking about Moscow City submarket the volume of vacant space has increased by 156 points
Rental rates remain unchanged the CPI is above 7 (January-May 2013 data)
Source Cushman amp Wakefield
TOTAL STOCK MOSCOW | ОБЩИЙ ОБЪЕМ ПРЕДЛОЖЕНИЯ В МОСКВЕ 1360 mn sq m
VACANCY RATE | ДОЛЯ СВОБОДНЫХ ПЛОЩАДЕЙ 128
US$ 860 AVERAGE RENTAL RATE CLASS A | СРЕДНЯЯ АРЕНДНАЯ СТАВКА КЛАСС А
Q1-Q3 DEMAND (TAKE-UP) | ОБЪЕМ СДЕЛОК АРЕНДЫ И ПРОДАЖИ В 1-III КВ 2013 1190138 sq m
Q1-Q3 2013 NEW CONSTRUCTION | НОВОЕ СТРОИТЕЛЬСТВО В 1-III КВ 2013 594009 sq m
SUPPLY By the end of Q3 2013 Moscow had 136 mn sq m of quality office space Nine new office buildings were completed with a rentable area of 244587 sq m in Q3 New construction volume remains moderate
Nearly 50 of new office space delivered in 2013 is located in the Moscow suburbs (outside TTR) while the demand is drawn towards the city center So the suburbs are in danger of oversupply during the last four quarters the vacancy rate in suburban submarkets has increased by 58 percentage points from 11 in Q3 2013 to 168 in Q3 2013
In the Central and Prime business areas (with the exception of Moscow City submarket) the vacancy rate is stable while in several central submarkets (such as Tagansky Frunzensky Novoslobodsky) the availability is decreasing
After the recent delivery of Mercury Tower with 87547 sq m of office rentable space Moscow City availability has doubled Hence the Moscow City vacancy rate grew by 156 percentage points up to 327
Altogether there are 154 mn sq m of available office premises in existing buildings and 35 mn sq m is under speculative construction
IumlETHAringAumlEumlIcircAEligAringIacuteEgraveAring По состоянию на конец III квартала 2013 года в Москве насчи-тывалось 136 млн кв м качественных офисов В III квартале было введено в эксплуатацию 9 офисных зданий общей арен-дуемой площадью 244 587 кв м Объемы нового строительства продолжают оставаться умеренными
Около 50 новых офисных площадей вышедших на рынок в 2013 году находятся в удаленных от центра города районах (за пределами ТТК) В то же время спрос продолжает тяготеть к центру города В результате на окраинах города наблюдается тенденция к росту избыточности предложения Так в течение 4-х последних кварталов уровень свободных помещений в рай-онах за пределам ТТК увеличился на 58 пп с 11 (III кв 2012) до 168 (III кв 2013) Внутри ТТК уровень свободных помеще-ний стабилен а в некоторых субрынках (Таганском Фрунзен-ском Новослободском) свободных помещений становится меньше Исключение составляет субрынок Москва-Сити где после ввода в эксплуатацию Башни Меркурий площадью 87 547 кв м объем свободных помещений удвоился что не-медленно привело к росту уровня свободных помещений на 156 пп до уровня 327
Всего в Москве предлагается в аренду или на продажу 154 млн кв м в существующих и 35 млн кв м в строящихся зданиях
Future supply mdash available space in buildings to be delivered in the next 12 month (under construction and under reconstruction) The data is given for the end of the period
Source Cushman amp Wakefield Source Cushman amp Wakefield Moscow Research Forum
DEMAND Overall 12 million sq m of quality office space was leased or bought during Q1-Q3 2013 For the second quarter in a row the total volume of take-up is decreasing In Q3 385836 sq m of quality office space has been transacted which is 20 below the average quarterly level of 2011-2012 Real estate budgets are limited and tenants tend to primarily consider their current location as a viable alternative to a new office
Tenants continue to be interested primarily in existing buildings the proportion of pre-lease agreements in Q1-Q3 was 63 of the total rented space (23 in Q3) In 2013 there is a significant reduction in the proportion of sales deals (from 20 on average in 2011-2012 to around 10 in 2013)
The number of large transactions (over 2000 sq m) continues decreasing The average transaction size has reduced again by 10 compared with the previous quarter and now stands at 528 sq m (taking into account only leasing deals)
NtildeIumlETHIcircNtilde Всего за три квартала 2013 года было арендовано и куплено 12 миллиона кв м качественных офисных помещений Вто-рой квартал подряд наблюдается снижение общего объема сделок В III квартале общий объем сделок составил 385 836 кв м что на 20 ниже среднего уровня 2011-2012 годов Бюджеты на недвижимость и переезды ограничены аренда-торы и арендодатели все чаще находят компромиссы приво-дящие к продлению текущих договоров аренды а не заклю-чению новых сделок в новых зданиях
Арендаторы продолжают интересоваться главным образом введенными в эксплуатацию зданиями ndash в 2013 году (1-III кв) доля договоров предварительной аренды составила менее 63 (в III кв ndash 23) от всех арендованных площадей Доля сделок продажи также продолжает оставаться низкой и со-ставляет не более 10 от всего объема офисных сделок
Продолжает снижаться количество крупных сделок (размером более 2 000 кв м) Средний размер транзакции снизился на 10 относительно предыдущего квартала и в III квартале составил 528 кв м учитывая только сделки аренды
NtildeOgraveAgraveAcircEcircEgrave AgraveETHAringIacuteAumlUcirc В классе А средняя запрашиваемая арендная ставка составляет 860 долларов США В классе Б средняя ставка аренды стабильна на уровне 520 долларов США Ставки аренды для Прайм офисов продолжают находиться на уровне 1 200 долларов США за кв м в год (без НДС и операционных расходов)
Source Cushman amp Wakefield
Source Cushman amp Wakefield
Q3 2013 AVERAGE BASE RENTAL RATES BY BUSINESS AREA СРЕДНИЕ БАЗОВЫЕ СТАВКИ АРЕНДЫ В III КВ 2013 Г ПО БИЗНЕС РАЙОНАМ
AVERAGE RENTAL RATES (US$) СРЕДНИЕ СТАВКИ АРЕНДЫ (ДОЛЛАРЫ США)
Downtown
Central
OTA
Moscow subareas
Moscow is divided into office submarkets areas with similar real estate indicators and dynamics Office submarkets are grouped in office subareas
The Downtown subarea is the territory inside the Garden Ring and the Belorussky business area
The Central subarea is the territory between the Garden ring and TTR (and the more distant SOK and KUT submarkets)
OTA includes the Moscow suburbs
RENTAL RATES In Class A the average asking rental rate is $860 In Class B the average asking rental rate was stable at $520 Rental rates for prime office space is at the level of $1200 per year per sq m (triple net)
IumlETHIcircAtildeIacuteIcircCcedil Несмотря на то что по заявлениям девелоперов более 400 тыс кв м площадей планируется к вводу во IV кв 2013 года мы ожидаем что до конца года будет введено в эксплуатацию дополнительно не более 150ndash200 тыс кв м новых офисов Таким образом в 2013 году сохранится баланс спроса и предло-жения в большинстве офисных субрынков
Высокие объемы строительства на окраинах города и в Москва-Сити не окажут существенного дестабилизирующего влияния на центральные районы До конца 2013 года а также в 2014 году в центральных районах ставки аренды будут стабильны возможен рост в соответствии в уровнем инфляции
LEASE TERMS IN QUALITY BUSINESS CENTERS УСЛОВИЯ АРЕНДЫ КАЧЕСТВЕННЫХ ОФИСНЫХ ПОМЕЩЕНИЙ
RUR USD or Euros (rarely used) per sqmyr For currency exchange landlords use either Central Bank of Russiarsquos official rate or set their own rate or fix the dollar corridor eg 25-40 RUBUSD
Российские рубли доллары США или евро (используется редко) за квм в год Используется обменный курс ЦБ России или используются условные единицы (уе) с фиксированным курсом в коридоре 25-40 рублей за уе
Payments Iumleumlagraveogravearingaeligegrave Quarterly in advance Ежеквартально авансом
Indexation Egraveiacuteaumlaringecircntildeagraveoumlegraveyuml 3-5 or at the level of USA EU CPI 10-15 for RUR agreements Sometimes step-rents are used
3-5 или US CPI 10-15 для рублевых договоров аренды Ингода используется ступенчатая индексация
Other payments Aumlethoacuteatildeegravearing iumleumlagraveogravearingaeligegrave
Operational expences
Операционные расходыThis sort of payments strongly depends on the service list included Average market payments 100-150 USDsqmyr for Class A 80-120 USDsqmyr for Class B
Платежи зависят от состава включенных услуг который может значительно отличаться 100-150 долларов США за квм в год для Класса A 80-120 долларов США за квм в год для Класса Б
VATНДС 18 18Source Cushman amp Wakefield
FORECAST Despite the announcements from developers that they will deliver more than 400000 sq m in Q4 2013 the new construction forecast continues to be rather conservative Just 150000-200000 sq m of new office space might be delivered by the end of this year Consequently in 2013 the supply-demand balance should remain stable
The high volume of office space under construction is the biggest threat at the moment Against the possible local oversupply in Moscow suburbs and Moscow-City submarkets in 2014 central and prime business areas should see a market balance both at the end of 2013 and during the whole 2014 For these areas rental rates are projected to grow in line with inflation
The table contains office buildings announce for delivery in 2013 with rentable area more than 15000 sq m Delivered buildings are included disregarding the size
TOTAL mdash Office rentable area or all office buildings announced for delivery in 2013 (including small buildings with office rentable less than 15000 sq m)
DOWNTOWNBlackampWhite Complex (bld White) ZAM B+ 13000 Q1Rosso Riva ZAM A 11947 Q1Park Tower BEL B+ 11850 Q1Chistoprudnyy bul 8 bld 1 CBD B- 4730 Q1White Gardens BEL A 63900 Q1Wall Street ZAM A 20493 Q2Vishnevy Sad CBD B+ 6736 Q2Domino ZAM A 6216 Q3Lukoil build-to-suit CBD B+ 35000 Q3CENTRALDubininskaya ul 33B SCH B+ 3000 Q1City Point BC CTY B+ 9951 Q1Sinitsa Plaza BAS B+ 13496 Q2Mercury City CTY A 87574 Q3Poluyaroslavskiy Bolshoy per 102 bld BAS B+ 2294 Q3Poklonnaya ul vl 3 KUT A 85572 Q4Park Pobedy KUT B+ 54000 Q4Nizhegorodsky Business Centre phase II BAS B- 37100 Q4Nizhegorodsky Business Centre phase I BAS B- 23000 Q4Arma 19 BAS B+ 19080 Q4Golden Gate BAS B+ 16000 Q4OTANewton Plaza SE B+ 52000 Q1Danilovskaya Manufaktura Sitsevyi Korpu SE B+ 3396 Q1iCube SW B+ 15256 Q1Obrucheva ul 52 bld3 SW B- 23300 Q1Lotte Business Centre SW B+ 38480 Q1Streamline NE B+ 11048 Q1Quadrum SUB B+ 24650 Q2Park Mira NE B+ 7000 Q2Format Complex II SUB B- 9122 Q2Dobrolyubova 6 bld 5 NE B- 4699 Q3Leninsky 119 SW A 15400 Q3Central Street NE B+ 6423 Q3Smart Park SW B+ 10260 Q39 akrov phase II SW B+ 62300 Q3Country Park Phase III SUB A 19120 Q3Riga Land bld 5 (bld A) (phase II) SUB B+ 40000 Q4Solutions BP bld 3 SW B+ 19500 Q4Avrora NE B- 21600 Q4Neo Geo SW B- 70000 Q4Novator office-hotel complex SUB B+ 24000 Q4Mebe One Khimki Plaza SUB A 26000 Q4
TOTAL 217236
TOTAL 421653
TOTAL 551253
Q3 2013 MoscowRUSSIA A Cushman amp Wakefield Research Publication
HOSPITALITY
ADR IN AUGUST 2013 | СРЕДНЯЯ ЦЕНА ЗА НОМЕР В АВГУСТЕ 2013 $152
QUALITY SUPPLY | ТЕКУЩИЙ ОБЪЕМ КАЧЕСТВЕННОГО ПРЕДЛОЖЕНИЯ 14200 rooms
OCCUPANCY | ЗАПОЛНЯЕМОСТЬ 77
RevPAR | СРЕДНИЙ ДОХОД НА НОМЕР $117
IumlETHAringAumlEumlIcircAEligAringIacuteEgraveAring По оценке департамента гостиничного бизнеса и туризма совокупный объем номерного фонда в Москве на конец III квартала 2013 г составил свыше 48 тыс номеров из них доля качественного предложения составила порядка 30 общего предложения или 142 тыс номеров
Новое предложение за III квартале 2013 г в сегменте качествен-ных гостиниц составило 1138 номеров и было сформировано за счет ввода в эксплуатацию 4-х гостиниц разной ценовой категории
В ноябре 2013 г ожидается открытие гостиниц под управлени-ем оператора Accor комплекс из трех отелей расположен по адресу ул Бахрушина вл 11 В состав комплекса войдут 3 гостиницы разной ценовой категории Mercure на 158 номеров (Upscale) Ibis на 190 номеров (Midscale) Adagio на 149 апартаментов (Midscale)
Это увеличит предложение на рынке качественных отелей минимум на 497 номеров Ожидаемое в 2013 г открытие гостиницы Marriott Novy Arbat (234 номера) перенесено на 1 квартал 2014 года
SUPPLY According to the Department of Hospitality and Tourism the cumulative number of rooms in the Moscow hotel market at the end of Q3 2013 is estimated at more than 48000 rooms with the proportion of high-quality supply at about 30 or 14200 rooms
The increase in high-quality segment by the end of Q3 2013 totaled 1138 rooms resulting from the commissioning of 4 hotels in different price categories
In addition Accor will open three new hotels in November Q4 2013 in the hotel complex located at ul Bakhrushina 11 The complex of hotels includes three brands Mercure with 158 rooms (Upscale) Ibis with 190 rooms (Midscale) and Adagio with 149 rooms (Midscale)
We believe that the total supply of international grade rooms will increase by 497 by the end of 2013 It was expected that more rooms would have been available but the opening of the Marriot Noviy Arbat (234 rooms) was postponed till the Q1 2014
QUALITY MOSCOW HOTEL MARKET STRUCTURE Q3 2013 YTD
NtildeOgraveETHOacuteEcircOgraveOacuteETHAgrave EcircAgravetimesAringNtildeOgraveAcircAringIacuteIacuteUcircOtilde AtildeIcircNtildeOgraveEgraveIacuteEgraveOuml IgraveIcircNtildeEcircAcircUcirc III EcircAcirc 2013
Средняя цена за номер (ADR) в августе 2013 г составила $152 что на 5 выше уровня августа 2012 г Положительная динамика обеспечена за счет гостиниц высокой ценовой категории максимальный рост средней цены за номер по отношению к результатам за аналогичный период 2012 г продемонстрировал рынок гостиниц класса Upscale 16 Среднеценовые объекты напротив работали с более демократичными группами спроса на рынке гостиниц класса Midscale было отмечено снижение показателя ADR на 7 по сравнению с августом 2012 г
Символическое падение ставок за номер на уровне 043 и 221 было отмечено также в сегментах Upper Midscale и Luxury соответственно что в целом характерно для августа ndash наиболее laquoтуристскогоraquo месяца в году
В отношении результатов 2013 г (по данным на август) рынок качественных гостиниц показал небольшое снижение показате-ля ADR (-11) по сравнению с прошлым годом что равносиль-но стабилизации в том числе с учетом ослабления рубля
Наиболее агрессивными с точки зрения ценовых ожиданий остаются гостиницы категории Luxury показывающие на фоне общих понижающих корректировок цены небольшой рост с $375 до $376 за номер
Московские гостиницы предлагают широкий разброс цен по сегментам наиболее дорогие ndash гостиницы категории Luxury где ADR в августе 2013 г составил $315 что на 10698 выше среднего показателя по рынку качественных гостиниц
Ценовой разрыв отелей категории Luxuгy со следующим за ним сегментом внушителен средняя цена за номер в гостиницах категории Upper Upscale уже только на 2875 превысила средний показатель по рынку и составила $197 Стоимость номера в гостиницах категории Upscale сравнима со средним по рынку значением и составляет $160
Цены за номер в гостиницах класса Upper Midscale и Midscale ниже среднерыночных на 30 и 48 соответственно и составляют $105 и $79 за номер (данные за август)
AVERAGE DAILY RATE US DOLLAR (ADR) AUGUST 2013 YTD
QUALITY HOTEL MARKET TRADING Average daily rate in August 2013 estimated to $152 which is 5 higher than in August 2012 This positive dynamic was ensured by high-quality hotels the highest ADR growth was recorded in the Upscale segment ndash Up 16 compared to the same period last year Midscale market in this period was oriented to more democratic groups of demand ADR declined by 7 comparing to August 2012
The fall in ADR at the level of 043 and 221 was also recorded in the Upper Midscale and Luxury segments respectively but that is typical for the August ndash the most tourist month of the year
The results of 2013 (August YtD) showed a symbolic decrease in ADR (-11) comparing to 2012 that can be interpreted as a stabili-zation taking into account the weakening of the Ruble
The most aggressive in terms of price expectations remain Luxury market segment showing slight increase from $375 to $376 per room comparison with the general lowering of prices
Moscow hotels offer a wide range of prices by segment the most expensive ndash Luxury with ADR in August about $315 it is 10698 higher than the average for the Moscow quality market
There is an impressive gap between Luxury hotel prices and prices for the Upper Upscale segment Average daily rate for Upper Upscale is about $197 and only 2875 higher than the average for the Moscow quality market
0
50
100
150
200
250
300
350
400
2010 2011 2012 2013
Luxury Upper Upscale
Upscale Upper Midscale
Midscale Moscow average
0
10
20
30
40
50
60
70
80
2010 2011 2012 2013
Luxury Upper UpscaleUpscale Upper MidscaleMidscale Moscow average
25
MARKETBEAT Q3 2013
NtildeIumlETHIcircNtilde
Средняя годовая загрузка качественных гостиниц Москвы в августе 2013 г составила 77 что на 11 выше данного показателя за аналогичный период прошлого года
Максимально высоким спросом в Москве пользуются гостиницы категории Upper Midscale и Midscale загрузка которых в августе фиксировалась на уровне 854 и 826 соответственно
Одной из особенностей рынка гостиниц Москвы в III кв 2013 г стала высокая загруженность качественных и центрально расположенных гостиниц в августе ndash традиционно низком из-за наступления laquoсезона отпусковraquo Нетипично высокая загрузка стала следствием увеличения туристских потоков в том числе за счет проведения Универсиады в Казани добавившей laquoтранзитныхraquo клиентов московским отелям
По итогам 2013 г по состоянию на август рынок качественных гостиниц показывает рост спроса по сравнению с прошлым годом практически по всем сегментам Рост спроса простимули-рован как ростом потока ночующих посетителей в Москву так и стагнацией цен на размещение последнее обстоятельство говорит о продолжающемся периоде неопределенности
OgraveAringIacuteAumlAringIacuteOumlEgraveEgrave
Среднее значение дохода на номер (RevPAR) за август 2013 г выросло на 171 и составило $117 против $100 в 2012 г В то же время по итогам 2013 г по состоянию на август динамика RevPAR по сегментам колебалась от 84 в Midscale до -46 в отелях категории Upper Midscale
Мы полагаем что тенденции к повышению среднерыночной доходности на номер (+12 YtD) за счет гибкой ценовой политики реагирующей на изменения спроса сохранится и в ближайшей перспективе В 2014 г гостиницы вышедшие на рынок в 2013 г окажут более выраженное воздействие на рыночную ситуацию за счет чего показатели RevPAR по сегменту Luxury и особенно Upper Midscale вряд ли существен-но превзойдут текущие показатели и будут колебаться от слабоотрицательных до слабоположительных значений в начале и конце года
DEMAND The average annual occupancy of quality hotels in Moscow in August 2013 was about 77 which is 11 higher than in the same period last year
Maximum high demand in Moscow hotels was in the Upper Midscale and Midscale category with occupancy in August at the level of 854 and 826 respectively
One of the features of the market of Moscow hotels in Q3 2013 was the high occupancy of quality hotels and especially the central located hotels ndash traditionally low in August because of the holiday season Unusually high occupancy was a result of increased tourist flows including through the Universiade in Kazan which added transit clients for Moscow hotels
In general up to August 2013 (YtD) the Moscow quality hotel market shows a growth in demand comparing to 2012 in almost all segments (reduced occupancy in Upper-Midscale segment by 03 pp can be seen as an insignificant adjustment) Demand growth is stimulated by the growing stream of domestic and international visitors staying overnight in Moscow and the stagnation of prices for accommodation the last point indicates the continuing period of uncertainty in the market
TRENDS IN REVENUE Average revenue per available room (RevRAR) in August 2013 increased by 171 to $117 versus $100 in August 2012
At the same time according to the results of August 2013 RevPAR dynamics by segment ranged from 84 in the Midscale segment to -46 in the Upper Midscale hotels We believe that the tendency to stimulate the RevRAR increase which the flexible price sensible of demand change will continue in the near future In 2014 the new hotels will have a more pronounced effect on the general market situation whereby RevPAR (especially for Luxury and Upper Midscale) unlikely to surpass itrsquos current estimations and will vary from slightly negative to low positive values at the beginning and end of the year
За III квартал 2013 года в эксплуатацию было введено более 235 тыс кв м качественных складских площадей
Ставки аренды остаются стабильными и составляют в среднем $135 за кв м в год в классе А без НДС операци-онных расходов и коммунальных платежей
Цена продажи составляет $1 200- $1 300 за кв м в типовых проектах класса А
Доля вакантных площадей в складах класса А за полугодие не изменилась и составляет 1
Объем арендованных и купленных складских площадей в III составил более 350 тыс кв м
Регионы
В большинстве регионов средние ставки аренды в классе А за прошедший квартал не изменились за исключением Новосибирска и Нижнего Новгорода где ставки выросли на 4-6
Объем арендованных и купленных складских площадей в III квартале составил более 85 тыс кв м
SUMMARY Moscow
In Q3 2013 more than 235000 sq m of quality warehouse space were put into operation
Rental rates remain stable at an average of $135 per sq m per year in A Class excluding VAT operating expenses and utility
The price of sale is $1200 - $1300 per sq m in typical projects of class A
The vacancy rate in Class A warehouses for the half of the year remains unchanged at 1
The volume of leased and purchased warehouse space in Q3 amounted to 350000 sq m
Regions
The average rental rates in Class A have not changed for the quarter in most regions except Novosibirsk and Nizhny Novgorod where rates have increased by 4-6
The volume of leased and purchased warehouse space in Q3 amounted to 85000 sq m
$132
$130
$140
$105
$110
$135
$135
$135
$80
$90
$100
$110
$120
$130
$140
$150
2006 2007 2008 2009 2010 2011 2012 2013F
KEY EXPECTATIONS
STABILITY
0
200
400
600
800
1000
1200
1400
1600
1800
2007 2008 2009 2010 2011 2012 2013F 2014F
27
MARKETBEAT Q3 2013
Source Cushman amp Wakefield
Source Cushman amp Wakefield
Source Cushman amp Wakefield
Source Cushman amp Wakefield
ОСНОВНЫЕ ТЕНДЕНЦИИ Объем нового строительства за 1-III кв 2013 года в Московском регионе составил 550 тыс кв м что соответствует аналогично-му показателю прошлого года Объем арендованных и куплен-ных площадей по итогам прошедших трех кварталов составил белее 830 тыс кв м что приблизительно соответствует показа-телю прошлого года
В регионах объем нового строительства в регионах за первые три квартала составил 239 тыс кв м что на треть меньше про-шлогоднего Арендовано куплено 250 тыс кв м что больше прошлогоднего показателя на 20
ПРЕДЛОЖЕНИЕ В Московском регионе в III квартале 2013 года предложение увеличилось на 235 тыс кв м
В минувшем квартале были построены
Логопарк Север (110 тыс кв м) девелопер Каравелла
Два новых корпуса в логистическом парке Климовск (48 тыс кв м) девелопер Raven Russia
Объем нового строительства соответствует показателям преды-дущего года но темпы строительства ниже заявленных девело-перами Основная проблема mdash задержки в строительстве Боль-ше всего это касается новых девелоперов длительное время работающие на рынке компании укладываются в заявленные сроки Поэтому до конца года будет построено до 1 млн кв м складских площадей
На рынке Москвы сохраняется дефицит готовых к въезду склад-ских площадей Все проекты сдаются или продаются на этапе строительства
Чистые средние ставки аренды в течении прошедшего квартала не изменились и составляют $135 за кв м при этом разброс ставок остается высоким
В 2014 году девелоперы обещают построить около 15 млн кв м складских площадей однако по нашем оценкам из-за задер-жек при строительстве построено будет на 30 меньше
KEY TRENDS The volume of new construction for Q1-Q3 2013 in the Moscow region amounted to 550000 sq m which corresponds to the same period of last year The volume of leased and purchased land based on the results of Q1-Q3 was more than 830000 sq m which approximately relative to the previous year figure
The volume of new construction in the regions for the first three quarters amounted to 239000 sq m which is a three times less than last year indicator 250000 sq m were leased and sold which is 20 more than last year figure
SUPPLY In Q3 2013 supply in Moscow region increased by 235000 sq m
In the last quarter were put into operation
bull Logistics Park North (110000 sq m) developer is Caravella
bull Two new phases in the logistics park Klimovsk (48000 sq m) developer is Raven Russia
The volume of new construction complies with the previous year but below the pace of construction announced by developers The main problem is the delays in construction mostly it concerns new developers Experienced companies meet the announced deadlines Therefore there will be built up to one million sq m of warehouse space until the end of the year
In Moscow there is a lack of ready-to-move storage space All projects are sold or bought during the construction process
Net average rental rates have not changed during the last quarter and amounted to $135 per sq m while the spread rate remains relatively high
In 2014 developers expect to build nearly 15 mn sq m of warehouse space however according to our estimations the volume of construction will be 30 less due to the development process delays
DISTRIBUTION OF QUALITY DEVELOPMENTS IN THE PIPELINE FOR 2013-2014 (lsquo000 SQ M) РАСПРЕДЕЛЕНИЕ ПЛАНИРУЕМЫХ К ВВОДУ В 2013-2014 ГГ СКЛАДСКИХ ПЛОЩАДЕЙ В МОСКОВСКОЙ ОБЛАСТИ ТЫС КВ М
DISTRIBUTION OF WampI SPACE IN THE MOSCOW REGION (lsquo000 SQ M) РАСПРЕДЕЛЕНИЕ СКЛАДСКИХ ПЛОЩАДЕЙ В МОСКОВСКОЙ ОБЛАСТИ ТЫС КВ М
В регионах в минувшем квартале было построено только 43 тыс кв м качественных складских площадей против 117 тыс в прошлом Все новые объекты построены рядом с Санкт-Петербургом
Всего в 2014 году в регионах будет построено боле 290 тыс кв м против 410 тыс кв м в прошлом В большинстве регионов дефицита складских площадей не наблюдается Исключение составляет Санкт-Петербург Екатеринбург и Ростов-на-Дону
Чистые ставки аренды в регионах в III квартале 2013 года не изменились за исключением Новосибирска и Нижнего Новгорода где они немного выросли до $120 и $123 за кв м соответственно
Source Cushman amp Wakefield
TAKE UP lsquo000 SQ M ОБЪЕМ АРЕНДОВАННЫХ И КУПЛЕННЫХ ПЛОЩАДЕЙ ТЫС КВ М
Source Cushman amp Wakefield
During the past quarter only 43000 sq m of quality warehouse space was built In the regions as against last year fiqure (117000 sq m) All new premises were built near St Petersburg
Comparing to last year figure (410000 sq m) more than 290000 sq m is going to be built in the regions in 2014 In most regions there is no lack of warehouse spaces observed The exceptions are St Petersburg Yekaterinburg and Rostov-on-Don
Net rental rates have not changed in the regions in Q3 except Novosibirsk and Nizhny Novgorod where they rose slightly to $120 and $123 per sq m respectively
2013 PIPELINE ОБЪЕКТЫ ЗАЯВЛЕННЫЕ К СТРОИТЕЛЬСТВУ В 2013 Г
PROJECT DEVELOPER GRADE DIRECTION HIGHWAYDISTANCE FROM
MKAD KMTOTAL AREA
000 SQ MEXPECTED
DELIVERY
Infrastroy Bykovo Infrastroy А E Egorevskoe 17 6155 Q1
Infrastroy Bykovo Infrastroy А E Egorevskoe 17 6193 Q4
Klimovsk LP Raven Russia A S Simferopolskoye 23 4772 Q3
Logopark Sever Karavella A N Rogachevskoye 30 11023 Q3
PNK Chekhov II PNK group A S Simferopolskoye 50 10424 Q2
PNK Chekhov II PNK group A S Simferopolskoye 50 5531 Q4
PNK Vnukovo PNK group A SW Kievskoe 19 10568 Q1
South Gate IP Radius group A S Kashirskoye 30 2070 Q2
South Gate IP Radius group A S Kashirskoye 30 3000 Q4
СПРОС В Московском регионе за I-III кварталах 2013 г было арендовано и куплено более 850 тыс кв м качественных складских площадей из них 235 тыс в III квартале что соответствует прошлогодним показателям
Наиболее крупные сделки в минувшем квартале
Автомобильный концерн Volkswagen купил 50 тыс кв м в складском комплексе PNK Чехов 2 девелопер PNK Group
Компания Верный купила 43 тыс кв м в складском комплексе PNK Север девелопер PNK Group
Автомобильный концерн General Motors арендовала 40 тыс кв м в индустриальном комплексе Южные врата
Следует отметить что большое количество качественных складских площадей было арендовано и куплено в III квартале 2013 г производственными компаниями при этом логистиче-ские компании и дистрибьюторы наоборот купили и арендова-ли меньшее количество площадей
Так же следует отметить увеличение доли продаж в III квартале до 42 против 14 во II квартале в структуре поглощения
На региональных рынках за минувший квартал было арендовано и куплено более 85 тыс кв м всего с начала года более 250 тыс кв м что почти на 20 выше аналогичного показателя прошлого года и на 5 среднего значения за последние 5 лет Этот показатель во многом обусловлен самой крупной сделкой за всю историю рынка складской недвижимости Санкт-Петербурга по предварительной продаже 43 тыс кв м компанией PNK Group продуктовой сети laquoВерныйraquo в складском комплексе PNK КАД
Сделки на такие большие площади позволяют девелоперу возобновить строительство в регионах но за период с IV кв 2012 по III квартале 2013 г Было заключено только 4 сделки более 25 тыс кв м Большинство сделок в регионах заключает-ся на складские площади до 10 тыс кв м
STRUCTURE OF DEMAND MOSCOW СТРУКТУРА СПРОСА МОСКВА
DEMAND In the Moscow region in Q1-Q3 2013 more than 850000 sq m were rented and purchased talking about quality warehouse space The Q3 indicator is 235000 sq m which is the same to the last years performance
The largest deals in the last quarter
bull Car manufacturer group Volkswagen bought 50000 sq m in a warehouse complex PNK Chekhov 2 developer is PNK Group
bull The Verniy company bought 43000 sq m in a warehouse complex PNK North developer is PNK Group
bull Automobile сar manufacturer General Motors leased 40000 sq m in the industrial complex South Gate
It should be noted that a large number of quality warehouse space was leased and purchased in the Q3 2013 by manufacturing companies while logistics companies and distributors on the contrary have bought and rented a smaller amount of warehouse space
It should be also mentioned the increasing sales in Q3 up to 42 comparing to 14 in the previous quarter for the both leased and bought premises
At the regional markets for the last quarter it was rented and purchased more than 85000 sq m Since of the beginning of the year more than 250000 sq m were rented and purchased which is almost 20 higher than last year and 5 higher than the average number for the last 5 years This indicator is largely due to the largest deal in the history of the warehouse property market of St Petersburg on the pre-sale of 43000 sq m by PNK Group to the food supplier Verniy in the warehouse complex PNK KAD
Such large deals allow developer to resume construction in the regions However between Q4 2012 and Q3 2013 it was only 4 deals amounted more than 25000 sq m made Most of the deals in the region are for warehouse space up to 10000 sq m
ТЕНДЕНЦИИ С начала прошлого года на рынок складской недвижимости остается стабильным Ежегодный спрос в Московском регионе составляет около 1 млн кв м в год Средние ставки аренды в классе А составляют $135 за кв м в год без НДС операцион-ных расходов и коммунальных платежей доля вакантных площадей сохраняется на уровне 1 Строительство большин-ства новых складских объектов будет начинаться только после заключения предварительных договоров аренды и продажи
Изменение ситуации в ближайшей перспективе ожидать не стоит В условиях низкого роста экономики страны начинать спекулятивное строительство большой риск повторения ситуации 2008 года поэтому предложение будет подстраивать-ся под спрос
На региональных рынках продолжится тенденция увеличения дефицита готовых к въезду складских площадей Не смотря на высокой спрос на складские объекты в регионах девелоперам не удается сформировать достаточных портфель предваритель-ных договоров аренды для начала строительства Исключение составляет Санкт-Петербург Свердловская область юг России где спрос или условия рынка обеспечили девелоперам формирование такого портфеля Мы прогнозируем что до конца года в регионах будет реализовано более 300 тыс кв м складских площадей
Source Cushman amp Wakefield
STRUCTURE OF DEMAND REGIONS СТРУКТУРА СПРОСА РЕГИОНЫ
TRENDS Since the beginning of the last year the warehouse market has remained stable Annual demand in the Moscow region is about one mn sq m per year average rental rates for Class A is $135 per sq m per year excluding VAT operating expenses and utility costs the vacancy rate remains at 1 Construction of the majority of new storage facilities will start only after the preliminary lease or sale contract signing up
In the nearest future the situation would remain the same It is the huge risk to start the new speculative construction in a low-growth economic situation as it is the threaten to repeat the 2008 year crisis the supply will adapt to the demand
The trend of growing deficit of ready-to-move warehouse spaces continues at the regional markets In spite of the high demand for storage facilities in the regions for developers it is still complicated to form a sufficient portfolio of preliminary agreements for the start of construction Exceptions are St Petersburg Sverdlovsk region and south Russia where the demand or market conditions provided developers with the opportunity to form such a portfolio We predict that by the end of the year in the regions will be sold over 300000 sq m of warehouse space
WampI MARKET IN RUSSIA ETHUcircIacuteIcircEcirc NtildeEcircEumlAgraveAumlNtildeEcircEgraveOtilde IumlIcircIgraveAringUgraveAringIacuteEgraveEacute Acirc ETHIcircNtildeNtildeEgraveEgrave
VACANCY RATE (EOY) Paris (Ile de France) 89 81 99 126 102 84 81 89 804
Budapest 59 172 173 188 195 208 194 217 2283
Warsaw 89 74 112 171 194 173 146 1621 1592
Madrid 55 38 37 55 73 84 93 95 972
TAKE UP 000 SQ MParis (Ile de France) 1 005 700 640 601 814 837 563 208 58
Budapest 152 229 308 280 210 327 355 31 21
Warsaw 260 445 556 216 451 743 483 183 112
Madrid 1 225 918 630 325 390 270 225 60 47
2013
36
MARKETBEAT Q3 2013
RESEARCH DEPARTMENT IcircOgraveAumlAringEuml EgraveNtildeNtildeEumlAringAumlIcircAcircAgraveIacuteEgraveEacute
Further information and copies of this report are available from Ellina Krylova
EllinaKrylovaeurcushwakecom
The information provided in this report is intended for informational purposes only and should not be relied on by any party without further independent verification Classifications of individual buildings are reviewed on a continuing basis and are subject to change The standards used in this process are consistent with those used by Moscow Research Forum and in the United States by the Society of Industrial and Office Realtors (SIOR) and BOMA International Reproduction of this report in whole or part is permitted only with written consent of Cushman amp Wakefield Data from this report may be cited with proper acknowledgment given
copy 2013 Cushman amp Wakefield All rights reserved
MORE INFORMATION AND CONTACTS ARE AVAILABLE ON WWWMARKETBEATRU EgraveIacuteOcircIcircETHIgraveAgraveOumlEgraveszlig IcircAacute IcircOgraveAumlAringEumlAring EgraveNtildeNtildeEumlAringAumlIcircAcircAgraveIacuteEgraveEacute Egrave IumlOacuteAacuteEumlEgraveEcircAgraveOumlEgraveEgrave AumlIcircNtildeOgraveOacuteIumlIacuteUcirc IacuteAgrave WWWMARKETBEATRU
DENIS SOKOLOV PARTNER RESEARCH DIRECTOR DenisSokoloveurcushwakecom
LADA BELAYCHUK ASSOCIATE DIRECTOR DEPUTY RESEARCH DIRECTOR LadaBelaychukeurcushwakecom
MAXIM ILYIN CONSULTANT CAPITAL MARKETS Maximilyineurcushwakecom
ALEXANDER KUNTSEVICH ANALYST WampI PROJECT MANAGEMENT AlexanerKuntsevicheurcushwakecom
TATYANA DIVINA SENIOR ANALYST
TatyanaDivinaeurcushwakecom
wwwcushmanwakefieldcom
4
MARKETBEAT Q3 2013
OUTLOOK We do not expect any notable changes in Q4 Business activity will remain low no change in rents is forecasted
Office market will be stagnating Net absorption will remain low no new tenants will appear on the market
Warehouse sector will outperform office because of the demand for modern logistic from such fast growing sectors as E-commerce and modern retailing
Retail real estate will be the bright spot with new retailers and new ideas coming to the market
In 2014 situation is likely to change While in Q1 we will face ldquoOlympics effectrdquo - growing interest to Russia from other countries and businesses Q2 will probably bring decrease of employment and slow-down of consumer sector We expect office real estate to remain as most stable sector in 2014
IumlETHIcircAtildeIacuteIcircCcedil Мы не ожидаем значительных перемен в четвертом квартале Деловая активность будет относительно низкой движения арендных ставок не ожидается
На офисном рынке будет наблюдаться стагнация Чистая абсорбция будет оставаться незначительной а большинство сделок будут связаны с переездом
Логистический сегмент будет развиваться немного более динамично обеспечивая потребность быстрорастущих сегментов таких как интернет-торговля и современный ритейл
Торговая недвижимость остается наиболее активным сегмен-том в который приходят и новые арендаторы и новые идеи
В 2014 году ситуация может поменяться Если в I квартале будет заметен laquoОлимпийский эффектraquo подогревающий интерес к России то со II квартала снижение занятости окажет негативное влияние на потребительский рынок Мы полагаем что в следующем году наиболее стабильным будет офисный сектор тогда как в торговле не исключена локальная коррекция
SOVEREIGN DEBT AS GDP IN SELECTED COUNTRIES ГОСДОЛГ В ВВП В СТРАНАХ МИРА
EcircETHAgraveOgraveEcircEgraveEacute IcircAacuteCcedilIcircETH В III квартале 2013 года основные драйверы роста экономики претерпели незначительные изменения по сравнению с преды-дущим кварталом
Так рост индекса промышленного производства с начала 2013 года продолжает замедляться Сократились объемы машино-строения выпуска транспортных средств производства металлов
Рост в сферах строительства услуг транспорта и связи также существенно замедлился
Темпы роста добычи полезных ископаемых увеличиваются в то время как обрабатывающий сектор показывает отрицательные результаты mdash снижение на 17 Рост производства сельскохо-зяйственной продукции объясняется завершением сезона
Инвестиционная активность и темпы роста показателей в сфере розничной торговли по сравнению с тем же периодом прошло-го года значительно снизились
Причины резкого снижения основных экономических показате-лей связывают с кризисом в ряде Европейских государств
Source Ministry for Economic Development
Source Ministry for Economic Development
SUMMARY Main economy drivers in Q3 2013 were slightly changed comparing to the previous quarter
The industrial production index is decreasing from the beginning of 2013 and still slowing down The volumes of engineering industry transport manufacture and metal production were reduced in this quarter
The increase in construction services transport and communica-tions is also slowed down since last quarter
The growth rate of mining and extraction is growing but at the same time the processing is falling down in this quarter on 17 The growth in agriculture sector is connected with season closure
Investment activity and the growth rate of retail sales are considerably decreased comparing with the same period of the last year
Expert expectations of the future are varied but they match in the fact that every economy driver in Russia at present are on the edge of their growth
BUDGET DEFICITSURPLUS IN SELECTED COUNTRIES ДЕФИЦИТПРОФИЦИТ БЮДЖЕТА В СТРАНАХ МИРА
MINISTRY FOR ECONOMIC DEVELOPMENT URALSIB CAPITAL RENAISSANCE CAPITALROSSTATS ACTUAL
который негативно повлиял на спрос на основные экспортируе-мые в Европу товары нефть и газ Снижение темпов промыш-ленного производства объясняют дефицитом инвестиций в производственные мощности и общему оттоку инвестиционно-го капитала из страны вызванного неблагоприятным деловым климатом
В III квартале 2013 года Министерство экономического развития понизило свой прогноз роста ВВП в 2013 году с 24 до 18 Аналитики Renaissance Capital также пересмотрели прогноз роста ВВП на 2013 год в сторону уменьшения до 22
Однако несмотря на снижение темпов роста экономики России в III квартале в IV квартале 2013 года и в начале 2014 года аналитики прогнозируют ускорение темпов роста в 2014 году они могут достигнуть от 26 до 3 Прогнозируется увеличение объемов промышленного производства и увеличе-ние объемов экспорта но только в том случае если до конца 2014 года цены на нефть останутся на стабильном уровне
In Q3 2013 Ministry of Economic Development dramatically reduced their forecasted GDP growth rate for the 2013 from 24 to 18 Renaissance Capital analytics are also changed their GDP growth forecast for 2013 to 22
The reasons of the main economy drivers are slowing is connected with crisis in Europe countries which affected the demand on main export goods crude oil and gas The slowing down of industrial production is caused by low-level investments in production facilities and investment outflow outside the country caused by unfavorable business climate
However despite of economy is slowing down in Q3 in Q4 and in the beginning of 2014 analytics forecast the acceleration of economy growth in Russia In 2014 the growth rate can reach 26-3 The forecasted increase in industrial production and in volume of export can happened in case that the oil prices will stay stable till the end of 2014
GDP AND YOY CPI IN 2013 ВВП И ИНФЛЯЦИЯ 2013 Г
Source Ministry for Economic Development
Source Ministry for Economic Development Rosstat Uralsib Capital Renaissance Capital
Q3 2013 MoscowRUSSIA A Cushman amp Wakefield Research Publication
CAPITAL MARKETS
Source Cushman amp Wakefield
TOTAL INVESTMENTS BY SECTOR ИНВЕСТИЦИИ ПО СЕКТОРАМ
EcircETHAgraveOgraveEcircEgraveEacute IcircAacuteCcedilIcircETH Объем инвестиций в коммерческую недвижимость в III квартале остался практически без изменений по сравнению с II кварталом 2013 года и составил 113 млрд долларов США
Москва сохраняет первенство по размеру инвестиций в коммер-ческую недвижимость и продолжает оставаться основным инвестиционным центром России В Москву привлекается более 80-90 от всех инвестиций в коммерческую недвижимость
На втором месте по объему инвестиций в коммерческую недвижимость находится Санкт-Петербург где в III квартале 2013 года инвестировано около 50 млн долларов США
Наш прогноз общего объема инвестиций в качественную коммерческую недвижимость за 2013 г остается неизменным и может составить 79 млрд долларов США В следующем 2014 году рынок ожидает незначительная стагнация и объем инвестиций будет находиться на уровне около 75 млрд долларов США
Source Cushman amp Wakefield
TOTAL INVESTMENTS | IcircAacuteUacuteAringIgrave EgraveIacuteAcircAringNtildeOgraveEgraveOumlEgraveEacute YTD 2013 US$ 575 bn
PRIME CAPITALIZATION RATES | NtildeOgraveAgraveAcircEcircEgrave EcircAgraveIumlEgraveOgraveAgraveEumlEgraveCcedilAgraveOumlEgraveEgrave Acirc IumlETHAgraveEacuteIgrave NtildeAringAtildeIgraveAringIacuteOgraveAring
INVESTMENTS YOY CHANGE AND SHARE OF OFFICE AND RETAIL SEGMENTS ИЗМЕНЕНИЯ ОБЪЕМА ИНВЕСТИЦИЙ И ДОЛИ ОФИСНОГО И ТОРГОВОГО СЕГМЕНТОВ
SUMMARY The total volume of commercial real estate investments in Q3 2013 was on the same level with previous one and amounted to $113 billion
Moscow takes the primary role according to the volume of investments in the commercial real estate industry and remains the major investment center in Russia The capital of Russia attracted more than 80-90 of total investments in the commercial real estate
The second place is for St Petersburg talking about the volume of total investments in Russian commercial real estate Nearly $50 million of dollars were attracted in Q3 2013
Our forecast of the total investment volume of quality real estate in Russia for 2013 stays unchanged and can reach the volume of $79 billion Next year we expect insignificant stagnation and the total volume of investments is going to be at the level of $75 billion
0
1 000
2 000
3 000
4 000
5 000
6 000
7 000
8 000
9 000
2006 2007 2008 2009 2010 2011 2012 F2013 F2014
mn
USD
Office Retail Industrial Other Forecast
4560
53545798
2256
3994
7547 74377900
5750
7500
0
20
40
60
80
100
0
1 000
2 000
3 000
4 000
2007
Q1
2007
Q2
2007
Q3
2007
Q4
2008
Q1
2008
Q2
2008
Q3
2008
Q4
2009
Q1
2009
Q2
2009
Q3
2009
Q4
2010
Q1
2010
Q2
2010
Q3
2010
Q4
2011
Q1
2011
Q2
2011
Q3
2011
Q4
2012
Q1
2012
Q2
2012
Q3
2012
Q4
2013
Q1
2013
Q2
2013
Q3
US
$ m
n
Total investments Office of total Retail of total
KEY EXPECTATIONS
STABILITY
8
MARKETBEAT Q3 2013
IcircNtildeIacuteIcircAcircIacuteUcircAring IumlIcircEumlIcircAEligAringIacuteEgraveszlig В регионах доля качественных проектов коммерческой недви-жимости в настоящее время крайне мала инвесторы в большей степени заинтересованы в laquoгородах-миллионникахraquo где рынок коммерческой недвижимости наиболее развит
В III квартале 2013 г основной объем инвестиций пришелся на офисную недвижимость Объем инвестиций в этом сегменте составил 8443 млн долларов США Среди крупных сделок можно отметить продажу офисного комплекса White Gardens Сумма сделки является одной и самых крупных на рынке за последнее время на рынке офисной недвижимости и составила около 740 млн долларов США
Объем инвестиционных сделок на рынке торговой недвижимо-сти в III квартале 2013 г составил 250 млн долларов США Од-нако если все запланированные сделки будут завершены то 2013 год станет рекордным по объему инвестиций в торговую недвижимость
Традиционно на складскую и индустриальную недвижимость приходится меньше всего совершенных инвестиционных сде-лок Так в прошедшем квартале на долю складской и индустри-альной недвижимости пришлось инвестиций на сумму около 332 млн долларов США
Совокупный объем инвестиций в коммерческую недвижимость за три квартала 2013 г составил 575 млрд долларов США По сравнению с наиболее развитыми рынками Лондона и Парижа объем инвестиций в Москве ниже на 70 чем за тот же период в Лондоне и на 20 ниже чем в Париже
NtildeOgraveAgraveAcircEcircEgrave EcircAgraveIumlEgraveOgraveAgraveEumlEgraveCcedilAgraveOumlEgraveEgrave Ставка капитализации на Прайм объекты в Москве составляют 85 для офисов 90 для торговых центров и 110 для склад-ской недвижимости Это выше среднеевропейского уровня на 250 базисных пунктов и на 450 бп выше наиболее развитых европейских рынков ndash Лондона и Парижа
TOP 30 INVESTMENT MARKETS ТОП-30 ИНВЕСТИЦИОННЫХ РЫНКОВ
MOSCOW PRIME CAPITALIZATION RATES СТАВКИ КАПИТАЛИЗАЦИИ laquoПРАЙМraquo В МОСКВЕ
Source Cushman amp Wakefield
MAIN DEVELOPMENTS In regions the share of quality real estate projects is small and investors are much more interested in economically developed cities with population of over a million where the real estate market is more matured
In the third quarter of 2013 the majority of investments came to the office segment with the volume of $8443 million Among the biggest deals in the market it worth mentioning White Gardens business centre realization (the amount of transaction is one of the largest in the office market for recent years and equals to $740 million
Retail was the less attractive sector for investors in Q3 and the volume of investments amounted to $250 million However if all planned deals are completed by the end of the year then 2013 will be the record-breaking year regarding the investment volume
Traditionally investments in warehouse and industrial real estate sectors are less popular in Russia and the number of completed deals is rather small here Thus the investments in warehouse and industrial sectors totaled about $332 million for the latest quarter
The total volume of investments in Q1-Q3 2013 reached the number of $575 billion Comparing the most developed markets of London and Paris the level of investments in Moscow is 70 lower than London and 20 lower than Paris for the same period of time
CAPITALISATION RATES The current yields for prime real estate projects in Moscow are 85 for offices 90 for retail and 110 for warehouse and industrial projects This rate is higher than average yields in Europe on 250 bps and on 450 bps higher of most developed investment markets of London and Paris
1 NYC Metro 1922 Tokyo 1543 London Metro 1404 LA Metro 1195 DC Metro 1086 SF Metro 827 Hong Kong 718 Paris 609 Singapore 4710 Sydney 4611 Dallas 4512 Atlanta 4413 Houston 4314 Toronto 4215 Boston 4016 Moscow 3917 Chicago 3918 Osaka 3319 Seoul 3220 So Fla 3221 Seattle 3122 Berlin-Brandenburg 3123 Stockholm 2824 Rhine-Ruhr 2825 Shanghai 2526 FrankfurtRhine-Main 2527 Melbourne 2528 Munich 2429 Phoenix 2430 Brisbane 24
6
8
10
12
14
16
18
2004
2005
2006
2007
2008
2009
2010
2011
2012
Q1
13
Q2
13
Q3
13
CBR refinancing rate Office primeShopping center prime WampI Prime
9
MARKETBEAT Q3 2013
INTERACTIVE CHARTS I EgraveIacuteOgraveAringETHAgraveEcircOgraveEgraveAcircIacuteUcircAring AtildeETHAgraveOcircEgraveEcircEgrave
RUSSIAN PROPERTY INVESTMENT MARKET I EgraveIacuteAcircAringNtildeOgraveEgraveOumlEgraveEgrave Acirc EcircIcircIgraveIgraveAringETHtimesAringNtildeEcircOacuteTHORN IacuteAringAumlAcircEgraveAEligEgraveIgraveIcircNtildeOgraveUuml ETHIcircNtildeNtildeEgraveEgrave
Q3 2013 MoscowRUSSIA A Cushman amp Wakefield Research Publication
RETAIL
Source Rosstat
RETAIL TRADE TURNOVER AND REAL DISPOSABLE INCOME RUSSIA YOY РОЗНИЧНЫЙ ТОВАРООБОРОТ И РЕАЛЬНЫЕ РАСПОЛАГАЕМЫЕ ДОХОДЫ РОССИЯ
EcircETHAgraveOgraveEcircEgraveEacute IcircAacuteCcedilIcircETH В целом по России объемы нового строительства торговых площадей так же высоки как и в прошлом 2012 г В течение трех кварталов 2013 г в 22 российских городах появились новые торговые комплексы Некоторое снижение темпов строительства в Москве в 2012-2013 гг будет компенсировано ожидаемыми масштабными открытиями в 2014 г Посещае-мость торговых центров в Москве находится на высоком уровне потребительские ожидания стабильны В связи с дефицитом предложения в торговых центрах Москвы ритейлеры активно изучают российские регионы В 2013 г как и в течение 2012 г ставки аренды были стабильны
CONSUMER CONFIDENCE INDEX ИНДЕКС ПОТРЕБИТЕЛЬСКОГО ОЖИДАНИЯ
IumlIcircOgraveETHAringAacuteEgraveOgraveAringEumlEgrave Реальные располагаемые денежные доходы населения России (доходы за вычетом обязательных платежей скорректирован-ные на индекс потребительских цен) по оценке Росстата в августе 2013 г выросли на 21 по сравнению с августом 2012 г в январе-августе 2013 г выросли на 41 в сравнении с аналогичным периодом прошлого года Среднемесячная зарплата в России в августе 2013 г составила 29 020 рублей и выросла на 128 по сравнению с августом 2012 года
BRIEF SUMMARY In general the volume of new construction of retail spaces in Russia can be described as high as it used to be in the past 2012 New retail complexes have been constructed and delivered for the past 3 quarters of 2013 in 22 Russian cities There is a reduction in the сconstruction of new quality retail premises in Moscow for 2012-2013 which is going to be compensated by large-scale and expected projects in 2014 Attendance of Moscow shopping centers is at the high level consumer expectations are stable Due to the shortage of supply in the shopping malls retailers actively seek for new spaces in Russian regions During the 2013 rental rents remains stable as it was in 2012
CONSUMERS According to Rosstat real income of the Russian population grew up by 21 comparing to August 2012 Moreover it increased by 41 in January-August 2013 relatively to the same period of time last year The average monthly salary was 29020 rubles in August 2013 and increased by 128 comparing to the past year
Total retail trade growth for January-May was 38
Source Rosstat
VACANCY RATE ДОЛЯ СВОБОДНЫХ ПЛОЩАДЕЙ (Prime shopping centers Moscow) | (действующие прайм ТЦ Москва) 12
PRIME RENTAL RATE INDICATOR | ПРАЙМ ИНДИКАТОР АРЕНДНЫХ СТАВОК (Prime shopping center retail gallery Moscow) | (галереи в прайм ТЦ Москва) US$ 3800
1642 mn sq m 572 quality projects
TOTAL QUALITY STOCK IN RUSSIA ОБЩЕЕ КОЛИЧЕСТВО КАЧЕСТВЕННЫХ ТОРГОВЫХ ПЛОЩАДЕЙ В РОССИИ
KEY EXPECTATIONS
STABILITY
-10
-5
0
5
10
15
20
2007 2008 2009 2010 2011 2012 F2013 F2014
Retail trade turnover growth Real personal disposable income growth
RETAILERS Retailer demand has remained relatively strong in Russia with limited new market entrants but existing retailers looking to expand and experiment with new format types Vacancy rates in prime shopping centres in Moscow are at extremely low levels with occupiers now transferring interest to the high street as shopping centre space cannot meet the demand
Those brands already present in Russia are actively looking to expand into the regions
NEWCOMER BRANDS WITH DEVELOPMENT PLANS IN RUSSIA НОВЫЕ ПЛАНЫ РАЗВИТИЯ РИТЕЙЛЕРОВ В РОССИИ
Source official websites and other media
REGION CITY NEWCOMERS 2013 COMING SOONSouthern Volgograd Leroy Merlin
Armavir LentaSochi Bata Louis Vuitton StarbucksTaganrog LentaKrasnodar Barker Bata StarbucksRostov-on-Don Starbucks
ETHEgraveOgraveAringEacuteEumlAringETHUcirc Спрос на качественные торговые помещения со стороны ритейлеров высокий Ритейлеры продолжают экспериментиро-вать с новыми форматами В связи с дефицитом предложения в торговых центрах Москвы ритейлеры обращают все больше внимания на торговые улицы
Продолжается активная экспансия во все регионы России
GLOBAL RETAILERS COMING TO RUSSIA НОВЫЕ МЕЖДУНАРОДНЫЕ РИТЕЙЛЕРЫ ПЛАНИРУЮЩИЕ НАЧАТЬ РАБОТУ В РОСИИ
NEW GLOBAL RETAILERS IN 2013 НОВЫЕ МЕЖДУНАРОДНЫЕ РИТЕЙЛЕРЫ В РОССИИ 2013
CushmanampWakefield Research quarterly monitoring of 9 quality shopping centers (total GLA - 05 mn sq m) These shopping centers have been opened more than one year ago and have a clear catchment area
OgraveIcircETHAtildeIcircAcircUcircAring IumlIcircIgraveAringUgraveAringIacuteEgraveszlig В III квартале посещаемость торговых центров в Москве находилась на более высоком уровне чем в предыдущие годы в этот период Доля покупателей (количество людей совершив-ших покупки относительно общего количества посетителей) снизилась до 308
Уровень свободных помещений в качественных торговых центрах находится на предельно низком уровне Небольшой рост в III квартале 2013 года (на 08 пп) связан с ротацией арендаторов в одном из торговых центров (один из этажей торгового центра в ближайшее время будет полностью занят крупным арендатором которые в настоящее время проводит ремонт помещения)
В целом в Москве продолжает наблюдаться дефицит предложе-ния в качественных торговых центрах
ДОЛЯ laquoУСПЕШНЫХ ПОКУПАТЕЛЕЙraquo ldquoSUCCESSFUL SHOPPERSrdquo
FOOTFALL ПОСЕЩАЕМОСТЬ ТОРГОВЫХ ЦЕНТРОВ
Source Cushman amp Wakefield
Source Cushman amp Wakefield
Source Cushman amp Wakefield
CushmanampWakefield Research quarterly monitoring of 9 quality shopping centers (total GLA - 05 mn sq m) These shopping centers have been opened more than one year ago and have a clear public contact area Number of successful shoppers remained stable (share of shoppers who make purchases out of all visitors of the monitored shopping centers)
The total number of retail outlets in the observed sample is 865 (brands in shopping galleries without operators of restaurant zones and without service companies like dry cleaning banks etc) These retail outlets are filled with 552 unique brands
VACANCY RATE УРОВЕНЬ СВОБОДНЫХ ПОМЕЩЕНИЙ
Petrovsky Passage
RETAIL SPACE
In Q3 the visiting rate of the retail centers was at the higher level than it used to be in the last year Buyers share (amount of people who made a purchase compared to total number of visitors) decreased with the number of 308 The level of vacant spaces in the quality retail centers is at the lowest level The small increase in the third quarter (08 points) is associated with the rotation of tenants in one of the shopping centers (one of retail centerrsquos floors is going to be fully occupied by the leaseholder who is currently conducting repair facilities)
In general there is a lack of supply in the quality retail centers in Moscow
Announced developers plans CW Forecast New construction YTD
НОВОЕ СТРОИТЕЛЬСТВО В III квартале в России было введено в эксплуатацию 15 новых торговых центров общей торговой площадью 292 750 кв м География нового строительства ndash от Иркутска и Ангарска до Сочи В основном стоятся торговые центры (75 всех новых качественных торговых площадей) также торговые площади открываются в многофункциональных комплексах Средний размер новых торговых центров уменьшается в 2013 году он составляет 26 тыс кв м что на 30 меньше чем в 2011 году
В III квартале крупнейшим открытым торговым объектом стал торгово-развлекательный центр Жемчужная Плаза (GLA 48 тыс кв м) в Санкт-Петербурге построенный в рамках комплексной застройки микрорайона Балтийская Жемчужина
В III квартале в Москве был открыт один новый торгово-развлекательный центр Райкин Плаза Также были открыты но-вые фазы комплекса Отрада В Москве новые качественные торговые площади строятся в разных форматах ndash торгово-развлекательные центры (Рио Райкин плаза) аутлет-центры (Внуково и Fashion House) многофункциональные комплексы (Белая Площадь Эволюция) До конца 2013 г в Московском регионе (г Павловский Посад) планируется открытие ритейл парка Белла Вита (GLA 36 тыс кв м)
NEW CONSTRUCTION 2013 RUSSIAQUALITY RETAIL STORES НОВОЕ СТРОИТЕЛЬСТВО В 2013 ГОДУ РОССИЯ КАЧЕСТВЕННЫЕ ТОРГОВЫЕ ОБЪЕКТЫ
Source Cushman amp Wakefield
QUALITY RETAIL CONSTRUCTION rsquo000 SQ M RUSSIA СТРОИТЕЛЬСТВО КАЧЕСТВЕННЫХ ТОРГОВЫХ ПЛОЩАДЕЙ ТЫС КВ М РОССИЯ
NEW CONSTRUCTION In Q3 15 new retail centers were delivered in Russia with a total area of 292750 sq m The geography of new construction is located from Irkutsk and Angarsk to Sochi The majority of new premises are located in shopping centers (75 of new quality retail space) besides retail space in multifunctional complexes Average area of newly constructed shopping centers is decreasing in 2013 it was about 26000 sq m which is 30 lower than in was in 2011
In the third quarter retail and entertainment center Pearl Plaza (GLA 48000 sq m) was awarded the name of the largest retail project in St Petersburg It was built as a part of the complex development in the Baltic Pearl micro region
Besides the new shopping and entertainment mall Raykin Plaza was delivered in the Q3 Also new phases of the Otrada complex were delivered New quality retail spaces are developed in various formats in Moscow ndash shopping and entertainment centers (Rio Raykin Plaza) outlet-centers (Vnukovo and Fashion House) multifunctional complexes (White Square Evolution) Till the end of 2013 it is planned to open retail park Bella Vita (GLA 36000 sq m) in the Moscow region (Pavlovskiy Posad city)
Standard lease terms for gallery tenants are between 3-5 years break options are rare For anchor tenants (including fashion anchors) lease terms are up to 20 -25 years and break options are becoming popular
Rents are typically payable monthly in advance Turnover percentage rents are increasingly seen in shopping centres Rental rates are generally calculated in USD Euricirc or commercial units are used In less quality shopping centres rental rates are calculated in RUR
Annual indexation is typical between 3-10 or at a level of USD EU CPI The practice of premium key money payments is seldom seen in Russia Rent reviews are rare on the market
Service ChargesIcirciumlaringethagraveoumlegraveicirciacuteiacuteucircaring iumleumlagraveogravearingaeligegrave
Service charge is payable by tenants at either an ldquoopen bookrdquo basis or more common as a fixed cost Utilities payments are charged on consumption Building insurance is normally charged back to tenant via service charge
Local property taxes are not payed separately they are generally included in the service charges Iacuteagraveeumlicircatilde iacuteagrave iacutearingaumlacircegraveaeligegraveigraveicircntildeograveuuml icircaacuteucircdivideiacuteicirc acirceumlthorndivideagravearingograventildeyuml acirc icirciumlaringethagraveoumlegraveicirciacuteiacuteucircaring iumleumlagraveogravearingaeligegrave
Other costsAumlethoacuteatildeegravearing iumleumlagraveogravearingaeligegrave
EcircIcircIgraveIgraveAringETHtimesAringNtildeEcircEgraveAring OacuteNtildeEumlIcircAcircEgraveszlig Acirc OgraveIcircETHAtildeIcircAcircUcircOtilde OumlAringIacuteOgraveETHAgraveOtilde Ставки аренды для помещений в торговых галереях качествен-ных торговых центров в Москве находятся в диапазоне от 500 до 4 000 долларов США (за кв м в год без НДС и других платежей) В течение трех кварталов 2013 и всего прошедшего 2012 года ставки аренды в торговых центрах были стабильны Прайм ритейл индикатор в Москве составляет 3 800 долларов США (за кв м в год без НДС и других платежей) Однако в 2013 году наметилась тенденция к повышению ставок аренды в лучших торговых центрах поэтому рост ставок на лучшие помещения может быть выше 5 (текущий консервативный прогноз)
Вне Москвы ставки аренды в торговых центрах в среднем на 30-60 ниже в зависимости от региона
Дополнительно к ставке аренды ритейлеры платят сервисные сборы за обслуживание (150-250 долларов США за кв м в год для помещений размером менее 500 кв м) за маркетинг (10-25 долларов США за кв м в год) также иногда бывают и другие дополнительные платежи
Source Cushman amp Wakefield
Source Cushman amp Wakefield
PRIME RETAIL INDICATOR MOSCOW ПРАЙМ РИТЕЙЛ ИНДИКАТОР В ТОРГОВЫХ ЦЕНТРАХ МОСКВА
Prime retail indicatormdashbase asking rental rate for the 100-200 sq m gallery unit at the ground floor of the prime shopping centers US$ per sq m per annum triple net
INDICATIVE RENTAL RATES IN QUALITY SHOPPING CENTER RETAIL GALLERIES MOSCOW СРЕДНИЕ АРЕНДНЫЕ СТАВКИ В ГАЛЕРЕЕ КАЧЕСТВЕННЫХ ТОРГОВЫХ ЦЕНТРОВ МОСКВА
COMMERCIAL RATES IN SHOPPING MALLS Moscow retail gallery rental rates are in the range of US$ 500- 4000 (per sq m per year before VAT and other expenses) depending on the size of the retail unit and the type of retailer Throughout Q1-Q3 and the whole of 2012 rental rates were stable across all sub-sectors
Moscowrsquos prime retail indicator is US$ 3800 per sq m per annum as a base rate However a tendency towards rate increases was observed in 2013 and near future growth may be higher than 5 (our current conservative estimate)
In other cities rental rates in shopping malls are typically 30 to 60 below Moscow levels
Additionally among other payments there are operational expenses (US$ 150-250 per sq m annually for units smaller than 500 sq m) marketing (US$ 10-25 per sq m annually) and others depending on the project
QUALITY RETAIL LEASE STRUCTURE СТРУКТУРА ДОГОВОРОВ АРЕНДЫ В КАЧЕСТВЕННЫХ ТОРГОВЫХ ПОМЕЩЕНИЯХ
ANCHORS
lt100 100 - 300 300 - 1200 1200 - 3500 3500-7000
Food court $1800-$2000
Kiosks $5000-$8000
Restaurant $600-$1000 $700
Clothing $1 600 $1 200 $700 $400
Shoes $2 200 $1 700 $1 200 $800
White and Brown $500
Supermarket $500-$600
Hypermarket $250-$450
Cinema $250-$320
BUSINESSGLA SQ M
RETAIL GALLERY MINI ANCHORS
Source Cushman amp Wakefield
15
MARKETBEAT Q3 2013
ТОРГОВЫЕ УЛИЦЫ На центральных торговых улицах свободно (предлагается в аренду или готовится к открытию) около 5 имеющихся поме-щений Ставки аренды в торговых коридорах стабильны В по-следние несколько лет есть тенденция к увеличению сроков аренды если еще три года назад договоры были чаще всего краткосрочные (на 11 месяцев) то сейчас трехлетние договора аренды становятся все более распространенными
Анализ торговых помещений на наиболее проходимых торго-вых улицах в центре города показывает что самыми популяр-ными категориями арендаторов являются предприятия питания (кафе рестораны) и магазины одежды и обуви которые занима-ют 29 и 21 всех помещений на этих улицах соответственно Значимыми арендаторами являются компании предлагающие услуги (спа парикмахерские медицинские услуги предприятия связи салоны фотографии юридические услуги) ndash они занимают 10 всех торговых помещений на главных улицах центра горо-да По 5 всех площадей занимают отделения банков ювелир-ные салоны магазины косметики и аксессуаров
Source Cushman amp Wakefield
HIGH STREETS Nearly 5 of the existing premises are freely available (are offered for lease or being prepared for delivery) in the central high streets Rental rates in the trade corridors are stable There is a tendency for increasing lease terms in the last few years As an example three years ago contracts used to be short-term mostly (11 months) and now agreements for the 3 and 5 years period become more and more widespread
The analysis of the retail spaces on the most passable areas in the city centre shows that the most popular categories of tenants are catering (cafe restaurants) and clothing shops They occupy 29 and 21 of all premises respectively Significant tenants are those who offers the following services spa hairdressers medical services communications companies photography and legal services ndash all of them occupy 10 of retail premises on the main streets of the city banks jewelry stores cosmetic stores and accessories occupy 5
AVERAGE RENTAL RATES ON HIGH STREETS IN MOSCOW СРЕДНИЕ АРЕНДНЫЕ СТАВКИ В ТОРГОВЫХ КОРИДОРАХ МОСКВА
HIGH STREET TENANT MIX MOSCOW Q3 2013 | СТРУКТУРА АРЕНДАТОРОВ В ТОРГОВЫХ КОРИДОРАХ МОСКВА III КВ 2013
Food Restaurants Cafes Fashion and footwareServices Bank ExchangeAccessories Optics Watches JewelryCosmetics Pharmacy Perfumery Other
HIGH STREET RENTAL RATES MOSCOW АРЕНДНЫЕ СТАВКИ В ТОРГОВЫХ КОРИДОРАХ МОСКВА
Data of the following trade corridors was used to conduct the analysis Tverskaya Petrovka-Stoleshnikov-Kuznetsky Most Nikolskaya Pyatnytskaya Pokrovka-Maroseyka In total these trade corridors located 710 outlets
US$ per sq m per annum triple net Aumlicirceumleumlagraveethucirc NtildeOslashAgrave ccedilagrave ecircacircigrave acirc atildeicircauml aacuteagraveccedilicircacircagraveyuml ntildeograveagraveacircecircagrave agraveetharingiacuteaumlucirc
OgraveIcircETHAtildeIcircAcircUcircAring OacuteEumlEgraveOumlUcirc mdash IumlAringOslashAringOtildeIcircAumlIacuteUcircAring CcedilIcircIacuteUcirc Важнейшим событием для торговых улиц стала программа развития пешеходных зон в Москве активно поддерживаемая Правительством города На тех улицах где уже отменили движение транспорта (в первую очередь Большая Дмитровка) происходит смена потоков посетителей (от пассажиров к пешеходам) Пешеходные улицы имеют огромный потенциал с точки зрения торговли и уже сейчас ритейлеры проявляют большой интерес к пешеходным районам Расширение пешеходных районов значительно увечит предложение качественных торговых помещений на улицах в Москве
HIGH STREETS mdash PEDESTRIAN AREA The most important event for the high streets became the development of pedestrian zones in Moscow which is actively supported by the city government There is a change of visitor flows (from passengers to pedestrians) on those streets where the driving was cancelled (it concerns Bolshaya Dmitrovka street first of all) There is a huge potential for retail activity talking about pedestrian streets and retailers show great interest in developing of those areas The expansion of pedestrian zones will significantly increase the supply of the quality retail premises in Moscow
HIGH STREETS mdash PEDESTRIAN AREA ТОРГОВЫЕ УЛИЦЫ mdash ПЕШЕХОДНЫЕ ЗОНЫ
With vehicular traffic restriction | Oacuteeumlegraveoumlucirc atildeaumlaring icircatildeethagraveiacuteegravedividearingiacuteicirc aumlacircegraveaeligaringiacuteegravearing ograveethagraveiacutentildeiumlicircethograveagrave
Opened for vehicles | Oacuteeumlegraveoumlucirc atildeaumlaring icircograveecircethucircograveicirc aumlacircegraveaeligaringiacuteegravearing ograveethagraveiacutentildeiumlicircethograveagrave
Q3 2013 MoscowRUSSIA A Cushman amp Wakefield Research Publication
OFFICE MARKET
IcircAacuteCcedilIcircETH ETHUcircIacuteEcircAgrave В III квартале 2013 г рынок продолжает оставаться активным спрос и предложение сбалансированы ставки аренды стабильны
Тенденция ослабления рынка офисной недвижимости отмечен-ная впервые в предыдущем квартале подкрепляется новыми фактами
Продолжилось снижение общего объема заключаемых сделок аренды и покупки в III квартале общий объем заключенных сделок составил 385 836 кв м что на 20 ниже среднего уровня 2011-2012 гг
Даже небольшой рост объема вывода на рынок новых помеще-ний приводит к увеличению доли свободных помещений За счет одного крупного объекта (Башня Меркурий в Москва-Сити арендуемой площадью 87 547 кв м) объемы ввода в эксплуатацию офисных площадей класса А в III квартале увеличились вдвое относительно средних объемов строительст-ва последних трех лет В результате уровень свободных помещений в классе А в среднем по Москве увеличился на 35 пп а в районе Москва-Сити mdash на 156 пп
Средняя ставка аренды не изменяется в течение последних трех кварталов в то время как инфляции в России за январь-май 2013 превысила уровень 7
ABSORPTION AND NEW CONSTRUCTION CLASSES A AND B (MN SQ M)
OVERVIEW The third quarter of the year saw the office market remain healthy with steady levels of demand Rents held firm There is a tendency of weakening signs in the office market which was noted for the first time in the previous quarter Now it is supported by some new facts
Overall demand level has continued to decrease Q3 take-up is 385836 sq m which is 20 less than the average take-up level for 2011-2012
Even moderate growth of new office space affects the vacancy rate In Q3 the delivery of Mercury Tower in Moscow City submarket (87547 sq m of office rentable area) doubled the quarterly Class A new construction volume (compared to the average number during the last three years) As a result the level of vacant space has increased by 35 percentage points in the Moscow Class A sector Talking about Moscow City submarket the volume of vacant space has increased by 156 points
Rental rates remain unchanged the CPI is above 7 (January-May 2013 data)
Source Cushman amp Wakefield
TOTAL STOCK MOSCOW | ОБЩИЙ ОБЪЕМ ПРЕДЛОЖЕНИЯ В МОСКВЕ 1360 mn sq m
VACANCY RATE | ДОЛЯ СВОБОДНЫХ ПЛОЩАДЕЙ 128
US$ 860 AVERAGE RENTAL RATE CLASS A | СРЕДНЯЯ АРЕНДНАЯ СТАВКА КЛАСС А
Q1-Q3 DEMAND (TAKE-UP) | ОБЪЕМ СДЕЛОК АРЕНДЫ И ПРОДАЖИ В 1-III КВ 2013 1190138 sq m
Q1-Q3 2013 NEW CONSTRUCTION | НОВОЕ СТРОИТЕЛЬСТВО В 1-III КВ 2013 594009 sq m
SUPPLY By the end of Q3 2013 Moscow had 136 mn sq m of quality office space Nine new office buildings were completed with a rentable area of 244587 sq m in Q3 New construction volume remains moderate
Nearly 50 of new office space delivered in 2013 is located in the Moscow suburbs (outside TTR) while the demand is drawn towards the city center So the suburbs are in danger of oversupply during the last four quarters the vacancy rate in suburban submarkets has increased by 58 percentage points from 11 in Q3 2013 to 168 in Q3 2013
In the Central and Prime business areas (with the exception of Moscow City submarket) the vacancy rate is stable while in several central submarkets (such as Tagansky Frunzensky Novoslobodsky) the availability is decreasing
After the recent delivery of Mercury Tower with 87547 sq m of office rentable space Moscow City availability has doubled Hence the Moscow City vacancy rate grew by 156 percentage points up to 327
Altogether there are 154 mn sq m of available office premises in existing buildings and 35 mn sq m is under speculative construction
IumlETHAringAumlEumlIcircAEligAringIacuteEgraveAring По состоянию на конец III квартала 2013 года в Москве насчи-тывалось 136 млн кв м качественных офисов В III квартале было введено в эксплуатацию 9 офисных зданий общей арен-дуемой площадью 244 587 кв м Объемы нового строительства продолжают оставаться умеренными
Около 50 новых офисных площадей вышедших на рынок в 2013 году находятся в удаленных от центра города районах (за пределами ТТК) В то же время спрос продолжает тяготеть к центру города В результате на окраинах города наблюдается тенденция к росту избыточности предложения Так в течение 4-х последних кварталов уровень свободных помещений в рай-онах за пределам ТТК увеличился на 58 пп с 11 (III кв 2012) до 168 (III кв 2013) Внутри ТТК уровень свободных помеще-ний стабилен а в некоторых субрынках (Таганском Фрунзен-ском Новослободском) свободных помещений становится меньше Исключение составляет субрынок Москва-Сити где после ввода в эксплуатацию Башни Меркурий площадью 87 547 кв м объем свободных помещений удвоился что не-медленно привело к росту уровня свободных помещений на 156 пп до уровня 327
Всего в Москве предлагается в аренду или на продажу 154 млн кв м в существующих и 35 млн кв м в строящихся зданиях
Future supply mdash available space in buildings to be delivered in the next 12 month (under construction and under reconstruction) The data is given for the end of the period
Source Cushman amp Wakefield Source Cushman amp Wakefield Moscow Research Forum
DEMAND Overall 12 million sq m of quality office space was leased or bought during Q1-Q3 2013 For the second quarter in a row the total volume of take-up is decreasing In Q3 385836 sq m of quality office space has been transacted which is 20 below the average quarterly level of 2011-2012 Real estate budgets are limited and tenants tend to primarily consider their current location as a viable alternative to a new office
Tenants continue to be interested primarily in existing buildings the proportion of pre-lease agreements in Q1-Q3 was 63 of the total rented space (23 in Q3) In 2013 there is a significant reduction in the proportion of sales deals (from 20 on average in 2011-2012 to around 10 in 2013)
The number of large transactions (over 2000 sq m) continues decreasing The average transaction size has reduced again by 10 compared with the previous quarter and now stands at 528 sq m (taking into account only leasing deals)
NtildeIumlETHIcircNtilde Всего за три квартала 2013 года было арендовано и куплено 12 миллиона кв м качественных офисных помещений Вто-рой квартал подряд наблюдается снижение общего объема сделок В III квартале общий объем сделок составил 385 836 кв м что на 20 ниже среднего уровня 2011-2012 годов Бюджеты на недвижимость и переезды ограничены аренда-торы и арендодатели все чаще находят компромиссы приво-дящие к продлению текущих договоров аренды а не заклю-чению новых сделок в новых зданиях
Арендаторы продолжают интересоваться главным образом введенными в эксплуатацию зданиями ndash в 2013 году (1-III кв) доля договоров предварительной аренды составила менее 63 (в III кв ndash 23) от всех арендованных площадей Доля сделок продажи также продолжает оставаться низкой и со-ставляет не более 10 от всего объема офисных сделок
Продолжает снижаться количество крупных сделок (размером более 2 000 кв м) Средний размер транзакции снизился на 10 относительно предыдущего квартала и в III квартале составил 528 кв м учитывая только сделки аренды
NtildeOgraveAgraveAcircEcircEgrave AgraveETHAringIacuteAumlUcirc В классе А средняя запрашиваемая арендная ставка составляет 860 долларов США В классе Б средняя ставка аренды стабильна на уровне 520 долларов США Ставки аренды для Прайм офисов продолжают находиться на уровне 1 200 долларов США за кв м в год (без НДС и операционных расходов)
Source Cushman amp Wakefield
Source Cushman amp Wakefield
Q3 2013 AVERAGE BASE RENTAL RATES BY BUSINESS AREA СРЕДНИЕ БАЗОВЫЕ СТАВКИ АРЕНДЫ В III КВ 2013 Г ПО БИЗНЕС РАЙОНАМ
AVERAGE RENTAL RATES (US$) СРЕДНИЕ СТАВКИ АРЕНДЫ (ДОЛЛАРЫ США)
Downtown
Central
OTA
Moscow subareas
Moscow is divided into office submarkets areas with similar real estate indicators and dynamics Office submarkets are grouped in office subareas
The Downtown subarea is the territory inside the Garden Ring and the Belorussky business area
The Central subarea is the territory between the Garden ring and TTR (and the more distant SOK and KUT submarkets)
OTA includes the Moscow suburbs
RENTAL RATES In Class A the average asking rental rate is $860 In Class B the average asking rental rate was stable at $520 Rental rates for prime office space is at the level of $1200 per year per sq m (triple net)
IumlETHIcircAtildeIacuteIcircCcedil Несмотря на то что по заявлениям девелоперов более 400 тыс кв м площадей планируется к вводу во IV кв 2013 года мы ожидаем что до конца года будет введено в эксплуатацию дополнительно не более 150ndash200 тыс кв м новых офисов Таким образом в 2013 году сохранится баланс спроса и предло-жения в большинстве офисных субрынков
Высокие объемы строительства на окраинах города и в Москва-Сити не окажут существенного дестабилизирующего влияния на центральные районы До конца 2013 года а также в 2014 году в центральных районах ставки аренды будут стабильны возможен рост в соответствии в уровнем инфляции
LEASE TERMS IN QUALITY BUSINESS CENTERS УСЛОВИЯ АРЕНДЫ КАЧЕСТВЕННЫХ ОФИСНЫХ ПОМЕЩЕНИЙ
RUR USD or Euros (rarely used) per sqmyr For currency exchange landlords use either Central Bank of Russiarsquos official rate or set their own rate or fix the dollar corridor eg 25-40 RUBUSD
Российские рубли доллары США или евро (используется редко) за квм в год Используется обменный курс ЦБ России или используются условные единицы (уе) с фиксированным курсом в коридоре 25-40 рублей за уе
Payments Iumleumlagraveogravearingaeligegrave Quarterly in advance Ежеквартально авансом
Indexation Egraveiacuteaumlaringecircntildeagraveoumlegraveyuml 3-5 or at the level of USA EU CPI 10-15 for RUR agreements Sometimes step-rents are used
3-5 или US CPI 10-15 для рублевых договоров аренды Ингода используется ступенчатая индексация
Other payments Aumlethoacuteatildeegravearing iumleumlagraveogravearingaeligegrave
Operational expences
Операционные расходыThis sort of payments strongly depends on the service list included Average market payments 100-150 USDsqmyr for Class A 80-120 USDsqmyr for Class B
Платежи зависят от состава включенных услуг который может значительно отличаться 100-150 долларов США за квм в год для Класса A 80-120 долларов США за квм в год для Класса Б
VATНДС 18 18Source Cushman amp Wakefield
FORECAST Despite the announcements from developers that they will deliver more than 400000 sq m in Q4 2013 the new construction forecast continues to be rather conservative Just 150000-200000 sq m of new office space might be delivered by the end of this year Consequently in 2013 the supply-demand balance should remain stable
The high volume of office space under construction is the biggest threat at the moment Against the possible local oversupply in Moscow suburbs and Moscow-City submarkets in 2014 central and prime business areas should see a market balance both at the end of 2013 and during the whole 2014 For these areas rental rates are projected to grow in line with inflation
The table contains office buildings announce for delivery in 2013 with rentable area more than 15000 sq m Delivered buildings are included disregarding the size
TOTAL mdash Office rentable area or all office buildings announced for delivery in 2013 (including small buildings with office rentable less than 15000 sq m)
DOWNTOWNBlackampWhite Complex (bld White) ZAM B+ 13000 Q1Rosso Riva ZAM A 11947 Q1Park Tower BEL B+ 11850 Q1Chistoprudnyy bul 8 bld 1 CBD B- 4730 Q1White Gardens BEL A 63900 Q1Wall Street ZAM A 20493 Q2Vishnevy Sad CBD B+ 6736 Q2Domino ZAM A 6216 Q3Lukoil build-to-suit CBD B+ 35000 Q3CENTRALDubininskaya ul 33B SCH B+ 3000 Q1City Point BC CTY B+ 9951 Q1Sinitsa Plaza BAS B+ 13496 Q2Mercury City CTY A 87574 Q3Poluyaroslavskiy Bolshoy per 102 bld BAS B+ 2294 Q3Poklonnaya ul vl 3 KUT A 85572 Q4Park Pobedy KUT B+ 54000 Q4Nizhegorodsky Business Centre phase II BAS B- 37100 Q4Nizhegorodsky Business Centre phase I BAS B- 23000 Q4Arma 19 BAS B+ 19080 Q4Golden Gate BAS B+ 16000 Q4OTANewton Plaza SE B+ 52000 Q1Danilovskaya Manufaktura Sitsevyi Korpu SE B+ 3396 Q1iCube SW B+ 15256 Q1Obrucheva ul 52 bld3 SW B- 23300 Q1Lotte Business Centre SW B+ 38480 Q1Streamline NE B+ 11048 Q1Quadrum SUB B+ 24650 Q2Park Mira NE B+ 7000 Q2Format Complex II SUB B- 9122 Q2Dobrolyubova 6 bld 5 NE B- 4699 Q3Leninsky 119 SW A 15400 Q3Central Street NE B+ 6423 Q3Smart Park SW B+ 10260 Q39 akrov phase II SW B+ 62300 Q3Country Park Phase III SUB A 19120 Q3Riga Land bld 5 (bld A) (phase II) SUB B+ 40000 Q4Solutions BP bld 3 SW B+ 19500 Q4Avrora NE B- 21600 Q4Neo Geo SW B- 70000 Q4Novator office-hotel complex SUB B+ 24000 Q4Mebe One Khimki Plaza SUB A 26000 Q4
TOTAL 217236
TOTAL 421653
TOTAL 551253
Q3 2013 MoscowRUSSIA A Cushman amp Wakefield Research Publication
HOSPITALITY
ADR IN AUGUST 2013 | СРЕДНЯЯ ЦЕНА ЗА НОМЕР В АВГУСТЕ 2013 $152
QUALITY SUPPLY | ТЕКУЩИЙ ОБЪЕМ КАЧЕСТВЕННОГО ПРЕДЛОЖЕНИЯ 14200 rooms
OCCUPANCY | ЗАПОЛНЯЕМОСТЬ 77
RevPAR | СРЕДНИЙ ДОХОД НА НОМЕР $117
IumlETHAringAumlEumlIcircAEligAringIacuteEgraveAring По оценке департамента гостиничного бизнеса и туризма совокупный объем номерного фонда в Москве на конец III квартала 2013 г составил свыше 48 тыс номеров из них доля качественного предложения составила порядка 30 общего предложения или 142 тыс номеров
Новое предложение за III квартале 2013 г в сегменте качествен-ных гостиниц составило 1138 номеров и было сформировано за счет ввода в эксплуатацию 4-х гостиниц разной ценовой категории
В ноябре 2013 г ожидается открытие гостиниц под управлени-ем оператора Accor комплекс из трех отелей расположен по адресу ул Бахрушина вл 11 В состав комплекса войдут 3 гостиницы разной ценовой категории Mercure на 158 номеров (Upscale) Ibis на 190 номеров (Midscale) Adagio на 149 апартаментов (Midscale)
Это увеличит предложение на рынке качественных отелей минимум на 497 номеров Ожидаемое в 2013 г открытие гостиницы Marriott Novy Arbat (234 номера) перенесено на 1 квартал 2014 года
SUPPLY According to the Department of Hospitality and Tourism the cumulative number of rooms in the Moscow hotel market at the end of Q3 2013 is estimated at more than 48000 rooms with the proportion of high-quality supply at about 30 or 14200 rooms
The increase in high-quality segment by the end of Q3 2013 totaled 1138 rooms resulting from the commissioning of 4 hotels in different price categories
In addition Accor will open three new hotels in November Q4 2013 in the hotel complex located at ul Bakhrushina 11 The complex of hotels includes three brands Mercure with 158 rooms (Upscale) Ibis with 190 rooms (Midscale) and Adagio with 149 rooms (Midscale)
We believe that the total supply of international grade rooms will increase by 497 by the end of 2013 It was expected that more rooms would have been available but the opening of the Marriot Noviy Arbat (234 rooms) was postponed till the Q1 2014
QUALITY MOSCOW HOTEL MARKET STRUCTURE Q3 2013 YTD
NtildeOgraveETHOacuteEcircOgraveOacuteETHAgrave EcircAgravetimesAringNtildeOgraveAcircAringIacuteIacuteUcircOtilde AtildeIcircNtildeOgraveEgraveIacuteEgraveOuml IgraveIcircNtildeEcircAcircUcirc III EcircAcirc 2013
Средняя цена за номер (ADR) в августе 2013 г составила $152 что на 5 выше уровня августа 2012 г Положительная динамика обеспечена за счет гостиниц высокой ценовой категории максимальный рост средней цены за номер по отношению к результатам за аналогичный период 2012 г продемонстрировал рынок гостиниц класса Upscale 16 Среднеценовые объекты напротив работали с более демократичными группами спроса на рынке гостиниц класса Midscale было отмечено снижение показателя ADR на 7 по сравнению с августом 2012 г
Символическое падение ставок за номер на уровне 043 и 221 было отмечено также в сегментах Upper Midscale и Luxury соответственно что в целом характерно для августа ndash наиболее laquoтуристскогоraquo месяца в году
В отношении результатов 2013 г (по данным на август) рынок качественных гостиниц показал небольшое снижение показате-ля ADR (-11) по сравнению с прошлым годом что равносиль-но стабилизации в том числе с учетом ослабления рубля
Наиболее агрессивными с точки зрения ценовых ожиданий остаются гостиницы категории Luxury показывающие на фоне общих понижающих корректировок цены небольшой рост с $375 до $376 за номер
Московские гостиницы предлагают широкий разброс цен по сегментам наиболее дорогие ndash гостиницы категории Luxury где ADR в августе 2013 г составил $315 что на 10698 выше среднего показателя по рынку качественных гостиниц
Ценовой разрыв отелей категории Luxuгy со следующим за ним сегментом внушителен средняя цена за номер в гостиницах категории Upper Upscale уже только на 2875 превысила средний показатель по рынку и составила $197 Стоимость номера в гостиницах категории Upscale сравнима со средним по рынку значением и составляет $160
Цены за номер в гостиницах класса Upper Midscale и Midscale ниже среднерыночных на 30 и 48 соответственно и составляют $105 и $79 за номер (данные за август)
AVERAGE DAILY RATE US DOLLAR (ADR) AUGUST 2013 YTD
QUALITY HOTEL MARKET TRADING Average daily rate in August 2013 estimated to $152 which is 5 higher than in August 2012 This positive dynamic was ensured by high-quality hotels the highest ADR growth was recorded in the Upscale segment ndash Up 16 compared to the same period last year Midscale market in this period was oriented to more democratic groups of demand ADR declined by 7 comparing to August 2012
The fall in ADR at the level of 043 and 221 was also recorded in the Upper Midscale and Luxury segments respectively but that is typical for the August ndash the most tourist month of the year
The results of 2013 (August YtD) showed a symbolic decrease in ADR (-11) comparing to 2012 that can be interpreted as a stabili-zation taking into account the weakening of the Ruble
The most aggressive in terms of price expectations remain Luxury market segment showing slight increase from $375 to $376 per room comparison with the general lowering of prices
Moscow hotels offer a wide range of prices by segment the most expensive ndash Luxury with ADR in August about $315 it is 10698 higher than the average for the Moscow quality market
There is an impressive gap between Luxury hotel prices and prices for the Upper Upscale segment Average daily rate for Upper Upscale is about $197 and only 2875 higher than the average for the Moscow quality market
0
50
100
150
200
250
300
350
400
2010 2011 2012 2013
Luxury Upper Upscale
Upscale Upper Midscale
Midscale Moscow average
0
10
20
30
40
50
60
70
80
2010 2011 2012 2013
Luxury Upper UpscaleUpscale Upper MidscaleMidscale Moscow average
25
MARKETBEAT Q3 2013
NtildeIumlETHIcircNtilde
Средняя годовая загрузка качественных гостиниц Москвы в августе 2013 г составила 77 что на 11 выше данного показателя за аналогичный период прошлого года
Максимально высоким спросом в Москве пользуются гостиницы категории Upper Midscale и Midscale загрузка которых в августе фиксировалась на уровне 854 и 826 соответственно
Одной из особенностей рынка гостиниц Москвы в III кв 2013 г стала высокая загруженность качественных и центрально расположенных гостиниц в августе ndash традиционно низком из-за наступления laquoсезона отпусковraquo Нетипично высокая загрузка стала следствием увеличения туристских потоков в том числе за счет проведения Универсиады в Казани добавившей laquoтранзитныхraquo клиентов московским отелям
По итогам 2013 г по состоянию на август рынок качественных гостиниц показывает рост спроса по сравнению с прошлым годом практически по всем сегментам Рост спроса простимули-рован как ростом потока ночующих посетителей в Москву так и стагнацией цен на размещение последнее обстоятельство говорит о продолжающемся периоде неопределенности
OgraveAringIacuteAumlAringIacuteOumlEgraveEgrave
Среднее значение дохода на номер (RevPAR) за август 2013 г выросло на 171 и составило $117 против $100 в 2012 г В то же время по итогам 2013 г по состоянию на август динамика RevPAR по сегментам колебалась от 84 в Midscale до -46 в отелях категории Upper Midscale
Мы полагаем что тенденции к повышению среднерыночной доходности на номер (+12 YtD) за счет гибкой ценовой политики реагирующей на изменения спроса сохранится и в ближайшей перспективе В 2014 г гостиницы вышедшие на рынок в 2013 г окажут более выраженное воздействие на рыночную ситуацию за счет чего показатели RevPAR по сегменту Luxury и особенно Upper Midscale вряд ли существен-но превзойдут текущие показатели и будут колебаться от слабоотрицательных до слабоположительных значений в начале и конце года
DEMAND The average annual occupancy of quality hotels in Moscow in August 2013 was about 77 which is 11 higher than in the same period last year
Maximum high demand in Moscow hotels was in the Upper Midscale and Midscale category with occupancy in August at the level of 854 and 826 respectively
One of the features of the market of Moscow hotels in Q3 2013 was the high occupancy of quality hotels and especially the central located hotels ndash traditionally low in August because of the holiday season Unusually high occupancy was a result of increased tourist flows including through the Universiade in Kazan which added transit clients for Moscow hotels
In general up to August 2013 (YtD) the Moscow quality hotel market shows a growth in demand comparing to 2012 in almost all segments (reduced occupancy in Upper-Midscale segment by 03 pp can be seen as an insignificant adjustment) Demand growth is stimulated by the growing stream of domestic and international visitors staying overnight in Moscow and the stagnation of prices for accommodation the last point indicates the continuing period of uncertainty in the market
TRENDS IN REVENUE Average revenue per available room (RevRAR) in August 2013 increased by 171 to $117 versus $100 in August 2012
At the same time according to the results of August 2013 RevPAR dynamics by segment ranged from 84 in the Midscale segment to -46 in the Upper Midscale hotels We believe that the tendency to stimulate the RevRAR increase which the flexible price sensible of demand change will continue in the near future In 2014 the new hotels will have a more pronounced effect on the general market situation whereby RevPAR (especially for Luxury and Upper Midscale) unlikely to surpass itrsquos current estimations and will vary from slightly negative to low positive values at the beginning and end of the year
За III квартал 2013 года в эксплуатацию было введено более 235 тыс кв м качественных складских площадей
Ставки аренды остаются стабильными и составляют в среднем $135 за кв м в год в классе А без НДС операци-онных расходов и коммунальных платежей
Цена продажи составляет $1 200- $1 300 за кв м в типовых проектах класса А
Доля вакантных площадей в складах класса А за полугодие не изменилась и составляет 1
Объем арендованных и купленных складских площадей в III составил более 350 тыс кв м
Регионы
В большинстве регионов средние ставки аренды в классе А за прошедший квартал не изменились за исключением Новосибирска и Нижнего Новгорода где ставки выросли на 4-6
Объем арендованных и купленных складских площадей в III квартале составил более 85 тыс кв м
SUMMARY Moscow
In Q3 2013 more than 235000 sq m of quality warehouse space were put into operation
Rental rates remain stable at an average of $135 per sq m per year in A Class excluding VAT operating expenses and utility
The price of sale is $1200 - $1300 per sq m in typical projects of class A
The vacancy rate in Class A warehouses for the half of the year remains unchanged at 1
The volume of leased and purchased warehouse space in Q3 amounted to 350000 sq m
Regions
The average rental rates in Class A have not changed for the quarter in most regions except Novosibirsk and Nizhny Novgorod where rates have increased by 4-6
The volume of leased and purchased warehouse space in Q3 amounted to 85000 sq m
$132
$130
$140
$105
$110
$135
$135
$135
$80
$90
$100
$110
$120
$130
$140
$150
2006 2007 2008 2009 2010 2011 2012 2013F
KEY EXPECTATIONS
STABILITY
0
200
400
600
800
1000
1200
1400
1600
1800
2007 2008 2009 2010 2011 2012 2013F 2014F
27
MARKETBEAT Q3 2013
Source Cushman amp Wakefield
Source Cushman amp Wakefield
Source Cushman amp Wakefield
Source Cushman amp Wakefield
ОСНОВНЫЕ ТЕНДЕНЦИИ Объем нового строительства за 1-III кв 2013 года в Московском регионе составил 550 тыс кв м что соответствует аналогично-му показателю прошлого года Объем арендованных и куплен-ных площадей по итогам прошедших трех кварталов составил белее 830 тыс кв м что приблизительно соответствует показа-телю прошлого года
В регионах объем нового строительства в регионах за первые три квартала составил 239 тыс кв м что на треть меньше про-шлогоднего Арендовано куплено 250 тыс кв м что больше прошлогоднего показателя на 20
ПРЕДЛОЖЕНИЕ В Московском регионе в III квартале 2013 года предложение увеличилось на 235 тыс кв м
В минувшем квартале были построены
Логопарк Север (110 тыс кв м) девелопер Каравелла
Два новых корпуса в логистическом парке Климовск (48 тыс кв м) девелопер Raven Russia
Объем нового строительства соответствует показателям преды-дущего года но темпы строительства ниже заявленных девело-перами Основная проблема mdash задержки в строительстве Боль-ше всего это касается новых девелоперов длительное время работающие на рынке компании укладываются в заявленные сроки Поэтому до конца года будет построено до 1 млн кв м складских площадей
На рынке Москвы сохраняется дефицит готовых к въезду склад-ских площадей Все проекты сдаются или продаются на этапе строительства
Чистые средние ставки аренды в течении прошедшего квартала не изменились и составляют $135 за кв м при этом разброс ставок остается высоким
В 2014 году девелоперы обещают построить около 15 млн кв м складских площадей однако по нашем оценкам из-за задер-жек при строительстве построено будет на 30 меньше
KEY TRENDS The volume of new construction for Q1-Q3 2013 in the Moscow region amounted to 550000 sq m which corresponds to the same period of last year The volume of leased and purchased land based on the results of Q1-Q3 was more than 830000 sq m which approximately relative to the previous year figure
The volume of new construction in the regions for the first three quarters amounted to 239000 sq m which is a three times less than last year indicator 250000 sq m were leased and sold which is 20 more than last year figure
SUPPLY In Q3 2013 supply in Moscow region increased by 235000 sq m
In the last quarter were put into operation
bull Logistics Park North (110000 sq m) developer is Caravella
bull Two new phases in the logistics park Klimovsk (48000 sq m) developer is Raven Russia
The volume of new construction complies with the previous year but below the pace of construction announced by developers The main problem is the delays in construction mostly it concerns new developers Experienced companies meet the announced deadlines Therefore there will be built up to one million sq m of warehouse space until the end of the year
In Moscow there is a lack of ready-to-move storage space All projects are sold or bought during the construction process
Net average rental rates have not changed during the last quarter and amounted to $135 per sq m while the spread rate remains relatively high
In 2014 developers expect to build nearly 15 mn sq m of warehouse space however according to our estimations the volume of construction will be 30 less due to the development process delays
DISTRIBUTION OF QUALITY DEVELOPMENTS IN THE PIPELINE FOR 2013-2014 (lsquo000 SQ M) РАСПРЕДЕЛЕНИЕ ПЛАНИРУЕМЫХ К ВВОДУ В 2013-2014 ГГ СКЛАДСКИХ ПЛОЩАДЕЙ В МОСКОВСКОЙ ОБЛАСТИ ТЫС КВ М
DISTRIBUTION OF WampI SPACE IN THE MOSCOW REGION (lsquo000 SQ M) РАСПРЕДЕЛЕНИЕ СКЛАДСКИХ ПЛОЩАДЕЙ В МОСКОВСКОЙ ОБЛАСТИ ТЫС КВ М
В регионах в минувшем квартале было построено только 43 тыс кв м качественных складских площадей против 117 тыс в прошлом Все новые объекты построены рядом с Санкт-Петербургом
Всего в 2014 году в регионах будет построено боле 290 тыс кв м против 410 тыс кв м в прошлом В большинстве регионов дефицита складских площадей не наблюдается Исключение составляет Санкт-Петербург Екатеринбург и Ростов-на-Дону
Чистые ставки аренды в регионах в III квартале 2013 года не изменились за исключением Новосибирска и Нижнего Новгорода где они немного выросли до $120 и $123 за кв м соответственно
Source Cushman amp Wakefield
TAKE UP lsquo000 SQ M ОБЪЕМ АРЕНДОВАННЫХ И КУПЛЕННЫХ ПЛОЩАДЕЙ ТЫС КВ М
Source Cushman amp Wakefield
During the past quarter only 43000 sq m of quality warehouse space was built In the regions as against last year fiqure (117000 sq m) All new premises were built near St Petersburg
Comparing to last year figure (410000 sq m) more than 290000 sq m is going to be built in the regions in 2014 In most regions there is no lack of warehouse spaces observed The exceptions are St Petersburg Yekaterinburg and Rostov-on-Don
Net rental rates have not changed in the regions in Q3 except Novosibirsk and Nizhny Novgorod where they rose slightly to $120 and $123 per sq m respectively
2013 PIPELINE ОБЪЕКТЫ ЗАЯВЛЕННЫЕ К СТРОИТЕЛЬСТВУ В 2013 Г
PROJECT DEVELOPER GRADE DIRECTION HIGHWAYDISTANCE FROM
MKAD KMTOTAL AREA
000 SQ MEXPECTED
DELIVERY
Infrastroy Bykovo Infrastroy А E Egorevskoe 17 6155 Q1
Infrastroy Bykovo Infrastroy А E Egorevskoe 17 6193 Q4
Klimovsk LP Raven Russia A S Simferopolskoye 23 4772 Q3
Logopark Sever Karavella A N Rogachevskoye 30 11023 Q3
PNK Chekhov II PNK group A S Simferopolskoye 50 10424 Q2
PNK Chekhov II PNK group A S Simferopolskoye 50 5531 Q4
PNK Vnukovo PNK group A SW Kievskoe 19 10568 Q1
South Gate IP Radius group A S Kashirskoye 30 2070 Q2
South Gate IP Radius group A S Kashirskoye 30 3000 Q4
СПРОС В Московском регионе за I-III кварталах 2013 г было арендовано и куплено более 850 тыс кв м качественных складских площадей из них 235 тыс в III квартале что соответствует прошлогодним показателям
Наиболее крупные сделки в минувшем квартале
Автомобильный концерн Volkswagen купил 50 тыс кв м в складском комплексе PNK Чехов 2 девелопер PNK Group
Компания Верный купила 43 тыс кв м в складском комплексе PNK Север девелопер PNK Group
Автомобильный концерн General Motors арендовала 40 тыс кв м в индустриальном комплексе Южные врата
Следует отметить что большое количество качественных складских площадей было арендовано и куплено в III квартале 2013 г производственными компаниями при этом логистиче-ские компании и дистрибьюторы наоборот купили и арендова-ли меньшее количество площадей
Так же следует отметить увеличение доли продаж в III квартале до 42 против 14 во II квартале в структуре поглощения
На региональных рынках за минувший квартал было арендовано и куплено более 85 тыс кв м всего с начала года более 250 тыс кв м что почти на 20 выше аналогичного показателя прошлого года и на 5 среднего значения за последние 5 лет Этот показатель во многом обусловлен самой крупной сделкой за всю историю рынка складской недвижимости Санкт-Петербурга по предварительной продаже 43 тыс кв м компанией PNK Group продуктовой сети laquoВерныйraquo в складском комплексе PNK КАД
Сделки на такие большие площади позволяют девелоперу возобновить строительство в регионах но за период с IV кв 2012 по III квартале 2013 г Было заключено только 4 сделки более 25 тыс кв м Большинство сделок в регионах заключает-ся на складские площади до 10 тыс кв м
STRUCTURE OF DEMAND MOSCOW СТРУКТУРА СПРОСА МОСКВА
DEMAND In the Moscow region in Q1-Q3 2013 more than 850000 sq m were rented and purchased talking about quality warehouse space The Q3 indicator is 235000 sq m which is the same to the last years performance
The largest deals in the last quarter
bull Car manufacturer group Volkswagen bought 50000 sq m in a warehouse complex PNK Chekhov 2 developer is PNK Group
bull The Verniy company bought 43000 sq m in a warehouse complex PNK North developer is PNK Group
bull Automobile сar manufacturer General Motors leased 40000 sq m in the industrial complex South Gate
It should be noted that a large number of quality warehouse space was leased and purchased in the Q3 2013 by manufacturing companies while logistics companies and distributors on the contrary have bought and rented a smaller amount of warehouse space
It should be also mentioned the increasing sales in Q3 up to 42 comparing to 14 in the previous quarter for the both leased and bought premises
At the regional markets for the last quarter it was rented and purchased more than 85000 sq m Since of the beginning of the year more than 250000 sq m were rented and purchased which is almost 20 higher than last year and 5 higher than the average number for the last 5 years This indicator is largely due to the largest deal in the history of the warehouse property market of St Petersburg on the pre-sale of 43000 sq m by PNK Group to the food supplier Verniy in the warehouse complex PNK KAD
Such large deals allow developer to resume construction in the regions However between Q4 2012 and Q3 2013 it was only 4 deals amounted more than 25000 sq m made Most of the deals in the region are for warehouse space up to 10000 sq m
ТЕНДЕНЦИИ С начала прошлого года на рынок складской недвижимости остается стабильным Ежегодный спрос в Московском регионе составляет около 1 млн кв м в год Средние ставки аренды в классе А составляют $135 за кв м в год без НДС операцион-ных расходов и коммунальных платежей доля вакантных площадей сохраняется на уровне 1 Строительство большин-ства новых складских объектов будет начинаться только после заключения предварительных договоров аренды и продажи
Изменение ситуации в ближайшей перспективе ожидать не стоит В условиях низкого роста экономики страны начинать спекулятивное строительство большой риск повторения ситуации 2008 года поэтому предложение будет подстраивать-ся под спрос
На региональных рынках продолжится тенденция увеличения дефицита готовых к въезду складских площадей Не смотря на высокой спрос на складские объекты в регионах девелоперам не удается сформировать достаточных портфель предваритель-ных договоров аренды для начала строительства Исключение составляет Санкт-Петербург Свердловская область юг России где спрос или условия рынка обеспечили девелоперам формирование такого портфеля Мы прогнозируем что до конца года в регионах будет реализовано более 300 тыс кв м складских площадей
Source Cushman amp Wakefield
STRUCTURE OF DEMAND REGIONS СТРУКТУРА СПРОСА РЕГИОНЫ
TRENDS Since the beginning of the last year the warehouse market has remained stable Annual demand in the Moscow region is about one mn sq m per year average rental rates for Class A is $135 per sq m per year excluding VAT operating expenses and utility costs the vacancy rate remains at 1 Construction of the majority of new storage facilities will start only after the preliminary lease or sale contract signing up
In the nearest future the situation would remain the same It is the huge risk to start the new speculative construction in a low-growth economic situation as it is the threaten to repeat the 2008 year crisis the supply will adapt to the demand
The trend of growing deficit of ready-to-move warehouse spaces continues at the regional markets In spite of the high demand for storage facilities in the regions for developers it is still complicated to form a sufficient portfolio of preliminary agreements for the start of construction Exceptions are St Petersburg Sverdlovsk region and south Russia where the demand or market conditions provided developers with the opportunity to form such a portfolio We predict that by the end of the year in the regions will be sold over 300000 sq m of warehouse space
WampI MARKET IN RUSSIA ETHUcircIacuteIcircEcirc NtildeEcircEumlAgraveAumlNtildeEcircEgraveOtilde IumlIcircIgraveAringUgraveAringIacuteEgraveEacute Acirc ETHIcircNtildeNtildeEgraveEgrave
VACANCY RATE (EOY) Paris (Ile de France) 89 81 99 126 102 84 81 89 804
Budapest 59 172 173 188 195 208 194 217 2283
Warsaw 89 74 112 171 194 173 146 1621 1592
Madrid 55 38 37 55 73 84 93 95 972
TAKE UP 000 SQ MParis (Ile de France) 1 005 700 640 601 814 837 563 208 58
Budapest 152 229 308 280 210 327 355 31 21
Warsaw 260 445 556 216 451 743 483 183 112
Madrid 1 225 918 630 325 390 270 225 60 47
2013
36
MARKETBEAT Q3 2013
RESEARCH DEPARTMENT IcircOgraveAumlAringEuml EgraveNtildeNtildeEumlAringAumlIcircAcircAgraveIacuteEgraveEacute
Further information and copies of this report are available from Ellina Krylova
EllinaKrylovaeurcushwakecom
The information provided in this report is intended for informational purposes only and should not be relied on by any party without further independent verification Classifications of individual buildings are reviewed on a continuing basis and are subject to change The standards used in this process are consistent with those used by Moscow Research Forum and in the United States by the Society of Industrial and Office Realtors (SIOR) and BOMA International Reproduction of this report in whole or part is permitted only with written consent of Cushman amp Wakefield Data from this report may be cited with proper acknowledgment given
copy 2013 Cushman amp Wakefield All rights reserved
MORE INFORMATION AND CONTACTS ARE AVAILABLE ON WWWMARKETBEATRU EgraveIacuteOcircIcircETHIgraveAgraveOumlEgraveszlig IcircAacute IcircOgraveAumlAringEumlAring EgraveNtildeNtildeEumlAringAumlIcircAcircAgraveIacuteEgraveEacute Egrave IumlOacuteAacuteEumlEgraveEcircAgraveOumlEgraveEgrave AumlIcircNtildeOgraveOacuteIumlIacuteUcirc IacuteAgrave WWWMARKETBEATRU
DENIS SOKOLOV PARTNER RESEARCH DIRECTOR DenisSokoloveurcushwakecom
LADA BELAYCHUK ASSOCIATE DIRECTOR DEPUTY RESEARCH DIRECTOR LadaBelaychukeurcushwakecom
MAXIM ILYIN CONSULTANT CAPITAL MARKETS Maximilyineurcushwakecom
ALEXANDER KUNTSEVICH ANALYST WampI PROJECT MANAGEMENT AlexanerKuntsevicheurcushwakecom
TATYANA DIVINA SENIOR ANALYST
TatyanaDivinaeurcushwakecom
wwwcushmanwakefieldcom
Q3 2013 MoscowRUSSIA A Cushman amp Wakefield Research Publication
MACRO REVIEIW
GDP MAIN DRIVERS IN 2013 ОСНОВНЫЕ ДРАЙВЕРЫ ЭКОНОМИКИ РОССИИ В 2013 Г
GDP F2013 AcircAcircIuml IumlETHIcircAtildeIacuteIcircCcedil 2013 18 YoY
EcircETHAgraveOgraveEcircEgraveEacute IcircAacuteCcedilIcircETH В III квартале 2013 года основные драйверы роста экономики претерпели незначительные изменения по сравнению с преды-дущим кварталом
Так рост индекса промышленного производства с начала 2013 года продолжает замедляться Сократились объемы машино-строения выпуска транспортных средств производства металлов
Рост в сферах строительства услуг транспорта и связи также существенно замедлился
Темпы роста добычи полезных ископаемых увеличиваются в то время как обрабатывающий сектор показывает отрицательные результаты mdash снижение на 17 Рост производства сельскохо-зяйственной продукции объясняется завершением сезона
Инвестиционная активность и темпы роста показателей в сфере розничной торговли по сравнению с тем же периодом прошло-го года значительно снизились
Причины резкого снижения основных экономических показате-лей связывают с кризисом в ряде Европейских государств
Source Ministry for Economic Development
Source Ministry for Economic Development
SUMMARY Main economy drivers in Q3 2013 were slightly changed comparing to the previous quarter
The industrial production index is decreasing from the beginning of 2013 and still slowing down The volumes of engineering industry transport manufacture and metal production were reduced in this quarter
The increase in construction services transport and communica-tions is also slowed down since last quarter
The growth rate of mining and extraction is growing but at the same time the processing is falling down in this quarter on 17 The growth in agriculture sector is connected with season closure
Investment activity and the growth rate of retail sales are considerably decreased comparing with the same period of the last year
Expert expectations of the future are varied but they match in the fact that every economy driver in Russia at present are on the edge of their growth
BUDGET DEFICITSURPLUS IN SELECTED COUNTRIES ДЕФИЦИТПРОФИЦИТ БЮДЖЕТА В СТРАНАХ МИРА
MINISTRY FOR ECONOMIC DEVELOPMENT URALSIB CAPITAL RENAISSANCE CAPITALROSSTATS ACTUAL
который негативно повлиял на спрос на основные экспортируе-мые в Европу товары нефть и газ Снижение темпов промыш-ленного производства объясняют дефицитом инвестиций в производственные мощности и общему оттоку инвестиционно-го капитала из страны вызванного неблагоприятным деловым климатом
В III квартале 2013 года Министерство экономического развития понизило свой прогноз роста ВВП в 2013 году с 24 до 18 Аналитики Renaissance Capital также пересмотрели прогноз роста ВВП на 2013 год в сторону уменьшения до 22
Однако несмотря на снижение темпов роста экономики России в III квартале в IV квартале 2013 года и в начале 2014 года аналитики прогнозируют ускорение темпов роста в 2014 году они могут достигнуть от 26 до 3 Прогнозируется увеличение объемов промышленного производства и увеличе-ние объемов экспорта но только в том случае если до конца 2014 года цены на нефть останутся на стабильном уровне
In Q3 2013 Ministry of Economic Development dramatically reduced their forecasted GDP growth rate for the 2013 from 24 to 18 Renaissance Capital analytics are also changed their GDP growth forecast for 2013 to 22
The reasons of the main economy drivers are slowing is connected with crisis in Europe countries which affected the demand on main export goods crude oil and gas The slowing down of industrial production is caused by low-level investments in production facilities and investment outflow outside the country caused by unfavorable business climate
However despite of economy is slowing down in Q3 in Q4 and in the beginning of 2014 analytics forecast the acceleration of economy growth in Russia In 2014 the growth rate can reach 26-3 The forecasted increase in industrial production and in volume of export can happened in case that the oil prices will stay stable till the end of 2014
GDP AND YOY CPI IN 2013 ВВП И ИНФЛЯЦИЯ 2013 Г
Source Ministry for Economic Development
Source Ministry for Economic Development Rosstat Uralsib Capital Renaissance Capital
Q3 2013 MoscowRUSSIA A Cushman amp Wakefield Research Publication
CAPITAL MARKETS
Source Cushman amp Wakefield
TOTAL INVESTMENTS BY SECTOR ИНВЕСТИЦИИ ПО СЕКТОРАМ
EcircETHAgraveOgraveEcircEgraveEacute IcircAacuteCcedilIcircETH Объем инвестиций в коммерческую недвижимость в III квартале остался практически без изменений по сравнению с II кварталом 2013 года и составил 113 млрд долларов США
Москва сохраняет первенство по размеру инвестиций в коммер-ческую недвижимость и продолжает оставаться основным инвестиционным центром России В Москву привлекается более 80-90 от всех инвестиций в коммерческую недвижимость
На втором месте по объему инвестиций в коммерческую недвижимость находится Санкт-Петербург где в III квартале 2013 года инвестировано около 50 млн долларов США
Наш прогноз общего объема инвестиций в качественную коммерческую недвижимость за 2013 г остается неизменным и может составить 79 млрд долларов США В следующем 2014 году рынок ожидает незначительная стагнация и объем инвестиций будет находиться на уровне около 75 млрд долларов США
Source Cushman amp Wakefield
TOTAL INVESTMENTS | IcircAacuteUacuteAringIgrave EgraveIacuteAcircAringNtildeOgraveEgraveOumlEgraveEacute YTD 2013 US$ 575 bn
PRIME CAPITALIZATION RATES | NtildeOgraveAgraveAcircEcircEgrave EcircAgraveIumlEgraveOgraveAgraveEumlEgraveCcedilAgraveOumlEgraveEgrave Acirc IumlETHAgraveEacuteIgrave NtildeAringAtildeIgraveAringIacuteOgraveAring
INVESTMENTS YOY CHANGE AND SHARE OF OFFICE AND RETAIL SEGMENTS ИЗМЕНЕНИЯ ОБЪЕМА ИНВЕСТИЦИЙ И ДОЛИ ОФИСНОГО И ТОРГОВОГО СЕГМЕНТОВ
SUMMARY The total volume of commercial real estate investments in Q3 2013 was on the same level with previous one and amounted to $113 billion
Moscow takes the primary role according to the volume of investments in the commercial real estate industry and remains the major investment center in Russia The capital of Russia attracted more than 80-90 of total investments in the commercial real estate
The second place is for St Petersburg talking about the volume of total investments in Russian commercial real estate Nearly $50 million of dollars were attracted in Q3 2013
Our forecast of the total investment volume of quality real estate in Russia for 2013 stays unchanged and can reach the volume of $79 billion Next year we expect insignificant stagnation and the total volume of investments is going to be at the level of $75 billion
0
1 000
2 000
3 000
4 000
5 000
6 000
7 000
8 000
9 000
2006 2007 2008 2009 2010 2011 2012 F2013 F2014
mn
USD
Office Retail Industrial Other Forecast
4560
53545798
2256
3994
7547 74377900
5750
7500
0
20
40
60
80
100
0
1 000
2 000
3 000
4 000
2007
Q1
2007
Q2
2007
Q3
2007
Q4
2008
Q1
2008
Q2
2008
Q3
2008
Q4
2009
Q1
2009
Q2
2009
Q3
2009
Q4
2010
Q1
2010
Q2
2010
Q3
2010
Q4
2011
Q1
2011
Q2
2011
Q3
2011
Q4
2012
Q1
2012
Q2
2012
Q3
2012
Q4
2013
Q1
2013
Q2
2013
Q3
US
$ m
n
Total investments Office of total Retail of total
KEY EXPECTATIONS
STABILITY
8
MARKETBEAT Q3 2013
IcircNtildeIacuteIcircAcircIacuteUcircAring IumlIcircEumlIcircAEligAringIacuteEgraveszlig В регионах доля качественных проектов коммерческой недви-жимости в настоящее время крайне мала инвесторы в большей степени заинтересованы в laquoгородах-миллионникахraquo где рынок коммерческой недвижимости наиболее развит
В III квартале 2013 г основной объем инвестиций пришелся на офисную недвижимость Объем инвестиций в этом сегменте составил 8443 млн долларов США Среди крупных сделок можно отметить продажу офисного комплекса White Gardens Сумма сделки является одной и самых крупных на рынке за последнее время на рынке офисной недвижимости и составила около 740 млн долларов США
Объем инвестиционных сделок на рынке торговой недвижимо-сти в III квартале 2013 г составил 250 млн долларов США Од-нако если все запланированные сделки будут завершены то 2013 год станет рекордным по объему инвестиций в торговую недвижимость
Традиционно на складскую и индустриальную недвижимость приходится меньше всего совершенных инвестиционных сде-лок Так в прошедшем квартале на долю складской и индустри-альной недвижимости пришлось инвестиций на сумму около 332 млн долларов США
Совокупный объем инвестиций в коммерческую недвижимость за три квартала 2013 г составил 575 млрд долларов США По сравнению с наиболее развитыми рынками Лондона и Парижа объем инвестиций в Москве ниже на 70 чем за тот же период в Лондоне и на 20 ниже чем в Париже
NtildeOgraveAgraveAcircEcircEgrave EcircAgraveIumlEgraveOgraveAgraveEumlEgraveCcedilAgraveOumlEgraveEgrave Ставка капитализации на Прайм объекты в Москве составляют 85 для офисов 90 для торговых центров и 110 для склад-ской недвижимости Это выше среднеевропейского уровня на 250 базисных пунктов и на 450 бп выше наиболее развитых европейских рынков ndash Лондона и Парижа
TOP 30 INVESTMENT MARKETS ТОП-30 ИНВЕСТИЦИОННЫХ РЫНКОВ
MOSCOW PRIME CAPITALIZATION RATES СТАВКИ КАПИТАЛИЗАЦИИ laquoПРАЙМraquo В МОСКВЕ
Source Cushman amp Wakefield
MAIN DEVELOPMENTS In regions the share of quality real estate projects is small and investors are much more interested in economically developed cities with population of over a million where the real estate market is more matured
In the third quarter of 2013 the majority of investments came to the office segment with the volume of $8443 million Among the biggest deals in the market it worth mentioning White Gardens business centre realization (the amount of transaction is one of the largest in the office market for recent years and equals to $740 million
Retail was the less attractive sector for investors in Q3 and the volume of investments amounted to $250 million However if all planned deals are completed by the end of the year then 2013 will be the record-breaking year regarding the investment volume
Traditionally investments in warehouse and industrial real estate sectors are less popular in Russia and the number of completed deals is rather small here Thus the investments in warehouse and industrial sectors totaled about $332 million for the latest quarter
The total volume of investments in Q1-Q3 2013 reached the number of $575 billion Comparing the most developed markets of London and Paris the level of investments in Moscow is 70 lower than London and 20 lower than Paris for the same period of time
CAPITALISATION RATES The current yields for prime real estate projects in Moscow are 85 for offices 90 for retail and 110 for warehouse and industrial projects This rate is higher than average yields in Europe on 250 bps and on 450 bps higher of most developed investment markets of London and Paris
1 NYC Metro 1922 Tokyo 1543 London Metro 1404 LA Metro 1195 DC Metro 1086 SF Metro 827 Hong Kong 718 Paris 609 Singapore 4710 Sydney 4611 Dallas 4512 Atlanta 4413 Houston 4314 Toronto 4215 Boston 4016 Moscow 3917 Chicago 3918 Osaka 3319 Seoul 3220 So Fla 3221 Seattle 3122 Berlin-Brandenburg 3123 Stockholm 2824 Rhine-Ruhr 2825 Shanghai 2526 FrankfurtRhine-Main 2527 Melbourne 2528 Munich 2429 Phoenix 2430 Brisbane 24
6
8
10
12
14
16
18
2004
2005
2006
2007
2008
2009
2010
2011
2012
Q1
13
Q2
13
Q3
13
CBR refinancing rate Office primeShopping center prime WampI Prime
9
MARKETBEAT Q3 2013
INTERACTIVE CHARTS I EgraveIacuteOgraveAringETHAgraveEcircOgraveEgraveAcircIacuteUcircAring AtildeETHAgraveOcircEgraveEcircEgrave
RUSSIAN PROPERTY INVESTMENT MARKET I EgraveIacuteAcircAringNtildeOgraveEgraveOumlEgraveEgrave Acirc EcircIcircIgraveIgraveAringETHtimesAringNtildeEcircOacuteTHORN IacuteAringAumlAcircEgraveAEligEgraveIgraveIcircNtildeOgraveUuml ETHIcircNtildeNtildeEgraveEgrave
Q3 2013 MoscowRUSSIA A Cushman amp Wakefield Research Publication
RETAIL
Source Rosstat
RETAIL TRADE TURNOVER AND REAL DISPOSABLE INCOME RUSSIA YOY РОЗНИЧНЫЙ ТОВАРООБОРОТ И РЕАЛЬНЫЕ РАСПОЛАГАЕМЫЕ ДОХОДЫ РОССИЯ
EcircETHAgraveOgraveEcircEgraveEacute IcircAacuteCcedilIcircETH В целом по России объемы нового строительства торговых площадей так же высоки как и в прошлом 2012 г В течение трех кварталов 2013 г в 22 российских городах появились новые торговые комплексы Некоторое снижение темпов строительства в Москве в 2012-2013 гг будет компенсировано ожидаемыми масштабными открытиями в 2014 г Посещае-мость торговых центров в Москве находится на высоком уровне потребительские ожидания стабильны В связи с дефицитом предложения в торговых центрах Москвы ритейлеры активно изучают российские регионы В 2013 г как и в течение 2012 г ставки аренды были стабильны
CONSUMER CONFIDENCE INDEX ИНДЕКС ПОТРЕБИТЕЛЬСКОГО ОЖИДАНИЯ
IumlIcircOgraveETHAringAacuteEgraveOgraveAringEumlEgrave Реальные располагаемые денежные доходы населения России (доходы за вычетом обязательных платежей скорректирован-ные на индекс потребительских цен) по оценке Росстата в августе 2013 г выросли на 21 по сравнению с августом 2012 г в январе-августе 2013 г выросли на 41 в сравнении с аналогичным периодом прошлого года Среднемесячная зарплата в России в августе 2013 г составила 29 020 рублей и выросла на 128 по сравнению с августом 2012 года
BRIEF SUMMARY In general the volume of new construction of retail spaces in Russia can be described as high as it used to be in the past 2012 New retail complexes have been constructed and delivered for the past 3 quarters of 2013 in 22 Russian cities There is a reduction in the сconstruction of new quality retail premises in Moscow for 2012-2013 which is going to be compensated by large-scale and expected projects in 2014 Attendance of Moscow shopping centers is at the high level consumer expectations are stable Due to the shortage of supply in the shopping malls retailers actively seek for new spaces in Russian regions During the 2013 rental rents remains stable as it was in 2012
CONSUMERS According to Rosstat real income of the Russian population grew up by 21 comparing to August 2012 Moreover it increased by 41 in January-August 2013 relatively to the same period of time last year The average monthly salary was 29020 rubles in August 2013 and increased by 128 comparing to the past year
Total retail trade growth for January-May was 38
Source Rosstat
VACANCY RATE ДОЛЯ СВОБОДНЫХ ПЛОЩАДЕЙ (Prime shopping centers Moscow) | (действующие прайм ТЦ Москва) 12
PRIME RENTAL RATE INDICATOR | ПРАЙМ ИНДИКАТОР АРЕНДНЫХ СТАВОК (Prime shopping center retail gallery Moscow) | (галереи в прайм ТЦ Москва) US$ 3800
1642 mn sq m 572 quality projects
TOTAL QUALITY STOCK IN RUSSIA ОБЩЕЕ КОЛИЧЕСТВО КАЧЕСТВЕННЫХ ТОРГОВЫХ ПЛОЩАДЕЙ В РОССИИ
KEY EXPECTATIONS
STABILITY
-10
-5
0
5
10
15
20
2007 2008 2009 2010 2011 2012 F2013 F2014
Retail trade turnover growth Real personal disposable income growth
RETAILERS Retailer demand has remained relatively strong in Russia with limited new market entrants but existing retailers looking to expand and experiment with new format types Vacancy rates in prime shopping centres in Moscow are at extremely low levels with occupiers now transferring interest to the high street as shopping centre space cannot meet the demand
Those brands already present in Russia are actively looking to expand into the regions
NEWCOMER BRANDS WITH DEVELOPMENT PLANS IN RUSSIA НОВЫЕ ПЛАНЫ РАЗВИТИЯ РИТЕЙЛЕРОВ В РОССИИ
Source official websites and other media
REGION CITY NEWCOMERS 2013 COMING SOONSouthern Volgograd Leroy Merlin
Armavir LentaSochi Bata Louis Vuitton StarbucksTaganrog LentaKrasnodar Barker Bata StarbucksRostov-on-Don Starbucks
ETHEgraveOgraveAringEacuteEumlAringETHUcirc Спрос на качественные торговые помещения со стороны ритейлеров высокий Ритейлеры продолжают экспериментиро-вать с новыми форматами В связи с дефицитом предложения в торговых центрах Москвы ритейлеры обращают все больше внимания на торговые улицы
Продолжается активная экспансия во все регионы России
GLOBAL RETAILERS COMING TO RUSSIA НОВЫЕ МЕЖДУНАРОДНЫЕ РИТЕЙЛЕРЫ ПЛАНИРУЮЩИЕ НАЧАТЬ РАБОТУ В РОСИИ
NEW GLOBAL RETAILERS IN 2013 НОВЫЕ МЕЖДУНАРОДНЫЕ РИТЕЙЛЕРЫ В РОССИИ 2013
CushmanampWakefield Research quarterly monitoring of 9 quality shopping centers (total GLA - 05 mn sq m) These shopping centers have been opened more than one year ago and have a clear catchment area
OgraveIcircETHAtildeIcircAcircUcircAring IumlIcircIgraveAringUgraveAringIacuteEgraveszlig В III квартале посещаемость торговых центров в Москве находилась на более высоком уровне чем в предыдущие годы в этот период Доля покупателей (количество людей совершив-ших покупки относительно общего количества посетителей) снизилась до 308
Уровень свободных помещений в качественных торговых центрах находится на предельно низком уровне Небольшой рост в III квартале 2013 года (на 08 пп) связан с ротацией арендаторов в одном из торговых центров (один из этажей торгового центра в ближайшее время будет полностью занят крупным арендатором которые в настоящее время проводит ремонт помещения)
В целом в Москве продолжает наблюдаться дефицит предложе-ния в качественных торговых центрах
ДОЛЯ laquoУСПЕШНЫХ ПОКУПАТЕЛЕЙraquo ldquoSUCCESSFUL SHOPPERSrdquo
FOOTFALL ПОСЕЩАЕМОСТЬ ТОРГОВЫХ ЦЕНТРОВ
Source Cushman amp Wakefield
Source Cushman amp Wakefield
Source Cushman amp Wakefield
CushmanampWakefield Research quarterly monitoring of 9 quality shopping centers (total GLA - 05 mn sq m) These shopping centers have been opened more than one year ago and have a clear public contact area Number of successful shoppers remained stable (share of shoppers who make purchases out of all visitors of the monitored shopping centers)
The total number of retail outlets in the observed sample is 865 (brands in shopping galleries without operators of restaurant zones and without service companies like dry cleaning banks etc) These retail outlets are filled with 552 unique brands
VACANCY RATE УРОВЕНЬ СВОБОДНЫХ ПОМЕЩЕНИЙ
Petrovsky Passage
RETAIL SPACE
In Q3 the visiting rate of the retail centers was at the higher level than it used to be in the last year Buyers share (amount of people who made a purchase compared to total number of visitors) decreased with the number of 308 The level of vacant spaces in the quality retail centers is at the lowest level The small increase in the third quarter (08 points) is associated with the rotation of tenants in one of the shopping centers (one of retail centerrsquos floors is going to be fully occupied by the leaseholder who is currently conducting repair facilities)
In general there is a lack of supply in the quality retail centers in Moscow
Announced developers plans CW Forecast New construction YTD
НОВОЕ СТРОИТЕЛЬСТВО В III квартале в России было введено в эксплуатацию 15 новых торговых центров общей торговой площадью 292 750 кв м География нового строительства ndash от Иркутска и Ангарска до Сочи В основном стоятся торговые центры (75 всех новых качественных торговых площадей) также торговые площади открываются в многофункциональных комплексах Средний размер новых торговых центров уменьшается в 2013 году он составляет 26 тыс кв м что на 30 меньше чем в 2011 году
В III квартале крупнейшим открытым торговым объектом стал торгово-развлекательный центр Жемчужная Плаза (GLA 48 тыс кв м) в Санкт-Петербурге построенный в рамках комплексной застройки микрорайона Балтийская Жемчужина
В III квартале в Москве был открыт один новый торгово-развлекательный центр Райкин Плаза Также были открыты но-вые фазы комплекса Отрада В Москве новые качественные торговые площади строятся в разных форматах ndash торгово-развлекательные центры (Рио Райкин плаза) аутлет-центры (Внуково и Fashion House) многофункциональные комплексы (Белая Площадь Эволюция) До конца 2013 г в Московском регионе (г Павловский Посад) планируется открытие ритейл парка Белла Вита (GLA 36 тыс кв м)
NEW CONSTRUCTION 2013 RUSSIAQUALITY RETAIL STORES НОВОЕ СТРОИТЕЛЬСТВО В 2013 ГОДУ РОССИЯ КАЧЕСТВЕННЫЕ ТОРГОВЫЕ ОБЪЕКТЫ
Source Cushman amp Wakefield
QUALITY RETAIL CONSTRUCTION rsquo000 SQ M RUSSIA СТРОИТЕЛЬСТВО КАЧЕСТВЕННЫХ ТОРГОВЫХ ПЛОЩАДЕЙ ТЫС КВ М РОССИЯ
NEW CONSTRUCTION In Q3 15 new retail centers were delivered in Russia with a total area of 292750 sq m The geography of new construction is located from Irkutsk and Angarsk to Sochi The majority of new premises are located in shopping centers (75 of new quality retail space) besides retail space in multifunctional complexes Average area of newly constructed shopping centers is decreasing in 2013 it was about 26000 sq m which is 30 lower than in was in 2011
In the third quarter retail and entertainment center Pearl Plaza (GLA 48000 sq m) was awarded the name of the largest retail project in St Petersburg It was built as a part of the complex development in the Baltic Pearl micro region
Besides the new shopping and entertainment mall Raykin Plaza was delivered in the Q3 Also new phases of the Otrada complex were delivered New quality retail spaces are developed in various formats in Moscow ndash shopping and entertainment centers (Rio Raykin Plaza) outlet-centers (Vnukovo and Fashion House) multifunctional complexes (White Square Evolution) Till the end of 2013 it is planned to open retail park Bella Vita (GLA 36000 sq m) in the Moscow region (Pavlovskiy Posad city)
Standard lease terms for gallery tenants are between 3-5 years break options are rare For anchor tenants (including fashion anchors) lease terms are up to 20 -25 years and break options are becoming popular
Rents are typically payable monthly in advance Turnover percentage rents are increasingly seen in shopping centres Rental rates are generally calculated in USD Euricirc or commercial units are used In less quality shopping centres rental rates are calculated in RUR
Annual indexation is typical between 3-10 or at a level of USD EU CPI The practice of premium key money payments is seldom seen in Russia Rent reviews are rare on the market
Service ChargesIcirciumlaringethagraveoumlegraveicirciacuteiacuteucircaring iumleumlagraveogravearingaeligegrave
Service charge is payable by tenants at either an ldquoopen bookrdquo basis or more common as a fixed cost Utilities payments are charged on consumption Building insurance is normally charged back to tenant via service charge
Local property taxes are not payed separately they are generally included in the service charges Iacuteagraveeumlicircatilde iacuteagrave iacutearingaumlacircegraveaeligegraveigraveicircntildeograveuuml icircaacuteucircdivideiacuteicirc acirceumlthorndivideagravearingograventildeyuml acirc icirciumlaringethagraveoumlegraveicirciacuteiacuteucircaring iumleumlagraveogravearingaeligegrave
Other costsAumlethoacuteatildeegravearing iumleumlagraveogravearingaeligegrave
EcircIcircIgraveIgraveAringETHtimesAringNtildeEcircEgraveAring OacuteNtildeEumlIcircAcircEgraveszlig Acirc OgraveIcircETHAtildeIcircAcircUcircOtilde OumlAringIacuteOgraveETHAgraveOtilde Ставки аренды для помещений в торговых галереях качествен-ных торговых центров в Москве находятся в диапазоне от 500 до 4 000 долларов США (за кв м в год без НДС и других платежей) В течение трех кварталов 2013 и всего прошедшего 2012 года ставки аренды в торговых центрах были стабильны Прайм ритейл индикатор в Москве составляет 3 800 долларов США (за кв м в год без НДС и других платежей) Однако в 2013 году наметилась тенденция к повышению ставок аренды в лучших торговых центрах поэтому рост ставок на лучшие помещения может быть выше 5 (текущий консервативный прогноз)
Вне Москвы ставки аренды в торговых центрах в среднем на 30-60 ниже в зависимости от региона
Дополнительно к ставке аренды ритейлеры платят сервисные сборы за обслуживание (150-250 долларов США за кв м в год для помещений размером менее 500 кв м) за маркетинг (10-25 долларов США за кв м в год) также иногда бывают и другие дополнительные платежи
Source Cushman amp Wakefield
Source Cushman amp Wakefield
PRIME RETAIL INDICATOR MOSCOW ПРАЙМ РИТЕЙЛ ИНДИКАТОР В ТОРГОВЫХ ЦЕНТРАХ МОСКВА
Prime retail indicatormdashbase asking rental rate for the 100-200 sq m gallery unit at the ground floor of the prime shopping centers US$ per sq m per annum triple net
INDICATIVE RENTAL RATES IN QUALITY SHOPPING CENTER RETAIL GALLERIES MOSCOW СРЕДНИЕ АРЕНДНЫЕ СТАВКИ В ГАЛЕРЕЕ КАЧЕСТВЕННЫХ ТОРГОВЫХ ЦЕНТРОВ МОСКВА
COMMERCIAL RATES IN SHOPPING MALLS Moscow retail gallery rental rates are in the range of US$ 500- 4000 (per sq m per year before VAT and other expenses) depending on the size of the retail unit and the type of retailer Throughout Q1-Q3 and the whole of 2012 rental rates were stable across all sub-sectors
Moscowrsquos prime retail indicator is US$ 3800 per sq m per annum as a base rate However a tendency towards rate increases was observed in 2013 and near future growth may be higher than 5 (our current conservative estimate)
In other cities rental rates in shopping malls are typically 30 to 60 below Moscow levels
Additionally among other payments there are operational expenses (US$ 150-250 per sq m annually for units smaller than 500 sq m) marketing (US$ 10-25 per sq m annually) and others depending on the project
QUALITY RETAIL LEASE STRUCTURE СТРУКТУРА ДОГОВОРОВ АРЕНДЫ В КАЧЕСТВЕННЫХ ТОРГОВЫХ ПОМЕЩЕНИЯХ
ANCHORS
lt100 100 - 300 300 - 1200 1200 - 3500 3500-7000
Food court $1800-$2000
Kiosks $5000-$8000
Restaurant $600-$1000 $700
Clothing $1 600 $1 200 $700 $400
Shoes $2 200 $1 700 $1 200 $800
White and Brown $500
Supermarket $500-$600
Hypermarket $250-$450
Cinema $250-$320
BUSINESSGLA SQ M
RETAIL GALLERY MINI ANCHORS
Source Cushman amp Wakefield
15
MARKETBEAT Q3 2013
ТОРГОВЫЕ УЛИЦЫ На центральных торговых улицах свободно (предлагается в аренду или готовится к открытию) около 5 имеющихся поме-щений Ставки аренды в торговых коридорах стабильны В по-следние несколько лет есть тенденция к увеличению сроков аренды если еще три года назад договоры были чаще всего краткосрочные (на 11 месяцев) то сейчас трехлетние договора аренды становятся все более распространенными
Анализ торговых помещений на наиболее проходимых торго-вых улицах в центре города показывает что самыми популяр-ными категориями арендаторов являются предприятия питания (кафе рестораны) и магазины одежды и обуви которые занима-ют 29 и 21 всех помещений на этих улицах соответственно Значимыми арендаторами являются компании предлагающие услуги (спа парикмахерские медицинские услуги предприятия связи салоны фотографии юридические услуги) ndash они занимают 10 всех торговых помещений на главных улицах центра горо-да По 5 всех площадей занимают отделения банков ювелир-ные салоны магазины косметики и аксессуаров
Source Cushman amp Wakefield
HIGH STREETS Nearly 5 of the existing premises are freely available (are offered for lease or being prepared for delivery) in the central high streets Rental rates in the trade corridors are stable There is a tendency for increasing lease terms in the last few years As an example three years ago contracts used to be short-term mostly (11 months) and now agreements for the 3 and 5 years period become more and more widespread
The analysis of the retail spaces on the most passable areas in the city centre shows that the most popular categories of tenants are catering (cafe restaurants) and clothing shops They occupy 29 and 21 of all premises respectively Significant tenants are those who offers the following services spa hairdressers medical services communications companies photography and legal services ndash all of them occupy 10 of retail premises on the main streets of the city banks jewelry stores cosmetic stores and accessories occupy 5
AVERAGE RENTAL RATES ON HIGH STREETS IN MOSCOW СРЕДНИЕ АРЕНДНЫЕ СТАВКИ В ТОРГОВЫХ КОРИДОРАХ МОСКВА
HIGH STREET TENANT MIX MOSCOW Q3 2013 | СТРУКТУРА АРЕНДАТОРОВ В ТОРГОВЫХ КОРИДОРАХ МОСКВА III КВ 2013
Food Restaurants Cafes Fashion and footwareServices Bank ExchangeAccessories Optics Watches JewelryCosmetics Pharmacy Perfumery Other
HIGH STREET RENTAL RATES MOSCOW АРЕНДНЫЕ СТАВКИ В ТОРГОВЫХ КОРИДОРАХ МОСКВА
Data of the following trade corridors was used to conduct the analysis Tverskaya Petrovka-Stoleshnikov-Kuznetsky Most Nikolskaya Pyatnytskaya Pokrovka-Maroseyka In total these trade corridors located 710 outlets
US$ per sq m per annum triple net Aumlicirceumleumlagraveethucirc NtildeOslashAgrave ccedilagrave ecircacircigrave acirc atildeicircauml aacuteagraveccedilicircacircagraveyuml ntildeograveagraveacircecircagrave agraveetharingiacuteaumlucirc
OgraveIcircETHAtildeIcircAcircUcircAring OacuteEumlEgraveOumlUcirc mdash IumlAringOslashAringOtildeIcircAumlIacuteUcircAring CcedilIcircIacuteUcirc Важнейшим событием для торговых улиц стала программа развития пешеходных зон в Москве активно поддерживаемая Правительством города На тех улицах где уже отменили движение транспорта (в первую очередь Большая Дмитровка) происходит смена потоков посетителей (от пассажиров к пешеходам) Пешеходные улицы имеют огромный потенциал с точки зрения торговли и уже сейчас ритейлеры проявляют большой интерес к пешеходным районам Расширение пешеходных районов значительно увечит предложение качественных торговых помещений на улицах в Москве
HIGH STREETS mdash PEDESTRIAN AREA The most important event for the high streets became the development of pedestrian zones in Moscow which is actively supported by the city government There is a change of visitor flows (from passengers to pedestrians) on those streets where the driving was cancelled (it concerns Bolshaya Dmitrovka street first of all) There is a huge potential for retail activity talking about pedestrian streets and retailers show great interest in developing of those areas The expansion of pedestrian zones will significantly increase the supply of the quality retail premises in Moscow
HIGH STREETS mdash PEDESTRIAN AREA ТОРГОВЫЕ УЛИЦЫ mdash ПЕШЕХОДНЫЕ ЗОНЫ
With vehicular traffic restriction | Oacuteeumlegraveoumlucirc atildeaumlaring icircatildeethagraveiacuteegravedividearingiacuteicirc aumlacircegraveaeligaringiacuteegravearing ograveethagraveiacutentildeiumlicircethograveagrave
Opened for vehicles | Oacuteeumlegraveoumlucirc atildeaumlaring icircograveecircethucircograveicirc aumlacircegraveaeligaringiacuteegravearing ograveethagraveiacutentildeiumlicircethograveagrave
Q3 2013 MoscowRUSSIA A Cushman amp Wakefield Research Publication
OFFICE MARKET
IcircAacuteCcedilIcircETH ETHUcircIacuteEcircAgrave В III квартале 2013 г рынок продолжает оставаться активным спрос и предложение сбалансированы ставки аренды стабильны
Тенденция ослабления рынка офисной недвижимости отмечен-ная впервые в предыдущем квартале подкрепляется новыми фактами
Продолжилось снижение общего объема заключаемых сделок аренды и покупки в III квартале общий объем заключенных сделок составил 385 836 кв м что на 20 ниже среднего уровня 2011-2012 гг
Даже небольшой рост объема вывода на рынок новых помеще-ний приводит к увеличению доли свободных помещений За счет одного крупного объекта (Башня Меркурий в Москва-Сити арендуемой площадью 87 547 кв м) объемы ввода в эксплуатацию офисных площадей класса А в III квартале увеличились вдвое относительно средних объемов строительст-ва последних трех лет В результате уровень свободных помещений в классе А в среднем по Москве увеличился на 35 пп а в районе Москва-Сити mdash на 156 пп
Средняя ставка аренды не изменяется в течение последних трех кварталов в то время как инфляции в России за январь-май 2013 превысила уровень 7
ABSORPTION AND NEW CONSTRUCTION CLASSES A AND B (MN SQ M)
OVERVIEW The third quarter of the year saw the office market remain healthy with steady levels of demand Rents held firm There is a tendency of weakening signs in the office market which was noted for the first time in the previous quarter Now it is supported by some new facts
Overall demand level has continued to decrease Q3 take-up is 385836 sq m which is 20 less than the average take-up level for 2011-2012
Even moderate growth of new office space affects the vacancy rate In Q3 the delivery of Mercury Tower in Moscow City submarket (87547 sq m of office rentable area) doubled the quarterly Class A new construction volume (compared to the average number during the last three years) As a result the level of vacant space has increased by 35 percentage points in the Moscow Class A sector Talking about Moscow City submarket the volume of vacant space has increased by 156 points
Rental rates remain unchanged the CPI is above 7 (January-May 2013 data)
Source Cushman amp Wakefield
TOTAL STOCK MOSCOW | ОБЩИЙ ОБЪЕМ ПРЕДЛОЖЕНИЯ В МОСКВЕ 1360 mn sq m
VACANCY RATE | ДОЛЯ СВОБОДНЫХ ПЛОЩАДЕЙ 128
US$ 860 AVERAGE RENTAL RATE CLASS A | СРЕДНЯЯ АРЕНДНАЯ СТАВКА КЛАСС А
Q1-Q3 DEMAND (TAKE-UP) | ОБЪЕМ СДЕЛОК АРЕНДЫ И ПРОДАЖИ В 1-III КВ 2013 1190138 sq m
Q1-Q3 2013 NEW CONSTRUCTION | НОВОЕ СТРОИТЕЛЬСТВО В 1-III КВ 2013 594009 sq m
SUPPLY By the end of Q3 2013 Moscow had 136 mn sq m of quality office space Nine new office buildings were completed with a rentable area of 244587 sq m in Q3 New construction volume remains moderate
Nearly 50 of new office space delivered in 2013 is located in the Moscow suburbs (outside TTR) while the demand is drawn towards the city center So the suburbs are in danger of oversupply during the last four quarters the vacancy rate in suburban submarkets has increased by 58 percentage points from 11 in Q3 2013 to 168 in Q3 2013
In the Central and Prime business areas (with the exception of Moscow City submarket) the vacancy rate is stable while in several central submarkets (such as Tagansky Frunzensky Novoslobodsky) the availability is decreasing
After the recent delivery of Mercury Tower with 87547 sq m of office rentable space Moscow City availability has doubled Hence the Moscow City vacancy rate grew by 156 percentage points up to 327
Altogether there are 154 mn sq m of available office premises in existing buildings and 35 mn sq m is under speculative construction
IumlETHAringAumlEumlIcircAEligAringIacuteEgraveAring По состоянию на конец III квартала 2013 года в Москве насчи-тывалось 136 млн кв м качественных офисов В III квартале было введено в эксплуатацию 9 офисных зданий общей арен-дуемой площадью 244 587 кв м Объемы нового строительства продолжают оставаться умеренными
Около 50 новых офисных площадей вышедших на рынок в 2013 году находятся в удаленных от центра города районах (за пределами ТТК) В то же время спрос продолжает тяготеть к центру города В результате на окраинах города наблюдается тенденция к росту избыточности предложения Так в течение 4-х последних кварталов уровень свободных помещений в рай-онах за пределам ТТК увеличился на 58 пп с 11 (III кв 2012) до 168 (III кв 2013) Внутри ТТК уровень свободных помеще-ний стабилен а в некоторых субрынках (Таганском Фрунзен-ском Новослободском) свободных помещений становится меньше Исключение составляет субрынок Москва-Сити где после ввода в эксплуатацию Башни Меркурий площадью 87 547 кв м объем свободных помещений удвоился что не-медленно привело к росту уровня свободных помещений на 156 пп до уровня 327
Всего в Москве предлагается в аренду или на продажу 154 млн кв м в существующих и 35 млн кв м в строящихся зданиях
Future supply mdash available space in buildings to be delivered in the next 12 month (under construction and under reconstruction) The data is given for the end of the period
Source Cushman amp Wakefield Source Cushman amp Wakefield Moscow Research Forum
DEMAND Overall 12 million sq m of quality office space was leased or bought during Q1-Q3 2013 For the second quarter in a row the total volume of take-up is decreasing In Q3 385836 sq m of quality office space has been transacted which is 20 below the average quarterly level of 2011-2012 Real estate budgets are limited and tenants tend to primarily consider their current location as a viable alternative to a new office
Tenants continue to be interested primarily in existing buildings the proportion of pre-lease agreements in Q1-Q3 was 63 of the total rented space (23 in Q3) In 2013 there is a significant reduction in the proportion of sales deals (from 20 on average in 2011-2012 to around 10 in 2013)
The number of large transactions (over 2000 sq m) continues decreasing The average transaction size has reduced again by 10 compared with the previous quarter and now stands at 528 sq m (taking into account only leasing deals)
NtildeIumlETHIcircNtilde Всего за три квартала 2013 года было арендовано и куплено 12 миллиона кв м качественных офисных помещений Вто-рой квартал подряд наблюдается снижение общего объема сделок В III квартале общий объем сделок составил 385 836 кв м что на 20 ниже среднего уровня 2011-2012 годов Бюджеты на недвижимость и переезды ограничены аренда-торы и арендодатели все чаще находят компромиссы приво-дящие к продлению текущих договоров аренды а не заклю-чению новых сделок в новых зданиях
Арендаторы продолжают интересоваться главным образом введенными в эксплуатацию зданиями ndash в 2013 году (1-III кв) доля договоров предварительной аренды составила менее 63 (в III кв ndash 23) от всех арендованных площадей Доля сделок продажи также продолжает оставаться низкой и со-ставляет не более 10 от всего объема офисных сделок
Продолжает снижаться количество крупных сделок (размером более 2 000 кв м) Средний размер транзакции снизился на 10 относительно предыдущего квартала и в III квартале составил 528 кв м учитывая только сделки аренды
NtildeOgraveAgraveAcircEcircEgrave AgraveETHAringIacuteAumlUcirc В классе А средняя запрашиваемая арендная ставка составляет 860 долларов США В классе Б средняя ставка аренды стабильна на уровне 520 долларов США Ставки аренды для Прайм офисов продолжают находиться на уровне 1 200 долларов США за кв м в год (без НДС и операционных расходов)
Source Cushman amp Wakefield
Source Cushman amp Wakefield
Q3 2013 AVERAGE BASE RENTAL RATES BY BUSINESS AREA СРЕДНИЕ БАЗОВЫЕ СТАВКИ АРЕНДЫ В III КВ 2013 Г ПО БИЗНЕС РАЙОНАМ
AVERAGE RENTAL RATES (US$) СРЕДНИЕ СТАВКИ АРЕНДЫ (ДОЛЛАРЫ США)
Downtown
Central
OTA
Moscow subareas
Moscow is divided into office submarkets areas with similar real estate indicators and dynamics Office submarkets are grouped in office subareas
The Downtown subarea is the territory inside the Garden Ring and the Belorussky business area
The Central subarea is the territory between the Garden ring and TTR (and the more distant SOK and KUT submarkets)
OTA includes the Moscow suburbs
RENTAL RATES In Class A the average asking rental rate is $860 In Class B the average asking rental rate was stable at $520 Rental rates for prime office space is at the level of $1200 per year per sq m (triple net)
IumlETHIcircAtildeIacuteIcircCcedil Несмотря на то что по заявлениям девелоперов более 400 тыс кв м площадей планируется к вводу во IV кв 2013 года мы ожидаем что до конца года будет введено в эксплуатацию дополнительно не более 150ndash200 тыс кв м новых офисов Таким образом в 2013 году сохранится баланс спроса и предло-жения в большинстве офисных субрынков
Высокие объемы строительства на окраинах города и в Москва-Сити не окажут существенного дестабилизирующего влияния на центральные районы До конца 2013 года а также в 2014 году в центральных районах ставки аренды будут стабильны возможен рост в соответствии в уровнем инфляции
LEASE TERMS IN QUALITY BUSINESS CENTERS УСЛОВИЯ АРЕНДЫ КАЧЕСТВЕННЫХ ОФИСНЫХ ПОМЕЩЕНИЙ
RUR USD or Euros (rarely used) per sqmyr For currency exchange landlords use either Central Bank of Russiarsquos official rate or set their own rate or fix the dollar corridor eg 25-40 RUBUSD
Российские рубли доллары США или евро (используется редко) за квм в год Используется обменный курс ЦБ России или используются условные единицы (уе) с фиксированным курсом в коридоре 25-40 рублей за уе
Payments Iumleumlagraveogravearingaeligegrave Quarterly in advance Ежеквартально авансом
Indexation Egraveiacuteaumlaringecircntildeagraveoumlegraveyuml 3-5 or at the level of USA EU CPI 10-15 for RUR agreements Sometimes step-rents are used
3-5 или US CPI 10-15 для рублевых договоров аренды Ингода используется ступенчатая индексация
Other payments Aumlethoacuteatildeegravearing iumleumlagraveogravearingaeligegrave
Operational expences
Операционные расходыThis sort of payments strongly depends on the service list included Average market payments 100-150 USDsqmyr for Class A 80-120 USDsqmyr for Class B
Платежи зависят от состава включенных услуг который может значительно отличаться 100-150 долларов США за квм в год для Класса A 80-120 долларов США за квм в год для Класса Б
VATНДС 18 18Source Cushman amp Wakefield
FORECAST Despite the announcements from developers that they will deliver more than 400000 sq m in Q4 2013 the new construction forecast continues to be rather conservative Just 150000-200000 sq m of new office space might be delivered by the end of this year Consequently in 2013 the supply-demand balance should remain stable
The high volume of office space under construction is the biggest threat at the moment Against the possible local oversupply in Moscow suburbs and Moscow-City submarkets in 2014 central and prime business areas should see a market balance both at the end of 2013 and during the whole 2014 For these areas rental rates are projected to grow in line with inflation
The table contains office buildings announce for delivery in 2013 with rentable area more than 15000 sq m Delivered buildings are included disregarding the size
TOTAL mdash Office rentable area or all office buildings announced for delivery in 2013 (including small buildings with office rentable less than 15000 sq m)
DOWNTOWNBlackampWhite Complex (bld White) ZAM B+ 13000 Q1Rosso Riva ZAM A 11947 Q1Park Tower BEL B+ 11850 Q1Chistoprudnyy bul 8 bld 1 CBD B- 4730 Q1White Gardens BEL A 63900 Q1Wall Street ZAM A 20493 Q2Vishnevy Sad CBD B+ 6736 Q2Domino ZAM A 6216 Q3Lukoil build-to-suit CBD B+ 35000 Q3CENTRALDubininskaya ul 33B SCH B+ 3000 Q1City Point BC CTY B+ 9951 Q1Sinitsa Plaza BAS B+ 13496 Q2Mercury City CTY A 87574 Q3Poluyaroslavskiy Bolshoy per 102 bld BAS B+ 2294 Q3Poklonnaya ul vl 3 KUT A 85572 Q4Park Pobedy KUT B+ 54000 Q4Nizhegorodsky Business Centre phase II BAS B- 37100 Q4Nizhegorodsky Business Centre phase I BAS B- 23000 Q4Arma 19 BAS B+ 19080 Q4Golden Gate BAS B+ 16000 Q4OTANewton Plaza SE B+ 52000 Q1Danilovskaya Manufaktura Sitsevyi Korpu SE B+ 3396 Q1iCube SW B+ 15256 Q1Obrucheva ul 52 bld3 SW B- 23300 Q1Lotte Business Centre SW B+ 38480 Q1Streamline NE B+ 11048 Q1Quadrum SUB B+ 24650 Q2Park Mira NE B+ 7000 Q2Format Complex II SUB B- 9122 Q2Dobrolyubova 6 bld 5 NE B- 4699 Q3Leninsky 119 SW A 15400 Q3Central Street NE B+ 6423 Q3Smart Park SW B+ 10260 Q39 akrov phase II SW B+ 62300 Q3Country Park Phase III SUB A 19120 Q3Riga Land bld 5 (bld A) (phase II) SUB B+ 40000 Q4Solutions BP bld 3 SW B+ 19500 Q4Avrora NE B- 21600 Q4Neo Geo SW B- 70000 Q4Novator office-hotel complex SUB B+ 24000 Q4Mebe One Khimki Plaza SUB A 26000 Q4
TOTAL 217236
TOTAL 421653
TOTAL 551253
Q3 2013 MoscowRUSSIA A Cushman amp Wakefield Research Publication
HOSPITALITY
ADR IN AUGUST 2013 | СРЕДНЯЯ ЦЕНА ЗА НОМЕР В АВГУСТЕ 2013 $152
QUALITY SUPPLY | ТЕКУЩИЙ ОБЪЕМ КАЧЕСТВЕННОГО ПРЕДЛОЖЕНИЯ 14200 rooms
OCCUPANCY | ЗАПОЛНЯЕМОСТЬ 77
RevPAR | СРЕДНИЙ ДОХОД НА НОМЕР $117
IumlETHAringAumlEumlIcircAEligAringIacuteEgraveAring По оценке департамента гостиничного бизнеса и туризма совокупный объем номерного фонда в Москве на конец III квартала 2013 г составил свыше 48 тыс номеров из них доля качественного предложения составила порядка 30 общего предложения или 142 тыс номеров
Новое предложение за III квартале 2013 г в сегменте качествен-ных гостиниц составило 1138 номеров и было сформировано за счет ввода в эксплуатацию 4-х гостиниц разной ценовой категории
В ноябре 2013 г ожидается открытие гостиниц под управлени-ем оператора Accor комплекс из трех отелей расположен по адресу ул Бахрушина вл 11 В состав комплекса войдут 3 гостиницы разной ценовой категории Mercure на 158 номеров (Upscale) Ibis на 190 номеров (Midscale) Adagio на 149 апартаментов (Midscale)
Это увеличит предложение на рынке качественных отелей минимум на 497 номеров Ожидаемое в 2013 г открытие гостиницы Marriott Novy Arbat (234 номера) перенесено на 1 квартал 2014 года
SUPPLY According to the Department of Hospitality and Tourism the cumulative number of rooms in the Moscow hotel market at the end of Q3 2013 is estimated at more than 48000 rooms with the proportion of high-quality supply at about 30 or 14200 rooms
The increase in high-quality segment by the end of Q3 2013 totaled 1138 rooms resulting from the commissioning of 4 hotels in different price categories
In addition Accor will open three new hotels in November Q4 2013 in the hotel complex located at ul Bakhrushina 11 The complex of hotels includes three brands Mercure with 158 rooms (Upscale) Ibis with 190 rooms (Midscale) and Adagio with 149 rooms (Midscale)
We believe that the total supply of international grade rooms will increase by 497 by the end of 2013 It was expected that more rooms would have been available but the opening of the Marriot Noviy Arbat (234 rooms) was postponed till the Q1 2014
QUALITY MOSCOW HOTEL MARKET STRUCTURE Q3 2013 YTD
NtildeOgraveETHOacuteEcircOgraveOacuteETHAgrave EcircAgravetimesAringNtildeOgraveAcircAringIacuteIacuteUcircOtilde AtildeIcircNtildeOgraveEgraveIacuteEgraveOuml IgraveIcircNtildeEcircAcircUcirc III EcircAcirc 2013
Средняя цена за номер (ADR) в августе 2013 г составила $152 что на 5 выше уровня августа 2012 г Положительная динамика обеспечена за счет гостиниц высокой ценовой категории максимальный рост средней цены за номер по отношению к результатам за аналогичный период 2012 г продемонстрировал рынок гостиниц класса Upscale 16 Среднеценовые объекты напротив работали с более демократичными группами спроса на рынке гостиниц класса Midscale было отмечено снижение показателя ADR на 7 по сравнению с августом 2012 г
Символическое падение ставок за номер на уровне 043 и 221 было отмечено также в сегментах Upper Midscale и Luxury соответственно что в целом характерно для августа ndash наиболее laquoтуристскогоraquo месяца в году
В отношении результатов 2013 г (по данным на август) рынок качественных гостиниц показал небольшое снижение показате-ля ADR (-11) по сравнению с прошлым годом что равносиль-но стабилизации в том числе с учетом ослабления рубля
Наиболее агрессивными с точки зрения ценовых ожиданий остаются гостиницы категории Luxury показывающие на фоне общих понижающих корректировок цены небольшой рост с $375 до $376 за номер
Московские гостиницы предлагают широкий разброс цен по сегментам наиболее дорогие ndash гостиницы категории Luxury где ADR в августе 2013 г составил $315 что на 10698 выше среднего показателя по рынку качественных гостиниц
Ценовой разрыв отелей категории Luxuгy со следующим за ним сегментом внушителен средняя цена за номер в гостиницах категории Upper Upscale уже только на 2875 превысила средний показатель по рынку и составила $197 Стоимость номера в гостиницах категории Upscale сравнима со средним по рынку значением и составляет $160
Цены за номер в гостиницах класса Upper Midscale и Midscale ниже среднерыночных на 30 и 48 соответственно и составляют $105 и $79 за номер (данные за август)
AVERAGE DAILY RATE US DOLLAR (ADR) AUGUST 2013 YTD
QUALITY HOTEL MARKET TRADING Average daily rate in August 2013 estimated to $152 which is 5 higher than in August 2012 This positive dynamic was ensured by high-quality hotels the highest ADR growth was recorded in the Upscale segment ndash Up 16 compared to the same period last year Midscale market in this period was oriented to more democratic groups of demand ADR declined by 7 comparing to August 2012
The fall in ADR at the level of 043 and 221 was also recorded in the Upper Midscale and Luxury segments respectively but that is typical for the August ndash the most tourist month of the year
The results of 2013 (August YtD) showed a symbolic decrease in ADR (-11) comparing to 2012 that can be interpreted as a stabili-zation taking into account the weakening of the Ruble
The most aggressive in terms of price expectations remain Luxury market segment showing slight increase from $375 to $376 per room comparison with the general lowering of prices
Moscow hotels offer a wide range of prices by segment the most expensive ndash Luxury with ADR in August about $315 it is 10698 higher than the average for the Moscow quality market
There is an impressive gap between Luxury hotel prices and prices for the Upper Upscale segment Average daily rate for Upper Upscale is about $197 and only 2875 higher than the average for the Moscow quality market
0
50
100
150
200
250
300
350
400
2010 2011 2012 2013
Luxury Upper Upscale
Upscale Upper Midscale
Midscale Moscow average
0
10
20
30
40
50
60
70
80
2010 2011 2012 2013
Luxury Upper UpscaleUpscale Upper MidscaleMidscale Moscow average
25
MARKETBEAT Q3 2013
NtildeIumlETHIcircNtilde
Средняя годовая загрузка качественных гостиниц Москвы в августе 2013 г составила 77 что на 11 выше данного показателя за аналогичный период прошлого года
Максимально высоким спросом в Москве пользуются гостиницы категории Upper Midscale и Midscale загрузка которых в августе фиксировалась на уровне 854 и 826 соответственно
Одной из особенностей рынка гостиниц Москвы в III кв 2013 г стала высокая загруженность качественных и центрально расположенных гостиниц в августе ndash традиционно низком из-за наступления laquoсезона отпусковraquo Нетипично высокая загрузка стала следствием увеличения туристских потоков в том числе за счет проведения Универсиады в Казани добавившей laquoтранзитныхraquo клиентов московским отелям
По итогам 2013 г по состоянию на август рынок качественных гостиниц показывает рост спроса по сравнению с прошлым годом практически по всем сегментам Рост спроса простимули-рован как ростом потока ночующих посетителей в Москву так и стагнацией цен на размещение последнее обстоятельство говорит о продолжающемся периоде неопределенности
OgraveAringIacuteAumlAringIacuteOumlEgraveEgrave
Среднее значение дохода на номер (RevPAR) за август 2013 г выросло на 171 и составило $117 против $100 в 2012 г В то же время по итогам 2013 г по состоянию на август динамика RevPAR по сегментам колебалась от 84 в Midscale до -46 в отелях категории Upper Midscale
Мы полагаем что тенденции к повышению среднерыночной доходности на номер (+12 YtD) за счет гибкой ценовой политики реагирующей на изменения спроса сохранится и в ближайшей перспективе В 2014 г гостиницы вышедшие на рынок в 2013 г окажут более выраженное воздействие на рыночную ситуацию за счет чего показатели RevPAR по сегменту Luxury и особенно Upper Midscale вряд ли существен-но превзойдут текущие показатели и будут колебаться от слабоотрицательных до слабоположительных значений в начале и конце года
DEMAND The average annual occupancy of quality hotels in Moscow in August 2013 was about 77 which is 11 higher than in the same period last year
Maximum high demand in Moscow hotels was in the Upper Midscale and Midscale category with occupancy in August at the level of 854 and 826 respectively
One of the features of the market of Moscow hotels in Q3 2013 was the high occupancy of quality hotels and especially the central located hotels ndash traditionally low in August because of the holiday season Unusually high occupancy was a result of increased tourist flows including through the Universiade in Kazan which added transit clients for Moscow hotels
In general up to August 2013 (YtD) the Moscow quality hotel market shows a growth in demand comparing to 2012 in almost all segments (reduced occupancy in Upper-Midscale segment by 03 pp can be seen as an insignificant adjustment) Demand growth is stimulated by the growing stream of domestic and international visitors staying overnight in Moscow and the stagnation of prices for accommodation the last point indicates the continuing period of uncertainty in the market
TRENDS IN REVENUE Average revenue per available room (RevRAR) in August 2013 increased by 171 to $117 versus $100 in August 2012
At the same time according to the results of August 2013 RevPAR dynamics by segment ranged from 84 in the Midscale segment to -46 in the Upper Midscale hotels We believe that the tendency to stimulate the RevRAR increase which the flexible price sensible of demand change will continue in the near future In 2014 the new hotels will have a more pronounced effect on the general market situation whereby RevPAR (especially for Luxury and Upper Midscale) unlikely to surpass itrsquos current estimations and will vary from slightly negative to low positive values at the beginning and end of the year
За III квартал 2013 года в эксплуатацию было введено более 235 тыс кв м качественных складских площадей
Ставки аренды остаются стабильными и составляют в среднем $135 за кв м в год в классе А без НДС операци-онных расходов и коммунальных платежей
Цена продажи составляет $1 200- $1 300 за кв м в типовых проектах класса А
Доля вакантных площадей в складах класса А за полугодие не изменилась и составляет 1
Объем арендованных и купленных складских площадей в III составил более 350 тыс кв м
Регионы
В большинстве регионов средние ставки аренды в классе А за прошедший квартал не изменились за исключением Новосибирска и Нижнего Новгорода где ставки выросли на 4-6
Объем арендованных и купленных складских площадей в III квартале составил более 85 тыс кв м
SUMMARY Moscow
In Q3 2013 more than 235000 sq m of quality warehouse space were put into operation
Rental rates remain stable at an average of $135 per sq m per year in A Class excluding VAT operating expenses and utility
The price of sale is $1200 - $1300 per sq m in typical projects of class A
The vacancy rate in Class A warehouses for the half of the year remains unchanged at 1
The volume of leased and purchased warehouse space in Q3 amounted to 350000 sq m
Regions
The average rental rates in Class A have not changed for the quarter in most regions except Novosibirsk and Nizhny Novgorod where rates have increased by 4-6
The volume of leased and purchased warehouse space in Q3 amounted to 85000 sq m
$132
$130
$140
$105
$110
$135
$135
$135
$80
$90
$100
$110
$120
$130
$140
$150
2006 2007 2008 2009 2010 2011 2012 2013F
KEY EXPECTATIONS
STABILITY
0
200
400
600
800
1000
1200
1400
1600
1800
2007 2008 2009 2010 2011 2012 2013F 2014F
27
MARKETBEAT Q3 2013
Source Cushman amp Wakefield
Source Cushman amp Wakefield
Source Cushman amp Wakefield
Source Cushman amp Wakefield
ОСНОВНЫЕ ТЕНДЕНЦИИ Объем нового строительства за 1-III кв 2013 года в Московском регионе составил 550 тыс кв м что соответствует аналогично-му показателю прошлого года Объем арендованных и куплен-ных площадей по итогам прошедших трех кварталов составил белее 830 тыс кв м что приблизительно соответствует показа-телю прошлого года
В регионах объем нового строительства в регионах за первые три квартала составил 239 тыс кв м что на треть меньше про-шлогоднего Арендовано куплено 250 тыс кв м что больше прошлогоднего показателя на 20
ПРЕДЛОЖЕНИЕ В Московском регионе в III квартале 2013 года предложение увеличилось на 235 тыс кв м
В минувшем квартале были построены
Логопарк Север (110 тыс кв м) девелопер Каравелла
Два новых корпуса в логистическом парке Климовск (48 тыс кв м) девелопер Raven Russia
Объем нового строительства соответствует показателям преды-дущего года но темпы строительства ниже заявленных девело-перами Основная проблема mdash задержки в строительстве Боль-ше всего это касается новых девелоперов длительное время работающие на рынке компании укладываются в заявленные сроки Поэтому до конца года будет построено до 1 млн кв м складских площадей
На рынке Москвы сохраняется дефицит готовых к въезду склад-ских площадей Все проекты сдаются или продаются на этапе строительства
Чистые средние ставки аренды в течении прошедшего квартала не изменились и составляют $135 за кв м при этом разброс ставок остается высоким
В 2014 году девелоперы обещают построить около 15 млн кв м складских площадей однако по нашем оценкам из-за задер-жек при строительстве построено будет на 30 меньше
KEY TRENDS The volume of new construction for Q1-Q3 2013 in the Moscow region amounted to 550000 sq m which corresponds to the same period of last year The volume of leased and purchased land based on the results of Q1-Q3 was more than 830000 sq m which approximately relative to the previous year figure
The volume of new construction in the regions for the first three quarters amounted to 239000 sq m which is a three times less than last year indicator 250000 sq m were leased and sold which is 20 more than last year figure
SUPPLY In Q3 2013 supply in Moscow region increased by 235000 sq m
In the last quarter were put into operation
bull Logistics Park North (110000 sq m) developer is Caravella
bull Two new phases in the logistics park Klimovsk (48000 sq m) developer is Raven Russia
The volume of new construction complies with the previous year but below the pace of construction announced by developers The main problem is the delays in construction mostly it concerns new developers Experienced companies meet the announced deadlines Therefore there will be built up to one million sq m of warehouse space until the end of the year
In Moscow there is a lack of ready-to-move storage space All projects are sold or bought during the construction process
Net average rental rates have not changed during the last quarter and amounted to $135 per sq m while the spread rate remains relatively high
In 2014 developers expect to build nearly 15 mn sq m of warehouse space however according to our estimations the volume of construction will be 30 less due to the development process delays
DISTRIBUTION OF QUALITY DEVELOPMENTS IN THE PIPELINE FOR 2013-2014 (lsquo000 SQ M) РАСПРЕДЕЛЕНИЕ ПЛАНИРУЕМЫХ К ВВОДУ В 2013-2014 ГГ СКЛАДСКИХ ПЛОЩАДЕЙ В МОСКОВСКОЙ ОБЛАСТИ ТЫС КВ М
DISTRIBUTION OF WampI SPACE IN THE MOSCOW REGION (lsquo000 SQ M) РАСПРЕДЕЛЕНИЕ СКЛАДСКИХ ПЛОЩАДЕЙ В МОСКОВСКОЙ ОБЛАСТИ ТЫС КВ М
В регионах в минувшем квартале было построено только 43 тыс кв м качественных складских площадей против 117 тыс в прошлом Все новые объекты построены рядом с Санкт-Петербургом
Всего в 2014 году в регионах будет построено боле 290 тыс кв м против 410 тыс кв м в прошлом В большинстве регионов дефицита складских площадей не наблюдается Исключение составляет Санкт-Петербург Екатеринбург и Ростов-на-Дону
Чистые ставки аренды в регионах в III квартале 2013 года не изменились за исключением Новосибирска и Нижнего Новгорода где они немного выросли до $120 и $123 за кв м соответственно
Source Cushman amp Wakefield
TAKE UP lsquo000 SQ M ОБЪЕМ АРЕНДОВАННЫХ И КУПЛЕННЫХ ПЛОЩАДЕЙ ТЫС КВ М
Source Cushman amp Wakefield
During the past quarter only 43000 sq m of quality warehouse space was built In the regions as against last year fiqure (117000 sq m) All new premises were built near St Petersburg
Comparing to last year figure (410000 sq m) more than 290000 sq m is going to be built in the regions in 2014 In most regions there is no lack of warehouse spaces observed The exceptions are St Petersburg Yekaterinburg and Rostov-on-Don
Net rental rates have not changed in the regions in Q3 except Novosibirsk and Nizhny Novgorod where they rose slightly to $120 and $123 per sq m respectively
2013 PIPELINE ОБЪЕКТЫ ЗАЯВЛЕННЫЕ К СТРОИТЕЛЬСТВУ В 2013 Г
PROJECT DEVELOPER GRADE DIRECTION HIGHWAYDISTANCE FROM
MKAD KMTOTAL AREA
000 SQ MEXPECTED
DELIVERY
Infrastroy Bykovo Infrastroy А E Egorevskoe 17 6155 Q1
Infrastroy Bykovo Infrastroy А E Egorevskoe 17 6193 Q4
Klimovsk LP Raven Russia A S Simferopolskoye 23 4772 Q3
Logopark Sever Karavella A N Rogachevskoye 30 11023 Q3
PNK Chekhov II PNK group A S Simferopolskoye 50 10424 Q2
PNK Chekhov II PNK group A S Simferopolskoye 50 5531 Q4
PNK Vnukovo PNK group A SW Kievskoe 19 10568 Q1
South Gate IP Radius group A S Kashirskoye 30 2070 Q2
South Gate IP Radius group A S Kashirskoye 30 3000 Q4
СПРОС В Московском регионе за I-III кварталах 2013 г было арендовано и куплено более 850 тыс кв м качественных складских площадей из них 235 тыс в III квартале что соответствует прошлогодним показателям
Наиболее крупные сделки в минувшем квартале
Автомобильный концерн Volkswagen купил 50 тыс кв м в складском комплексе PNK Чехов 2 девелопер PNK Group
Компания Верный купила 43 тыс кв м в складском комплексе PNK Север девелопер PNK Group
Автомобильный концерн General Motors арендовала 40 тыс кв м в индустриальном комплексе Южные врата
Следует отметить что большое количество качественных складских площадей было арендовано и куплено в III квартале 2013 г производственными компаниями при этом логистиче-ские компании и дистрибьюторы наоборот купили и арендова-ли меньшее количество площадей
Так же следует отметить увеличение доли продаж в III квартале до 42 против 14 во II квартале в структуре поглощения
На региональных рынках за минувший квартал было арендовано и куплено более 85 тыс кв м всего с начала года более 250 тыс кв м что почти на 20 выше аналогичного показателя прошлого года и на 5 среднего значения за последние 5 лет Этот показатель во многом обусловлен самой крупной сделкой за всю историю рынка складской недвижимости Санкт-Петербурга по предварительной продаже 43 тыс кв м компанией PNK Group продуктовой сети laquoВерныйraquo в складском комплексе PNK КАД
Сделки на такие большие площади позволяют девелоперу возобновить строительство в регионах но за период с IV кв 2012 по III квартале 2013 г Было заключено только 4 сделки более 25 тыс кв м Большинство сделок в регионах заключает-ся на складские площади до 10 тыс кв м
STRUCTURE OF DEMAND MOSCOW СТРУКТУРА СПРОСА МОСКВА
DEMAND In the Moscow region in Q1-Q3 2013 more than 850000 sq m were rented and purchased talking about quality warehouse space The Q3 indicator is 235000 sq m which is the same to the last years performance
The largest deals in the last quarter
bull Car manufacturer group Volkswagen bought 50000 sq m in a warehouse complex PNK Chekhov 2 developer is PNK Group
bull The Verniy company bought 43000 sq m in a warehouse complex PNK North developer is PNK Group
bull Automobile сar manufacturer General Motors leased 40000 sq m in the industrial complex South Gate
It should be noted that a large number of quality warehouse space was leased and purchased in the Q3 2013 by manufacturing companies while logistics companies and distributors on the contrary have bought and rented a smaller amount of warehouse space
It should be also mentioned the increasing sales in Q3 up to 42 comparing to 14 in the previous quarter for the both leased and bought premises
At the regional markets for the last quarter it was rented and purchased more than 85000 sq m Since of the beginning of the year more than 250000 sq m were rented and purchased which is almost 20 higher than last year and 5 higher than the average number for the last 5 years This indicator is largely due to the largest deal in the history of the warehouse property market of St Petersburg on the pre-sale of 43000 sq m by PNK Group to the food supplier Verniy in the warehouse complex PNK KAD
Such large deals allow developer to resume construction in the regions However between Q4 2012 and Q3 2013 it was only 4 deals amounted more than 25000 sq m made Most of the deals in the region are for warehouse space up to 10000 sq m
ТЕНДЕНЦИИ С начала прошлого года на рынок складской недвижимости остается стабильным Ежегодный спрос в Московском регионе составляет около 1 млн кв м в год Средние ставки аренды в классе А составляют $135 за кв м в год без НДС операцион-ных расходов и коммунальных платежей доля вакантных площадей сохраняется на уровне 1 Строительство большин-ства новых складских объектов будет начинаться только после заключения предварительных договоров аренды и продажи
Изменение ситуации в ближайшей перспективе ожидать не стоит В условиях низкого роста экономики страны начинать спекулятивное строительство большой риск повторения ситуации 2008 года поэтому предложение будет подстраивать-ся под спрос
На региональных рынках продолжится тенденция увеличения дефицита готовых к въезду складских площадей Не смотря на высокой спрос на складские объекты в регионах девелоперам не удается сформировать достаточных портфель предваритель-ных договоров аренды для начала строительства Исключение составляет Санкт-Петербург Свердловская область юг России где спрос или условия рынка обеспечили девелоперам формирование такого портфеля Мы прогнозируем что до конца года в регионах будет реализовано более 300 тыс кв м складских площадей
Source Cushman amp Wakefield
STRUCTURE OF DEMAND REGIONS СТРУКТУРА СПРОСА РЕГИОНЫ
TRENDS Since the beginning of the last year the warehouse market has remained stable Annual demand in the Moscow region is about one mn sq m per year average rental rates for Class A is $135 per sq m per year excluding VAT operating expenses and utility costs the vacancy rate remains at 1 Construction of the majority of new storage facilities will start only after the preliminary lease or sale contract signing up
In the nearest future the situation would remain the same It is the huge risk to start the new speculative construction in a low-growth economic situation as it is the threaten to repeat the 2008 year crisis the supply will adapt to the demand
The trend of growing deficit of ready-to-move warehouse spaces continues at the regional markets In spite of the high demand for storage facilities in the regions for developers it is still complicated to form a sufficient portfolio of preliminary agreements for the start of construction Exceptions are St Petersburg Sverdlovsk region and south Russia where the demand or market conditions provided developers with the opportunity to form such a portfolio We predict that by the end of the year in the regions will be sold over 300000 sq m of warehouse space
WampI MARKET IN RUSSIA ETHUcircIacuteIcircEcirc NtildeEcircEumlAgraveAumlNtildeEcircEgraveOtilde IumlIcircIgraveAringUgraveAringIacuteEgraveEacute Acirc ETHIcircNtildeNtildeEgraveEgrave
VACANCY RATE (EOY) Paris (Ile de France) 89 81 99 126 102 84 81 89 804
Budapest 59 172 173 188 195 208 194 217 2283
Warsaw 89 74 112 171 194 173 146 1621 1592
Madrid 55 38 37 55 73 84 93 95 972
TAKE UP 000 SQ MParis (Ile de France) 1 005 700 640 601 814 837 563 208 58
Budapest 152 229 308 280 210 327 355 31 21
Warsaw 260 445 556 216 451 743 483 183 112
Madrid 1 225 918 630 325 390 270 225 60 47
2013
36
MARKETBEAT Q3 2013
RESEARCH DEPARTMENT IcircOgraveAumlAringEuml EgraveNtildeNtildeEumlAringAumlIcircAcircAgraveIacuteEgraveEacute
Further information and copies of this report are available from Ellina Krylova
EllinaKrylovaeurcushwakecom
The information provided in this report is intended for informational purposes only and should not be relied on by any party without further independent verification Classifications of individual buildings are reviewed on a continuing basis and are subject to change The standards used in this process are consistent with those used by Moscow Research Forum and in the United States by the Society of Industrial and Office Realtors (SIOR) and BOMA International Reproduction of this report in whole or part is permitted only with written consent of Cushman amp Wakefield Data from this report may be cited with proper acknowledgment given
copy 2013 Cushman amp Wakefield All rights reserved
MORE INFORMATION AND CONTACTS ARE AVAILABLE ON WWWMARKETBEATRU EgraveIacuteOcircIcircETHIgraveAgraveOumlEgraveszlig IcircAacute IcircOgraveAumlAringEumlAring EgraveNtildeNtildeEumlAringAumlIcircAcircAgraveIacuteEgraveEacute Egrave IumlOacuteAacuteEumlEgraveEcircAgraveOumlEgraveEgrave AumlIcircNtildeOgraveOacuteIumlIacuteUcirc IacuteAgrave WWWMARKETBEATRU
DENIS SOKOLOV PARTNER RESEARCH DIRECTOR DenisSokoloveurcushwakecom
LADA BELAYCHUK ASSOCIATE DIRECTOR DEPUTY RESEARCH DIRECTOR LadaBelaychukeurcushwakecom
MAXIM ILYIN CONSULTANT CAPITAL MARKETS Maximilyineurcushwakecom
ALEXANDER KUNTSEVICH ANALYST WampI PROJECT MANAGEMENT AlexanerKuntsevicheurcushwakecom
TATYANA DIVINA SENIOR ANALYST
TatyanaDivinaeurcushwakecom
wwwcushmanwakefieldcom
Q3 2013 MoscowRUSSIA A Cushman amp Wakefield Research Publication
CAPITAL MARKETS
Source Cushman amp Wakefield
TOTAL INVESTMENTS BY SECTOR ИНВЕСТИЦИИ ПО СЕКТОРАМ
EcircETHAgraveOgraveEcircEgraveEacute IcircAacuteCcedilIcircETH Объем инвестиций в коммерческую недвижимость в III квартале остался практически без изменений по сравнению с II кварталом 2013 года и составил 113 млрд долларов США
Москва сохраняет первенство по размеру инвестиций в коммер-ческую недвижимость и продолжает оставаться основным инвестиционным центром России В Москву привлекается более 80-90 от всех инвестиций в коммерческую недвижимость
На втором месте по объему инвестиций в коммерческую недвижимость находится Санкт-Петербург где в III квартале 2013 года инвестировано около 50 млн долларов США
Наш прогноз общего объема инвестиций в качественную коммерческую недвижимость за 2013 г остается неизменным и может составить 79 млрд долларов США В следующем 2014 году рынок ожидает незначительная стагнация и объем инвестиций будет находиться на уровне около 75 млрд долларов США
Source Cushman amp Wakefield
TOTAL INVESTMENTS | IcircAacuteUacuteAringIgrave EgraveIacuteAcircAringNtildeOgraveEgraveOumlEgraveEacute YTD 2013 US$ 575 bn
PRIME CAPITALIZATION RATES | NtildeOgraveAgraveAcircEcircEgrave EcircAgraveIumlEgraveOgraveAgraveEumlEgraveCcedilAgraveOumlEgraveEgrave Acirc IumlETHAgraveEacuteIgrave NtildeAringAtildeIgraveAringIacuteOgraveAring
INVESTMENTS YOY CHANGE AND SHARE OF OFFICE AND RETAIL SEGMENTS ИЗМЕНЕНИЯ ОБЪЕМА ИНВЕСТИЦИЙ И ДОЛИ ОФИСНОГО И ТОРГОВОГО СЕГМЕНТОВ
SUMMARY The total volume of commercial real estate investments in Q3 2013 was on the same level with previous one and amounted to $113 billion
Moscow takes the primary role according to the volume of investments in the commercial real estate industry and remains the major investment center in Russia The capital of Russia attracted more than 80-90 of total investments in the commercial real estate
The second place is for St Petersburg talking about the volume of total investments in Russian commercial real estate Nearly $50 million of dollars were attracted in Q3 2013
Our forecast of the total investment volume of quality real estate in Russia for 2013 stays unchanged and can reach the volume of $79 billion Next year we expect insignificant stagnation and the total volume of investments is going to be at the level of $75 billion
0
1 000
2 000
3 000
4 000
5 000
6 000
7 000
8 000
9 000
2006 2007 2008 2009 2010 2011 2012 F2013 F2014
mn
USD
Office Retail Industrial Other Forecast
4560
53545798
2256
3994
7547 74377900
5750
7500
0
20
40
60
80
100
0
1 000
2 000
3 000
4 000
2007
Q1
2007
Q2
2007
Q3
2007
Q4
2008
Q1
2008
Q2
2008
Q3
2008
Q4
2009
Q1
2009
Q2
2009
Q3
2009
Q4
2010
Q1
2010
Q2
2010
Q3
2010
Q4
2011
Q1
2011
Q2
2011
Q3
2011
Q4
2012
Q1
2012
Q2
2012
Q3
2012
Q4
2013
Q1
2013
Q2
2013
Q3
US
$ m
n
Total investments Office of total Retail of total
KEY EXPECTATIONS
STABILITY
8
MARKETBEAT Q3 2013
IcircNtildeIacuteIcircAcircIacuteUcircAring IumlIcircEumlIcircAEligAringIacuteEgraveszlig В регионах доля качественных проектов коммерческой недви-жимости в настоящее время крайне мала инвесторы в большей степени заинтересованы в laquoгородах-миллионникахraquo где рынок коммерческой недвижимости наиболее развит
В III квартале 2013 г основной объем инвестиций пришелся на офисную недвижимость Объем инвестиций в этом сегменте составил 8443 млн долларов США Среди крупных сделок можно отметить продажу офисного комплекса White Gardens Сумма сделки является одной и самых крупных на рынке за последнее время на рынке офисной недвижимости и составила около 740 млн долларов США
Объем инвестиционных сделок на рынке торговой недвижимо-сти в III квартале 2013 г составил 250 млн долларов США Од-нако если все запланированные сделки будут завершены то 2013 год станет рекордным по объему инвестиций в торговую недвижимость
Традиционно на складскую и индустриальную недвижимость приходится меньше всего совершенных инвестиционных сде-лок Так в прошедшем квартале на долю складской и индустри-альной недвижимости пришлось инвестиций на сумму около 332 млн долларов США
Совокупный объем инвестиций в коммерческую недвижимость за три квартала 2013 г составил 575 млрд долларов США По сравнению с наиболее развитыми рынками Лондона и Парижа объем инвестиций в Москве ниже на 70 чем за тот же период в Лондоне и на 20 ниже чем в Париже
NtildeOgraveAgraveAcircEcircEgrave EcircAgraveIumlEgraveOgraveAgraveEumlEgraveCcedilAgraveOumlEgraveEgrave Ставка капитализации на Прайм объекты в Москве составляют 85 для офисов 90 для торговых центров и 110 для склад-ской недвижимости Это выше среднеевропейского уровня на 250 базисных пунктов и на 450 бп выше наиболее развитых европейских рынков ndash Лондона и Парижа
TOP 30 INVESTMENT MARKETS ТОП-30 ИНВЕСТИЦИОННЫХ РЫНКОВ
MOSCOW PRIME CAPITALIZATION RATES СТАВКИ КАПИТАЛИЗАЦИИ laquoПРАЙМraquo В МОСКВЕ
Source Cushman amp Wakefield
MAIN DEVELOPMENTS In regions the share of quality real estate projects is small and investors are much more interested in economically developed cities with population of over a million where the real estate market is more matured
In the third quarter of 2013 the majority of investments came to the office segment with the volume of $8443 million Among the biggest deals in the market it worth mentioning White Gardens business centre realization (the amount of transaction is one of the largest in the office market for recent years and equals to $740 million
Retail was the less attractive sector for investors in Q3 and the volume of investments amounted to $250 million However if all planned deals are completed by the end of the year then 2013 will be the record-breaking year regarding the investment volume
Traditionally investments in warehouse and industrial real estate sectors are less popular in Russia and the number of completed deals is rather small here Thus the investments in warehouse and industrial sectors totaled about $332 million for the latest quarter
The total volume of investments in Q1-Q3 2013 reached the number of $575 billion Comparing the most developed markets of London and Paris the level of investments in Moscow is 70 lower than London and 20 lower than Paris for the same period of time
CAPITALISATION RATES The current yields for prime real estate projects in Moscow are 85 for offices 90 for retail and 110 for warehouse and industrial projects This rate is higher than average yields in Europe on 250 bps and on 450 bps higher of most developed investment markets of London and Paris
1 NYC Metro 1922 Tokyo 1543 London Metro 1404 LA Metro 1195 DC Metro 1086 SF Metro 827 Hong Kong 718 Paris 609 Singapore 4710 Sydney 4611 Dallas 4512 Atlanta 4413 Houston 4314 Toronto 4215 Boston 4016 Moscow 3917 Chicago 3918 Osaka 3319 Seoul 3220 So Fla 3221 Seattle 3122 Berlin-Brandenburg 3123 Stockholm 2824 Rhine-Ruhr 2825 Shanghai 2526 FrankfurtRhine-Main 2527 Melbourne 2528 Munich 2429 Phoenix 2430 Brisbane 24
6
8
10
12
14
16
18
2004
2005
2006
2007
2008
2009
2010
2011
2012
Q1
13
Q2
13
Q3
13
CBR refinancing rate Office primeShopping center prime WampI Prime
9
MARKETBEAT Q3 2013
INTERACTIVE CHARTS I EgraveIacuteOgraveAringETHAgraveEcircOgraveEgraveAcircIacuteUcircAring AtildeETHAgraveOcircEgraveEcircEgrave
RUSSIAN PROPERTY INVESTMENT MARKET I EgraveIacuteAcircAringNtildeOgraveEgraveOumlEgraveEgrave Acirc EcircIcircIgraveIgraveAringETHtimesAringNtildeEcircOacuteTHORN IacuteAringAumlAcircEgraveAEligEgraveIgraveIcircNtildeOgraveUuml ETHIcircNtildeNtildeEgraveEgrave
Q3 2013 MoscowRUSSIA A Cushman amp Wakefield Research Publication
RETAIL
Source Rosstat
RETAIL TRADE TURNOVER AND REAL DISPOSABLE INCOME RUSSIA YOY РОЗНИЧНЫЙ ТОВАРООБОРОТ И РЕАЛЬНЫЕ РАСПОЛАГАЕМЫЕ ДОХОДЫ РОССИЯ
EcircETHAgraveOgraveEcircEgraveEacute IcircAacuteCcedilIcircETH В целом по России объемы нового строительства торговых площадей так же высоки как и в прошлом 2012 г В течение трех кварталов 2013 г в 22 российских городах появились новые торговые комплексы Некоторое снижение темпов строительства в Москве в 2012-2013 гг будет компенсировано ожидаемыми масштабными открытиями в 2014 г Посещае-мость торговых центров в Москве находится на высоком уровне потребительские ожидания стабильны В связи с дефицитом предложения в торговых центрах Москвы ритейлеры активно изучают российские регионы В 2013 г как и в течение 2012 г ставки аренды были стабильны
CONSUMER CONFIDENCE INDEX ИНДЕКС ПОТРЕБИТЕЛЬСКОГО ОЖИДАНИЯ
IumlIcircOgraveETHAringAacuteEgraveOgraveAringEumlEgrave Реальные располагаемые денежные доходы населения России (доходы за вычетом обязательных платежей скорректирован-ные на индекс потребительских цен) по оценке Росстата в августе 2013 г выросли на 21 по сравнению с августом 2012 г в январе-августе 2013 г выросли на 41 в сравнении с аналогичным периодом прошлого года Среднемесячная зарплата в России в августе 2013 г составила 29 020 рублей и выросла на 128 по сравнению с августом 2012 года
BRIEF SUMMARY In general the volume of new construction of retail spaces in Russia can be described as high as it used to be in the past 2012 New retail complexes have been constructed and delivered for the past 3 quarters of 2013 in 22 Russian cities There is a reduction in the сconstruction of new quality retail premises in Moscow for 2012-2013 which is going to be compensated by large-scale and expected projects in 2014 Attendance of Moscow shopping centers is at the high level consumer expectations are stable Due to the shortage of supply in the shopping malls retailers actively seek for new spaces in Russian regions During the 2013 rental rents remains stable as it was in 2012
CONSUMERS According to Rosstat real income of the Russian population grew up by 21 comparing to August 2012 Moreover it increased by 41 in January-August 2013 relatively to the same period of time last year The average monthly salary was 29020 rubles in August 2013 and increased by 128 comparing to the past year
Total retail trade growth for January-May was 38
Source Rosstat
VACANCY RATE ДОЛЯ СВОБОДНЫХ ПЛОЩАДЕЙ (Prime shopping centers Moscow) | (действующие прайм ТЦ Москва) 12
PRIME RENTAL RATE INDICATOR | ПРАЙМ ИНДИКАТОР АРЕНДНЫХ СТАВОК (Prime shopping center retail gallery Moscow) | (галереи в прайм ТЦ Москва) US$ 3800
1642 mn sq m 572 quality projects
TOTAL QUALITY STOCK IN RUSSIA ОБЩЕЕ КОЛИЧЕСТВО КАЧЕСТВЕННЫХ ТОРГОВЫХ ПЛОЩАДЕЙ В РОССИИ
KEY EXPECTATIONS
STABILITY
-10
-5
0
5
10
15
20
2007 2008 2009 2010 2011 2012 F2013 F2014
Retail trade turnover growth Real personal disposable income growth
RETAILERS Retailer demand has remained relatively strong in Russia with limited new market entrants but existing retailers looking to expand and experiment with new format types Vacancy rates in prime shopping centres in Moscow are at extremely low levels with occupiers now transferring interest to the high street as shopping centre space cannot meet the demand
Those brands already present in Russia are actively looking to expand into the regions
NEWCOMER BRANDS WITH DEVELOPMENT PLANS IN RUSSIA НОВЫЕ ПЛАНЫ РАЗВИТИЯ РИТЕЙЛЕРОВ В РОССИИ
Source official websites and other media
REGION CITY NEWCOMERS 2013 COMING SOONSouthern Volgograd Leroy Merlin
Armavir LentaSochi Bata Louis Vuitton StarbucksTaganrog LentaKrasnodar Barker Bata StarbucksRostov-on-Don Starbucks
ETHEgraveOgraveAringEacuteEumlAringETHUcirc Спрос на качественные торговые помещения со стороны ритейлеров высокий Ритейлеры продолжают экспериментиро-вать с новыми форматами В связи с дефицитом предложения в торговых центрах Москвы ритейлеры обращают все больше внимания на торговые улицы
Продолжается активная экспансия во все регионы России
GLOBAL RETAILERS COMING TO RUSSIA НОВЫЕ МЕЖДУНАРОДНЫЕ РИТЕЙЛЕРЫ ПЛАНИРУЮЩИЕ НАЧАТЬ РАБОТУ В РОСИИ
NEW GLOBAL RETAILERS IN 2013 НОВЫЕ МЕЖДУНАРОДНЫЕ РИТЕЙЛЕРЫ В РОССИИ 2013
CushmanampWakefield Research quarterly monitoring of 9 quality shopping centers (total GLA - 05 mn sq m) These shopping centers have been opened more than one year ago and have a clear catchment area
OgraveIcircETHAtildeIcircAcircUcircAring IumlIcircIgraveAringUgraveAringIacuteEgraveszlig В III квартале посещаемость торговых центров в Москве находилась на более высоком уровне чем в предыдущие годы в этот период Доля покупателей (количество людей совершив-ших покупки относительно общего количества посетителей) снизилась до 308
Уровень свободных помещений в качественных торговых центрах находится на предельно низком уровне Небольшой рост в III квартале 2013 года (на 08 пп) связан с ротацией арендаторов в одном из торговых центров (один из этажей торгового центра в ближайшее время будет полностью занят крупным арендатором которые в настоящее время проводит ремонт помещения)
В целом в Москве продолжает наблюдаться дефицит предложе-ния в качественных торговых центрах
ДОЛЯ laquoУСПЕШНЫХ ПОКУПАТЕЛЕЙraquo ldquoSUCCESSFUL SHOPPERSrdquo
FOOTFALL ПОСЕЩАЕМОСТЬ ТОРГОВЫХ ЦЕНТРОВ
Source Cushman amp Wakefield
Source Cushman amp Wakefield
Source Cushman amp Wakefield
CushmanampWakefield Research quarterly monitoring of 9 quality shopping centers (total GLA - 05 mn sq m) These shopping centers have been opened more than one year ago and have a clear public contact area Number of successful shoppers remained stable (share of shoppers who make purchases out of all visitors of the monitored shopping centers)
The total number of retail outlets in the observed sample is 865 (brands in shopping galleries without operators of restaurant zones and without service companies like dry cleaning banks etc) These retail outlets are filled with 552 unique brands
VACANCY RATE УРОВЕНЬ СВОБОДНЫХ ПОМЕЩЕНИЙ
Petrovsky Passage
RETAIL SPACE
In Q3 the visiting rate of the retail centers was at the higher level than it used to be in the last year Buyers share (amount of people who made a purchase compared to total number of visitors) decreased with the number of 308 The level of vacant spaces in the quality retail centers is at the lowest level The small increase in the third quarter (08 points) is associated with the rotation of tenants in one of the shopping centers (one of retail centerrsquos floors is going to be fully occupied by the leaseholder who is currently conducting repair facilities)
In general there is a lack of supply in the quality retail centers in Moscow
Announced developers plans CW Forecast New construction YTD
НОВОЕ СТРОИТЕЛЬСТВО В III квартале в России было введено в эксплуатацию 15 новых торговых центров общей торговой площадью 292 750 кв м География нового строительства ndash от Иркутска и Ангарска до Сочи В основном стоятся торговые центры (75 всех новых качественных торговых площадей) также торговые площади открываются в многофункциональных комплексах Средний размер новых торговых центров уменьшается в 2013 году он составляет 26 тыс кв м что на 30 меньше чем в 2011 году
В III квартале крупнейшим открытым торговым объектом стал торгово-развлекательный центр Жемчужная Плаза (GLA 48 тыс кв м) в Санкт-Петербурге построенный в рамках комплексной застройки микрорайона Балтийская Жемчужина
В III квартале в Москве был открыт один новый торгово-развлекательный центр Райкин Плаза Также были открыты но-вые фазы комплекса Отрада В Москве новые качественные торговые площади строятся в разных форматах ndash торгово-развлекательные центры (Рио Райкин плаза) аутлет-центры (Внуково и Fashion House) многофункциональные комплексы (Белая Площадь Эволюция) До конца 2013 г в Московском регионе (г Павловский Посад) планируется открытие ритейл парка Белла Вита (GLA 36 тыс кв м)
NEW CONSTRUCTION 2013 RUSSIAQUALITY RETAIL STORES НОВОЕ СТРОИТЕЛЬСТВО В 2013 ГОДУ РОССИЯ КАЧЕСТВЕННЫЕ ТОРГОВЫЕ ОБЪЕКТЫ
Source Cushman amp Wakefield
QUALITY RETAIL CONSTRUCTION rsquo000 SQ M RUSSIA СТРОИТЕЛЬСТВО КАЧЕСТВЕННЫХ ТОРГОВЫХ ПЛОЩАДЕЙ ТЫС КВ М РОССИЯ
NEW CONSTRUCTION In Q3 15 new retail centers were delivered in Russia with a total area of 292750 sq m The geography of new construction is located from Irkutsk and Angarsk to Sochi The majority of new premises are located in shopping centers (75 of new quality retail space) besides retail space in multifunctional complexes Average area of newly constructed shopping centers is decreasing in 2013 it was about 26000 sq m which is 30 lower than in was in 2011
In the third quarter retail and entertainment center Pearl Plaza (GLA 48000 sq m) was awarded the name of the largest retail project in St Petersburg It was built as a part of the complex development in the Baltic Pearl micro region
Besides the new shopping and entertainment mall Raykin Plaza was delivered in the Q3 Also new phases of the Otrada complex were delivered New quality retail spaces are developed in various formats in Moscow ndash shopping and entertainment centers (Rio Raykin Plaza) outlet-centers (Vnukovo and Fashion House) multifunctional complexes (White Square Evolution) Till the end of 2013 it is planned to open retail park Bella Vita (GLA 36000 sq m) in the Moscow region (Pavlovskiy Posad city)
Standard lease terms for gallery tenants are between 3-5 years break options are rare For anchor tenants (including fashion anchors) lease terms are up to 20 -25 years and break options are becoming popular
Rents are typically payable monthly in advance Turnover percentage rents are increasingly seen in shopping centres Rental rates are generally calculated in USD Euricirc or commercial units are used In less quality shopping centres rental rates are calculated in RUR
Annual indexation is typical between 3-10 or at a level of USD EU CPI The practice of premium key money payments is seldom seen in Russia Rent reviews are rare on the market
Service ChargesIcirciumlaringethagraveoumlegraveicirciacuteiacuteucircaring iumleumlagraveogravearingaeligegrave
Service charge is payable by tenants at either an ldquoopen bookrdquo basis or more common as a fixed cost Utilities payments are charged on consumption Building insurance is normally charged back to tenant via service charge
Local property taxes are not payed separately they are generally included in the service charges Iacuteagraveeumlicircatilde iacuteagrave iacutearingaumlacircegraveaeligegraveigraveicircntildeograveuuml icircaacuteucircdivideiacuteicirc acirceumlthorndivideagravearingograventildeyuml acirc icirciumlaringethagraveoumlegraveicirciacuteiacuteucircaring iumleumlagraveogravearingaeligegrave
Other costsAumlethoacuteatildeegravearing iumleumlagraveogravearingaeligegrave
EcircIcircIgraveIgraveAringETHtimesAringNtildeEcircEgraveAring OacuteNtildeEumlIcircAcircEgraveszlig Acirc OgraveIcircETHAtildeIcircAcircUcircOtilde OumlAringIacuteOgraveETHAgraveOtilde Ставки аренды для помещений в торговых галереях качествен-ных торговых центров в Москве находятся в диапазоне от 500 до 4 000 долларов США (за кв м в год без НДС и других платежей) В течение трех кварталов 2013 и всего прошедшего 2012 года ставки аренды в торговых центрах были стабильны Прайм ритейл индикатор в Москве составляет 3 800 долларов США (за кв м в год без НДС и других платежей) Однако в 2013 году наметилась тенденция к повышению ставок аренды в лучших торговых центрах поэтому рост ставок на лучшие помещения может быть выше 5 (текущий консервативный прогноз)
Вне Москвы ставки аренды в торговых центрах в среднем на 30-60 ниже в зависимости от региона
Дополнительно к ставке аренды ритейлеры платят сервисные сборы за обслуживание (150-250 долларов США за кв м в год для помещений размером менее 500 кв м) за маркетинг (10-25 долларов США за кв м в год) также иногда бывают и другие дополнительные платежи
Source Cushman amp Wakefield
Source Cushman amp Wakefield
PRIME RETAIL INDICATOR MOSCOW ПРАЙМ РИТЕЙЛ ИНДИКАТОР В ТОРГОВЫХ ЦЕНТРАХ МОСКВА
Prime retail indicatormdashbase asking rental rate for the 100-200 sq m gallery unit at the ground floor of the prime shopping centers US$ per sq m per annum triple net
INDICATIVE RENTAL RATES IN QUALITY SHOPPING CENTER RETAIL GALLERIES MOSCOW СРЕДНИЕ АРЕНДНЫЕ СТАВКИ В ГАЛЕРЕЕ КАЧЕСТВЕННЫХ ТОРГОВЫХ ЦЕНТРОВ МОСКВА
COMMERCIAL RATES IN SHOPPING MALLS Moscow retail gallery rental rates are in the range of US$ 500- 4000 (per sq m per year before VAT and other expenses) depending on the size of the retail unit and the type of retailer Throughout Q1-Q3 and the whole of 2012 rental rates were stable across all sub-sectors
Moscowrsquos prime retail indicator is US$ 3800 per sq m per annum as a base rate However a tendency towards rate increases was observed in 2013 and near future growth may be higher than 5 (our current conservative estimate)
In other cities rental rates in shopping malls are typically 30 to 60 below Moscow levels
Additionally among other payments there are operational expenses (US$ 150-250 per sq m annually for units smaller than 500 sq m) marketing (US$ 10-25 per sq m annually) and others depending on the project
QUALITY RETAIL LEASE STRUCTURE СТРУКТУРА ДОГОВОРОВ АРЕНДЫ В КАЧЕСТВЕННЫХ ТОРГОВЫХ ПОМЕЩЕНИЯХ
ANCHORS
lt100 100 - 300 300 - 1200 1200 - 3500 3500-7000
Food court $1800-$2000
Kiosks $5000-$8000
Restaurant $600-$1000 $700
Clothing $1 600 $1 200 $700 $400
Shoes $2 200 $1 700 $1 200 $800
White and Brown $500
Supermarket $500-$600
Hypermarket $250-$450
Cinema $250-$320
BUSINESSGLA SQ M
RETAIL GALLERY MINI ANCHORS
Source Cushman amp Wakefield
15
MARKETBEAT Q3 2013
ТОРГОВЫЕ УЛИЦЫ На центральных торговых улицах свободно (предлагается в аренду или готовится к открытию) около 5 имеющихся поме-щений Ставки аренды в торговых коридорах стабильны В по-следние несколько лет есть тенденция к увеличению сроков аренды если еще три года назад договоры были чаще всего краткосрочные (на 11 месяцев) то сейчас трехлетние договора аренды становятся все более распространенными
Анализ торговых помещений на наиболее проходимых торго-вых улицах в центре города показывает что самыми популяр-ными категориями арендаторов являются предприятия питания (кафе рестораны) и магазины одежды и обуви которые занима-ют 29 и 21 всех помещений на этих улицах соответственно Значимыми арендаторами являются компании предлагающие услуги (спа парикмахерские медицинские услуги предприятия связи салоны фотографии юридические услуги) ndash они занимают 10 всех торговых помещений на главных улицах центра горо-да По 5 всех площадей занимают отделения банков ювелир-ные салоны магазины косметики и аксессуаров
Source Cushman amp Wakefield
HIGH STREETS Nearly 5 of the existing premises are freely available (are offered for lease or being prepared for delivery) in the central high streets Rental rates in the trade corridors are stable There is a tendency for increasing lease terms in the last few years As an example three years ago contracts used to be short-term mostly (11 months) and now agreements for the 3 and 5 years period become more and more widespread
The analysis of the retail spaces on the most passable areas in the city centre shows that the most popular categories of tenants are catering (cafe restaurants) and clothing shops They occupy 29 and 21 of all premises respectively Significant tenants are those who offers the following services spa hairdressers medical services communications companies photography and legal services ndash all of them occupy 10 of retail premises on the main streets of the city banks jewelry stores cosmetic stores and accessories occupy 5
AVERAGE RENTAL RATES ON HIGH STREETS IN MOSCOW СРЕДНИЕ АРЕНДНЫЕ СТАВКИ В ТОРГОВЫХ КОРИДОРАХ МОСКВА
HIGH STREET TENANT MIX MOSCOW Q3 2013 | СТРУКТУРА АРЕНДАТОРОВ В ТОРГОВЫХ КОРИДОРАХ МОСКВА III КВ 2013
Food Restaurants Cafes Fashion and footwareServices Bank ExchangeAccessories Optics Watches JewelryCosmetics Pharmacy Perfumery Other
HIGH STREET RENTAL RATES MOSCOW АРЕНДНЫЕ СТАВКИ В ТОРГОВЫХ КОРИДОРАХ МОСКВА
Data of the following trade corridors was used to conduct the analysis Tverskaya Petrovka-Stoleshnikov-Kuznetsky Most Nikolskaya Pyatnytskaya Pokrovka-Maroseyka In total these trade corridors located 710 outlets
US$ per sq m per annum triple net Aumlicirceumleumlagraveethucirc NtildeOslashAgrave ccedilagrave ecircacircigrave acirc atildeicircauml aacuteagraveccedilicircacircagraveyuml ntildeograveagraveacircecircagrave agraveetharingiacuteaumlucirc
OgraveIcircETHAtildeIcircAcircUcircAring OacuteEumlEgraveOumlUcirc mdash IumlAringOslashAringOtildeIcircAumlIacuteUcircAring CcedilIcircIacuteUcirc Важнейшим событием для торговых улиц стала программа развития пешеходных зон в Москве активно поддерживаемая Правительством города На тех улицах где уже отменили движение транспорта (в первую очередь Большая Дмитровка) происходит смена потоков посетителей (от пассажиров к пешеходам) Пешеходные улицы имеют огромный потенциал с точки зрения торговли и уже сейчас ритейлеры проявляют большой интерес к пешеходным районам Расширение пешеходных районов значительно увечит предложение качественных торговых помещений на улицах в Москве
HIGH STREETS mdash PEDESTRIAN AREA The most important event for the high streets became the development of pedestrian zones in Moscow which is actively supported by the city government There is a change of visitor flows (from passengers to pedestrians) on those streets where the driving was cancelled (it concerns Bolshaya Dmitrovka street first of all) There is a huge potential for retail activity talking about pedestrian streets and retailers show great interest in developing of those areas The expansion of pedestrian zones will significantly increase the supply of the quality retail premises in Moscow
HIGH STREETS mdash PEDESTRIAN AREA ТОРГОВЫЕ УЛИЦЫ mdash ПЕШЕХОДНЫЕ ЗОНЫ
With vehicular traffic restriction | Oacuteeumlegraveoumlucirc atildeaumlaring icircatildeethagraveiacuteegravedividearingiacuteicirc aumlacircegraveaeligaringiacuteegravearing ograveethagraveiacutentildeiumlicircethograveagrave
Opened for vehicles | Oacuteeumlegraveoumlucirc atildeaumlaring icircograveecircethucircograveicirc aumlacircegraveaeligaringiacuteegravearing ograveethagraveiacutentildeiumlicircethograveagrave
Q3 2013 MoscowRUSSIA A Cushman amp Wakefield Research Publication
OFFICE MARKET
IcircAacuteCcedilIcircETH ETHUcircIacuteEcircAgrave В III квартале 2013 г рынок продолжает оставаться активным спрос и предложение сбалансированы ставки аренды стабильны
Тенденция ослабления рынка офисной недвижимости отмечен-ная впервые в предыдущем квартале подкрепляется новыми фактами
Продолжилось снижение общего объема заключаемых сделок аренды и покупки в III квартале общий объем заключенных сделок составил 385 836 кв м что на 20 ниже среднего уровня 2011-2012 гг
Даже небольшой рост объема вывода на рынок новых помеще-ний приводит к увеличению доли свободных помещений За счет одного крупного объекта (Башня Меркурий в Москва-Сити арендуемой площадью 87 547 кв м) объемы ввода в эксплуатацию офисных площадей класса А в III квартале увеличились вдвое относительно средних объемов строительст-ва последних трех лет В результате уровень свободных помещений в классе А в среднем по Москве увеличился на 35 пп а в районе Москва-Сити mdash на 156 пп
Средняя ставка аренды не изменяется в течение последних трех кварталов в то время как инфляции в России за январь-май 2013 превысила уровень 7
ABSORPTION AND NEW CONSTRUCTION CLASSES A AND B (MN SQ M)
OVERVIEW The third quarter of the year saw the office market remain healthy with steady levels of demand Rents held firm There is a tendency of weakening signs in the office market which was noted for the first time in the previous quarter Now it is supported by some new facts
Overall demand level has continued to decrease Q3 take-up is 385836 sq m which is 20 less than the average take-up level for 2011-2012
Even moderate growth of new office space affects the vacancy rate In Q3 the delivery of Mercury Tower in Moscow City submarket (87547 sq m of office rentable area) doubled the quarterly Class A new construction volume (compared to the average number during the last three years) As a result the level of vacant space has increased by 35 percentage points in the Moscow Class A sector Talking about Moscow City submarket the volume of vacant space has increased by 156 points
Rental rates remain unchanged the CPI is above 7 (January-May 2013 data)
Source Cushman amp Wakefield
TOTAL STOCK MOSCOW | ОБЩИЙ ОБЪЕМ ПРЕДЛОЖЕНИЯ В МОСКВЕ 1360 mn sq m
VACANCY RATE | ДОЛЯ СВОБОДНЫХ ПЛОЩАДЕЙ 128
US$ 860 AVERAGE RENTAL RATE CLASS A | СРЕДНЯЯ АРЕНДНАЯ СТАВКА КЛАСС А
Q1-Q3 DEMAND (TAKE-UP) | ОБЪЕМ СДЕЛОК АРЕНДЫ И ПРОДАЖИ В 1-III КВ 2013 1190138 sq m
Q1-Q3 2013 NEW CONSTRUCTION | НОВОЕ СТРОИТЕЛЬСТВО В 1-III КВ 2013 594009 sq m
SUPPLY By the end of Q3 2013 Moscow had 136 mn sq m of quality office space Nine new office buildings were completed with a rentable area of 244587 sq m in Q3 New construction volume remains moderate
Nearly 50 of new office space delivered in 2013 is located in the Moscow suburbs (outside TTR) while the demand is drawn towards the city center So the suburbs are in danger of oversupply during the last four quarters the vacancy rate in suburban submarkets has increased by 58 percentage points from 11 in Q3 2013 to 168 in Q3 2013
In the Central and Prime business areas (with the exception of Moscow City submarket) the vacancy rate is stable while in several central submarkets (such as Tagansky Frunzensky Novoslobodsky) the availability is decreasing
After the recent delivery of Mercury Tower with 87547 sq m of office rentable space Moscow City availability has doubled Hence the Moscow City vacancy rate grew by 156 percentage points up to 327
Altogether there are 154 mn sq m of available office premises in existing buildings and 35 mn sq m is under speculative construction
IumlETHAringAumlEumlIcircAEligAringIacuteEgraveAring По состоянию на конец III квартала 2013 года в Москве насчи-тывалось 136 млн кв м качественных офисов В III квартале было введено в эксплуатацию 9 офисных зданий общей арен-дуемой площадью 244 587 кв м Объемы нового строительства продолжают оставаться умеренными
Около 50 новых офисных площадей вышедших на рынок в 2013 году находятся в удаленных от центра города районах (за пределами ТТК) В то же время спрос продолжает тяготеть к центру города В результате на окраинах города наблюдается тенденция к росту избыточности предложения Так в течение 4-х последних кварталов уровень свободных помещений в рай-онах за пределам ТТК увеличился на 58 пп с 11 (III кв 2012) до 168 (III кв 2013) Внутри ТТК уровень свободных помеще-ний стабилен а в некоторых субрынках (Таганском Фрунзен-ском Новослободском) свободных помещений становится меньше Исключение составляет субрынок Москва-Сити где после ввода в эксплуатацию Башни Меркурий площадью 87 547 кв м объем свободных помещений удвоился что не-медленно привело к росту уровня свободных помещений на 156 пп до уровня 327
Всего в Москве предлагается в аренду или на продажу 154 млн кв м в существующих и 35 млн кв м в строящихся зданиях
Future supply mdash available space in buildings to be delivered in the next 12 month (under construction and under reconstruction) The data is given for the end of the period
Source Cushman amp Wakefield Source Cushman amp Wakefield Moscow Research Forum
DEMAND Overall 12 million sq m of quality office space was leased or bought during Q1-Q3 2013 For the second quarter in a row the total volume of take-up is decreasing In Q3 385836 sq m of quality office space has been transacted which is 20 below the average quarterly level of 2011-2012 Real estate budgets are limited and tenants tend to primarily consider their current location as a viable alternative to a new office
Tenants continue to be interested primarily in existing buildings the proportion of pre-lease agreements in Q1-Q3 was 63 of the total rented space (23 in Q3) In 2013 there is a significant reduction in the proportion of sales deals (from 20 on average in 2011-2012 to around 10 in 2013)
The number of large transactions (over 2000 sq m) continues decreasing The average transaction size has reduced again by 10 compared with the previous quarter and now stands at 528 sq m (taking into account only leasing deals)
NtildeIumlETHIcircNtilde Всего за три квартала 2013 года было арендовано и куплено 12 миллиона кв м качественных офисных помещений Вто-рой квартал подряд наблюдается снижение общего объема сделок В III квартале общий объем сделок составил 385 836 кв м что на 20 ниже среднего уровня 2011-2012 годов Бюджеты на недвижимость и переезды ограничены аренда-торы и арендодатели все чаще находят компромиссы приво-дящие к продлению текущих договоров аренды а не заклю-чению новых сделок в новых зданиях
Арендаторы продолжают интересоваться главным образом введенными в эксплуатацию зданиями ndash в 2013 году (1-III кв) доля договоров предварительной аренды составила менее 63 (в III кв ndash 23) от всех арендованных площадей Доля сделок продажи также продолжает оставаться низкой и со-ставляет не более 10 от всего объема офисных сделок
Продолжает снижаться количество крупных сделок (размером более 2 000 кв м) Средний размер транзакции снизился на 10 относительно предыдущего квартала и в III квартале составил 528 кв м учитывая только сделки аренды
NtildeOgraveAgraveAcircEcircEgrave AgraveETHAringIacuteAumlUcirc В классе А средняя запрашиваемая арендная ставка составляет 860 долларов США В классе Б средняя ставка аренды стабильна на уровне 520 долларов США Ставки аренды для Прайм офисов продолжают находиться на уровне 1 200 долларов США за кв м в год (без НДС и операционных расходов)
Source Cushman amp Wakefield
Source Cushman amp Wakefield
Q3 2013 AVERAGE BASE RENTAL RATES BY BUSINESS AREA СРЕДНИЕ БАЗОВЫЕ СТАВКИ АРЕНДЫ В III КВ 2013 Г ПО БИЗНЕС РАЙОНАМ
AVERAGE RENTAL RATES (US$) СРЕДНИЕ СТАВКИ АРЕНДЫ (ДОЛЛАРЫ США)
Downtown
Central
OTA
Moscow subareas
Moscow is divided into office submarkets areas with similar real estate indicators and dynamics Office submarkets are grouped in office subareas
The Downtown subarea is the territory inside the Garden Ring and the Belorussky business area
The Central subarea is the territory between the Garden ring and TTR (and the more distant SOK and KUT submarkets)
OTA includes the Moscow suburbs
RENTAL RATES In Class A the average asking rental rate is $860 In Class B the average asking rental rate was stable at $520 Rental rates for prime office space is at the level of $1200 per year per sq m (triple net)
IumlETHIcircAtildeIacuteIcircCcedil Несмотря на то что по заявлениям девелоперов более 400 тыс кв м площадей планируется к вводу во IV кв 2013 года мы ожидаем что до конца года будет введено в эксплуатацию дополнительно не более 150ndash200 тыс кв м новых офисов Таким образом в 2013 году сохранится баланс спроса и предло-жения в большинстве офисных субрынков
Высокие объемы строительства на окраинах города и в Москва-Сити не окажут существенного дестабилизирующего влияния на центральные районы До конца 2013 года а также в 2014 году в центральных районах ставки аренды будут стабильны возможен рост в соответствии в уровнем инфляции
LEASE TERMS IN QUALITY BUSINESS CENTERS УСЛОВИЯ АРЕНДЫ КАЧЕСТВЕННЫХ ОФИСНЫХ ПОМЕЩЕНИЙ
RUR USD or Euros (rarely used) per sqmyr For currency exchange landlords use either Central Bank of Russiarsquos official rate or set their own rate or fix the dollar corridor eg 25-40 RUBUSD
Российские рубли доллары США или евро (используется редко) за квм в год Используется обменный курс ЦБ России или используются условные единицы (уе) с фиксированным курсом в коридоре 25-40 рублей за уе
Payments Iumleumlagraveogravearingaeligegrave Quarterly in advance Ежеквартально авансом
Indexation Egraveiacuteaumlaringecircntildeagraveoumlegraveyuml 3-5 or at the level of USA EU CPI 10-15 for RUR agreements Sometimes step-rents are used
3-5 или US CPI 10-15 для рублевых договоров аренды Ингода используется ступенчатая индексация
Other payments Aumlethoacuteatildeegravearing iumleumlagraveogravearingaeligegrave
Operational expences
Операционные расходыThis sort of payments strongly depends on the service list included Average market payments 100-150 USDsqmyr for Class A 80-120 USDsqmyr for Class B
Платежи зависят от состава включенных услуг который может значительно отличаться 100-150 долларов США за квм в год для Класса A 80-120 долларов США за квм в год для Класса Б
VATНДС 18 18Source Cushman amp Wakefield
FORECAST Despite the announcements from developers that they will deliver more than 400000 sq m in Q4 2013 the new construction forecast continues to be rather conservative Just 150000-200000 sq m of new office space might be delivered by the end of this year Consequently in 2013 the supply-demand balance should remain stable
The high volume of office space under construction is the biggest threat at the moment Against the possible local oversupply in Moscow suburbs and Moscow-City submarkets in 2014 central and prime business areas should see a market balance both at the end of 2013 and during the whole 2014 For these areas rental rates are projected to grow in line with inflation
The table contains office buildings announce for delivery in 2013 with rentable area more than 15000 sq m Delivered buildings are included disregarding the size
TOTAL mdash Office rentable area or all office buildings announced for delivery in 2013 (including small buildings with office rentable less than 15000 sq m)
DOWNTOWNBlackampWhite Complex (bld White) ZAM B+ 13000 Q1Rosso Riva ZAM A 11947 Q1Park Tower BEL B+ 11850 Q1Chistoprudnyy bul 8 bld 1 CBD B- 4730 Q1White Gardens BEL A 63900 Q1Wall Street ZAM A 20493 Q2Vishnevy Sad CBD B+ 6736 Q2Domino ZAM A 6216 Q3Lukoil build-to-suit CBD B+ 35000 Q3CENTRALDubininskaya ul 33B SCH B+ 3000 Q1City Point BC CTY B+ 9951 Q1Sinitsa Plaza BAS B+ 13496 Q2Mercury City CTY A 87574 Q3Poluyaroslavskiy Bolshoy per 102 bld BAS B+ 2294 Q3Poklonnaya ul vl 3 KUT A 85572 Q4Park Pobedy KUT B+ 54000 Q4Nizhegorodsky Business Centre phase II BAS B- 37100 Q4Nizhegorodsky Business Centre phase I BAS B- 23000 Q4Arma 19 BAS B+ 19080 Q4Golden Gate BAS B+ 16000 Q4OTANewton Plaza SE B+ 52000 Q1Danilovskaya Manufaktura Sitsevyi Korpu SE B+ 3396 Q1iCube SW B+ 15256 Q1Obrucheva ul 52 bld3 SW B- 23300 Q1Lotte Business Centre SW B+ 38480 Q1Streamline NE B+ 11048 Q1Quadrum SUB B+ 24650 Q2Park Mira NE B+ 7000 Q2Format Complex II SUB B- 9122 Q2Dobrolyubova 6 bld 5 NE B- 4699 Q3Leninsky 119 SW A 15400 Q3Central Street NE B+ 6423 Q3Smart Park SW B+ 10260 Q39 akrov phase II SW B+ 62300 Q3Country Park Phase III SUB A 19120 Q3Riga Land bld 5 (bld A) (phase II) SUB B+ 40000 Q4Solutions BP bld 3 SW B+ 19500 Q4Avrora NE B- 21600 Q4Neo Geo SW B- 70000 Q4Novator office-hotel complex SUB B+ 24000 Q4Mebe One Khimki Plaza SUB A 26000 Q4
TOTAL 217236
TOTAL 421653
TOTAL 551253
Q3 2013 MoscowRUSSIA A Cushman amp Wakefield Research Publication
HOSPITALITY
ADR IN AUGUST 2013 | СРЕДНЯЯ ЦЕНА ЗА НОМЕР В АВГУСТЕ 2013 $152
QUALITY SUPPLY | ТЕКУЩИЙ ОБЪЕМ КАЧЕСТВЕННОГО ПРЕДЛОЖЕНИЯ 14200 rooms
OCCUPANCY | ЗАПОЛНЯЕМОСТЬ 77
RevPAR | СРЕДНИЙ ДОХОД НА НОМЕР $117
IumlETHAringAumlEumlIcircAEligAringIacuteEgraveAring По оценке департамента гостиничного бизнеса и туризма совокупный объем номерного фонда в Москве на конец III квартала 2013 г составил свыше 48 тыс номеров из них доля качественного предложения составила порядка 30 общего предложения или 142 тыс номеров
Новое предложение за III квартале 2013 г в сегменте качествен-ных гостиниц составило 1138 номеров и было сформировано за счет ввода в эксплуатацию 4-х гостиниц разной ценовой категории
В ноябре 2013 г ожидается открытие гостиниц под управлени-ем оператора Accor комплекс из трех отелей расположен по адресу ул Бахрушина вл 11 В состав комплекса войдут 3 гостиницы разной ценовой категории Mercure на 158 номеров (Upscale) Ibis на 190 номеров (Midscale) Adagio на 149 апартаментов (Midscale)
Это увеличит предложение на рынке качественных отелей минимум на 497 номеров Ожидаемое в 2013 г открытие гостиницы Marriott Novy Arbat (234 номера) перенесено на 1 квартал 2014 года
SUPPLY According to the Department of Hospitality and Tourism the cumulative number of rooms in the Moscow hotel market at the end of Q3 2013 is estimated at more than 48000 rooms with the proportion of high-quality supply at about 30 or 14200 rooms
The increase in high-quality segment by the end of Q3 2013 totaled 1138 rooms resulting from the commissioning of 4 hotels in different price categories
In addition Accor will open three new hotels in November Q4 2013 in the hotel complex located at ul Bakhrushina 11 The complex of hotels includes three brands Mercure with 158 rooms (Upscale) Ibis with 190 rooms (Midscale) and Adagio with 149 rooms (Midscale)
We believe that the total supply of international grade rooms will increase by 497 by the end of 2013 It was expected that more rooms would have been available but the opening of the Marriot Noviy Arbat (234 rooms) was postponed till the Q1 2014
QUALITY MOSCOW HOTEL MARKET STRUCTURE Q3 2013 YTD
NtildeOgraveETHOacuteEcircOgraveOacuteETHAgrave EcircAgravetimesAringNtildeOgraveAcircAringIacuteIacuteUcircOtilde AtildeIcircNtildeOgraveEgraveIacuteEgraveOuml IgraveIcircNtildeEcircAcircUcirc III EcircAcirc 2013
Средняя цена за номер (ADR) в августе 2013 г составила $152 что на 5 выше уровня августа 2012 г Положительная динамика обеспечена за счет гостиниц высокой ценовой категории максимальный рост средней цены за номер по отношению к результатам за аналогичный период 2012 г продемонстрировал рынок гостиниц класса Upscale 16 Среднеценовые объекты напротив работали с более демократичными группами спроса на рынке гостиниц класса Midscale было отмечено снижение показателя ADR на 7 по сравнению с августом 2012 г
Символическое падение ставок за номер на уровне 043 и 221 было отмечено также в сегментах Upper Midscale и Luxury соответственно что в целом характерно для августа ndash наиболее laquoтуристскогоraquo месяца в году
В отношении результатов 2013 г (по данным на август) рынок качественных гостиниц показал небольшое снижение показате-ля ADR (-11) по сравнению с прошлым годом что равносиль-но стабилизации в том числе с учетом ослабления рубля
Наиболее агрессивными с точки зрения ценовых ожиданий остаются гостиницы категории Luxury показывающие на фоне общих понижающих корректировок цены небольшой рост с $375 до $376 за номер
Московские гостиницы предлагают широкий разброс цен по сегментам наиболее дорогие ndash гостиницы категории Luxury где ADR в августе 2013 г составил $315 что на 10698 выше среднего показателя по рынку качественных гостиниц
Ценовой разрыв отелей категории Luxuгy со следующим за ним сегментом внушителен средняя цена за номер в гостиницах категории Upper Upscale уже только на 2875 превысила средний показатель по рынку и составила $197 Стоимость номера в гостиницах категории Upscale сравнима со средним по рынку значением и составляет $160
Цены за номер в гостиницах класса Upper Midscale и Midscale ниже среднерыночных на 30 и 48 соответственно и составляют $105 и $79 за номер (данные за август)
AVERAGE DAILY RATE US DOLLAR (ADR) AUGUST 2013 YTD
QUALITY HOTEL MARKET TRADING Average daily rate in August 2013 estimated to $152 which is 5 higher than in August 2012 This positive dynamic was ensured by high-quality hotels the highest ADR growth was recorded in the Upscale segment ndash Up 16 compared to the same period last year Midscale market in this period was oriented to more democratic groups of demand ADR declined by 7 comparing to August 2012
The fall in ADR at the level of 043 and 221 was also recorded in the Upper Midscale and Luxury segments respectively but that is typical for the August ndash the most tourist month of the year
The results of 2013 (August YtD) showed a symbolic decrease in ADR (-11) comparing to 2012 that can be interpreted as a stabili-zation taking into account the weakening of the Ruble
The most aggressive in terms of price expectations remain Luxury market segment showing slight increase from $375 to $376 per room comparison with the general lowering of prices
Moscow hotels offer a wide range of prices by segment the most expensive ndash Luxury with ADR in August about $315 it is 10698 higher than the average for the Moscow quality market
There is an impressive gap between Luxury hotel prices and prices for the Upper Upscale segment Average daily rate for Upper Upscale is about $197 and only 2875 higher than the average for the Moscow quality market
0
50
100
150
200
250
300
350
400
2010 2011 2012 2013
Luxury Upper Upscale
Upscale Upper Midscale
Midscale Moscow average
0
10
20
30
40
50
60
70
80
2010 2011 2012 2013
Luxury Upper UpscaleUpscale Upper MidscaleMidscale Moscow average
25
MARKETBEAT Q3 2013
NtildeIumlETHIcircNtilde
Средняя годовая загрузка качественных гостиниц Москвы в августе 2013 г составила 77 что на 11 выше данного показателя за аналогичный период прошлого года
Максимально высоким спросом в Москве пользуются гостиницы категории Upper Midscale и Midscale загрузка которых в августе фиксировалась на уровне 854 и 826 соответственно
Одной из особенностей рынка гостиниц Москвы в III кв 2013 г стала высокая загруженность качественных и центрально расположенных гостиниц в августе ndash традиционно низком из-за наступления laquoсезона отпусковraquo Нетипично высокая загрузка стала следствием увеличения туристских потоков в том числе за счет проведения Универсиады в Казани добавившей laquoтранзитныхraquo клиентов московским отелям
По итогам 2013 г по состоянию на август рынок качественных гостиниц показывает рост спроса по сравнению с прошлым годом практически по всем сегментам Рост спроса простимули-рован как ростом потока ночующих посетителей в Москву так и стагнацией цен на размещение последнее обстоятельство говорит о продолжающемся периоде неопределенности
OgraveAringIacuteAumlAringIacuteOumlEgraveEgrave
Среднее значение дохода на номер (RevPAR) за август 2013 г выросло на 171 и составило $117 против $100 в 2012 г В то же время по итогам 2013 г по состоянию на август динамика RevPAR по сегментам колебалась от 84 в Midscale до -46 в отелях категории Upper Midscale
Мы полагаем что тенденции к повышению среднерыночной доходности на номер (+12 YtD) за счет гибкой ценовой политики реагирующей на изменения спроса сохранится и в ближайшей перспективе В 2014 г гостиницы вышедшие на рынок в 2013 г окажут более выраженное воздействие на рыночную ситуацию за счет чего показатели RevPAR по сегменту Luxury и особенно Upper Midscale вряд ли существен-но превзойдут текущие показатели и будут колебаться от слабоотрицательных до слабоположительных значений в начале и конце года
DEMAND The average annual occupancy of quality hotels in Moscow in August 2013 was about 77 which is 11 higher than in the same period last year
Maximum high demand in Moscow hotels was in the Upper Midscale and Midscale category with occupancy in August at the level of 854 and 826 respectively
One of the features of the market of Moscow hotels in Q3 2013 was the high occupancy of quality hotels and especially the central located hotels ndash traditionally low in August because of the holiday season Unusually high occupancy was a result of increased tourist flows including through the Universiade in Kazan which added transit clients for Moscow hotels
In general up to August 2013 (YtD) the Moscow quality hotel market shows a growth in demand comparing to 2012 in almost all segments (reduced occupancy in Upper-Midscale segment by 03 pp can be seen as an insignificant adjustment) Demand growth is stimulated by the growing stream of domestic and international visitors staying overnight in Moscow and the stagnation of prices for accommodation the last point indicates the continuing period of uncertainty in the market
TRENDS IN REVENUE Average revenue per available room (RevRAR) in August 2013 increased by 171 to $117 versus $100 in August 2012
At the same time according to the results of August 2013 RevPAR dynamics by segment ranged from 84 in the Midscale segment to -46 in the Upper Midscale hotels We believe that the tendency to stimulate the RevRAR increase which the flexible price sensible of demand change will continue in the near future In 2014 the new hotels will have a more pronounced effect on the general market situation whereby RevPAR (especially for Luxury and Upper Midscale) unlikely to surpass itrsquos current estimations and will vary from slightly negative to low positive values at the beginning and end of the year
За III квартал 2013 года в эксплуатацию было введено более 235 тыс кв м качественных складских площадей
Ставки аренды остаются стабильными и составляют в среднем $135 за кв м в год в классе А без НДС операци-онных расходов и коммунальных платежей
Цена продажи составляет $1 200- $1 300 за кв м в типовых проектах класса А
Доля вакантных площадей в складах класса А за полугодие не изменилась и составляет 1
Объем арендованных и купленных складских площадей в III составил более 350 тыс кв м
Регионы
В большинстве регионов средние ставки аренды в классе А за прошедший квартал не изменились за исключением Новосибирска и Нижнего Новгорода где ставки выросли на 4-6
Объем арендованных и купленных складских площадей в III квартале составил более 85 тыс кв м
SUMMARY Moscow
In Q3 2013 more than 235000 sq m of quality warehouse space were put into operation
Rental rates remain stable at an average of $135 per sq m per year in A Class excluding VAT operating expenses and utility
The price of sale is $1200 - $1300 per sq m in typical projects of class A
The vacancy rate in Class A warehouses for the half of the year remains unchanged at 1
The volume of leased and purchased warehouse space in Q3 amounted to 350000 sq m
Regions
The average rental rates in Class A have not changed for the quarter in most regions except Novosibirsk and Nizhny Novgorod where rates have increased by 4-6
The volume of leased and purchased warehouse space in Q3 amounted to 85000 sq m
$132
$130
$140
$105
$110
$135
$135
$135
$80
$90
$100
$110
$120
$130
$140
$150
2006 2007 2008 2009 2010 2011 2012 2013F
KEY EXPECTATIONS
STABILITY
0
200
400
600
800
1000
1200
1400
1600
1800
2007 2008 2009 2010 2011 2012 2013F 2014F
27
MARKETBEAT Q3 2013
Source Cushman amp Wakefield
Source Cushman amp Wakefield
Source Cushman amp Wakefield
Source Cushman amp Wakefield
ОСНОВНЫЕ ТЕНДЕНЦИИ Объем нового строительства за 1-III кв 2013 года в Московском регионе составил 550 тыс кв м что соответствует аналогично-му показателю прошлого года Объем арендованных и куплен-ных площадей по итогам прошедших трех кварталов составил белее 830 тыс кв м что приблизительно соответствует показа-телю прошлого года
В регионах объем нового строительства в регионах за первые три квартала составил 239 тыс кв м что на треть меньше про-шлогоднего Арендовано куплено 250 тыс кв м что больше прошлогоднего показателя на 20
ПРЕДЛОЖЕНИЕ В Московском регионе в III квартале 2013 года предложение увеличилось на 235 тыс кв м
В минувшем квартале были построены
Логопарк Север (110 тыс кв м) девелопер Каравелла
Два новых корпуса в логистическом парке Климовск (48 тыс кв м) девелопер Raven Russia
Объем нового строительства соответствует показателям преды-дущего года но темпы строительства ниже заявленных девело-перами Основная проблема mdash задержки в строительстве Боль-ше всего это касается новых девелоперов длительное время работающие на рынке компании укладываются в заявленные сроки Поэтому до конца года будет построено до 1 млн кв м складских площадей
На рынке Москвы сохраняется дефицит готовых к въезду склад-ских площадей Все проекты сдаются или продаются на этапе строительства
Чистые средние ставки аренды в течении прошедшего квартала не изменились и составляют $135 за кв м при этом разброс ставок остается высоким
В 2014 году девелоперы обещают построить около 15 млн кв м складских площадей однако по нашем оценкам из-за задер-жек при строительстве построено будет на 30 меньше
KEY TRENDS The volume of new construction for Q1-Q3 2013 in the Moscow region amounted to 550000 sq m which corresponds to the same period of last year The volume of leased and purchased land based on the results of Q1-Q3 was more than 830000 sq m which approximately relative to the previous year figure
The volume of new construction in the regions for the first three quarters amounted to 239000 sq m which is a three times less than last year indicator 250000 sq m were leased and sold which is 20 more than last year figure
SUPPLY In Q3 2013 supply in Moscow region increased by 235000 sq m
In the last quarter were put into operation
bull Logistics Park North (110000 sq m) developer is Caravella
bull Two new phases in the logistics park Klimovsk (48000 sq m) developer is Raven Russia
The volume of new construction complies with the previous year but below the pace of construction announced by developers The main problem is the delays in construction mostly it concerns new developers Experienced companies meet the announced deadlines Therefore there will be built up to one million sq m of warehouse space until the end of the year
In Moscow there is a lack of ready-to-move storage space All projects are sold or bought during the construction process
Net average rental rates have not changed during the last quarter and amounted to $135 per sq m while the spread rate remains relatively high
In 2014 developers expect to build nearly 15 mn sq m of warehouse space however according to our estimations the volume of construction will be 30 less due to the development process delays
DISTRIBUTION OF QUALITY DEVELOPMENTS IN THE PIPELINE FOR 2013-2014 (lsquo000 SQ M) РАСПРЕДЕЛЕНИЕ ПЛАНИРУЕМЫХ К ВВОДУ В 2013-2014 ГГ СКЛАДСКИХ ПЛОЩАДЕЙ В МОСКОВСКОЙ ОБЛАСТИ ТЫС КВ М
DISTRIBUTION OF WampI SPACE IN THE MOSCOW REGION (lsquo000 SQ M) РАСПРЕДЕЛЕНИЕ СКЛАДСКИХ ПЛОЩАДЕЙ В МОСКОВСКОЙ ОБЛАСТИ ТЫС КВ М
В регионах в минувшем квартале было построено только 43 тыс кв м качественных складских площадей против 117 тыс в прошлом Все новые объекты построены рядом с Санкт-Петербургом
Всего в 2014 году в регионах будет построено боле 290 тыс кв м против 410 тыс кв м в прошлом В большинстве регионов дефицита складских площадей не наблюдается Исключение составляет Санкт-Петербург Екатеринбург и Ростов-на-Дону
Чистые ставки аренды в регионах в III квартале 2013 года не изменились за исключением Новосибирска и Нижнего Новгорода где они немного выросли до $120 и $123 за кв м соответственно
Source Cushman amp Wakefield
TAKE UP lsquo000 SQ M ОБЪЕМ АРЕНДОВАННЫХ И КУПЛЕННЫХ ПЛОЩАДЕЙ ТЫС КВ М
Source Cushman amp Wakefield
During the past quarter only 43000 sq m of quality warehouse space was built In the regions as against last year fiqure (117000 sq m) All new premises were built near St Petersburg
Comparing to last year figure (410000 sq m) more than 290000 sq m is going to be built in the regions in 2014 In most regions there is no lack of warehouse spaces observed The exceptions are St Petersburg Yekaterinburg and Rostov-on-Don
Net rental rates have not changed in the regions in Q3 except Novosibirsk and Nizhny Novgorod where they rose slightly to $120 and $123 per sq m respectively
2013 PIPELINE ОБЪЕКТЫ ЗАЯВЛЕННЫЕ К СТРОИТЕЛЬСТВУ В 2013 Г
PROJECT DEVELOPER GRADE DIRECTION HIGHWAYDISTANCE FROM
MKAD KMTOTAL AREA
000 SQ MEXPECTED
DELIVERY
Infrastroy Bykovo Infrastroy А E Egorevskoe 17 6155 Q1
Infrastroy Bykovo Infrastroy А E Egorevskoe 17 6193 Q4
Klimovsk LP Raven Russia A S Simferopolskoye 23 4772 Q3
Logopark Sever Karavella A N Rogachevskoye 30 11023 Q3
PNK Chekhov II PNK group A S Simferopolskoye 50 10424 Q2
PNK Chekhov II PNK group A S Simferopolskoye 50 5531 Q4
PNK Vnukovo PNK group A SW Kievskoe 19 10568 Q1
South Gate IP Radius group A S Kashirskoye 30 2070 Q2
South Gate IP Radius group A S Kashirskoye 30 3000 Q4
СПРОС В Московском регионе за I-III кварталах 2013 г было арендовано и куплено более 850 тыс кв м качественных складских площадей из них 235 тыс в III квартале что соответствует прошлогодним показателям
Наиболее крупные сделки в минувшем квартале
Автомобильный концерн Volkswagen купил 50 тыс кв м в складском комплексе PNK Чехов 2 девелопер PNK Group
Компания Верный купила 43 тыс кв м в складском комплексе PNK Север девелопер PNK Group
Автомобильный концерн General Motors арендовала 40 тыс кв м в индустриальном комплексе Южные врата
Следует отметить что большое количество качественных складских площадей было арендовано и куплено в III квартале 2013 г производственными компаниями при этом логистиче-ские компании и дистрибьюторы наоборот купили и арендова-ли меньшее количество площадей
Так же следует отметить увеличение доли продаж в III квартале до 42 против 14 во II квартале в структуре поглощения
На региональных рынках за минувший квартал было арендовано и куплено более 85 тыс кв м всего с начала года более 250 тыс кв м что почти на 20 выше аналогичного показателя прошлого года и на 5 среднего значения за последние 5 лет Этот показатель во многом обусловлен самой крупной сделкой за всю историю рынка складской недвижимости Санкт-Петербурга по предварительной продаже 43 тыс кв м компанией PNK Group продуктовой сети laquoВерныйraquo в складском комплексе PNK КАД
Сделки на такие большие площади позволяют девелоперу возобновить строительство в регионах но за период с IV кв 2012 по III квартале 2013 г Было заключено только 4 сделки более 25 тыс кв м Большинство сделок в регионах заключает-ся на складские площади до 10 тыс кв м
STRUCTURE OF DEMAND MOSCOW СТРУКТУРА СПРОСА МОСКВА
DEMAND In the Moscow region in Q1-Q3 2013 more than 850000 sq m were rented and purchased talking about quality warehouse space The Q3 indicator is 235000 sq m which is the same to the last years performance
The largest deals in the last quarter
bull Car manufacturer group Volkswagen bought 50000 sq m in a warehouse complex PNK Chekhov 2 developer is PNK Group
bull The Verniy company bought 43000 sq m in a warehouse complex PNK North developer is PNK Group
bull Automobile сar manufacturer General Motors leased 40000 sq m in the industrial complex South Gate
It should be noted that a large number of quality warehouse space was leased and purchased in the Q3 2013 by manufacturing companies while logistics companies and distributors on the contrary have bought and rented a smaller amount of warehouse space
It should be also mentioned the increasing sales in Q3 up to 42 comparing to 14 in the previous quarter for the both leased and bought premises
At the regional markets for the last quarter it was rented and purchased more than 85000 sq m Since of the beginning of the year more than 250000 sq m were rented and purchased which is almost 20 higher than last year and 5 higher than the average number for the last 5 years This indicator is largely due to the largest deal in the history of the warehouse property market of St Petersburg on the pre-sale of 43000 sq m by PNK Group to the food supplier Verniy in the warehouse complex PNK KAD
Such large deals allow developer to resume construction in the regions However between Q4 2012 and Q3 2013 it was only 4 deals amounted more than 25000 sq m made Most of the deals in the region are for warehouse space up to 10000 sq m
ТЕНДЕНЦИИ С начала прошлого года на рынок складской недвижимости остается стабильным Ежегодный спрос в Московском регионе составляет около 1 млн кв м в год Средние ставки аренды в классе А составляют $135 за кв м в год без НДС операцион-ных расходов и коммунальных платежей доля вакантных площадей сохраняется на уровне 1 Строительство большин-ства новых складских объектов будет начинаться только после заключения предварительных договоров аренды и продажи
Изменение ситуации в ближайшей перспективе ожидать не стоит В условиях низкого роста экономики страны начинать спекулятивное строительство большой риск повторения ситуации 2008 года поэтому предложение будет подстраивать-ся под спрос
На региональных рынках продолжится тенденция увеличения дефицита готовых к въезду складских площадей Не смотря на высокой спрос на складские объекты в регионах девелоперам не удается сформировать достаточных портфель предваритель-ных договоров аренды для начала строительства Исключение составляет Санкт-Петербург Свердловская область юг России где спрос или условия рынка обеспечили девелоперам формирование такого портфеля Мы прогнозируем что до конца года в регионах будет реализовано более 300 тыс кв м складских площадей
Source Cushman amp Wakefield
STRUCTURE OF DEMAND REGIONS СТРУКТУРА СПРОСА РЕГИОНЫ
TRENDS Since the beginning of the last year the warehouse market has remained stable Annual demand in the Moscow region is about one mn sq m per year average rental rates for Class A is $135 per sq m per year excluding VAT operating expenses and utility costs the vacancy rate remains at 1 Construction of the majority of new storage facilities will start only after the preliminary lease or sale contract signing up
In the nearest future the situation would remain the same It is the huge risk to start the new speculative construction in a low-growth economic situation as it is the threaten to repeat the 2008 year crisis the supply will adapt to the demand
The trend of growing deficit of ready-to-move warehouse spaces continues at the regional markets In spite of the high demand for storage facilities in the regions for developers it is still complicated to form a sufficient portfolio of preliminary agreements for the start of construction Exceptions are St Petersburg Sverdlovsk region and south Russia where the demand or market conditions provided developers with the opportunity to form such a portfolio We predict that by the end of the year in the regions will be sold over 300000 sq m of warehouse space
WampI MARKET IN RUSSIA ETHUcircIacuteIcircEcirc NtildeEcircEumlAgraveAumlNtildeEcircEgraveOtilde IumlIcircIgraveAringUgraveAringIacuteEgraveEacute Acirc ETHIcircNtildeNtildeEgraveEgrave
VACANCY RATE (EOY) Paris (Ile de France) 89 81 99 126 102 84 81 89 804
Budapest 59 172 173 188 195 208 194 217 2283
Warsaw 89 74 112 171 194 173 146 1621 1592
Madrid 55 38 37 55 73 84 93 95 972
TAKE UP 000 SQ MParis (Ile de France) 1 005 700 640 601 814 837 563 208 58
Budapest 152 229 308 280 210 327 355 31 21
Warsaw 260 445 556 216 451 743 483 183 112
Madrid 1 225 918 630 325 390 270 225 60 47
2013
36
MARKETBEAT Q3 2013
RESEARCH DEPARTMENT IcircOgraveAumlAringEuml EgraveNtildeNtildeEumlAringAumlIcircAcircAgraveIacuteEgraveEacute
Further information and copies of this report are available from Ellina Krylova
EllinaKrylovaeurcushwakecom
The information provided in this report is intended for informational purposes only and should not be relied on by any party without further independent verification Classifications of individual buildings are reviewed on a continuing basis and are subject to change The standards used in this process are consistent with those used by Moscow Research Forum and in the United States by the Society of Industrial and Office Realtors (SIOR) and BOMA International Reproduction of this report in whole or part is permitted only with written consent of Cushman amp Wakefield Data from this report may be cited with proper acknowledgment given
copy 2013 Cushman amp Wakefield All rights reserved
MORE INFORMATION AND CONTACTS ARE AVAILABLE ON WWWMARKETBEATRU EgraveIacuteOcircIcircETHIgraveAgraveOumlEgraveszlig IcircAacute IcircOgraveAumlAringEumlAring EgraveNtildeNtildeEumlAringAumlIcircAcircAgraveIacuteEgraveEacute Egrave IumlOacuteAacuteEumlEgraveEcircAgraveOumlEgraveEgrave AumlIcircNtildeOgraveOacuteIumlIacuteUcirc IacuteAgrave WWWMARKETBEATRU
DENIS SOKOLOV PARTNER RESEARCH DIRECTOR DenisSokoloveurcushwakecom
LADA BELAYCHUK ASSOCIATE DIRECTOR DEPUTY RESEARCH DIRECTOR LadaBelaychukeurcushwakecom
MAXIM ILYIN CONSULTANT CAPITAL MARKETS Maximilyineurcushwakecom
ALEXANDER KUNTSEVICH ANALYST WampI PROJECT MANAGEMENT AlexanerKuntsevicheurcushwakecom
TATYANA DIVINA SENIOR ANALYST
TatyanaDivinaeurcushwakecom
wwwcushmanwakefieldcom
8
MARKETBEAT Q3 2013
IcircNtildeIacuteIcircAcircIacuteUcircAring IumlIcircEumlIcircAEligAringIacuteEgraveszlig В регионах доля качественных проектов коммерческой недви-жимости в настоящее время крайне мала инвесторы в большей степени заинтересованы в laquoгородах-миллионникахraquo где рынок коммерческой недвижимости наиболее развит
В III квартале 2013 г основной объем инвестиций пришелся на офисную недвижимость Объем инвестиций в этом сегменте составил 8443 млн долларов США Среди крупных сделок можно отметить продажу офисного комплекса White Gardens Сумма сделки является одной и самых крупных на рынке за последнее время на рынке офисной недвижимости и составила около 740 млн долларов США
Объем инвестиционных сделок на рынке торговой недвижимо-сти в III квартале 2013 г составил 250 млн долларов США Од-нако если все запланированные сделки будут завершены то 2013 год станет рекордным по объему инвестиций в торговую недвижимость
Традиционно на складскую и индустриальную недвижимость приходится меньше всего совершенных инвестиционных сде-лок Так в прошедшем квартале на долю складской и индустри-альной недвижимости пришлось инвестиций на сумму около 332 млн долларов США
Совокупный объем инвестиций в коммерческую недвижимость за три квартала 2013 г составил 575 млрд долларов США По сравнению с наиболее развитыми рынками Лондона и Парижа объем инвестиций в Москве ниже на 70 чем за тот же период в Лондоне и на 20 ниже чем в Париже
NtildeOgraveAgraveAcircEcircEgrave EcircAgraveIumlEgraveOgraveAgraveEumlEgraveCcedilAgraveOumlEgraveEgrave Ставка капитализации на Прайм объекты в Москве составляют 85 для офисов 90 для торговых центров и 110 для склад-ской недвижимости Это выше среднеевропейского уровня на 250 базисных пунктов и на 450 бп выше наиболее развитых европейских рынков ndash Лондона и Парижа
TOP 30 INVESTMENT MARKETS ТОП-30 ИНВЕСТИЦИОННЫХ РЫНКОВ
MOSCOW PRIME CAPITALIZATION RATES СТАВКИ КАПИТАЛИЗАЦИИ laquoПРАЙМraquo В МОСКВЕ
Source Cushman amp Wakefield
MAIN DEVELOPMENTS In regions the share of quality real estate projects is small and investors are much more interested in economically developed cities with population of over a million where the real estate market is more matured
In the third quarter of 2013 the majority of investments came to the office segment with the volume of $8443 million Among the biggest deals in the market it worth mentioning White Gardens business centre realization (the amount of transaction is one of the largest in the office market for recent years and equals to $740 million
Retail was the less attractive sector for investors in Q3 and the volume of investments amounted to $250 million However if all planned deals are completed by the end of the year then 2013 will be the record-breaking year regarding the investment volume
Traditionally investments in warehouse and industrial real estate sectors are less popular in Russia and the number of completed deals is rather small here Thus the investments in warehouse and industrial sectors totaled about $332 million for the latest quarter
The total volume of investments in Q1-Q3 2013 reached the number of $575 billion Comparing the most developed markets of London and Paris the level of investments in Moscow is 70 lower than London and 20 lower than Paris for the same period of time
CAPITALISATION RATES The current yields for prime real estate projects in Moscow are 85 for offices 90 for retail and 110 for warehouse and industrial projects This rate is higher than average yields in Europe on 250 bps and on 450 bps higher of most developed investment markets of London and Paris
1 NYC Metro 1922 Tokyo 1543 London Metro 1404 LA Metro 1195 DC Metro 1086 SF Metro 827 Hong Kong 718 Paris 609 Singapore 4710 Sydney 4611 Dallas 4512 Atlanta 4413 Houston 4314 Toronto 4215 Boston 4016 Moscow 3917 Chicago 3918 Osaka 3319 Seoul 3220 So Fla 3221 Seattle 3122 Berlin-Brandenburg 3123 Stockholm 2824 Rhine-Ruhr 2825 Shanghai 2526 FrankfurtRhine-Main 2527 Melbourne 2528 Munich 2429 Phoenix 2430 Brisbane 24
6
8
10
12
14
16
18
2004
2005
2006
2007
2008
2009
2010
2011
2012
Q1
13
Q2
13
Q3
13
CBR refinancing rate Office primeShopping center prime WampI Prime
9
MARKETBEAT Q3 2013
INTERACTIVE CHARTS I EgraveIacuteOgraveAringETHAgraveEcircOgraveEgraveAcircIacuteUcircAring AtildeETHAgraveOcircEgraveEcircEgrave
RUSSIAN PROPERTY INVESTMENT MARKET I EgraveIacuteAcircAringNtildeOgraveEgraveOumlEgraveEgrave Acirc EcircIcircIgraveIgraveAringETHtimesAringNtildeEcircOacuteTHORN IacuteAringAumlAcircEgraveAEligEgraveIgraveIcircNtildeOgraveUuml ETHIcircNtildeNtildeEgraveEgrave
Q3 2013 MoscowRUSSIA A Cushman amp Wakefield Research Publication
RETAIL
Source Rosstat
RETAIL TRADE TURNOVER AND REAL DISPOSABLE INCOME RUSSIA YOY РОЗНИЧНЫЙ ТОВАРООБОРОТ И РЕАЛЬНЫЕ РАСПОЛАГАЕМЫЕ ДОХОДЫ РОССИЯ
EcircETHAgraveOgraveEcircEgraveEacute IcircAacuteCcedilIcircETH В целом по России объемы нового строительства торговых площадей так же высоки как и в прошлом 2012 г В течение трех кварталов 2013 г в 22 российских городах появились новые торговые комплексы Некоторое снижение темпов строительства в Москве в 2012-2013 гг будет компенсировано ожидаемыми масштабными открытиями в 2014 г Посещае-мость торговых центров в Москве находится на высоком уровне потребительские ожидания стабильны В связи с дефицитом предложения в торговых центрах Москвы ритейлеры активно изучают российские регионы В 2013 г как и в течение 2012 г ставки аренды были стабильны
CONSUMER CONFIDENCE INDEX ИНДЕКС ПОТРЕБИТЕЛЬСКОГО ОЖИДАНИЯ
IumlIcircOgraveETHAringAacuteEgraveOgraveAringEumlEgrave Реальные располагаемые денежные доходы населения России (доходы за вычетом обязательных платежей скорректирован-ные на индекс потребительских цен) по оценке Росстата в августе 2013 г выросли на 21 по сравнению с августом 2012 г в январе-августе 2013 г выросли на 41 в сравнении с аналогичным периодом прошлого года Среднемесячная зарплата в России в августе 2013 г составила 29 020 рублей и выросла на 128 по сравнению с августом 2012 года
BRIEF SUMMARY In general the volume of new construction of retail spaces in Russia can be described as high as it used to be in the past 2012 New retail complexes have been constructed and delivered for the past 3 quarters of 2013 in 22 Russian cities There is a reduction in the сconstruction of new quality retail premises in Moscow for 2012-2013 which is going to be compensated by large-scale and expected projects in 2014 Attendance of Moscow shopping centers is at the high level consumer expectations are stable Due to the shortage of supply in the shopping malls retailers actively seek for new spaces in Russian regions During the 2013 rental rents remains stable as it was in 2012
CONSUMERS According to Rosstat real income of the Russian population grew up by 21 comparing to August 2012 Moreover it increased by 41 in January-August 2013 relatively to the same period of time last year The average monthly salary was 29020 rubles in August 2013 and increased by 128 comparing to the past year
Total retail trade growth for January-May was 38
Source Rosstat
VACANCY RATE ДОЛЯ СВОБОДНЫХ ПЛОЩАДЕЙ (Prime shopping centers Moscow) | (действующие прайм ТЦ Москва) 12
PRIME RENTAL RATE INDICATOR | ПРАЙМ ИНДИКАТОР АРЕНДНЫХ СТАВОК (Prime shopping center retail gallery Moscow) | (галереи в прайм ТЦ Москва) US$ 3800
1642 mn sq m 572 quality projects
TOTAL QUALITY STOCK IN RUSSIA ОБЩЕЕ КОЛИЧЕСТВО КАЧЕСТВЕННЫХ ТОРГОВЫХ ПЛОЩАДЕЙ В РОССИИ
KEY EXPECTATIONS
STABILITY
-10
-5
0
5
10
15
20
2007 2008 2009 2010 2011 2012 F2013 F2014
Retail trade turnover growth Real personal disposable income growth
RETAILERS Retailer demand has remained relatively strong in Russia with limited new market entrants but existing retailers looking to expand and experiment with new format types Vacancy rates in prime shopping centres in Moscow are at extremely low levels with occupiers now transferring interest to the high street as shopping centre space cannot meet the demand
Those brands already present in Russia are actively looking to expand into the regions
NEWCOMER BRANDS WITH DEVELOPMENT PLANS IN RUSSIA НОВЫЕ ПЛАНЫ РАЗВИТИЯ РИТЕЙЛЕРОВ В РОССИИ
Source official websites and other media
REGION CITY NEWCOMERS 2013 COMING SOONSouthern Volgograd Leroy Merlin
Armavir LentaSochi Bata Louis Vuitton StarbucksTaganrog LentaKrasnodar Barker Bata StarbucksRostov-on-Don Starbucks
ETHEgraveOgraveAringEacuteEumlAringETHUcirc Спрос на качественные торговые помещения со стороны ритейлеров высокий Ритейлеры продолжают экспериментиро-вать с новыми форматами В связи с дефицитом предложения в торговых центрах Москвы ритейлеры обращают все больше внимания на торговые улицы
Продолжается активная экспансия во все регионы России
GLOBAL RETAILERS COMING TO RUSSIA НОВЫЕ МЕЖДУНАРОДНЫЕ РИТЕЙЛЕРЫ ПЛАНИРУЮЩИЕ НАЧАТЬ РАБОТУ В РОСИИ
NEW GLOBAL RETAILERS IN 2013 НОВЫЕ МЕЖДУНАРОДНЫЕ РИТЕЙЛЕРЫ В РОССИИ 2013
CushmanampWakefield Research quarterly monitoring of 9 quality shopping centers (total GLA - 05 mn sq m) These shopping centers have been opened more than one year ago and have a clear catchment area
OgraveIcircETHAtildeIcircAcircUcircAring IumlIcircIgraveAringUgraveAringIacuteEgraveszlig В III квартале посещаемость торговых центров в Москве находилась на более высоком уровне чем в предыдущие годы в этот период Доля покупателей (количество людей совершив-ших покупки относительно общего количества посетителей) снизилась до 308
Уровень свободных помещений в качественных торговых центрах находится на предельно низком уровне Небольшой рост в III квартале 2013 года (на 08 пп) связан с ротацией арендаторов в одном из торговых центров (один из этажей торгового центра в ближайшее время будет полностью занят крупным арендатором которые в настоящее время проводит ремонт помещения)
В целом в Москве продолжает наблюдаться дефицит предложе-ния в качественных торговых центрах
ДОЛЯ laquoУСПЕШНЫХ ПОКУПАТЕЛЕЙraquo ldquoSUCCESSFUL SHOPPERSrdquo
FOOTFALL ПОСЕЩАЕМОСТЬ ТОРГОВЫХ ЦЕНТРОВ
Source Cushman amp Wakefield
Source Cushman amp Wakefield
Source Cushman amp Wakefield
CushmanampWakefield Research quarterly monitoring of 9 quality shopping centers (total GLA - 05 mn sq m) These shopping centers have been opened more than one year ago and have a clear public contact area Number of successful shoppers remained stable (share of shoppers who make purchases out of all visitors of the monitored shopping centers)
The total number of retail outlets in the observed sample is 865 (brands in shopping galleries without operators of restaurant zones and without service companies like dry cleaning banks etc) These retail outlets are filled with 552 unique brands
VACANCY RATE УРОВЕНЬ СВОБОДНЫХ ПОМЕЩЕНИЙ
Petrovsky Passage
RETAIL SPACE
In Q3 the visiting rate of the retail centers was at the higher level than it used to be in the last year Buyers share (amount of people who made a purchase compared to total number of visitors) decreased with the number of 308 The level of vacant spaces in the quality retail centers is at the lowest level The small increase in the third quarter (08 points) is associated with the rotation of tenants in one of the shopping centers (one of retail centerrsquos floors is going to be fully occupied by the leaseholder who is currently conducting repair facilities)
In general there is a lack of supply in the quality retail centers in Moscow
Announced developers plans CW Forecast New construction YTD
НОВОЕ СТРОИТЕЛЬСТВО В III квартале в России было введено в эксплуатацию 15 новых торговых центров общей торговой площадью 292 750 кв м География нового строительства ndash от Иркутска и Ангарска до Сочи В основном стоятся торговые центры (75 всех новых качественных торговых площадей) также торговые площади открываются в многофункциональных комплексах Средний размер новых торговых центров уменьшается в 2013 году он составляет 26 тыс кв м что на 30 меньше чем в 2011 году
В III квартале крупнейшим открытым торговым объектом стал торгово-развлекательный центр Жемчужная Плаза (GLA 48 тыс кв м) в Санкт-Петербурге построенный в рамках комплексной застройки микрорайона Балтийская Жемчужина
В III квартале в Москве был открыт один новый торгово-развлекательный центр Райкин Плаза Также были открыты но-вые фазы комплекса Отрада В Москве новые качественные торговые площади строятся в разных форматах ndash торгово-развлекательные центры (Рио Райкин плаза) аутлет-центры (Внуково и Fashion House) многофункциональные комплексы (Белая Площадь Эволюция) До конца 2013 г в Московском регионе (г Павловский Посад) планируется открытие ритейл парка Белла Вита (GLA 36 тыс кв м)
NEW CONSTRUCTION 2013 RUSSIAQUALITY RETAIL STORES НОВОЕ СТРОИТЕЛЬСТВО В 2013 ГОДУ РОССИЯ КАЧЕСТВЕННЫЕ ТОРГОВЫЕ ОБЪЕКТЫ
Source Cushman amp Wakefield
QUALITY RETAIL CONSTRUCTION rsquo000 SQ M RUSSIA СТРОИТЕЛЬСТВО КАЧЕСТВЕННЫХ ТОРГОВЫХ ПЛОЩАДЕЙ ТЫС КВ М РОССИЯ
NEW CONSTRUCTION In Q3 15 new retail centers were delivered in Russia with a total area of 292750 sq m The geography of new construction is located from Irkutsk and Angarsk to Sochi The majority of new premises are located in shopping centers (75 of new quality retail space) besides retail space in multifunctional complexes Average area of newly constructed shopping centers is decreasing in 2013 it was about 26000 sq m which is 30 lower than in was in 2011
In the third quarter retail and entertainment center Pearl Plaza (GLA 48000 sq m) was awarded the name of the largest retail project in St Petersburg It was built as a part of the complex development in the Baltic Pearl micro region
Besides the new shopping and entertainment mall Raykin Plaza was delivered in the Q3 Also new phases of the Otrada complex were delivered New quality retail spaces are developed in various formats in Moscow ndash shopping and entertainment centers (Rio Raykin Plaza) outlet-centers (Vnukovo and Fashion House) multifunctional complexes (White Square Evolution) Till the end of 2013 it is planned to open retail park Bella Vita (GLA 36000 sq m) in the Moscow region (Pavlovskiy Posad city)
Standard lease terms for gallery tenants are between 3-5 years break options are rare For anchor tenants (including fashion anchors) lease terms are up to 20 -25 years and break options are becoming popular
Rents are typically payable monthly in advance Turnover percentage rents are increasingly seen in shopping centres Rental rates are generally calculated in USD Euricirc or commercial units are used In less quality shopping centres rental rates are calculated in RUR
Annual indexation is typical between 3-10 or at a level of USD EU CPI The practice of premium key money payments is seldom seen in Russia Rent reviews are rare on the market
Service ChargesIcirciumlaringethagraveoumlegraveicirciacuteiacuteucircaring iumleumlagraveogravearingaeligegrave
Service charge is payable by tenants at either an ldquoopen bookrdquo basis or more common as a fixed cost Utilities payments are charged on consumption Building insurance is normally charged back to tenant via service charge
Local property taxes are not payed separately they are generally included in the service charges Iacuteagraveeumlicircatilde iacuteagrave iacutearingaumlacircegraveaeligegraveigraveicircntildeograveuuml icircaacuteucircdivideiacuteicirc acirceumlthorndivideagravearingograventildeyuml acirc icirciumlaringethagraveoumlegraveicirciacuteiacuteucircaring iumleumlagraveogravearingaeligegrave
Other costsAumlethoacuteatildeegravearing iumleumlagraveogravearingaeligegrave
EcircIcircIgraveIgraveAringETHtimesAringNtildeEcircEgraveAring OacuteNtildeEumlIcircAcircEgraveszlig Acirc OgraveIcircETHAtildeIcircAcircUcircOtilde OumlAringIacuteOgraveETHAgraveOtilde Ставки аренды для помещений в торговых галереях качествен-ных торговых центров в Москве находятся в диапазоне от 500 до 4 000 долларов США (за кв м в год без НДС и других платежей) В течение трех кварталов 2013 и всего прошедшего 2012 года ставки аренды в торговых центрах были стабильны Прайм ритейл индикатор в Москве составляет 3 800 долларов США (за кв м в год без НДС и других платежей) Однако в 2013 году наметилась тенденция к повышению ставок аренды в лучших торговых центрах поэтому рост ставок на лучшие помещения может быть выше 5 (текущий консервативный прогноз)
Вне Москвы ставки аренды в торговых центрах в среднем на 30-60 ниже в зависимости от региона
Дополнительно к ставке аренды ритейлеры платят сервисные сборы за обслуживание (150-250 долларов США за кв м в год для помещений размером менее 500 кв м) за маркетинг (10-25 долларов США за кв м в год) также иногда бывают и другие дополнительные платежи
Source Cushman amp Wakefield
Source Cushman amp Wakefield
PRIME RETAIL INDICATOR MOSCOW ПРАЙМ РИТЕЙЛ ИНДИКАТОР В ТОРГОВЫХ ЦЕНТРАХ МОСКВА
Prime retail indicatormdashbase asking rental rate for the 100-200 sq m gallery unit at the ground floor of the prime shopping centers US$ per sq m per annum triple net
INDICATIVE RENTAL RATES IN QUALITY SHOPPING CENTER RETAIL GALLERIES MOSCOW СРЕДНИЕ АРЕНДНЫЕ СТАВКИ В ГАЛЕРЕЕ КАЧЕСТВЕННЫХ ТОРГОВЫХ ЦЕНТРОВ МОСКВА
COMMERCIAL RATES IN SHOPPING MALLS Moscow retail gallery rental rates are in the range of US$ 500- 4000 (per sq m per year before VAT and other expenses) depending on the size of the retail unit and the type of retailer Throughout Q1-Q3 and the whole of 2012 rental rates were stable across all sub-sectors
Moscowrsquos prime retail indicator is US$ 3800 per sq m per annum as a base rate However a tendency towards rate increases was observed in 2013 and near future growth may be higher than 5 (our current conservative estimate)
In other cities rental rates in shopping malls are typically 30 to 60 below Moscow levels
Additionally among other payments there are operational expenses (US$ 150-250 per sq m annually for units smaller than 500 sq m) marketing (US$ 10-25 per sq m annually) and others depending on the project
QUALITY RETAIL LEASE STRUCTURE СТРУКТУРА ДОГОВОРОВ АРЕНДЫ В КАЧЕСТВЕННЫХ ТОРГОВЫХ ПОМЕЩЕНИЯХ
ANCHORS
lt100 100 - 300 300 - 1200 1200 - 3500 3500-7000
Food court $1800-$2000
Kiosks $5000-$8000
Restaurant $600-$1000 $700
Clothing $1 600 $1 200 $700 $400
Shoes $2 200 $1 700 $1 200 $800
White and Brown $500
Supermarket $500-$600
Hypermarket $250-$450
Cinema $250-$320
BUSINESSGLA SQ M
RETAIL GALLERY MINI ANCHORS
Source Cushman amp Wakefield
15
MARKETBEAT Q3 2013
ТОРГОВЫЕ УЛИЦЫ На центральных торговых улицах свободно (предлагается в аренду или готовится к открытию) около 5 имеющихся поме-щений Ставки аренды в торговых коридорах стабильны В по-следние несколько лет есть тенденция к увеличению сроков аренды если еще три года назад договоры были чаще всего краткосрочные (на 11 месяцев) то сейчас трехлетние договора аренды становятся все более распространенными
Анализ торговых помещений на наиболее проходимых торго-вых улицах в центре города показывает что самыми популяр-ными категориями арендаторов являются предприятия питания (кафе рестораны) и магазины одежды и обуви которые занима-ют 29 и 21 всех помещений на этих улицах соответственно Значимыми арендаторами являются компании предлагающие услуги (спа парикмахерские медицинские услуги предприятия связи салоны фотографии юридические услуги) ndash они занимают 10 всех торговых помещений на главных улицах центра горо-да По 5 всех площадей занимают отделения банков ювелир-ные салоны магазины косметики и аксессуаров
Source Cushman amp Wakefield
HIGH STREETS Nearly 5 of the existing premises are freely available (are offered for lease or being prepared for delivery) in the central high streets Rental rates in the trade corridors are stable There is a tendency for increasing lease terms in the last few years As an example three years ago contracts used to be short-term mostly (11 months) and now agreements for the 3 and 5 years period become more and more widespread
The analysis of the retail spaces on the most passable areas in the city centre shows that the most popular categories of tenants are catering (cafe restaurants) and clothing shops They occupy 29 and 21 of all premises respectively Significant tenants are those who offers the following services spa hairdressers medical services communications companies photography and legal services ndash all of them occupy 10 of retail premises on the main streets of the city banks jewelry stores cosmetic stores and accessories occupy 5
AVERAGE RENTAL RATES ON HIGH STREETS IN MOSCOW СРЕДНИЕ АРЕНДНЫЕ СТАВКИ В ТОРГОВЫХ КОРИДОРАХ МОСКВА
HIGH STREET TENANT MIX MOSCOW Q3 2013 | СТРУКТУРА АРЕНДАТОРОВ В ТОРГОВЫХ КОРИДОРАХ МОСКВА III КВ 2013
Food Restaurants Cafes Fashion and footwareServices Bank ExchangeAccessories Optics Watches JewelryCosmetics Pharmacy Perfumery Other
HIGH STREET RENTAL RATES MOSCOW АРЕНДНЫЕ СТАВКИ В ТОРГОВЫХ КОРИДОРАХ МОСКВА
Data of the following trade corridors was used to conduct the analysis Tverskaya Petrovka-Stoleshnikov-Kuznetsky Most Nikolskaya Pyatnytskaya Pokrovka-Maroseyka In total these trade corridors located 710 outlets
US$ per sq m per annum triple net Aumlicirceumleumlagraveethucirc NtildeOslashAgrave ccedilagrave ecircacircigrave acirc atildeicircauml aacuteagraveccedilicircacircagraveyuml ntildeograveagraveacircecircagrave agraveetharingiacuteaumlucirc
OgraveIcircETHAtildeIcircAcircUcircAring OacuteEumlEgraveOumlUcirc mdash IumlAringOslashAringOtildeIcircAumlIacuteUcircAring CcedilIcircIacuteUcirc Важнейшим событием для торговых улиц стала программа развития пешеходных зон в Москве активно поддерживаемая Правительством города На тех улицах где уже отменили движение транспорта (в первую очередь Большая Дмитровка) происходит смена потоков посетителей (от пассажиров к пешеходам) Пешеходные улицы имеют огромный потенциал с точки зрения торговли и уже сейчас ритейлеры проявляют большой интерес к пешеходным районам Расширение пешеходных районов значительно увечит предложение качественных торговых помещений на улицах в Москве
HIGH STREETS mdash PEDESTRIAN AREA The most important event for the high streets became the development of pedestrian zones in Moscow which is actively supported by the city government There is a change of visitor flows (from passengers to pedestrians) on those streets where the driving was cancelled (it concerns Bolshaya Dmitrovka street first of all) There is a huge potential for retail activity talking about pedestrian streets and retailers show great interest in developing of those areas The expansion of pedestrian zones will significantly increase the supply of the quality retail premises in Moscow
HIGH STREETS mdash PEDESTRIAN AREA ТОРГОВЫЕ УЛИЦЫ mdash ПЕШЕХОДНЫЕ ЗОНЫ
With vehicular traffic restriction | Oacuteeumlegraveoumlucirc atildeaumlaring icircatildeethagraveiacuteegravedividearingiacuteicirc aumlacircegraveaeligaringiacuteegravearing ograveethagraveiacutentildeiumlicircethograveagrave
Opened for vehicles | Oacuteeumlegraveoumlucirc atildeaumlaring icircograveecircethucircograveicirc aumlacircegraveaeligaringiacuteegravearing ograveethagraveiacutentildeiumlicircethograveagrave
Q3 2013 MoscowRUSSIA A Cushman amp Wakefield Research Publication
OFFICE MARKET
IcircAacuteCcedilIcircETH ETHUcircIacuteEcircAgrave В III квартале 2013 г рынок продолжает оставаться активным спрос и предложение сбалансированы ставки аренды стабильны
Тенденция ослабления рынка офисной недвижимости отмечен-ная впервые в предыдущем квартале подкрепляется новыми фактами
Продолжилось снижение общего объема заключаемых сделок аренды и покупки в III квартале общий объем заключенных сделок составил 385 836 кв м что на 20 ниже среднего уровня 2011-2012 гг
Даже небольшой рост объема вывода на рынок новых помеще-ний приводит к увеличению доли свободных помещений За счет одного крупного объекта (Башня Меркурий в Москва-Сити арендуемой площадью 87 547 кв м) объемы ввода в эксплуатацию офисных площадей класса А в III квартале увеличились вдвое относительно средних объемов строительст-ва последних трех лет В результате уровень свободных помещений в классе А в среднем по Москве увеличился на 35 пп а в районе Москва-Сити mdash на 156 пп
Средняя ставка аренды не изменяется в течение последних трех кварталов в то время как инфляции в России за январь-май 2013 превысила уровень 7
ABSORPTION AND NEW CONSTRUCTION CLASSES A AND B (MN SQ M)
OVERVIEW The third quarter of the year saw the office market remain healthy with steady levels of demand Rents held firm There is a tendency of weakening signs in the office market which was noted for the first time in the previous quarter Now it is supported by some new facts
Overall demand level has continued to decrease Q3 take-up is 385836 sq m which is 20 less than the average take-up level for 2011-2012
Even moderate growth of new office space affects the vacancy rate In Q3 the delivery of Mercury Tower in Moscow City submarket (87547 sq m of office rentable area) doubled the quarterly Class A new construction volume (compared to the average number during the last three years) As a result the level of vacant space has increased by 35 percentage points in the Moscow Class A sector Talking about Moscow City submarket the volume of vacant space has increased by 156 points
Rental rates remain unchanged the CPI is above 7 (January-May 2013 data)
Source Cushman amp Wakefield
TOTAL STOCK MOSCOW | ОБЩИЙ ОБЪЕМ ПРЕДЛОЖЕНИЯ В МОСКВЕ 1360 mn sq m
VACANCY RATE | ДОЛЯ СВОБОДНЫХ ПЛОЩАДЕЙ 128
US$ 860 AVERAGE RENTAL RATE CLASS A | СРЕДНЯЯ АРЕНДНАЯ СТАВКА КЛАСС А
Q1-Q3 DEMAND (TAKE-UP) | ОБЪЕМ СДЕЛОК АРЕНДЫ И ПРОДАЖИ В 1-III КВ 2013 1190138 sq m
Q1-Q3 2013 NEW CONSTRUCTION | НОВОЕ СТРОИТЕЛЬСТВО В 1-III КВ 2013 594009 sq m
SUPPLY By the end of Q3 2013 Moscow had 136 mn sq m of quality office space Nine new office buildings were completed with a rentable area of 244587 sq m in Q3 New construction volume remains moderate
Nearly 50 of new office space delivered in 2013 is located in the Moscow suburbs (outside TTR) while the demand is drawn towards the city center So the suburbs are in danger of oversupply during the last four quarters the vacancy rate in suburban submarkets has increased by 58 percentage points from 11 in Q3 2013 to 168 in Q3 2013
In the Central and Prime business areas (with the exception of Moscow City submarket) the vacancy rate is stable while in several central submarkets (such as Tagansky Frunzensky Novoslobodsky) the availability is decreasing
After the recent delivery of Mercury Tower with 87547 sq m of office rentable space Moscow City availability has doubled Hence the Moscow City vacancy rate grew by 156 percentage points up to 327
Altogether there are 154 mn sq m of available office premises in existing buildings and 35 mn sq m is under speculative construction
IumlETHAringAumlEumlIcircAEligAringIacuteEgraveAring По состоянию на конец III квартала 2013 года в Москве насчи-тывалось 136 млн кв м качественных офисов В III квартале было введено в эксплуатацию 9 офисных зданий общей арен-дуемой площадью 244 587 кв м Объемы нового строительства продолжают оставаться умеренными
Около 50 новых офисных площадей вышедших на рынок в 2013 году находятся в удаленных от центра города районах (за пределами ТТК) В то же время спрос продолжает тяготеть к центру города В результате на окраинах города наблюдается тенденция к росту избыточности предложения Так в течение 4-х последних кварталов уровень свободных помещений в рай-онах за пределам ТТК увеличился на 58 пп с 11 (III кв 2012) до 168 (III кв 2013) Внутри ТТК уровень свободных помеще-ний стабилен а в некоторых субрынках (Таганском Фрунзен-ском Новослободском) свободных помещений становится меньше Исключение составляет субрынок Москва-Сити где после ввода в эксплуатацию Башни Меркурий площадью 87 547 кв м объем свободных помещений удвоился что не-медленно привело к росту уровня свободных помещений на 156 пп до уровня 327
Всего в Москве предлагается в аренду или на продажу 154 млн кв м в существующих и 35 млн кв м в строящихся зданиях
Future supply mdash available space in buildings to be delivered in the next 12 month (under construction and under reconstruction) The data is given for the end of the period
Source Cushman amp Wakefield Source Cushman amp Wakefield Moscow Research Forum
DEMAND Overall 12 million sq m of quality office space was leased or bought during Q1-Q3 2013 For the second quarter in a row the total volume of take-up is decreasing In Q3 385836 sq m of quality office space has been transacted which is 20 below the average quarterly level of 2011-2012 Real estate budgets are limited and tenants tend to primarily consider their current location as a viable alternative to a new office
Tenants continue to be interested primarily in existing buildings the proportion of pre-lease agreements in Q1-Q3 was 63 of the total rented space (23 in Q3) In 2013 there is a significant reduction in the proportion of sales deals (from 20 on average in 2011-2012 to around 10 in 2013)
The number of large transactions (over 2000 sq m) continues decreasing The average transaction size has reduced again by 10 compared with the previous quarter and now stands at 528 sq m (taking into account only leasing deals)
NtildeIumlETHIcircNtilde Всего за три квартала 2013 года было арендовано и куплено 12 миллиона кв м качественных офисных помещений Вто-рой квартал подряд наблюдается снижение общего объема сделок В III квартале общий объем сделок составил 385 836 кв м что на 20 ниже среднего уровня 2011-2012 годов Бюджеты на недвижимость и переезды ограничены аренда-торы и арендодатели все чаще находят компромиссы приво-дящие к продлению текущих договоров аренды а не заклю-чению новых сделок в новых зданиях
Арендаторы продолжают интересоваться главным образом введенными в эксплуатацию зданиями ndash в 2013 году (1-III кв) доля договоров предварительной аренды составила менее 63 (в III кв ndash 23) от всех арендованных площадей Доля сделок продажи также продолжает оставаться низкой и со-ставляет не более 10 от всего объема офисных сделок
Продолжает снижаться количество крупных сделок (размером более 2 000 кв м) Средний размер транзакции снизился на 10 относительно предыдущего квартала и в III квартале составил 528 кв м учитывая только сделки аренды
NtildeOgraveAgraveAcircEcircEgrave AgraveETHAringIacuteAumlUcirc В классе А средняя запрашиваемая арендная ставка составляет 860 долларов США В классе Б средняя ставка аренды стабильна на уровне 520 долларов США Ставки аренды для Прайм офисов продолжают находиться на уровне 1 200 долларов США за кв м в год (без НДС и операционных расходов)
Source Cushman amp Wakefield
Source Cushman amp Wakefield
Q3 2013 AVERAGE BASE RENTAL RATES BY BUSINESS AREA СРЕДНИЕ БАЗОВЫЕ СТАВКИ АРЕНДЫ В III КВ 2013 Г ПО БИЗНЕС РАЙОНАМ
AVERAGE RENTAL RATES (US$) СРЕДНИЕ СТАВКИ АРЕНДЫ (ДОЛЛАРЫ США)
Downtown
Central
OTA
Moscow subareas
Moscow is divided into office submarkets areas with similar real estate indicators and dynamics Office submarkets are grouped in office subareas
The Downtown subarea is the territory inside the Garden Ring and the Belorussky business area
The Central subarea is the territory between the Garden ring and TTR (and the more distant SOK and KUT submarkets)
OTA includes the Moscow suburbs
RENTAL RATES In Class A the average asking rental rate is $860 In Class B the average asking rental rate was stable at $520 Rental rates for prime office space is at the level of $1200 per year per sq m (triple net)
IumlETHIcircAtildeIacuteIcircCcedil Несмотря на то что по заявлениям девелоперов более 400 тыс кв м площадей планируется к вводу во IV кв 2013 года мы ожидаем что до конца года будет введено в эксплуатацию дополнительно не более 150ndash200 тыс кв м новых офисов Таким образом в 2013 году сохранится баланс спроса и предло-жения в большинстве офисных субрынков
Высокие объемы строительства на окраинах города и в Москва-Сити не окажут существенного дестабилизирующего влияния на центральные районы До конца 2013 года а также в 2014 году в центральных районах ставки аренды будут стабильны возможен рост в соответствии в уровнем инфляции
LEASE TERMS IN QUALITY BUSINESS CENTERS УСЛОВИЯ АРЕНДЫ КАЧЕСТВЕННЫХ ОФИСНЫХ ПОМЕЩЕНИЙ
RUR USD or Euros (rarely used) per sqmyr For currency exchange landlords use either Central Bank of Russiarsquos official rate or set their own rate or fix the dollar corridor eg 25-40 RUBUSD
Российские рубли доллары США или евро (используется редко) за квм в год Используется обменный курс ЦБ России или используются условные единицы (уе) с фиксированным курсом в коридоре 25-40 рублей за уе
Payments Iumleumlagraveogravearingaeligegrave Quarterly in advance Ежеквартально авансом
Indexation Egraveiacuteaumlaringecircntildeagraveoumlegraveyuml 3-5 or at the level of USA EU CPI 10-15 for RUR agreements Sometimes step-rents are used
3-5 или US CPI 10-15 для рублевых договоров аренды Ингода используется ступенчатая индексация
Other payments Aumlethoacuteatildeegravearing iumleumlagraveogravearingaeligegrave
Operational expences
Операционные расходыThis sort of payments strongly depends on the service list included Average market payments 100-150 USDsqmyr for Class A 80-120 USDsqmyr for Class B
Платежи зависят от состава включенных услуг который может значительно отличаться 100-150 долларов США за квм в год для Класса A 80-120 долларов США за квм в год для Класса Б
VATНДС 18 18Source Cushman amp Wakefield
FORECAST Despite the announcements from developers that they will deliver more than 400000 sq m in Q4 2013 the new construction forecast continues to be rather conservative Just 150000-200000 sq m of new office space might be delivered by the end of this year Consequently in 2013 the supply-demand balance should remain stable
The high volume of office space under construction is the biggest threat at the moment Against the possible local oversupply in Moscow suburbs and Moscow-City submarkets in 2014 central and prime business areas should see a market balance both at the end of 2013 and during the whole 2014 For these areas rental rates are projected to grow in line with inflation
The table contains office buildings announce for delivery in 2013 with rentable area more than 15000 sq m Delivered buildings are included disregarding the size
TOTAL mdash Office rentable area or all office buildings announced for delivery in 2013 (including small buildings with office rentable less than 15000 sq m)
DOWNTOWNBlackampWhite Complex (bld White) ZAM B+ 13000 Q1Rosso Riva ZAM A 11947 Q1Park Tower BEL B+ 11850 Q1Chistoprudnyy bul 8 bld 1 CBD B- 4730 Q1White Gardens BEL A 63900 Q1Wall Street ZAM A 20493 Q2Vishnevy Sad CBD B+ 6736 Q2Domino ZAM A 6216 Q3Lukoil build-to-suit CBD B+ 35000 Q3CENTRALDubininskaya ul 33B SCH B+ 3000 Q1City Point BC CTY B+ 9951 Q1Sinitsa Plaza BAS B+ 13496 Q2Mercury City CTY A 87574 Q3Poluyaroslavskiy Bolshoy per 102 bld BAS B+ 2294 Q3Poklonnaya ul vl 3 KUT A 85572 Q4Park Pobedy KUT B+ 54000 Q4Nizhegorodsky Business Centre phase II BAS B- 37100 Q4Nizhegorodsky Business Centre phase I BAS B- 23000 Q4Arma 19 BAS B+ 19080 Q4Golden Gate BAS B+ 16000 Q4OTANewton Plaza SE B+ 52000 Q1Danilovskaya Manufaktura Sitsevyi Korpu SE B+ 3396 Q1iCube SW B+ 15256 Q1Obrucheva ul 52 bld3 SW B- 23300 Q1Lotte Business Centre SW B+ 38480 Q1Streamline NE B+ 11048 Q1Quadrum SUB B+ 24650 Q2Park Mira NE B+ 7000 Q2Format Complex II SUB B- 9122 Q2Dobrolyubova 6 bld 5 NE B- 4699 Q3Leninsky 119 SW A 15400 Q3Central Street NE B+ 6423 Q3Smart Park SW B+ 10260 Q39 akrov phase II SW B+ 62300 Q3Country Park Phase III SUB A 19120 Q3Riga Land bld 5 (bld A) (phase II) SUB B+ 40000 Q4Solutions BP bld 3 SW B+ 19500 Q4Avrora NE B- 21600 Q4Neo Geo SW B- 70000 Q4Novator office-hotel complex SUB B+ 24000 Q4Mebe One Khimki Plaza SUB A 26000 Q4
TOTAL 217236
TOTAL 421653
TOTAL 551253
Q3 2013 MoscowRUSSIA A Cushman amp Wakefield Research Publication
HOSPITALITY
ADR IN AUGUST 2013 | СРЕДНЯЯ ЦЕНА ЗА НОМЕР В АВГУСТЕ 2013 $152
QUALITY SUPPLY | ТЕКУЩИЙ ОБЪЕМ КАЧЕСТВЕННОГО ПРЕДЛОЖЕНИЯ 14200 rooms
OCCUPANCY | ЗАПОЛНЯЕМОСТЬ 77
RevPAR | СРЕДНИЙ ДОХОД НА НОМЕР $117
IumlETHAringAumlEumlIcircAEligAringIacuteEgraveAring По оценке департамента гостиничного бизнеса и туризма совокупный объем номерного фонда в Москве на конец III квартала 2013 г составил свыше 48 тыс номеров из них доля качественного предложения составила порядка 30 общего предложения или 142 тыс номеров
Новое предложение за III квартале 2013 г в сегменте качествен-ных гостиниц составило 1138 номеров и было сформировано за счет ввода в эксплуатацию 4-х гостиниц разной ценовой категории
В ноябре 2013 г ожидается открытие гостиниц под управлени-ем оператора Accor комплекс из трех отелей расположен по адресу ул Бахрушина вл 11 В состав комплекса войдут 3 гостиницы разной ценовой категории Mercure на 158 номеров (Upscale) Ibis на 190 номеров (Midscale) Adagio на 149 апартаментов (Midscale)
Это увеличит предложение на рынке качественных отелей минимум на 497 номеров Ожидаемое в 2013 г открытие гостиницы Marriott Novy Arbat (234 номера) перенесено на 1 квартал 2014 года
SUPPLY According to the Department of Hospitality and Tourism the cumulative number of rooms in the Moscow hotel market at the end of Q3 2013 is estimated at more than 48000 rooms with the proportion of high-quality supply at about 30 or 14200 rooms
The increase in high-quality segment by the end of Q3 2013 totaled 1138 rooms resulting from the commissioning of 4 hotels in different price categories
In addition Accor will open three new hotels in November Q4 2013 in the hotel complex located at ul Bakhrushina 11 The complex of hotels includes three brands Mercure with 158 rooms (Upscale) Ibis with 190 rooms (Midscale) and Adagio with 149 rooms (Midscale)
We believe that the total supply of international grade rooms will increase by 497 by the end of 2013 It was expected that more rooms would have been available but the opening of the Marriot Noviy Arbat (234 rooms) was postponed till the Q1 2014
QUALITY MOSCOW HOTEL MARKET STRUCTURE Q3 2013 YTD
NtildeOgraveETHOacuteEcircOgraveOacuteETHAgrave EcircAgravetimesAringNtildeOgraveAcircAringIacuteIacuteUcircOtilde AtildeIcircNtildeOgraveEgraveIacuteEgraveOuml IgraveIcircNtildeEcircAcircUcirc III EcircAcirc 2013
Средняя цена за номер (ADR) в августе 2013 г составила $152 что на 5 выше уровня августа 2012 г Положительная динамика обеспечена за счет гостиниц высокой ценовой категории максимальный рост средней цены за номер по отношению к результатам за аналогичный период 2012 г продемонстрировал рынок гостиниц класса Upscale 16 Среднеценовые объекты напротив работали с более демократичными группами спроса на рынке гостиниц класса Midscale было отмечено снижение показателя ADR на 7 по сравнению с августом 2012 г
Символическое падение ставок за номер на уровне 043 и 221 было отмечено также в сегментах Upper Midscale и Luxury соответственно что в целом характерно для августа ndash наиболее laquoтуристскогоraquo месяца в году
В отношении результатов 2013 г (по данным на август) рынок качественных гостиниц показал небольшое снижение показате-ля ADR (-11) по сравнению с прошлым годом что равносиль-но стабилизации в том числе с учетом ослабления рубля
Наиболее агрессивными с точки зрения ценовых ожиданий остаются гостиницы категории Luxury показывающие на фоне общих понижающих корректировок цены небольшой рост с $375 до $376 за номер
Московские гостиницы предлагают широкий разброс цен по сегментам наиболее дорогие ndash гостиницы категории Luxury где ADR в августе 2013 г составил $315 что на 10698 выше среднего показателя по рынку качественных гостиниц
Ценовой разрыв отелей категории Luxuгy со следующим за ним сегментом внушителен средняя цена за номер в гостиницах категории Upper Upscale уже только на 2875 превысила средний показатель по рынку и составила $197 Стоимость номера в гостиницах категории Upscale сравнима со средним по рынку значением и составляет $160
Цены за номер в гостиницах класса Upper Midscale и Midscale ниже среднерыночных на 30 и 48 соответственно и составляют $105 и $79 за номер (данные за август)
AVERAGE DAILY RATE US DOLLAR (ADR) AUGUST 2013 YTD
QUALITY HOTEL MARKET TRADING Average daily rate in August 2013 estimated to $152 which is 5 higher than in August 2012 This positive dynamic was ensured by high-quality hotels the highest ADR growth was recorded in the Upscale segment ndash Up 16 compared to the same period last year Midscale market in this period was oriented to more democratic groups of demand ADR declined by 7 comparing to August 2012
The fall in ADR at the level of 043 and 221 was also recorded in the Upper Midscale and Luxury segments respectively but that is typical for the August ndash the most tourist month of the year
The results of 2013 (August YtD) showed a symbolic decrease in ADR (-11) comparing to 2012 that can be interpreted as a stabili-zation taking into account the weakening of the Ruble
The most aggressive in terms of price expectations remain Luxury market segment showing slight increase from $375 to $376 per room comparison with the general lowering of prices
Moscow hotels offer a wide range of prices by segment the most expensive ndash Luxury with ADR in August about $315 it is 10698 higher than the average for the Moscow quality market
There is an impressive gap between Luxury hotel prices and prices for the Upper Upscale segment Average daily rate for Upper Upscale is about $197 and only 2875 higher than the average for the Moscow quality market
0
50
100
150
200
250
300
350
400
2010 2011 2012 2013
Luxury Upper Upscale
Upscale Upper Midscale
Midscale Moscow average
0
10
20
30
40
50
60
70
80
2010 2011 2012 2013
Luxury Upper UpscaleUpscale Upper MidscaleMidscale Moscow average
25
MARKETBEAT Q3 2013
NtildeIumlETHIcircNtilde
Средняя годовая загрузка качественных гостиниц Москвы в августе 2013 г составила 77 что на 11 выше данного показателя за аналогичный период прошлого года
Максимально высоким спросом в Москве пользуются гостиницы категории Upper Midscale и Midscale загрузка которых в августе фиксировалась на уровне 854 и 826 соответственно
Одной из особенностей рынка гостиниц Москвы в III кв 2013 г стала высокая загруженность качественных и центрально расположенных гостиниц в августе ndash традиционно низком из-за наступления laquoсезона отпусковraquo Нетипично высокая загрузка стала следствием увеличения туристских потоков в том числе за счет проведения Универсиады в Казани добавившей laquoтранзитныхraquo клиентов московским отелям
По итогам 2013 г по состоянию на август рынок качественных гостиниц показывает рост спроса по сравнению с прошлым годом практически по всем сегментам Рост спроса простимули-рован как ростом потока ночующих посетителей в Москву так и стагнацией цен на размещение последнее обстоятельство говорит о продолжающемся периоде неопределенности
OgraveAringIacuteAumlAringIacuteOumlEgraveEgrave
Среднее значение дохода на номер (RevPAR) за август 2013 г выросло на 171 и составило $117 против $100 в 2012 г В то же время по итогам 2013 г по состоянию на август динамика RevPAR по сегментам колебалась от 84 в Midscale до -46 в отелях категории Upper Midscale
Мы полагаем что тенденции к повышению среднерыночной доходности на номер (+12 YtD) за счет гибкой ценовой политики реагирующей на изменения спроса сохранится и в ближайшей перспективе В 2014 г гостиницы вышедшие на рынок в 2013 г окажут более выраженное воздействие на рыночную ситуацию за счет чего показатели RevPAR по сегменту Luxury и особенно Upper Midscale вряд ли существен-но превзойдут текущие показатели и будут колебаться от слабоотрицательных до слабоположительных значений в начале и конце года
DEMAND The average annual occupancy of quality hotels in Moscow in August 2013 was about 77 which is 11 higher than in the same period last year
Maximum high demand in Moscow hotels was in the Upper Midscale and Midscale category with occupancy in August at the level of 854 and 826 respectively
One of the features of the market of Moscow hotels in Q3 2013 was the high occupancy of quality hotels and especially the central located hotels ndash traditionally low in August because of the holiday season Unusually high occupancy was a result of increased tourist flows including through the Universiade in Kazan which added transit clients for Moscow hotels
In general up to August 2013 (YtD) the Moscow quality hotel market shows a growth in demand comparing to 2012 in almost all segments (reduced occupancy in Upper-Midscale segment by 03 pp can be seen as an insignificant adjustment) Demand growth is stimulated by the growing stream of domestic and international visitors staying overnight in Moscow and the stagnation of prices for accommodation the last point indicates the continuing period of uncertainty in the market
TRENDS IN REVENUE Average revenue per available room (RevRAR) in August 2013 increased by 171 to $117 versus $100 in August 2012
At the same time according to the results of August 2013 RevPAR dynamics by segment ranged from 84 in the Midscale segment to -46 in the Upper Midscale hotels We believe that the tendency to stimulate the RevRAR increase which the flexible price sensible of demand change will continue in the near future In 2014 the new hotels will have a more pronounced effect on the general market situation whereby RevPAR (especially for Luxury and Upper Midscale) unlikely to surpass itrsquos current estimations and will vary from slightly negative to low positive values at the beginning and end of the year
За III квартал 2013 года в эксплуатацию было введено более 235 тыс кв м качественных складских площадей
Ставки аренды остаются стабильными и составляют в среднем $135 за кв м в год в классе А без НДС операци-онных расходов и коммунальных платежей
Цена продажи составляет $1 200- $1 300 за кв м в типовых проектах класса А
Доля вакантных площадей в складах класса А за полугодие не изменилась и составляет 1
Объем арендованных и купленных складских площадей в III составил более 350 тыс кв м
Регионы
В большинстве регионов средние ставки аренды в классе А за прошедший квартал не изменились за исключением Новосибирска и Нижнего Новгорода где ставки выросли на 4-6
Объем арендованных и купленных складских площадей в III квартале составил более 85 тыс кв м
SUMMARY Moscow
In Q3 2013 more than 235000 sq m of quality warehouse space were put into operation
Rental rates remain stable at an average of $135 per sq m per year in A Class excluding VAT operating expenses and utility
The price of sale is $1200 - $1300 per sq m in typical projects of class A
The vacancy rate in Class A warehouses for the half of the year remains unchanged at 1
The volume of leased and purchased warehouse space in Q3 amounted to 350000 sq m
Regions
The average rental rates in Class A have not changed for the quarter in most regions except Novosibirsk and Nizhny Novgorod where rates have increased by 4-6
The volume of leased and purchased warehouse space in Q3 amounted to 85000 sq m
$132
$130
$140
$105
$110
$135
$135
$135
$80
$90
$100
$110
$120
$130
$140
$150
2006 2007 2008 2009 2010 2011 2012 2013F
KEY EXPECTATIONS
STABILITY
0
200
400
600
800
1000
1200
1400
1600
1800
2007 2008 2009 2010 2011 2012 2013F 2014F
27
MARKETBEAT Q3 2013
Source Cushman amp Wakefield
Source Cushman amp Wakefield
Source Cushman amp Wakefield
Source Cushman amp Wakefield
ОСНОВНЫЕ ТЕНДЕНЦИИ Объем нового строительства за 1-III кв 2013 года в Московском регионе составил 550 тыс кв м что соответствует аналогично-му показателю прошлого года Объем арендованных и куплен-ных площадей по итогам прошедших трех кварталов составил белее 830 тыс кв м что приблизительно соответствует показа-телю прошлого года
В регионах объем нового строительства в регионах за первые три квартала составил 239 тыс кв м что на треть меньше про-шлогоднего Арендовано куплено 250 тыс кв м что больше прошлогоднего показателя на 20
ПРЕДЛОЖЕНИЕ В Московском регионе в III квартале 2013 года предложение увеличилось на 235 тыс кв м
В минувшем квартале были построены
Логопарк Север (110 тыс кв м) девелопер Каравелла
Два новых корпуса в логистическом парке Климовск (48 тыс кв м) девелопер Raven Russia
Объем нового строительства соответствует показателям преды-дущего года но темпы строительства ниже заявленных девело-перами Основная проблема mdash задержки в строительстве Боль-ше всего это касается новых девелоперов длительное время работающие на рынке компании укладываются в заявленные сроки Поэтому до конца года будет построено до 1 млн кв м складских площадей
На рынке Москвы сохраняется дефицит готовых к въезду склад-ских площадей Все проекты сдаются или продаются на этапе строительства
Чистые средние ставки аренды в течении прошедшего квартала не изменились и составляют $135 за кв м при этом разброс ставок остается высоким
В 2014 году девелоперы обещают построить около 15 млн кв м складских площадей однако по нашем оценкам из-за задер-жек при строительстве построено будет на 30 меньше
KEY TRENDS The volume of new construction for Q1-Q3 2013 in the Moscow region amounted to 550000 sq m which corresponds to the same period of last year The volume of leased and purchased land based on the results of Q1-Q3 was more than 830000 sq m which approximately relative to the previous year figure
The volume of new construction in the regions for the first three quarters amounted to 239000 sq m which is a three times less than last year indicator 250000 sq m were leased and sold which is 20 more than last year figure
SUPPLY In Q3 2013 supply in Moscow region increased by 235000 sq m
In the last quarter were put into operation
bull Logistics Park North (110000 sq m) developer is Caravella
bull Two new phases in the logistics park Klimovsk (48000 sq m) developer is Raven Russia
The volume of new construction complies with the previous year but below the pace of construction announced by developers The main problem is the delays in construction mostly it concerns new developers Experienced companies meet the announced deadlines Therefore there will be built up to one million sq m of warehouse space until the end of the year
In Moscow there is a lack of ready-to-move storage space All projects are sold or bought during the construction process
Net average rental rates have not changed during the last quarter and amounted to $135 per sq m while the spread rate remains relatively high
In 2014 developers expect to build nearly 15 mn sq m of warehouse space however according to our estimations the volume of construction will be 30 less due to the development process delays
DISTRIBUTION OF QUALITY DEVELOPMENTS IN THE PIPELINE FOR 2013-2014 (lsquo000 SQ M) РАСПРЕДЕЛЕНИЕ ПЛАНИРУЕМЫХ К ВВОДУ В 2013-2014 ГГ СКЛАДСКИХ ПЛОЩАДЕЙ В МОСКОВСКОЙ ОБЛАСТИ ТЫС КВ М
DISTRIBUTION OF WampI SPACE IN THE MOSCOW REGION (lsquo000 SQ M) РАСПРЕДЕЛЕНИЕ СКЛАДСКИХ ПЛОЩАДЕЙ В МОСКОВСКОЙ ОБЛАСТИ ТЫС КВ М
В регионах в минувшем квартале было построено только 43 тыс кв м качественных складских площадей против 117 тыс в прошлом Все новые объекты построены рядом с Санкт-Петербургом
Всего в 2014 году в регионах будет построено боле 290 тыс кв м против 410 тыс кв м в прошлом В большинстве регионов дефицита складских площадей не наблюдается Исключение составляет Санкт-Петербург Екатеринбург и Ростов-на-Дону
Чистые ставки аренды в регионах в III квартале 2013 года не изменились за исключением Новосибирска и Нижнего Новгорода где они немного выросли до $120 и $123 за кв м соответственно
Source Cushman amp Wakefield
TAKE UP lsquo000 SQ M ОБЪЕМ АРЕНДОВАННЫХ И КУПЛЕННЫХ ПЛОЩАДЕЙ ТЫС КВ М
Source Cushman amp Wakefield
During the past quarter only 43000 sq m of quality warehouse space was built In the regions as against last year fiqure (117000 sq m) All new premises were built near St Petersburg
Comparing to last year figure (410000 sq m) more than 290000 sq m is going to be built in the regions in 2014 In most regions there is no lack of warehouse spaces observed The exceptions are St Petersburg Yekaterinburg and Rostov-on-Don
Net rental rates have not changed in the regions in Q3 except Novosibirsk and Nizhny Novgorod where they rose slightly to $120 and $123 per sq m respectively
2013 PIPELINE ОБЪЕКТЫ ЗАЯВЛЕННЫЕ К СТРОИТЕЛЬСТВУ В 2013 Г
PROJECT DEVELOPER GRADE DIRECTION HIGHWAYDISTANCE FROM
MKAD KMTOTAL AREA
000 SQ MEXPECTED
DELIVERY
Infrastroy Bykovo Infrastroy А E Egorevskoe 17 6155 Q1
Infrastroy Bykovo Infrastroy А E Egorevskoe 17 6193 Q4
Klimovsk LP Raven Russia A S Simferopolskoye 23 4772 Q3
Logopark Sever Karavella A N Rogachevskoye 30 11023 Q3
PNK Chekhov II PNK group A S Simferopolskoye 50 10424 Q2
PNK Chekhov II PNK group A S Simferopolskoye 50 5531 Q4
PNK Vnukovo PNK group A SW Kievskoe 19 10568 Q1
South Gate IP Radius group A S Kashirskoye 30 2070 Q2
South Gate IP Radius group A S Kashirskoye 30 3000 Q4
СПРОС В Московском регионе за I-III кварталах 2013 г было арендовано и куплено более 850 тыс кв м качественных складских площадей из них 235 тыс в III квартале что соответствует прошлогодним показателям
Наиболее крупные сделки в минувшем квартале
Автомобильный концерн Volkswagen купил 50 тыс кв м в складском комплексе PNK Чехов 2 девелопер PNK Group
Компания Верный купила 43 тыс кв м в складском комплексе PNK Север девелопер PNK Group
Автомобильный концерн General Motors арендовала 40 тыс кв м в индустриальном комплексе Южные врата
Следует отметить что большое количество качественных складских площадей было арендовано и куплено в III квартале 2013 г производственными компаниями при этом логистиче-ские компании и дистрибьюторы наоборот купили и арендова-ли меньшее количество площадей
Так же следует отметить увеличение доли продаж в III квартале до 42 против 14 во II квартале в структуре поглощения
На региональных рынках за минувший квартал было арендовано и куплено более 85 тыс кв м всего с начала года более 250 тыс кв м что почти на 20 выше аналогичного показателя прошлого года и на 5 среднего значения за последние 5 лет Этот показатель во многом обусловлен самой крупной сделкой за всю историю рынка складской недвижимости Санкт-Петербурга по предварительной продаже 43 тыс кв м компанией PNK Group продуктовой сети laquoВерныйraquo в складском комплексе PNK КАД
Сделки на такие большие площади позволяют девелоперу возобновить строительство в регионах но за период с IV кв 2012 по III квартале 2013 г Было заключено только 4 сделки более 25 тыс кв м Большинство сделок в регионах заключает-ся на складские площади до 10 тыс кв м
STRUCTURE OF DEMAND MOSCOW СТРУКТУРА СПРОСА МОСКВА
DEMAND In the Moscow region in Q1-Q3 2013 more than 850000 sq m were rented and purchased talking about quality warehouse space The Q3 indicator is 235000 sq m which is the same to the last years performance
The largest deals in the last quarter
bull Car manufacturer group Volkswagen bought 50000 sq m in a warehouse complex PNK Chekhov 2 developer is PNK Group
bull The Verniy company bought 43000 sq m in a warehouse complex PNK North developer is PNK Group
bull Automobile сar manufacturer General Motors leased 40000 sq m in the industrial complex South Gate
It should be noted that a large number of quality warehouse space was leased and purchased in the Q3 2013 by manufacturing companies while logistics companies and distributors on the contrary have bought and rented a smaller amount of warehouse space
It should be also mentioned the increasing sales in Q3 up to 42 comparing to 14 in the previous quarter for the both leased and bought premises
At the regional markets for the last quarter it was rented and purchased more than 85000 sq m Since of the beginning of the year more than 250000 sq m were rented and purchased which is almost 20 higher than last year and 5 higher than the average number for the last 5 years This indicator is largely due to the largest deal in the history of the warehouse property market of St Petersburg on the pre-sale of 43000 sq m by PNK Group to the food supplier Verniy in the warehouse complex PNK KAD
Such large deals allow developer to resume construction in the regions However between Q4 2012 and Q3 2013 it was only 4 deals amounted more than 25000 sq m made Most of the deals in the region are for warehouse space up to 10000 sq m
ТЕНДЕНЦИИ С начала прошлого года на рынок складской недвижимости остается стабильным Ежегодный спрос в Московском регионе составляет около 1 млн кв м в год Средние ставки аренды в классе А составляют $135 за кв м в год без НДС операцион-ных расходов и коммунальных платежей доля вакантных площадей сохраняется на уровне 1 Строительство большин-ства новых складских объектов будет начинаться только после заключения предварительных договоров аренды и продажи
Изменение ситуации в ближайшей перспективе ожидать не стоит В условиях низкого роста экономики страны начинать спекулятивное строительство большой риск повторения ситуации 2008 года поэтому предложение будет подстраивать-ся под спрос
На региональных рынках продолжится тенденция увеличения дефицита готовых к въезду складских площадей Не смотря на высокой спрос на складские объекты в регионах девелоперам не удается сформировать достаточных портфель предваритель-ных договоров аренды для начала строительства Исключение составляет Санкт-Петербург Свердловская область юг России где спрос или условия рынка обеспечили девелоперам формирование такого портфеля Мы прогнозируем что до конца года в регионах будет реализовано более 300 тыс кв м складских площадей
Source Cushman amp Wakefield
STRUCTURE OF DEMAND REGIONS СТРУКТУРА СПРОСА РЕГИОНЫ
TRENDS Since the beginning of the last year the warehouse market has remained stable Annual demand in the Moscow region is about one mn sq m per year average rental rates for Class A is $135 per sq m per year excluding VAT operating expenses and utility costs the vacancy rate remains at 1 Construction of the majority of new storage facilities will start only after the preliminary lease or sale contract signing up
In the nearest future the situation would remain the same It is the huge risk to start the new speculative construction in a low-growth economic situation as it is the threaten to repeat the 2008 year crisis the supply will adapt to the demand
The trend of growing deficit of ready-to-move warehouse spaces continues at the regional markets In spite of the high demand for storage facilities in the regions for developers it is still complicated to form a sufficient portfolio of preliminary agreements for the start of construction Exceptions are St Petersburg Sverdlovsk region and south Russia where the demand or market conditions provided developers with the opportunity to form such a portfolio We predict that by the end of the year in the regions will be sold over 300000 sq m of warehouse space
WampI MARKET IN RUSSIA ETHUcircIacuteIcircEcirc NtildeEcircEumlAgraveAumlNtildeEcircEgraveOtilde IumlIcircIgraveAringUgraveAringIacuteEgraveEacute Acirc ETHIcircNtildeNtildeEgraveEgrave
VACANCY RATE (EOY) Paris (Ile de France) 89 81 99 126 102 84 81 89 804
Budapest 59 172 173 188 195 208 194 217 2283
Warsaw 89 74 112 171 194 173 146 1621 1592
Madrid 55 38 37 55 73 84 93 95 972
TAKE UP 000 SQ MParis (Ile de France) 1 005 700 640 601 814 837 563 208 58
Budapest 152 229 308 280 210 327 355 31 21
Warsaw 260 445 556 216 451 743 483 183 112
Madrid 1 225 918 630 325 390 270 225 60 47
2013
36
MARKETBEAT Q3 2013
RESEARCH DEPARTMENT IcircOgraveAumlAringEuml EgraveNtildeNtildeEumlAringAumlIcircAcircAgraveIacuteEgraveEacute
Further information and copies of this report are available from Ellina Krylova
EllinaKrylovaeurcushwakecom
The information provided in this report is intended for informational purposes only and should not be relied on by any party without further independent verification Classifications of individual buildings are reviewed on a continuing basis and are subject to change The standards used in this process are consistent with those used by Moscow Research Forum and in the United States by the Society of Industrial and Office Realtors (SIOR) and BOMA International Reproduction of this report in whole or part is permitted only with written consent of Cushman amp Wakefield Data from this report may be cited with proper acknowledgment given
copy 2013 Cushman amp Wakefield All rights reserved
MORE INFORMATION AND CONTACTS ARE AVAILABLE ON WWWMARKETBEATRU EgraveIacuteOcircIcircETHIgraveAgraveOumlEgraveszlig IcircAacute IcircOgraveAumlAringEumlAring EgraveNtildeNtildeEumlAringAumlIcircAcircAgraveIacuteEgraveEacute Egrave IumlOacuteAacuteEumlEgraveEcircAgraveOumlEgraveEgrave AumlIcircNtildeOgraveOacuteIumlIacuteUcirc IacuteAgrave WWWMARKETBEATRU
DENIS SOKOLOV PARTNER RESEARCH DIRECTOR DenisSokoloveurcushwakecom
LADA BELAYCHUK ASSOCIATE DIRECTOR DEPUTY RESEARCH DIRECTOR LadaBelaychukeurcushwakecom
MAXIM ILYIN CONSULTANT CAPITAL MARKETS Maximilyineurcushwakecom
ALEXANDER KUNTSEVICH ANALYST WampI PROJECT MANAGEMENT AlexanerKuntsevicheurcushwakecom
TATYANA DIVINA SENIOR ANALYST
TatyanaDivinaeurcushwakecom
wwwcushmanwakefieldcom
Q3 2013 MoscowRUSSIA A Cushman amp Wakefield Research Publication
RETAIL
Source Rosstat
RETAIL TRADE TURNOVER AND REAL DISPOSABLE INCOME RUSSIA YOY РОЗНИЧНЫЙ ТОВАРООБОРОТ И РЕАЛЬНЫЕ РАСПОЛАГАЕМЫЕ ДОХОДЫ РОССИЯ
EcircETHAgraveOgraveEcircEgraveEacute IcircAacuteCcedilIcircETH В целом по России объемы нового строительства торговых площадей так же высоки как и в прошлом 2012 г В течение трех кварталов 2013 г в 22 российских городах появились новые торговые комплексы Некоторое снижение темпов строительства в Москве в 2012-2013 гг будет компенсировано ожидаемыми масштабными открытиями в 2014 г Посещае-мость торговых центров в Москве находится на высоком уровне потребительские ожидания стабильны В связи с дефицитом предложения в торговых центрах Москвы ритейлеры активно изучают российские регионы В 2013 г как и в течение 2012 г ставки аренды были стабильны
CONSUMER CONFIDENCE INDEX ИНДЕКС ПОТРЕБИТЕЛЬСКОГО ОЖИДАНИЯ
IumlIcircOgraveETHAringAacuteEgraveOgraveAringEumlEgrave Реальные располагаемые денежные доходы населения России (доходы за вычетом обязательных платежей скорректирован-ные на индекс потребительских цен) по оценке Росстата в августе 2013 г выросли на 21 по сравнению с августом 2012 г в январе-августе 2013 г выросли на 41 в сравнении с аналогичным периодом прошлого года Среднемесячная зарплата в России в августе 2013 г составила 29 020 рублей и выросла на 128 по сравнению с августом 2012 года
BRIEF SUMMARY In general the volume of new construction of retail spaces in Russia can be described as high as it used to be in the past 2012 New retail complexes have been constructed and delivered for the past 3 quarters of 2013 in 22 Russian cities There is a reduction in the сconstruction of new quality retail premises in Moscow for 2012-2013 which is going to be compensated by large-scale and expected projects in 2014 Attendance of Moscow shopping centers is at the high level consumer expectations are stable Due to the shortage of supply in the shopping malls retailers actively seek for new spaces in Russian regions During the 2013 rental rents remains stable as it was in 2012
CONSUMERS According to Rosstat real income of the Russian population grew up by 21 comparing to August 2012 Moreover it increased by 41 in January-August 2013 relatively to the same period of time last year The average monthly salary was 29020 rubles in August 2013 and increased by 128 comparing to the past year
Total retail trade growth for January-May was 38
Source Rosstat
VACANCY RATE ДОЛЯ СВОБОДНЫХ ПЛОЩАДЕЙ (Prime shopping centers Moscow) | (действующие прайм ТЦ Москва) 12
PRIME RENTAL RATE INDICATOR | ПРАЙМ ИНДИКАТОР АРЕНДНЫХ СТАВОК (Prime shopping center retail gallery Moscow) | (галереи в прайм ТЦ Москва) US$ 3800
1642 mn sq m 572 quality projects
TOTAL QUALITY STOCK IN RUSSIA ОБЩЕЕ КОЛИЧЕСТВО КАЧЕСТВЕННЫХ ТОРГОВЫХ ПЛОЩАДЕЙ В РОССИИ
KEY EXPECTATIONS
STABILITY
-10
-5
0
5
10
15
20
2007 2008 2009 2010 2011 2012 F2013 F2014
Retail trade turnover growth Real personal disposable income growth
RETAILERS Retailer demand has remained relatively strong in Russia with limited new market entrants but existing retailers looking to expand and experiment with new format types Vacancy rates in prime shopping centres in Moscow are at extremely low levels with occupiers now transferring interest to the high street as shopping centre space cannot meet the demand
Those brands already present in Russia are actively looking to expand into the regions
NEWCOMER BRANDS WITH DEVELOPMENT PLANS IN RUSSIA НОВЫЕ ПЛАНЫ РАЗВИТИЯ РИТЕЙЛЕРОВ В РОССИИ
Source official websites and other media
REGION CITY NEWCOMERS 2013 COMING SOONSouthern Volgograd Leroy Merlin
Armavir LentaSochi Bata Louis Vuitton StarbucksTaganrog LentaKrasnodar Barker Bata StarbucksRostov-on-Don Starbucks
ETHEgraveOgraveAringEacuteEumlAringETHUcirc Спрос на качественные торговые помещения со стороны ритейлеров высокий Ритейлеры продолжают экспериментиро-вать с новыми форматами В связи с дефицитом предложения в торговых центрах Москвы ритейлеры обращают все больше внимания на торговые улицы
Продолжается активная экспансия во все регионы России
GLOBAL RETAILERS COMING TO RUSSIA НОВЫЕ МЕЖДУНАРОДНЫЕ РИТЕЙЛЕРЫ ПЛАНИРУЮЩИЕ НАЧАТЬ РАБОТУ В РОСИИ
NEW GLOBAL RETAILERS IN 2013 НОВЫЕ МЕЖДУНАРОДНЫЕ РИТЕЙЛЕРЫ В РОССИИ 2013
CushmanampWakefield Research quarterly monitoring of 9 quality shopping centers (total GLA - 05 mn sq m) These shopping centers have been opened more than one year ago and have a clear catchment area
OgraveIcircETHAtildeIcircAcircUcircAring IumlIcircIgraveAringUgraveAringIacuteEgraveszlig В III квартале посещаемость торговых центров в Москве находилась на более высоком уровне чем в предыдущие годы в этот период Доля покупателей (количество людей совершив-ших покупки относительно общего количества посетителей) снизилась до 308
Уровень свободных помещений в качественных торговых центрах находится на предельно низком уровне Небольшой рост в III квартале 2013 года (на 08 пп) связан с ротацией арендаторов в одном из торговых центров (один из этажей торгового центра в ближайшее время будет полностью занят крупным арендатором которые в настоящее время проводит ремонт помещения)
В целом в Москве продолжает наблюдаться дефицит предложе-ния в качественных торговых центрах
ДОЛЯ laquoУСПЕШНЫХ ПОКУПАТЕЛЕЙraquo ldquoSUCCESSFUL SHOPPERSrdquo
FOOTFALL ПОСЕЩАЕМОСТЬ ТОРГОВЫХ ЦЕНТРОВ
Source Cushman amp Wakefield
Source Cushman amp Wakefield
Source Cushman amp Wakefield
CushmanampWakefield Research quarterly monitoring of 9 quality shopping centers (total GLA - 05 mn sq m) These shopping centers have been opened more than one year ago and have a clear public contact area Number of successful shoppers remained stable (share of shoppers who make purchases out of all visitors of the monitored shopping centers)
The total number of retail outlets in the observed sample is 865 (brands in shopping galleries without operators of restaurant zones and without service companies like dry cleaning banks etc) These retail outlets are filled with 552 unique brands
VACANCY RATE УРОВЕНЬ СВОБОДНЫХ ПОМЕЩЕНИЙ
Petrovsky Passage
RETAIL SPACE
In Q3 the visiting rate of the retail centers was at the higher level than it used to be in the last year Buyers share (amount of people who made a purchase compared to total number of visitors) decreased with the number of 308 The level of vacant spaces in the quality retail centers is at the lowest level The small increase in the third quarter (08 points) is associated with the rotation of tenants in one of the shopping centers (one of retail centerrsquos floors is going to be fully occupied by the leaseholder who is currently conducting repair facilities)
In general there is a lack of supply in the quality retail centers in Moscow
Announced developers plans CW Forecast New construction YTD
НОВОЕ СТРОИТЕЛЬСТВО В III квартале в России было введено в эксплуатацию 15 новых торговых центров общей торговой площадью 292 750 кв м География нового строительства ndash от Иркутска и Ангарска до Сочи В основном стоятся торговые центры (75 всех новых качественных торговых площадей) также торговые площади открываются в многофункциональных комплексах Средний размер новых торговых центров уменьшается в 2013 году он составляет 26 тыс кв м что на 30 меньше чем в 2011 году
В III квартале крупнейшим открытым торговым объектом стал торгово-развлекательный центр Жемчужная Плаза (GLA 48 тыс кв м) в Санкт-Петербурге построенный в рамках комплексной застройки микрорайона Балтийская Жемчужина
В III квартале в Москве был открыт один новый торгово-развлекательный центр Райкин Плаза Также были открыты но-вые фазы комплекса Отрада В Москве новые качественные торговые площади строятся в разных форматах ndash торгово-развлекательные центры (Рио Райкин плаза) аутлет-центры (Внуково и Fashion House) многофункциональные комплексы (Белая Площадь Эволюция) До конца 2013 г в Московском регионе (г Павловский Посад) планируется открытие ритейл парка Белла Вита (GLA 36 тыс кв м)
NEW CONSTRUCTION 2013 RUSSIAQUALITY RETAIL STORES НОВОЕ СТРОИТЕЛЬСТВО В 2013 ГОДУ РОССИЯ КАЧЕСТВЕННЫЕ ТОРГОВЫЕ ОБЪЕКТЫ
Source Cushman amp Wakefield
QUALITY RETAIL CONSTRUCTION rsquo000 SQ M RUSSIA СТРОИТЕЛЬСТВО КАЧЕСТВЕННЫХ ТОРГОВЫХ ПЛОЩАДЕЙ ТЫС КВ М РОССИЯ
NEW CONSTRUCTION In Q3 15 new retail centers were delivered in Russia with a total area of 292750 sq m The geography of new construction is located from Irkutsk and Angarsk to Sochi The majority of new premises are located in shopping centers (75 of new quality retail space) besides retail space in multifunctional complexes Average area of newly constructed shopping centers is decreasing in 2013 it was about 26000 sq m which is 30 lower than in was in 2011
In the third quarter retail and entertainment center Pearl Plaza (GLA 48000 sq m) was awarded the name of the largest retail project in St Petersburg It was built as a part of the complex development in the Baltic Pearl micro region
Besides the new shopping and entertainment mall Raykin Plaza was delivered in the Q3 Also new phases of the Otrada complex were delivered New quality retail spaces are developed in various formats in Moscow ndash shopping and entertainment centers (Rio Raykin Plaza) outlet-centers (Vnukovo and Fashion House) multifunctional complexes (White Square Evolution) Till the end of 2013 it is planned to open retail park Bella Vita (GLA 36000 sq m) in the Moscow region (Pavlovskiy Posad city)
Standard lease terms for gallery tenants are between 3-5 years break options are rare For anchor tenants (including fashion anchors) lease terms are up to 20 -25 years and break options are becoming popular
Rents are typically payable monthly in advance Turnover percentage rents are increasingly seen in shopping centres Rental rates are generally calculated in USD Euricirc or commercial units are used In less quality shopping centres rental rates are calculated in RUR
Annual indexation is typical between 3-10 or at a level of USD EU CPI The practice of premium key money payments is seldom seen in Russia Rent reviews are rare on the market
Service ChargesIcirciumlaringethagraveoumlegraveicirciacuteiacuteucircaring iumleumlagraveogravearingaeligegrave
Service charge is payable by tenants at either an ldquoopen bookrdquo basis or more common as a fixed cost Utilities payments are charged on consumption Building insurance is normally charged back to tenant via service charge
Local property taxes are not payed separately they are generally included in the service charges Iacuteagraveeumlicircatilde iacuteagrave iacutearingaumlacircegraveaeligegraveigraveicircntildeograveuuml icircaacuteucircdivideiacuteicirc acirceumlthorndivideagravearingograventildeyuml acirc icirciumlaringethagraveoumlegraveicirciacuteiacuteucircaring iumleumlagraveogravearingaeligegrave
Other costsAumlethoacuteatildeegravearing iumleumlagraveogravearingaeligegrave
EcircIcircIgraveIgraveAringETHtimesAringNtildeEcircEgraveAring OacuteNtildeEumlIcircAcircEgraveszlig Acirc OgraveIcircETHAtildeIcircAcircUcircOtilde OumlAringIacuteOgraveETHAgraveOtilde Ставки аренды для помещений в торговых галереях качествен-ных торговых центров в Москве находятся в диапазоне от 500 до 4 000 долларов США (за кв м в год без НДС и других платежей) В течение трех кварталов 2013 и всего прошедшего 2012 года ставки аренды в торговых центрах были стабильны Прайм ритейл индикатор в Москве составляет 3 800 долларов США (за кв м в год без НДС и других платежей) Однако в 2013 году наметилась тенденция к повышению ставок аренды в лучших торговых центрах поэтому рост ставок на лучшие помещения может быть выше 5 (текущий консервативный прогноз)
Вне Москвы ставки аренды в торговых центрах в среднем на 30-60 ниже в зависимости от региона
Дополнительно к ставке аренды ритейлеры платят сервисные сборы за обслуживание (150-250 долларов США за кв м в год для помещений размером менее 500 кв м) за маркетинг (10-25 долларов США за кв м в год) также иногда бывают и другие дополнительные платежи
Source Cushman amp Wakefield
Source Cushman amp Wakefield
PRIME RETAIL INDICATOR MOSCOW ПРАЙМ РИТЕЙЛ ИНДИКАТОР В ТОРГОВЫХ ЦЕНТРАХ МОСКВА
Prime retail indicatormdashbase asking rental rate for the 100-200 sq m gallery unit at the ground floor of the prime shopping centers US$ per sq m per annum triple net
INDICATIVE RENTAL RATES IN QUALITY SHOPPING CENTER RETAIL GALLERIES MOSCOW СРЕДНИЕ АРЕНДНЫЕ СТАВКИ В ГАЛЕРЕЕ КАЧЕСТВЕННЫХ ТОРГОВЫХ ЦЕНТРОВ МОСКВА
COMMERCIAL RATES IN SHOPPING MALLS Moscow retail gallery rental rates are in the range of US$ 500- 4000 (per sq m per year before VAT and other expenses) depending on the size of the retail unit and the type of retailer Throughout Q1-Q3 and the whole of 2012 rental rates were stable across all sub-sectors
Moscowrsquos prime retail indicator is US$ 3800 per sq m per annum as a base rate However a tendency towards rate increases was observed in 2013 and near future growth may be higher than 5 (our current conservative estimate)
In other cities rental rates in shopping malls are typically 30 to 60 below Moscow levels
Additionally among other payments there are operational expenses (US$ 150-250 per sq m annually for units smaller than 500 sq m) marketing (US$ 10-25 per sq m annually) and others depending on the project
QUALITY RETAIL LEASE STRUCTURE СТРУКТУРА ДОГОВОРОВ АРЕНДЫ В КАЧЕСТВЕННЫХ ТОРГОВЫХ ПОМЕЩЕНИЯХ
ANCHORS
lt100 100 - 300 300 - 1200 1200 - 3500 3500-7000
Food court $1800-$2000
Kiosks $5000-$8000
Restaurant $600-$1000 $700
Clothing $1 600 $1 200 $700 $400
Shoes $2 200 $1 700 $1 200 $800
White and Brown $500
Supermarket $500-$600
Hypermarket $250-$450
Cinema $250-$320
BUSINESSGLA SQ M
RETAIL GALLERY MINI ANCHORS
Source Cushman amp Wakefield
15
MARKETBEAT Q3 2013
ТОРГОВЫЕ УЛИЦЫ На центральных торговых улицах свободно (предлагается в аренду или готовится к открытию) около 5 имеющихся поме-щений Ставки аренды в торговых коридорах стабильны В по-следние несколько лет есть тенденция к увеличению сроков аренды если еще три года назад договоры были чаще всего краткосрочные (на 11 месяцев) то сейчас трехлетние договора аренды становятся все более распространенными
Анализ торговых помещений на наиболее проходимых торго-вых улицах в центре города показывает что самыми популяр-ными категориями арендаторов являются предприятия питания (кафе рестораны) и магазины одежды и обуви которые занима-ют 29 и 21 всех помещений на этих улицах соответственно Значимыми арендаторами являются компании предлагающие услуги (спа парикмахерские медицинские услуги предприятия связи салоны фотографии юридические услуги) ndash они занимают 10 всех торговых помещений на главных улицах центра горо-да По 5 всех площадей занимают отделения банков ювелир-ные салоны магазины косметики и аксессуаров
Source Cushman amp Wakefield
HIGH STREETS Nearly 5 of the existing premises are freely available (are offered for lease or being prepared for delivery) in the central high streets Rental rates in the trade corridors are stable There is a tendency for increasing lease terms in the last few years As an example three years ago contracts used to be short-term mostly (11 months) and now agreements for the 3 and 5 years period become more and more widespread
The analysis of the retail spaces on the most passable areas in the city centre shows that the most popular categories of tenants are catering (cafe restaurants) and clothing shops They occupy 29 and 21 of all premises respectively Significant tenants are those who offers the following services spa hairdressers medical services communications companies photography and legal services ndash all of them occupy 10 of retail premises on the main streets of the city banks jewelry stores cosmetic stores and accessories occupy 5
AVERAGE RENTAL RATES ON HIGH STREETS IN MOSCOW СРЕДНИЕ АРЕНДНЫЕ СТАВКИ В ТОРГОВЫХ КОРИДОРАХ МОСКВА
HIGH STREET TENANT MIX MOSCOW Q3 2013 | СТРУКТУРА АРЕНДАТОРОВ В ТОРГОВЫХ КОРИДОРАХ МОСКВА III КВ 2013
Food Restaurants Cafes Fashion and footwareServices Bank ExchangeAccessories Optics Watches JewelryCosmetics Pharmacy Perfumery Other
HIGH STREET RENTAL RATES MOSCOW АРЕНДНЫЕ СТАВКИ В ТОРГОВЫХ КОРИДОРАХ МОСКВА
Data of the following trade corridors was used to conduct the analysis Tverskaya Petrovka-Stoleshnikov-Kuznetsky Most Nikolskaya Pyatnytskaya Pokrovka-Maroseyka In total these trade corridors located 710 outlets
US$ per sq m per annum triple net Aumlicirceumleumlagraveethucirc NtildeOslashAgrave ccedilagrave ecircacircigrave acirc atildeicircauml aacuteagraveccedilicircacircagraveyuml ntildeograveagraveacircecircagrave agraveetharingiacuteaumlucirc
OgraveIcircETHAtildeIcircAcircUcircAring OacuteEumlEgraveOumlUcirc mdash IumlAringOslashAringOtildeIcircAumlIacuteUcircAring CcedilIcircIacuteUcirc Важнейшим событием для торговых улиц стала программа развития пешеходных зон в Москве активно поддерживаемая Правительством города На тех улицах где уже отменили движение транспорта (в первую очередь Большая Дмитровка) происходит смена потоков посетителей (от пассажиров к пешеходам) Пешеходные улицы имеют огромный потенциал с точки зрения торговли и уже сейчас ритейлеры проявляют большой интерес к пешеходным районам Расширение пешеходных районов значительно увечит предложение качественных торговых помещений на улицах в Москве
HIGH STREETS mdash PEDESTRIAN AREA The most important event for the high streets became the development of pedestrian zones in Moscow which is actively supported by the city government There is a change of visitor flows (from passengers to pedestrians) on those streets where the driving was cancelled (it concerns Bolshaya Dmitrovka street first of all) There is a huge potential for retail activity talking about pedestrian streets and retailers show great interest in developing of those areas The expansion of pedestrian zones will significantly increase the supply of the quality retail premises in Moscow
HIGH STREETS mdash PEDESTRIAN AREA ТОРГОВЫЕ УЛИЦЫ mdash ПЕШЕХОДНЫЕ ЗОНЫ
With vehicular traffic restriction | Oacuteeumlegraveoumlucirc atildeaumlaring icircatildeethagraveiacuteegravedividearingiacuteicirc aumlacircegraveaeligaringiacuteegravearing ograveethagraveiacutentildeiumlicircethograveagrave
Opened for vehicles | Oacuteeumlegraveoumlucirc atildeaumlaring icircograveecircethucircograveicirc aumlacircegraveaeligaringiacuteegravearing ograveethagraveiacutentildeiumlicircethograveagrave
Q3 2013 MoscowRUSSIA A Cushman amp Wakefield Research Publication
OFFICE MARKET
IcircAacuteCcedilIcircETH ETHUcircIacuteEcircAgrave В III квартале 2013 г рынок продолжает оставаться активным спрос и предложение сбалансированы ставки аренды стабильны
Тенденция ослабления рынка офисной недвижимости отмечен-ная впервые в предыдущем квартале подкрепляется новыми фактами
Продолжилось снижение общего объема заключаемых сделок аренды и покупки в III квартале общий объем заключенных сделок составил 385 836 кв м что на 20 ниже среднего уровня 2011-2012 гг
Даже небольшой рост объема вывода на рынок новых помеще-ний приводит к увеличению доли свободных помещений За счет одного крупного объекта (Башня Меркурий в Москва-Сити арендуемой площадью 87 547 кв м) объемы ввода в эксплуатацию офисных площадей класса А в III квартале увеличились вдвое относительно средних объемов строительст-ва последних трех лет В результате уровень свободных помещений в классе А в среднем по Москве увеличился на 35 пп а в районе Москва-Сити mdash на 156 пп
Средняя ставка аренды не изменяется в течение последних трех кварталов в то время как инфляции в России за январь-май 2013 превысила уровень 7
ABSORPTION AND NEW CONSTRUCTION CLASSES A AND B (MN SQ M)
OVERVIEW The third quarter of the year saw the office market remain healthy with steady levels of demand Rents held firm There is a tendency of weakening signs in the office market which was noted for the first time in the previous quarter Now it is supported by some new facts
Overall demand level has continued to decrease Q3 take-up is 385836 sq m which is 20 less than the average take-up level for 2011-2012
Even moderate growth of new office space affects the vacancy rate In Q3 the delivery of Mercury Tower in Moscow City submarket (87547 sq m of office rentable area) doubled the quarterly Class A new construction volume (compared to the average number during the last three years) As a result the level of vacant space has increased by 35 percentage points in the Moscow Class A sector Talking about Moscow City submarket the volume of vacant space has increased by 156 points
Rental rates remain unchanged the CPI is above 7 (January-May 2013 data)
Source Cushman amp Wakefield
TOTAL STOCK MOSCOW | ОБЩИЙ ОБЪЕМ ПРЕДЛОЖЕНИЯ В МОСКВЕ 1360 mn sq m
VACANCY RATE | ДОЛЯ СВОБОДНЫХ ПЛОЩАДЕЙ 128
US$ 860 AVERAGE RENTAL RATE CLASS A | СРЕДНЯЯ АРЕНДНАЯ СТАВКА КЛАСС А
Q1-Q3 DEMAND (TAKE-UP) | ОБЪЕМ СДЕЛОК АРЕНДЫ И ПРОДАЖИ В 1-III КВ 2013 1190138 sq m
Q1-Q3 2013 NEW CONSTRUCTION | НОВОЕ СТРОИТЕЛЬСТВО В 1-III КВ 2013 594009 sq m
SUPPLY By the end of Q3 2013 Moscow had 136 mn sq m of quality office space Nine new office buildings were completed with a rentable area of 244587 sq m in Q3 New construction volume remains moderate
Nearly 50 of new office space delivered in 2013 is located in the Moscow suburbs (outside TTR) while the demand is drawn towards the city center So the suburbs are in danger of oversupply during the last four quarters the vacancy rate in suburban submarkets has increased by 58 percentage points from 11 in Q3 2013 to 168 in Q3 2013
In the Central and Prime business areas (with the exception of Moscow City submarket) the vacancy rate is stable while in several central submarkets (such as Tagansky Frunzensky Novoslobodsky) the availability is decreasing
After the recent delivery of Mercury Tower with 87547 sq m of office rentable space Moscow City availability has doubled Hence the Moscow City vacancy rate grew by 156 percentage points up to 327
Altogether there are 154 mn sq m of available office premises in existing buildings and 35 mn sq m is under speculative construction
IumlETHAringAumlEumlIcircAEligAringIacuteEgraveAring По состоянию на конец III квартала 2013 года в Москве насчи-тывалось 136 млн кв м качественных офисов В III квартале было введено в эксплуатацию 9 офисных зданий общей арен-дуемой площадью 244 587 кв м Объемы нового строительства продолжают оставаться умеренными
Около 50 новых офисных площадей вышедших на рынок в 2013 году находятся в удаленных от центра города районах (за пределами ТТК) В то же время спрос продолжает тяготеть к центру города В результате на окраинах города наблюдается тенденция к росту избыточности предложения Так в течение 4-х последних кварталов уровень свободных помещений в рай-онах за пределам ТТК увеличился на 58 пп с 11 (III кв 2012) до 168 (III кв 2013) Внутри ТТК уровень свободных помеще-ний стабилен а в некоторых субрынках (Таганском Фрунзен-ском Новослободском) свободных помещений становится меньше Исключение составляет субрынок Москва-Сити где после ввода в эксплуатацию Башни Меркурий площадью 87 547 кв м объем свободных помещений удвоился что не-медленно привело к росту уровня свободных помещений на 156 пп до уровня 327
Всего в Москве предлагается в аренду или на продажу 154 млн кв м в существующих и 35 млн кв м в строящихся зданиях
Future supply mdash available space in buildings to be delivered in the next 12 month (under construction and under reconstruction) The data is given for the end of the period
Source Cushman amp Wakefield Source Cushman amp Wakefield Moscow Research Forum
DEMAND Overall 12 million sq m of quality office space was leased or bought during Q1-Q3 2013 For the second quarter in a row the total volume of take-up is decreasing In Q3 385836 sq m of quality office space has been transacted which is 20 below the average quarterly level of 2011-2012 Real estate budgets are limited and tenants tend to primarily consider their current location as a viable alternative to a new office
Tenants continue to be interested primarily in existing buildings the proportion of pre-lease agreements in Q1-Q3 was 63 of the total rented space (23 in Q3) In 2013 there is a significant reduction in the proportion of sales deals (from 20 on average in 2011-2012 to around 10 in 2013)
The number of large transactions (over 2000 sq m) continues decreasing The average transaction size has reduced again by 10 compared with the previous quarter and now stands at 528 sq m (taking into account only leasing deals)
NtildeIumlETHIcircNtilde Всего за три квартала 2013 года было арендовано и куплено 12 миллиона кв м качественных офисных помещений Вто-рой квартал подряд наблюдается снижение общего объема сделок В III квартале общий объем сделок составил 385 836 кв м что на 20 ниже среднего уровня 2011-2012 годов Бюджеты на недвижимость и переезды ограничены аренда-торы и арендодатели все чаще находят компромиссы приво-дящие к продлению текущих договоров аренды а не заклю-чению новых сделок в новых зданиях
Арендаторы продолжают интересоваться главным образом введенными в эксплуатацию зданиями ndash в 2013 году (1-III кв) доля договоров предварительной аренды составила менее 63 (в III кв ndash 23) от всех арендованных площадей Доля сделок продажи также продолжает оставаться низкой и со-ставляет не более 10 от всего объема офисных сделок
Продолжает снижаться количество крупных сделок (размером более 2 000 кв м) Средний размер транзакции снизился на 10 относительно предыдущего квартала и в III квартале составил 528 кв м учитывая только сделки аренды
NtildeOgraveAgraveAcircEcircEgrave AgraveETHAringIacuteAumlUcirc В классе А средняя запрашиваемая арендная ставка составляет 860 долларов США В классе Б средняя ставка аренды стабильна на уровне 520 долларов США Ставки аренды для Прайм офисов продолжают находиться на уровне 1 200 долларов США за кв м в год (без НДС и операционных расходов)
Source Cushman amp Wakefield
Source Cushman amp Wakefield
Q3 2013 AVERAGE BASE RENTAL RATES BY BUSINESS AREA СРЕДНИЕ БАЗОВЫЕ СТАВКИ АРЕНДЫ В III КВ 2013 Г ПО БИЗНЕС РАЙОНАМ
AVERAGE RENTAL RATES (US$) СРЕДНИЕ СТАВКИ АРЕНДЫ (ДОЛЛАРЫ США)
Downtown
Central
OTA
Moscow subareas
Moscow is divided into office submarkets areas with similar real estate indicators and dynamics Office submarkets are grouped in office subareas
The Downtown subarea is the territory inside the Garden Ring and the Belorussky business area
The Central subarea is the territory between the Garden ring and TTR (and the more distant SOK and KUT submarkets)
OTA includes the Moscow suburbs
RENTAL RATES In Class A the average asking rental rate is $860 In Class B the average asking rental rate was stable at $520 Rental rates for prime office space is at the level of $1200 per year per sq m (triple net)
IumlETHIcircAtildeIacuteIcircCcedil Несмотря на то что по заявлениям девелоперов более 400 тыс кв м площадей планируется к вводу во IV кв 2013 года мы ожидаем что до конца года будет введено в эксплуатацию дополнительно не более 150ndash200 тыс кв м новых офисов Таким образом в 2013 году сохранится баланс спроса и предло-жения в большинстве офисных субрынков
Высокие объемы строительства на окраинах города и в Москва-Сити не окажут существенного дестабилизирующего влияния на центральные районы До конца 2013 года а также в 2014 году в центральных районах ставки аренды будут стабильны возможен рост в соответствии в уровнем инфляции
LEASE TERMS IN QUALITY BUSINESS CENTERS УСЛОВИЯ АРЕНДЫ КАЧЕСТВЕННЫХ ОФИСНЫХ ПОМЕЩЕНИЙ
RUR USD or Euros (rarely used) per sqmyr For currency exchange landlords use either Central Bank of Russiarsquos official rate or set their own rate or fix the dollar corridor eg 25-40 RUBUSD
Российские рубли доллары США или евро (используется редко) за квм в год Используется обменный курс ЦБ России или используются условные единицы (уе) с фиксированным курсом в коридоре 25-40 рублей за уе
Payments Iumleumlagraveogravearingaeligegrave Quarterly in advance Ежеквартально авансом
Indexation Egraveiacuteaumlaringecircntildeagraveoumlegraveyuml 3-5 or at the level of USA EU CPI 10-15 for RUR agreements Sometimes step-rents are used
3-5 или US CPI 10-15 для рублевых договоров аренды Ингода используется ступенчатая индексация
Other payments Aumlethoacuteatildeegravearing iumleumlagraveogravearingaeligegrave
Operational expences
Операционные расходыThis sort of payments strongly depends on the service list included Average market payments 100-150 USDsqmyr for Class A 80-120 USDsqmyr for Class B
Платежи зависят от состава включенных услуг который может значительно отличаться 100-150 долларов США за квм в год для Класса A 80-120 долларов США за квм в год для Класса Б
VATНДС 18 18Source Cushman amp Wakefield
FORECAST Despite the announcements from developers that they will deliver more than 400000 sq m in Q4 2013 the new construction forecast continues to be rather conservative Just 150000-200000 sq m of new office space might be delivered by the end of this year Consequently in 2013 the supply-demand balance should remain stable
The high volume of office space under construction is the biggest threat at the moment Against the possible local oversupply in Moscow suburbs and Moscow-City submarkets in 2014 central and prime business areas should see a market balance both at the end of 2013 and during the whole 2014 For these areas rental rates are projected to grow in line with inflation
The table contains office buildings announce for delivery in 2013 with rentable area more than 15000 sq m Delivered buildings are included disregarding the size
TOTAL mdash Office rentable area or all office buildings announced for delivery in 2013 (including small buildings with office rentable less than 15000 sq m)
DOWNTOWNBlackampWhite Complex (bld White) ZAM B+ 13000 Q1Rosso Riva ZAM A 11947 Q1Park Tower BEL B+ 11850 Q1Chistoprudnyy bul 8 bld 1 CBD B- 4730 Q1White Gardens BEL A 63900 Q1Wall Street ZAM A 20493 Q2Vishnevy Sad CBD B+ 6736 Q2Domino ZAM A 6216 Q3Lukoil build-to-suit CBD B+ 35000 Q3CENTRALDubininskaya ul 33B SCH B+ 3000 Q1City Point BC CTY B+ 9951 Q1Sinitsa Plaza BAS B+ 13496 Q2Mercury City CTY A 87574 Q3Poluyaroslavskiy Bolshoy per 102 bld BAS B+ 2294 Q3Poklonnaya ul vl 3 KUT A 85572 Q4Park Pobedy KUT B+ 54000 Q4Nizhegorodsky Business Centre phase II BAS B- 37100 Q4Nizhegorodsky Business Centre phase I BAS B- 23000 Q4Arma 19 BAS B+ 19080 Q4Golden Gate BAS B+ 16000 Q4OTANewton Plaza SE B+ 52000 Q1Danilovskaya Manufaktura Sitsevyi Korpu SE B+ 3396 Q1iCube SW B+ 15256 Q1Obrucheva ul 52 bld3 SW B- 23300 Q1Lotte Business Centre SW B+ 38480 Q1Streamline NE B+ 11048 Q1Quadrum SUB B+ 24650 Q2Park Mira NE B+ 7000 Q2Format Complex II SUB B- 9122 Q2Dobrolyubova 6 bld 5 NE B- 4699 Q3Leninsky 119 SW A 15400 Q3Central Street NE B+ 6423 Q3Smart Park SW B+ 10260 Q39 akrov phase II SW B+ 62300 Q3Country Park Phase III SUB A 19120 Q3Riga Land bld 5 (bld A) (phase II) SUB B+ 40000 Q4Solutions BP bld 3 SW B+ 19500 Q4Avrora NE B- 21600 Q4Neo Geo SW B- 70000 Q4Novator office-hotel complex SUB B+ 24000 Q4Mebe One Khimki Plaza SUB A 26000 Q4
TOTAL 217236
TOTAL 421653
TOTAL 551253
Q3 2013 MoscowRUSSIA A Cushman amp Wakefield Research Publication
HOSPITALITY
ADR IN AUGUST 2013 | СРЕДНЯЯ ЦЕНА ЗА НОМЕР В АВГУСТЕ 2013 $152
QUALITY SUPPLY | ТЕКУЩИЙ ОБЪЕМ КАЧЕСТВЕННОГО ПРЕДЛОЖЕНИЯ 14200 rooms
OCCUPANCY | ЗАПОЛНЯЕМОСТЬ 77
RevPAR | СРЕДНИЙ ДОХОД НА НОМЕР $117
IumlETHAringAumlEumlIcircAEligAringIacuteEgraveAring По оценке департамента гостиничного бизнеса и туризма совокупный объем номерного фонда в Москве на конец III квартала 2013 г составил свыше 48 тыс номеров из них доля качественного предложения составила порядка 30 общего предложения или 142 тыс номеров
Новое предложение за III квартале 2013 г в сегменте качествен-ных гостиниц составило 1138 номеров и было сформировано за счет ввода в эксплуатацию 4-х гостиниц разной ценовой категории
В ноябре 2013 г ожидается открытие гостиниц под управлени-ем оператора Accor комплекс из трех отелей расположен по адресу ул Бахрушина вл 11 В состав комплекса войдут 3 гостиницы разной ценовой категории Mercure на 158 номеров (Upscale) Ibis на 190 номеров (Midscale) Adagio на 149 апартаментов (Midscale)
Это увеличит предложение на рынке качественных отелей минимум на 497 номеров Ожидаемое в 2013 г открытие гостиницы Marriott Novy Arbat (234 номера) перенесено на 1 квартал 2014 года
SUPPLY According to the Department of Hospitality and Tourism the cumulative number of rooms in the Moscow hotel market at the end of Q3 2013 is estimated at more than 48000 rooms with the proportion of high-quality supply at about 30 or 14200 rooms
The increase in high-quality segment by the end of Q3 2013 totaled 1138 rooms resulting from the commissioning of 4 hotels in different price categories
In addition Accor will open three new hotels in November Q4 2013 in the hotel complex located at ul Bakhrushina 11 The complex of hotels includes three brands Mercure with 158 rooms (Upscale) Ibis with 190 rooms (Midscale) and Adagio with 149 rooms (Midscale)
We believe that the total supply of international grade rooms will increase by 497 by the end of 2013 It was expected that more rooms would have been available but the opening of the Marriot Noviy Arbat (234 rooms) was postponed till the Q1 2014
QUALITY MOSCOW HOTEL MARKET STRUCTURE Q3 2013 YTD
NtildeOgraveETHOacuteEcircOgraveOacuteETHAgrave EcircAgravetimesAringNtildeOgraveAcircAringIacuteIacuteUcircOtilde AtildeIcircNtildeOgraveEgraveIacuteEgraveOuml IgraveIcircNtildeEcircAcircUcirc III EcircAcirc 2013
Средняя цена за номер (ADR) в августе 2013 г составила $152 что на 5 выше уровня августа 2012 г Положительная динамика обеспечена за счет гостиниц высокой ценовой категории максимальный рост средней цены за номер по отношению к результатам за аналогичный период 2012 г продемонстрировал рынок гостиниц класса Upscale 16 Среднеценовые объекты напротив работали с более демократичными группами спроса на рынке гостиниц класса Midscale было отмечено снижение показателя ADR на 7 по сравнению с августом 2012 г
Символическое падение ставок за номер на уровне 043 и 221 было отмечено также в сегментах Upper Midscale и Luxury соответственно что в целом характерно для августа ndash наиболее laquoтуристскогоraquo месяца в году
В отношении результатов 2013 г (по данным на август) рынок качественных гостиниц показал небольшое снижение показате-ля ADR (-11) по сравнению с прошлым годом что равносиль-но стабилизации в том числе с учетом ослабления рубля
Наиболее агрессивными с точки зрения ценовых ожиданий остаются гостиницы категории Luxury показывающие на фоне общих понижающих корректировок цены небольшой рост с $375 до $376 за номер
Московские гостиницы предлагают широкий разброс цен по сегментам наиболее дорогие ndash гостиницы категории Luxury где ADR в августе 2013 г составил $315 что на 10698 выше среднего показателя по рынку качественных гостиниц
Ценовой разрыв отелей категории Luxuгy со следующим за ним сегментом внушителен средняя цена за номер в гостиницах категории Upper Upscale уже только на 2875 превысила средний показатель по рынку и составила $197 Стоимость номера в гостиницах категории Upscale сравнима со средним по рынку значением и составляет $160
Цены за номер в гостиницах класса Upper Midscale и Midscale ниже среднерыночных на 30 и 48 соответственно и составляют $105 и $79 за номер (данные за август)
AVERAGE DAILY RATE US DOLLAR (ADR) AUGUST 2013 YTD
QUALITY HOTEL MARKET TRADING Average daily rate in August 2013 estimated to $152 which is 5 higher than in August 2012 This positive dynamic was ensured by high-quality hotels the highest ADR growth was recorded in the Upscale segment ndash Up 16 compared to the same period last year Midscale market in this period was oriented to more democratic groups of demand ADR declined by 7 comparing to August 2012
The fall in ADR at the level of 043 and 221 was also recorded in the Upper Midscale and Luxury segments respectively but that is typical for the August ndash the most tourist month of the year
The results of 2013 (August YtD) showed a symbolic decrease in ADR (-11) comparing to 2012 that can be interpreted as a stabili-zation taking into account the weakening of the Ruble
The most aggressive in terms of price expectations remain Luxury market segment showing slight increase from $375 to $376 per room comparison with the general lowering of prices
Moscow hotels offer a wide range of prices by segment the most expensive ndash Luxury with ADR in August about $315 it is 10698 higher than the average for the Moscow quality market
There is an impressive gap between Luxury hotel prices and prices for the Upper Upscale segment Average daily rate for Upper Upscale is about $197 and only 2875 higher than the average for the Moscow quality market
0
50
100
150
200
250
300
350
400
2010 2011 2012 2013
Luxury Upper Upscale
Upscale Upper Midscale
Midscale Moscow average
0
10
20
30
40
50
60
70
80
2010 2011 2012 2013
Luxury Upper UpscaleUpscale Upper MidscaleMidscale Moscow average
25
MARKETBEAT Q3 2013
NtildeIumlETHIcircNtilde
Средняя годовая загрузка качественных гостиниц Москвы в августе 2013 г составила 77 что на 11 выше данного показателя за аналогичный период прошлого года
Максимально высоким спросом в Москве пользуются гостиницы категории Upper Midscale и Midscale загрузка которых в августе фиксировалась на уровне 854 и 826 соответственно
Одной из особенностей рынка гостиниц Москвы в III кв 2013 г стала высокая загруженность качественных и центрально расположенных гостиниц в августе ndash традиционно низком из-за наступления laquoсезона отпусковraquo Нетипично высокая загрузка стала следствием увеличения туристских потоков в том числе за счет проведения Универсиады в Казани добавившей laquoтранзитныхraquo клиентов московским отелям
По итогам 2013 г по состоянию на август рынок качественных гостиниц показывает рост спроса по сравнению с прошлым годом практически по всем сегментам Рост спроса простимули-рован как ростом потока ночующих посетителей в Москву так и стагнацией цен на размещение последнее обстоятельство говорит о продолжающемся периоде неопределенности
OgraveAringIacuteAumlAringIacuteOumlEgraveEgrave
Среднее значение дохода на номер (RevPAR) за август 2013 г выросло на 171 и составило $117 против $100 в 2012 г В то же время по итогам 2013 г по состоянию на август динамика RevPAR по сегментам колебалась от 84 в Midscale до -46 в отелях категории Upper Midscale
Мы полагаем что тенденции к повышению среднерыночной доходности на номер (+12 YtD) за счет гибкой ценовой политики реагирующей на изменения спроса сохранится и в ближайшей перспективе В 2014 г гостиницы вышедшие на рынок в 2013 г окажут более выраженное воздействие на рыночную ситуацию за счет чего показатели RevPAR по сегменту Luxury и особенно Upper Midscale вряд ли существен-но превзойдут текущие показатели и будут колебаться от слабоотрицательных до слабоположительных значений в начале и конце года
DEMAND The average annual occupancy of quality hotels in Moscow in August 2013 was about 77 which is 11 higher than in the same period last year
Maximum high demand in Moscow hotels was in the Upper Midscale and Midscale category with occupancy in August at the level of 854 and 826 respectively
One of the features of the market of Moscow hotels in Q3 2013 was the high occupancy of quality hotels and especially the central located hotels ndash traditionally low in August because of the holiday season Unusually high occupancy was a result of increased tourist flows including through the Universiade in Kazan which added transit clients for Moscow hotels
In general up to August 2013 (YtD) the Moscow quality hotel market shows a growth in demand comparing to 2012 in almost all segments (reduced occupancy in Upper-Midscale segment by 03 pp can be seen as an insignificant adjustment) Demand growth is stimulated by the growing stream of domestic and international visitors staying overnight in Moscow and the stagnation of prices for accommodation the last point indicates the continuing period of uncertainty in the market
TRENDS IN REVENUE Average revenue per available room (RevRAR) in August 2013 increased by 171 to $117 versus $100 in August 2012
At the same time according to the results of August 2013 RevPAR dynamics by segment ranged from 84 in the Midscale segment to -46 in the Upper Midscale hotels We believe that the tendency to stimulate the RevRAR increase which the flexible price sensible of demand change will continue in the near future In 2014 the new hotels will have a more pronounced effect on the general market situation whereby RevPAR (especially for Luxury and Upper Midscale) unlikely to surpass itrsquos current estimations and will vary from slightly negative to low positive values at the beginning and end of the year
За III квартал 2013 года в эксплуатацию было введено более 235 тыс кв м качественных складских площадей
Ставки аренды остаются стабильными и составляют в среднем $135 за кв м в год в классе А без НДС операци-онных расходов и коммунальных платежей
Цена продажи составляет $1 200- $1 300 за кв м в типовых проектах класса А
Доля вакантных площадей в складах класса А за полугодие не изменилась и составляет 1
Объем арендованных и купленных складских площадей в III составил более 350 тыс кв м
Регионы
В большинстве регионов средние ставки аренды в классе А за прошедший квартал не изменились за исключением Новосибирска и Нижнего Новгорода где ставки выросли на 4-6
Объем арендованных и купленных складских площадей в III квартале составил более 85 тыс кв м
SUMMARY Moscow
In Q3 2013 more than 235000 sq m of quality warehouse space were put into operation
Rental rates remain stable at an average of $135 per sq m per year in A Class excluding VAT operating expenses and utility
The price of sale is $1200 - $1300 per sq m in typical projects of class A
The vacancy rate in Class A warehouses for the half of the year remains unchanged at 1
The volume of leased and purchased warehouse space in Q3 amounted to 350000 sq m
Regions
The average rental rates in Class A have not changed for the quarter in most regions except Novosibirsk and Nizhny Novgorod where rates have increased by 4-6
The volume of leased and purchased warehouse space in Q3 amounted to 85000 sq m
$132
$130
$140
$105
$110
$135
$135
$135
$80
$90
$100
$110
$120
$130
$140
$150
2006 2007 2008 2009 2010 2011 2012 2013F
KEY EXPECTATIONS
STABILITY
0
200
400
600
800
1000
1200
1400
1600
1800
2007 2008 2009 2010 2011 2012 2013F 2014F
27
MARKETBEAT Q3 2013
Source Cushman amp Wakefield
Source Cushman amp Wakefield
Source Cushman amp Wakefield
Source Cushman amp Wakefield
ОСНОВНЫЕ ТЕНДЕНЦИИ Объем нового строительства за 1-III кв 2013 года в Московском регионе составил 550 тыс кв м что соответствует аналогично-му показателю прошлого года Объем арендованных и куплен-ных площадей по итогам прошедших трех кварталов составил белее 830 тыс кв м что приблизительно соответствует показа-телю прошлого года
В регионах объем нового строительства в регионах за первые три квартала составил 239 тыс кв м что на треть меньше про-шлогоднего Арендовано куплено 250 тыс кв м что больше прошлогоднего показателя на 20
ПРЕДЛОЖЕНИЕ В Московском регионе в III квартале 2013 года предложение увеличилось на 235 тыс кв м
В минувшем квартале были построены
Логопарк Север (110 тыс кв м) девелопер Каравелла
Два новых корпуса в логистическом парке Климовск (48 тыс кв м) девелопер Raven Russia
Объем нового строительства соответствует показателям преды-дущего года но темпы строительства ниже заявленных девело-перами Основная проблема mdash задержки в строительстве Боль-ше всего это касается новых девелоперов длительное время работающие на рынке компании укладываются в заявленные сроки Поэтому до конца года будет построено до 1 млн кв м складских площадей
На рынке Москвы сохраняется дефицит готовых к въезду склад-ских площадей Все проекты сдаются или продаются на этапе строительства
Чистые средние ставки аренды в течении прошедшего квартала не изменились и составляют $135 за кв м при этом разброс ставок остается высоким
В 2014 году девелоперы обещают построить около 15 млн кв м складских площадей однако по нашем оценкам из-за задер-жек при строительстве построено будет на 30 меньше
KEY TRENDS The volume of new construction for Q1-Q3 2013 in the Moscow region amounted to 550000 sq m which corresponds to the same period of last year The volume of leased and purchased land based on the results of Q1-Q3 was more than 830000 sq m which approximately relative to the previous year figure
The volume of new construction in the regions for the first three quarters amounted to 239000 sq m which is a three times less than last year indicator 250000 sq m were leased and sold which is 20 more than last year figure
SUPPLY In Q3 2013 supply in Moscow region increased by 235000 sq m
In the last quarter were put into operation
bull Logistics Park North (110000 sq m) developer is Caravella
bull Two new phases in the logistics park Klimovsk (48000 sq m) developer is Raven Russia
The volume of new construction complies with the previous year but below the pace of construction announced by developers The main problem is the delays in construction mostly it concerns new developers Experienced companies meet the announced deadlines Therefore there will be built up to one million sq m of warehouse space until the end of the year
In Moscow there is a lack of ready-to-move storage space All projects are sold or bought during the construction process
Net average rental rates have not changed during the last quarter and amounted to $135 per sq m while the spread rate remains relatively high
In 2014 developers expect to build nearly 15 mn sq m of warehouse space however according to our estimations the volume of construction will be 30 less due to the development process delays
DISTRIBUTION OF QUALITY DEVELOPMENTS IN THE PIPELINE FOR 2013-2014 (lsquo000 SQ M) РАСПРЕДЕЛЕНИЕ ПЛАНИРУЕМЫХ К ВВОДУ В 2013-2014 ГГ СКЛАДСКИХ ПЛОЩАДЕЙ В МОСКОВСКОЙ ОБЛАСТИ ТЫС КВ М
DISTRIBUTION OF WampI SPACE IN THE MOSCOW REGION (lsquo000 SQ M) РАСПРЕДЕЛЕНИЕ СКЛАДСКИХ ПЛОЩАДЕЙ В МОСКОВСКОЙ ОБЛАСТИ ТЫС КВ М
В регионах в минувшем квартале было построено только 43 тыс кв м качественных складских площадей против 117 тыс в прошлом Все новые объекты построены рядом с Санкт-Петербургом
Всего в 2014 году в регионах будет построено боле 290 тыс кв м против 410 тыс кв м в прошлом В большинстве регионов дефицита складских площадей не наблюдается Исключение составляет Санкт-Петербург Екатеринбург и Ростов-на-Дону
Чистые ставки аренды в регионах в III квартале 2013 года не изменились за исключением Новосибирска и Нижнего Новгорода где они немного выросли до $120 и $123 за кв м соответственно
Source Cushman amp Wakefield
TAKE UP lsquo000 SQ M ОБЪЕМ АРЕНДОВАННЫХ И КУПЛЕННЫХ ПЛОЩАДЕЙ ТЫС КВ М
Source Cushman amp Wakefield
During the past quarter only 43000 sq m of quality warehouse space was built In the regions as against last year fiqure (117000 sq m) All new premises were built near St Petersburg
Comparing to last year figure (410000 sq m) more than 290000 sq m is going to be built in the regions in 2014 In most regions there is no lack of warehouse spaces observed The exceptions are St Petersburg Yekaterinburg and Rostov-on-Don
Net rental rates have not changed in the regions in Q3 except Novosibirsk and Nizhny Novgorod where they rose slightly to $120 and $123 per sq m respectively
2013 PIPELINE ОБЪЕКТЫ ЗАЯВЛЕННЫЕ К СТРОИТЕЛЬСТВУ В 2013 Г
PROJECT DEVELOPER GRADE DIRECTION HIGHWAYDISTANCE FROM
MKAD KMTOTAL AREA
000 SQ MEXPECTED
DELIVERY
Infrastroy Bykovo Infrastroy А E Egorevskoe 17 6155 Q1
Infrastroy Bykovo Infrastroy А E Egorevskoe 17 6193 Q4
Klimovsk LP Raven Russia A S Simferopolskoye 23 4772 Q3
Logopark Sever Karavella A N Rogachevskoye 30 11023 Q3
PNK Chekhov II PNK group A S Simferopolskoye 50 10424 Q2
PNK Chekhov II PNK group A S Simferopolskoye 50 5531 Q4
PNK Vnukovo PNK group A SW Kievskoe 19 10568 Q1
South Gate IP Radius group A S Kashirskoye 30 2070 Q2
South Gate IP Radius group A S Kashirskoye 30 3000 Q4
СПРОС В Московском регионе за I-III кварталах 2013 г было арендовано и куплено более 850 тыс кв м качественных складских площадей из них 235 тыс в III квартале что соответствует прошлогодним показателям
Наиболее крупные сделки в минувшем квартале
Автомобильный концерн Volkswagen купил 50 тыс кв м в складском комплексе PNK Чехов 2 девелопер PNK Group
Компания Верный купила 43 тыс кв м в складском комплексе PNK Север девелопер PNK Group
Автомобильный концерн General Motors арендовала 40 тыс кв м в индустриальном комплексе Южные врата
Следует отметить что большое количество качественных складских площадей было арендовано и куплено в III квартале 2013 г производственными компаниями при этом логистиче-ские компании и дистрибьюторы наоборот купили и арендова-ли меньшее количество площадей
Так же следует отметить увеличение доли продаж в III квартале до 42 против 14 во II квартале в структуре поглощения
На региональных рынках за минувший квартал было арендовано и куплено более 85 тыс кв м всего с начала года более 250 тыс кв м что почти на 20 выше аналогичного показателя прошлого года и на 5 среднего значения за последние 5 лет Этот показатель во многом обусловлен самой крупной сделкой за всю историю рынка складской недвижимости Санкт-Петербурга по предварительной продаже 43 тыс кв м компанией PNK Group продуктовой сети laquoВерныйraquo в складском комплексе PNK КАД
Сделки на такие большие площади позволяют девелоперу возобновить строительство в регионах но за период с IV кв 2012 по III квартале 2013 г Было заключено только 4 сделки более 25 тыс кв м Большинство сделок в регионах заключает-ся на складские площади до 10 тыс кв м
STRUCTURE OF DEMAND MOSCOW СТРУКТУРА СПРОСА МОСКВА
DEMAND In the Moscow region in Q1-Q3 2013 more than 850000 sq m were rented and purchased talking about quality warehouse space The Q3 indicator is 235000 sq m which is the same to the last years performance
The largest deals in the last quarter
bull Car manufacturer group Volkswagen bought 50000 sq m in a warehouse complex PNK Chekhov 2 developer is PNK Group
bull The Verniy company bought 43000 sq m in a warehouse complex PNK North developer is PNK Group
bull Automobile сar manufacturer General Motors leased 40000 sq m in the industrial complex South Gate
It should be noted that a large number of quality warehouse space was leased and purchased in the Q3 2013 by manufacturing companies while logistics companies and distributors on the contrary have bought and rented a smaller amount of warehouse space
It should be also mentioned the increasing sales in Q3 up to 42 comparing to 14 in the previous quarter for the both leased and bought premises
At the regional markets for the last quarter it was rented and purchased more than 85000 sq m Since of the beginning of the year more than 250000 sq m were rented and purchased which is almost 20 higher than last year and 5 higher than the average number for the last 5 years This indicator is largely due to the largest deal in the history of the warehouse property market of St Petersburg on the pre-sale of 43000 sq m by PNK Group to the food supplier Verniy in the warehouse complex PNK KAD
Such large deals allow developer to resume construction in the regions However between Q4 2012 and Q3 2013 it was only 4 deals amounted more than 25000 sq m made Most of the deals in the region are for warehouse space up to 10000 sq m
ТЕНДЕНЦИИ С начала прошлого года на рынок складской недвижимости остается стабильным Ежегодный спрос в Московском регионе составляет около 1 млн кв м в год Средние ставки аренды в классе А составляют $135 за кв м в год без НДС операцион-ных расходов и коммунальных платежей доля вакантных площадей сохраняется на уровне 1 Строительство большин-ства новых складских объектов будет начинаться только после заключения предварительных договоров аренды и продажи
Изменение ситуации в ближайшей перспективе ожидать не стоит В условиях низкого роста экономики страны начинать спекулятивное строительство большой риск повторения ситуации 2008 года поэтому предложение будет подстраивать-ся под спрос
На региональных рынках продолжится тенденция увеличения дефицита готовых к въезду складских площадей Не смотря на высокой спрос на складские объекты в регионах девелоперам не удается сформировать достаточных портфель предваритель-ных договоров аренды для начала строительства Исключение составляет Санкт-Петербург Свердловская область юг России где спрос или условия рынка обеспечили девелоперам формирование такого портфеля Мы прогнозируем что до конца года в регионах будет реализовано более 300 тыс кв м складских площадей
Source Cushman amp Wakefield
STRUCTURE OF DEMAND REGIONS СТРУКТУРА СПРОСА РЕГИОНЫ
TRENDS Since the beginning of the last year the warehouse market has remained stable Annual demand in the Moscow region is about one mn sq m per year average rental rates for Class A is $135 per sq m per year excluding VAT operating expenses and utility costs the vacancy rate remains at 1 Construction of the majority of new storage facilities will start only after the preliminary lease or sale contract signing up
In the nearest future the situation would remain the same It is the huge risk to start the new speculative construction in a low-growth economic situation as it is the threaten to repeat the 2008 year crisis the supply will adapt to the demand
The trend of growing deficit of ready-to-move warehouse spaces continues at the regional markets In spite of the high demand for storage facilities in the regions for developers it is still complicated to form a sufficient portfolio of preliminary agreements for the start of construction Exceptions are St Petersburg Sverdlovsk region and south Russia where the demand or market conditions provided developers with the opportunity to form such a portfolio We predict that by the end of the year in the regions will be sold over 300000 sq m of warehouse space
WampI MARKET IN RUSSIA ETHUcircIacuteIcircEcirc NtildeEcircEumlAgraveAumlNtildeEcircEgraveOtilde IumlIcircIgraveAringUgraveAringIacuteEgraveEacute Acirc ETHIcircNtildeNtildeEgraveEgrave
VACANCY RATE (EOY) Paris (Ile de France) 89 81 99 126 102 84 81 89 804
Budapest 59 172 173 188 195 208 194 217 2283
Warsaw 89 74 112 171 194 173 146 1621 1592
Madrid 55 38 37 55 73 84 93 95 972
TAKE UP 000 SQ MParis (Ile de France) 1 005 700 640 601 814 837 563 208 58
Budapest 152 229 308 280 210 327 355 31 21
Warsaw 260 445 556 216 451 743 483 183 112
Madrid 1 225 918 630 325 390 270 225 60 47
2013
36
MARKETBEAT Q3 2013
RESEARCH DEPARTMENT IcircOgraveAumlAringEuml EgraveNtildeNtildeEumlAringAumlIcircAcircAgraveIacuteEgraveEacute
Further information and copies of this report are available from Ellina Krylova
EllinaKrylovaeurcushwakecom
The information provided in this report is intended for informational purposes only and should not be relied on by any party without further independent verification Classifications of individual buildings are reviewed on a continuing basis and are subject to change The standards used in this process are consistent with those used by Moscow Research Forum and in the United States by the Society of Industrial and Office Realtors (SIOR) and BOMA International Reproduction of this report in whole or part is permitted only with written consent of Cushman amp Wakefield Data from this report may be cited with proper acknowledgment given
copy 2013 Cushman amp Wakefield All rights reserved
MORE INFORMATION AND CONTACTS ARE AVAILABLE ON WWWMARKETBEATRU EgraveIacuteOcircIcircETHIgraveAgraveOumlEgraveszlig IcircAacute IcircOgraveAumlAringEumlAring EgraveNtildeNtildeEumlAringAumlIcircAcircAgraveIacuteEgraveEacute Egrave IumlOacuteAacuteEumlEgraveEcircAgraveOumlEgraveEgrave AumlIcircNtildeOgraveOacuteIumlIacuteUcirc IacuteAgrave WWWMARKETBEATRU
DENIS SOKOLOV PARTNER RESEARCH DIRECTOR DenisSokoloveurcushwakecom
LADA BELAYCHUK ASSOCIATE DIRECTOR DEPUTY RESEARCH DIRECTOR LadaBelaychukeurcushwakecom
MAXIM ILYIN CONSULTANT CAPITAL MARKETS Maximilyineurcushwakecom
ALEXANDER KUNTSEVICH ANALYST WampI PROJECT MANAGEMENT AlexanerKuntsevicheurcushwakecom
TATYANA DIVINA SENIOR ANALYST
TatyanaDivinaeurcushwakecom
wwwcushmanwakefieldcom
13
MARKETBEAT Q3 2013
1 8281 620
1 895
1 561 1 6351 426
1 872
787
1 600
2 172
2006 2007 2008 2009 2010 2011 2012 Q1-Q3 2013
Announced developers plans CW Forecast New construction YTD
НОВОЕ СТРОИТЕЛЬСТВО В III квартале в России было введено в эксплуатацию 15 новых торговых центров общей торговой площадью 292 750 кв м География нового строительства ndash от Иркутска и Ангарска до Сочи В основном стоятся торговые центры (75 всех новых качественных торговых площадей) также торговые площади открываются в многофункциональных комплексах Средний размер новых торговых центров уменьшается в 2013 году он составляет 26 тыс кв м что на 30 меньше чем в 2011 году
В III квартале крупнейшим открытым торговым объектом стал торгово-развлекательный центр Жемчужная Плаза (GLA 48 тыс кв м) в Санкт-Петербурге построенный в рамках комплексной застройки микрорайона Балтийская Жемчужина
В III квартале в Москве был открыт один новый торгово-развлекательный центр Райкин Плаза Также были открыты но-вые фазы комплекса Отрада В Москве новые качественные торговые площади строятся в разных форматах ndash торгово-развлекательные центры (Рио Райкин плаза) аутлет-центры (Внуково и Fashion House) многофункциональные комплексы (Белая Площадь Эволюция) До конца 2013 г в Московском регионе (г Павловский Посад) планируется открытие ритейл парка Белла Вита (GLA 36 тыс кв м)
NEW CONSTRUCTION 2013 RUSSIAQUALITY RETAIL STORES НОВОЕ СТРОИТЕЛЬСТВО В 2013 ГОДУ РОССИЯ КАЧЕСТВЕННЫЕ ТОРГОВЫЕ ОБЪЕКТЫ
Source Cushman amp Wakefield
QUALITY RETAIL CONSTRUCTION rsquo000 SQ M RUSSIA СТРОИТЕЛЬСТВО КАЧЕСТВЕННЫХ ТОРГОВЫХ ПЛОЩАДЕЙ ТЫС КВ М РОССИЯ
NEW CONSTRUCTION In Q3 15 new retail centers were delivered in Russia with a total area of 292750 sq m The geography of new construction is located from Irkutsk and Angarsk to Sochi The majority of new premises are located in shopping centers (75 of new quality retail space) besides retail space in multifunctional complexes Average area of newly constructed shopping centers is decreasing in 2013 it was about 26000 sq m which is 30 lower than in was in 2011
In the third quarter retail and entertainment center Pearl Plaza (GLA 48000 sq m) was awarded the name of the largest retail project in St Petersburg It was built as a part of the complex development in the Baltic Pearl micro region
Besides the new shopping and entertainment mall Raykin Plaza was delivered in the Q3 Also new phases of the Otrada complex were delivered New quality retail spaces are developed in various formats in Moscow ndash shopping and entertainment centers (Rio Raykin Plaza) outlet-centers (Vnukovo and Fashion House) multifunctional complexes (White Square Evolution) Till the end of 2013 it is planned to open retail park Bella Vita (GLA 36000 sq m) in the Moscow region (Pavlovskiy Posad city)
Standard lease terms for gallery tenants are between 3-5 years break options are rare For anchor tenants (including fashion anchors) lease terms are up to 20 -25 years and break options are becoming popular
Rents are typically payable monthly in advance Turnover percentage rents are increasingly seen in shopping centres Rental rates are generally calculated in USD Euricirc or commercial units are used In less quality shopping centres rental rates are calculated in RUR
Annual indexation is typical between 3-10 or at a level of USD EU CPI The practice of premium key money payments is seldom seen in Russia Rent reviews are rare on the market
Service ChargesIcirciumlaringethagraveoumlegraveicirciacuteiacuteucircaring iumleumlagraveogravearingaeligegrave
Service charge is payable by tenants at either an ldquoopen bookrdquo basis or more common as a fixed cost Utilities payments are charged on consumption Building insurance is normally charged back to tenant via service charge
Local property taxes are not payed separately they are generally included in the service charges Iacuteagraveeumlicircatilde iacuteagrave iacutearingaumlacircegraveaeligegraveigraveicircntildeograveuuml icircaacuteucircdivideiacuteicirc acirceumlthorndivideagravearingograventildeyuml acirc icirciumlaringethagraveoumlegraveicirciacuteiacuteucircaring iumleumlagraveogravearingaeligegrave
Other costsAumlethoacuteatildeegravearing iumleumlagraveogravearingaeligegrave
EcircIcircIgraveIgraveAringETHtimesAringNtildeEcircEgraveAring OacuteNtildeEumlIcircAcircEgraveszlig Acirc OgraveIcircETHAtildeIcircAcircUcircOtilde OumlAringIacuteOgraveETHAgraveOtilde Ставки аренды для помещений в торговых галереях качествен-ных торговых центров в Москве находятся в диапазоне от 500 до 4 000 долларов США (за кв м в год без НДС и других платежей) В течение трех кварталов 2013 и всего прошедшего 2012 года ставки аренды в торговых центрах были стабильны Прайм ритейл индикатор в Москве составляет 3 800 долларов США (за кв м в год без НДС и других платежей) Однако в 2013 году наметилась тенденция к повышению ставок аренды в лучших торговых центрах поэтому рост ставок на лучшие помещения может быть выше 5 (текущий консервативный прогноз)
Вне Москвы ставки аренды в торговых центрах в среднем на 30-60 ниже в зависимости от региона
Дополнительно к ставке аренды ритейлеры платят сервисные сборы за обслуживание (150-250 долларов США за кв м в год для помещений размером менее 500 кв м) за маркетинг (10-25 долларов США за кв м в год) также иногда бывают и другие дополнительные платежи
Source Cushman amp Wakefield
Source Cushman amp Wakefield
PRIME RETAIL INDICATOR MOSCOW ПРАЙМ РИТЕЙЛ ИНДИКАТОР В ТОРГОВЫХ ЦЕНТРАХ МОСКВА
Prime retail indicatormdashbase asking rental rate for the 100-200 sq m gallery unit at the ground floor of the prime shopping centers US$ per sq m per annum triple net
INDICATIVE RENTAL RATES IN QUALITY SHOPPING CENTER RETAIL GALLERIES MOSCOW СРЕДНИЕ АРЕНДНЫЕ СТАВКИ В ГАЛЕРЕЕ КАЧЕСТВЕННЫХ ТОРГОВЫХ ЦЕНТРОВ МОСКВА
COMMERCIAL RATES IN SHOPPING MALLS Moscow retail gallery rental rates are in the range of US$ 500- 4000 (per sq m per year before VAT and other expenses) depending on the size of the retail unit and the type of retailer Throughout Q1-Q3 and the whole of 2012 rental rates were stable across all sub-sectors
Moscowrsquos prime retail indicator is US$ 3800 per sq m per annum as a base rate However a tendency towards rate increases was observed in 2013 and near future growth may be higher than 5 (our current conservative estimate)
In other cities rental rates in shopping malls are typically 30 to 60 below Moscow levels
Additionally among other payments there are operational expenses (US$ 150-250 per sq m annually for units smaller than 500 sq m) marketing (US$ 10-25 per sq m annually) and others depending on the project
QUALITY RETAIL LEASE STRUCTURE СТРУКТУРА ДОГОВОРОВ АРЕНДЫ В КАЧЕСТВЕННЫХ ТОРГОВЫХ ПОМЕЩЕНИЯХ
ANCHORS
lt100 100 - 300 300 - 1200 1200 - 3500 3500-7000
Food court $1800-$2000
Kiosks $5000-$8000
Restaurant $600-$1000 $700
Clothing $1 600 $1 200 $700 $400
Shoes $2 200 $1 700 $1 200 $800
White and Brown $500
Supermarket $500-$600
Hypermarket $250-$450
Cinema $250-$320
BUSINESSGLA SQ M
RETAIL GALLERY MINI ANCHORS
Source Cushman amp Wakefield
15
MARKETBEAT Q3 2013
ТОРГОВЫЕ УЛИЦЫ На центральных торговых улицах свободно (предлагается в аренду или готовится к открытию) около 5 имеющихся поме-щений Ставки аренды в торговых коридорах стабильны В по-следние несколько лет есть тенденция к увеличению сроков аренды если еще три года назад договоры были чаще всего краткосрочные (на 11 месяцев) то сейчас трехлетние договора аренды становятся все более распространенными
Анализ торговых помещений на наиболее проходимых торго-вых улицах в центре города показывает что самыми популяр-ными категориями арендаторов являются предприятия питания (кафе рестораны) и магазины одежды и обуви которые занима-ют 29 и 21 всех помещений на этих улицах соответственно Значимыми арендаторами являются компании предлагающие услуги (спа парикмахерские медицинские услуги предприятия связи салоны фотографии юридические услуги) ndash они занимают 10 всех торговых помещений на главных улицах центра горо-да По 5 всех площадей занимают отделения банков ювелир-ные салоны магазины косметики и аксессуаров
Source Cushman amp Wakefield
HIGH STREETS Nearly 5 of the existing premises are freely available (are offered for lease or being prepared for delivery) in the central high streets Rental rates in the trade corridors are stable There is a tendency for increasing lease terms in the last few years As an example three years ago contracts used to be short-term mostly (11 months) and now agreements for the 3 and 5 years period become more and more widespread
The analysis of the retail spaces on the most passable areas in the city centre shows that the most popular categories of tenants are catering (cafe restaurants) and clothing shops They occupy 29 and 21 of all premises respectively Significant tenants are those who offers the following services spa hairdressers medical services communications companies photography and legal services ndash all of them occupy 10 of retail premises on the main streets of the city banks jewelry stores cosmetic stores and accessories occupy 5
AVERAGE RENTAL RATES ON HIGH STREETS IN MOSCOW СРЕДНИЕ АРЕНДНЫЕ СТАВКИ В ТОРГОВЫХ КОРИДОРАХ МОСКВА
HIGH STREET TENANT MIX MOSCOW Q3 2013 | СТРУКТУРА АРЕНДАТОРОВ В ТОРГОВЫХ КОРИДОРАХ МОСКВА III КВ 2013
Food Restaurants Cafes Fashion and footwareServices Bank ExchangeAccessories Optics Watches JewelryCosmetics Pharmacy Perfumery Other
HIGH STREET RENTAL RATES MOSCOW АРЕНДНЫЕ СТАВКИ В ТОРГОВЫХ КОРИДОРАХ МОСКВА
Data of the following trade corridors was used to conduct the analysis Tverskaya Petrovka-Stoleshnikov-Kuznetsky Most Nikolskaya Pyatnytskaya Pokrovka-Maroseyka In total these trade corridors located 710 outlets
US$ per sq m per annum triple net Aumlicirceumleumlagraveethucirc NtildeOslashAgrave ccedilagrave ecircacircigrave acirc atildeicircauml aacuteagraveccedilicircacircagraveyuml ntildeograveagraveacircecircagrave agraveetharingiacuteaumlucirc
OgraveIcircETHAtildeIcircAcircUcircAring OacuteEumlEgraveOumlUcirc mdash IumlAringOslashAringOtildeIcircAumlIacuteUcircAring CcedilIcircIacuteUcirc Важнейшим событием для торговых улиц стала программа развития пешеходных зон в Москве активно поддерживаемая Правительством города На тех улицах где уже отменили движение транспорта (в первую очередь Большая Дмитровка) происходит смена потоков посетителей (от пассажиров к пешеходам) Пешеходные улицы имеют огромный потенциал с точки зрения торговли и уже сейчас ритейлеры проявляют большой интерес к пешеходным районам Расширение пешеходных районов значительно увечит предложение качественных торговых помещений на улицах в Москве
HIGH STREETS mdash PEDESTRIAN AREA The most important event for the high streets became the development of pedestrian zones in Moscow which is actively supported by the city government There is a change of visitor flows (from passengers to pedestrians) on those streets where the driving was cancelled (it concerns Bolshaya Dmitrovka street first of all) There is a huge potential for retail activity talking about pedestrian streets and retailers show great interest in developing of those areas The expansion of pedestrian zones will significantly increase the supply of the quality retail premises in Moscow
HIGH STREETS mdash PEDESTRIAN AREA ТОРГОВЫЕ УЛИЦЫ mdash ПЕШЕХОДНЫЕ ЗОНЫ
With vehicular traffic restriction | Oacuteeumlegraveoumlucirc atildeaumlaring icircatildeethagraveiacuteegravedividearingiacuteicirc aumlacircegraveaeligaringiacuteegravearing ograveethagraveiacutentildeiumlicircethograveagrave
Opened for vehicles | Oacuteeumlegraveoumlucirc atildeaumlaring icircograveecircethucircograveicirc aumlacircegraveaeligaringiacuteegravearing ograveethagraveiacutentildeiumlicircethograveagrave
Q3 2013 MoscowRUSSIA A Cushman amp Wakefield Research Publication
OFFICE MARKET
IcircAacuteCcedilIcircETH ETHUcircIacuteEcircAgrave В III квартале 2013 г рынок продолжает оставаться активным спрос и предложение сбалансированы ставки аренды стабильны
Тенденция ослабления рынка офисной недвижимости отмечен-ная впервые в предыдущем квартале подкрепляется новыми фактами
Продолжилось снижение общего объема заключаемых сделок аренды и покупки в III квартале общий объем заключенных сделок составил 385 836 кв м что на 20 ниже среднего уровня 2011-2012 гг
Даже небольшой рост объема вывода на рынок новых помеще-ний приводит к увеличению доли свободных помещений За счет одного крупного объекта (Башня Меркурий в Москва-Сити арендуемой площадью 87 547 кв м) объемы ввода в эксплуатацию офисных площадей класса А в III квартале увеличились вдвое относительно средних объемов строительст-ва последних трех лет В результате уровень свободных помещений в классе А в среднем по Москве увеличился на 35 пп а в районе Москва-Сити mdash на 156 пп
Средняя ставка аренды не изменяется в течение последних трех кварталов в то время как инфляции в России за январь-май 2013 превысила уровень 7
ABSORPTION AND NEW CONSTRUCTION CLASSES A AND B (MN SQ M)
OVERVIEW The third quarter of the year saw the office market remain healthy with steady levels of demand Rents held firm There is a tendency of weakening signs in the office market which was noted for the first time in the previous quarter Now it is supported by some new facts
Overall demand level has continued to decrease Q3 take-up is 385836 sq m which is 20 less than the average take-up level for 2011-2012
Even moderate growth of new office space affects the vacancy rate In Q3 the delivery of Mercury Tower in Moscow City submarket (87547 sq m of office rentable area) doubled the quarterly Class A new construction volume (compared to the average number during the last three years) As a result the level of vacant space has increased by 35 percentage points in the Moscow Class A sector Talking about Moscow City submarket the volume of vacant space has increased by 156 points
Rental rates remain unchanged the CPI is above 7 (January-May 2013 data)
Source Cushman amp Wakefield
TOTAL STOCK MOSCOW | ОБЩИЙ ОБЪЕМ ПРЕДЛОЖЕНИЯ В МОСКВЕ 1360 mn sq m
VACANCY RATE | ДОЛЯ СВОБОДНЫХ ПЛОЩАДЕЙ 128
US$ 860 AVERAGE RENTAL RATE CLASS A | СРЕДНЯЯ АРЕНДНАЯ СТАВКА КЛАСС А
Q1-Q3 DEMAND (TAKE-UP) | ОБЪЕМ СДЕЛОК АРЕНДЫ И ПРОДАЖИ В 1-III КВ 2013 1190138 sq m
Q1-Q3 2013 NEW CONSTRUCTION | НОВОЕ СТРОИТЕЛЬСТВО В 1-III КВ 2013 594009 sq m
SUPPLY By the end of Q3 2013 Moscow had 136 mn sq m of quality office space Nine new office buildings were completed with a rentable area of 244587 sq m in Q3 New construction volume remains moderate
Nearly 50 of new office space delivered in 2013 is located in the Moscow suburbs (outside TTR) while the demand is drawn towards the city center So the suburbs are in danger of oversupply during the last four quarters the vacancy rate in suburban submarkets has increased by 58 percentage points from 11 in Q3 2013 to 168 in Q3 2013
In the Central and Prime business areas (with the exception of Moscow City submarket) the vacancy rate is stable while in several central submarkets (such as Tagansky Frunzensky Novoslobodsky) the availability is decreasing
After the recent delivery of Mercury Tower with 87547 sq m of office rentable space Moscow City availability has doubled Hence the Moscow City vacancy rate grew by 156 percentage points up to 327
Altogether there are 154 mn sq m of available office premises in existing buildings and 35 mn sq m is under speculative construction
IumlETHAringAumlEumlIcircAEligAringIacuteEgraveAring По состоянию на конец III квартала 2013 года в Москве насчи-тывалось 136 млн кв м качественных офисов В III квартале было введено в эксплуатацию 9 офисных зданий общей арен-дуемой площадью 244 587 кв м Объемы нового строительства продолжают оставаться умеренными
Около 50 новых офисных площадей вышедших на рынок в 2013 году находятся в удаленных от центра города районах (за пределами ТТК) В то же время спрос продолжает тяготеть к центру города В результате на окраинах города наблюдается тенденция к росту избыточности предложения Так в течение 4-х последних кварталов уровень свободных помещений в рай-онах за пределам ТТК увеличился на 58 пп с 11 (III кв 2012) до 168 (III кв 2013) Внутри ТТК уровень свободных помеще-ний стабилен а в некоторых субрынках (Таганском Фрунзен-ском Новослободском) свободных помещений становится меньше Исключение составляет субрынок Москва-Сити где после ввода в эксплуатацию Башни Меркурий площадью 87 547 кв м объем свободных помещений удвоился что не-медленно привело к росту уровня свободных помещений на 156 пп до уровня 327
Всего в Москве предлагается в аренду или на продажу 154 млн кв м в существующих и 35 млн кв м в строящихся зданиях
Future supply mdash available space in buildings to be delivered in the next 12 month (under construction and under reconstruction) The data is given for the end of the period
Source Cushman amp Wakefield Source Cushman amp Wakefield Moscow Research Forum
DEMAND Overall 12 million sq m of quality office space was leased or bought during Q1-Q3 2013 For the second quarter in a row the total volume of take-up is decreasing In Q3 385836 sq m of quality office space has been transacted which is 20 below the average quarterly level of 2011-2012 Real estate budgets are limited and tenants tend to primarily consider their current location as a viable alternative to a new office
Tenants continue to be interested primarily in existing buildings the proportion of pre-lease agreements in Q1-Q3 was 63 of the total rented space (23 in Q3) In 2013 there is a significant reduction in the proportion of sales deals (from 20 on average in 2011-2012 to around 10 in 2013)
The number of large transactions (over 2000 sq m) continues decreasing The average transaction size has reduced again by 10 compared with the previous quarter and now stands at 528 sq m (taking into account only leasing deals)
NtildeIumlETHIcircNtilde Всего за три квартала 2013 года было арендовано и куплено 12 миллиона кв м качественных офисных помещений Вто-рой квартал подряд наблюдается снижение общего объема сделок В III квартале общий объем сделок составил 385 836 кв м что на 20 ниже среднего уровня 2011-2012 годов Бюджеты на недвижимость и переезды ограничены аренда-торы и арендодатели все чаще находят компромиссы приво-дящие к продлению текущих договоров аренды а не заклю-чению новых сделок в новых зданиях
Арендаторы продолжают интересоваться главным образом введенными в эксплуатацию зданиями ndash в 2013 году (1-III кв) доля договоров предварительной аренды составила менее 63 (в III кв ndash 23) от всех арендованных площадей Доля сделок продажи также продолжает оставаться низкой и со-ставляет не более 10 от всего объема офисных сделок
Продолжает снижаться количество крупных сделок (размером более 2 000 кв м) Средний размер транзакции снизился на 10 относительно предыдущего квартала и в III квартале составил 528 кв м учитывая только сделки аренды
NtildeOgraveAgraveAcircEcircEgrave AgraveETHAringIacuteAumlUcirc В классе А средняя запрашиваемая арендная ставка составляет 860 долларов США В классе Б средняя ставка аренды стабильна на уровне 520 долларов США Ставки аренды для Прайм офисов продолжают находиться на уровне 1 200 долларов США за кв м в год (без НДС и операционных расходов)
Source Cushman amp Wakefield
Source Cushman amp Wakefield
Q3 2013 AVERAGE BASE RENTAL RATES BY BUSINESS AREA СРЕДНИЕ БАЗОВЫЕ СТАВКИ АРЕНДЫ В III КВ 2013 Г ПО БИЗНЕС РАЙОНАМ
AVERAGE RENTAL RATES (US$) СРЕДНИЕ СТАВКИ АРЕНДЫ (ДОЛЛАРЫ США)
Downtown
Central
OTA
Moscow subareas
Moscow is divided into office submarkets areas with similar real estate indicators and dynamics Office submarkets are grouped in office subareas
The Downtown subarea is the territory inside the Garden Ring and the Belorussky business area
The Central subarea is the territory between the Garden ring and TTR (and the more distant SOK and KUT submarkets)
OTA includes the Moscow suburbs
RENTAL RATES In Class A the average asking rental rate is $860 In Class B the average asking rental rate was stable at $520 Rental rates for prime office space is at the level of $1200 per year per sq m (triple net)
IumlETHIcircAtildeIacuteIcircCcedil Несмотря на то что по заявлениям девелоперов более 400 тыс кв м площадей планируется к вводу во IV кв 2013 года мы ожидаем что до конца года будет введено в эксплуатацию дополнительно не более 150ndash200 тыс кв м новых офисов Таким образом в 2013 году сохранится баланс спроса и предло-жения в большинстве офисных субрынков
Высокие объемы строительства на окраинах города и в Москва-Сити не окажут существенного дестабилизирующего влияния на центральные районы До конца 2013 года а также в 2014 году в центральных районах ставки аренды будут стабильны возможен рост в соответствии в уровнем инфляции
LEASE TERMS IN QUALITY BUSINESS CENTERS УСЛОВИЯ АРЕНДЫ КАЧЕСТВЕННЫХ ОФИСНЫХ ПОМЕЩЕНИЙ
RUR USD or Euros (rarely used) per sqmyr For currency exchange landlords use either Central Bank of Russiarsquos official rate or set their own rate or fix the dollar corridor eg 25-40 RUBUSD
Российские рубли доллары США или евро (используется редко) за квм в год Используется обменный курс ЦБ России или используются условные единицы (уе) с фиксированным курсом в коридоре 25-40 рублей за уе
Payments Iumleumlagraveogravearingaeligegrave Quarterly in advance Ежеквартально авансом
Indexation Egraveiacuteaumlaringecircntildeagraveoumlegraveyuml 3-5 or at the level of USA EU CPI 10-15 for RUR agreements Sometimes step-rents are used
3-5 или US CPI 10-15 для рублевых договоров аренды Ингода используется ступенчатая индексация
Other payments Aumlethoacuteatildeegravearing iumleumlagraveogravearingaeligegrave
Operational expences
Операционные расходыThis sort of payments strongly depends on the service list included Average market payments 100-150 USDsqmyr for Class A 80-120 USDsqmyr for Class B
Платежи зависят от состава включенных услуг который может значительно отличаться 100-150 долларов США за квм в год для Класса A 80-120 долларов США за квм в год для Класса Б
VATНДС 18 18Source Cushman amp Wakefield
FORECAST Despite the announcements from developers that they will deliver more than 400000 sq m in Q4 2013 the new construction forecast continues to be rather conservative Just 150000-200000 sq m of new office space might be delivered by the end of this year Consequently in 2013 the supply-demand balance should remain stable
The high volume of office space under construction is the biggest threat at the moment Against the possible local oversupply in Moscow suburbs and Moscow-City submarkets in 2014 central and prime business areas should see a market balance both at the end of 2013 and during the whole 2014 For these areas rental rates are projected to grow in line with inflation
The table contains office buildings announce for delivery in 2013 with rentable area more than 15000 sq m Delivered buildings are included disregarding the size
TOTAL mdash Office rentable area or all office buildings announced for delivery in 2013 (including small buildings with office rentable less than 15000 sq m)
DOWNTOWNBlackampWhite Complex (bld White) ZAM B+ 13000 Q1Rosso Riva ZAM A 11947 Q1Park Tower BEL B+ 11850 Q1Chistoprudnyy bul 8 bld 1 CBD B- 4730 Q1White Gardens BEL A 63900 Q1Wall Street ZAM A 20493 Q2Vishnevy Sad CBD B+ 6736 Q2Domino ZAM A 6216 Q3Lukoil build-to-suit CBD B+ 35000 Q3CENTRALDubininskaya ul 33B SCH B+ 3000 Q1City Point BC CTY B+ 9951 Q1Sinitsa Plaza BAS B+ 13496 Q2Mercury City CTY A 87574 Q3Poluyaroslavskiy Bolshoy per 102 bld BAS B+ 2294 Q3Poklonnaya ul vl 3 KUT A 85572 Q4Park Pobedy KUT B+ 54000 Q4Nizhegorodsky Business Centre phase II BAS B- 37100 Q4Nizhegorodsky Business Centre phase I BAS B- 23000 Q4Arma 19 BAS B+ 19080 Q4Golden Gate BAS B+ 16000 Q4OTANewton Plaza SE B+ 52000 Q1Danilovskaya Manufaktura Sitsevyi Korpu SE B+ 3396 Q1iCube SW B+ 15256 Q1Obrucheva ul 52 bld3 SW B- 23300 Q1Lotte Business Centre SW B+ 38480 Q1Streamline NE B+ 11048 Q1Quadrum SUB B+ 24650 Q2Park Mira NE B+ 7000 Q2Format Complex II SUB B- 9122 Q2Dobrolyubova 6 bld 5 NE B- 4699 Q3Leninsky 119 SW A 15400 Q3Central Street NE B+ 6423 Q3Smart Park SW B+ 10260 Q39 akrov phase II SW B+ 62300 Q3Country Park Phase III SUB A 19120 Q3Riga Land bld 5 (bld A) (phase II) SUB B+ 40000 Q4Solutions BP bld 3 SW B+ 19500 Q4Avrora NE B- 21600 Q4Neo Geo SW B- 70000 Q4Novator office-hotel complex SUB B+ 24000 Q4Mebe One Khimki Plaza SUB A 26000 Q4
TOTAL 217236
TOTAL 421653
TOTAL 551253
Q3 2013 MoscowRUSSIA A Cushman amp Wakefield Research Publication
HOSPITALITY
ADR IN AUGUST 2013 | СРЕДНЯЯ ЦЕНА ЗА НОМЕР В АВГУСТЕ 2013 $152
QUALITY SUPPLY | ТЕКУЩИЙ ОБЪЕМ КАЧЕСТВЕННОГО ПРЕДЛОЖЕНИЯ 14200 rooms
OCCUPANCY | ЗАПОЛНЯЕМОСТЬ 77
RevPAR | СРЕДНИЙ ДОХОД НА НОМЕР $117
IumlETHAringAumlEumlIcircAEligAringIacuteEgraveAring По оценке департамента гостиничного бизнеса и туризма совокупный объем номерного фонда в Москве на конец III квартала 2013 г составил свыше 48 тыс номеров из них доля качественного предложения составила порядка 30 общего предложения или 142 тыс номеров
Новое предложение за III квартале 2013 г в сегменте качествен-ных гостиниц составило 1138 номеров и было сформировано за счет ввода в эксплуатацию 4-х гостиниц разной ценовой категории
В ноябре 2013 г ожидается открытие гостиниц под управлени-ем оператора Accor комплекс из трех отелей расположен по адресу ул Бахрушина вл 11 В состав комплекса войдут 3 гостиницы разной ценовой категории Mercure на 158 номеров (Upscale) Ibis на 190 номеров (Midscale) Adagio на 149 апартаментов (Midscale)
Это увеличит предложение на рынке качественных отелей минимум на 497 номеров Ожидаемое в 2013 г открытие гостиницы Marriott Novy Arbat (234 номера) перенесено на 1 квартал 2014 года
SUPPLY According to the Department of Hospitality and Tourism the cumulative number of rooms in the Moscow hotel market at the end of Q3 2013 is estimated at more than 48000 rooms with the proportion of high-quality supply at about 30 or 14200 rooms
The increase in high-quality segment by the end of Q3 2013 totaled 1138 rooms resulting from the commissioning of 4 hotels in different price categories
In addition Accor will open three new hotels in November Q4 2013 in the hotel complex located at ul Bakhrushina 11 The complex of hotels includes three brands Mercure with 158 rooms (Upscale) Ibis with 190 rooms (Midscale) and Adagio with 149 rooms (Midscale)
We believe that the total supply of international grade rooms will increase by 497 by the end of 2013 It was expected that more rooms would have been available but the opening of the Marriot Noviy Arbat (234 rooms) was postponed till the Q1 2014
QUALITY MOSCOW HOTEL MARKET STRUCTURE Q3 2013 YTD
NtildeOgraveETHOacuteEcircOgraveOacuteETHAgrave EcircAgravetimesAringNtildeOgraveAcircAringIacuteIacuteUcircOtilde AtildeIcircNtildeOgraveEgraveIacuteEgraveOuml IgraveIcircNtildeEcircAcircUcirc III EcircAcirc 2013
Средняя цена за номер (ADR) в августе 2013 г составила $152 что на 5 выше уровня августа 2012 г Положительная динамика обеспечена за счет гостиниц высокой ценовой категории максимальный рост средней цены за номер по отношению к результатам за аналогичный период 2012 г продемонстрировал рынок гостиниц класса Upscale 16 Среднеценовые объекты напротив работали с более демократичными группами спроса на рынке гостиниц класса Midscale было отмечено снижение показателя ADR на 7 по сравнению с августом 2012 г
Символическое падение ставок за номер на уровне 043 и 221 было отмечено также в сегментах Upper Midscale и Luxury соответственно что в целом характерно для августа ndash наиболее laquoтуристскогоraquo месяца в году
В отношении результатов 2013 г (по данным на август) рынок качественных гостиниц показал небольшое снижение показате-ля ADR (-11) по сравнению с прошлым годом что равносиль-но стабилизации в том числе с учетом ослабления рубля
Наиболее агрессивными с точки зрения ценовых ожиданий остаются гостиницы категории Luxury показывающие на фоне общих понижающих корректировок цены небольшой рост с $375 до $376 за номер
Московские гостиницы предлагают широкий разброс цен по сегментам наиболее дорогие ndash гостиницы категории Luxury где ADR в августе 2013 г составил $315 что на 10698 выше среднего показателя по рынку качественных гостиниц
Ценовой разрыв отелей категории Luxuгy со следующим за ним сегментом внушителен средняя цена за номер в гостиницах категории Upper Upscale уже только на 2875 превысила средний показатель по рынку и составила $197 Стоимость номера в гостиницах категории Upscale сравнима со средним по рынку значением и составляет $160
Цены за номер в гостиницах класса Upper Midscale и Midscale ниже среднерыночных на 30 и 48 соответственно и составляют $105 и $79 за номер (данные за август)
AVERAGE DAILY RATE US DOLLAR (ADR) AUGUST 2013 YTD
QUALITY HOTEL MARKET TRADING Average daily rate in August 2013 estimated to $152 which is 5 higher than in August 2012 This positive dynamic was ensured by high-quality hotels the highest ADR growth was recorded in the Upscale segment ndash Up 16 compared to the same period last year Midscale market in this period was oriented to more democratic groups of demand ADR declined by 7 comparing to August 2012
The fall in ADR at the level of 043 and 221 was also recorded in the Upper Midscale and Luxury segments respectively but that is typical for the August ndash the most tourist month of the year
The results of 2013 (August YtD) showed a symbolic decrease in ADR (-11) comparing to 2012 that can be interpreted as a stabili-zation taking into account the weakening of the Ruble
The most aggressive in terms of price expectations remain Luxury market segment showing slight increase from $375 to $376 per room comparison with the general lowering of prices
Moscow hotels offer a wide range of prices by segment the most expensive ndash Luxury with ADR in August about $315 it is 10698 higher than the average for the Moscow quality market
There is an impressive gap between Luxury hotel prices and prices for the Upper Upscale segment Average daily rate for Upper Upscale is about $197 and only 2875 higher than the average for the Moscow quality market
0
50
100
150
200
250
300
350
400
2010 2011 2012 2013
Luxury Upper Upscale
Upscale Upper Midscale
Midscale Moscow average
0
10
20
30
40
50
60
70
80
2010 2011 2012 2013
Luxury Upper UpscaleUpscale Upper MidscaleMidscale Moscow average
25
MARKETBEAT Q3 2013
NtildeIumlETHIcircNtilde
Средняя годовая загрузка качественных гостиниц Москвы в августе 2013 г составила 77 что на 11 выше данного показателя за аналогичный период прошлого года
Максимально высоким спросом в Москве пользуются гостиницы категории Upper Midscale и Midscale загрузка которых в августе фиксировалась на уровне 854 и 826 соответственно
Одной из особенностей рынка гостиниц Москвы в III кв 2013 г стала высокая загруженность качественных и центрально расположенных гостиниц в августе ndash традиционно низком из-за наступления laquoсезона отпусковraquo Нетипично высокая загрузка стала следствием увеличения туристских потоков в том числе за счет проведения Универсиады в Казани добавившей laquoтранзитныхraquo клиентов московским отелям
По итогам 2013 г по состоянию на август рынок качественных гостиниц показывает рост спроса по сравнению с прошлым годом практически по всем сегментам Рост спроса простимули-рован как ростом потока ночующих посетителей в Москву так и стагнацией цен на размещение последнее обстоятельство говорит о продолжающемся периоде неопределенности
OgraveAringIacuteAumlAringIacuteOumlEgraveEgrave
Среднее значение дохода на номер (RevPAR) за август 2013 г выросло на 171 и составило $117 против $100 в 2012 г В то же время по итогам 2013 г по состоянию на август динамика RevPAR по сегментам колебалась от 84 в Midscale до -46 в отелях категории Upper Midscale
Мы полагаем что тенденции к повышению среднерыночной доходности на номер (+12 YtD) за счет гибкой ценовой политики реагирующей на изменения спроса сохранится и в ближайшей перспективе В 2014 г гостиницы вышедшие на рынок в 2013 г окажут более выраженное воздействие на рыночную ситуацию за счет чего показатели RevPAR по сегменту Luxury и особенно Upper Midscale вряд ли существен-но превзойдут текущие показатели и будут колебаться от слабоотрицательных до слабоположительных значений в начале и конце года
DEMAND The average annual occupancy of quality hotels in Moscow in August 2013 was about 77 which is 11 higher than in the same period last year
Maximum high demand in Moscow hotels was in the Upper Midscale and Midscale category with occupancy in August at the level of 854 and 826 respectively
One of the features of the market of Moscow hotels in Q3 2013 was the high occupancy of quality hotels and especially the central located hotels ndash traditionally low in August because of the holiday season Unusually high occupancy was a result of increased tourist flows including through the Universiade in Kazan which added transit clients for Moscow hotels
In general up to August 2013 (YtD) the Moscow quality hotel market shows a growth in demand comparing to 2012 in almost all segments (reduced occupancy in Upper-Midscale segment by 03 pp can be seen as an insignificant adjustment) Demand growth is stimulated by the growing stream of domestic and international visitors staying overnight in Moscow and the stagnation of prices for accommodation the last point indicates the continuing period of uncertainty in the market
TRENDS IN REVENUE Average revenue per available room (RevRAR) in August 2013 increased by 171 to $117 versus $100 in August 2012
At the same time according to the results of August 2013 RevPAR dynamics by segment ranged from 84 in the Midscale segment to -46 in the Upper Midscale hotels We believe that the tendency to stimulate the RevRAR increase which the flexible price sensible of demand change will continue in the near future In 2014 the new hotels will have a more pronounced effect on the general market situation whereby RevPAR (especially for Luxury and Upper Midscale) unlikely to surpass itrsquos current estimations and will vary from slightly negative to low positive values at the beginning and end of the year
За III квартал 2013 года в эксплуатацию было введено более 235 тыс кв м качественных складских площадей
Ставки аренды остаются стабильными и составляют в среднем $135 за кв м в год в классе А без НДС операци-онных расходов и коммунальных платежей
Цена продажи составляет $1 200- $1 300 за кв м в типовых проектах класса А
Доля вакантных площадей в складах класса А за полугодие не изменилась и составляет 1
Объем арендованных и купленных складских площадей в III составил более 350 тыс кв м
Регионы
В большинстве регионов средние ставки аренды в классе А за прошедший квартал не изменились за исключением Новосибирска и Нижнего Новгорода где ставки выросли на 4-6
Объем арендованных и купленных складских площадей в III квартале составил более 85 тыс кв м
SUMMARY Moscow
In Q3 2013 more than 235000 sq m of quality warehouse space were put into operation
Rental rates remain stable at an average of $135 per sq m per year in A Class excluding VAT operating expenses and utility
The price of sale is $1200 - $1300 per sq m in typical projects of class A
The vacancy rate in Class A warehouses for the half of the year remains unchanged at 1
The volume of leased and purchased warehouse space in Q3 amounted to 350000 sq m
Regions
The average rental rates in Class A have not changed for the quarter in most regions except Novosibirsk and Nizhny Novgorod where rates have increased by 4-6
The volume of leased and purchased warehouse space in Q3 amounted to 85000 sq m
$132
$130
$140
$105
$110
$135
$135
$135
$80
$90
$100
$110
$120
$130
$140
$150
2006 2007 2008 2009 2010 2011 2012 2013F
KEY EXPECTATIONS
STABILITY
0
200
400
600
800
1000
1200
1400
1600
1800
2007 2008 2009 2010 2011 2012 2013F 2014F
27
MARKETBEAT Q3 2013
Source Cushman amp Wakefield
Source Cushman amp Wakefield
Source Cushman amp Wakefield
Source Cushman amp Wakefield
ОСНОВНЫЕ ТЕНДЕНЦИИ Объем нового строительства за 1-III кв 2013 года в Московском регионе составил 550 тыс кв м что соответствует аналогично-му показателю прошлого года Объем арендованных и куплен-ных площадей по итогам прошедших трех кварталов составил белее 830 тыс кв м что приблизительно соответствует показа-телю прошлого года
В регионах объем нового строительства в регионах за первые три квартала составил 239 тыс кв м что на треть меньше про-шлогоднего Арендовано куплено 250 тыс кв м что больше прошлогоднего показателя на 20
ПРЕДЛОЖЕНИЕ В Московском регионе в III квартале 2013 года предложение увеличилось на 235 тыс кв м
В минувшем квартале были построены
Логопарк Север (110 тыс кв м) девелопер Каравелла
Два новых корпуса в логистическом парке Климовск (48 тыс кв м) девелопер Raven Russia
Объем нового строительства соответствует показателям преды-дущего года но темпы строительства ниже заявленных девело-перами Основная проблема mdash задержки в строительстве Боль-ше всего это касается новых девелоперов длительное время работающие на рынке компании укладываются в заявленные сроки Поэтому до конца года будет построено до 1 млн кв м складских площадей
На рынке Москвы сохраняется дефицит готовых к въезду склад-ских площадей Все проекты сдаются или продаются на этапе строительства
Чистые средние ставки аренды в течении прошедшего квартала не изменились и составляют $135 за кв м при этом разброс ставок остается высоким
В 2014 году девелоперы обещают построить около 15 млн кв м складских площадей однако по нашем оценкам из-за задер-жек при строительстве построено будет на 30 меньше
KEY TRENDS The volume of new construction for Q1-Q3 2013 in the Moscow region amounted to 550000 sq m which corresponds to the same period of last year The volume of leased and purchased land based on the results of Q1-Q3 was more than 830000 sq m which approximately relative to the previous year figure
The volume of new construction in the regions for the first three quarters amounted to 239000 sq m which is a three times less than last year indicator 250000 sq m were leased and sold which is 20 more than last year figure
SUPPLY In Q3 2013 supply in Moscow region increased by 235000 sq m
In the last quarter were put into operation
bull Logistics Park North (110000 sq m) developer is Caravella
bull Two new phases in the logistics park Klimovsk (48000 sq m) developer is Raven Russia
The volume of new construction complies with the previous year but below the pace of construction announced by developers The main problem is the delays in construction mostly it concerns new developers Experienced companies meet the announced deadlines Therefore there will be built up to one million sq m of warehouse space until the end of the year
In Moscow there is a lack of ready-to-move storage space All projects are sold or bought during the construction process
Net average rental rates have not changed during the last quarter and amounted to $135 per sq m while the spread rate remains relatively high
In 2014 developers expect to build nearly 15 mn sq m of warehouse space however according to our estimations the volume of construction will be 30 less due to the development process delays
DISTRIBUTION OF QUALITY DEVELOPMENTS IN THE PIPELINE FOR 2013-2014 (lsquo000 SQ M) РАСПРЕДЕЛЕНИЕ ПЛАНИРУЕМЫХ К ВВОДУ В 2013-2014 ГГ СКЛАДСКИХ ПЛОЩАДЕЙ В МОСКОВСКОЙ ОБЛАСТИ ТЫС КВ М
DISTRIBUTION OF WampI SPACE IN THE MOSCOW REGION (lsquo000 SQ M) РАСПРЕДЕЛЕНИЕ СКЛАДСКИХ ПЛОЩАДЕЙ В МОСКОВСКОЙ ОБЛАСТИ ТЫС КВ М
В регионах в минувшем квартале было построено только 43 тыс кв м качественных складских площадей против 117 тыс в прошлом Все новые объекты построены рядом с Санкт-Петербургом
Всего в 2014 году в регионах будет построено боле 290 тыс кв м против 410 тыс кв м в прошлом В большинстве регионов дефицита складских площадей не наблюдается Исключение составляет Санкт-Петербург Екатеринбург и Ростов-на-Дону
Чистые ставки аренды в регионах в III квартале 2013 года не изменились за исключением Новосибирска и Нижнего Новгорода где они немного выросли до $120 и $123 за кв м соответственно
Source Cushman amp Wakefield
TAKE UP lsquo000 SQ M ОБЪЕМ АРЕНДОВАННЫХ И КУПЛЕННЫХ ПЛОЩАДЕЙ ТЫС КВ М
Source Cushman amp Wakefield
During the past quarter only 43000 sq m of quality warehouse space was built In the regions as against last year fiqure (117000 sq m) All new premises were built near St Petersburg
Comparing to last year figure (410000 sq m) more than 290000 sq m is going to be built in the regions in 2014 In most regions there is no lack of warehouse spaces observed The exceptions are St Petersburg Yekaterinburg and Rostov-on-Don
Net rental rates have not changed in the regions in Q3 except Novosibirsk and Nizhny Novgorod where they rose slightly to $120 and $123 per sq m respectively
2013 PIPELINE ОБЪЕКТЫ ЗАЯВЛЕННЫЕ К СТРОИТЕЛЬСТВУ В 2013 Г
PROJECT DEVELOPER GRADE DIRECTION HIGHWAYDISTANCE FROM
MKAD KMTOTAL AREA
000 SQ MEXPECTED
DELIVERY
Infrastroy Bykovo Infrastroy А E Egorevskoe 17 6155 Q1
Infrastroy Bykovo Infrastroy А E Egorevskoe 17 6193 Q4
Klimovsk LP Raven Russia A S Simferopolskoye 23 4772 Q3
Logopark Sever Karavella A N Rogachevskoye 30 11023 Q3
PNK Chekhov II PNK group A S Simferopolskoye 50 10424 Q2
PNK Chekhov II PNK group A S Simferopolskoye 50 5531 Q4
PNK Vnukovo PNK group A SW Kievskoe 19 10568 Q1
South Gate IP Radius group A S Kashirskoye 30 2070 Q2
South Gate IP Radius group A S Kashirskoye 30 3000 Q4
СПРОС В Московском регионе за I-III кварталах 2013 г было арендовано и куплено более 850 тыс кв м качественных складских площадей из них 235 тыс в III квартале что соответствует прошлогодним показателям
Наиболее крупные сделки в минувшем квартале
Автомобильный концерн Volkswagen купил 50 тыс кв м в складском комплексе PNK Чехов 2 девелопер PNK Group
Компания Верный купила 43 тыс кв м в складском комплексе PNK Север девелопер PNK Group
Автомобильный концерн General Motors арендовала 40 тыс кв м в индустриальном комплексе Южные врата
Следует отметить что большое количество качественных складских площадей было арендовано и куплено в III квартале 2013 г производственными компаниями при этом логистиче-ские компании и дистрибьюторы наоборот купили и арендова-ли меньшее количество площадей
Так же следует отметить увеличение доли продаж в III квартале до 42 против 14 во II квартале в структуре поглощения
На региональных рынках за минувший квартал было арендовано и куплено более 85 тыс кв м всего с начала года более 250 тыс кв м что почти на 20 выше аналогичного показателя прошлого года и на 5 среднего значения за последние 5 лет Этот показатель во многом обусловлен самой крупной сделкой за всю историю рынка складской недвижимости Санкт-Петербурга по предварительной продаже 43 тыс кв м компанией PNK Group продуктовой сети laquoВерныйraquo в складском комплексе PNK КАД
Сделки на такие большие площади позволяют девелоперу возобновить строительство в регионах но за период с IV кв 2012 по III квартале 2013 г Было заключено только 4 сделки более 25 тыс кв м Большинство сделок в регионах заключает-ся на складские площади до 10 тыс кв м
STRUCTURE OF DEMAND MOSCOW СТРУКТУРА СПРОСА МОСКВА
DEMAND In the Moscow region in Q1-Q3 2013 more than 850000 sq m were rented and purchased talking about quality warehouse space The Q3 indicator is 235000 sq m which is the same to the last years performance
The largest deals in the last quarter
bull Car manufacturer group Volkswagen bought 50000 sq m in a warehouse complex PNK Chekhov 2 developer is PNK Group
bull The Verniy company bought 43000 sq m in a warehouse complex PNK North developer is PNK Group
bull Automobile сar manufacturer General Motors leased 40000 sq m in the industrial complex South Gate
It should be noted that a large number of quality warehouse space was leased and purchased in the Q3 2013 by manufacturing companies while logistics companies and distributors on the contrary have bought and rented a smaller amount of warehouse space
It should be also mentioned the increasing sales in Q3 up to 42 comparing to 14 in the previous quarter for the both leased and bought premises
At the regional markets for the last quarter it was rented and purchased more than 85000 sq m Since of the beginning of the year more than 250000 sq m were rented and purchased which is almost 20 higher than last year and 5 higher than the average number for the last 5 years This indicator is largely due to the largest deal in the history of the warehouse property market of St Petersburg on the pre-sale of 43000 sq m by PNK Group to the food supplier Verniy in the warehouse complex PNK KAD
Such large deals allow developer to resume construction in the regions However between Q4 2012 and Q3 2013 it was only 4 deals amounted more than 25000 sq m made Most of the deals in the region are for warehouse space up to 10000 sq m
ТЕНДЕНЦИИ С начала прошлого года на рынок складской недвижимости остается стабильным Ежегодный спрос в Московском регионе составляет около 1 млн кв м в год Средние ставки аренды в классе А составляют $135 за кв м в год без НДС операцион-ных расходов и коммунальных платежей доля вакантных площадей сохраняется на уровне 1 Строительство большин-ства новых складских объектов будет начинаться только после заключения предварительных договоров аренды и продажи
Изменение ситуации в ближайшей перспективе ожидать не стоит В условиях низкого роста экономики страны начинать спекулятивное строительство большой риск повторения ситуации 2008 года поэтому предложение будет подстраивать-ся под спрос
На региональных рынках продолжится тенденция увеличения дефицита готовых к въезду складских площадей Не смотря на высокой спрос на складские объекты в регионах девелоперам не удается сформировать достаточных портфель предваритель-ных договоров аренды для начала строительства Исключение составляет Санкт-Петербург Свердловская область юг России где спрос или условия рынка обеспечили девелоперам формирование такого портфеля Мы прогнозируем что до конца года в регионах будет реализовано более 300 тыс кв м складских площадей
Source Cushman amp Wakefield
STRUCTURE OF DEMAND REGIONS СТРУКТУРА СПРОСА РЕГИОНЫ
TRENDS Since the beginning of the last year the warehouse market has remained stable Annual demand in the Moscow region is about one mn sq m per year average rental rates for Class A is $135 per sq m per year excluding VAT operating expenses and utility costs the vacancy rate remains at 1 Construction of the majority of new storage facilities will start only after the preliminary lease or sale contract signing up
In the nearest future the situation would remain the same It is the huge risk to start the new speculative construction in a low-growth economic situation as it is the threaten to repeat the 2008 year crisis the supply will adapt to the demand
The trend of growing deficit of ready-to-move warehouse spaces continues at the regional markets In spite of the high demand for storage facilities in the regions for developers it is still complicated to form a sufficient portfolio of preliminary agreements for the start of construction Exceptions are St Petersburg Sverdlovsk region and south Russia where the demand or market conditions provided developers with the opportunity to form such a portfolio We predict that by the end of the year in the regions will be sold over 300000 sq m of warehouse space
WampI MARKET IN RUSSIA ETHUcircIacuteIcircEcirc NtildeEcircEumlAgraveAumlNtildeEcircEgraveOtilde IumlIcircIgraveAringUgraveAringIacuteEgraveEacute Acirc ETHIcircNtildeNtildeEgraveEgrave
VACANCY RATE (EOY) Paris (Ile de France) 89 81 99 126 102 84 81 89 804
Budapest 59 172 173 188 195 208 194 217 2283
Warsaw 89 74 112 171 194 173 146 1621 1592
Madrid 55 38 37 55 73 84 93 95 972
TAKE UP 000 SQ MParis (Ile de France) 1 005 700 640 601 814 837 563 208 58
Budapest 152 229 308 280 210 327 355 31 21
Warsaw 260 445 556 216 451 743 483 183 112
Madrid 1 225 918 630 325 390 270 225 60 47
2013
36
MARKETBEAT Q3 2013
RESEARCH DEPARTMENT IcircOgraveAumlAringEuml EgraveNtildeNtildeEumlAringAumlIcircAcircAgraveIacuteEgraveEacute
Further information and copies of this report are available from Ellina Krylova
EllinaKrylovaeurcushwakecom
The information provided in this report is intended for informational purposes only and should not be relied on by any party without further independent verification Classifications of individual buildings are reviewed on a continuing basis and are subject to change The standards used in this process are consistent with those used by Moscow Research Forum and in the United States by the Society of Industrial and Office Realtors (SIOR) and BOMA International Reproduction of this report in whole or part is permitted only with written consent of Cushman amp Wakefield Data from this report may be cited with proper acknowledgment given
copy 2013 Cushman amp Wakefield All rights reserved
MORE INFORMATION AND CONTACTS ARE AVAILABLE ON WWWMARKETBEATRU EgraveIacuteOcircIcircETHIgraveAgraveOumlEgraveszlig IcircAacute IcircOgraveAumlAringEumlAring EgraveNtildeNtildeEumlAringAumlIcircAcircAgraveIacuteEgraveEacute Egrave IumlOacuteAacuteEumlEgraveEcircAgraveOumlEgraveEgrave AumlIcircNtildeOgraveOacuteIumlIacuteUcirc IacuteAgrave WWWMARKETBEATRU
DENIS SOKOLOV PARTNER RESEARCH DIRECTOR DenisSokoloveurcushwakecom
LADA BELAYCHUK ASSOCIATE DIRECTOR DEPUTY RESEARCH DIRECTOR LadaBelaychukeurcushwakecom
MAXIM ILYIN CONSULTANT CAPITAL MARKETS Maximilyineurcushwakecom
ALEXANDER KUNTSEVICH ANALYST WampI PROJECT MANAGEMENT AlexanerKuntsevicheurcushwakecom
TATYANA DIVINA SENIOR ANALYST
TatyanaDivinaeurcushwakecom
wwwcushmanwakefieldcom
16
MARKETBEAT Q3 2013
OgraveIcircETHAtildeIcircAcircUcircAring OacuteEumlEgraveOumlUcirc mdash IumlAringOslashAringOtildeIcircAumlIacuteUcircAring CcedilIcircIacuteUcirc Важнейшим событием для торговых улиц стала программа развития пешеходных зон в Москве активно поддерживаемая Правительством города На тех улицах где уже отменили движение транспорта (в первую очередь Большая Дмитровка) происходит смена потоков посетителей (от пассажиров к пешеходам) Пешеходные улицы имеют огромный потенциал с точки зрения торговли и уже сейчас ритейлеры проявляют большой интерес к пешеходным районам Расширение пешеходных районов значительно увечит предложение качественных торговых помещений на улицах в Москве
HIGH STREETS mdash PEDESTRIAN AREA The most important event for the high streets became the development of pedestrian zones in Moscow which is actively supported by the city government There is a change of visitor flows (from passengers to pedestrians) on those streets where the driving was cancelled (it concerns Bolshaya Dmitrovka street first of all) There is a huge potential for retail activity talking about pedestrian streets and retailers show great interest in developing of those areas The expansion of pedestrian zones will significantly increase the supply of the quality retail premises in Moscow
HIGH STREETS mdash PEDESTRIAN AREA ТОРГОВЫЕ УЛИЦЫ mdash ПЕШЕХОДНЫЕ ЗОНЫ
With vehicular traffic restriction | Oacuteeumlegraveoumlucirc atildeaumlaring icircatildeethagraveiacuteegravedividearingiacuteicirc aumlacircegraveaeligaringiacuteegravearing ograveethagraveiacutentildeiumlicircethograveagrave
Opened for vehicles | Oacuteeumlegraveoumlucirc atildeaumlaring icircograveecircethucircograveicirc aumlacircegraveaeligaringiacuteegravearing ograveethagraveiacutentildeiumlicircethograveagrave
Q3 2013 MoscowRUSSIA A Cushman amp Wakefield Research Publication
OFFICE MARKET
IcircAacuteCcedilIcircETH ETHUcircIacuteEcircAgrave В III квартале 2013 г рынок продолжает оставаться активным спрос и предложение сбалансированы ставки аренды стабильны
Тенденция ослабления рынка офисной недвижимости отмечен-ная впервые в предыдущем квартале подкрепляется новыми фактами
Продолжилось снижение общего объема заключаемых сделок аренды и покупки в III квартале общий объем заключенных сделок составил 385 836 кв м что на 20 ниже среднего уровня 2011-2012 гг
Даже небольшой рост объема вывода на рынок новых помеще-ний приводит к увеличению доли свободных помещений За счет одного крупного объекта (Башня Меркурий в Москва-Сити арендуемой площадью 87 547 кв м) объемы ввода в эксплуатацию офисных площадей класса А в III квартале увеличились вдвое относительно средних объемов строительст-ва последних трех лет В результате уровень свободных помещений в классе А в среднем по Москве увеличился на 35 пп а в районе Москва-Сити mdash на 156 пп
Средняя ставка аренды не изменяется в течение последних трех кварталов в то время как инфляции в России за январь-май 2013 превысила уровень 7
ABSORPTION AND NEW CONSTRUCTION CLASSES A AND B (MN SQ M)
OVERVIEW The third quarter of the year saw the office market remain healthy with steady levels of demand Rents held firm There is a tendency of weakening signs in the office market which was noted for the first time in the previous quarter Now it is supported by some new facts
Overall demand level has continued to decrease Q3 take-up is 385836 sq m which is 20 less than the average take-up level for 2011-2012
Even moderate growth of new office space affects the vacancy rate In Q3 the delivery of Mercury Tower in Moscow City submarket (87547 sq m of office rentable area) doubled the quarterly Class A new construction volume (compared to the average number during the last three years) As a result the level of vacant space has increased by 35 percentage points in the Moscow Class A sector Talking about Moscow City submarket the volume of vacant space has increased by 156 points
Rental rates remain unchanged the CPI is above 7 (January-May 2013 data)
Source Cushman amp Wakefield
TOTAL STOCK MOSCOW | ОБЩИЙ ОБЪЕМ ПРЕДЛОЖЕНИЯ В МОСКВЕ 1360 mn sq m
VACANCY RATE | ДОЛЯ СВОБОДНЫХ ПЛОЩАДЕЙ 128
US$ 860 AVERAGE RENTAL RATE CLASS A | СРЕДНЯЯ АРЕНДНАЯ СТАВКА КЛАСС А
Q1-Q3 DEMAND (TAKE-UP) | ОБЪЕМ СДЕЛОК АРЕНДЫ И ПРОДАЖИ В 1-III КВ 2013 1190138 sq m
Q1-Q3 2013 NEW CONSTRUCTION | НОВОЕ СТРОИТЕЛЬСТВО В 1-III КВ 2013 594009 sq m
SUPPLY By the end of Q3 2013 Moscow had 136 mn sq m of quality office space Nine new office buildings were completed with a rentable area of 244587 sq m in Q3 New construction volume remains moderate
Nearly 50 of new office space delivered in 2013 is located in the Moscow suburbs (outside TTR) while the demand is drawn towards the city center So the suburbs are in danger of oversupply during the last four quarters the vacancy rate in suburban submarkets has increased by 58 percentage points from 11 in Q3 2013 to 168 in Q3 2013
In the Central and Prime business areas (with the exception of Moscow City submarket) the vacancy rate is stable while in several central submarkets (such as Tagansky Frunzensky Novoslobodsky) the availability is decreasing
After the recent delivery of Mercury Tower with 87547 sq m of office rentable space Moscow City availability has doubled Hence the Moscow City vacancy rate grew by 156 percentage points up to 327
Altogether there are 154 mn sq m of available office premises in existing buildings and 35 mn sq m is under speculative construction
IumlETHAringAumlEumlIcircAEligAringIacuteEgraveAring По состоянию на конец III квартала 2013 года в Москве насчи-тывалось 136 млн кв м качественных офисов В III квартале было введено в эксплуатацию 9 офисных зданий общей арен-дуемой площадью 244 587 кв м Объемы нового строительства продолжают оставаться умеренными
Около 50 новых офисных площадей вышедших на рынок в 2013 году находятся в удаленных от центра города районах (за пределами ТТК) В то же время спрос продолжает тяготеть к центру города В результате на окраинах города наблюдается тенденция к росту избыточности предложения Так в течение 4-х последних кварталов уровень свободных помещений в рай-онах за пределам ТТК увеличился на 58 пп с 11 (III кв 2012) до 168 (III кв 2013) Внутри ТТК уровень свободных помеще-ний стабилен а в некоторых субрынках (Таганском Фрунзен-ском Новослободском) свободных помещений становится меньше Исключение составляет субрынок Москва-Сити где после ввода в эксплуатацию Башни Меркурий площадью 87 547 кв м объем свободных помещений удвоился что не-медленно привело к росту уровня свободных помещений на 156 пп до уровня 327
Всего в Москве предлагается в аренду или на продажу 154 млн кв м в существующих и 35 млн кв м в строящихся зданиях
Future supply mdash available space in buildings to be delivered in the next 12 month (under construction and under reconstruction) The data is given for the end of the period
Source Cushman amp Wakefield Source Cushman amp Wakefield Moscow Research Forum
DEMAND Overall 12 million sq m of quality office space was leased or bought during Q1-Q3 2013 For the second quarter in a row the total volume of take-up is decreasing In Q3 385836 sq m of quality office space has been transacted which is 20 below the average quarterly level of 2011-2012 Real estate budgets are limited and tenants tend to primarily consider their current location as a viable alternative to a new office
Tenants continue to be interested primarily in existing buildings the proportion of pre-lease agreements in Q1-Q3 was 63 of the total rented space (23 in Q3) In 2013 there is a significant reduction in the proportion of sales deals (from 20 on average in 2011-2012 to around 10 in 2013)
The number of large transactions (over 2000 sq m) continues decreasing The average transaction size has reduced again by 10 compared with the previous quarter and now stands at 528 sq m (taking into account only leasing deals)
NtildeIumlETHIcircNtilde Всего за три квартала 2013 года было арендовано и куплено 12 миллиона кв м качественных офисных помещений Вто-рой квартал подряд наблюдается снижение общего объема сделок В III квартале общий объем сделок составил 385 836 кв м что на 20 ниже среднего уровня 2011-2012 годов Бюджеты на недвижимость и переезды ограничены аренда-торы и арендодатели все чаще находят компромиссы приво-дящие к продлению текущих договоров аренды а не заклю-чению новых сделок в новых зданиях
Арендаторы продолжают интересоваться главным образом введенными в эксплуатацию зданиями ndash в 2013 году (1-III кв) доля договоров предварительной аренды составила менее 63 (в III кв ndash 23) от всех арендованных площадей Доля сделок продажи также продолжает оставаться низкой и со-ставляет не более 10 от всего объема офисных сделок
Продолжает снижаться количество крупных сделок (размером более 2 000 кв м) Средний размер транзакции снизился на 10 относительно предыдущего квартала и в III квартале составил 528 кв м учитывая только сделки аренды
NtildeOgraveAgraveAcircEcircEgrave AgraveETHAringIacuteAumlUcirc В классе А средняя запрашиваемая арендная ставка составляет 860 долларов США В классе Б средняя ставка аренды стабильна на уровне 520 долларов США Ставки аренды для Прайм офисов продолжают находиться на уровне 1 200 долларов США за кв м в год (без НДС и операционных расходов)
Source Cushman amp Wakefield
Source Cushman amp Wakefield
Q3 2013 AVERAGE BASE RENTAL RATES BY BUSINESS AREA СРЕДНИЕ БАЗОВЫЕ СТАВКИ АРЕНДЫ В III КВ 2013 Г ПО БИЗНЕС РАЙОНАМ
AVERAGE RENTAL RATES (US$) СРЕДНИЕ СТАВКИ АРЕНДЫ (ДОЛЛАРЫ США)
Downtown
Central
OTA
Moscow subareas
Moscow is divided into office submarkets areas with similar real estate indicators and dynamics Office submarkets are grouped in office subareas
The Downtown subarea is the territory inside the Garden Ring and the Belorussky business area
The Central subarea is the territory between the Garden ring and TTR (and the more distant SOK and KUT submarkets)
OTA includes the Moscow suburbs
RENTAL RATES In Class A the average asking rental rate is $860 In Class B the average asking rental rate was stable at $520 Rental rates for prime office space is at the level of $1200 per year per sq m (triple net)
IumlETHIcircAtildeIacuteIcircCcedil Несмотря на то что по заявлениям девелоперов более 400 тыс кв м площадей планируется к вводу во IV кв 2013 года мы ожидаем что до конца года будет введено в эксплуатацию дополнительно не более 150ndash200 тыс кв м новых офисов Таким образом в 2013 году сохранится баланс спроса и предло-жения в большинстве офисных субрынков
Высокие объемы строительства на окраинах города и в Москва-Сити не окажут существенного дестабилизирующего влияния на центральные районы До конца 2013 года а также в 2014 году в центральных районах ставки аренды будут стабильны возможен рост в соответствии в уровнем инфляции
LEASE TERMS IN QUALITY BUSINESS CENTERS УСЛОВИЯ АРЕНДЫ КАЧЕСТВЕННЫХ ОФИСНЫХ ПОМЕЩЕНИЙ
RUR USD or Euros (rarely used) per sqmyr For currency exchange landlords use either Central Bank of Russiarsquos official rate or set their own rate or fix the dollar corridor eg 25-40 RUBUSD
Российские рубли доллары США или евро (используется редко) за квм в год Используется обменный курс ЦБ России или используются условные единицы (уе) с фиксированным курсом в коридоре 25-40 рублей за уе
Payments Iumleumlagraveogravearingaeligegrave Quarterly in advance Ежеквартально авансом
Indexation Egraveiacuteaumlaringecircntildeagraveoumlegraveyuml 3-5 or at the level of USA EU CPI 10-15 for RUR agreements Sometimes step-rents are used
3-5 или US CPI 10-15 для рублевых договоров аренды Ингода используется ступенчатая индексация
Other payments Aumlethoacuteatildeegravearing iumleumlagraveogravearingaeligegrave
Operational expences
Операционные расходыThis sort of payments strongly depends on the service list included Average market payments 100-150 USDsqmyr for Class A 80-120 USDsqmyr for Class B
Платежи зависят от состава включенных услуг который может значительно отличаться 100-150 долларов США за квм в год для Класса A 80-120 долларов США за квм в год для Класса Б
VATНДС 18 18Source Cushman amp Wakefield
FORECAST Despite the announcements from developers that they will deliver more than 400000 sq m in Q4 2013 the new construction forecast continues to be rather conservative Just 150000-200000 sq m of new office space might be delivered by the end of this year Consequently in 2013 the supply-demand balance should remain stable
The high volume of office space under construction is the biggest threat at the moment Against the possible local oversupply in Moscow suburbs and Moscow-City submarkets in 2014 central and prime business areas should see a market balance both at the end of 2013 and during the whole 2014 For these areas rental rates are projected to grow in line with inflation
The table contains office buildings announce for delivery in 2013 with rentable area more than 15000 sq m Delivered buildings are included disregarding the size
TOTAL mdash Office rentable area or all office buildings announced for delivery in 2013 (including small buildings with office rentable less than 15000 sq m)
DOWNTOWNBlackampWhite Complex (bld White) ZAM B+ 13000 Q1Rosso Riva ZAM A 11947 Q1Park Tower BEL B+ 11850 Q1Chistoprudnyy bul 8 bld 1 CBD B- 4730 Q1White Gardens BEL A 63900 Q1Wall Street ZAM A 20493 Q2Vishnevy Sad CBD B+ 6736 Q2Domino ZAM A 6216 Q3Lukoil build-to-suit CBD B+ 35000 Q3CENTRALDubininskaya ul 33B SCH B+ 3000 Q1City Point BC CTY B+ 9951 Q1Sinitsa Plaza BAS B+ 13496 Q2Mercury City CTY A 87574 Q3Poluyaroslavskiy Bolshoy per 102 bld BAS B+ 2294 Q3Poklonnaya ul vl 3 KUT A 85572 Q4Park Pobedy KUT B+ 54000 Q4Nizhegorodsky Business Centre phase II BAS B- 37100 Q4Nizhegorodsky Business Centre phase I BAS B- 23000 Q4Arma 19 BAS B+ 19080 Q4Golden Gate BAS B+ 16000 Q4OTANewton Plaza SE B+ 52000 Q1Danilovskaya Manufaktura Sitsevyi Korpu SE B+ 3396 Q1iCube SW B+ 15256 Q1Obrucheva ul 52 bld3 SW B- 23300 Q1Lotte Business Centre SW B+ 38480 Q1Streamline NE B+ 11048 Q1Quadrum SUB B+ 24650 Q2Park Mira NE B+ 7000 Q2Format Complex II SUB B- 9122 Q2Dobrolyubova 6 bld 5 NE B- 4699 Q3Leninsky 119 SW A 15400 Q3Central Street NE B+ 6423 Q3Smart Park SW B+ 10260 Q39 akrov phase II SW B+ 62300 Q3Country Park Phase III SUB A 19120 Q3Riga Land bld 5 (bld A) (phase II) SUB B+ 40000 Q4Solutions BP bld 3 SW B+ 19500 Q4Avrora NE B- 21600 Q4Neo Geo SW B- 70000 Q4Novator office-hotel complex SUB B+ 24000 Q4Mebe One Khimki Plaza SUB A 26000 Q4
TOTAL 217236
TOTAL 421653
TOTAL 551253
Q3 2013 MoscowRUSSIA A Cushman amp Wakefield Research Publication
HOSPITALITY
ADR IN AUGUST 2013 | СРЕДНЯЯ ЦЕНА ЗА НОМЕР В АВГУСТЕ 2013 $152
QUALITY SUPPLY | ТЕКУЩИЙ ОБЪЕМ КАЧЕСТВЕННОГО ПРЕДЛОЖЕНИЯ 14200 rooms
OCCUPANCY | ЗАПОЛНЯЕМОСТЬ 77
RevPAR | СРЕДНИЙ ДОХОД НА НОМЕР $117
IumlETHAringAumlEumlIcircAEligAringIacuteEgraveAring По оценке департамента гостиничного бизнеса и туризма совокупный объем номерного фонда в Москве на конец III квартала 2013 г составил свыше 48 тыс номеров из них доля качественного предложения составила порядка 30 общего предложения или 142 тыс номеров
Новое предложение за III квартале 2013 г в сегменте качествен-ных гостиниц составило 1138 номеров и было сформировано за счет ввода в эксплуатацию 4-х гостиниц разной ценовой категории
В ноябре 2013 г ожидается открытие гостиниц под управлени-ем оператора Accor комплекс из трех отелей расположен по адресу ул Бахрушина вл 11 В состав комплекса войдут 3 гостиницы разной ценовой категории Mercure на 158 номеров (Upscale) Ibis на 190 номеров (Midscale) Adagio на 149 апартаментов (Midscale)
Это увеличит предложение на рынке качественных отелей минимум на 497 номеров Ожидаемое в 2013 г открытие гостиницы Marriott Novy Arbat (234 номера) перенесено на 1 квартал 2014 года
SUPPLY According to the Department of Hospitality and Tourism the cumulative number of rooms in the Moscow hotel market at the end of Q3 2013 is estimated at more than 48000 rooms with the proportion of high-quality supply at about 30 or 14200 rooms
The increase in high-quality segment by the end of Q3 2013 totaled 1138 rooms resulting from the commissioning of 4 hotels in different price categories
In addition Accor will open three new hotels in November Q4 2013 in the hotel complex located at ul Bakhrushina 11 The complex of hotels includes three brands Mercure with 158 rooms (Upscale) Ibis with 190 rooms (Midscale) and Adagio with 149 rooms (Midscale)
We believe that the total supply of international grade rooms will increase by 497 by the end of 2013 It was expected that more rooms would have been available but the opening of the Marriot Noviy Arbat (234 rooms) was postponed till the Q1 2014
QUALITY MOSCOW HOTEL MARKET STRUCTURE Q3 2013 YTD
NtildeOgraveETHOacuteEcircOgraveOacuteETHAgrave EcircAgravetimesAringNtildeOgraveAcircAringIacuteIacuteUcircOtilde AtildeIcircNtildeOgraveEgraveIacuteEgraveOuml IgraveIcircNtildeEcircAcircUcirc III EcircAcirc 2013
Средняя цена за номер (ADR) в августе 2013 г составила $152 что на 5 выше уровня августа 2012 г Положительная динамика обеспечена за счет гостиниц высокой ценовой категории максимальный рост средней цены за номер по отношению к результатам за аналогичный период 2012 г продемонстрировал рынок гостиниц класса Upscale 16 Среднеценовые объекты напротив работали с более демократичными группами спроса на рынке гостиниц класса Midscale было отмечено снижение показателя ADR на 7 по сравнению с августом 2012 г
Символическое падение ставок за номер на уровне 043 и 221 было отмечено также в сегментах Upper Midscale и Luxury соответственно что в целом характерно для августа ndash наиболее laquoтуристскогоraquo месяца в году
В отношении результатов 2013 г (по данным на август) рынок качественных гостиниц показал небольшое снижение показате-ля ADR (-11) по сравнению с прошлым годом что равносиль-но стабилизации в том числе с учетом ослабления рубля
Наиболее агрессивными с точки зрения ценовых ожиданий остаются гостиницы категории Luxury показывающие на фоне общих понижающих корректировок цены небольшой рост с $375 до $376 за номер
Московские гостиницы предлагают широкий разброс цен по сегментам наиболее дорогие ndash гостиницы категории Luxury где ADR в августе 2013 г составил $315 что на 10698 выше среднего показателя по рынку качественных гостиниц
Ценовой разрыв отелей категории Luxuгy со следующим за ним сегментом внушителен средняя цена за номер в гостиницах категории Upper Upscale уже только на 2875 превысила средний показатель по рынку и составила $197 Стоимость номера в гостиницах категории Upscale сравнима со средним по рынку значением и составляет $160
Цены за номер в гостиницах класса Upper Midscale и Midscale ниже среднерыночных на 30 и 48 соответственно и составляют $105 и $79 за номер (данные за август)
AVERAGE DAILY RATE US DOLLAR (ADR) AUGUST 2013 YTD
QUALITY HOTEL MARKET TRADING Average daily rate in August 2013 estimated to $152 which is 5 higher than in August 2012 This positive dynamic was ensured by high-quality hotels the highest ADR growth was recorded in the Upscale segment ndash Up 16 compared to the same period last year Midscale market in this period was oriented to more democratic groups of demand ADR declined by 7 comparing to August 2012
The fall in ADR at the level of 043 and 221 was also recorded in the Upper Midscale and Luxury segments respectively but that is typical for the August ndash the most tourist month of the year
The results of 2013 (August YtD) showed a symbolic decrease in ADR (-11) comparing to 2012 that can be interpreted as a stabili-zation taking into account the weakening of the Ruble
The most aggressive in terms of price expectations remain Luxury market segment showing slight increase from $375 to $376 per room comparison with the general lowering of prices
Moscow hotels offer a wide range of prices by segment the most expensive ndash Luxury with ADR in August about $315 it is 10698 higher than the average for the Moscow quality market
There is an impressive gap between Luxury hotel prices and prices for the Upper Upscale segment Average daily rate for Upper Upscale is about $197 and only 2875 higher than the average for the Moscow quality market
0
50
100
150
200
250
300
350
400
2010 2011 2012 2013
Luxury Upper Upscale
Upscale Upper Midscale
Midscale Moscow average
0
10
20
30
40
50
60
70
80
2010 2011 2012 2013
Luxury Upper UpscaleUpscale Upper MidscaleMidscale Moscow average
25
MARKETBEAT Q3 2013
NtildeIumlETHIcircNtilde
Средняя годовая загрузка качественных гостиниц Москвы в августе 2013 г составила 77 что на 11 выше данного показателя за аналогичный период прошлого года
Максимально высоким спросом в Москве пользуются гостиницы категории Upper Midscale и Midscale загрузка которых в августе фиксировалась на уровне 854 и 826 соответственно
Одной из особенностей рынка гостиниц Москвы в III кв 2013 г стала высокая загруженность качественных и центрально расположенных гостиниц в августе ndash традиционно низком из-за наступления laquoсезона отпусковraquo Нетипично высокая загрузка стала следствием увеличения туристских потоков в том числе за счет проведения Универсиады в Казани добавившей laquoтранзитныхraquo клиентов московским отелям
По итогам 2013 г по состоянию на август рынок качественных гостиниц показывает рост спроса по сравнению с прошлым годом практически по всем сегментам Рост спроса простимули-рован как ростом потока ночующих посетителей в Москву так и стагнацией цен на размещение последнее обстоятельство говорит о продолжающемся периоде неопределенности
OgraveAringIacuteAumlAringIacuteOumlEgraveEgrave
Среднее значение дохода на номер (RevPAR) за август 2013 г выросло на 171 и составило $117 против $100 в 2012 г В то же время по итогам 2013 г по состоянию на август динамика RevPAR по сегментам колебалась от 84 в Midscale до -46 в отелях категории Upper Midscale
Мы полагаем что тенденции к повышению среднерыночной доходности на номер (+12 YtD) за счет гибкой ценовой политики реагирующей на изменения спроса сохранится и в ближайшей перспективе В 2014 г гостиницы вышедшие на рынок в 2013 г окажут более выраженное воздействие на рыночную ситуацию за счет чего показатели RevPAR по сегменту Luxury и особенно Upper Midscale вряд ли существен-но превзойдут текущие показатели и будут колебаться от слабоотрицательных до слабоположительных значений в начале и конце года
DEMAND The average annual occupancy of quality hotels in Moscow in August 2013 was about 77 which is 11 higher than in the same period last year
Maximum high demand in Moscow hotels was in the Upper Midscale and Midscale category with occupancy in August at the level of 854 and 826 respectively
One of the features of the market of Moscow hotels in Q3 2013 was the high occupancy of quality hotels and especially the central located hotels ndash traditionally low in August because of the holiday season Unusually high occupancy was a result of increased tourist flows including through the Universiade in Kazan which added transit clients for Moscow hotels
In general up to August 2013 (YtD) the Moscow quality hotel market shows a growth in demand comparing to 2012 in almost all segments (reduced occupancy in Upper-Midscale segment by 03 pp can be seen as an insignificant adjustment) Demand growth is stimulated by the growing stream of domestic and international visitors staying overnight in Moscow and the stagnation of prices for accommodation the last point indicates the continuing period of uncertainty in the market
TRENDS IN REVENUE Average revenue per available room (RevRAR) in August 2013 increased by 171 to $117 versus $100 in August 2012
At the same time according to the results of August 2013 RevPAR dynamics by segment ranged from 84 in the Midscale segment to -46 in the Upper Midscale hotels We believe that the tendency to stimulate the RevRAR increase which the flexible price sensible of demand change will continue in the near future In 2014 the new hotels will have a more pronounced effect on the general market situation whereby RevPAR (especially for Luxury and Upper Midscale) unlikely to surpass itrsquos current estimations and will vary from slightly negative to low positive values at the beginning and end of the year
За III квартал 2013 года в эксплуатацию было введено более 235 тыс кв м качественных складских площадей
Ставки аренды остаются стабильными и составляют в среднем $135 за кв м в год в классе А без НДС операци-онных расходов и коммунальных платежей
Цена продажи составляет $1 200- $1 300 за кв м в типовых проектах класса А
Доля вакантных площадей в складах класса А за полугодие не изменилась и составляет 1
Объем арендованных и купленных складских площадей в III составил более 350 тыс кв м
Регионы
В большинстве регионов средние ставки аренды в классе А за прошедший квартал не изменились за исключением Новосибирска и Нижнего Новгорода где ставки выросли на 4-6
Объем арендованных и купленных складских площадей в III квартале составил более 85 тыс кв м
SUMMARY Moscow
In Q3 2013 more than 235000 sq m of quality warehouse space were put into operation
Rental rates remain stable at an average of $135 per sq m per year in A Class excluding VAT operating expenses and utility
The price of sale is $1200 - $1300 per sq m in typical projects of class A
The vacancy rate in Class A warehouses for the half of the year remains unchanged at 1
The volume of leased and purchased warehouse space in Q3 amounted to 350000 sq m
Regions
The average rental rates in Class A have not changed for the quarter in most regions except Novosibirsk and Nizhny Novgorod where rates have increased by 4-6
The volume of leased and purchased warehouse space in Q3 amounted to 85000 sq m
$132
$130
$140
$105
$110
$135
$135
$135
$80
$90
$100
$110
$120
$130
$140
$150
2006 2007 2008 2009 2010 2011 2012 2013F
KEY EXPECTATIONS
STABILITY
0
200
400
600
800
1000
1200
1400
1600
1800
2007 2008 2009 2010 2011 2012 2013F 2014F
27
MARKETBEAT Q3 2013
Source Cushman amp Wakefield
Source Cushman amp Wakefield
Source Cushman amp Wakefield
Source Cushman amp Wakefield
ОСНОВНЫЕ ТЕНДЕНЦИИ Объем нового строительства за 1-III кв 2013 года в Московском регионе составил 550 тыс кв м что соответствует аналогично-му показателю прошлого года Объем арендованных и куплен-ных площадей по итогам прошедших трех кварталов составил белее 830 тыс кв м что приблизительно соответствует показа-телю прошлого года
В регионах объем нового строительства в регионах за первые три квартала составил 239 тыс кв м что на треть меньше про-шлогоднего Арендовано куплено 250 тыс кв м что больше прошлогоднего показателя на 20
ПРЕДЛОЖЕНИЕ В Московском регионе в III квартале 2013 года предложение увеличилось на 235 тыс кв м
В минувшем квартале были построены
Логопарк Север (110 тыс кв м) девелопер Каравелла
Два новых корпуса в логистическом парке Климовск (48 тыс кв м) девелопер Raven Russia
Объем нового строительства соответствует показателям преды-дущего года но темпы строительства ниже заявленных девело-перами Основная проблема mdash задержки в строительстве Боль-ше всего это касается новых девелоперов длительное время работающие на рынке компании укладываются в заявленные сроки Поэтому до конца года будет построено до 1 млн кв м складских площадей
На рынке Москвы сохраняется дефицит готовых к въезду склад-ских площадей Все проекты сдаются или продаются на этапе строительства
Чистые средние ставки аренды в течении прошедшего квартала не изменились и составляют $135 за кв м при этом разброс ставок остается высоким
В 2014 году девелоперы обещают построить около 15 млн кв м складских площадей однако по нашем оценкам из-за задер-жек при строительстве построено будет на 30 меньше
KEY TRENDS The volume of new construction for Q1-Q3 2013 in the Moscow region amounted to 550000 sq m which corresponds to the same period of last year The volume of leased and purchased land based on the results of Q1-Q3 was more than 830000 sq m which approximately relative to the previous year figure
The volume of new construction in the regions for the first three quarters amounted to 239000 sq m which is a three times less than last year indicator 250000 sq m were leased and sold which is 20 more than last year figure
SUPPLY In Q3 2013 supply in Moscow region increased by 235000 sq m
In the last quarter were put into operation
bull Logistics Park North (110000 sq m) developer is Caravella
bull Two new phases in the logistics park Klimovsk (48000 sq m) developer is Raven Russia
The volume of new construction complies with the previous year but below the pace of construction announced by developers The main problem is the delays in construction mostly it concerns new developers Experienced companies meet the announced deadlines Therefore there will be built up to one million sq m of warehouse space until the end of the year
In Moscow there is a lack of ready-to-move storage space All projects are sold or bought during the construction process
Net average rental rates have not changed during the last quarter and amounted to $135 per sq m while the spread rate remains relatively high
In 2014 developers expect to build nearly 15 mn sq m of warehouse space however according to our estimations the volume of construction will be 30 less due to the development process delays
DISTRIBUTION OF QUALITY DEVELOPMENTS IN THE PIPELINE FOR 2013-2014 (lsquo000 SQ M) РАСПРЕДЕЛЕНИЕ ПЛАНИРУЕМЫХ К ВВОДУ В 2013-2014 ГГ СКЛАДСКИХ ПЛОЩАДЕЙ В МОСКОВСКОЙ ОБЛАСТИ ТЫС КВ М
DISTRIBUTION OF WampI SPACE IN THE MOSCOW REGION (lsquo000 SQ M) РАСПРЕДЕЛЕНИЕ СКЛАДСКИХ ПЛОЩАДЕЙ В МОСКОВСКОЙ ОБЛАСТИ ТЫС КВ М
В регионах в минувшем квартале было построено только 43 тыс кв м качественных складских площадей против 117 тыс в прошлом Все новые объекты построены рядом с Санкт-Петербургом
Всего в 2014 году в регионах будет построено боле 290 тыс кв м против 410 тыс кв м в прошлом В большинстве регионов дефицита складских площадей не наблюдается Исключение составляет Санкт-Петербург Екатеринбург и Ростов-на-Дону
Чистые ставки аренды в регионах в III квартале 2013 года не изменились за исключением Новосибирска и Нижнего Новгорода где они немного выросли до $120 и $123 за кв м соответственно
Source Cushman amp Wakefield
TAKE UP lsquo000 SQ M ОБЪЕМ АРЕНДОВАННЫХ И КУПЛЕННЫХ ПЛОЩАДЕЙ ТЫС КВ М
Source Cushman amp Wakefield
During the past quarter only 43000 sq m of quality warehouse space was built In the regions as against last year fiqure (117000 sq m) All new premises were built near St Petersburg
Comparing to last year figure (410000 sq m) more than 290000 sq m is going to be built in the regions in 2014 In most regions there is no lack of warehouse spaces observed The exceptions are St Petersburg Yekaterinburg and Rostov-on-Don
Net rental rates have not changed in the regions in Q3 except Novosibirsk and Nizhny Novgorod where they rose slightly to $120 and $123 per sq m respectively
2013 PIPELINE ОБЪЕКТЫ ЗАЯВЛЕННЫЕ К СТРОИТЕЛЬСТВУ В 2013 Г
PROJECT DEVELOPER GRADE DIRECTION HIGHWAYDISTANCE FROM
MKAD KMTOTAL AREA
000 SQ MEXPECTED
DELIVERY
Infrastroy Bykovo Infrastroy А E Egorevskoe 17 6155 Q1
Infrastroy Bykovo Infrastroy А E Egorevskoe 17 6193 Q4
Klimovsk LP Raven Russia A S Simferopolskoye 23 4772 Q3
Logopark Sever Karavella A N Rogachevskoye 30 11023 Q3
PNK Chekhov II PNK group A S Simferopolskoye 50 10424 Q2
PNK Chekhov II PNK group A S Simferopolskoye 50 5531 Q4
PNK Vnukovo PNK group A SW Kievskoe 19 10568 Q1
South Gate IP Radius group A S Kashirskoye 30 2070 Q2
South Gate IP Radius group A S Kashirskoye 30 3000 Q4
СПРОС В Московском регионе за I-III кварталах 2013 г было арендовано и куплено более 850 тыс кв м качественных складских площадей из них 235 тыс в III квартале что соответствует прошлогодним показателям
Наиболее крупные сделки в минувшем квартале
Автомобильный концерн Volkswagen купил 50 тыс кв м в складском комплексе PNK Чехов 2 девелопер PNK Group
Компания Верный купила 43 тыс кв м в складском комплексе PNK Север девелопер PNK Group
Автомобильный концерн General Motors арендовала 40 тыс кв м в индустриальном комплексе Южные врата
Следует отметить что большое количество качественных складских площадей было арендовано и куплено в III квартале 2013 г производственными компаниями при этом логистиче-ские компании и дистрибьюторы наоборот купили и арендова-ли меньшее количество площадей
Так же следует отметить увеличение доли продаж в III квартале до 42 против 14 во II квартале в структуре поглощения
На региональных рынках за минувший квартал было арендовано и куплено более 85 тыс кв м всего с начала года более 250 тыс кв м что почти на 20 выше аналогичного показателя прошлого года и на 5 среднего значения за последние 5 лет Этот показатель во многом обусловлен самой крупной сделкой за всю историю рынка складской недвижимости Санкт-Петербурга по предварительной продаже 43 тыс кв м компанией PNK Group продуктовой сети laquoВерныйraquo в складском комплексе PNK КАД
Сделки на такие большие площади позволяют девелоперу возобновить строительство в регионах но за период с IV кв 2012 по III квартале 2013 г Было заключено только 4 сделки более 25 тыс кв м Большинство сделок в регионах заключает-ся на складские площади до 10 тыс кв м
STRUCTURE OF DEMAND MOSCOW СТРУКТУРА СПРОСА МОСКВА
DEMAND In the Moscow region in Q1-Q3 2013 more than 850000 sq m were rented and purchased talking about quality warehouse space The Q3 indicator is 235000 sq m which is the same to the last years performance
The largest deals in the last quarter
bull Car manufacturer group Volkswagen bought 50000 sq m in a warehouse complex PNK Chekhov 2 developer is PNK Group
bull The Verniy company bought 43000 sq m in a warehouse complex PNK North developer is PNK Group
bull Automobile сar manufacturer General Motors leased 40000 sq m in the industrial complex South Gate
It should be noted that a large number of quality warehouse space was leased and purchased in the Q3 2013 by manufacturing companies while logistics companies and distributors on the contrary have bought and rented a smaller amount of warehouse space
It should be also mentioned the increasing sales in Q3 up to 42 comparing to 14 in the previous quarter for the both leased and bought premises
At the regional markets for the last quarter it was rented and purchased more than 85000 sq m Since of the beginning of the year more than 250000 sq m were rented and purchased which is almost 20 higher than last year and 5 higher than the average number for the last 5 years This indicator is largely due to the largest deal in the history of the warehouse property market of St Petersburg on the pre-sale of 43000 sq m by PNK Group to the food supplier Verniy in the warehouse complex PNK KAD
Such large deals allow developer to resume construction in the regions However between Q4 2012 and Q3 2013 it was only 4 deals amounted more than 25000 sq m made Most of the deals in the region are for warehouse space up to 10000 sq m
ТЕНДЕНЦИИ С начала прошлого года на рынок складской недвижимости остается стабильным Ежегодный спрос в Московском регионе составляет около 1 млн кв м в год Средние ставки аренды в классе А составляют $135 за кв м в год без НДС операцион-ных расходов и коммунальных платежей доля вакантных площадей сохраняется на уровне 1 Строительство большин-ства новых складских объектов будет начинаться только после заключения предварительных договоров аренды и продажи
Изменение ситуации в ближайшей перспективе ожидать не стоит В условиях низкого роста экономики страны начинать спекулятивное строительство большой риск повторения ситуации 2008 года поэтому предложение будет подстраивать-ся под спрос
На региональных рынках продолжится тенденция увеличения дефицита готовых к въезду складских площадей Не смотря на высокой спрос на складские объекты в регионах девелоперам не удается сформировать достаточных портфель предваритель-ных договоров аренды для начала строительства Исключение составляет Санкт-Петербург Свердловская область юг России где спрос или условия рынка обеспечили девелоперам формирование такого портфеля Мы прогнозируем что до конца года в регионах будет реализовано более 300 тыс кв м складских площадей
Source Cushman amp Wakefield
STRUCTURE OF DEMAND REGIONS СТРУКТУРА СПРОСА РЕГИОНЫ
TRENDS Since the beginning of the last year the warehouse market has remained stable Annual demand in the Moscow region is about one mn sq m per year average rental rates for Class A is $135 per sq m per year excluding VAT operating expenses and utility costs the vacancy rate remains at 1 Construction of the majority of new storage facilities will start only after the preliminary lease or sale contract signing up
In the nearest future the situation would remain the same It is the huge risk to start the new speculative construction in a low-growth economic situation as it is the threaten to repeat the 2008 year crisis the supply will adapt to the demand
The trend of growing deficit of ready-to-move warehouse spaces continues at the regional markets In spite of the high demand for storage facilities in the regions for developers it is still complicated to form a sufficient portfolio of preliminary agreements for the start of construction Exceptions are St Petersburg Sverdlovsk region and south Russia where the demand or market conditions provided developers with the opportunity to form such a portfolio We predict that by the end of the year in the regions will be sold over 300000 sq m of warehouse space
WampI MARKET IN RUSSIA ETHUcircIacuteIcircEcirc NtildeEcircEumlAgraveAumlNtildeEcircEgraveOtilde IumlIcircIgraveAringUgraveAringIacuteEgraveEacute Acirc ETHIcircNtildeNtildeEgraveEgrave
VACANCY RATE (EOY) Paris (Ile de France) 89 81 99 126 102 84 81 89 804
Budapest 59 172 173 188 195 208 194 217 2283
Warsaw 89 74 112 171 194 173 146 1621 1592
Madrid 55 38 37 55 73 84 93 95 972
TAKE UP 000 SQ MParis (Ile de France) 1 005 700 640 601 814 837 563 208 58
Budapest 152 229 308 280 210 327 355 31 21
Warsaw 260 445 556 216 451 743 483 183 112
Madrid 1 225 918 630 325 390 270 225 60 47
2013
36
MARKETBEAT Q3 2013
RESEARCH DEPARTMENT IcircOgraveAumlAringEuml EgraveNtildeNtildeEumlAringAumlIcircAcircAgraveIacuteEgraveEacute
Further information and copies of this report are available from Ellina Krylova
EllinaKrylovaeurcushwakecom
The information provided in this report is intended for informational purposes only and should not be relied on by any party without further independent verification Classifications of individual buildings are reviewed on a continuing basis and are subject to change The standards used in this process are consistent with those used by Moscow Research Forum and in the United States by the Society of Industrial and Office Realtors (SIOR) and BOMA International Reproduction of this report in whole or part is permitted only with written consent of Cushman amp Wakefield Data from this report may be cited with proper acknowledgment given
copy 2013 Cushman amp Wakefield All rights reserved
MORE INFORMATION AND CONTACTS ARE AVAILABLE ON WWWMARKETBEATRU EgraveIacuteOcircIcircETHIgraveAgraveOumlEgraveszlig IcircAacute IcircOgraveAumlAringEumlAring EgraveNtildeNtildeEumlAringAumlIcircAcircAgraveIacuteEgraveEacute Egrave IumlOacuteAacuteEumlEgraveEcircAgraveOumlEgraveEgrave AumlIcircNtildeOgraveOacuteIumlIacuteUcirc IacuteAgrave WWWMARKETBEATRU
DENIS SOKOLOV PARTNER RESEARCH DIRECTOR DenisSokoloveurcushwakecom
LADA BELAYCHUK ASSOCIATE DIRECTOR DEPUTY RESEARCH DIRECTOR LadaBelaychukeurcushwakecom
MAXIM ILYIN CONSULTANT CAPITAL MARKETS Maximilyineurcushwakecom
ALEXANDER KUNTSEVICH ANALYST WampI PROJECT MANAGEMENT AlexanerKuntsevicheurcushwakecom
Q3 2013 MoscowRUSSIA A Cushman amp Wakefield Research Publication
OFFICE MARKET
IcircAacuteCcedilIcircETH ETHUcircIacuteEcircAgrave В III квартале 2013 г рынок продолжает оставаться активным спрос и предложение сбалансированы ставки аренды стабильны
Тенденция ослабления рынка офисной недвижимости отмечен-ная впервые в предыдущем квартале подкрепляется новыми фактами
Продолжилось снижение общего объема заключаемых сделок аренды и покупки в III квартале общий объем заключенных сделок составил 385 836 кв м что на 20 ниже среднего уровня 2011-2012 гг
Даже небольшой рост объема вывода на рынок новых помеще-ний приводит к увеличению доли свободных помещений За счет одного крупного объекта (Башня Меркурий в Москва-Сити арендуемой площадью 87 547 кв м) объемы ввода в эксплуатацию офисных площадей класса А в III квартале увеличились вдвое относительно средних объемов строительст-ва последних трех лет В результате уровень свободных помещений в классе А в среднем по Москве увеличился на 35 пп а в районе Москва-Сити mdash на 156 пп
Средняя ставка аренды не изменяется в течение последних трех кварталов в то время как инфляции в России за январь-май 2013 превысила уровень 7
ABSORPTION AND NEW CONSTRUCTION CLASSES A AND B (MN SQ M)
OVERVIEW The third quarter of the year saw the office market remain healthy with steady levels of demand Rents held firm There is a tendency of weakening signs in the office market which was noted for the first time in the previous quarter Now it is supported by some new facts
Overall demand level has continued to decrease Q3 take-up is 385836 sq m which is 20 less than the average take-up level for 2011-2012
Even moderate growth of new office space affects the vacancy rate In Q3 the delivery of Mercury Tower in Moscow City submarket (87547 sq m of office rentable area) doubled the quarterly Class A new construction volume (compared to the average number during the last three years) As a result the level of vacant space has increased by 35 percentage points in the Moscow Class A sector Talking about Moscow City submarket the volume of vacant space has increased by 156 points
Rental rates remain unchanged the CPI is above 7 (January-May 2013 data)
Source Cushman amp Wakefield
TOTAL STOCK MOSCOW | ОБЩИЙ ОБЪЕМ ПРЕДЛОЖЕНИЯ В МОСКВЕ 1360 mn sq m
VACANCY RATE | ДОЛЯ СВОБОДНЫХ ПЛОЩАДЕЙ 128
US$ 860 AVERAGE RENTAL RATE CLASS A | СРЕДНЯЯ АРЕНДНАЯ СТАВКА КЛАСС А
Q1-Q3 DEMAND (TAKE-UP) | ОБЪЕМ СДЕЛОК АРЕНДЫ И ПРОДАЖИ В 1-III КВ 2013 1190138 sq m
Q1-Q3 2013 NEW CONSTRUCTION | НОВОЕ СТРОИТЕЛЬСТВО В 1-III КВ 2013 594009 sq m
SUPPLY By the end of Q3 2013 Moscow had 136 mn sq m of quality office space Nine new office buildings were completed with a rentable area of 244587 sq m in Q3 New construction volume remains moderate
Nearly 50 of new office space delivered in 2013 is located in the Moscow suburbs (outside TTR) while the demand is drawn towards the city center So the suburbs are in danger of oversupply during the last four quarters the vacancy rate in suburban submarkets has increased by 58 percentage points from 11 in Q3 2013 to 168 in Q3 2013
In the Central and Prime business areas (with the exception of Moscow City submarket) the vacancy rate is stable while in several central submarkets (such as Tagansky Frunzensky Novoslobodsky) the availability is decreasing
After the recent delivery of Mercury Tower with 87547 sq m of office rentable space Moscow City availability has doubled Hence the Moscow City vacancy rate grew by 156 percentage points up to 327
Altogether there are 154 mn sq m of available office premises in existing buildings and 35 mn sq m is under speculative construction
IumlETHAringAumlEumlIcircAEligAringIacuteEgraveAring По состоянию на конец III квартала 2013 года в Москве насчи-тывалось 136 млн кв м качественных офисов В III квартале было введено в эксплуатацию 9 офисных зданий общей арен-дуемой площадью 244 587 кв м Объемы нового строительства продолжают оставаться умеренными
Около 50 новых офисных площадей вышедших на рынок в 2013 году находятся в удаленных от центра города районах (за пределами ТТК) В то же время спрос продолжает тяготеть к центру города В результате на окраинах города наблюдается тенденция к росту избыточности предложения Так в течение 4-х последних кварталов уровень свободных помещений в рай-онах за пределам ТТК увеличился на 58 пп с 11 (III кв 2012) до 168 (III кв 2013) Внутри ТТК уровень свободных помеще-ний стабилен а в некоторых субрынках (Таганском Фрунзен-ском Новослободском) свободных помещений становится меньше Исключение составляет субрынок Москва-Сити где после ввода в эксплуатацию Башни Меркурий площадью 87 547 кв м объем свободных помещений удвоился что не-медленно привело к росту уровня свободных помещений на 156 пп до уровня 327
Всего в Москве предлагается в аренду или на продажу 154 млн кв м в существующих и 35 млн кв м в строящихся зданиях
Future supply mdash available space in buildings to be delivered in the next 12 month (under construction and under reconstruction) The data is given for the end of the period
Source Cushman amp Wakefield Source Cushman amp Wakefield Moscow Research Forum
DEMAND Overall 12 million sq m of quality office space was leased or bought during Q1-Q3 2013 For the second quarter in a row the total volume of take-up is decreasing In Q3 385836 sq m of quality office space has been transacted which is 20 below the average quarterly level of 2011-2012 Real estate budgets are limited and tenants tend to primarily consider their current location as a viable alternative to a new office
Tenants continue to be interested primarily in existing buildings the proportion of pre-lease agreements in Q1-Q3 was 63 of the total rented space (23 in Q3) In 2013 there is a significant reduction in the proportion of sales deals (from 20 on average in 2011-2012 to around 10 in 2013)
The number of large transactions (over 2000 sq m) continues decreasing The average transaction size has reduced again by 10 compared with the previous quarter and now stands at 528 sq m (taking into account only leasing deals)
NtildeIumlETHIcircNtilde Всего за три квартала 2013 года было арендовано и куплено 12 миллиона кв м качественных офисных помещений Вто-рой квартал подряд наблюдается снижение общего объема сделок В III квартале общий объем сделок составил 385 836 кв м что на 20 ниже среднего уровня 2011-2012 годов Бюджеты на недвижимость и переезды ограничены аренда-торы и арендодатели все чаще находят компромиссы приво-дящие к продлению текущих договоров аренды а не заклю-чению новых сделок в новых зданиях
Арендаторы продолжают интересоваться главным образом введенными в эксплуатацию зданиями ndash в 2013 году (1-III кв) доля договоров предварительной аренды составила менее 63 (в III кв ndash 23) от всех арендованных площадей Доля сделок продажи также продолжает оставаться низкой и со-ставляет не более 10 от всего объема офисных сделок
Продолжает снижаться количество крупных сделок (размером более 2 000 кв м) Средний размер транзакции снизился на 10 относительно предыдущего квартала и в III квартале составил 528 кв м учитывая только сделки аренды
NtildeOgraveAgraveAcircEcircEgrave AgraveETHAringIacuteAumlUcirc В классе А средняя запрашиваемая арендная ставка составляет 860 долларов США В классе Б средняя ставка аренды стабильна на уровне 520 долларов США Ставки аренды для Прайм офисов продолжают находиться на уровне 1 200 долларов США за кв м в год (без НДС и операционных расходов)
Source Cushman amp Wakefield
Source Cushman amp Wakefield
Q3 2013 AVERAGE BASE RENTAL RATES BY BUSINESS AREA СРЕДНИЕ БАЗОВЫЕ СТАВКИ АРЕНДЫ В III КВ 2013 Г ПО БИЗНЕС РАЙОНАМ
AVERAGE RENTAL RATES (US$) СРЕДНИЕ СТАВКИ АРЕНДЫ (ДОЛЛАРЫ США)
Downtown
Central
OTA
Moscow subareas
Moscow is divided into office submarkets areas with similar real estate indicators and dynamics Office submarkets are grouped in office subareas
The Downtown subarea is the territory inside the Garden Ring and the Belorussky business area
The Central subarea is the territory between the Garden ring and TTR (and the more distant SOK and KUT submarkets)
OTA includes the Moscow suburbs
RENTAL RATES In Class A the average asking rental rate is $860 In Class B the average asking rental rate was stable at $520 Rental rates for prime office space is at the level of $1200 per year per sq m (triple net)
IumlETHIcircAtildeIacuteIcircCcedil Несмотря на то что по заявлениям девелоперов более 400 тыс кв м площадей планируется к вводу во IV кв 2013 года мы ожидаем что до конца года будет введено в эксплуатацию дополнительно не более 150ndash200 тыс кв м новых офисов Таким образом в 2013 году сохранится баланс спроса и предло-жения в большинстве офисных субрынков
Высокие объемы строительства на окраинах города и в Москва-Сити не окажут существенного дестабилизирующего влияния на центральные районы До конца 2013 года а также в 2014 году в центральных районах ставки аренды будут стабильны возможен рост в соответствии в уровнем инфляции
LEASE TERMS IN QUALITY BUSINESS CENTERS УСЛОВИЯ АРЕНДЫ КАЧЕСТВЕННЫХ ОФИСНЫХ ПОМЕЩЕНИЙ
RUR USD or Euros (rarely used) per sqmyr For currency exchange landlords use either Central Bank of Russiarsquos official rate or set their own rate or fix the dollar corridor eg 25-40 RUBUSD
Российские рубли доллары США или евро (используется редко) за квм в год Используется обменный курс ЦБ России или используются условные единицы (уе) с фиксированным курсом в коридоре 25-40 рублей за уе
Payments Iumleumlagraveogravearingaeligegrave Quarterly in advance Ежеквартально авансом
Indexation Egraveiacuteaumlaringecircntildeagraveoumlegraveyuml 3-5 or at the level of USA EU CPI 10-15 for RUR agreements Sometimes step-rents are used
3-5 или US CPI 10-15 для рублевых договоров аренды Ингода используется ступенчатая индексация
Other payments Aumlethoacuteatildeegravearing iumleumlagraveogravearingaeligegrave
Operational expences
Операционные расходыThis sort of payments strongly depends on the service list included Average market payments 100-150 USDsqmyr for Class A 80-120 USDsqmyr for Class B
Платежи зависят от состава включенных услуг который может значительно отличаться 100-150 долларов США за квм в год для Класса A 80-120 долларов США за квм в год для Класса Б
VATНДС 18 18Source Cushman amp Wakefield
FORECAST Despite the announcements from developers that they will deliver more than 400000 sq m in Q4 2013 the new construction forecast continues to be rather conservative Just 150000-200000 sq m of new office space might be delivered by the end of this year Consequently in 2013 the supply-demand balance should remain stable
The high volume of office space under construction is the biggest threat at the moment Against the possible local oversupply in Moscow suburbs and Moscow-City submarkets in 2014 central and prime business areas should see a market balance both at the end of 2013 and during the whole 2014 For these areas rental rates are projected to grow in line with inflation
The table contains office buildings announce for delivery in 2013 with rentable area more than 15000 sq m Delivered buildings are included disregarding the size
TOTAL mdash Office rentable area or all office buildings announced for delivery in 2013 (including small buildings with office rentable less than 15000 sq m)
DOWNTOWNBlackampWhite Complex (bld White) ZAM B+ 13000 Q1Rosso Riva ZAM A 11947 Q1Park Tower BEL B+ 11850 Q1Chistoprudnyy bul 8 bld 1 CBD B- 4730 Q1White Gardens BEL A 63900 Q1Wall Street ZAM A 20493 Q2Vishnevy Sad CBD B+ 6736 Q2Domino ZAM A 6216 Q3Lukoil build-to-suit CBD B+ 35000 Q3CENTRALDubininskaya ul 33B SCH B+ 3000 Q1City Point BC CTY B+ 9951 Q1Sinitsa Plaza BAS B+ 13496 Q2Mercury City CTY A 87574 Q3Poluyaroslavskiy Bolshoy per 102 bld BAS B+ 2294 Q3Poklonnaya ul vl 3 KUT A 85572 Q4Park Pobedy KUT B+ 54000 Q4Nizhegorodsky Business Centre phase II BAS B- 37100 Q4Nizhegorodsky Business Centre phase I BAS B- 23000 Q4Arma 19 BAS B+ 19080 Q4Golden Gate BAS B+ 16000 Q4OTANewton Plaza SE B+ 52000 Q1Danilovskaya Manufaktura Sitsevyi Korpu SE B+ 3396 Q1iCube SW B+ 15256 Q1Obrucheva ul 52 bld3 SW B- 23300 Q1Lotte Business Centre SW B+ 38480 Q1Streamline NE B+ 11048 Q1Quadrum SUB B+ 24650 Q2Park Mira NE B+ 7000 Q2Format Complex II SUB B- 9122 Q2Dobrolyubova 6 bld 5 NE B- 4699 Q3Leninsky 119 SW A 15400 Q3Central Street NE B+ 6423 Q3Smart Park SW B+ 10260 Q39 akrov phase II SW B+ 62300 Q3Country Park Phase III SUB A 19120 Q3Riga Land bld 5 (bld A) (phase II) SUB B+ 40000 Q4Solutions BP bld 3 SW B+ 19500 Q4Avrora NE B- 21600 Q4Neo Geo SW B- 70000 Q4Novator office-hotel complex SUB B+ 24000 Q4Mebe One Khimki Plaza SUB A 26000 Q4
TOTAL 217236
TOTAL 421653
TOTAL 551253
Q3 2013 MoscowRUSSIA A Cushman amp Wakefield Research Publication
HOSPITALITY
ADR IN AUGUST 2013 | СРЕДНЯЯ ЦЕНА ЗА НОМЕР В АВГУСТЕ 2013 $152
QUALITY SUPPLY | ТЕКУЩИЙ ОБЪЕМ КАЧЕСТВЕННОГО ПРЕДЛОЖЕНИЯ 14200 rooms
OCCUPANCY | ЗАПОЛНЯЕМОСТЬ 77
RevPAR | СРЕДНИЙ ДОХОД НА НОМЕР $117
IumlETHAringAumlEumlIcircAEligAringIacuteEgraveAring По оценке департамента гостиничного бизнеса и туризма совокупный объем номерного фонда в Москве на конец III квартала 2013 г составил свыше 48 тыс номеров из них доля качественного предложения составила порядка 30 общего предложения или 142 тыс номеров
Новое предложение за III квартале 2013 г в сегменте качествен-ных гостиниц составило 1138 номеров и было сформировано за счет ввода в эксплуатацию 4-х гостиниц разной ценовой категории
В ноябре 2013 г ожидается открытие гостиниц под управлени-ем оператора Accor комплекс из трех отелей расположен по адресу ул Бахрушина вл 11 В состав комплекса войдут 3 гостиницы разной ценовой категории Mercure на 158 номеров (Upscale) Ibis на 190 номеров (Midscale) Adagio на 149 апартаментов (Midscale)
Это увеличит предложение на рынке качественных отелей минимум на 497 номеров Ожидаемое в 2013 г открытие гостиницы Marriott Novy Arbat (234 номера) перенесено на 1 квартал 2014 года
SUPPLY According to the Department of Hospitality and Tourism the cumulative number of rooms in the Moscow hotel market at the end of Q3 2013 is estimated at more than 48000 rooms with the proportion of high-quality supply at about 30 or 14200 rooms
The increase in high-quality segment by the end of Q3 2013 totaled 1138 rooms resulting from the commissioning of 4 hotels in different price categories
In addition Accor will open three new hotels in November Q4 2013 in the hotel complex located at ul Bakhrushina 11 The complex of hotels includes three brands Mercure with 158 rooms (Upscale) Ibis with 190 rooms (Midscale) and Adagio with 149 rooms (Midscale)
We believe that the total supply of international grade rooms will increase by 497 by the end of 2013 It was expected that more rooms would have been available but the opening of the Marriot Noviy Arbat (234 rooms) was postponed till the Q1 2014
QUALITY MOSCOW HOTEL MARKET STRUCTURE Q3 2013 YTD
NtildeOgraveETHOacuteEcircOgraveOacuteETHAgrave EcircAgravetimesAringNtildeOgraveAcircAringIacuteIacuteUcircOtilde AtildeIcircNtildeOgraveEgraveIacuteEgraveOuml IgraveIcircNtildeEcircAcircUcirc III EcircAcirc 2013
Средняя цена за номер (ADR) в августе 2013 г составила $152 что на 5 выше уровня августа 2012 г Положительная динамика обеспечена за счет гостиниц высокой ценовой категории максимальный рост средней цены за номер по отношению к результатам за аналогичный период 2012 г продемонстрировал рынок гостиниц класса Upscale 16 Среднеценовые объекты напротив работали с более демократичными группами спроса на рынке гостиниц класса Midscale было отмечено снижение показателя ADR на 7 по сравнению с августом 2012 г
Символическое падение ставок за номер на уровне 043 и 221 было отмечено также в сегментах Upper Midscale и Luxury соответственно что в целом характерно для августа ndash наиболее laquoтуристскогоraquo месяца в году
В отношении результатов 2013 г (по данным на август) рынок качественных гостиниц показал небольшое снижение показате-ля ADR (-11) по сравнению с прошлым годом что равносиль-но стабилизации в том числе с учетом ослабления рубля
Наиболее агрессивными с точки зрения ценовых ожиданий остаются гостиницы категории Luxury показывающие на фоне общих понижающих корректировок цены небольшой рост с $375 до $376 за номер
Московские гостиницы предлагают широкий разброс цен по сегментам наиболее дорогие ndash гостиницы категории Luxury где ADR в августе 2013 г составил $315 что на 10698 выше среднего показателя по рынку качественных гостиниц
Ценовой разрыв отелей категории Luxuгy со следующим за ним сегментом внушителен средняя цена за номер в гостиницах категории Upper Upscale уже только на 2875 превысила средний показатель по рынку и составила $197 Стоимость номера в гостиницах категории Upscale сравнима со средним по рынку значением и составляет $160
Цены за номер в гостиницах класса Upper Midscale и Midscale ниже среднерыночных на 30 и 48 соответственно и составляют $105 и $79 за номер (данные за август)
AVERAGE DAILY RATE US DOLLAR (ADR) AUGUST 2013 YTD
QUALITY HOTEL MARKET TRADING Average daily rate in August 2013 estimated to $152 which is 5 higher than in August 2012 This positive dynamic was ensured by high-quality hotels the highest ADR growth was recorded in the Upscale segment ndash Up 16 compared to the same period last year Midscale market in this period was oriented to more democratic groups of demand ADR declined by 7 comparing to August 2012
The fall in ADR at the level of 043 and 221 was also recorded in the Upper Midscale and Luxury segments respectively but that is typical for the August ndash the most tourist month of the year
The results of 2013 (August YtD) showed a symbolic decrease in ADR (-11) comparing to 2012 that can be interpreted as a stabili-zation taking into account the weakening of the Ruble
The most aggressive in terms of price expectations remain Luxury market segment showing slight increase from $375 to $376 per room comparison with the general lowering of prices
Moscow hotels offer a wide range of prices by segment the most expensive ndash Luxury with ADR in August about $315 it is 10698 higher than the average for the Moscow quality market
There is an impressive gap between Luxury hotel prices and prices for the Upper Upscale segment Average daily rate for Upper Upscale is about $197 and only 2875 higher than the average for the Moscow quality market
0
50
100
150
200
250
300
350
400
2010 2011 2012 2013
Luxury Upper Upscale
Upscale Upper Midscale
Midscale Moscow average
0
10
20
30
40
50
60
70
80
2010 2011 2012 2013
Luxury Upper UpscaleUpscale Upper MidscaleMidscale Moscow average
25
MARKETBEAT Q3 2013
NtildeIumlETHIcircNtilde
Средняя годовая загрузка качественных гостиниц Москвы в августе 2013 г составила 77 что на 11 выше данного показателя за аналогичный период прошлого года
Максимально высоким спросом в Москве пользуются гостиницы категории Upper Midscale и Midscale загрузка которых в августе фиксировалась на уровне 854 и 826 соответственно
Одной из особенностей рынка гостиниц Москвы в III кв 2013 г стала высокая загруженность качественных и центрально расположенных гостиниц в августе ndash традиционно низком из-за наступления laquoсезона отпусковraquo Нетипично высокая загрузка стала следствием увеличения туристских потоков в том числе за счет проведения Универсиады в Казани добавившей laquoтранзитныхraquo клиентов московским отелям
По итогам 2013 г по состоянию на август рынок качественных гостиниц показывает рост спроса по сравнению с прошлым годом практически по всем сегментам Рост спроса простимули-рован как ростом потока ночующих посетителей в Москву так и стагнацией цен на размещение последнее обстоятельство говорит о продолжающемся периоде неопределенности
OgraveAringIacuteAumlAringIacuteOumlEgraveEgrave
Среднее значение дохода на номер (RevPAR) за август 2013 г выросло на 171 и составило $117 против $100 в 2012 г В то же время по итогам 2013 г по состоянию на август динамика RevPAR по сегментам колебалась от 84 в Midscale до -46 в отелях категории Upper Midscale
Мы полагаем что тенденции к повышению среднерыночной доходности на номер (+12 YtD) за счет гибкой ценовой политики реагирующей на изменения спроса сохранится и в ближайшей перспективе В 2014 г гостиницы вышедшие на рынок в 2013 г окажут более выраженное воздействие на рыночную ситуацию за счет чего показатели RevPAR по сегменту Luxury и особенно Upper Midscale вряд ли существен-но превзойдут текущие показатели и будут колебаться от слабоотрицательных до слабоположительных значений в начале и конце года
DEMAND The average annual occupancy of quality hotels in Moscow in August 2013 was about 77 which is 11 higher than in the same period last year
Maximum high demand in Moscow hotels was in the Upper Midscale and Midscale category with occupancy in August at the level of 854 and 826 respectively
One of the features of the market of Moscow hotels in Q3 2013 was the high occupancy of quality hotels and especially the central located hotels ndash traditionally low in August because of the holiday season Unusually high occupancy was a result of increased tourist flows including through the Universiade in Kazan which added transit clients for Moscow hotels
In general up to August 2013 (YtD) the Moscow quality hotel market shows a growth in demand comparing to 2012 in almost all segments (reduced occupancy in Upper-Midscale segment by 03 pp can be seen as an insignificant adjustment) Demand growth is stimulated by the growing stream of domestic and international visitors staying overnight in Moscow and the stagnation of prices for accommodation the last point indicates the continuing period of uncertainty in the market
TRENDS IN REVENUE Average revenue per available room (RevRAR) in August 2013 increased by 171 to $117 versus $100 in August 2012
At the same time according to the results of August 2013 RevPAR dynamics by segment ranged from 84 in the Midscale segment to -46 in the Upper Midscale hotels We believe that the tendency to stimulate the RevRAR increase which the flexible price sensible of demand change will continue in the near future In 2014 the new hotels will have a more pronounced effect on the general market situation whereby RevPAR (especially for Luxury and Upper Midscale) unlikely to surpass itrsquos current estimations and will vary from slightly negative to low positive values at the beginning and end of the year
За III квартал 2013 года в эксплуатацию было введено более 235 тыс кв м качественных складских площадей
Ставки аренды остаются стабильными и составляют в среднем $135 за кв м в год в классе А без НДС операци-онных расходов и коммунальных платежей
Цена продажи составляет $1 200- $1 300 за кв м в типовых проектах класса А
Доля вакантных площадей в складах класса А за полугодие не изменилась и составляет 1
Объем арендованных и купленных складских площадей в III составил более 350 тыс кв м
Регионы
В большинстве регионов средние ставки аренды в классе А за прошедший квартал не изменились за исключением Новосибирска и Нижнего Новгорода где ставки выросли на 4-6
Объем арендованных и купленных складских площадей в III квартале составил более 85 тыс кв м
SUMMARY Moscow
In Q3 2013 more than 235000 sq m of quality warehouse space were put into operation
Rental rates remain stable at an average of $135 per sq m per year in A Class excluding VAT operating expenses and utility
The price of sale is $1200 - $1300 per sq m in typical projects of class A
The vacancy rate in Class A warehouses for the half of the year remains unchanged at 1
The volume of leased and purchased warehouse space in Q3 amounted to 350000 sq m
Regions
The average rental rates in Class A have not changed for the quarter in most regions except Novosibirsk and Nizhny Novgorod where rates have increased by 4-6
The volume of leased and purchased warehouse space in Q3 amounted to 85000 sq m
$132
$130
$140
$105
$110
$135
$135
$135
$80
$90
$100
$110
$120
$130
$140
$150
2006 2007 2008 2009 2010 2011 2012 2013F
KEY EXPECTATIONS
STABILITY
0
200
400
600
800
1000
1200
1400
1600
1800
2007 2008 2009 2010 2011 2012 2013F 2014F
27
MARKETBEAT Q3 2013
Source Cushman amp Wakefield
Source Cushman amp Wakefield
Source Cushman amp Wakefield
Source Cushman amp Wakefield
ОСНОВНЫЕ ТЕНДЕНЦИИ Объем нового строительства за 1-III кв 2013 года в Московском регионе составил 550 тыс кв м что соответствует аналогично-му показателю прошлого года Объем арендованных и куплен-ных площадей по итогам прошедших трех кварталов составил белее 830 тыс кв м что приблизительно соответствует показа-телю прошлого года
В регионах объем нового строительства в регионах за первые три квартала составил 239 тыс кв м что на треть меньше про-шлогоднего Арендовано куплено 250 тыс кв м что больше прошлогоднего показателя на 20
ПРЕДЛОЖЕНИЕ В Московском регионе в III квартале 2013 года предложение увеличилось на 235 тыс кв м
В минувшем квартале были построены
Логопарк Север (110 тыс кв м) девелопер Каравелла
Два новых корпуса в логистическом парке Климовск (48 тыс кв м) девелопер Raven Russia
Объем нового строительства соответствует показателям преды-дущего года но темпы строительства ниже заявленных девело-перами Основная проблема mdash задержки в строительстве Боль-ше всего это касается новых девелоперов длительное время работающие на рынке компании укладываются в заявленные сроки Поэтому до конца года будет построено до 1 млн кв м складских площадей
На рынке Москвы сохраняется дефицит готовых к въезду склад-ских площадей Все проекты сдаются или продаются на этапе строительства
Чистые средние ставки аренды в течении прошедшего квартала не изменились и составляют $135 за кв м при этом разброс ставок остается высоким
В 2014 году девелоперы обещают построить около 15 млн кв м складских площадей однако по нашем оценкам из-за задер-жек при строительстве построено будет на 30 меньше
KEY TRENDS The volume of new construction for Q1-Q3 2013 in the Moscow region amounted to 550000 sq m which corresponds to the same period of last year The volume of leased and purchased land based on the results of Q1-Q3 was more than 830000 sq m which approximately relative to the previous year figure
The volume of new construction in the regions for the first three quarters amounted to 239000 sq m which is a three times less than last year indicator 250000 sq m were leased and sold which is 20 more than last year figure
SUPPLY In Q3 2013 supply in Moscow region increased by 235000 sq m
In the last quarter were put into operation
bull Logistics Park North (110000 sq m) developer is Caravella
bull Two new phases in the logistics park Klimovsk (48000 sq m) developer is Raven Russia
The volume of new construction complies with the previous year but below the pace of construction announced by developers The main problem is the delays in construction mostly it concerns new developers Experienced companies meet the announced deadlines Therefore there will be built up to one million sq m of warehouse space until the end of the year
In Moscow there is a lack of ready-to-move storage space All projects are sold or bought during the construction process
Net average rental rates have not changed during the last quarter and amounted to $135 per sq m while the spread rate remains relatively high
In 2014 developers expect to build nearly 15 mn sq m of warehouse space however according to our estimations the volume of construction will be 30 less due to the development process delays
DISTRIBUTION OF QUALITY DEVELOPMENTS IN THE PIPELINE FOR 2013-2014 (lsquo000 SQ M) РАСПРЕДЕЛЕНИЕ ПЛАНИРУЕМЫХ К ВВОДУ В 2013-2014 ГГ СКЛАДСКИХ ПЛОЩАДЕЙ В МОСКОВСКОЙ ОБЛАСТИ ТЫС КВ М
DISTRIBUTION OF WampI SPACE IN THE MOSCOW REGION (lsquo000 SQ M) РАСПРЕДЕЛЕНИЕ СКЛАДСКИХ ПЛОЩАДЕЙ В МОСКОВСКОЙ ОБЛАСТИ ТЫС КВ М
В регионах в минувшем квартале было построено только 43 тыс кв м качественных складских площадей против 117 тыс в прошлом Все новые объекты построены рядом с Санкт-Петербургом
Всего в 2014 году в регионах будет построено боле 290 тыс кв м против 410 тыс кв м в прошлом В большинстве регионов дефицита складских площадей не наблюдается Исключение составляет Санкт-Петербург Екатеринбург и Ростов-на-Дону
Чистые ставки аренды в регионах в III квартале 2013 года не изменились за исключением Новосибирска и Нижнего Новгорода где они немного выросли до $120 и $123 за кв м соответственно
Source Cushman amp Wakefield
TAKE UP lsquo000 SQ M ОБЪЕМ АРЕНДОВАННЫХ И КУПЛЕННЫХ ПЛОЩАДЕЙ ТЫС КВ М
Source Cushman amp Wakefield
During the past quarter only 43000 sq m of quality warehouse space was built In the regions as against last year fiqure (117000 sq m) All new premises were built near St Petersburg
Comparing to last year figure (410000 sq m) more than 290000 sq m is going to be built in the regions in 2014 In most regions there is no lack of warehouse spaces observed The exceptions are St Petersburg Yekaterinburg and Rostov-on-Don
Net rental rates have not changed in the regions in Q3 except Novosibirsk and Nizhny Novgorod where they rose slightly to $120 and $123 per sq m respectively
2013 PIPELINE ОБЪЕКТЫ ЗАЯВЛЕННЫЕ К СТРОИТЕЛЬСТВУ В 2013 Г
PROJECT DEVELOPER GRADE DIRECTION HIGHWAYDISTANCE FROM
MKAD KMTOTAL AREA
000 SQ MEXPECTED
DELIVERY
Infrastroy Bykovo Infrastroy А E Egorevskoe 17 6155 Q1
Infrastroy Bykovo Infrastroy А E Egorevskoe 17 6193 Q4
Klimovsk LP Raven Russia A S Simferopolskoye 23 4772 Q3
Logopark Sever Karavella A N Rogachevskoye 30 11023 Q3
PNK Chekhov II PNK group A S Simferopolskoye 50 10424 Q2
PNK Chekhov II PNK group A S Simferopolskoye 50 5531 Q4
PNK Vnukovo PNK group A SW Kievskoe 19 10568 Q1
South Gate IP Radius group A S Kashirskoye 30 2070 Q2
South Gate IP Radius group A S Kashirskoye 30 3000 Q4
СПРОС В Московском регионе за I-III кварталах 2013 г было арендовано и куплено более 850 тыс кв м качественных складских площадей из них 235 тыс в III квартале что соответствует прошлогодним показателям
Наиболее крупные сделки в минувшем квартале
Автомобильный концерн Volkswagen купил 50 тыс кв м в складском комплексе PNK Чехов 2 девелопер PNK Group
Компания Верный купила 43 тыс кв м в складском комплексе PNK Север девелопер PNK Group
Автомобильный концерн General Motors арендовала 40 тыс кв м в индустриальном комплексе Южные врата
Следует отметить что большое количество качественных складских площадей было арендовано и куплено в III квартале 2013 г производственными компаниями при этом логистиче-ские компании и дистрибьюторы наоборот купили и арендова-ли меньшее количество площадей
Так же следует отметить увеличение доли продаж в III квартале до 42 против 14 во II квартале в структуре поглощения
На региональных рынках за минувший квартал было арендовано и куплено более 85 тыс кв м всего с начала года более 250 тыс кв м что почти на 20 выше аналогичного показателя прошлого года и на 5 среднего значения за последние 5 лет Этот показатель во многом обусловлен самой крупной сделкой за всю историю рынка складской недвижимости Санкт-Петербурга по предварительной продаже 43 тыс кв м компанией PNK Group продуктовой сети laquoВерныйraquo в складском комплексе PNK КАД
Сделки на такие большие площади позволяют девелоперу возобновить строительство в регионах но за период с IV кв 2012 по III квартале 2013 г Было заключено только 4 сделки более 25 тыс кв м Большинство сделок в регионах заключает-ся на складские площади до 10 тыс кв м
STRUCTURE OF DEMAND MOSCOW СТРУКТУРА СПРОСА МОСКВА
DEMAND In the Moscow region in Q1-Q3 2013 more than 850000 sq m were rented and purchased talking about quality warehouse space The Q3 indicator is 235000 sq m which is the same to the last years performance
The largest deals in the last quarter
bull Car manufacturer group Volkswagen bought 50000 sq m in a warehouse complex PNK Chekhov 2 developer is PNK Group
bull The Verniy company bought 43000 sq m in a warehouse complex PNK North developer is PNK Group
bull Automobile сar manufacturer General Motors leased 40000 sq m in the industrial complex South Gate
It should be noted that a large number of quality warehouse space was leased and purchased in the Q3 2013 by manufacturing companies while logistics companies and distributors on the contrary have bought and rented a smaller amount of warehouse space
It should be also mentioned the increasing sales in Q3 up to 42 comparing to 14 in the previous quarter for the both leased and bought premises
At the regional markets for the last quarter it was rented and purchased more than 85000 sq m Since of the beginning of the year more than 250000 sq m were rented and purchased which is almost 20 higher than last year and 5 higher than the average number for the last 5 years This indicator is largely due to the largest deal in the history of the warehouse property market of St Petersburg on the pre-sale of 43000 sq m by PNK Group to the food supplier Verniy in the warehouse complex PNK KAD
Such large deals allow developer to resume construction in the regions However between Q4 2012 and Q3 2013 it was only 4 deals amounted more than 25000 sq m made Most of the deals in the region are for warehouse space up to 10000 sq m
ТЕНДЕНЦИИ С начала прошлого года на рынок складской недвижимости остается стабильным Ежегодный спрос в Московском регионе составляет около 1 млн кв м в год Средние ставки аренды в классе А составляют $135 за кв м в год без НДС операцион-ных расходов и коммунальных платежей доля вакантных площадей сохраняется на уровне 1 Строительство большин-ства новых складских объектов будет начинаться только после заключения предварительных договоров аренды и продажи
Изменение ситуации в ближайшей перспективе ожидать не стоит В условиях низкого роста экономики страны начинать спекулятивное строительство большой риск повторения ситуации 2008 года поэтому предложение будет подстраивать-ся под спрос
На региональных рынках продолжится тенденция увеличения дефицита готовых к въезду складских площадей Не смотря на высокой спрос на складские объекты в регионах девелоперам не удается сформировать достаточных портфель предваритель-ных договоров аренды для начала строительства Исключение составляет Санкт-Петербург Свердловская область юг России где спрос или условия рынка обеспечили девелоперам формирование такого портфеля Мы прогнозируем что до конца года в регионах будет реализовано более 300 тыс кв м складских площадей
Source Cushman amp Wakefield
STRUCTURE OF DEMAND REGIONS СТРУКТУРА СПРОСА РЕГИОНЫ
TRENDS Since the beginning of the last year the warehouse market has remained stable Annual demand in the Moscow region is about one mn sq m per year average rental rates for Class A is $135 per sq m per year excluding VAT operating expenses and utility costs the vacancy rate remains at 1 Construction of the majority of new storage facilities will start only after the preliminary lease or sale contract signing up
In the nearest future the situation would remain the same It is the huge risk to start the new speculative construction in a low-growth economic situation as it is the threaten to repeat the 2008 year crisis the supply will adapt to the demand
The trend of growing deficit of ready-to-move warehouse spaces continues at the regional markets In spite of the high demand for storage facilities in the regions for developers it is still complicated to form a sufficient portfolio of preliminary agreements for the start of construction Exceptions are St Petersburg Sverdlovsk region and south Russia where the demand or market conditions provided developers with the opportunity to form such a portfolio We predict that by the end of the year in the regions will be sold over 300000 sq m of warehouse space
WampI MARKET IN RUSSIA ETHUcircIacuteIcircEcirc NtildeEcircEumlAgraveAumlNtildeEcircEgraveOtilde IumlIcircIgraveAringUgraveAringIacuteEgraveEacute Acirc ETHIcircNtildeNtildeEgraveEgrave
VACANCY RATE (EOY) Paris (Ile de France) 89 81 99 126 102 84 81 89 804
Budapest 59 172 173 188 195 208 194 217 2283
Warsaw 89 74 112 171 194 173 146 1621 1592
Madrid 55 38 37 55 73 84 93 95 972
TAKE UP 000 SQ MParis (Ile de France) 1 005 700 640 601 814 837 563 208 58
Budapest 152 229 308 280 210 327 355 31 21
Warsaw 260 445 556 216 451 743 483 183 112
Madrid 1 225 918 630 325 390 270 225 60 47
2013
36
MARKETBEAT Q3 2013
RESEARCH DEPARTMENT IcircOgraveAumlAringEuml EgraveNtildeNtildeEumlAringAumlIcircAcircAgraveIacuteEgraveEacute
Further information and copies of this report are available from Ellina Krylova
EllinaKrylovaeurcushwakecom
The information provided in this report is intended for informational purposes only and should not be relied on by any party without further independent verification Classifications of individual buildings are reviewed on a continuing basis and are subject to change The standards used in this process are consistent with those used by Moscow Research Forum and in the United States by the Society of Industrial and Office Realtors (SIOR) and BOMA International Reproduction of this report in whole or part is permitted only with written consent of Cushman amp Wakefield Data from this report may be cited with proper acknowledgment given
copy 2013 Cushman amp Wakefield All rights reserved
MORE INFORMATION AND CONTACTS ARE AVAILABLE ON WWWMARKETBEATRU EgraveIacuteOcircIcircETHIgraveAgraveOumlEgraveszlig IcircAacute IcircOgraveAumlAringEumlAring EgraveNtildeNtildeEumlAringAumlIcircAcircAgraveIacuteEgraveEacute Egrave IumlOacuteAacuteEumlEgraveEcircAgraveOumlEgraveEgrave AumlIcircNtildeOgraveOacuteIumlIacuteUcirc IacuteAgrave WWWMARKETBEATRU
DENIS SOKOLOV PARTNER RESEARCH DIRECTOR DenisSokoloveurcushwakecom
LADA BELAYCHUK ASSOCIATE DIRECTOR DEPUTY RESEARCH DIRECTOR LadaBelaychukeurcushwakecom
MAXIM ILYIN CONSULTANT CAPITAL MARKETS Maximilyineurcushwakecom
ALEXANDER KUNTSEVICH ANALYST WampI PROJECT MANAGEMENT AlexanerKuntsevicheurcushwakecom
TATYANA DIVINA SENIOR ANALYST
TatyanaDivinaeurcushwakecom
wwwcushmanwakefieldcom
Q3 2013 MoscowRUSSIA A Cushman amp Wakefield Research Publication
OFFICE MARKET
IcircAacuteCcedilIcircETH ETHUcircIacuteEcircAgrave В III квартале 2013 г рынок продолжает оставаться активным спрос и предложение сбалансированы ставки аренды стабильны
Тенденция ослабления рынка офисной недвижимости отмечен-ная впервые в предыдущем квартале подкрепляется новыми фактами
Продолжилось снижение общего объема заключаемых сделок аренды и покупки в III квартале общий объем заключенных сделок составил 385 836 кв м что на 20 ниже среднего уровня 2011-2012 гг
Даже небольшой рост объема вывода на рынок новых помеще-ний приводит к увеличению доли свободных помещений За счет одного крупного объекта (Башня Меркурий в Москва-Сити арендуемой площадью 87 547 кв м) объемы ввода в эксплуатацию офисных площадей класса А в III квартале увеличились вдвое относительно средних объемов строительст-ва последних трех лет В результате уровень свободных помещений в классе А в среднем по Москве увеличился на 35 пп а в районе Москва-Сити mdash на 156 пп
Средняя ставка аренды не изменяется в течение последних трех кварталов в то время как инфляции в России за январь-май 2013 превысила уровень 7
ABSORPTION AND NEW CONSTRUCTION CLASSES A AND B (MN SQ M)
OVERVIEW The third quarter of the year saw the office market remain healthy with steady levels of demand Rents held firm There is a tendency of weakening signs in the office market which was noted for the first time in the previous quarter Now it is supported by some new facts
Overall demand level has continued to decrease Q3 take-up is 385836 sq m which is 20 less than the average take-up level for 2011-2012
Even moderate growth of new office space affects the vacancy rate In Q3 the delivery of Mercury Tower in Moscow City submarket (87547 sq m of office rentable area) doubled the quarterly Class A new construction volume (compared to the average number during the last three years) As a result the level of vacant space has increased by 35 percentage points in the Moscow Class A sector Talking about Moscow City submarket the volume of vacant space has increased by 156 points
Rental rates remain unchanged the CPI is above 7 (January-May 2013 data)
Source Cushman amp Wakefield
TOTAL STOCK MOSCOW | ОБЩИЙ ОБЪЕМ ПРЕДЛОЖЕНИЯ В МОСКВЕ 1360 mn sq m
VACANCY RATE | ДОЛЯ СВОБОДНЫХ ПЛОЩАДЕЙ 128
US$ 860 AVERAGE RENTAL RATE CLASS A | СРЕДНЯЯ АРЕНДНАЯ СТАВКА КЛАСС А
Q1-Q3 DEMAND (TAKE-UP) | ОБЪЕМ СДЕЛОК АРЕНДЫ И ПРОДАЖИ В 1-III КВ 2013 1190138 sq m
Q1-Q3 2013 NEW CONSTRUCTION | НОВОЕ СТРОИТЕЛЬСТВО В 1-III КВ 2013 594009 sq m
SUPPLY By the end of Q3 2013 Moscow had 136 mn sq m of quality office space Nine new office buildings were completed with a rentable area of 244587 sq m in Q3 New construction volume remains moderate
Nearly 50 of new office space delivered in 2013 is located in the Moscow suburbs (outside TTR) while the demand is drawn towards the city center So the suburbs are in danger of oversupply during the last four quarters the vacancy rate in suburban submarkets has increased by 58 percentage points from 11 in Q3 2013 to 168 in Q3 2013
In the Central and Prime business areas (with the exception of Moscow City submarket) the vacancy rate is stable while in several central submarkets (such as Tagansky Frunzensky Novoslobodsky) the availability is decreasing
After the recent delivery of Mercury Tower with 87547 sq m of office rentable space Moscow City availability has doubled Hence the Moscow City vacancy rate grew by 156 percentage points up to 327
Altogether there are 154 mn sq m of available office premises in existing buildings and 35 mn sq m is under speculative construction
IumlETHAringAumlEumlIcircAEligAringIacuteEgraveAring По состоянию на конец III квартала 2013 года в Москве насчи-тывалось 136 млн кв м качественных офисов В III квартале было введено в эксплуатацию 9 офисных зданий общей арен-дуемой площадью 244 587 кв м Объемы нового строительства продолжают оставаться умеренными
Около 50 новых офисных площадей вышедших на рынок в 2013 году находятся в удаленных от центра города районах (за пределами ТТК) В то же время спрос продолжает тяготеть к центру города В результате на окраинах города наблюдается тенденция к росту избыточности предложения Так в течение 4-х последних кварталов уровень свободных помещений в рай-онах за пределам ТТК увеличился на 58 пп с 11 (III кв 2012) до 168 (III кв 2013) Внутри ТТК уровень свободных помеще-ний стабилен а в некоторых субрынках (Таганском Фрунзен-ском Новослободском) свободных помещений становится меньше Исключение составляет субрынок Москва-Сити где после ввода в эксплуатацию Башни Меркурий площадью 87 547 кв м объем свободных помещений удвоился что не-медленно привело к росту уровня свободных помещений на 156 пп до уровня 327
Всего в Москве предлагается в аренду или на продажу 154 млн кв м в существующих и 35 млн кв м в строящихся зданиях
Future supply mdash available space in buildings to be delivered in the next 12 month (under construction and under reconstruction) The data is given for the end of the period
Source Cushman amp Wakefield Source Cushman amp Wakefield Moscow Research Forum
DEMAND Overall 12 million sq m of quality office space was leased or bought during Q1-Q3 2013 For the second quarter in a row the total volume of take-up is decreasing In Q3 385836 sq m of quality office space has been transacted which is 20 below the average quarterly level of 2011-2012 Real estate budgets are limited and tenants tend to primarily consider their current location as a viable alternative to a new office
Tenants continue to be interested primarily in existing buildings the proportion of pre-lease agreements in Q1-Q3 was 63 of the total rented space (23 in Q3) In 2013 there is a significant reduction in the proportion of sales deals (from 20 on average in 2011-2012 to around 10 in 2013)
The number of large transactions (over 2000 sq m) continues decreasing The average transaction size has reduced again by 10 compared with the previous quarter and now stands at 528 sq m (taking into account only leasing deals)
NtildeIumlETHIcircNtilde Всего за три квартала 2013 года было арендовано и куплено 12 миллиона кв м качественных офисных помещений Вто-рой квартал подряд наблюдается снижение общего объема сделок В III квартале общий объем сделок составил 385 836 кв м что на 20 ниже среднего уровня 2011-2012 годов Бюджеты на недвижимость и переезды ограничены аренда-торы и арендодатели все чаще находят компромиссы приво-дящие к продлению текущих договоров аренды а не заклю-чению новых сделок в новых зданиях
Арендаторы продолжают интересоваться главным образом введенными в эксплуатацию зданиями ndash в 2013 году (1-III кв) доля договоров предварительной аренды составила менее 63 (в III кв ndash 23) от всех арендованных площадей Доля сделок продажи также продолжает оставаться низкой и со-ставляет не более 10 от всего объема офисных сделок
Продолжает снижаться количество крупных сделок (размером более 2 000 кв м) Средний размер транзакции снизился на 10 относительно предыдущего квартала и в III квартале составил 528 кв м учитывая только сделки аренды
NtildeOgraveAgraveAcircEcircEgrave AgraveETHAringIacuteAumlUcirc В классе А средняя запрашиваемая арендная ставка составляет 860 долларов США В классе Б средняя ставка аренды стабильна на уровне 520 долларов США Ставки аренды для Прайм офисов продолжают находиться на уровне 1 200 долларов США за кв м в год (без НДС и операционных расходов)
Source Cushman amp Wakefield
Source Cushman amp Wakefield
Q3 2013 AVERAGE BASE RENTAL RATES BY BUSINESS AREA СРЕДНИЕ БАЗОВЫЕ СТАВКИ АРЕНДЫ В III КВ 2013 Г ПО БИЗНЕС РАЙОНАМ
AVERAGE RENTAL RATES (US$) СРЕДНИЕ СТАВКИ АРЕНДЫ (ДОЛЛАРЫ США)
Downtown
Central
OTA
Moscow subareas
Moscow is divided into office submarkets areas with similar real estate indicators and dynamics Office submarkets are grouped in office subareas
The Downtown subarea is the territory inside the Garden Ring and the Belorussky business area
The Central subarea is the territory between the Garden ring and TTR (and the more distant SOK and KUT submarkets)
OTA includes the Moscow suburbs
RENTAL RATES In Class A the average asking rental rate is $860 In Class B the average asking rental rate was stable at $520 Rental rates for prime office space is at the level of $1200 per year per sq m (triple net)
IumlETHIcircAtildeIacuteIcircCcedil Несмотря на то что по заявлениям девелоперов более 400 тыс кв м площадей планируется к вводу во IV кв 2013 года мы ожидаем что до конца года будет введено в эксплуатацию дополнительно не более 150ndash200 тыс кв м новых офисов Таким образом в 2013 году сохранится баланс спроса и предло-жения в большинстве офисных субрынков
Высокие объемы строительства на окраинах города и в Москва-Сити не окажут существенного дестабилизирующего влияния на центральные районы До конца 2013 года а также в 2014 году в центральных районах ставки аренды будут стабильны возможен рост в соответствии в уровнем инфляции
LEASE TERMS IN QUALITY BUSINESS CENTERS УСЛОВИЯ АРЕНДЫ КАЧЕСТВЕННЫХ ОФИСНЫХ ПОМЕЩЕНИЙ
RUR USD or Euros (rarely used) per sqmyr For currency exchange landlords use either Central Bank of Russiarsquos official rate or set their own rate or fix the dollar corridor eg 25-40 RUBUSD
Российские рубли доллары США или евро (используется редко) за квм в год Используется обменный курс ЦБ России или используются условные единицы (уе) с фиксированным курсом в коридоре 25-40 рублей за уе
Payments Iumleumlagraveogravearingaeligegrave Quarterly in advance Ежеквартально авансом
Indexation Egraveiacuteaumlaringecircntildeagraveoumlegraveyuml 3-5 or at the level of USA EU CPI 10-15 for RUR agreements Sometimes step-rents are used
3-5 или US CPI 10-15 для рублевых договоров аренды Ингода используется ступенчатая индексация
Other payments Aumlethoacuteatildeegravearing iumleumlagraveogravearingaeligegrave
Operational expences
Операционные расходыThis sort of payments strongly depends on the service list included Average market payments 100-150 USDsqmyr for Class A 80-120 USDsqmyr for Class B
Платежи зависят от состава включенных услуг который может значительно отличаться 100-150 долларов США за квм в год для Класса A 80-120 долларов США за квм в год для Класса Б
VATНДС 18 18Source Cushman amp Wakefield
FORECAST Despite the announcements from developers that they will deliver more than 400000 sq m in Q4 2013 the new construction forecast continues to be rather conservative Just 150000-200000 sq m of new office space might be delivered by the end of this year Consequently in 2013 the supply-demand balance should remain stable
The high volume of office space under construction is the biggest threat at the moment Against the possible local oversupply in Moscow suburbs and Moscow-City submarkets in 2014 central and prime business areas should see a market balance both at the end of 2013 and during the whole 2014 For these areas rental rates are projected to grow in line with inflation
The table contains office buildings announce for delivery in 2013 with rentable area more than 15000 sq m Delivered buildings are included disregarding the size
TOTAL mdash Office rentable area or all office buildings announced for delivery in 2013 (including small buildings with office rentable less than 15000 sq m)
DOWNTOWNBlackampWhite Complex (bld White) ZAM B+ 13000 Q1Rosso Riva ZAM A 11947 Q1Park Tower BEL B+ 11850 Q1Chistoprudnyy bul 8 bld 1 CBD B- 4730 Q1White Gardens BEL A 63900 Q1Wall Street ZAM A 20493 Q2Vishnevy Sad CBD B+ 6736 Q2Domino ZAM A 6216 Q3Lukoil build-to-suit CBD B+ 35000 Q3CENTRALDubininskaya ul 33B SCH B+ 3000 Q1City Point BC CTY B+ 9951 Q1Sinitsa Plaza BAS B+ 13496 Q2Mercury City CTY A 87574 Q3Poluyaroslavskiy Bolshoy per 102 bld BAS B+ 2294 Q3Poklonnaya ul vl 3 KUT A 85572 Q4Park Pobedy KUT B+ 54000 Q4Nizhegorodsky Business Centre phase II BAS B- 37100 Q4Nizhegorodsky Business Centre phase I BAS B- 23000 Q4Arma 19 BAS B+ 19080 Q4Golden Gate BAS B+ 16000 Q4OTANewton Plaza SE B+ 52000 Q1Danilovskaya Manufaktura Sitsevyi Korpu SE B+ 3396 Q1iCube SW B+ 15256 Q1Obrucheva ul 52 bld3 SW B- 23300 Q1Lotte Business Centre SW B+ 38480 Q1Streamline NE B+ 11048 Q1Quadrum SUB B+ 24650 Q2Park Mira NE B+ 7000 Q2Format Complex II SUB B- 9122 Q2Dobrolyubova 6 bld 5 NE B- 4699 Q3Leninsky 119 SW A 15400 Q3Central Street NE B+ 6423 Q3Smart Park SW B+ 10260 Q39 akrov phase II SW B+ 62300 Q3Country Park Phase III SUB A 19120 Q3Riga Land bld 5 (bld A) (phase II) SUB B+ 40000 Q4Solutions BP bld 3 SW B+ 19500 Q4Avrora NE B- 21600 Q4Neo Geo SW B- 70000 Q4Novator office-hotel complex SUB B+ 24000 Q4Mebe One Khimki Plaza SUB A 26000 Q4
TOTAL 217236
TOTAL 421653
TOTAL 551253
Q3 2013 MoscowRUSSIA A Cushman amp Wakefield Research Publication
HOSPITALITY
ADR IN AUGUST 2013 | СРЕДНЯЯ ЦЕНА ЗА НОМЕР В АВГУСТЕ 2013 $152
QUALITY SUPPLY | ТЕКУЩИЙ ОБЪЕМ КАЧЕСТВЕННОГО ПРЕДЛОЖЕНИЯ 14200 rooms
OCCUPANCY | ЗАПОЛНЯЕМОСТЬ 77
RevPAR | СРЕДНИЙ ДОХОД НА НОМЕР $117
IumlETHAringAumlEumlIcircAEligAringIacuteEgraveAring По оценке департамента гостиничного бизнеса и туризма совокупный объем номерного фонда в Москве на конец III квартала 2013 г составил свыше 48 тыс номеров из них доля качественного предложения составила порядка 30 общего предложения или 142 тыс номеров
Новое предложение за III квартале 2013 г в сегменте качествен-ных гостиниц составило 1138 номеров и было сформировано за счет ввода в эксплуатацию 4-х гостиниц разной ценовой категории
В ноябре 2013 г ожидается открытие гостиниц под управлени-ем оператора Accor комплекс из трех отелей расположен по адресу ул Бахрушина вл 11 В состав комплекса войдут 3 гостиницы разной ценовой категории Mercure на 158 номеров (Upscale) Ibis на 190 номеров (Midscale) Adagio на 149 апартаментов (Midscale)
Это увеличит предложение на рынке качественных отелей минимум на 497 номеров Ожидаемое в 2013 г открытие гостиницы Marriott Novy Arbat (234 номера) перенесено на 1 квартал 2014 года
SUPPLY According to the Department of Hospitality and Tourism the cumulative number of rooms in the Moscow hotel market at the end of Q3 2013 is estimated at more than 48000 rooms with the proportion of high-quality supply at about 30 or 14200 rooms
The increase in high-quality segment by the end of Q3 2013 totaled 1138 rooms resulting from the commissioning of 4 hotels in different price categories
In addition Accor will open three new hotels in November Q4 2013 in the hotel complex located at ul Bakhrushina 11 The complex of hotels includes three brands Mercure with 158 rooms (Upscale) Ibis with 190 rooms (Midscale) and Adagio with 149 rooms (Midscale)
We believe that the total supply of international grade rooms will increase by 497 by the end of 2013 It was expected that more rooms would have been available but the opening of the Marriot Noviy Arbat (234 rooms) was postponed till the Q1 2014
QUALITY MOSCOW HOTEL MARKET STRUCTURE Q3 2013 YTD
NtildeOgraveETHOacuteEcircOgraveOacuteETHAgrave EcircAgravetimesAringNtildeOgraveAcircAringIacuteIacuteUcircOtilde AtildeIcircNtildeOgraveEgraveIacuteEgraveOuml IgraveIcircNtildeEcircAcircUcirc III EcircAcirc 2013
Средняя цена за номер (ADR) в августе 2013 г составила $152 что на 5 выше уровня августа 2012 г Положительная динамика обеспечена за счет гостиниц высокой ценовой категории максимальный рост средней цены за номер по отношению к результатам за аналогичный период 2012 г продемонстрировал рынок гостиниц класса Upscale 16 Среднеценовые объекты напротив работали с более демократичными группами спроса на рынке гостиниц класса Midscale было отмечено снижение показателя ADR на 7 по сравнению с августом 2012 г
Символическое падение ставок за номер на уровне 043 и 221 было отмечено также в сегментах Upper Midscale и Luxury соответственно что в целом характерно для августа ndash наиболее laquoтуристскогоraquo месяца в году
В отношении результатов 2013 г (по данным на август) рынок качественных гостиниц показал небольшое снижение показате-ля ADR (-11) по сравнению с прошлым годом что равносиль-но стабилизации в том числе с учетом ослабления рубля
Наиболее агрессивными с точки зрения ценовых ожиданий остаются гостиницы категории Luxury показывающие на фоне общих понижающих корректировок цены небольшой рост с $375 до $376 за номер
Московские гостиницы предлагают широкий разброс цен по сегментам наиболее дорогие ndash гостиницы категории Luxury где ADR в августе 2013 г составил $315 что на 10698 выше среднего показателя по рынку качественных гостиниц
Ценовой разрыв отелей категории Luxuгy со следующим за ним сегментом внушителен средняя цена за номер в гостиницах категории Upper Upscale уже только на 2875 превысила средний показатель по рынку и составила $197 Стоимость номера в гостиницах категории Upscale сравнима со средним по рынку значением и составляет $160
Цены за номер в гостиницах класса Upper Midscale и Midscale ниже среднерыночных на 30 и 48 соответственно и составляют $105 и $79 за номер (данные за август)
AVERAGE DAILY RATE US DOLLAR (ADR) AUGUST 2013 YTD
QUALITY HOTEL MARKET TRADING Average daily rate in August 2013 estimated to $152 which is 5 higher than in August 2012 This positive dynamic was ensured by high-quality hotels the highest ADR growth was recorded in the Upscale segment ndash Up 16 compared to the same period last year Midscale market in this period was oriented to more democratic groups of demand ADR declined by 7 comparing to August 2012
The fall in ADR at the level of 043 and 221 was also recorded in the Upper Midscale and Luxury segments respectively but that is typical for the August ndash the most tourist month of the year
The results of 2013 (August YtD) showed a symbolic decrease in ADR (-11) comparing to 2012 that can be interpreted as a stabili-zation taking into account the weakening of the Ruble
The most aggressive in terms of price expectations remain Luxury market segment showing slight increase from $375 to $376 per room comparison with the general lowering of prices
Moscow hotels offer a wide range of prices by segment the most expensive ndash Luxury with ADR in August about $315 it is 10698 higher than the average for the Moscow quality market
There is an impressive gap between Luxury hotel prices and prices for the Upper Upscale segment Average daily rate for Upper Upscale is about $197 and only 2875 higher than the average for the Moscow quality market
0
50
100
150
200
250
300
350
400
2010 2011 2012 2013
Luxury Upper Upscale
Upscale Upper Midscale
Midscale Moscow average
0
10
20
30
40
50
60
70
80
2010 2011 2012 2013
Luxury Upper UpscaleUpscale Upper MidscaleMidscale Moscow average
25
MARKETBEAT Q3 2013
NtildeIumlETHIcircNtilde
Средняя годовая загрузка качественных гостиниц Москвы в августе 2013 г составила 77 что на 11 выше данного показателя за аналогичный период прошлого года
Максимально высоким спросом в Москве пользуются гостиницы категории Upper Midscale и Midscale загрузка которых в августе фиксировалась на уровне 854 и 826 соответственно
Одной из особенностей рынка гостиниц Москвы в III кв 2013 г стала высокая загруженность качественных и центрально расположенных гостиниц в августе ndash традиционно низком из-за наступления laquoсезона отпусковraquo Нетипично высокая загрузка стала следствием увеличения туристских потоков в том числе за счет проведения Универсиады в Казани добавившей laquoтранзитныхraquo клиентов московским отелям
По итогам 2013 г по состоянию на август рынок качественных гостиниц показывает рост спроса по сравнению с прошлым годом практически по всем сегментам Рост спроса простимули-рован как ростом потока ночующих посетителей в Москву так и стагнацией цен на размещение последнее обстоятельство говорит о продолжающемся периоде неопределенности
OgraveAringIacuteAumlAringIacuteOumlEgraveEgrave
Среднее значение дохода на номер (RevPAR) за август 2013 г выросло на 171 и составило $117 против $100 в 2012 г В то же время по итогам 2013 г по состоянию на август динамика RevPAR по сегментам колебалась от 84 в Midscale до -46 в отелях категории Upper Midscale
Мы полагаем что тенденции к повышению среднерыночной доходности на номер (+12 YtD) за счет гибкой ценовой политики реагирующей на изменения спроса сохранится и в ближайшей перспективе В 2014 г гостиницы вышедшие на рынок в 2013 г окажут более выраженное воздействие на рыночную ситуацию за счет чего показатели RevPAR по сегменту Luxury и особенно Upper Midscale вряд ли существен-но превзойдут текущие показатели и будут колебаться от слабоотрицательных до слабоположительных значений в начале и конце года
DEMAND The average annual occupancy of quality hotels in Moscow in August 2013 was about 77 which is 11 higher than in the same period last year
Maximum high demand in Moscow hotels was in the Upper Midscale and Midscale category with occupancy in August at the level of 854 and 826 respectively
One of the features of the market of Moscow hotels in Q3 2013 was the high occupancy of quality hotels and especially the central located hotels ndash traditionally low in August because of the holiday season Unusually high occupancy was a result of increased tourist flows including through the Universiade in Kazan which added transit clients for Moscow hotels
In general up to August 2013 (YtD) the Moscow quality hotel market shows a growth in demand comparing to 2012 in almost all segments (reduced occupancy in Upper-Midscale segment by 03 pp can be seen as an insignificant adjustment) Demand growth is stimulated by the growing stream of domestic and international visitors staying overnight in Moscow and the stagnation of prices for accommodation the last point indicates the continuing period of uncertainty in the market
TRENDS IN REVENUE Average revenue per available room (RevRAR) in August 2013 increased by 171 to $117 versus $100 in August 2012
At the same time according to the results of August 2013 RevPAR dynamics by segment ranged from 84 in the Midscale segment to -46 in the Upper Midscale hotels We believe that the tendency to stimulate the RevRAR increase which the flexible price sensible of demand change will continue in the near future In 2014 the new hotels will have a more pronounced effect on the general market situation whereby RevPAR (especially for Luxury and Upper Midscale) unlikely to surpass itrsquos current estimations and will vary from slightly negative to low positive values at the beginning and end of the year
За III квартал 2013 года в эксплуатацию было введено более 235 тыс кв м качественных складских площадей
Ставки аренды остаются стабильными и составляют в среднем $135 за кв м в год в классе А без НДС операци-онных расходов и коммунальных платежей
Цена продажи составляет $1 200- $1 300 за кв м в типовых проектах класса А
Доля вакантных площадей в складах класса А за полугодие не изменилась и составляет 1
Объем арендованных и купленных складских площадей в III составил более 350 тыс кв м
Регионы
В большинстве регионов средние ставки аренды в классе А за прошедший квартал не изменились за исключением Новосибирска и Нижнего Новгорода где ставки выросли на 4-6
Объем арендованных и купленных складских площадей в III квартале составил более 85 тыс кв м
SUMMARY Moscow
In Q3 2013 more than 235000 sq m of quality warehouse space were put into operation
Rental rates remain stable at an average of $135 per sq m per year in A Class excluding VAT operating expenses and utility
The price of sale is $1200 - $1300 per sq m in typical projects of class A
The vacancy rate in Class A warehouses for the half of the year remains unchanged at 1
The volume of leased and purchased warehouse space in Q3 amounted to 350000 sq m
Regions
The average rental rates in Class A have not changed for the quarter in most regions except Novosibirsk and Nizhny Novgorod where rates have increased by 4-6
The volume of leased and purchased warehouse space in Q3 amounted to 85000 sq m
$132
$130
$140
$105
$110
$135
$135
$135
$80
$90
$100
$110
$120
$130
$140
$150
2006 2007 2008 2009 2010 2011 2012 2013F
KEY EXPECTATIONS
STABILITY
0
200
400
600
800
1000
1200
1400
1600
1800
2007 2008 2009 2010 2011 2012 2013F 2014F
27
MARKETBEAT Q3 2013
Source Cushman amp Wakefield
Source Cushman amp Wakefield
Source Cushman amp Wakefield
Source Cushman amp Wakefield
ОСНОВНЫЕ ТЕНДЕНЦИИ Объем нового строительства за 1-III кв 2013 года в Московском регионе составил 550 тыс кв м что соответствует аналогично-му показателю прошлого года Объем арендованных и куплен-ных площадей по итогам прошедших трех кварталов составил белее 830 тыс кв м что приблизительно соответствует показа-телю прошлого года
В регионах объем нового строительства в регионах за первые три квартала составил 239 тыс кв м что на треть меньше про-шлогоднего Арендовано куплено 250 тыс кв м что больше прошлогоднего показателя на 20
ПРЕДЛОЖЕНИЕ В Московском регионе в III квартале 2013 года предложение увеличилось на 235 тыс кв м
В минувшем квартале были построены
Логопарк Север (110 тыс кв м) девелопер Каравелла
Два новых корпуса в логистическом парке Климовск (48 тыс кв м) девелопер Raven Russia
Объем нового строительства соответствует показателям преды-дущего года но темпы строительства ниже заявленных девело-перами Основная проблема mdash задержки в строительстве Боль-ше всего это касается новых девелоперов длительное время работающие на рынке компании укладываются в заявленные сроки Поэтому до конца года будет построено до 1 млн кв м складских площадей
На рынке Москвы сохраняется дефицит готовых к въезду склад-ских площадей Все проекты сдаются или продаются на этапе строительства
Чистые средние ставки аренды в течении прошедшего квартала не изменились и составляют $135 за кв м при этом разброс ставок остается высоким
В 2014 году девелоперы обещают построить около 15 млн кв м складских площадей однако по нашем оценкам из-за задер-жек при строительстве построено будет на 30 меньше
KEY TRENDS The volume of new construction for Q1-Q3 2013 in the Moscow region amounted to 550000 sq m which corresponds to the same period of last year The volume of leased and purchased land based on the results of Q1-Q3 was more than 830000 sq m which approximately relative to the previous year figure
The volume of new construction in the regions for the first three quarters amounted to 239000 sq m which is a three times less than last year indicator 250000 sq m were leased and sold which is 20 more than last year figure
SUPPLY In Q3 2013 supply in Moscow region increased by 235000 sq m
In the last quarter were put into operation
bull Logistics Park North (110000 sq m) developer is Caravella
bull Two new phases in the logistics park Klimovsk (48000 sq m) developer is Raven Russia
The volume of new construction complies with the previous year but below the pace of construction announced by developers The main problem is the delays in construction mostly it concerns new developers Experienced companies meet the announced deadlines Therefore there will be built up to one million sq m of warehouse space until the end of the year
In Moscow there is a lack of ready-to-move storage space All projects are sold or bought during the construction process
Net average rental rates have not changed during the last quarter and amounted to $135 per sq m while the spread rate remains relatively high
In 2014 developers expect to build nearly 15 mn sq m of warehouse space however according to our estimations the volume of construction will be 30 less due to the development process delays
DISTRIBUTION OF QUALITY DEVELOPMENTS IN THE PIPELINE FOR 2013-2014 (lsquo000 SQ M) РАСПРЕДЕЛЕНИЕ ПЛАНИРУЕМЫХ К ВВОДУ В 2013-2014 ГГ СКЛАДСКИХ ПЛОЩАДЕЙ В МОСКОВСКОЙ ОБЛАСТИ ТЫС КВ М
DISTRIBUTION OF WampI SPACE IN THE MOSCOW REGION (lsquo000 SQ M) РАСПРЕДЕЛЕНИЕ СКЛАДСКИХ ПЛОЩАДЕЙ В МОСКОВСКОЙ ОБЛАСТИ ТЫС КВ М
В регионах в минувшем квартале было построено только 43 тыс кв м качественных складских площадей против 117 тыс в прошлом Все новые объекты построены рядом с Санкт-Петербургом
Всего в 2014 году в регионах будет построено боле 290 тыс кв м против 410 тыс кв м в прошлом В большинстве регионов дефицита складских площадей не наблюдается Исключение составляет Санкт-Петербург Екатеринбург и Ростов-на-Дону
Чистые ставки аренды в регионах в III квартале 2013 года не изменились за исключением Новосибирска и Нижнего Новгорода где они немного выросли до $120 и $123 за кв м соответственно
Source Cushman amp Wakefield
TAKE UP lsquo000 SQ M ОБЪЕМ АРЕНДОВАННЫХ И КУПЛЕННЫХ ПЛОЩАДЕЙ ТЫС КВ М
Source Cushman amp Wakefield
During the past quarter only 43000 sq m of quality warehouse space was built In the regions as against last year fiqure (117000 sq m) All new premises were built near St Petersburg
Comparing to last year figure (410000 sq m) more than 290000 sq m is going to be built in the regions in 2014 In most regions there is no lack of warehouse spaces observed The exceptions are St Petersburg Yekaterinburg and Rostov-on-Don
Net rental rates have not changed in the regions in Q3 except Novosibirsk and Nizhny Novgorod where they rose slightly to $120 and $123 per sq m respectively
2013 PIPELINE ОБЪЕКТЫ ЗАЯВЛЕННЫЕ К СТРОИТЕЛЬСТВУ В 2013 Г
PROJECT DEVELOPER GRADE DIRECTION HIGHWAYDISTANCE FROM
MKAD KMTOTAL AREA
000 SQ MEXPECTED
DELIVERY
Infrastroy Bykovo Infrastroy А E Egorevskoe 17 6155 Q1
Infrastroy Bykovo Infrastroy А E Egorevskoe 17 6193 Q4
Klimovsk LP Raven Russia A S Simferopolskoye 23 4772 Q3
Logopark Sever Karavella A N Rogachevskoye 30 11023 Q3
PNK Chekhov II PNK group A S Simferopolskoye 50 10424 Q2
PNK Chekhov II PNK group A S Simferopolskoye 50 5531 Q4
PNK Vnukovo PNK group A SW Kievskoe 19 10568 Q1
South Gate IP Radius group A S Kashirskoye 30 2070 Q2
South Gate IP Radius group A S Kashirskoye 30 3000 Q4
СПРОС В Московском регионе за I-III кварталах 2013 г было арендовано и куплено более 850 тыс кв м качественных складских площадей из них 235 тыс в III квартале что соответствует прошлогодним показателям
Наиболее крупные сделки в минувшем квартале
Автомобильный концерн Volkswagen купил 50 тыс кв м в складском комплексе PNK Чехов 2 девелопер PNK Group
Компания Верный купила 43 тыс кв м в складском комплексе PNK Север девелопер PNK Group
Автомобильный концерн General Motors арендовала 40 тыс кв м в индустриальном комплексе Южные врата
Следует отметить что большое количество качественных складских площадей было арендовано и куплено в III квартале 2013 г производственными компаниями при этом логистиче-ские компании и дистрибьюторы наоборот купили и арендова-ли меньшее количество площадей
Так же следует отметить увеличение доли продаж в III квартале до 42 против 14 во II квартале в структуре поглощения
На региональных рынках за минувший квартал было арендовано и куплено более 85 тыс кв м всего с начала года более 250 тыс кв м что почти на 20 выше аналогичного показателя прошлого года и на 5 среднего значения за последние 5 лет Этот показатель во многом обусловлен самой крупной сделкой за всю историю рынка складской недвижимости Санкт-Петербурга по предварительной продаже 43 тыс кв м компанией PNK Group продуктовой сети laquoВерныйraquo в складском комплексе PNK КАД
Сделки на такие большие площади позволяют девелоперу возобновить строительство в регионах но за период с IV кв 2012 по III квартале 2013 г Было заключено только 4 сделки более 25 тыс кв м Большинство сделок в регионах заключает-ся на складские площади до 10 тыс кв м
STRUCTURE OF DEMAND MOSCOW СТРУКТУРА СПРОСА МОСКВА
DEMAND In the Moscow region in Q1-Q3 2013 more than 850000 sq m were rented and purchased talking about quality warehouse space The Q3 indicator is 235000 sq m which is the same to the last years performance
The largest deals in the last quarter
bull Car manufacturer group Volkswagen bought 50000 sq m in a warehouse complex PNK Chekhov 2 developer is PNK Group
bull The Verniy company bought 43000 sq m in a warehouse complex PNK North developer is PNK Group
bull Automobile сar manufacturer General Motors leased 40000 sq m in the industrial complex South Gate
It should be noted that a large number of quality warehouse space was leased and purchased in the Q3 2013 by manufacturing companies while logistics companies and distributors on the contrary have bought and rented a smaller amount of warehouse space
It should be also mentioned the increasing sales in Q3 up to 42 comparing to 14 in the previous quarter for the both leased and bought premises
At the regional markets for the last quarter it was rented and purchased more than 85000 sq m Since of the beginning of the year more than 250000 sq m were rented and purchased which is almost 20 higher than last year and 5 higher than the average number for the last 5 years This indicator is largely due to the largest deal in the history of the warehouse property market of St Petersburg on the pre-sale of 43000 sq m by PNK Group to the food supplier Verniy in the warehouse complex PNK KAD
Such large deals allow developer to resume construction in the regions However between Q4 2012 and Q3 2013 it was only 4 deals amounted more than 25000 sq m made Most of the deals in the region are for warehouse space up to 10000 sq m
ТЕНДЕНЦИИ С начала прошлого года на рынок складской недвижимости остается стабильным Ежегодный спрос в Московском регионе составляет около 1 млн кв м в год Средние ставки аренды в классе А составляют $135 за кв м в год без НДС операцион-ных расходов и коммунальных платежей доля вакантных площадей сохраняется на уровне 1 Строительство большин-ства новых складских объектов будет начинаться только после заключения предварительных договоров аренды и продажи
Изменение ситуации в ближайшей перспективе ожидать не стоит В условиях низкого роста экономики страны начинать спекулятивное строительство большой риск повторения ситуации 2008 года поэтому предложение будет подстраивать-ся под спрос
На региональных рынках продолжится тенденция увеличения дефицита готовых к въезду складских площадей Не смотря на высокой спрос на складские объекты в регионах девелоперам не удается сформировать достаточных портфель предваритель-ных договоров аренды для начала строительства Исключение составляет Санкт-Петербург Свердловская область юг России где спрос или условия рынка обеспечили девелоперам формирование такого портфеля Мы прогнозируем что до конца года в регионах будет реализовано более 300 тыс кв м складских площадей
Source Cushman amp Wakefield
STRUCTURE OF DEMAND REGIONS СТРУКТУРА СПРОСА РЕГИОНЫ
TRENDS Since the beginning of the last year the warehouse market has remained stable Annual demand in the Moscow region is about one mn sq m per year average rental rates for Class A is $135 per sq m per year excluding VAT operating expenses and utility costs the vacancy rate remains at 1 Construction of the majority of new storage facilities will start only after the preliminary lease or sale contract signing up
In the nearest future the situation would remain the same It is the huge risk to start the new speculative construction in a low-growth economic situation as it is the threaten to repeat the 2008 year crisis the supply will adapt to the demand
The trend of growing deficit of ready-to-move warehouse spaces continues at the regional markets In spite of the high demand for storage facilities in the regions for developers it is still complicated to form a sufficient portfolio of preliminary agreements for the start of construction Exceptions are St Petersburg Sverdlovsk region and south Russia where the demand or market conditions provided developers with the opportunity to form such a portfolio We predict that by the end of the year in the regions will be sold over 300000 sq m of warehouse space
WampI MARKET IN RUSSIA ETHUcircIacuteIcircEcirc NtildeEcircEumlAgraveAumlNtildeEcircEgraveOtilde IumlIcircIgraveAringUgraveAringIacuteEgraveEacute Acirc ETHIcircNtildeNtildeEgraveEgrave
VACANCY RATE (EOY) Paris (Ile de France) 89 81 99 126 102 84 81 89 804
Budapest 59 172 173 188 195 208 194 217 2283
Warsaw 89 74 112 171 194 173 146 1621 1592
Madrid 55 38 37 55 73 84 93 95 972
TAKE UP 000 SQ MParis (Ile de France) 1 005 700 640 601 814 837 563 208 58
Budapest 152 229 308 280 210 327 355 31 21
Warsaw 260 445 556 216 451 743 483 183 112
Madrid 1 225 918 630 325 390 270 225 60 47
2013
36
MARKETBEAT Q3 2013
RESEARCH DEPARTMENT IcircOgraveAumlAringEuml EgraveNtildeNtildeEumlAringAumlIcircAcircAgraveIacuteEgraveEacute
Further information and copies of this report are available from Ellina Krylova
EllinaKrylovaeurcushwakecom
The information provided in this report is intended for informational purposes only and should not be relied on by any party without further independent verification Classifications of individual buildings are reviewed on a continuing basis and are subject to change The standards used in this process are consistent with those used by Moscow Research Forum and in the United States by the Society of Industrial and Office Realtors (SIOR) and BOMA International Reproduction of this report in whole or part is permitted only with written consent of Cushman amp Wakefield Data from this report may be cited with proper acknowledgment given
copy 2013 Cushman amp Wakefield All rights reserved
MORE INFORMATION AND CONTACTS ARE AVAILABLE ON WWWMARKETBEATRU EgraveIacuteOcircIcircETHIgraveAgraveOumlEgraveszlig IcircAacute IcircOgraveAumlAringEumlAring EgraveNtildeNtildeEumlAringAumlIcircAcircAgraveIacuteEgraveEacute Egrave IumlOacuteAacuteEumlEgraveEcircAgraveOumlEgraveEgrave AumlIcircNtildeOgraveOacuteIumlIacuteUcirc IacuteAgrave WWWMARKETBEATRU
DENIS SOKOLOV PARTNER RESEARCH DIRECTOR DenisSokoloveurcushwakecom
LADA BELAYCHUK ASSOCIATE DIRECTOR DEPUTY RESEARCH DIRECTOR LadaBelaychukeurcushwakecom
MAXIM ILYIN CONSULTANT CAPITAL MARKETS Maximilyineurcushwakecom
ALEXANDER KUNTSEVICH ANALYST WampI PROJECT MANAGEMENT AlexanerKuntsevicheurcushwakecom
TATYANA DIVINA SENIOR ANALYST
TatyanaDivinaeurcushwakecom
wwwcushmanwakefieldcom
22
MARKETBEAT Q3 2013
Source Cushman amp Wakefield Moscow Research Forum
The table contains office buildings announce for delivery in 2013 with rentable area more than 15000 sq m Delivered buildings are included disregarding the size
TOTAL mdash Office rentable area or all office buildings announced for delivery in 2013 (including small buildings with office rentable less than 15000 sq m)
DOWNTOWNBlackampWhite Complex (bld White) ZAM B+ 13000 Q1Rosso Riva ZAM A 11947 Q1Park Tower BEL B+ 11850 Q1Chistoprudnyy bul 8 bld 1 CBD B- 4730 Q1White Gardens BEL A 63900 Q1Wall Street ZAM A 20493 Q2Vishnevy Sad CBD B+ 6736 Q2Domino ZAM A 6216 Q3Lukoil build-to-suit CBD B+ 35000 Q3CENTRALDubininskaya ul 33B SCH B+ 3000 Q1City Point BC CTY B+ 9951 Q1Sinitsa Plaza BAS B+ 13496 Q2Mercury City CTY A 87574 Q3Poluyaroslavskiy Bolshoy per 102 bld BAS B+ 2294 Q3Poklonnaya ul vl 3 KUT A 85572 Q4Park Pobedy KUT B+ 54000 Q4Nizhegorodsky Business Centre phase II BAS B- 37100 Q4Nizhegorodsky Business Centre phase I BAS B- 23000 Q4Arma 19 BAS B+ 19080 Q4Golden Gate BAS B+ 16000 Q4OTANewton Plaza SE B+ 52000 Q1Danilovskaya Manufaktura Sitsevyi Korpu SE B+ 3396 Q1iCube SW B+ 15256 Q1Obrucheva ul 52 bld3 SW B- 23300 Q1Lotte Business Centre SW B+ 38480 Q1Streamline NE B+ 11048 Q1Quadrum SUB B+ 24650 Q2Park Mira NE B+ 7000 Q2Format Complex II SUB B- 9122 Q2Dobrolyubova 6 bld 5 NE B- 4699 Q3Leninsky 119 SW A 15400 Q3Central Street NE B+ 6423 Q3Smart Park SW B+ 10260 Q39 akrov phase II SW B+ 62300 Q3Country Park Phase III SUB A 19120 Q3Riga Land bld 5 (bld A) (phase II) SUB B+ 40000 Q4Solutions BP bld 3 SW B+ 19500 Q4Avrora NE B- 21600 Q4Neo Geo SW B- 70000 Q4Novator office-hotel complex SUB B+ 24000 Q4Mebe One Khimki Plaza SUB A 26000 Q4
TOTAL 217236
TOTAL 421653
TOTAL 551253
Q3 2013 MoscowRUSSIA A Cushman amp Wakefield Research Publication
HOSPITALITY
ADR IN AUGUST 2013 | СРЕДНЯЯ ЦЕНА ЗА НОМЕР В АВГУСТЕ 2013 $152
QUALITY SUPPLY | ТЕКУЩИЙ ОБЪЕМ КАЧЕСТВЕННОГО ПРЕДЛОЖЕНИЯ 14200 rooms
OCCUPANCY | ЗАПОЛНЯЕМОСТЬ 77
RevPAR | СРЕДНИЙ ДОХОД НА НОМЕР $117
IumlETHAringAumlEumlIcircAEligAringIacuteEgraveAring По оценке департамента гостиничного бизнеса и туризма совокупный объем номерного фонда в Москве на конец III квартала 2013 г составил свыше 48 тыс номеров из них доля качественного предложения составила порядка 30 общего предложения или 142 тыс номеров
Новое предложение за III квартале 2013 г в сегменте качествен-ных гостиниц составило 1138 номеров и было сформировано за счет ввода в эксплуатацию 4-х гостиниц разной ценовой категории
В ноябре 2013 г ожидается открытие гостиниц под управлени-ем оператора Accor комплекс из трех отелей расположен по адресу ул Бахрушина вл 11 В состав комплекса войдут 3 гостиницы разной ценовой категории Mercure на 158 номеров (Upscale) Ibis на 190 номеров (Midscale) Adagio на 149 апартаментов (Midscale)
Это увеличит предложение на рынке качественных отелей минимум на 497 номеров Ожидаемое в 2013 г открытие гостиницы Marriott Novy Arbat (234 номера) перенесено на 1 квартал 2014 года
SUPPLY According to the Department of Hospitality and Tourism the cumulative number of rooms in the Moscow hotel market at the end of Q3 2013 is estimated at more than 48000 rooms with the proportion of high-quality supply at about 30 or 14200 rooms
The increase in high-quality segment by the end of Q3 2013 totaled 1138 rooms resulting from the commissioning of 4 hotels in different price categories
In addition Accor will open three new hotels in November Q4 2013 in the hotel complex located at ul Bakhrushina 11 The complex of hotels includes three brands Mercure with 158 rooms (Upscale) Ibis with 190 rooms (Midscale) and Adagio with 149 rooms (Midscale)
We believe that the total supply of international grade rooms will increase by 497 by the end of 2013 It was expected that more rooms would have been available but the opening of the Marriot Noviy Arbat (234 rooms) was postponed till the Q1 2014
QUALITY MOSCOW HOTEL MARKET STRUCTURE Q3 2013 YTD
NtildeOgraveETHOacuteEcircOgraveOacuteETHAgrave EcircAgravetimesAringNtildeOgraveAcircAringIacuteIacuteUcircOtilde AtildeIcircNtildeOgraveEgraveIacuteEgraveOuml IgraveIcircNtildeEcircAcircUcirc III EcircAcirc 2013
Средняя цена за номер (ADR) в августе 2013 г составила $152 что на 5 выше уровня августа 2012 г Положительная динамика обеспечена за счет гостиниц высокой ценовой категории максимальный рост средней цены за номер по отношению к результатам за аналогичный период 2012 г продемонстрировал рынок гостиниц класса Upscale 16 Среднеценовые объекты напротив работали с более демократичными группами спроса на рынке гостиниц класса Midscale было отмечено снижение показателя ADR на 7 по сравнению с августом 2012 г
Символическое падение ставок за номер на уровне 043 и 221 было отмечено также в сегментах Upper Midscale и Luxury соответственно что в целом характерно для августа ndash наиболее laquoтуристскогоraquo месяца в году
В отношении результатов 2013 г (по данным на август) рынок качественных гостиниц показал небольшое снижение показате-ля ADR (-11) по сравнению с прошлым годом что равносиль-но стабилизации в том числе с учетом ослабления рубля
Наиболее агрессивными с точки зрения ценовых ожиданий остаются гостиницы категории Luxury показывающие на фоне общих понижающих корректировок цены небольшой рост с $375 до $376 за номер
Московские гостиницы предлагают широкий разброс цен по сегментам наиболее дорогие ndash гостиницы категории Luxury где ADR в августе 2013 г составил $315 что на 10698 выше среднего показателя по рынку качественных гостиниц
Ценовой разрыв отелей категории Luxuгy со следующим за ним сегментом внушителен средняя цена за номер в гостиницах категории Upper Upscale уже только на 2875 превысила средний показатель по рынку и составила $197 Стоимость номера в гостиницах категории Upscale сравнима со средним по рынку значением и составляет $160
Цены за номер в гостиницах класса Upper Midscale и Midscale ниже среднерыночных на 30 и 48 соответственно и составляют $105 и $79 за номер (данные за август)
AVERAGE DAILY RATE US DOLLAR (ADR) AUGUST 2013 YTD
QUALITY HOTEL MARKET TRADING Average daily rate in August 2013 estimated to $152 which is 5 higher than in August 2012 This positive dynamic was ensured by high-quality hotels the highest ADR growth was recorded in the Upscale segment ndash Up 16 compared to the same period last year Midscale market in this period was oriented to more democratic groups of demand ADR declined by 7 comparing to August 2012
The fall in ADR at the level of 043 and 221 was also recorded in the Upper Midscale and Luxury segments respectively but that is typical for the August ndash the most tourist month of the year
The results of 2013 (August YtD) showed a symbolic decrease in ADR (-11) comparing to 2012 that can be interpreted as a stabili-zation taking into account the weakening of the Ruble
The most aggressive in terms of price expectations remain Luxury market segment showing slight increase from $375 to $376 per room comparison with the general lowering of prices
Moscow hotels offer a wide range of prices by segment the most expensive ndash Luxury with ADR in August about $315 it is 10698 higher than the average for the Moscow quality market
There is an impressive gap between Luxury hotel prices and prices for the Upper Upscale segment Average daily rate for Upper Upscale is about $197 and only 2875 higher than the average for the Moscow quality market
0
50
100
150
200
250
300
350
400
2010 2011 2012 2013
Luxury Upper Upscale
Upscale Upper Midscale
Midscale Moscow average
0
10
20
30
40
50
60
70
80
2010 2011 2012 2013
Luxury Upper UpscaleUpscale Upper MidscaleMidscale Moscow average
25
MARKETBEAT Q3 2013
NtildeIumlETHIcircNtilde
Средняя годовая загрузка качественных гостиниц Москвы в августе 2013 г составила 77 что на 11 выше данного показателя за аналогичный период прошлого года
Максимально высоким спросом в Москве пользуются гостиницы категории Upper Midscale и Midscale загрузка которых в августе фиксировалась на уровне 854 и 826 соответственно
Одной из особенностей рынка гостиниц Москвы в III кв 2013 г стала высокая загруженность качественных и центрально расположенных гостиниц в августе ndash традиционно низком из-за наступления laquoсезона отпусковraquo Нетипично высокая загрузка стала следствием увеличения туристских потоков в том числе за счет проведения Универсиады в Казани добавившей laquoтранзитныхraquo клиентов московским отелям
По итогам 2013 г по состоянию на август рынок качественных гостиниц показывает рост спроса по сравнению с прошлым годом практически по всем сегментам Рост спроса простимули-рован как ростом потока ночующих посетителей в Москву так и стагнацией цен на размещение последнее обстоятельство говорит о продолжающемся периоде неопределенности
OgraveAringIacuteAumlAringIacuteOumlEgraveEgrave
Среднее значение дохода на номер (RevPAR) за август 2013 г выросло на 171 и составило $117 против $100 в 2012 г В то же время по итогам 2013 г по состоянию на август динамика RevPAR по сегментам колебалась от 84 в Midscale до -46 в отелях категории Upper Midscale
Мы полагаем что тенденции к повышению среднерыночной доходности на номер (+12 YtD) за счет гибкой ценовой политики реагирующей на изменения спроса сохранится и в ближайшей перспективе В 2014 г гостиницы вышедшие на рынок в 2013 г окажут более выраженное воздействие на рыночную ситуацию за счет чего показатели RevPAR по сегменту Luxury и особенно Upper Midscale вряд ли существен-но превзойдут текущие показатели и будут колебаться от слабоотрицательных до слабоположительных значений в начале и конце года
DEMAND The average annual occupancy of quality hotels in Moscow in August 2013 was about 77 which is 11 higher than in the same period last year
Maximum high demand in Moscow hotels was in the Upper Midscale and Midscale category with occupancy in August at the level of 854 and 826 respectively
One of the features of the market of Moscow hotels in Q3 2013 was the high occupancy of quality hotels and especially the central located hotels ndash traditionally low in August because of the holiday season Unusually high occupancy was a result of increased tourist flows including through the Universiade in Kazan which added transit clients for Moscow hotels
In general up to August 2013 (YtD) the Moscow quality hotel market shows a growth in demand comparing to 2012 in almost all segments (reduced occupancy in Upper-Midscale segment by 03 pp can be seen as an insignificant adjustment) Demand growth is stimulated by the growing stream of domestic and international visitors staying overnight in Moscow and the stagnation of prices for accommodation the last point indicates the continuing period of uncertainty in the market
TRENDS IN REVENUE Average revenue per available room (RevRAR) in August 2013 increased by 171 to $117 versus $100 in August 2012
At the same time according to the results of August 2013 RevPAR dynamics by segment ranged from 84 in the Midscale segment to -46 in the Upper Midscale hotels We believe that the tendency to stimulate the RevRAR increase which the flexible price sensible of demand change will continue in the near future In 2014 the new hotels will have a more pronounced effect on the general market situation whereby RevPAR (especially for Luxury and Upper Midscale) unlikely to surpass itrsquos current estimations and will vary from slightly negative to low positive values at the beginning and end of the year
За III квартал 2013 года в эксплуатацию было введено более 235 тыс кв м качественных складских площадей
Ставки аренды остаются стабильными и составляют в среднем $135 за кв м в год в классе А без НДС операци-онных расходов и коммунальных платежей
Цена продажи составляет $1 200- $1 300 за кв м в типовых проектах класса А
Доля вакантных площадей в складах класса А за полугодие не изменилась и составляет 1
Объем арендованных и купленных складских площадей в III составил более 350 тыс кв м
Регионы
В большинстве регионов средние ставки аренды в классе А за прошедший квартал не изменились за исключением Новосибирска и Нижнего Новгорода где ставки выросли на 4-6
Объем арендованных и купленных складских площадей в III квартале составил более 85 тыс кв м
SUMMARY Moscow
In Q3 2013 more than 235000 sq m of quality warehouse space were put into operation
Rental rates remain stable at an average of $135 per sq m per year in A Class excluding VAT operating expenses and utility
The price of sale is $1200 - $1300 per sq m in typical projects of class A
The vacancy rate in Class A warehouses for the half of the year remains unchanged at 1
The volume of leased and purchased warehouse space in Q3 amounted to 350000 sq m
Regions
The average rental rates in Class A have not changed for the quarter in most regions except Novosibirsk and Nizhny Novgorod where rates have increased by 4-6
The volume of leased and purchased warehouse space in Q3 amounted to 85000 sq m
$132
$130
$140
$105
$110
$135
$135
$135
$80
$90
$100
$110
$120
$130
$140
$150
2006 2007 2008 2009 2010 2011 2012 2013F
KEY EXPECTATIONS
STABILITY
0
200
400
600
800
1000
1200
1400
1600
1800
2007 2008 2009 2010 2011 2012 2013F 2014F
27
MARKETBEAT Q3 2013
Source Cushman amp Wakefield
Source Cushman amp Wakefield
Source Cushman amp Wakefield
Source Cushman amp Wakefield
ОСНОВНЫЕ ТЕНДЕНЦИИ Объем нового строительства за 1-III кв 2013 года в Московском регионе составил 550 тыс кв м что соответствует аналогично-му показателю прошлого года Объем арендованных и куплен-ных площадей по итогам прошедших трех кварталов составил белее 830 тыс кв м что приблизительно соответствует показа-телю прошлого года
В регионах объем нового строительства в регионах за первые три квартала составил 239 тыс кв м что на треть меньше про-шлогоднего Арендовано куплено 250 тыс кв м что больше прошлогоднего показателя на 20
ПРЕДЛОЖЕНИЕ В Московском регионе в III квартале 2013 года предложение увеличилось на 235 тыс кв м
В минувшем квартале были построены
Логопарк Север (110 тыс кв м) девелопер Каравелла
Два новых корпуса в логистическом парке Климовск (48 тыс кв м) девелопер Raven Russia
Объем нового строительства соответствует показателям преды-дущего года но темпы строительства ниже заявленных девело-перами Основная проблема mdash задержки в строительстве Боль-ше всего это касается новых девелоперов длительное время работающие на рынке компании укладываются в заявленные сроки Поэтому до конца года будет построено до 1 млн кв м складских площадей
На рынке Москвы сохраняется дефицит готовых к въезду склад-ских площадей Все проекты сдаются или продаются на этапе строительства
Чистые средние ставки аренды в течении прошедшего квартала не изменились и составляют $135 за кв м при этом разброс ставок остается высоким
В 2014 году девелоперы обещают построить около 15 млн кв м складских площадей однако по нашем оценкам из-за задер-жек при строительстве построено будет на 30 меньше
KEY TRENDS The volume of new construction for Q1-Q3 2013 in the Moscow region amounted to 550000 sq m which corresponds to the same period of last year The volume of leased and purchased land based on the results of Q1-Q3 was more than 830000 sq m which approximately relative to the previous year figure
The volume of new construction in the regions for the first three quarters amounted to 239000 sq m which is a three times less than last year indicator 250000 sq m were leased and sold which is 20 more than last year figure
SUPPLY In Q3 2013 supply in Moscow region increased by 235000 sq m
In the last quarter were put into operation
bull Logistics Park North (110000 sq m) developer is Caravella
bull Two new phases in the logistics park Klimovsk (48000 sq m) developer is Raven Russia
The volume of new construction complies with the previous year but below the pace of construction announced by developers The main problem is the delays in construction mostly it concerns new developers Experienced companies meet the announced deadlines Therefore there will be built up to one million sq m of warehouse space until the end of the year
In Moscow there is a lack of ready-to-move storage space All projects are sold or bought during the construction process
Net average rental rates have not changed during the last quarter and amounted to $135 per sq m while the spread rate remains relatively high
In 2014 developers expect to build nearly 15 mn sq m of warehouse space however according to our estimations the volume of construction will be 30 less due to the development process delays
DISTRIBUTION OF QUALITY DEVELOPMENTS IN THE PIPELINE FOR 2013-2014 (lsquo000 SQ M) РАСПРЕДЕЛЕНИЕ ПЛАНИРУЕМЫХ К ВВОДУ В 2013-2014 ГГ СКЛАДСКИХ ПЛОЩАДЕЙ В МОСКОВСКОЙ ОБЛАСТИ ТЫС КВ М
DISTRIBUTION OF WampI SPACE IN THE MOSCOW REGION (lsquo000 SQ M) РАСПРЕДЕЛЕНИЕ СКЛАДСКИХ ПЛОЩАДЕЙ В МОСКОВСКОЙ ОБЛАСТИ ТЫС КВ М
В регионах в минувшем квартале было построено только 43 тыс кв м качественных складских площадей против 117 тыс в прошлом Все новые объекты построены рядом с Санкт-Петербургом
Всего в 2014 году в регионах будет построено боле 290 тыс кв м против 410 тыс кв м в прошлом В большинстве регионов дефицита складских площадей не наблюдается Исключение составляет Санкт-Петербург Екатеринбург и Ростов-на-Дону
Чистые ставки аренды в регионах в III квартале 2013 года не изменились за исключением Новосибирска и Нижнего Новгорода где они немного выросли до $120 и $123 за кв м соответственно
Source Cushman amp Wakefield
TAKE UP lsquo000 SQ M ОБЪЕМ АРЕНДОВАННЫХ И КУПЛЕННЫХ ПЛОЩАДЕЙ ТЫС КВ М
Source Cushman amp Wakefield
During the past quarter only 43000 sq m of quality warehouse space was built In the regions as against last year fiqure (117000 sq m) All new premises were built near St Petersburg
Comparing to last year figure (410000 sq m) more than 290000 sq m is going to be built in the regions in 2014 In most regions there is no lack of warehouse spaces observed The exceptions are St Petersburg Yekaterinburg and Rostov-on-Don
Net rental rates have not changed in the regions in Q3 except Novosibirsk and Nizhny Novgorod where they rose slightly to $120 and $123 per sq m respectively
2013 PIPELINE ОБЪЕКТЫ ЗАЯВЛЕННЫЕ К СТРОИТЕЛЬСТВУ В 2013 Г
PROJECT DEVELOPER GRADE DIRECTION HIGHWAYDISTANCE FROM
MKAD KMTOTAL AREA
000 SQ MEXPECTED
DELIVERY
Infrastroy Bykovo Infrastroy А E Egorevskoe 17 6155 Q1
Infrastroy Bykovo Infrastroy А E Egorevskoe 17 6193 Q4
Klimovsk LP Raven Russia A S Simferopolskoye 23 4772 Q3
Logopark Sever Karavella A N Rogachevskoye 30 11023 Q3
PNK Chekhov II PNK group A S Simferopolskoye 50 10424 Q2
PNK Chekhov II PNK group A S Simferopolskoye 50 5531 Q4
PNK Vnukovo PNK group A SW Kievskoe 19 10568 Q1
South Gate IP Radius group A S Kashirskoye 30 2070 Q2
South Gate IP Radius group A S Kashirskoye 30 3000 Q4
СПРОС В Московском регионе за I-III кварталах 2013 г было арендовано и куплено более 850 тыс кв м качественных складских площадей из них 235 тыс в III квартале что соответствует прошлогодним показателям
Наиболее крупные сделки в минувшем квартале
Автомобильный концерн Volkswagen купил 50 тыс кв м в складском комплексе PNK Чехов 2 девелопер PNK Group
Компания Верный купила 43 тыс кв м в складском комплексе PNK Север девелопер PNK Group
Автомобильный концерн General Motors арендовала 40 тыс кв м в индустриальном комплексе Южные врата
Следует отметить что большое количество качественных складских площадей было арендовано и куплено в III квартале 2013 г производственными компаниями при этом логистиче-ские компании и дистрибьюторы наоборот купили и арендова-ли меньшее количество площадей
Так же следует отметить увеличение доли продаж в III квартале до 42 против 14 во II квартале в структуре поглощения
На региональных рынках за минувший квартал было арендовано и куплено более 85 тыс кв м всего с начала года более 250 тыс кв м что почти на 20 выше аналогичного показателя прошлого года и на 5 среднего значения за последние 5 лет Этот показатель во многом обусловлен самой крупной сделкой за всю историю рынка складской недвижимости Санкт-Петербурга по предварительной продаже 43 тыс кв м компанией PNK Group продуктовой сети laquoВерныйraquo в складском комплексе PNK КАД
Сделки на такие большие площади позволяют девелоперу возобновить строительство в регионах но за период с IV кв 2012 по III квартале 2013 г Было заключено только 4 сделки более 25 тыс кв м Большинство сделок в регионах заключает-ся на складские площади до 10 тыс кв м
STRUCTURE OF DEMAND MOSCOW СТРУКТУРА СПРОСА МОСКВА
DEMAND In the Moscow region in Q1-Q3 2013 more than 850000 sq m were rented and purchased talking about quality warehouse space The Q3 indicator is 235000 sq m which is the same to the last years performance
The largest deals in the last quarter
bull Car manufacturer group Volkswagen bought 50000 sq m in a warehouse complex PNK Chekhov 2 developer is PNK Group
bull The Verniy company bought 43000 sq m in a warehouse complex PNK North developer is PNK Group
bull Automobile сar manufacturer General Motors leased 40000 sq m in the industrial complex South Gate
It should be noted that a large number of quality warehouse space was leased and purchased in the Q3 2013 by manufacturing companies while logistics companies and distributors on the contrary have bought and rented a smaller amount of warehouse space
It should be also mentioned the increasing sales in Q3 up to 42 comparing to 14 in the previous quarter for the both leased and bought premises
At the regional markets for the last quarter it was rented and purchased more than 85000 sq m Since of the beginning of the year more than 250000 sq m were rented and purchased which is almost 20 higher than last year and 5 higher than the average number for the last 5 years This indicator is largely due to the largest deal in the history of the warehouse property market of St Petersburg on the pre-sale of 43000 sq m by PNK Group to the food supplier Verniy in the warehouse complex PNK KAD
Such large deals allow developer to resume construction in the regions However between Q4 2012 and Q3 2013 it was only 4 deals amounted more than 25000 sq m made Most of the deals in the region are for warehouse space up to 10000 sq m
ТЕНДЕНЦИИ С начала прошлого года на рынок складской недвижимости остается стабильным Ежегодный спрос в Московском регионе составляет около 1 млн кв м в год Средние ставки аренды в классе А составляют $135 за кв м в год без НДС операцион-ных расходов и коммунальных платежей доля вакантных площадей сохраняется на уровне 1 Строительство большин-ства новых складских объектов будет начинаться только после заключения предварительных договоров аренды и продажи
Изменение ситуации в ближайшей перспективе ожидать не стоит В условиях низкого роста экономики страны начинать спекулятивное строительство большой риск повторения ситуации 2008 года поэтому предложение будет подстраивать-ся под спрос
На региональных рынках продолжится тенденция увеличения дефицита готовых к въезду складских площадей Не смотря на высокой спрос на складские объекты в регионах девелоперам не удается сформировать достаточных портфель предваритель-ных договоров аренды для начала строительства Исключение составляет Санкт-Петербург Свердловская область юг России где спрос или условия рынка обеспечили девелоперам формирование такого портфеля Мы прогнозируем что до конца года в регионах будет реализовано более 300 тыс кв м складских площадей
Source Cushman amp Wakefield
STRUCTURE OF DEMAND REGIONS СТРУКТУРА СПРОСА РЕГИОНЫ
TRENDS Since the beginning of the last year the warehouse market has remained stable Annual demand in the Moscow region is about one mn sq m per year average rental rates for Class A is $135 per sq m per year excluding VAT operating expenses and utility costs the vacancy rate remains at 1 Construction of the majority of new storage facilities will start only after the preliminary lease or sale contract signing up
In the nearest future the situation would remain the same It is the huge risk to start the new speculative construction in a low-growth economic situation as it is the threaten to repeat the 2008 year crisis the supply will adapt to the demand
The trend of growing deficit of ready-to-move warehouse spaces continues at the regional markets In spite of the high demand for storage facilities in the regions for developers it is still complicated to form a sufficient portfolio of preliminary agreements for the start of construction Exceptions are St Petersburg Sverdlovsk region and south Russia where the demand or market conditions provided developers with the opportunity to form such a portfolio We predict that by the end of the year in the regions will be sold over 300000 sq m of warehouse space
WampI MARKET IN RUSSIA ETHUcircIacuteIcircEcirc NtildeEcircEumlAgraveAumlNtildeEcircEgraveOtilde IumlIcircIgraveAringUgraveAringIacuteEgraveEacute Acirc ETHIcircNtildeNtildeEgraveEgrave
VACANCY RATE (EOY) Paris (Ile de France) 89 81 99 126 102 84 81 89 804
Budapest 59 172 173 188 195 208 194 217 2283
Warsaw 89 74 112 171 194 173 146 1621 1592
Madrid 55 38 37 55 73 84 93 95 972
TAKE UP 000 SQ MParis (Ile de France) 1 005 700 640 601 814 837 563 208 58
Budapest 152 229 308 280 210 327 355 31 21
Warsaw 260 445 556 216 451 743 483 183 112
Madrid 1 225 918 630 325 390 270 225 60 47
2013
36
MARKETBEAT Q3 2013
RESEARCH DEPARTMENT IcircOgraveAumlAringEuml EgraveNtildeNtildeEumlAringAumlIcircAcircAgraveIacuteEgraveEacute
Further information and copies of this report are available from Ellina Krylova
EllinaKrylovaeurcushwakecom
The information provided in this report is intended for informational purposes only and should not be relied on by any party without further independent verification Classifications of individual buildings are reviewed on a continuing basis and are subject to change The standards used in this process are consistent with those used by Moscow Research Forum and in the United States by the Society of Industrial and Office Realtors (SIOR) and BOMA International Reproduction of this report in whole or part is permitted only with written consent of Cushman amp Wakefield Data from this report may be cited with proper acknowledgment given
copy 2013 Cushman amp Wakefield All rights reserved
MORE INFORMATION AND CONTACTS ARE AVAILABLE ON WWWMARKETBEATRU EgraveIacuteOcircIcircETHIgraveAgraveOumlEgraveszlig IcircAacute IcircOgraveAumlAringEumlAring EgraveNtildeNtildeEumlAringAumlIcircAcircAgraveIacuteEgraveEacute Egrave IumlOacuteAacuteEumlEgraveEcircAgraveOumlEgraveEgrave AumlIcircNtildeOgraveOacuteIumlIacuteUcirc IacuteAgrave WWWMARKETBEATRU
DENIS SOKOLOV PARTNER RESEARCH DIRECTOR DenisSokoloveurcushwakecom
LADA BELAYCHUK ASSOCIATE DIRECTOR DEPUTY RESEARCH DIRECTOR LadaBelaychukeurcushwakecom
MAXIM ILYIN CONSULTANT CAPITAL MARKETS Maximilyineurcushwakecom
ALEXANDER KUNTSEVICH ANALYST WampI PROJECT MANAGEMENT AlexanerKuntsevicheurcushwakecom
TATYANA DIVINA SENIOR ANALYST
TatyanaDivinaeurcushwakecom
wwwcushmanwakefieldcom
Q3 2013 MoscowRUSSIA A Cushman amp Wakefield Research Publication
HOSPITALITY
ADR IN AUGUST 2013 | СРЕДНЯЯ ЦЕНА ЗА НОМЕР В АВГУСТЕ 2013 $152
QUALITY SUPPLY | ТЕКУЩИЙ ОБЪЕМ КАЧЕСТВЕННОГО ПРЕДЛОЖЕНИЯ 14200 rooms
OCCUPANCY | ЗАПОЛНЯЕМОСТЬ 77
RevPAR | СРЕДНИЙ ДОХОД НА НОМЕР $117
IumlETHAringAumlEumlIcircAEligAringIacuteEgraveAring По оценке департамента гостиничного бизнеса и туризма совокупный объем номерного фонда в Москве на конец III квартала 2013 г составил свыше 48 тыс номеров из них доля качественного предложения составила порядка 30 общего предложения или 142 тыс номеров
Новое предложение за III квартале 2013 г в сегменте качествен-ных гостиниц составило 1138 номеров и было сформировано за счет ввода в эксплуатацию 4-х гостиниц разной ценовой категории
В ноябре 2013 г ожидается открытие гостиниц под управлени-ем оператора Accor комплекс из трех отелей расположен по адресу ул Бахрушина вл 11 В состав комплекса войдут 3 гостиницы разной ценовой категории Mercure на 158 номеров (Upscale) Ibis на 190 номеров (Midscale) Adagio на 149 апартаментов (Midscale)
Это увеличит предложение на рынке качественных отелей минимум на 497 номеров Ожидаемое в 2013 г открытие гостиницы Marriott Novy Arbat (234 номера) перенесено на 1 квартал 2014 года
SUPPLY According to the Department of Hospitality and Tourism the cumulative number of rooms in the Moscow hotel market at the end of Q3 2013 is estimated at more than 48000 rooms with the proportion of high-quality supply at about 30 or 14200 rooms
The increase in high-quality segment by the end of Q3 2013 totaled 1138 rooms resulting from the commissioning of 4 hotels in different price categories
In addition Accor will open three new hotels in November Q4 2013 in the hotel complex located at ul Bakhrushina 11 The complex of hotels includes three brands Mercure with 158 rooms (Upscale) Ibis with 190 rooms (Midscale) and Adagio with 149 rooms (Midscale)
We believe that the total supply of international grade rooms will increase by 497 by the end of 2013 It was expected that more rooms would have been available but the opening of the Marriot Noviy Arbat (234 rooms) was postponed till the Q1 2014
QUALITY MOSCOW HOTEL MARKET STRUCTURE Q3 2013 YTD
NtildeOgraveETHOacuteEcircOgraveOacuteETHAgrave EcircAgravetimesAringNtildeOgraveAcircAringIacuteIacuteUcircOtilde AtildeIcircNtildeOgraveEgraveIacuteEgraveOuml IgraveIcircNtildeEcircAcircUcirc III EcircAcirc 2013
Средняя цена за номер (ADR) в августе 2013 г составила $152 что на 5 выше уровня августа 2012 г Положительная динамика обеспечена за счет гостиниц высокой ценовой категории максимальный рост средней цены за номер по отношению к результатам за аналогичный период 2012 г продемонстрировал рынок гостиниц класса Upscale 16 Среднеценовые объекты напротив работали с более демократичными группами спроса на рынке гостиниц класса Midscale было отмечено снижение показателя ADR на 7 по сравнению с августом 2012 г
Символическое падение ставок за номер на уровне 043 и 221 было отмечено также в сегментах Upper Midscale и Luxury соответственно что в целом характерно для августа ndash наиболее laquoтуристскогоraquo месяца в году
В отношении результатов 2013 г (по данным на август) рынок качественных гостиниц показал небольшое снижение показате-ля ADR (-11) по сравнению с прошлым годом что равносиль-но стабилизации в том числе с учетом ослабления рубля
Наиболее агрессивными с точки зрения ценовых ожиданий остаются гостиницы категории Luxury показывающие на фоне общих понижающих корректировок цены небольшой рост с $375 до $376 за номер
Московские гостиницы предлагают широкий разброс цен по сегментам наиболее дорогие ndash гостиницы категории Luxury где ADR в августе 2013 г составил $315 что на 10698 выше среднего показателя по рынку качественных гостиниц
Ценовой разрыв отелей категории Luxuгy со следующим за ним сегментом внушителен средняя цена за номер в гостиницах категории Upper Upscale уже только на 2875 превысила средний показатель по рынку и составила $197 Стоимость номера в гостиницах категории Upscale сравнима со средним по рынку значением и составляет $160
Цены за номер в гостиницах класса Upper Midscale и Midscale ниже среднерыночных на 30 и 48 соответственно и составляют $105 и $79 за номер (данные за август)
AVERAGE DAILY RATE US DOLLAR (ADR) AUGUST 2013 YTD
QUALITY HOTEL MARKET TRADING Average daily rate in August 2013 estimated to $152 which is 5 higher than in August 2012 This positive dynamic was ensured by high-quality hotels the highest ADR growth was recorded in the Upscale segment ndash Up 16 compared to the same period last year Midscale market in this period was oriented to more democratic groups of demand ADR declined by 7 comparing to August 2012
The fall in ADR at the level of 043 and 221 was also recorded in the Upper Midscale and Luxury segments respectively but that is typical for the August ndash the most tourist month of the year
The results of 2013 (August YtD) showed a symbolic decrease in ADR (-11) comparing to 2012 that can be interpreted as a stabili-zation taking into account the weakening of the Ruble
The most aggressive in terms of price expectations remain Luxury market segment showing slight increase from $375 to $376 per room comparison with the general lowering of prices
Moscow hotels offer a wide range of prices by segment the most expensive ndash Luxury with ADR in August about $315 it is 10698 higher than the average for the Moscow quality market
There is an impressive gap between Luxury hotel prices and prices for the Upper Upscale segment Average daily rate for Upper Upscale is about $197 and only 2875 higher than the average for the Moscow quality market
0
50
100
150
200
250
300
350
400
2010 2011 2012 2013
Luxury Upper Upscale
Upscale Upper Midscale
Midscale Moscow average
0
10
20
30
40
50
60
70
80
2010 2011 2012 2013
Luxury Upper UpscaleUpscale Upper MidscaleMidscale Moscow average
25
MARKETBEAT Q3 2013
NtildeIumlETHIcircNtilde
Средняя годовая загрузка качественных гостиниц Москвы в августе 2013 г составила 77 что на 11 выше данного показателя за аналогичный период прошлого года
Максимально высоким спросом в Москве пользуются гостиницы категории Upper Midscale и Midscale загрузка которых в августе фиксировалась на уровне 854 и 826 соответственно
Одной из особенностей рынка гостиниц Москвы в III кв 2013 г стала высокая загруженность качественных и центрально расположенных гостиниц в августе ndash традиционно низком из-за наступления laquoсезона отпусковraquo Нетипично высокая загрузка стала следствием увеличения туристских потоков в том числе за счет проведения Универсиады в Казани добавившей laquoтранзитныхraquo клиентов московским отелям
По итогам 2013 г по состоянию на август рынок качественных гостиниц показывает рост спроса по сравнению с прошлым годом практически по всем сегментам Рост спроса простимули-рован как ростом потока ночующих посетителей в Москву так и стагнацией цен на размещение последнее обстоятельство говорит о продолжающемся периоде неопределенности
OgraveAringIacuteAumlAringIacuteOumlEgraveEgrave
Среднее значение дохода на номер (RevPAR) за август 2013 г выросло на 171 и составило $117 против $100 в 2012 г В то же время по итогам 2013 г по состоянию на август динамика RevPAR по сегментам колебалась от 84 в Midscale до -46 в отелях категории Upper Midscale
Мы полагаем что тенденции к повышению среднерыночной доходности на номер (+12 YtD) за счет гибкой ценовой политики реагирующей на изменения спроса сохранится и в ближайшей перспективе В 2014 г гостиницы вышедшие на рынок в 2013 г окажут более выраженное воздействие на рыночную ситуацию за счет чего показатели RevPAR по сегменту Luxury и особенно Upper Midscale вряд ли существен-но превзойдут текущие показатели и будут колебаться от слабоотрицательных до слабоположительных значений в начале и конце года
DEMAND The average annual occupancy of quality hotels in Moscow in August 2013 was about 77 which is 11 higher than in the same period last year
Maximum high demand in Moscow hotels was in the Upper Midscale and Midscale category with occupancy in August at the level of 854 and 826 respectively
One of the features of the market of Moscow hotels in Q3 2013 was the high occupancy of quality hotels and especially the central located hotels ndash traditionally low in August because of the holiday season Unusually high occupancy was a result of increased tourist flows including through the Universiade in Kazan which added transit clients for Moscow hotels
In general up to August 2013 (YtD) the Moscow quality hotel market shows a growth in demand comparing to 2012 in almost all segments (reduced occupancy in Upper-Midscale segment by 03 pp can be seen as an insignificant adjustment) Demand growth is stimulated by the growing stream of domestic and international visitors staying overnight in Moscow and the stagnation of prices for accommodation the last point indicates the continuing period of uncertainty in the market
TRENDS IN REVENUE Average revenue per available room (RevRAR) in August 2013 increased by 171 to $117 versus $100 in August 2012
At the same time according to the results of August 2013 RevPAR dynamics by segment ranged from 84 in the Midscale segment to -46 in the Upper Midscale hotels We believe that the tendency to stimulate the RevRAR increase which the flexible price sensible of demand change will continue in the near future In 2014 the new hotels will have a more pronounced effect on the general market situation whereby RevPAR (especially for Luxury and Upper Midscale) unlikely to surpass itrsquos current estimations and will vary from slightly negative to low positive values at the beginning and end of the year
За III квартал 2013 года в эксплуатацию было введено более 235 тыс кв м качественных складских площадей
Ставки аренды остаются стабильными и составляют в среднем $135 за кв м в год в классе А без НДС операци-онных расходов и коммунальных платежей
Цена продажи составляет $1 200- $1 300 за кв м в типовых проектах класса А
Доля вакантных площадей в складах класса А за полугодие не изменилась и составляет 1
Объем арендованных и купленных складских площадей в III составил более 350 тыс кв м
Регионы
В большинстве регионов средние ставки аренды в классе А за прошедший квартал не изменились за исключением Новосибирска и Нижнего Новгорода где ставки выросли на 4-6
Объем арендованных и купленных складских площадей в III квартале составил более 85 тыс кв м
SUMMARY Moscow
In Q3 2013 more than 235000 sq m of quality warehouse space were put into operation
Rental rates remain stable at an average of $135 per sq m per year in A Class excluding VAT operating expenses and utility
The price of sale is $1200 - $1300 per sq m in typical projects of class A
The vacancy rate in Class A warehouses for the half of the year remains unchanged at 1
The volume of leased and purchased warehouse space in Q3 amounted to 350000 sq m
Regions
The average rental rates in Class A have not changed for the quarter in most regions except Novosibirsk and Nizhny Novgorod where rates have increased by 4-6
The volume of leased and purchased warehouse space in Q3 amounted to 85000 sq m
$132
$130
$140
$105
$110
$135
$135
$135
$80
$90
$100
$110
$120
$130
$140
$150
2006 2007 2008 2009 2010 2011 2012 2013F
KEY EXPECTATIONS
STABILITY
0
200
400
600
800
1000
1200
1400
1600
1800
2007 2008 2009 2010 2011 2012 2013F 2014F
27
MARKETBEAT Q3 2013
Source Cushman amp Wakefield
Source Cushman amp Wakefield
Source Cushman amp Wakefield
Source Cushman amp Wakefield
ОСНОВНЫЕ ТЕНДЕНЦИИ Объем нового строительства за 1-III кв 2013 года в Московском регионе составил 550 тыс кв м что соответствует аналогично-му показателю прошлого года Объем арендованных и куплен-ных площадей по итогам прошедших трех кварталов составил белее 830 тыс кв м что приблизительно соответствует показа-телю прошлого года
В регионах объем нового строительства в регионах за первые три квартала составил 239 тыс кв м что на треть меньше про-шлогоднего Арендовано куплено 250 тыс кв м что больше прошлогоднего показателя на 20
ПРЕДЛОЖЕНИЕ В Московском регионе в III квартале 2013 года предложение увеличилось на 235 тыс кв м
В минувшем квартале были построены
Логопарк Север (110 тыс кв м) девелопер Каравелла
Два новых корпуса в логистическом парке Климовск (48 тыс кв м) девелопер Raven Russia
Объем нового строительства соответствует показателям преды-дущего года но темпы строительства ниже заявленных девело-перами Основная проблема mdash задержки в строительстве Боль-ше всего это касается новых девелоперов длительное время работающие на рынке компании укладываются в заявленные сроки Поэтому до конца года будет построено до 1 млн кв м складских площадей
На рынке Москвы сохраняется дефицит готовых к въезду склад-ских площадей Все проекты сдаются или продаются на этапе строительства
Чистые средние ставки аренды в течении прошедшего квартала не изменились и составляют $135 за кв м при этом разброс ставок остается высоким
В 2014 году девелоперы обещают построить около 15 млн кв м складских площадей однако по нашем оценкам из-за задер-жек при строительстве построено будет на 30 меньше
KEY TRENDS The volume of new construction for Q1-Q3 2013 in the Moscow region amounted to 550000 sq m which corresponds to the same period of last year The volume of leased and purchased land based on the results of Q1-Q3 was more than 830000 sq m which approximately relative to the previous year figure
The volume of new construction in the regions for the first three quarters amounted to 239000 sq m which is a three times less than last year indicator 250000 sq m were leased and sold which is 20 more than last year figure
SUPPLY In Q3 2013 supply in Moscow region increased by 235000 sq m
In the last quarter were put into operation
bull Logistics Park North (110000 sq m) developer is Caravella
bull Two new phases in the logistics park Klimovsk (48000 sq m) developer is Raven Russia
The volume of new construction complies with the previous year but below the pace of construction announced by developers The main problem is the delays in construction mostly it concerns new developers Experienced companies meet the announced deadlines Therefore there will be built up to one million sq m of warehouse space until the end of the year
In Moscow there is a lack of ready-to-move storage space All projects are sold or bought during the construction process
Net average rental rates have not changed during the last quarter and amounted to $135 per sq m while the spread rate remains relatively high
In 2014 developers expect to build nearly 15 mn sq m of warehouse space however according to our estimations the volume of construction will be 30 less due to the development process delays
DISTRIBUTION OF QUALITY DEVELOPMENTS IN THE PIPELINE FOR 2013-2014 (lsquo000 SQ M) РАСПРЕДЕЛЕНИЕ ПЛАНИРУЕМЫХ К ВВОДУ В 2013-2014 ГГ СКЛАДСКИХ ПЛОЩАДЕЙ В МОСКОВСКОЙ ОБЛАСТИ ТЫС КВ М
DISTRIBUTION OF WampI SPACE IN THE MOSCOW REGION (lsquo000 SQ M) РАСПРЕДЕЛЕНИЕ СКЛАДСКИХ ПЛОЩАДЕЙ В МОСКОВСКОЙ ОБЛАСТИ ТЫС КВ М
В регионах в минувшем квартале было построено только 43 тыс кв м качественных складских площадей против 117 тыс в прошлом Все новые объекты построены рядом с Санкт-Петербургом
Всего в 2014 году в регионах будет построено боле 290 тыс кв м против 410 тыс кв м в прошлом В большинстве регионов дефицита складских площадей не наблюдается Исключение составляет Санкт-Петербург Екатеринбург и Ростов-на-Дону
Чистые ставки аренды в регионах в III квартале 2013 года не изменились за исключением Новосибирска и Нижнего Новгорода где они немного выросли до $120 и $123 за кв м соответственно
Source Cushman amp Wakefield
TAKE UP lsquo000 SQ M ОБЪЕМ АРЕНДОВАННЫХ И КУПЛЕННЫХ ПЛОЩАДЕЙ ТЫС КВ М
Source Cushman amp Wakefield
During the past quarter only 43000 sq m of quality warehouse space was built In the regions as against last year fiqure (117000 sq m) All new premises were built near St Petersburg
Comparing to last year figure (410000 sq m) more than 290000 sq m is going to be built in the regions in 2014 In most regions there is no lack of warehouse spaces observed The exceptions are St Petersburg Yekaterinburg and Rostov-on-Don
Net rental rates have not changed in the regions in Q3 except Novosibirsk and Nizhny Novgorod where they rose slightly to $120 and $123 per sq m respectively
2013 PIPELINE ОБЪЕКТЫ ЗАЯВЛЕННЫЕ К СТРОИТЕЛЬСТВУ В 2013 Г
PROJECT DEVELOPER GRADE DIRECTION HIGHWAYDISTANCE FROM
MKAD KMTOTAL AREA
000 SQ MEXPECTED
DELIVERY
Infrastroy Bykovo Infrastroy А E Egorevskoe 17 6155 Q1
Infrastroy Bykovo Infrastroy А E Egorevskoe 17 6193 Q4
Klimovsk LP Raven Russia A S Simferopolskoye 23 4772 Q3
Logopark Sever Karavella A N Rogachevskoye 30 11023 Q3
PNK Chekhov II PNK group A S Simferopolskoye 50 10424 Q2
PNK Chekhov II PNK group A S Simferopolskoye 50 5531 Q4
PNK Vnukovo PNK group A SW Kievskoe 19 10568 Q1
South Gate IP Radius group A S Kashirskoye 30 2070 Q2
South Gate IP Radius group A S Kashirskoye 30 3000 Q4
СПРОС В Московском регионе за I-III кварталах 2013 г было арендовано и куплено более 850 тыс кв м качественных складских площадей из них 235 тыс в III квартале что соответствует прошлогодним показателям
Наиболее крупные сделки в минувшем квартале
Автомобильный концерн Volkswagen купил 50 тыс кв м в складском комплексе PNK Чехов 2 девелопер PNK Group
Компания Верный купила 43 тыс кв м в складском комплексе PNK Север девелопер PNK Group
Автомобильный концерн General Motors арендовала 40 тыс кв м в индустриальном комплексе Южные врата
Следует отметить что большое количество качественных складских площадей было арендовано и куплено в III квартале 2013 г производственными компаниями при этом логистиче-ские компании и дистрибьюторы наоборот купили и арендова-ли меньшее количество площадей
Так же следует отметить увеличение доли продаж в III квартале до 42 против 14 во II квартале в структуре поглощения
На региональных рынках за минувший квартал было арендовано и куплено более 85 тыс кв м всего с начала года более 250 тыс кв м что почти на 20 выше аналогичного показателя прошлого года и на 5 среднего значения за последние 5 лет Этот показатель во многом обусловлен самой крупной сделкой за всю историю рынка складской недвижимости Санкт-Петербурга по предварительной продаже 43 тыс кв м компанией PNK Group продуктовой сети laquoВерныйraquo в складском комплексе PNK КАД
Сделки на такие большие площади позволяют девелоперу возобновить строительство в регионах но за период с IV кв 2012 по III квартале 2013 г Было заключено только 4 сделки более 25 тыс кв м Большинство сделок в регионах заключает-ся на складские площади до 10 тыс кв м
STRUCTURE OF DEMAND MOSCOW СТРУКТУРА СПРОСА МОСКВА
DEMAND In the Moscow region in Q1-Q3 2013 more than 850000 sq m were rented and purchased talking about quality warehouse space The Q3 indicator is 235000 sq m which is the same to the last years performance
The largest deals in the last quarter
bull Car manufacturer group Volkswagen bought 50000 sq m in a warehouse complex PNK Chekhov 2 developer is PNK Group
bull The Verniy company bought 43000 sq m in a warehouse complex PNK North developer is PNK Group
bull Automobile сar manufacturer General Motors leased 40000 sq m in the industrial complex South Gate
It should be noted that a large number of quality warehouse space was leased and purchased in the Q3 2013 by manufacturing companies while logistics companies and distributors on the contrary have bought and rented a smaller amount of warehouse space
It should be also mentioned the increasing sales in Q3 up to 42 comparing to 14 in the previous quarter for the both leased and bought premises
At the regional markets for the last quarter it was rented and purchased more than 85000 sq m Since of the beginning of the year more than 250000 sq m were rented and purchased which is almost 20 higher than last year and 5 higher than the average number for the last 5 years This indicator is largely due to the largest deal in the history of the warehouse property market of St Petersburg on the pre-sale of 43000 sq m by PNK Group to the food supplier Verniy in the warehouse complex PNK KAD
Such large deals allow developer to resume construction in the regions However between Q4 2012 and Q3 2013 it was only 4 deals amounted more than 25000 sq m made Most of the deals in the region are for warehouse space up to 10000 sq m
ТЕНДЕНЦИИ С начала прошлого года на рынок складской недвижимости остается стабильным Ежегодный спрос в Московском регионе составляет около 1 млн кв м в год Средние ставки аренды в классе А составляют $135 за кв м в год без НДС операцион-ных расходов и коммунальных платежей доля вакантных площадей сохраняется на уровне 1 Строительство большин-ства новых складских объектов будет начинаться только после заключения предварительных договоров аренды и продажи
Изменение ситуации в ближайшей перспективе ожидать не стоит В условиях низкого роста экономики страны начинать спекулятивное строительство большой риск повторения ситуации 2008 года поэтому предложение будет подстраивать-ся под спрос
На региональных рынках продолжится тенденция увеличения дефицита готовых к въезду складских площадей Не смотря на высокой спрос на складские объекты в регионах девелоперам не удается сформировать достаточных портфель предваритель-ных договоров аренды для начала строительства Исключение составляет Санкт-Петербург Свердловская область юг России где спрос или условия рынка обеспечили девелоперам формирование такого портфеля Мы прогнозируем что до конца года в регионах будет реализовано более 300 тыс кв м складских площадей
Source Cushman amp Wakefield
STRUCTURE OF DEMAND REGIONS СТРУКТУРА СПРОСА РЕГИОНЫ
TRENDS Since the beginning of the last year the warehouse market has remained stable Annual demand in the Moscow region is about one mn sq m per year average rental rates for Class A is $135 per sq m per year excluding VAT operating expenses and utility costs the vacancy rate remains at 1 Construction of the majority of new storage facilities will start only after the preliminary lease or sale contract signing up
In the nearest future the situation would remain the same It is the huge risk to start the new speculative construction in a low-growth economic situation as it is the threaten to repeat the 2008 year crisis the supply will adapt to the demand
The trend of growing deficit of ready-to-move warehouse spaces continues at the regional markets In spite of the high demand for storage facilities in the regions for developers it is still complicated to form a sufficient portfolio of preliminary agreements for the start of construction Exceptions are St Petersburg Sverdlovsk region and south Russia where the demand or market conditions provided developers with the opportunity to form such a portfolio We predict that by the end of the year in the regions will be sold over 300000 sq m of warehouse space
WampI MARKET IN RUSSIA ETHUcircIacuteIcircEcirc NtildeEcircEumlAgraveAumlNtildeEcircEgraveOtilde IumlIcircIgraveAringUgraveAringIacuteEgraveEacute Acirc ETHIcircNtildeNtildeEgraveEgrave
VACANCY RATE (EOY) Paris (Ile de France) 89 81 99 126 102 84 81 89 804
Budapest 59 172 173 188 195 208 194 217 2283
Warsaw 89 74 112 171 194 173 146 1621 1592
Madrid 55 38 37 55 73 84 93 95 972
TAKE UP 000 SQ MParis (Ile de France) 1 005 700 640 601 814 837 563 208 58
Budapest 152 229 308 280 210 327 355 31 21
Warsaw 260 445 556 216 451 743 483 183 112
Madrid 1 225 918 630 325 390 270 225 60 47
2013
36
MARKETBEAT Q3 2013
RESEARCH DEPARTMENT IcircOgraveAumlAringEuml EgraveNtildeNtildeEumlAringAumlIcircAcircAgraveIacuteEgraveEacute
Further information and copies of this report are available from Ellina Krylova
EllinaKrylovaeurcushwakecom
The information provided in this report is intended for informational purposes only and should not be relied on by any party without further independent verification Classifications of individual buildings are reviewed on a continuing basis and are subject to change The standards used in this process are consistent with those used by Moscow Research Forum and in the United States by the Society of Industrial and Office Realtors (SIOR) and BOMA International Reproduction of this report in whole or part is permitted only with written consent of Cushman amp Wakefield Data from this report may be cited with proper acknowledgment given
copy 2013 Cushman amp Wakefield All rights reserved
MORE INFORMATION AND CONTACTS ARE AVAILABLE ON WWWMARKETBEATRU EgraveIacuteOcircIcircETHIgraveAgraveOumlEgraveszlig IcircAacute IcircOgraveAumlAringEumlAring EgraveNtildeNtildeEumlAringAumlIcircAcircAgraveIacuteEgraveEacute Egrave IumlOacuteAacuteEumlEgraveEcircAgraveOumlEgraveEgrave AumlIcircNtildeOgraveOacuteIumlIacuteUcirc IacuteAgrave WWWMARKETBEATRU
DENIS SOKOLOV PARTNER RESEARCH DIRECTOR DenisSokoloveurcushwakecom
LADA BELAYCHUK ASSOCIATE DIRECTOR DEPUTY RESEARCH DIRECTOR LadaBelaychukeurcushwakecom
MAXIM ILYIN CONSULTANT CAPITAL MARKETS Maximilyineurcushwakecom
ALEXANDER KUNTSEVICH ANALYST WampI PROJECT MANAGEMENT AlexanerKuntsevicheurcushwakecom
TATYANA DIVINA SENIOR ANALYST
TatyanaDivinaeurcushwakecom
wwwcushmanwakefieldcom
Q3 2013 MoscowRUSSIA A Cushman amp Wakefield Research Publication
WAREHOUSE amp INDUSTRIAL
NEW SUPPLY 2013 | НОВОЕ ПРЕДЛОЖЕНИЕ 2013 950000 sq m
AVERAGE RENTAL RATE FOR CLASS A | АРЕНДНЫЕ СТАВКИ КЛАСС А US$ 135 sq m
VACANCY RATE FOR CLASS A | ДОЛЯ СВОБОДНЫХ ПЛОЩАДЕЙ КЛАСС А 1
NEW CONSTRUCTION IN MOSCOW REGION (1000 SQ M) МОСКОВСКАЯ ОБЛАСТЬ НОВОЕ СТРОИТЕЛЬСТВО ТЫС КВ М
AVERAGE CLASS A RENTAL RATE IN MOSCOW REGION СРЕДНИЕ СТАВКИ АРЕНДЫ В МОСКОВСКОМ РЕГИОНЕ КЛАСС А
За III квартал 2013 года в эксплуатацию было введено более 235 тыс кв м качественных складских площадей
Ставки аренды остаются стабильными и составляют в среднем $135 за кв м в год в классе А без НДС операци-онных расходов и коммунальных платежей
Цена продажи составляет $1 200- $1 300 за кв м в типовых проектах класса А
Доля вакантных площадей в складах класса А за полугодие не изменилась и составляет 1
Объем арендованных и купленных складских площадей в III составил более 350 тыс кв м
Регионы
В большинстве регионов средние ставки аренды в классе А за прошедший квартал не изменились за исключением Новосибирска и Нижнего Новгорода где ставки выросли на 4-6
Объем арендованных и купленных складских площадей в III квартале составил более 85 тыс кв м
SUMMARY Moscow
In Q3 2013 more than 235000 sq m of quality warehouse space were put into operation
Rental rates remain stable at an average of $135 per sq m per year in A Class excluding VAT operating expenses and utility
The price of sale is $1200 - $1300 per sq m in typical projects of class A
The vacancy rate in Class A warehouses for the half of the year remains unchanged at 1
The volume of leased and purchased warehouse space in Q3 amounted to 350000 sq m
Regions
The average rental rates in Class A have not changed for the quarter in most regions except Novosibirsk and Nizhny Novgorod where rates have increased by 4-6
The volume of leased and purchased warehouse space in Q3 amounted to 85000 sq m
$132
$130
$140
$105
$110
$135
$135
$135
$80
$90
$100
$110
$120
$130
$140
$150
2006 2007 2008 2009 2010 2011 2012 2013F
KEY EXPECTATIONS
STABILITY
0
200
400
600
800
1000
1200
1400
1600
1800
2007 2008 2009 2010 2011 2012 2013F 2014F
27
MARKETBEAT Q3 2013
Source Cushman amp Wakefield
Source Cushman amp Wakefield
Source Cushman amp Wakefield
Source Cushman amp Wakefield
ОСНОВНЫЕ ТЕНДЕНЦИИ Объем нового строительства за 1-III кв 2013 года в Московском регионе составил 550 тыс кв м что соответствует аналогично-му показателю прошлого года Объем арендованных и куплен-ных площадей по итогам прошедших трех кварталов составил белее 830 тыс кв м что приблизительно соответствует показа-телю прошлого года
В регионах объем нового строительства в регионах за первые три квартала составил 239 тыс кв м что на треть меньше про-шлогоднего Арендовано куплено 250 тыс кв м что больше прошлогоднего показателя на 20
ПРЕДЛОЖЕНИЕ В Московском регионе в III квартале 2013 года предложение увеличилось на 235 тыс кв м
В минувшем квартале были построены
Логопарк Север (110 тыс кв м) девелопер Каравелла
Два новых корпуса в логистическом парке Климовск (48 тыс кв м) девелопер Raven Russia
Объем нового строительства соответствует показателям преды-дущего года но темпы строительства ниже заявленных девело-перами Основная проблема mdash задержки в строительстве Боль-ше всего это касается новых девелоперов длительное время работающие на рынке компании укладываются в заявленные сроки Поэтому до конца года будет построено до 1 млн кв м складских площадей
На рынке Москвы сохраняется дефицит готовых к въезду склад-ских площадей Все проекты сдаются или продаются на этапе строительства
Чистые средние ставки аренды в течении прошедшего квартала не изменились и составляют $135 за кв м при этом разброс ставок остается высоким
В 2014 году девелоперы обещают построить около 15 млн кв м складских площадей однако по нашем оценкам из-за задер-жек при строительстве построено будет на 30 меньше
KEY TRENDS The volume of new construction for Q1-Q3 2013 in the Moscow region amounted to 550000 sq m which corresponds to the same period of last year The volume of leased and purchased land based on the results of Q1-Q3 was more than 830000 sq m which approximately relative to the previous year figure
The volume of new construction in the regions for the first three quarters amounted to 239000 sq m which is a three times less than last year indicator 250000 sq m were leased and sold which is 20 more than last year figure
SUPPLY In Q3 2013 supply in Moscow region increased by 235000 sq m
In the last quarter were put into operation
bull Logistics Park North (110000 sq m) developer is Caravella
bull Two new phases in the logistics park Klimovsk (48000 sq m) developer is Raven Russia
The volume of new construction complies with the previous year but below the pace of construction announced by developers The main problem is the delays in construction mostly it concerns new developers Experienced companies meet the announced deadlines Therefore there will be built up to one million sq m of warehouse space until the end of the year
In Moscow there is a lack of ready-to-move storage space All projects are sold or bought during the construction process
Net average rental rates have not changed during the last quarter and amounted to $135 per sq m while the spread rate remains relatively high
In 2014 developers expect to build nearly 15 mn sq m of warehouse space however according to our estimations the volume of construction will be 30 less due to the development process delays
DISTRIBUTION OF QUALITY DEVELOPMENTS IN THE PIPELINE FOR 2013-2014 (lsquo000 SQ M) РАСПРЕДЕЛЕНИЕ ПЛАНИРУЕМЫХ К ВВОДУ В 2013-2014 ГГ СКЛАДСКИХ ПЛОЩАДЕЙ В МОСКОВСКОЙ ОБЛАСТИ ТЫС КВ М
DISTRIBUTION OF WampI SPACE IN THE MOSCOW REGION (lsquo000 SQ M) РАСПРЕДЕЛЕНИЕ СКЛАДСКИХ ПЛОЩАДЕЙ В МОСКОВСКОЙ ОБЛАСТИ ТЫС КВ М
В регионах в минувшем квартале было построено только 43 тыс кв м качественных складских площадей против 117 тыс в прошлом Все новые объекты построены рядом с Санкт-Петербургом
Всего в 2014 году в регионах будет построено боле 290 тыс кв м против 410 тыс кв м в прошлом В большинстве регионов дефицита складских площадей не наблюдается Исключение составляет Санкт-Петербург Екатеринбург и Ростов-на-Дону
Чистые ставки аренды в регионах в III квартале 2013 года не изменились за исключением Новосибирска и Нижнего Новгорода где они немного выросли до $120 и $123 за кв м соответственно
Source Cushman amp Wakefield
TAKE UP lsquo000 SQ M ОБЪЕМ АРЕНДОВАННЫХ И КУПЛЕННЫХ ПЛОЩАДЕЙ ТЫС КВ М
Source Cushman amp Wakefield
During the past quarter only 43000 sq m of quality warehouse space was built In the regions as against last year fiqure (117000 sq m) All new premises were built near St Petersburg
Comparing to last year figure (410000 sq m) more than 290000 sq m is going to be built in the regions in 2014 In most regions there is no lack of warehouse spaces observed The exceptions are St Petersburg Yekaterinburg and Rostov-on-Don
Net rental rates have not changed in the regions in Q3 except Novosibirsk and Nizhny Novgorod where they rose slightly to $120 and $123 per sq m respectively
2013 PIPELINE ОБЪЕКТЫ ЗАЯВЛЕННЫЕ К СТРОИТЕЛЬСТВУ В 2013 Г
PROJECT DEVELOPER GRADE DIRECTION HIGHWAYDISTANCE FROM
MKAD KMTOTAL AREA
000 SQ MEXPECTED
DELIVERY
Infrastroy Bykovo Infrastroy А E Egorevskoe 17 6155 Q1
Infrastroy Bykovo Infrastroy А E Egorevskoe 17 6193 Q4
Klimovsk LP Raven Russia A S Simferopolskoye 23 4772 Q3
Logopark Sever Karavella A N Rogachevskoye 30 11023 Q3
PNK Chekhov II PNK group A S Simferopolskoye 50 10424 Q2
PNK Chekhov II PNK group A S Simferopolskoye 50 5531 Q4
PNK Vnukovo PNK group A SW Kievskoe 19 10568 Q1
South Gate IP Radius group A S Kashirskoye 30 2070 Q2
South Gate IP Radius group A S Kashirskoye 30 3000 Q4
СПРОС В Московском регионе за I-III кварталах 2013 г было арендовано и куплено более 850 тыс кв м качественных складских площадей из них 235 тыс в III квартале что соответствует прошлогодним показателям
Наиболее крупные сделки в минувшем квартале
Автомобильный концерн Volkswagen купил 50 тыс кв м в складском комплексе PNK Чехов 2 девелопер PNK Group
Компания Верный купила 43 тыс кв м в складском комплексе PNK Север девелопер PNK Group
Автомобильный концерн General Motors арендовала 40 тыс кв м в индустриальном комплексе Южные врата
Следует отметить что большое количество качественных складских площадей было арендовано и куплено в III квартале 2013 г производственными компаниями при этом логистиче-ские компании и дистрибьюторы наоборот купили и арендова-ли меньшее количество площадей
Так же следует отметить увеличение доли продаж в III квартале до 42 против 14 во II квартале в структуре поглощения
На региональных рынках за минувший квартал было арендовано и куплено более 85 тыс кв м всего с начала года более 250 тыс кв м что почти на 20 выше аналогичного показателя прошлого года и на 5 среднего значения за последние 5 лет Этот показатель во многом обусловлен самой крупной сделкой за всю историю рынка складской недвижимости Санкт-Петербурга по предварительной продаже 43 тыс кв м компанией PNK Group продуктовой сети laquoВерныйraquo в складском комплексе PNK КАД
Сделки на такие большие площади позволяют девелоперу возобновить строительство в регионах но за период с IV кв 2012 по III квартале 2013 г Было заключено только 4 сделки более 25 тыс кв м Большинство сделок в регионах заключает-ся на складские площади до 10 тыс кв м
STRUCTURE OF DEMAND MOSCOW СТРУКТУРА СПРОСА МОСКВА
DEMAND In the Moscow region in Q1-Q3 2013 more than 850000 sq m were rented and purchased talking about quality warehouse space The Q3 indicator is 235000 sq m which is the same to the last years performance
The largest deals in the last quarter
bull Car manufacturer group Volkswagen bought 50000 sq m in a warehouse complex PNK Chekhov 2 developer is PNK Group
bull The Verniy company bought 43000 sq m in a warehouse complex PNK North developer is PNK Group
bull Automobile сar manufacturer General Motors leased 40000 sq m in the industrial complex South Gate
It should be noted that a large number of quality warehouse space was leased and purchased in the Q3 2013 by manufacturing companies while logistics companies and distributors on the contrary have bought and rented a smaller amount of warehouse space
It should be also mentioned the increasing sales in Q3 up to 42 comparing to 14 in the previous quarter for the both leased and bought premises
At the regional markets for the last quarter it was rented and purchased more than 85000 sq m Since of the beginning of the year more than 250000 sq m were rented and purchased which is almost 20 higher than last year and 5 higher than the average number for the last 5 years This indicator is largely due to the largest deal in the history of the warehouse property market of St Petersburg on the pre-sale of 43000 sq m by PNK Group to the food supplier Verniy in the warehouse complex PNK KAD
Such large deals allow developer to resume construction in the regions However between Q4 2012 and Q3 2013 it was only 4 deals amounted more than 25000 sq m made Most of the deals in the region are for warehouse space up to 10000 sq m
ТЕНДЕНЦИИ С начала прошлого года на рынок складской недвижимости остается стабильным Ежегодный спрос в Московском регионе составляет около 1 млн кв м в год Средние ставки аренды в классе А составляют $135 за кв м в год без НДС операцион-ных расходов и коммунальных платежей доля вакантных площадей сохраняется на уровне 1 Строительство большин-ства новых складских объектов будет начинаться только после заключения предварительных договоров аренды и продажи
Изменение ситуации в ближайшей перспективе ожидать не стоит В условиях низкого роста экономики страны начинать спекулятивное строительство большой риск повторения ситуации 2008 года поэтому предложение будет подстраивать-ся под спрос
На региональных рынках продолжится тенденция увеличения дефицита готовых к въезду складских площадей Не смотря на высокой спрос на складские объекты в регионах девелоперам не удается сформировать достаточных портфель предваритель-ных договоров аренды для начала строительства Исключение составляет Санкт-Петербург Свердловская область юг России где спрос или условия рынка обеспечили девелоперам формирование такого портфеля Мы прогнозируем что до конца года в регионах будет реализовано более 300 тыс кв м складских площадей
Source Cushman amp Wakefield
STRUCTURE OF DEMAND REGIONS СТРУКТУРА СПРОСА РЕГИОНЫ
TRENDS Since the beginning of the last year the warehouse market has remained stable Annual demand in the Moscow region is about one mn sq m per year average rental rates for Class A is $135 per sq m per year excluding VAT operating expenses and utility costs the vacancy rate remains at 1 Construction of the majority of new storage facilities will start only after the preliminary lease or sale contract signing up
In the nearest future the situation would remain the same It is the huge risk to start the new speculative construction in a low-growth economic situation as it is the threaten to repeat the 2008 year crisis the supply will adapt to the demand
The trend of growing deficit of ready-to-move warehouse spaces continues at the regional markets In spite of the high demand for storage facilities in the regions for developers it is still complicated to form a sufficient portfolio of preliminary agreements for the start of construction Exceptions are St Petersburg Sverdlovsk region and south Russia where the demand or market conditions provided developers with the opportunity to form such a portfolio We predict that by the end of the year in the regions will be sold over 300000 sq m of warehouse space
WampI MARKET IN RUSSIA ETHUcircIacuteIcircEcirc NtildeEcircEumlAgraveAumlNtildeEcircEgraveOtilde IumlIcircIgraveAringUgraveAringIacuteEgraveEacute Acirc ETHIcircNtildeNtildeEgraveEgrave
VACANCY RATE (EOY) Paris (Ile de France) 89 81 99 126 102 84 81 89 804
Budapest 59 172 173 188 195 208 194 217 2283
Warsaw 89 74 112 171 194 173 146 1621 1592
Madrid 55 38 37 55 73 84 93 95 972
TAKE UP 000 SQ MParis (Ile de France) 1 005 700 640 601 814 837 563 208 58
Budapest 152 229 308 280 210 327 355 31 21
Warsaw 260 445 556 216 451 743 483 183 112
Madrid 1 225 918 630 325 390 270 225 60 47
2013
36
MARKETBEAT Q3 2013
RESEARCH DEPARTMENT IcircOgraveAumlAringEuml EgraveNtildeNtildeEumlAringAumlIcircAcircAgraveIacuteEgraveEacute
Further information and copies of this report are available from Ellina Krylova
EllinaKrylovaeurcushwakecom
The information provided in this report is intended for informational purposes only and should not be relied on by any party without further independent verification Classifications of individual buildings are reviewed on a continuing basis and are subject to change The standards used in this process are consistent with those used by Moscow Research Forum and in the United States by the Society of Industrial and Office Realtors (SIOR) and BOMA International Reproduction of this report in whole or part is permitted only with written consent of Cushman amp Wakefield Data from this report may be cited with proper acknowledgment given
copy 2013 Cushman amp Wakefield All rights reserved
MORE INFORMATION AND CONTACTS ARE AVAILABLE ON WWWMARKETBEATRU EgraveIacuteOcircIcircETHIgraveAgraveOumlEgraveszlig IcircAacute IcircOgraveAumlAringEumlAring EgraveNtildeNtildeEumlAringAumlIcircAcircAgraveIacuteEgraveEacute Egrave IumlOacuteAacuteEumlEgraveEcircAgraveOumlEgraveEgrave AumlIcircNtildeOgraveOacuteIumlIacuteUcirc IacuteAgrave WWWMARKETBEATRU
DENIS SOKOLOV PARTNER RESEARCH DIRECTOR DenisSokoloveurcushwakecom
LADA BELAYCHUK ASSOCIATE DIRECTOR DEPUTY RESEARCH DIRECTOR LadaBelaychukeurcushwakecom
MAXIM ILYIN CONSULTANT CAPITAL MARKETS Maximilyineurcushwakecom
ALEXANDER KUNTSEVICH ANALYST WampI PROJECT MANAGEMENT AlexanerKuntsevicheurcushwakecom
TATYANA DIVINA SENIOR ANALYST
TatyanaDivinaeurcushwakecom
wwwcushmanwakefieldcom
28
MARKETBEAT Q3 2013
В регионах в минувшем квартале было построено только 43 тыс кв м качественных складских площадей против 117 тыс в прошлом Все новые объекты построены рядом с Санкт-Петербургом
Всего в 2014 году в регионах будет построено боле 290 тыс кв м против 410 тыс кв м в прошлом В большинстве регионов дефицита складских площадей не наблюдается Исключение составляет Санкт-Петербург Екатеринбург и Ростов-на-Дону
Чистые ставки аренды в регионах в III квартале 2013 года не изменились за исключением Новосибирска и Нижнего Новгорода где они немного выросли до $120 и $123 за кв м соответственно
Source Cushman amp Wakefield
TAKE UP lsquo000 SQ M ОБЪЕМ АРЕНДОВАННЫХ И КУПЛЕННЫХ ПЛОЩАДЕЙ ТЫС КВ М
Source Cushman amp Wakefield
During the past quarter only 43000 sq m of quality warehouse space was built In the regions as against last year fiqure (117000 sq m) All new premises were built near St Petersburg
Comparing to last year figure (410000 sq m) more than 290000 sq m is going to be built in the regions in 2014 In most regions there is no lack of warehouse spaces observed The exceptions are St Petersburg Yekaterinburg and Rostov-on-Don
Net rental rates have not changed in the regions in Q3 except Novosibirsk and Nizhny Novgorod where they rose slightly to $120 and $123 per sq m respectively
2013 PIPELINE ОБЪЕКТЫ ЗАЯВЛЕННЫЕ К СТРОИТЕЛЬСТВУ В 2013 Г
PROJECT DEVELOPER GRADE DIRECTION HIGHWAYDISTANCE FROM
MKAD KMTOTAL AREA
000 SQ MEXPECTED
DELIVERY
Infrastroy Bykovo Infrastroy А E Egorevskoe 17 6155 Q1
Infrastroy Bykovo Infrastroy А E Egorevskoe 17 6193 Q4
Klimovsk LP Raven Russia A S Simferopolskoye 23 4772 Q3
Logopark Sever Karavella A N Rogachevskoye 30 11023 Q3
PNK Chekhov II PNK group A S Simferopolskoye 50 10424 Q2
PNK Chekhov II PNK group A S Simferopolskoye 50 5531 Q4
PNK Vnukovo PNK group A SW Kievskoe 19 10568 Q1
South Gate IP Radius group A S Kashirskoye 30 2070 Q2
South Gate IP Radius group A S Kashirskoye 30 3000 Q4
СПРОС В Московском регионе за I-III кварталах 2013 г было арендовано и куплено более 850 тыс кв м качественных складских площадей из них 235 тыс в III квартале что соответствует прошлогодним показателям
Наиболее крупные сделки в минувшем квартале
Автомобильный концерн Volkswagen купил 50 тыс кв м в складском комплексе PNK Чехов 2 девелопер PNK Group
Компания Верный купила 43 тыс кв м в складском комплексе PNK Север девелопер PNK Group
Автомобильный концерн General Motors арендовала 40 тыс кв м в индустриальном комплексе Южные врата
Следует отметить что большое количество качественных складских площадей было арендовано и куплено в III квартале 2013 г производственными компаниями при этом логистиче-ские компании и дистрибьюторы наоборот купили и арендова-ли меньшее количество площадей
Так же следует отметить увеличение доли продаж в III квартале до 42 против 14 во II квартале в структуре поглощения
На региональных рынках за минувший квартал было арендовано и куплено более 85 тыс кв м всего с начала года более 250 тыс кв м что почти на 20 выше аналогичного показателя прошлого года и на 5 среднего значения за последние 5 лет Этот показатель во многом обусловлен самой крупной сделкой за всю историю рынка складской недвижимости Санкт-Петербурга по предварительной продаже 43 тыс кв м компанией PNK Group продуктовой сети laquoВерныйraquo в складском комплексе PNK КАД
Сделки на такие большие площади позволяют девелоперу возобновить строительство в регионах но за период с IV кв 2012 по III квартале 2013 г Было заключено только 4 сделки более 25 тыс кв м Большинство сделок в регионах заключает-ся на складские площади до 10 тыс кв м
STRUCTURE OF DEMAND MOSCOW СТРУКТУРА СПРОСА МОСКВА
DEMAND In the Moscow region in Q1-Q3 2013 more than 850000 sq m were rented and purchased talking about quality warehouse space The Q3 indicator is 235000 sq m which is the same to the last years performance
The largest deals in the last quarter
bull Car manufacturer group Volkswagen bought 50000 sq m in a warehouse complex PNK Chekhov 2 developer is PNK Group
bull The Verniy company bought 43000 sq m in a warehouse complex PNK North developer is PNK Group
bull Automobile сar manufacturer General Motors leased 40000 sq m in the industrial complex South Gate
It should be noted that a large number of quality warehouse space was leased and purchased in the Q3 2013 by manufacturing companies while logistics companies and distributors on the contrary have bought and rented a smaller amount of warehouse space
It should be also mentioned the increasing sales in Q3 up to 42 comparing to 14 in the previous quarter for the both leased and bought premises
At the regional markets for the last quarter it was rented and purchased more than 85000 sq m Since of the beginning of the year more than 250000 sq m were rented and purchased which is almost 20 higher than last year and 5 higher than the average number for the last 5 years This indicator is largely due to the largest deal in the history of the warehouse property market of St Petersburg on the pre-sale of 43000 sq m by PNK Group to the food supplier Verniy in the warehouse complex PNK KAD
Such large deals allow developer to resume construction in the regions However between Q4 2012 and Q3 2013 it was only 4 deals amounted more than 25000 sq m made Most of the deals in the region are for warehouse space up to 10000 sq m
ТЕНДЕНЦИИ С начала прошлого года на рынок складской недвижимости остается стабильным Ежегодный спрос в Московском регионе составляет около 1 млн кв м в год Средние ставки аренды в классе А составляют $135 за кв м в год без НДС операцион-ных расходов и коммунальных платежей доля вакантных площадей сохраняется на уровне 1 Строительство большин-ства новых складских объектов будет начинаться только после заключения предварительных договоров аренды и продажи
Изменение ситуации в ближайшей перспективе ожидать не стоит В условиях низкого роста экономики страны начинать спекулятивное строительство большой риск повторения ситуации 2008 года поэтому предложение будет подстраивать-ся под спрос
На региональных рынках продолжится тенденция увеличения дефицита готовых к въезду складских площадей Не смотря на высокой спрос на складские объекты в регионах девелоперам не удается сформировать достаточных портфель предваритель-ных договоров аренды для начала строительства Исключение составляет Санкт-Петербург Свердловская область юг России где спрос или условия рынка обеспечили девелоперам формирование такого портфеля Мы прогнозируем что до конца года в регионах будет реализовано более 300 тыс кв м складских площадей
Source Cushman amp Wakefield
STRUCTURE OF DEMAND REGIONS СТРУКТУРА СПРОСА РЕГИОНЫ
TRENDS Since the beginning of the last year the warehouse market has remained stable Annual demand in the Moscow region is about one mn sq m per year average rental rates for Class A is $135 per sq m per year excluding VAT operating expenses and utility costs the vacancy rate remains at 1 Construction of the majority of new storage facilities will start only after the preliminary lease or sale contract signing up
In the nearest future the situation would remain the same It is the huge risk to start the new speculative construction in a low-growth economic situation as it is the threaten to repeat the 2008 year crisis the supply will adapt to the demand
The trend of growing deficit of ready-to-move warehouse spaces continues at the regional markets In spite of the high demand for storage facilities in the regions for developers it is still complicated to form a sufficient portfolio of preliminary agreements for the start of construction Exceptions are St Petersburg Sverdlovsk region and south Russia where the demand or market conditions provided developers with the opportunity to form such a portfolio We predict that by the end of the year in the regions will be sold over 300000 sq m of warehouse space
WampI MARKET IN RUSSIA ETHUcircIacuteIcircEcirc NtildeEcircEumlAgraveAumlNtildeEcircEgraveOtilde IumlIcircIgraveAringUgraveAringIacuteEgraveEacute Acirc ETHIcircNtildeNtildeEgraveEgrave
VACANCY RATE (EOY) Paris (Ile de France) 89 81 99 126 102 84 81 89 804
Budapest 59 172 173 188 195 208 194 217 2283
Warsaw 89 74 112 171 194 173 146 1621 1592
Madrid 55 38 37 55 73 84 93 95 972
TAKE UP 000 SQ MParis (Ile de France) 1 005 700 640 601 814 837 563 208 58
Budapest 152 229 308 280 210 327 355 31 21
Warsaw 260 445 556 216 451 743 483 183 112
Madrid 1 225 918 630 325 390 270 225 60 47
2013
36
MARKETBEAT Q3 2013
RESEARCH DEPARTMENT IcircOgraveAumlAringEuml EgraveNtildeNtildeEumlAringAumlIcircAcircAgraveIacuteEgraveEacute
Further information and copies of this report are available from Ellina Krylova
EllinaKrylovaeurcushwakecom
The information provided in this report is intended for informational purposes only and should not be relied on by any party without further independent verification Classifications of individual buildings are reviewed on a continuing basis and are subject to change The standards used in this process are consistent with those used by Moscow Research Forum and in the United States by the Society of Industrial and Office Realtors (SIOR) and BOMA International Reproduction of this report in whole or part is permitted only with written consent of Cushman amp Wakefield Data from this report may be cited with proper acknowledgment given
copy 2013 Cushman amp Wakefield All rights reserved
MORE INFORMATION AND CONTACTS ARE AVAILABLE ON WWWMARKETBEATRU EgraveIacuteOcircIcircETHIgraveAgraveOumlEgraveszlig IcircAacute IcircOgraveAumlAringEumlAring EgraveNtildeNtildeEumlAringAumlIcircAcircAgraveIacuteEgraveEacute Egrave IumlOacuteAacuteEumlEgraveEcircAgraveOumlEgraveEgrave AumlIcircNtildeOgraveOacuteIumlIacuteUcirc IacuteAgrave WWWMARKETBEATRU
DENIS SOKOLOV PARTNER RESEARCH DIRECTOR DenisSokoloveurcushwakecom
LADA BELAYCHUK ASSOCIATE DIRECTOR DEPUTY RESEARCH DIRECTOR LadaBelaychukeurcushwakecom
MAXIM ILYIN CONSULTANT CAPITAL MARKETS Maximilyineurcushwakecom
ALEXANDER KUNTSEVICH ANALYST WampI PROJECT MANAGEMENT AlexanerKuntsevicheurcushwakecom
TATYANA DIVINA SENIOR ANALYST
TatyanaDivinaeurcushwakecom
wwwcushmanwakefieldcom
29
MARKETBEAT Q3 2013
СПРОС В Московском регионе за I-III кварталах 2013 г было арендовано и куплено более 850 тыс кв м качественных складских площадей из них 235 тыс в III квартале что соответствует прошлогодним показателям
Наиболее крупные сделки в минувшем квартале
Автомобильный концерн Volkswagen купил 50 тыс кв м в складском комплексе PNK Чехов 2 девелопер PNK Group
Компания Верный купила 43 тыс кв м в складском комплексе PNK Север девелопер PNK Group
Автомобильный концерн General Motors арендовала 40 тыс кв м в индустриальном комплексе Южные врата
Следует отметить что большое количество качественных складских площадей было арендовано и куплено в III квартале 2013 г производственными компаниями при этом логистиче-ские компании и дистрибьюторы наоборот купили и арендова-ли меньшее количество площадей
Так же следует отметить увеличение доли продаж в III квартале до 42 против 14 во II квартале в структуре поглощения
На региональных рынках за минувший квартал было арендовано и куплено более 85 тыс кв м всего с начала года более 250 тыс кв м что почти на 20 выше аналогичного показателя прошлого года и на 5 среднего значения за последние 5 лет Этот показатель во многом обусловлен самой крупной сделкой за всю историю рынка складской недвижимости Санкт-Петербурга по предварительной продаже 43 тыс кв м компанией PNK Group продуктовой сети laquoВерныйraquo в складском комплексе PNK КАД
Сделки на такие большие площади позволяют девелоперу возобновить строительство в регионах но за период с IV кв 2012 по III квартале 2013 г Было заключено только 4 сделки более 25 тыс кв м Большинство сделок в регионах заключает-ся на складские площади до 10 тыс кв м
STRUCTURE OF DEMAND MOSCOW СТРУКТУРА СПРОСА МОСКВА
DEMAND In the Moscow region in Q1-Q3 2013 more than 850000 sq m were rented and purchased talking about quality warehouse space The Q3 indicator is 235000 sq m which is the same to the last years performance
The largest deals in the last quarter
bull Car manufacturer group Volkswagen bought 50000 sq m in a warehouse complex PNK Chekhov 2 developer is PNK Group
bull The Verniy company bought 43000 sq m in a warehouse complex PNK North developer is PNK Group
bull Automobile сar manufacturer General Motors leased 40000 sq m in the industrial complex South Gate
It should be noted that a large number of quality warehouse space was leased and purchased in the Q3 2013 by manufacturing companies while logistics companies and distributors on the contrary have bought and rented a smaller amount of warehouse space
It should be also mentioned the increasing sales in Q3 up to 42 comparing to 14 in the previous quarter for the both leased and bought premises
At the regional markets for the last quarter it was rented and purchased more than 85000 sq m Since of the beginning of the year more than 250000 sq m were rented and purchased which is almost 20 higher than last year and 5 higher than the average number for the last 5 years This indicator is largely due to the largest deal in the history of the warehouse property market of St Petersburg on the pre-sale of 43000 sq m by PNK Group to the food supplier Verniy in the warehouse complex PNK KAD
Such large deals allow developer to resume construction in the regions However between Q4 2012 and Q3 2013 it was only 4 deals amounted more than 25000 sq m made Most of the deals in the region are for warehouse space up to 10000 sq m
ТЕНДЕНЦИИ С начала прошлого года на рынок складской недвижимости остается стабильным Ежегодный спрос в Московском регионе составляет около 1 млн кв м в год Средние ставки аренды в классе А составляют $135 за кв м в год без НДС операцион-ных расходов и коммунальных платежей доля вакантных площадей сохраняется на уровне 1 Строительство большин-ства новых складских объектов будет начинаться только после заключения предварительных договоров аренды и продажи
Изменение ситуации в ближайшей перспективе ожидать не стоит В условиях низкого роста экономики страны начинать спекулятивное строительство большой риск повторения ситуации 2008 года поэтому предложение будет подстраивать-ся под спрос
На региональных рынках продолжится тенденция увеличения дефицита готовых к въезду складских площадей Не смотря на высокой спрос на складские объекты в регионах девелоперам не удается сформировать достаточных портфель предваритель-ных договоров аренды для начала строительства Исключение составляет Санкт-Петербург Свердловская область юг России где спрос или условия рынка обеспечили девелоперам формирование такого портфеля Мы прогнозируем что до конца года в регионах будет реализовано более 300 тыс кв м складских площадей
Source Cushman amp Wakefield
STRUCTURE OF DEMAND REGIONS СТРУКТУРА СПРОСА РЕГИОНЫ
TRENDS Since the beginning of the last year the warehouse market has remained stable Annual demand in the Moscow region is about one mn sq m per year average rental rates for Class A is $135 per sq m per year excluding VAT operating expenses and utility costs the vacancy rate remains at 1 Construction of the majority of new storage facilities will start only after the preliminary lease or sale contract signing up
In the nearest future the situation would remain the same It is the huge risk to start the new speculative construction in a low-growth economic situation as it is the threaten to repeat the 2008 year crisis the supply will adapt to the demand
The trend of growing deficit of ready-to-move warehouse spaces continues at the regional markets In spite of the high demand for storage facilities in the regions for developers it is still complicated to form a sufficient portfolio of preliminary agreements for the start of construction Exceptions are St Petersburg Sverdlovsk region and south Russia where the demand or market conditions provided developers with the opportunity to form such a portfolio We predict that by the end of the year in the regions will be sold over 300000 sq m of warehouse space
WampI MARKET IN RUSSIA ETHUcircIacuteIcircEcirc NtildeEcircEumlAgraveAumlNtildeEcircEgraveOtilde IumlIcircIgraveAringUgraveAringIacuteEgraveEacute Acirc ETHIcircNtildeNtildeEgraveEgrave
VACANCY RATE (EOY) Paris (Ile de France) 89 81 99 126 102 84 81 89 804
Budapest 59 172 173 188 195 208 194 217 2283
Warsaw 89 74 112 171 194 173 146 1621 1592
Madrid 55 38 37 55 73 84 93 95 972
TAKE UP 000 SQ MParis (Ile de France) 1 005 700 640 601 814 837 563 208 58
Budapest 152 229 308 280 210 327 355 31 21
Warsaw 260 445 556 216 451 743 483 183 112
Madrid 1 225 918 630 325 390 270 225 60 47
2013
36
MARKETBEAT Q3 2013
RESEARCH DEPARTMENT IcircOgraveAumlAringEuml EgraveNtildeNtildeEumlAringAumlIcircAcircAgraveIacuteEgraveEacute
Further information and copies of this report are available from Ellina Krylova
EllinaKrylovaeurcushwakecom
The information provided in this report is intended for informational purposes only and should not be relied on by any party without further independent verification Classifications of individual buildings are reviewed on a continuing basis and are subject to change The standards used in this process are consistent with those used by Moscow Research Forum and in the United States by the Society of Industrial and Office Realtors (SIOR) and BOMA International Reproduction of this report in whole or part is permitted only with written consent of Cushman amp Wakefield Data from this report may be cited with proper acknowledgment given
copy 2013 Cushman amp Wakefield All rights reserved
MORE INFORMATION AND CONTACTS ARE AVAILABLE ON WWWMARKETBEATRU EgraveIacuteOcircIcircETHIgraveAgraveOumlEgraveszlig IcircAacute IcircOgraveAumlAringEumlAring EgraveNtildeNtildeEumlAringAumlIcircAcircAgraveIacuteEgraveEacute Egrave IumlOacuteAacuteEumlEgraveEcircAgraveOumlEgraveEgrave AumlIcircNtildeOgraveOacuteIumlIacuteUcirc IacuteAgrave WWWMARKETBEATRU
DENIS SOKOLOV PARTNER RESEARCH DIRECTOR DenisSokoloveurcushwakecom
LADA BELAYCHUK ASSOCIATE DIRECTOR DEPUTY RESEARCH DIRECTOR LadaBelaychukeurcushwakecom
MAXIM ILYIN CONSULTANT CAPITAL MARKETS Maximilyineurcushwakecom
ALEXANDER KUNTSEVICH ANALYST WampI PROJECT MANAGEMENT AlexanerKuntsevicheurcushwakecom
TATYANA DIVINA SENIOR ANALYST
TatyanaDivinaeurcushwakecom
wwwcushmanwakefieldcom
30
MARKETBEAT Q3 2013
ТЕНДЕНЦИИ С начала прошлого года на рынок складской недвижимости остается стабильным Ежегодный спрос в Московском регионе составляет около 1 млн кв м в год Средние ставки аренды в классе А составляют $135 за кв м в год без НДС операцион-ных расходов и коммунальных платежей доля вакантных площадей сохраняется на уровне 1 Строительство большин-ства новых складских объектов будет начинаться только после заключения предварительных договоров аренды и продажи
Изменение ситуации в ближайшей перспективе ожидать не стоит В условиях низкого роста экономики страны начинать спекулятивное строительство большой риск повторения ситуации 2008 года поэтому предложение будет подстраивать-ся под спрос
На региональных рынках продолжится тенденция увеличения дефицита готовых к въезду складских площадей Не смотря на высокой спрос на складские объекты в регионах девелоперам не удается сформировать достаточных портфель предваритель-ных договоров аренды для начала строительства Исключение составляет Санкт-Петербург Свердловская область юг России где спрос или условия рынка обеспечили девелоперам формирование такого портфеля Мы прогнозируем что до конца года в регионах будет реализовано более 300 тыс кв м складских площадей
Source Cushman amp Wakefield
STRUCTURE OF DEMAND REGIONS СТРУКТУРА СПРОСА РЕГИОНЫ
TRENDS Since the beginning of the last year the warehouse market has remained stable Annual demand in the Moscow region is about one mn sq m per year average rental rates for Class A is $135 per sq m per year excluding VAT operating expenses and utility costs the vacancy rate remains at 1 Construction of the majority of new storage facilities will start only after the preliminary lease or sale contract signing up
In the nearest future the situation would remain the same It is the huge risk to start the new speculative construction in a low-growth economic situation as it is the threaten to repeat the 2008 year crisis the supply will adapt to the demand
The trend of growing deficit of ready-to-move warehouse spaces continues at the regional markets In spite of the high demand for storage facilities in the regions for developers it is still complicated to form a sufficient portfolio of preliminary agreements for the start of construction Exceptions are St Petersburg Sverdlovsk region and south Russia where the demand or market conditions provided developers with the opportunity to form such a portfolio We predict that by the end of the year in the regions will be sold over 300000 sq m of warehouse space
WampI MARKET IN RUSSIA ETHUcircIacuteIcircEcirc NtildeEcircEumlAgraveAumlNtildeEcircEgraveOtilde IumlIcircIgraveAringUgraveAringIacuteEgraveEacute Acirc ETHIcircNtildeNtildeEgraveEgrave
VACANCY RATE (EOY) Paris (Ile de France) 89 81 99 126 102 84 81 89 804
Budapest 59 172 173 188 195 208 194 217 2283
Warsaw 89 74 112 171 194 173 146 1621 1592
Madrid 55 38 37 55 73 84 93 95 972
TAKE UP 000 SQ MParis (Ile de France) 1 005 700 640 601 814 837 563 208 58
Budapest 152 229 308 280 210 327 355 31 21
Warsaw 260 445 556 216 451 743 483 183 112
Madrid 1 225 918 630 325 390 270 225 60 47
2013
36
MARKETBEAT Q3 2013
RESEARCH DEPARTMENT IcircOgraveAumlAringEuml EgraveNtildeNtildeEumlAringAumlIcircAcircAgraveIacuteEgraveEacute
Further information and copies of this report are available from Ellina Krylova
EllinaKrylovaeurcushwakecom
The information provided in this report is intended for informational purposes only and should not be relied on by any party without further independent verification Classifications of individual buildings are reviewed on a continuing basis and are subject to change The standards used in this process are consistent with those used by Moscow Research Forum and in the United States by the Society of Industrial and Office Realtors (SIOR) and BOMA International Reproduction of this report in whole or part is permitted only with written consent of Cushman amp Wakefield Data from this report may be cited with proper acknowledgment given
copy 2013 Cushman amp Wakefield All rights reserved
MORE INFORMATION AND CONTACTS ARE AVAILABLE ON WWWMARKETBEATRU EgraveIacuteOcircIcircETHIgraveAgraveOumlEgraveszlig IcircAacute IcircOgraveAumlAringEumlAring EgraveNtildeNtildeEumlAringAumlIcircAcircAgraveIacuteEgraveEacute Egrave IumlOacuteAacuteEumlEgraveEcircAgraveOumlEgraveEgrave AumlIcircNtildeOgraveOacuteIumlIacuteUcirc IacuteAgrave WWWMARKETBEATRU
DENIS SOKOLOV PARTNER RESEARCH DIRECTOR DenisSokoloveurcushwakecom
LADA BELAYCHUK ASSOCIATE DIRECTOR DEPUTY RESEARCH DIRECTOR LadaBelaychukeurcushwakecom
MAXIM ILYIN CONSULTANT CAPITAL MARKETS Maximilyineurcushwakecom
ALEXANDER KUNTSEVICH ANALYST WampI PROJECT MANAGEMENT AlexanerKuntsevicheurcushwakecom
TATYANA DIVINA SENIOR ANALYST
TatyanaDivinaeurcushwakecom
wwwcushmanwakefieldcom
Q3 2013 MoscowRUSSIA A Cushman amp Wakefield Research Publication
MARKETBEAT
MARKET INDICATORS
33
MARKETBEAT Q3 2013
Q1 Q2 Q3 Q4
OFFICEStock class A 000 sq m 162 186 281 357 529 668 917 1 268 1 670 1 966 2 240 2 459 2 535 2 555 2 683Stock class B (B+ and B-) 000 sq m 2 277 2 631 3 208 3 845 4 499 5 218 6 461 8 318 9 296 9 907 10 283 10 636 10 820 10 881 10 931New Construction A 000 sq m 24 95 76 172 139 248 351 403 296 274 219 76 20 128New Construction B (B+ and B-) 000 sq m 354 577 638 653 719 1 244 1 857 978 610 376 353 182 66 121Vacancy rate class A 09 13 09 23 16 33 34 106 211 199 178 166 166 191 196Vacancy rate class B (B+ and B-) 02 03 02 19 40 29 42 60 110 114 111 114 116 115 112Take up class A 000 sq m 29 62 72 153 188 297 488 471 182 376 679 465 70 100 82Take up class B (B+ and B-) 000 sq m 244 345 571 601 791 840 1 009 1 246 552 922 1 230 1 514 343 292 307Rental rates class A $460 $480 $500 $540 $600 $710 $930 $1 090 $710 $640 $740 $790 $850 $870 $860Rental rates class B (B+ and B-) $420 $390 $390 $450 $470 $530 $630 $810 $510 $420 $460 $460 $490 $500 $500Prime capitalization rates - - - 135 125 85 75 12 13 9 85 875 850 850
VACANCY RATE (EOY) Paris (Ile de France) 89 81 99 126 102 84 81 89 804
Budapest 59 172 173 188 195 208 194 217 2283
Warsaw 89 74 112 171 194 173 146 1621 1592
Madrid 55 38 37 55 73 84 93 95 972
TAKE UP 000 SQ MParis (Ile de France) 1 005 700 640 601 814 837 563 208 58
Budapest 152 229 308 280 210 327 355 31 21
Warsaw 260 445 556 216 451 743 483 183 112
Madrid 1 225 918 630 325 390 270 225 60 47
2013
36
MARKETBEAT Q3 2013
RESEARCH DEPARTMENT IcircOgraveAumlAringEuml EgraveNtildeNtildeEumlAringAumlIcircAcircAgraveIacuteEgraveEacute
Further information and copies of this report are available from Ellina Krylova
EllinaKrylovaeurcushwakecom
The information provided in this report is intended for informational purposes only and should not be relied on by any party without further independent verification Classifications of individual buildings are reviewed on a continuing basis and are subject to change The standards used in this process are consistent with those used by Moscow Research Forum and in the United States by the Society of Industrial and Office Realtors (SIOR) and BOMA International Reproduction of this report in whole or part is permitted only with written consent of Cushman amp Wakefield Data from this report may be cited with proper acknowledgment given
copy 2013 Cushman amp Wakefield All rights reserved
MORE INFORMATION AND CONTACTS ARE AVAILABLE ON WWWMARKETBEATRU EgraveIacuteOcircIcircETHIgraveAgraveOumlEgraveszlig IcircAacute IcircOgraveAumlAringEumlAring EgraveNtildeNtildeEumlAringAumlIcircAcircAgraveIacuteEgraveEacute Egrave IumlOacuteAacuteEumlEgraveEcircAgraveOumlEgraveEgrave AumlIcircNtildeOgraveOacuteIumlIacuteUcirc IacuteAgrave WWWMARKETBEATRU
DENIS SOKOLOV PARTNER RESEARCH DIRECTOR DenisSokoloveurcushwakecom
LADA BELAYCHUK ASSOCIATE DIRECTOR DEPUTY RESEARCH DIRECTOR LadaBelaychukeurcushwakecom
MAXIM ILYIN CONSULTANT CAPITAL MARKETS Maximilyineurcushwakecom
ALEXANDER KUNTSEVICH ANALYST WampI PROJECT MANAGEMENT AlexanerKuntsevicheurcushwakecom
TATYANA DIVINA SENIOR ANALYST
TatyanaDivinaeurcushwakecom
wwwcushmanwakefieldcom
34
MARKETBEAT Q3 2013
CATEGORY QTR PROPERTY NAME MARKET OFFICE RENTABLE
SQ M
RETAIL GLA SQ M
WAREHOUSE AREA SQ M
ROOMS GRADE PRICE ESTIMATION
USD
INVESTOR NAME
SINGLE TRANSACTIONSRETAIL Q2 Aura Novosibirsk 60 439 750 RosEvroDevelopment
Q2 Mozaika (50) Moscow 68 000 100 OST Group
Q1 Metropolis Moscow 80 000 1 200 Morgan Stanley Real Estate Fund VII
Q1 Frunzensky univermag St Petersburg 5 500 125 Imperia Holding
OFFICE Q3 White Gardens Moscow 63 900 A 740 Milhouse Capital
Q3 iCube Moscow 15 256 B+ 90 O1 Properties
Q2 International Commercial bank building St Petersburg 8 000 B+ 641 Gazprom OAO
Q1 Dvintsev BC bldg B Moscow 12 003 A 675 Central Properties
Q1 Aquamarine BC Phase III (50) Moscow 55 422 A 230 AFI Developments
Q1 Olympia Park Moscow 45 966 A 350 Kaspersky Labs
Q1 White Square office center Moscow 73 526 A 1 000 O1 Properties
INDUSTRIAL Q3 Terminal SV St Petersburg 20 000 A 227 Admiral
Q1 Tomilino Moscow region 52 328 A 100 BIN Group
HOSPITALITY Q2 Renaissance Moscow Hotel Moscow 475 upscale 170 Alexander Klyachin (Azimut Hotels)
PORTFOLIO TRANSACTIONSHOSPITALITY Q2 ALROSA hotel portfolio (ALROSA na Kazachyem
Vedensky Zarnitsa Pur-Navolok Polyarnaya Zvezda)
Moscow St Petersburg Mirny Arkhangelsk Yakutsk
516 upscale 635 Nord OOO
INDUSTRIAL Q1 Eurasia Logistics portfolio (Tolmachevo Biek Tau Pyshma)
Novosibirsk Kazan Ekaterinburg
930 594 A 500 IQ Property management
APPENDIX II
Source Cushman amp Wakefield
NOTABLE INVESTMENT TRANSACTIONS IN RUSSIA IN 2013 НЕКОТОРЫЕ ИНВЕСТИЦИОННЫЕ СДЕЛКИ НА РЫНКЕ КОММЕРЧЕСКОЙ НЕДВИЖИМОСТИ РОССИИ В 2013 Г
VACANCY RATE (EOY) Paris (Ile de France) 89 81 99 126 102 84 81 89 804
Budapest 59 172 173 188 195 208 194 217 2283
Warsaw 89 74 112 171 194 173 146 1621 1592
Madrid 55 38 37 55 73 84 93 95 972
TAKE UP 000 SQ MParis (Ile de France) 1 005 700 640 601 814 837 563 208 58
Budapest 152 229 308 280 210 327 355 31 21
Warsaw 260 445 556 216 451 743 483 183 112
Madrid 1 225 918 630 325 390 270 225 60 47
2013
36
MARKETBEAT Q3 2013
RESEARCH DEPARTMENT IcircOgraveAumlAringEuml EgraveNtildeNtildeEumlAringAumlIcircAcircAgraveIacuteEgraveEacute
Further information and copies of this report are available from Ellina Krylova
EllinaKrylovaeurcushwakecom
The information provided in this report is intended for informational purposes only and should not be relied on by any party without further independent verification Classifications of individual buildings are reviewed on a continuing basis and are subject to change The standards used in this process are consistent with those used by Moscow Research Forum and in the United States by the Society of Industrial and Office Realtors (SIOR) and BOMA International Reproduction of this report in whole or part is permitted only with written consent of Cushman amp Wakefield Data from this report may be cited with proper acknowledgment given
copy 2013 Cushman amp Wakefield All rights reserved
MORE INFORMATION AND CONTACTS ARE AVAILABLE ON WWWMARKETBEATRU EgraveIacuteOcircIcircETHIgraveAgraveOumlEgraveszlig IcircAacute IcircOgraveAumlAringEumlAring EgraveNtildeNtildeEumlAringAumlIcircAcircAgraveIacuteEgraveEacute Egrave IumlOacuteAacuteEumlEgraveEcircAgraveOumlEgraveEgrave AumlIcircNtildeOgraveOacuteIumlIacuteUcirc IacuteAgrave WWWMARKETBEATRU
DENIS SOKOLOV PARTNER RESEARCH DIRECTOR DenisSokoloveurcushwakecom
LADA BELAYCHUK ASSOCIATE DIRECTOR DEPUTY RESEARCH DIRECTOR LadaBelaychukeurcushwakecom
MAXIM ILYIN CONSULTANT CAPITAL MARKETS Maximilyineurcushwakecom
ALEXANDER KUNTSEVICH ANALYST WampI PROJECT MANAGEMENT AlexanerKuntsevicheurcushwakecom
TATYANA DIVINA SENIOR ANALYST
TatyanaDivinaeurcushwakecom
wwwcushmanwakefieldcom
35
MARKETBEAT Q3 2013
APPENDIX III
Source Cushman amp Wakefield
PROPERTY MARKET INDICATORS IN KEY EUROPEAN MARKETS ИНДИКАТОРЫ РЫНКА НЕДВИЖИМОСТИ В НЕКОТОРЫХ СТРАНАХ ЕВРОПЫ
VACANCY RATE (EOY) Paris (Ile de France) 89 81 99 126 102 84 81 89 804
Budapest 59 172 173 188 195 208 194 217 2283
Warsaw 89 74 112 171 194 173 146 1621 1592
Madrid 55 38 37 55 73 84 93 95 972
TAKE UP 000 SQ MParis (Ile de France) 1 005 700 640 601 814 837 563 208 58
Budapest 152 229 308 280 210 327 355 31 21
Warsaw 260 445 556 216 451 743 483 183 112
Madrid 1 225 918 630 325 390 270 225 60 47
2013
36
MARKETBEAT Q3 2013
RESEARCH DEPARTMENT IcircOgraveAumlAringEuml EgraveNtildeNtildeEumlAringAumlIcircAcircAgraveIacuteEgraveEacute
Further information and copies of this report are available from Ellina Krylova
EllinaKrylovaeurcushwakecom
The information provided in this report is intended for informational purposes only and should not be relied on by any party without further independent verification Classifications of individual buildings are reviewed on a continuing basis and are subject to change The standards used in this process are consistent with those used by Moscow Research Forum and in the United States by the Society of Industrial and Office Realtors (SIOR) and BOMA International Reproduction of this report in whole or part is permitted only with written consent of Cushman amp Wakefield Data from this report may be cited with proper acknowledgment given
copy 2013 Cushman amp Wakefield All rights reserved
MORE INFORMATION AND CONTACTS ARE AVAILABLE ON WWWMARKETBEATRU EgraveIacuteOcircIcircETHIgraveAgraveOumlEgraveszlig IcircAacute IcircOgraveAumlAringEumlAring EgraveNtildeNtildeEumlAringAumlIcircAcircAgraveIacuteEgraveEacute Egrave IumlOacuteAacuteEumlEgraveEcircAgraveOumlEgraveEgrave AumlIcircNtildeOgraveOacuteIumlIacuteUcirc IacuteAgrave WWWMARKETBEATRU
DENIS SOKOLOV PARTNER RESEARCH DIRECTOR DenisSokoloveurcushwakecom
LADA BELAYCHUK ASSOCIATE DIRECTOR DEPUTY RESEARCH DIRECTOR LadaBelaychukeurcushwakecom
MAXIM ILYIN CONSULTANT CAPITAL MARKETS Maximilyineurcushwakecom
ALEXANDER KUNTSEVICH ANALYST WampI PROJECT MANAGEMENT AlexanerKuntsevicheurcushwakecom
TATYANA DIVINA SENIOR ANALYST
TatyanaDivinaeurcushwakecom
wwwcushmanwakefieldcom
36
MARKETBEAT Q3 2013
RESEARCH DEPARTMENT IcircOgraveAumlAringEuml EgraveNtildeNtildeEumlAringAumlIcircAcircAgraveIacuteEgraveEacute
Further information and copies of this report are available from Ellina Krylova
EllinaKrylovaeurcushwakecom
The information provided in this report is intended for informational purposes only and should not be relied on by any party without further independent verification Classifications of individual buildings are reviewed on a continuing basis and are subject to change The standards used in this process are consistent with those used by Moscow Research Forum and in the United States by the Society of Industrial and Office Realtors (SIOR) and BOMA International Reproduction of this report in whole or part is permitted only with written consent of Cushman amp Wakefield Data from this report may be cited with proper acknowledgment given
copy 2013 Cushman amp Wakefield All rights reserved
MORE INFORMATION AND CONTACTS ARE AVAILABLE ON WWWMARKETBEATRU EgraveIacuteOcircIcircETHIgraveAgraveOumlEgraveszlig IcircAacute IcircOgraveAumlAringEumlAring EgraveNtildeNtildeEumlAringAumlIcircAcircAgraveIacuteEgraveEacute Egrave IumlOacuteAacuteEumlEgraveEcircAgraveOumlEgraveEgrave AumlIcircNtildeOgraveOacuteIumlIacuteUcirc IacuteAgrave WWWMARKETBEATRU
DENIS SOKOLOV PARTNER RESEARCH DIRECTOR DenisSokoloveurcushwakecom
LADA BELAYCHUK ASSOCIATE DIRECTOR DEPUTY RESEARCH DIRECTOR LadaBelaychukeurcushwakecom
MAXIM ILYIN CONSULTANT CAPITAL MARKETS Maximilyineurcushwakecom
ALEXANDER KUNTSEVICH ANALYST WampI PROJECT MANAGEMENT AlexanerKuntsevicheurcushwakecom