marriott international, inc. report - ingotbrokers.com.au filecompany general overview marriott...
TRANSCRIPT
Marriott International, Inc.
Report
Company General Overview
Marriott International, Inc., incorporated on September 19, 1997, is a diversified global lodging company
which operates in the Hotels and Entertainment services industry.
The Company is an operator, franchisor and licensor of hotels and timeshare properties across the world
with its headquarters in the United States of America.
The Company also operates markets and develops residential properties and provides services to
home/condominium owner associations.
The Company operates through three segments: North American Full-Service, North American Limited-
Service and International.
The North American Full-Service segment’s hotels include Marriott Hotels, Marriott Conference Centers,
JW Marriott, Renaissance Hotels, Renaissance ClubSport, Gaylord Hotels, Autograph Collection Hotels,
The Ritz-Carlton, The Ritz-Carlton Residences and EDITION Residences located in the United States and
Canada, the company also operates Delta Hotels and Resorts brand.
The North American Limited-Service segment includes AC Hotels by Marriott, Courtyard, Residence Inn,
SpringHill Suites, Fairfield Inn & Suites and TownePlace Suites properties, located in the United States
and Canada.
The International segment includes The Ritz-Carlton, Bulgari Hotels & Resorts, EDITION, JW Marriott,
Autograph Collection Hotels, Renaissance Hotels, Marriott Hotels, Marriott Executive Apartments, AC
Hotels by Marriott, Courtyard, Residence Inn, SpringHill Suites, Fairfield Inn & Suites, TownePlace Suites,
Protea Hotels and Moxy Hotels located outside the United States and Canada.
General Stock Information:
Stock Quote: MAR
52 Week’s High: 84.33$, As of April. 2016
52 Weeks’s Low: 56.43$, As of April. 2016
Stock Beta: 1.26, As of April. 2016
Market Cap: 16.92B, As of April. 2016
Executive Committee and Equity distribution:
As of March 2016 the executive committee and the majority shareholders equity are as follows:
Name Current Position Years in Position
Mr. John (Bill) Marriott Jr. Executive Chairman of the Board 4 Years
Mr. Arne Sorenson President, Chief Executive Officer, Director 4 Years
Ms. Kathleen Oberg Chief Financial Officer, Executive Vice President Less than a year
Simon Cooper President and Managing Director, Asia Pacific 6 Years
Mr. Alex Kyriakidis President and Managing Director, Middle East and Africa 4 Years
Ms. Amy McPherson President and Managing Director, Europe 7 Years
72.43% of the Marriott International, Inc. shares are freely floating in the market, however 57.17% of
the remaining 27.75% is owned by family members and strategic institutional investors.
Investor’s Name Percent Owned Shares Owned Turn Over
Marriott (John Willard Jr) 16.71% 42.37M Low
Marriott (Richard E) 9.49% 24.06M Low
T.RowePrice Associates, Inc. 6.39% 16.20M Low
The Vanguard Group, Inc. 6.09% 15.43M Low
Jennison Associates, LLC 5.81% 14.74M Low
Fidelity Management & Research Company 3.75% 9.50M Low
BlackRock Institutional Trust Company, N.A. 3.16% 8.01M Low
State Street Global Advisors (US) 3.11% 7.89M Low
Morgan Stanly Investment Management Inc. 1.42% 3.61M Low
Two Sigma Investments, LP 1.24% 3.15M High
Sector Overview
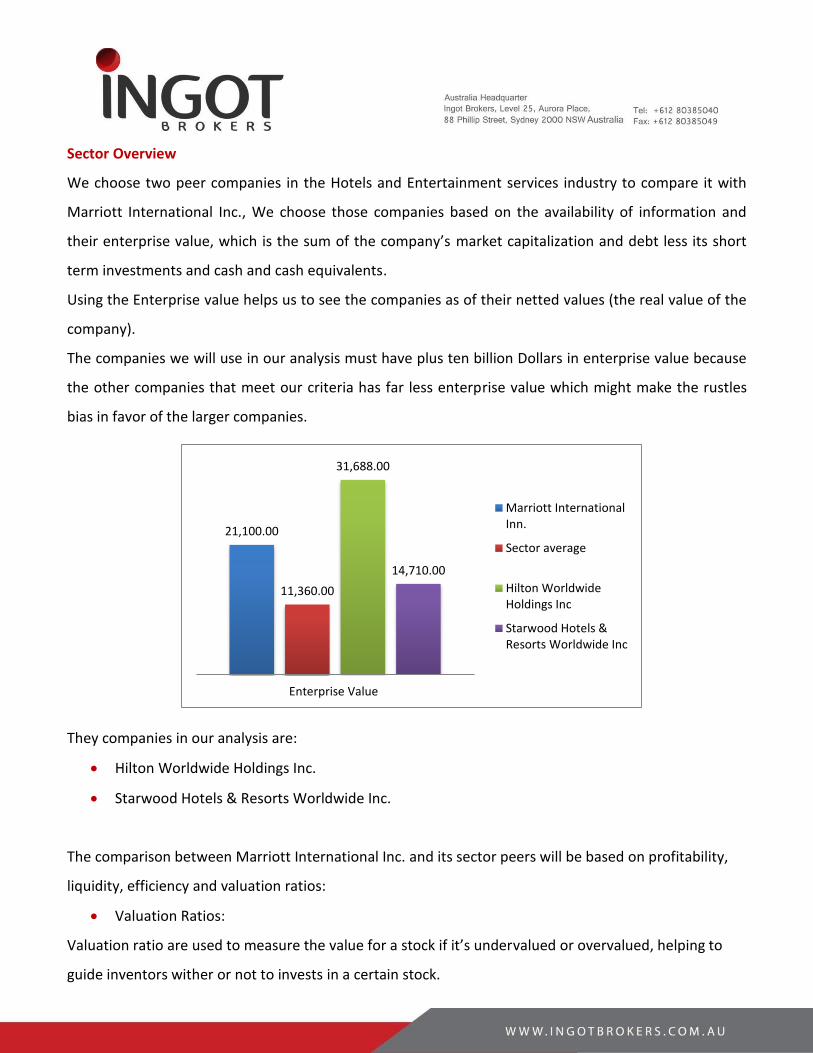
We choose two peer companies in the Hotels and Entertainment services industry to compare it with
Marriott International Inc., We choose those companies based on the availability of information and
their enterprise value, which is the sum of the company’s market capitalization and debt less its short
term investments and cash and cash equivalents.
Using the Enterprise value helps us to see the companies as of their netted values (the real value of the
company).
The companies we will use in our analysis must have plus ten billion Dollars in enterprise value because
the other companies that meet our criteria has far less enterprise value which might make the rustles
bias in favor of the larger companies.
They companies in our analysis are:
Hilton Worldwide Holdings Inc.
Starwood Hotels & Resorts Worldwide Inc.
The comparison between Marriott International Inc. and its sector peers will be based on profitability,
liquidity, efficiency and valuation ratios:
Valuation Ratios:
Valuation ratio are used to measure the value for a stock if it’s undervalued or overvalued, helping to
guide inventors wither or not to invests in a certain stock.
21,100.00
11,360.00
31,688.00
14,710.00
Enterprise Value
Marriott InternationalInn.
Sector average
Hilton WorldwideHoldings Inc
Starwood Hotels &Resorts Worldwide Inc
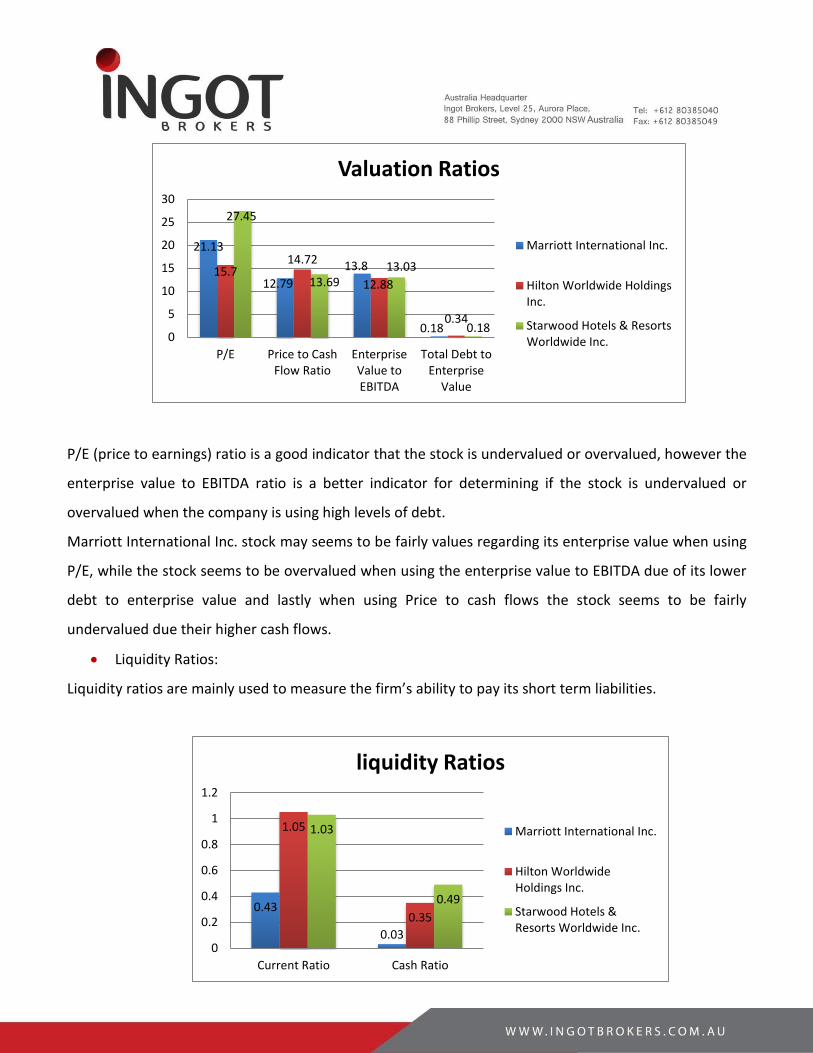
P/E (price to earnings) ratio is a good indicator that the stock is undervalued or overvalued, however the
enterprise value to EBITDA ratio is a better indicator for determining if the stock is undervalued or
overvalued when the company is using high levels of debt.
Marriott International Inc. stock may seems to be fairly values regarding its enterprise value when using
P/E, while the stock seems to be overvalued when using the enterprise value to EBITDA due of its lower
debt to enterprise value and lastly when using Price to cash flows the stock seems to be fairly
undervalued due their higher cash flows.
Liquidity Ratios:
Liquidity ratios are mainly used to measure the firm’s ability to pay its short term liabilities.
21.13
12.79
13.8
0.18
15.714.72
12.88
0.34
27.45
13.6913.03
0.180
5
10
15
20
25
30
P/E Price to CashFlow Ratio
EnterpriseValue toEBITDA
Total Debt toEnterprise
Value
Valuation Ratios
Marriott International Inc.
Hilton Worldwide HoldingsInc.
Starwood Hotels & ResortsWorldwide Inc.
0.43
0.03
1.05
0.35
1.03
0.49
0
0.2
0.4
0.6
0.8
1
1.2
Current Ratio Cash Ratio
liquidity Ratios
Marriott International Inc.
Hilton WorldwideHoldings Inc.
Starwood Hotels &Resorts Worldwide Inc.
The current and cash ratios indicate that the company may be in a bad liquidity positions while
comparing it to its peers, however the low current asset due the negative working capital that Marriott
International Inc. is running and focus on higher free cash flows may indicate otherwise.
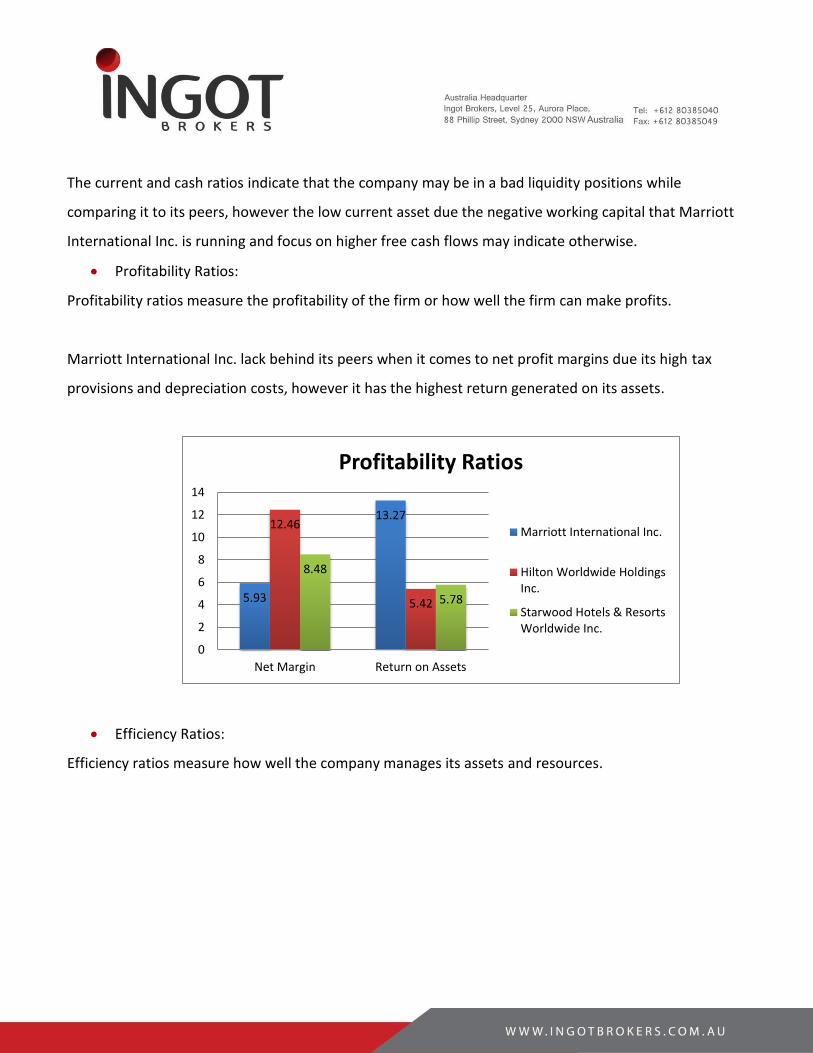
Profitability Ratios:
Profitability ratios measure the profitability of the firm or how well the firm can make profits.
Marriott International Inc. lack behind its peers when it comes to net profit margins due its high tax
provisions and depreciation costs, however it has the highest return generated on its assets.
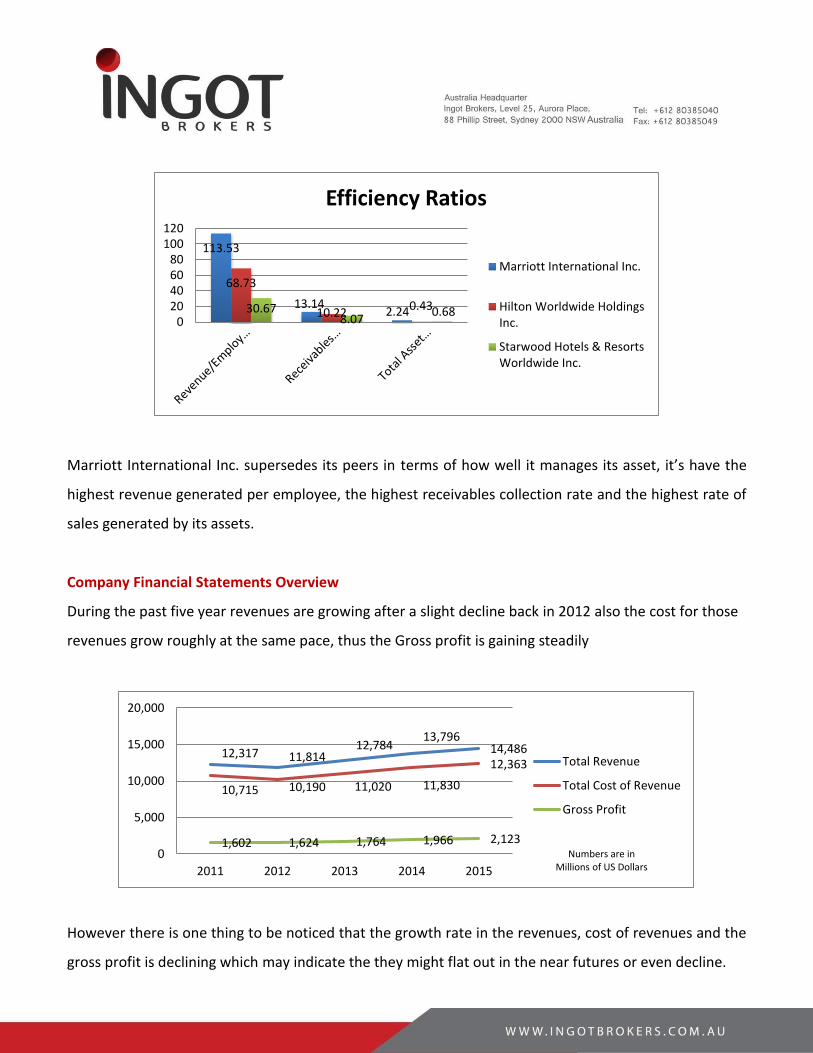
Efficiency Ratios:
Efficiency ratios measure how well the company manages its assets and resources.
5.93
13.2712.46
5.42
8.48
5.78
0
2
4
6
8
10
12
14
Net Margin Return on Assets
Profitability Ratios
Marriott International Inc.
Hilton Worldwide HoldingsInc.
Starwood Hotels & ResortsWorldwide Inc.
12,317 11,81412,784
13,79614,486
10,715 10,190 11,020 11,830
12,363
1,602 1,624 1,764 1,966 2,1230
5,000
10,000
15,000
20,000
2011 2012 2013 2014 2015
Numbers are in Millions of US Dollars
Total Revenue
Total Cost of Revenue
Gross Profit
Marriott International Inc. supersedes its peers in terms of how well it manages its asset, it’s have the
highest revenue generated per employee, the highest receivables collection rate and the highest rate of
sales generated by its assets.
Company Financial Statements Overview
During the past five year revenues are growing after a slight decline back in 2012 also the cost for those
revenues grow roughly at the same pace, thus the Gross profit is gaining steadily
However there is one thing to be noticed that the growth rate in the revenues, cost of revenues and the
gross profit is declining which may indicate the they might flat out in the near futures or even decline.
113.53
13.142.24
68.73
10.220.4330.67
8.070.68
020406080
100120
Efficiency Ratios
Marriott International Inc.
Hilton Worldwide HoldingsInc.
Starwood Hotels & ResortsWorldwide Inc.
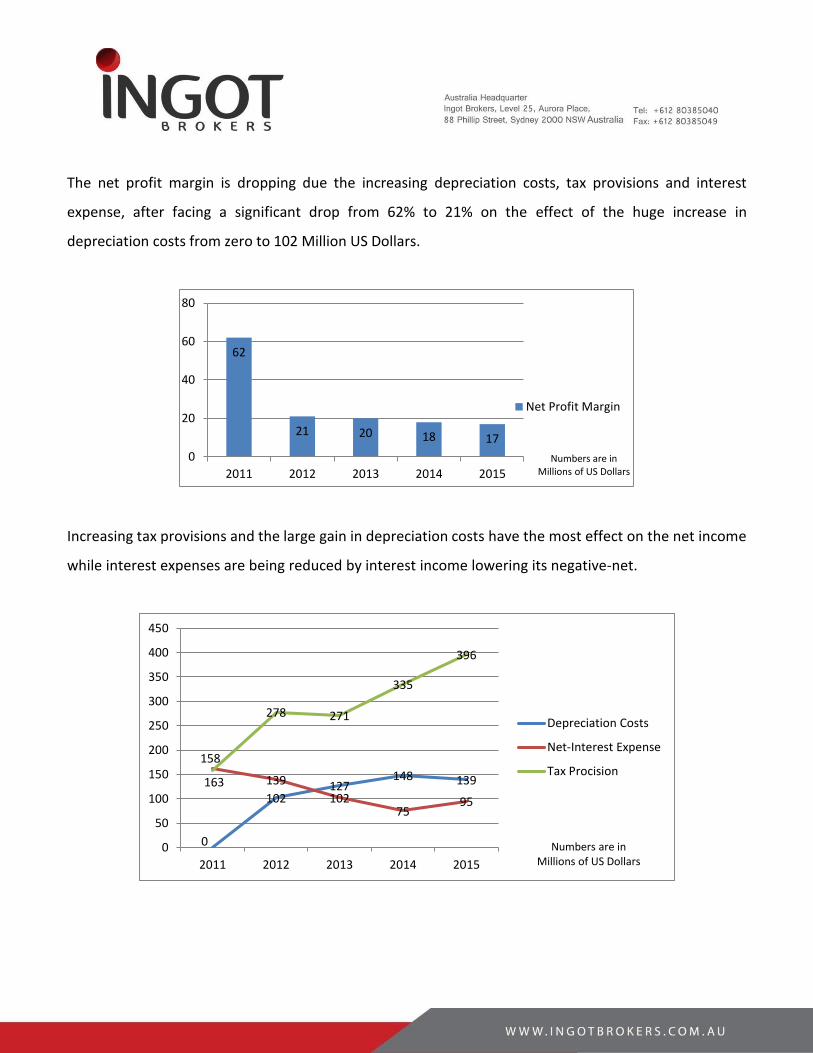
The net profit margin is dropping due the increasing depreciation costs, tax provisions and interest
expense, after facing a significant drop from 62% to 21% on the effect of the huge increase in
depreciation costs from zero to 102 Million US Dollars.
Increasing tax provisions and the large gain in depreciation costs have the most effect on the net income
while interest expenses are being reduced by interest income lowering its negative-net.
62
21 20 18 17
0
20
40
60
80
2011 2012 2013 2014 2015Numbers are in
Millions of US Dollars
Net Profit Margin
0
102127
148 139163 139
10275
95
158
278 271
335
396
0
50
100
150
200
250
300
350
400
450
2011 2012 2013 2014 2015
Numbers are in Millions of US Dollars
Depreciation Costs
Net-Interest Expense
Tax Procision
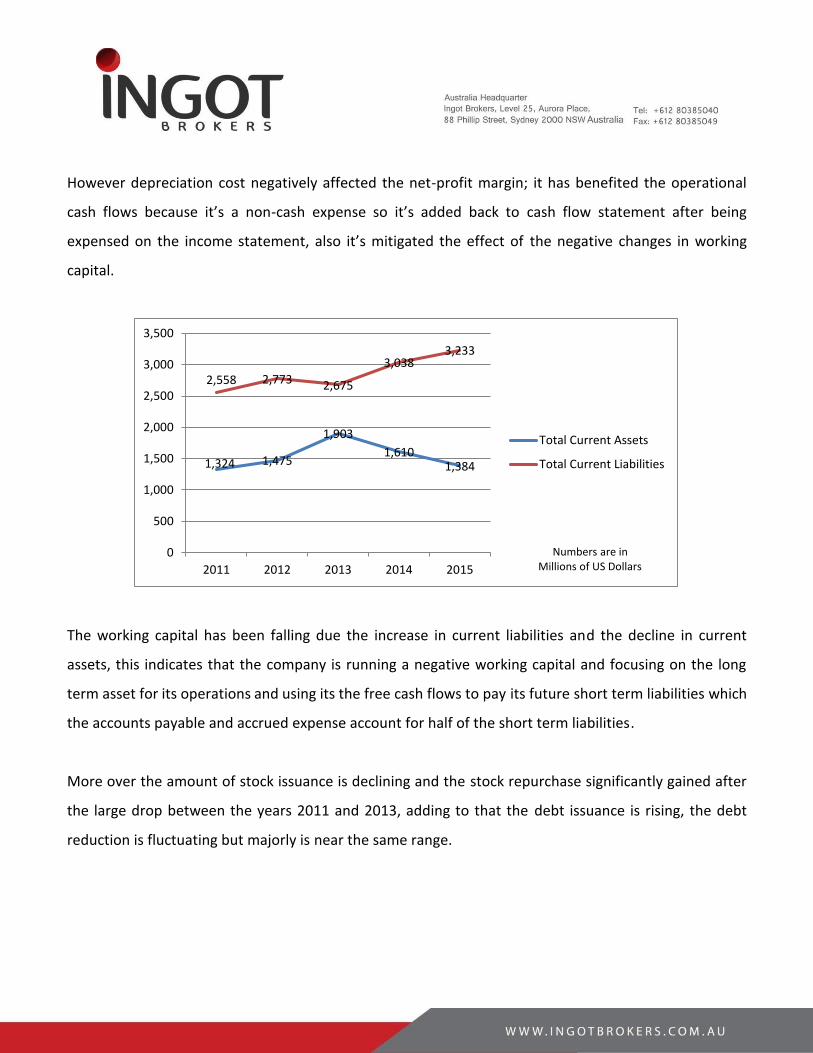
However depreciation cost negatively affected the net-profit margin; it has benefited the operational
cash flows because it’s a non-cash expense so it’s added back to cash flow statement after being
expensed on the income statement, also it’s mitigated the effect of the negative changes in working
capital.
The working capital has been falling due the increase in current liabilities and the decline in current
assets, this indicates that the company is running a negative working capital and focusing on the long
term asset for its operations and using its the free cash flows to pay its future short term liabilities which
the accounts payable and accrued expense account for half of the short term liabilities.
More over the amount of stock issuance is declining and the stock repurchase significantly gained after
the large drop between the years 2011 and 2013, adding to that the debt issuance is rising, the debt
reduction is fluctuating but majorly is near the same range.
1,324 1,475
1,903
1,6101,384
2,558 2,773 2,675
3,0383,233
0
500
1,000
1,500
2,000
2,500
3,000
3,500
2011 2012 2013 2014 2015
Numbers are in Millions of US Dollars
Total Current Assets
Total Current Liabilities
Future forecast
On the 8th of April 2016 Marriott International Inc. and Starwood Hotels and Resorts Worldwide Inc.
shareholders votes to approve merger, which may results in a new giant in the hotels and entertainment
services industry with a market cap that supersedes the Hilton’s Worldwide Holdings Inc. 22.07 Billion
Dollars market cap.
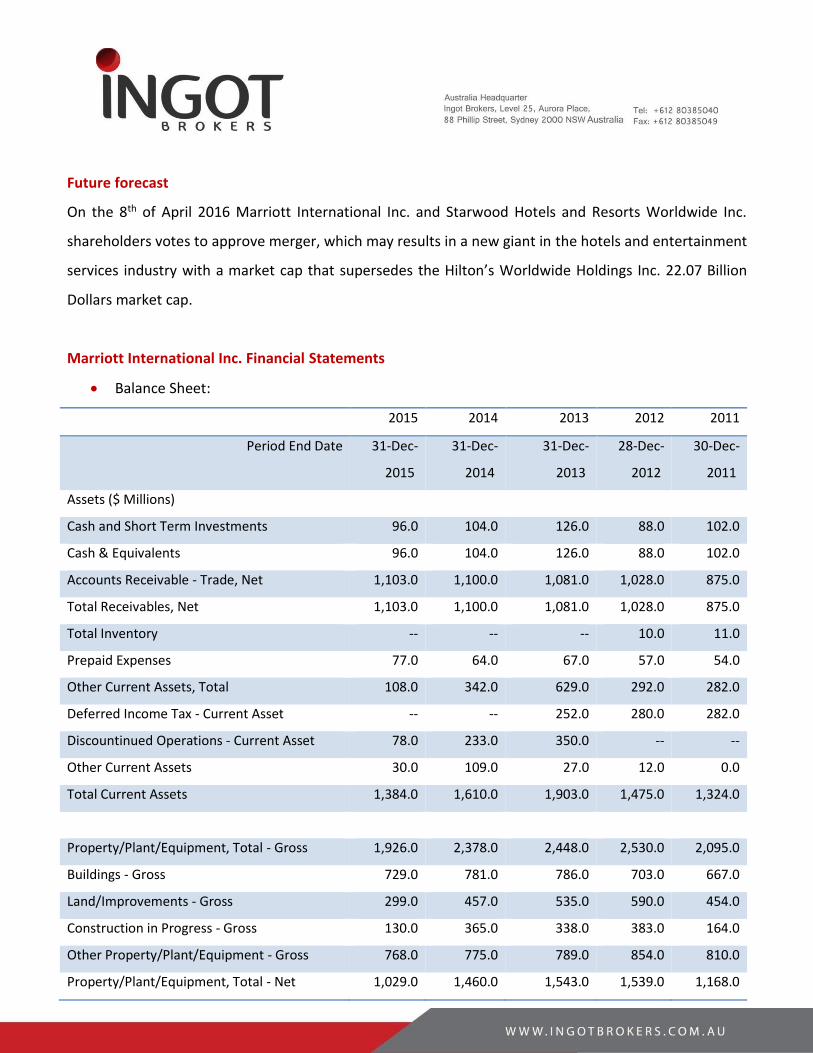
Marriott International Inc. Financial Statements
Balance Sheet:
2015 2014 2013 2012 2011
Period End Date 31-Dec-
2015
31-Dec-
2014
31-Dec-
2013
28-Dec-
2012
30-Dec-
2011
Assets ($ Millions)
Cash and Short Term Investments 96.0 104.0 126.0 88.0 102.0
Cash & Equivalents 96.0 104.0 126.0 88.0 102.0
Accounts Receivable - Trade, Net 1,103.0 1,100.0 1,081.0 1,028.0 875.0
Total Receivables, Net 1,103.0 1,100.0 1,081.0 1,028.0 875.0
Total Inventory -- -- -- 10.0 11.0
Prepaid Expenses 77.0 64.0 67.0 57.0 54.0
Other Current Assets, Total 108.0 342.0 629.0 292.0 282.0
Deferred Income Tax - Current Asset -- -- 252.0 280.0 282.0
Discountinued Operations - Current Asset 78.0 233.0 350.0 -- --
Other Current Assets 30.0 109.0 27.0 12.0 0.0
Total Current Assets 1,384.0 1,610.0 1,903.0 1,475.0 1,324.0
Property/Plant/Equipment, Total - Gross 1,926.0 2,378.0 2,448.0 2,530.0 2,095.0
Buildings - Gross 729.0 781.0 786.0 703.0 667.0
Land/Improvements - Gross 299.0 457.0 535.0 590.0 454.0
Construction in Progress - Gross 130.0 365.0 338.0 383.0 164.0
Other Property/Plant/Equipment - Gross 768.0 775.0 789.0 854.0 810.0
Property/Plant/Equipment, Total - Net 1,029.0 1,460.0 1,543.0 1,539.0 1,168.0
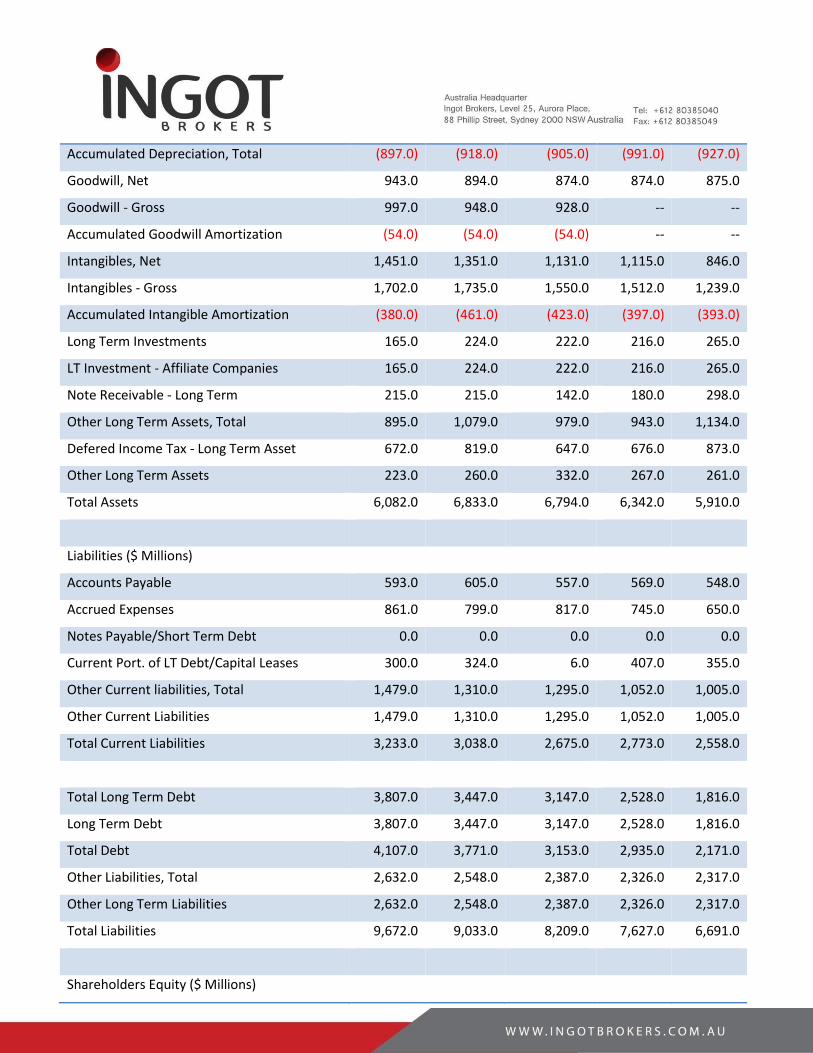
Accumulated Depreciation, Total (897.0) (918.0) (905.0) (991.0) (927.0)
Goodwill, Net 943.0 894.0 874.0 874.0 875.0
Goodwill - Gross 997.0 948.0 928.0 -- --
Accumulated Goodwill Amortization (54.0) (54.0) (54.0) -- --
Intangibles, Net 1,451.0 1,351.0 1,131.0 1,115.0 846.0
Intangibles - Gross 1,702.0 1,735.0 1,550.0 1,512.0 1,239.0
Accumulated Intangible Amortization (380.0) (461.0) (423.0) (397.0) (393.0)
Long Term Investments 165.0 224.0 222.0 216.0 265.0
LT Investment - Affiliate Companies 165.0 224.0 222.0 216.0 265.0
Note Receivable - Long Term 215.0 215.0 142.0 180.0 298.0
Other Long Term Assets, Total 895.0 1,079.0 979.0 943.0 1,134.0
Defered Income Tax - Long Term Asset 672.0 819.0 647.0 676.0 873.0
Other Long Term Assets 223.0 260.0 332.0 267.0 261.0
Total Assets 6,082.0 6,833.0 6,794.0 6,342.0 5,910.0
Liabilities ($ Millions)
Accounts Payable 593.0 605.0 557.0 569.0 548.0
Accrued Expenses 861.0 799.0 817.0 745.0 650.0
Notes Payable/Short Term Debt 0.0 0.0 0.0 0.0 0.0
Current Port. of LT Debt/Capital Leases 300.0 324.0 6.0 407.0 355.0
Other Current liabilities, Total 1,479.0 1,310.0 1,295.0 1,052.0 1,005.0
Other Current Liabilities 1,479.0 1,310.0 1,295.0 1,052.0 1,005.0
Total Current Liabilities 3,233.0 3,038.0 2,675.0 2,773.0 2,558.0
Total Long Term Debt 3,807.0 3,447.0 3,147.0 2,528.0 1,816.0
Long Term Debt 3,807.0 3,447.0 3,147.0 2,528.0 1,816.0
Total Debt 4,107.0 3,771.0 3,153.0 2,935.0 2,171.0
Other Liabilities, Total 2,632.0 2,548.0 2,387.0 2,326.0 2,317.0
Other Long Term Liabilities 2,632.0 2,548.0 2,387.0 2,326.0 2,317.0
Total Liabilities 9,672.0 9,033.0 8,209.0 7,627.0 6,691.0
Shareholders Equity ($ Millions)
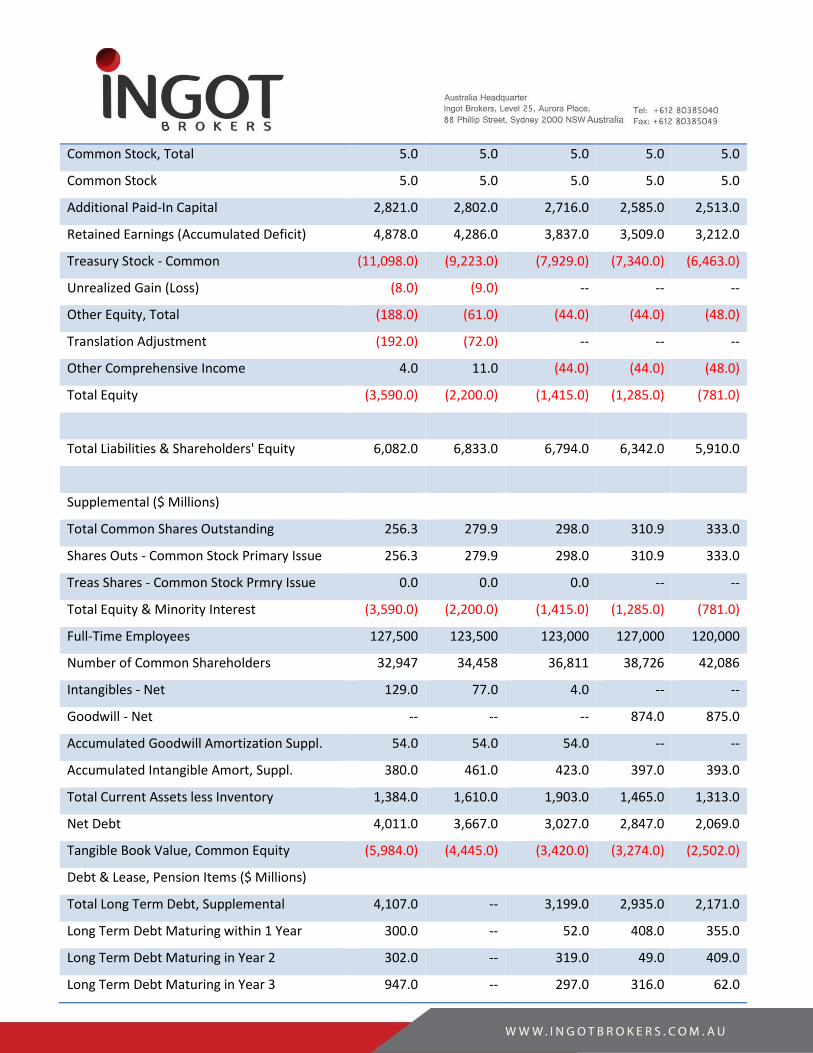
Common Stock, Total 5.0 5.0 5.0 5.0 5.0
Common Stock 5.0 5.0 5.0 5.0 5.0
Additional Paid-In Capital 2,821.0 2,802.0 2,716.0 2,585.0 2,513.0
Retained Earnings (Accumulated Deficit) 4,878.0 4,286.0 3,837.0 3,509.0 3,212.0
Treasury Stock - Common (11,098.0) (9,223.0) (7,929.0) (7,340.0) (6,463.0)
Unrealized Gain (Loss) (8.0) (9.0) -- -- --
Other Equity, Total (188.0) (61.0) (44.0) (44.0) (48.0)
Translation Adjustment (192.0) (72.0) -- -- --
Other Comprehensive Income 4.0 11.0 (44.0) (44.0) (48.0)
Total Equity (3,590.0) (2,200.0) (1,415.0) (1,285.0) (781.0)
Total Liabilities & Shareholders' Equity 6,082.0 6,833.0 6,794.0 6,342.0 5,910.0
Supplemental ($ Millions)
Total Common Shares Outstanding 256.3 279.9 298.0 310.9 333.0
Shares Outs - Common Stock Primary Issue 256.3 279.9 298.0 310.9 333.0
Treas Shares - Common Stock Prmry Issue 0.0 0.0 0.0 -- --
Total Equity & Minority Interest (3,590.0) (2,200.0) (1,415.0) (1,285.0) (781.0)
Full-Time Employees 127,500 123,500 123,000 127,000 120,000
Number of Common Shareholders 32,947 34,458 36,811 38,726 42,086
Intangibles - Net 129.0 77.0 4.0 -- --
Goodwill - Net -- -- -- 874.0 875.0
Accumulated Goodwill Amortization Suppl. 54.0 54.0 54.0 -- --
Accumulated Intangible Amort, Suppl. 380.0 461.0 423.0 397.0 393.0
Total Current Assets less Inventory 1,384.0 1,610.0 1,903.0 1,465.0 1,313.0
Net Debt 4,011.0 3,667.0 3,027.0 2,847.0 2,069.0
Tangible Book Value, Common Equity (5,984.0) (4,445.0) (3,420.0) (3,274.0) (2,502.0)
Debt & Lease, Pension Items ($ Millions)
Total Long Term Debt, Supplemental 4,107.0 -- 3,199.0 2,935.0 2,171.0
Long Term Debt Maturing within 1 Year 300.0 -- 52.0 408.0 355.0
Long Term Debt Maturing in Year 2 302.0 -- 319.0 49.0 409.0
Long Term Debt Maturing in Year 3 947.0 -- 297.0 316.0 62.0
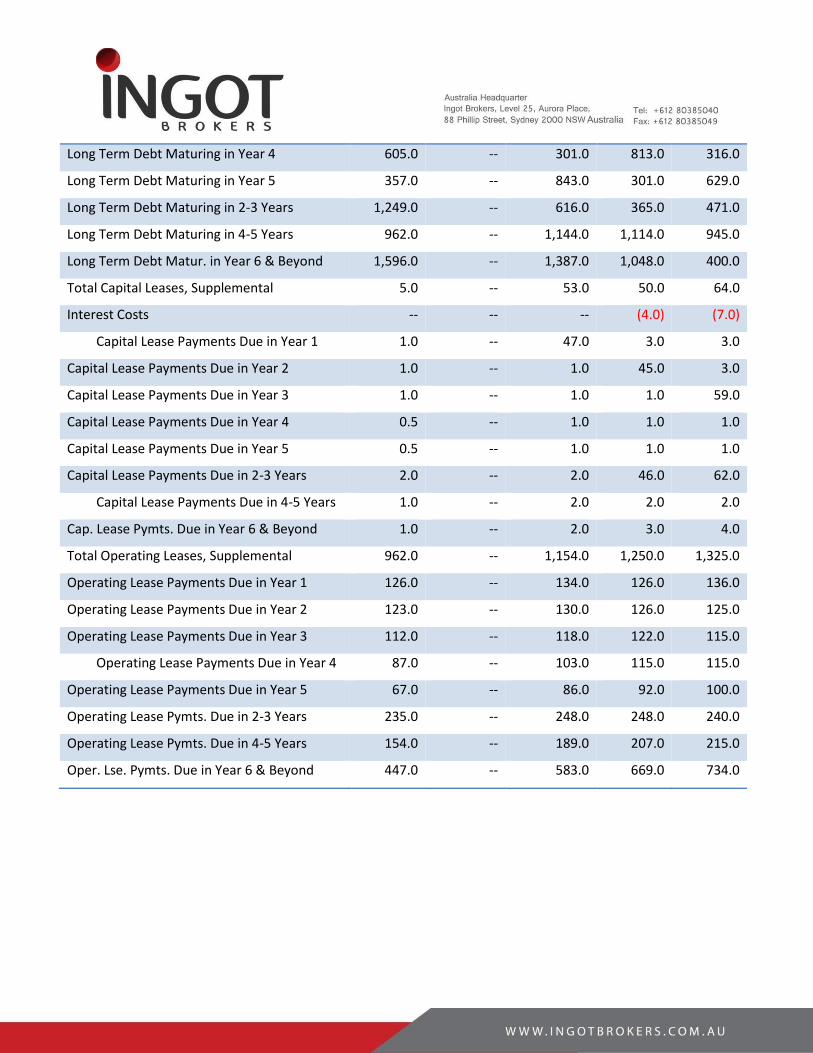
Long Term Debt Maturing in Year 4 605.0 -- 301.0 813.0 316.0
Long Term Debt Maturing in Year 5 357.0 -- 843.0 301.0 629.0
Long Term Debt Maturing in 2-3 Years 1,249.0 -- 616.0 365.0 471.0
Long Term Debt Maturing in 4-5 Years 962.0 -- 1,144.0 1,114.0 945.0
Long Term Debt Matur. in Year 6 & Beyond 1,596.0 -- 1,387.0 1,048.0 400.0
Total Capital Leases, Supplemental 5.0 -- 53.0 50.0 64.0
Interest Costs -- -- -- (4.0) (7.0)
Capital Lease Payments Due in Year 1 1.0 -- 47.0 3.0 3.0
Capital Lease Payments Due in Year 2 1.0 -- 1.0 45.0 3.0
Capital Lease Payments Due in Year 3 1.0 -- 1.0 1.0 59.0
Capital Lease Payments Due in Year 4 0.5 -- 1.0 1.0 1.0
Capital Lease Payments Due in Year 5 0.5 -- 1.0 1.0 1.0
Capital Lease Payments Due in 2-3 Years 2.0 -- 2.0 46.0 62.0
Capital Lease Payments Due in 4-5 Years 1.0 -- 2.0 2.0 2.0
Cap. Lease Pymts. Due in Year 6 & Beyond 1.0 -- 2.0 3.0 4.0
Total Operating Leases, Supplemental 962.0 -- 1,154.0 1,250.0 1,325.0
Operating Lease Payments Due in Year 1 126.0 -- 134.0 126.0 136.0
Operating Lease Payments Due in Year 2 123.0 -- 130.0 126.0 125.0
Operating Lease Payments Due in Year 3 112.0 -- 118.0 122.0 115.0
Operating Lease Payments Due in Year 4 87.0 -- 103.0 115.0 115.0
Operating Lease Payments Due in Year 5 67.0 -- 86.0 92.0 100.0
Operating Lease Pymts. Due in 2-3 Years 235.0 -- 248.0 248.0 240.0
Operating Lease Pymts. Due in 4-5 Years 154.0 -- 189.0 207.0 215.0
Oper. Lse. Pymts. Due in Year 6 & Beyond 447.0 -- 583.0 669.0 734.0
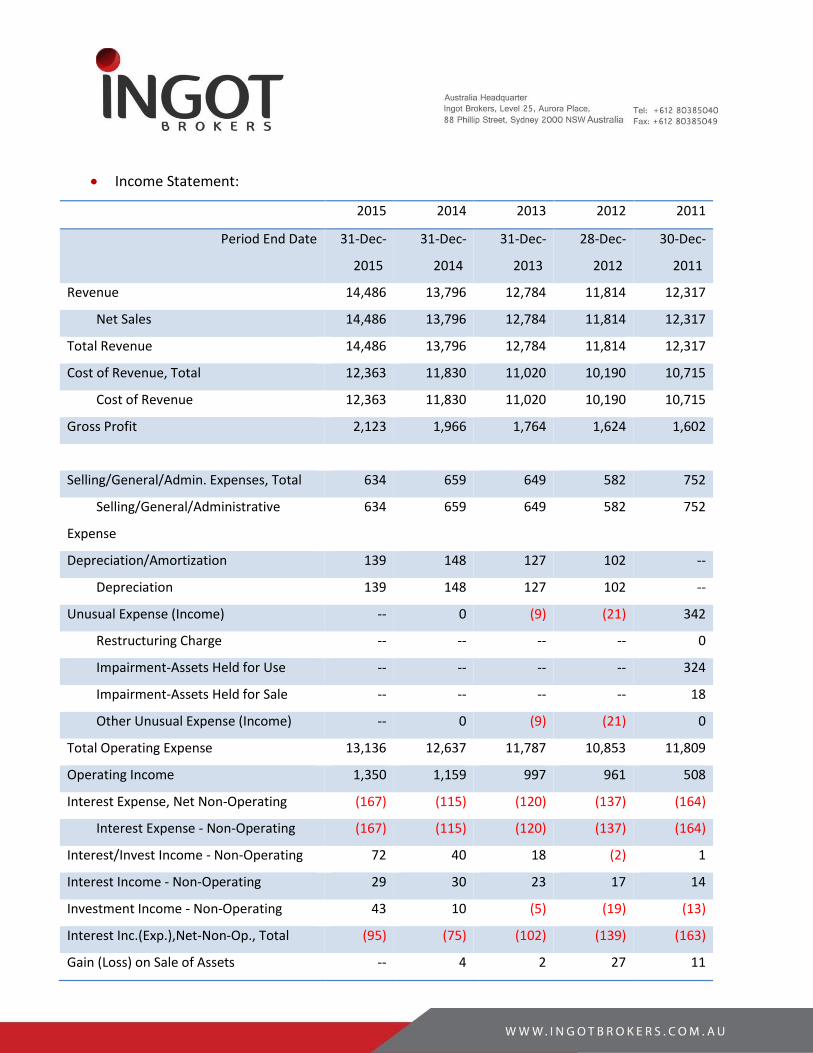
Income Statement:
2015 2014 2013 2012 2011
Period End Date 31-Dec-
2015
31-Dec-
2014
31-Dec-
2013
28-Dec-
2012
30-Dec-
2011
Revenue 14,486 13,796 12,784 11,814 12,317
Net Sales 14,486 13,796 12,784 11,814 12,317
Total Revenue 14,486 13,796 12,784 11,814 12,317
Cost of Revenue, Total 12,363 11,830 11,020 10,190 10,715
Cost of Revenue 12,363 11,830 11,020 10,190 10,715
Gross Profit 2,123 1,966 1,764 1,624 1,602
Selling/General/Admin. Expenses, Total 634 659 649 582 752
Selling/General/Administrative
Expense
634 659 649 582 752
Depreciation/Amortization 139 148 127 102 --
Depreciation 139 148 127 102 --
Unusual Expense (Income) -- 0 (9) (21) 342
Restructuring Charge -- -- -- -- 0
Impairment-Assets Held for Use -- -- -- -- 324
Impairment-Assets Held for Sale -- -- -- -- 18
Other Unusual Expense (Income) -- 0 (9) (21) 0
Total Operating Expense 13,136 12,637 11,787 10,853 11,809
Operating Income 1,350 1,159 997 961 508
Interest Expense, Net Non-Operating (167) (115) (120) (137) (164)
Interest Expense - Non-Operating (167) (115) (120) (137) (164)
Interest/Invest Income - Non-Operating 72 40 18 (2) 1
Interest Income - Non-Operating 29 30 23 17 14
Investment Income - Non-Operating 43 10 (5) (19) (13)
Interest Inc.(Exp.),Net-Non-Op., Total (95) (75) (102) (139) (163)
Gain (Loss) on Sale of Assets -- 4 2 27 11
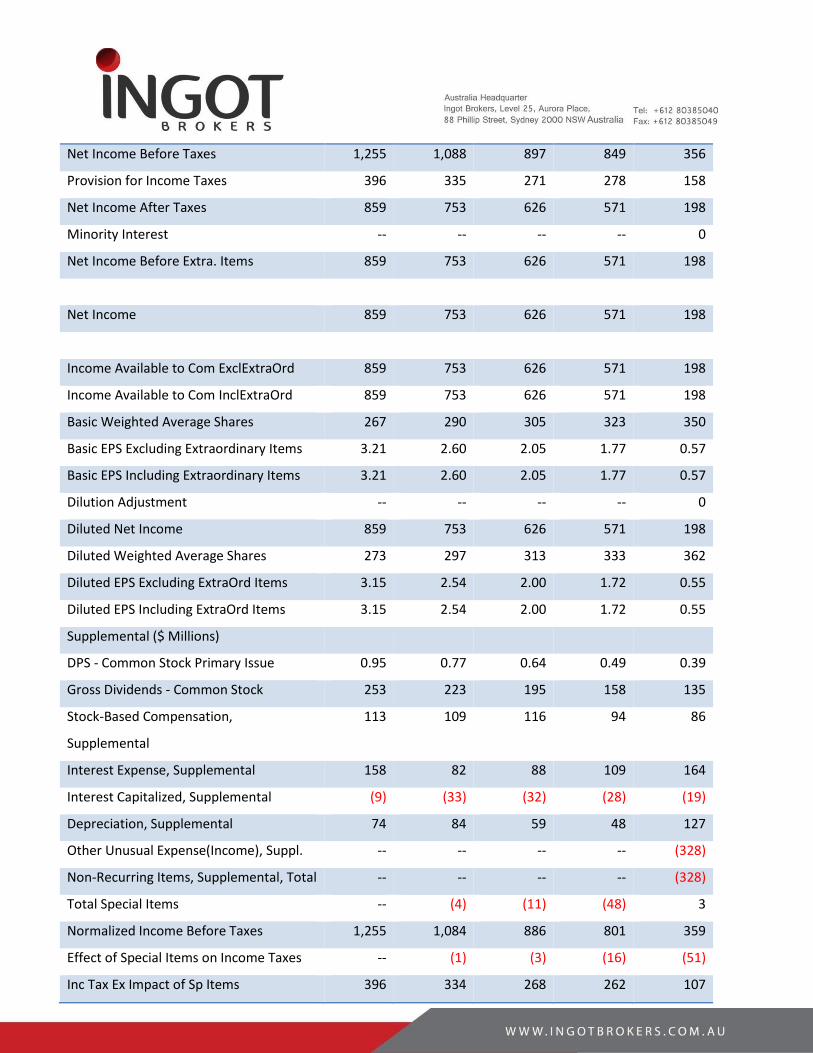
Net Income Before Taxes 1,255 1,088 897 849 356
Provision for Income Taxes 396 335 271 278 158
Net Income After Taxes 859 753 626 571 198
Minority Interest -- -- -- -- 0
Net Income Before Extra. Items 859 753 626 571 198
Net Income 859 753 626 571 198
Income Available to Com ExclExtraOrd 859 753 626 571 198
Income Available to Com InclExtraOrd 859 753 626 571 198
Basic Weighted Average Shares 267 290 305 323 350
Basic EPS Excluding Extraordinary Items 3.21 2.60 2.05 1.77 0.57
Basic EPS Including Extraordinary Items 3.21 2.60 2.05 1.77 0.57
Dilution Adjustment -- -- -- -- 0
Diluted Net Income 859 753 626 571 198
Diluted Weighted Average Shares 273 297 313 333 362
Diluted EPS Excluding ExtraOrd Items 3.15 2.54 2.00 1.72 0.55
Diluted EPS Including ExtraOrd Items 3.15 2.54 2.00 1.72 0.55
Supplemental ($ Millions)
DPS - Common Stock Primary Issue 0.95 0.77 0.64 0.49 0.39
Gross Dividends - Common Stock 253 223 195 158 135
Stock-Based Compensation,
Supplemental
113 109 116 94 86
Interest Expense, Supplemental 158 82 88 109 164
Interest Capitalized, Supplemental (9) (33) (32) (28) (19)
Depreciation, Supplemental 74 84 59 48 127
Other Unusual Expense(Income), Suppl. -- -- -- -- (328)
Non-Recurring Items, Supplemental, Total -- -- -- -- (328)
Total Special Items -- (4) (11) (48) 3
Normalized Income Before Taxes 1,255 1,084 886 801 359
Effect of Special Items on Income Taxes -- (1) (3) (16) (51)
Inc Tax Ex Impact of Sp Items 396 334 268 262 107
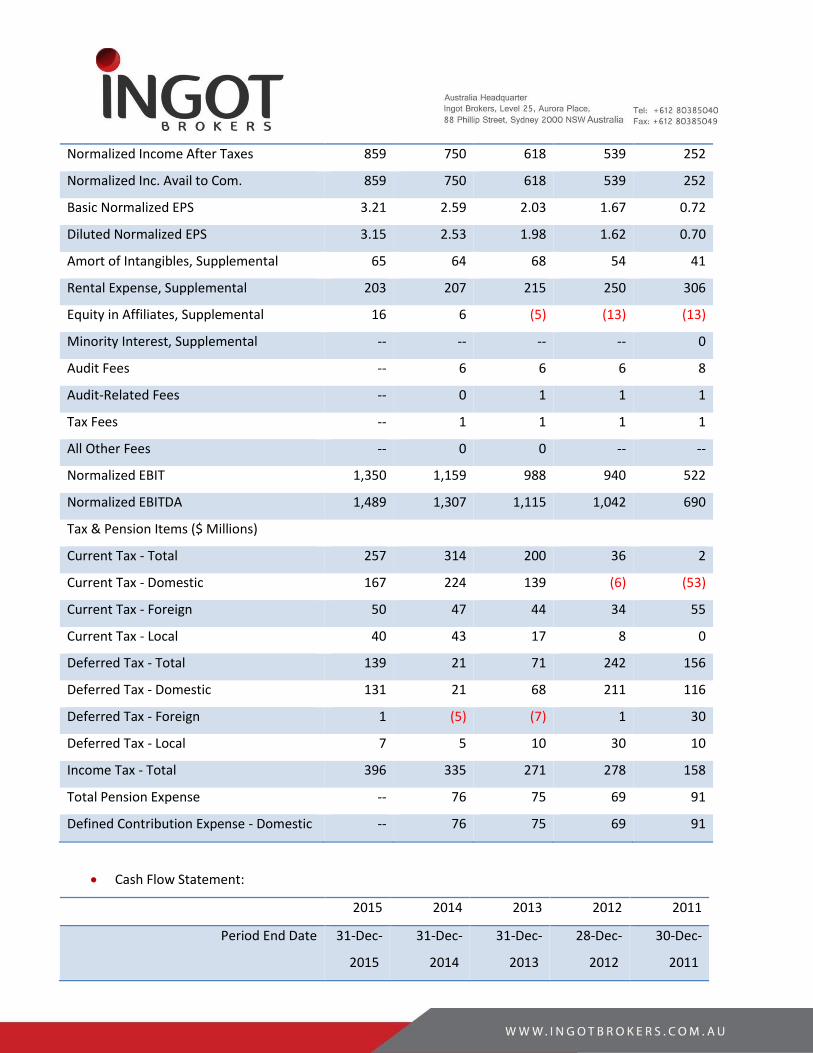
Normalized Income After Taxes 859 750 618 539 252
Normalized Inc. Avail to Com. 859 750 618 539 252
Basic Normalized EPS 3.21 2.59 2.03 1.67 0.72
Diluted Normalized EPS 3.15 2.53 1.98 1.62 0.70
Amort of Intangibles, Supplemental 65 64 68 54 41
Rental Expense, Supplemental 203 207 215 250 306
Equity in Affiliates, Supplemental 16 6 (5) (13) (13)
Minority Interest, Supplemental -- -- -- -- 0
Audit Fees -- 6 6 6 8
Audit-Related Fees -- 0 1 1 1
Tax Fees -- 1 1 1 1
All Other Fees -- 0 0 -- --
Normalized EBIT 1,350 1,159 988 940 522
Normalized EBITDA 1,489 1,307 1,115 1,042 690
Tax & Pension Items ($ Millions)
Current Tax - Total 257 314 200 36 2
Current Tax - Domestic 167 224 139 (6) (53)
Current Tax - Foreign 50 47 44 34 55
Current Tax - Local 40 43 17 8 0
Deferred Tax - Total 139 21 71 242 156
Deferred Tax - Domestic 131 21 68 211 116
Deferred Tax - Foreign 1 (5) (7) 1 30
Deferred Tax - Local 7 5 10 30 10
Income Tax - Total 396 335 271 278 158
Total Pension Expense -- 76 75 69 91
Defined Contribution Expense - Domestic -- 76 75 69 91
Cash Flow Statement:
2015 2014 2013 2012 2011
Period End Date 31-Dec-
2015
31-Dec-
2014
31-Dec-
2013
28-Dec-
2012
30-Dec-
2011
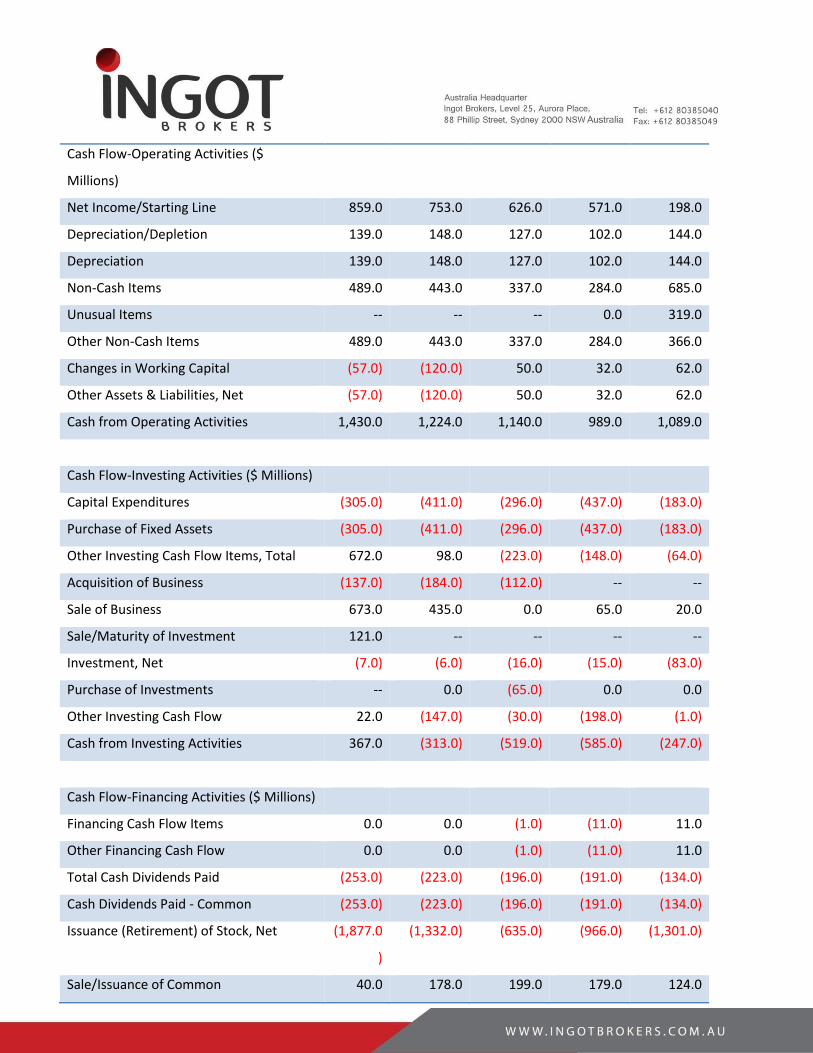
Cash Flow-Operating Activities ($
Millions)
Net Income/Starting Line 859.0 753.0 626.0 571.0 198.0
Depreciation/Depletion 139.0 148.0 127.0 102.0 144.0
Depreciation 139.0 148.0 127.0 102.0 144.0
Non-Cash Items 489.0 443.0 337.0 284.0 685.0
Unusual Items -- -- -- 0.0 319.0
Other Non-Cash Items 489.0 443.0 337.0 284.0 366.0
Changes in Working Capital (57.0) (120.0) 50.0 32.0 62.0
Other Assets & Liabilities, Net (57.0) (120.0) 50.0 32.0 62.0
Cash from Operating Activities 1,430.0 1,224.0 1,140.0 989.0 1,089.0
Cash Flow-Investing Activities ($ Millions)
Capital Expenditures (305.0) (411.0) (296.0) (437.0) (183.0)
Purchase of Fixed Assets (305.0) (411.0) (296.0) (437.0) (183.0)
Other Investing Cash Flow Items, Total 672.0 98.0 (223.0) (148.0) (64.0)
Acquisition of Business (137.0) (184.0) (112.0) -- --
Sale of Business 673.0 435.0 0.0 65.0 20.0
Sale/Maturity of Investment 121.0 -- -- -- --
Investment, Net (7.0) (6.0) (16.0) (15.0) (83.0)
Purchase of Investments -- 0.0 (65.0) 0.0 0.0
Other Investing Cash Flow 22.0 (147.0) (30.0) (198.0) (1.0)
Cash from Investing Activities 367.0 (313.0) (519.0) (585.0) (247.0)
Cash Flow-Financing Activities ($ Millions)
Financing Cash Flow Items 0.0 0.0 (1.0) (11.0) 11.0
Other Financing Cash Flow 0.0 0.0 (1.0) (11.0) 11.0
Total Cash Dividends Paid (253.0) (223.0) (196.0) (191.0) (134.0)
Cash Dividends Paid - Common (253.0) (223.0) (196.0) (191.0) (134.0)
Issuance (Retirement) of Stock, Net (1,877.0
)
(1,332.0) (635.0) (966.0) (1,301.0)
Sale/Issuance of Common 40.0 178.0 199.0 179.0 124.0
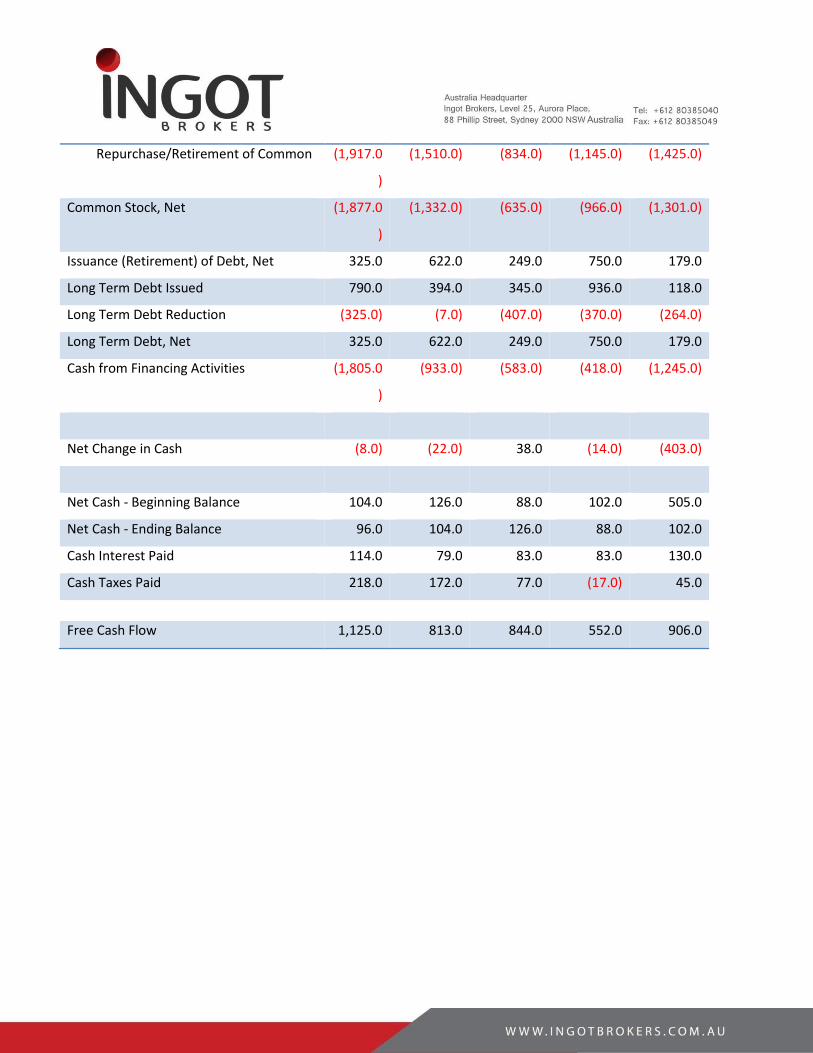
Repurchase/Retirement of Common (1,917.0
)
(1,510.0) (834.0) (1,145.0) (1,425.0)
Common Stock, Net (1,877.0
)
(1,332.0) (635.0) (966.0) (1,301.0)
Issuance (Retirement) of Debt, Net 325.0 622.0 249.0 750.0 179.0
Long Term Debt Issued 790.0 394.0 345.0 936.0 118.0
Long Term Debt Reduction (325.0) (7.0) (407.0) (370.0) (264.0)
Long Term Debt, Net 325.0 622.0 249.0 750.0 179.0
Cash from Financing Activities (1,805.0
)
(933.0) (583.0) (418.0) (1,245.0)
Net Change in Cash (8.0) (22.0) 38.0 (14.0) (403.0)
Net Cash - Beginning Balance 104.0 126.0 88.0 102.0 505.0
Net Cash - Ending Balance 96.0 104.0 126.0 88.0 102.0
Cash Interest Paid 114.0 79.0 83.0 83.0 130.0
Cash Taxes Paid 218.0 172.0 77.0 (17.0) 45.0
Free Cash Flow 1,125.0 813.0 844.0 552.0 906.0
Recourses
From Thomson Reuters Eikon Platform.
The material contained in this document is provided solely for general information and educational purposes and is not, and should not
be construed as, an offer to buy or sell, or as a solicitation of an offer to buy or sell any product, security or investment. Nothing in this
document should be taken as making any recommendations or providing any investment or other advice with respect to the purchase,
sale or other disposition of any product, security or investment, including without limitation, any advice to the effect that any product
related transaction is appropriate for any investment objective or financial situation of a prospective investor. A decision to invest in any
report related products, security or investment should not be made in reliance on any of the statements in this document. Before
making any investment decision, prospective investors should seek advice from their financial advisors, take into account their individual
financial needs and circumstances and carefully consider the risks associated with such investment decision. Without limiting any of the
foregoing, in no event will Ingot Brokers or any of its affiliates be liable for any decision made or action taken in reliance on the
information in this document and, in any event, Ingot Brokers and its affiliates shall not be liable for any consequential, special, punitive,
incidental, indirect or similar damages arising from, related to or connected with this document, even if notified of the possibility of such
damages.