mass balance freya glacier 2015-16 - epic.awi.de · 2 summary the annual surface mass balance...
TRANSCRIPT

1
Mass Balance Freya Glacier 2015-16
Bernhard Hynek1, Daniel Binder1, Michele Citterio2
1 Zentralanstalt für Meteorologie und Geodynamik (ZAMG), Vienna 2 Geological Survey of Denmark and Greenland (GEUS), Copenhagen
Technical Report. Supplement to the mass balance data 2015-16 published in:
Hynek, Bernhard; Weyss, Gernot; Binder, Daniel; Schöner, Wolfgang; Abermann, Jakob; Citterio,
Michele (2014): Mass balance of Freya Glacier, Greenland since 2007/2008. Zentralanstalt für
Meteorologie und Geodynamik, Wien, PANGAEA. https://doi.org/10.1594/PANGAEA.831035

2
Summary
The annual surface mass balance 2015/16 of Freya Glacier (5.3km², 2013) was measured by 11 new
ablation stakes (drilled within the spring 2016 fieldwork), an automatic camera and an automatic
weather station (AWS, near stake 6) with continuous measurement of surface height change. The
glacierwide annual surface mass balance was calculated to -540 +/-100 mm w.e. which is 10% more
negative than the average value since the start of monitoring in 2007/08. The equilibrium altitude line
(ELA) was at 950m a.s.l. and the accumulation area ratio (AAR) 15%. The glacierwide interpretation of
mass balance distribution is based on an orthofoto from 12.7.2016, aerial fotos from 11.08.2016 and
the snowline retreat measured by the automatic camera. Winter mass balance is based on ~100 snow
depth probings with a mean snow depth of 201cm and one bulk snow density measurement of
320kg/m³ within a snowpit next to the AWS. Overall winter mass balance 2015/16 was 650 +/-50 mm
w.e., which is 15% below the 6 year average. The high correlation between winter and annual mass
balance shows, that interannual mass balance variability is mainly driven by winter accumulation.
Figure: a) Map of monitoring network in 2015/16. b) Area averaged winter and annual surface mass balance of
Freya Glacier since the beginning of the monitoring in 2007/08. c) Freya Glacier at the end of the summer 2016
on 29.8.2016 9:00 exposing firn layers that had been accumulated in the two previous positive mass balance years
of 2014 and 2015. [webcam image]
a b
c

3
Fieldwork Spring 2016
Fieldwork on Freya Glacier in spring 2016 took place between 22.4. and 10.5.2016 and was carried out
by Daniel Binder (ZAMG), Bernhard Hynek (ZAMG), and Michele Citterio (GEUS). The purpose of the
fieldwork was not only to measure the winter mass balance of the glacier, but also to install automatic
measuremtent systems for a remote mass balance monitoring of Freya Glacier within the research
project Glacio-Live and to change the ablation stake network from plastic to aluminium stakes that can
be found and redrilled during spring, so that only one visit per year (in spring) is necessary. The
following tasks were carried out during spring 2016 fieldwork:
Winter mass balance measurements by snow depth probing (~100 points) and one snow
density measurement.
Installation of two automatic cameras for snow line monitoring on the ridge above Freya
glacier powered by 3 solar panels and a wind mill and equiped with an Iridium Pilot Antenna
for data transfer in near real time.
Installation of a Promice-type (GEUS) automatic weather station (AWS) including snow height
and ice ablation sensors to measure the surface mass and energy balance continuously. The
termistor string for ice temperature measurements and the ablation hose was drilled only in
spring 2017.
Drilling of 11 aluminium stakes, each 6-8 meter long, to measure surface ablation.
Recovery of sensors and datalogger from the old AWS, which had been burried by snow during
the previous winter.
Winter mass balance
Snow probing took place on 22.4. (46 points), 7.5.(11 points, at stakes) and 10.5.2016 (46 points and
snowpit). Between 22.4. and 10.5. there was snowfall and storm, but the amount of new snow was
less than 10cm, so the values of different dates have been combined without adjustment to a
measurement date of 10.5.2016.
The bulk density of the snow pack was measured in a snow pit next to the AWS (stake 6) on 10.5.2016.
At the AWS there were 200 cm of winter snow accumulation with a mean density of 321 kg/m³ (SWE
= 642 mm). Below the winter snow, there was 35cm of firn (density 507 kg/m³) and 9 cm of
superimposed ice.
As snow depth point measurements vary along short distances by half a meter, we assume, that the
snow probe penetrated through the firn layer of 2015 (and maybe 2014), so the higher values have
benn corrected or deleted. Apart from totally unmeasured zones in the accumulation area that is the
main source of uncertainty in the winter snow depth distribution on the glacier. So the mean
snowdepth of 95 snow depth point measurements is 201cm, using a snow density of 321kg/m² this is
a winter mass balance of 645mm w.e. A spatial interpolation of winter accumulation over the whole
glacier yields a mean winter mass balance of 650 +/-50 mm. w.e.

4
Table: Values from the snow pit next to the AWS at stake 6 at an elevation of 688m a.s.l.
Figure: Snow density measurements in the snow pit next to the AWS at stake 6.
layer weight weight r swe r swe layer
from to thickn. total snow mean sum
[cm] [cm] [cm] [g] [g] [kg/m³] [mm] [kg/m³] [mm]
0 20 19.0 314 107 229 4620 40 19.5 334 127 265 53
40 60 20.0 336 129 262 52
60 80 19.5 337 130 271 54
80 100 19.5 333 126 263 53
100 120 19.5 400 193 402 80
120 140 20.0 375 168 341 68
140 160 19.5 390 183 381 76
160 180 20.0 407 200 407 81
180 200 18.5 385 178 391 78 321 642 snow
200 235 19.5 450 243 507 177 507 177 firn
235 244 ~850 72 ~850 72 SI ice
depth

5
Figure: Snow depth point measurements on Freya Glacier in April/May 2016.

6
Figure: Snow depth point measurements from May 2016. In the background orthofoto of 11.8.2016.

7
Webcam-Installation for snow line monitoring
In May 2016 an automatic camera system has been installed on the ridge above Freya Glacier to
monitor the daily snow cover and by that the spatial distribution of surface mass balance over the
glacier. The system consists of two automatic cameras, 3 solar panels and a windmill for power
generation, three 80 Ah lead batteries and an Iridium-Antenna for data transfer in near real time. In
total this was an equipment of approx. 250 kg, that was carried up an elevation of 300 meters to be
installed on a viewpoint on the northern ridge of the glacier at an elevation of 1053m a.s.l. One camera
is directed downwards to cover most of the glaciers surface and the second camera is directed upwards
to monitor the snowcover in the accumulation area. Unfortunately the upward camera had some
electronic defect and did not deliver data in the first year. However this could be fixed in spring 2017,
since then the camera is working properly. Online-Pictures of the webcams are here:
Downward camera: https://www.foto-webcam.eu/webcam/freya1/
Upward camera: https://www.foto-webcam.eu/webcam/freya2/
Table: Coordinates of the AWS and the Camera.
ID UTM_x UTM_y Lat Lon Elevation
CAM 506376 8254720 74.3825 -20.7878 1052.8
AWS 505048 8255280 74.3875 -20.8320 688.1
Figure: Pictures of the installation of the webcams in spring 2016 (Fotos: B.Hynek).

8
Figures: Location of the automatic cameras on the ridge above Freya Glacier on an elevation of 1053m a.s.l. Upper
picture: To the left is the windmill and on the right the Iridium Antenna for data transfer.The cameras are located
below the Iridium Antenna.

9
Figure: Fotos from the installation of the webcam station at an elevation of 1053m a.s.l.

10
Figure: Top: FreyaCam2 (left), and FreyaCam1 (right) Bottom: Panorama Picture generated with the two
images. Almost the whole glacier surface is visible from the camera position.
Figure: Temperature (outside and inside) and battery voltage at the camera station from Sept 2016 to Aug 2017.
Windmill and solar panels provided enough energy to keep the station running during the Arctic winter.
11
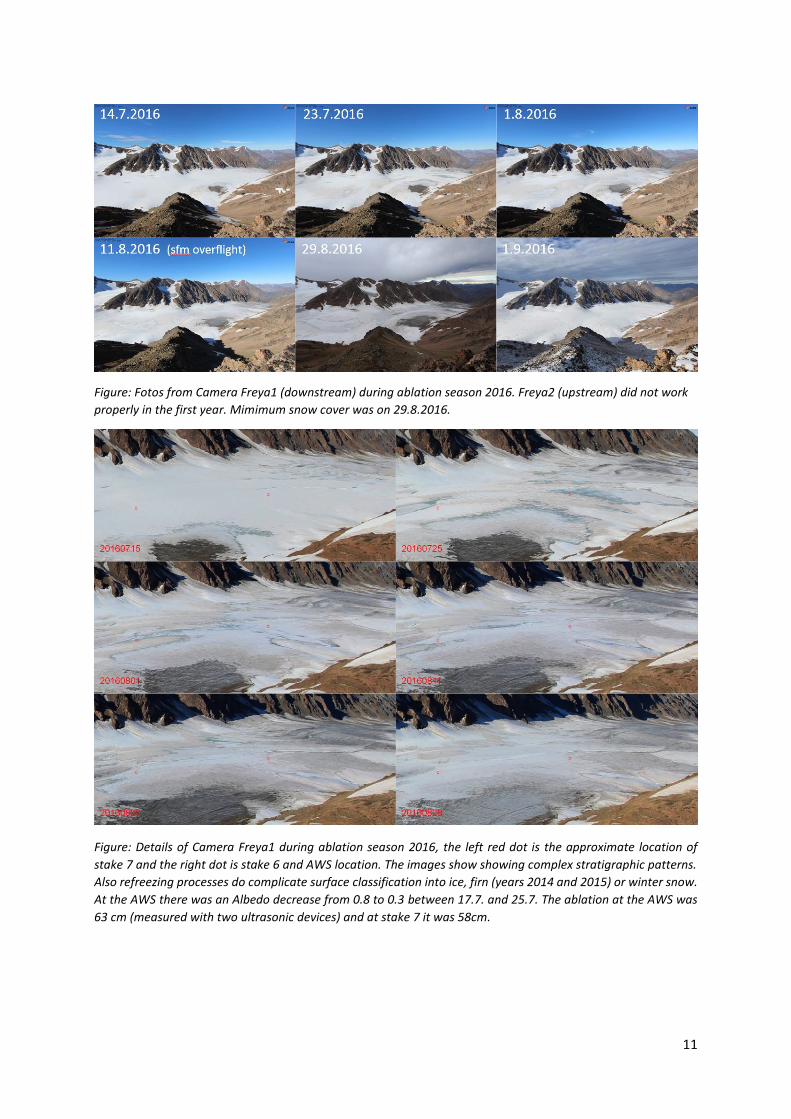
Figure: Fotos from Camera Freya1 (downstream) during ablation season 2016. Freya2 (upstream) did not work
properly in the first year. Mimimum snow cover was on 29.8.2016.
Figure: Details of Camera Freya1 during ablation season 2016, the left red dot is the approximate location of
stake 7 and the right dot is stake 6 and AWS location. The images show showing complex stratigraphic patterns.
Also refreezing processes do complicate surface classification into ice, firn (years 2014 and 2015) or winter snow.
At the AWS there was an Albedo decrease from 0.8 to 0.3 between 17.7. and 25.7. The ablation at the AWS was
63 cm (measured with two ultrasonic devices) and at stake 7 it was 58cm.

12
Installation of a new automatic weather station (AWS)
In May 2016 an automatic weather station (AWS) was established on the surface of Freya Glacier at an
elevation of 688m a.s.l. The weather station replaces the older station, that had been burried by winter
snow during the last winter. The new station is a GEUS promice type station that measures all relevant
variables to derive the surface energy balance and transfers all data via Iridium. Additionally two
ultrasonic rangers for snow depth and snow/ice ablation are mounted on the floating station and on 3
extra aluminium poles, that had been drilled into the ice.
Figure: During the build up of the new AWS on Freya Glacier in May 2016.
Table: Data Table of the online transmitted data of the AWS. Data are transmitted every 6 hours and
transmitted values are averaged values (4h means) or sample values from the last measurement, depnding on
the quantity. In case of low battery power data are transmitted only once a day.
quantity unit numeric quantity unit numeric
1 timestamp 16 ice temperature 1 average (°C) -5.583
2 seconds_since_1990 sec 884390400 17 ice temperature 2 average (°C) -4.376
3 air pressure average (hPa) 619.7 18 ice temperature 3 average (°C) -4.447
4 air temperature average (°C) -18.51 19 ice temperature 4 average (°C) -4.504
5 relative humidity average (%) 52.91 20 ice temperature 5 average (°C) -3.944
6 wind speed average (m/S) 1.688 21 ice temperature 6 average (°C) -4.392
7 wind direction average (dir) 167.1 22 ice temperature 7 average (°C) -4.611
8 shortwave radiation in average (Vx10^-5) -1.33 23 ice temperature 8 average (°C) -5.102
9 short wave radiation out average (Vx10^-5) 0.432 24 tilt x average (vx10^-2) -3.637
10 longwave radiation in average (Vx10^-5) -46.62 25 tilt y average (vx10^-2) 2.88
11 longwave radiation out average (Vx10^-5) -18.81 26 latitude sample (dec deg) 7422.72062
12 temperature rad sensor average (°C) -19.09 27 longitude sample (dec deg) 2049.34199
13 snow height sample (m) 1.847 28 altitude sample (m) 677.1
14 surface height sample (m) 1.175 29 currents sample (mA) 132.7
15 ice height sample (mv) 20.05 30 battery voltage sample (V) 12.39
10.01.2018 00:00

13
Figure: Details of the new AWS on Freya Glacier, Tall Guy.
Table: Manual measurements at the
day of the AWS installation.
Manual measurements at the AWS in cm 07.05.2016
Temp/Hum height (bottom of casing - surface) 335
Sonic Ranger @ AWS height (membrane - surface) 340
Wind sensor height (center of propeller - surface) 385
Sonic Ranger @ Stakes height (membrane - surface) 58
Free length of stake - outer, with sonic ranger 86
Free length of stake -middle 76
Free length of stake - outer, without sonic ranger 80
Boom direction relative to magn North 204
Mast tilt in boom direction (+ if down) -4
Mast tilt across boom (- if clockwise) 5
Height of surface irregularities 3
Snow height 200

14
Figures: The new AWS on Freya Glacier at on elevation of 688m a.s.l. The location of the automatic cameras is
shown in the lowest picture.

15
Figures: Location of the AWS visible on fotos from the overflight on 2016-08-11. The station stands still in the
firn area. To that date there had occurred already 40cm of firn ablation, until the end of the summer in 2016-
08-29 firn ablation accumulates to 63cm. That firn had been built up in the previous two years.

16
Figure: Data from the AWS at stake 6 from Mai 2016 to Mai 2017. From top to bottom: Shortwave radiation and
albedo, temperature and humidity, surface ablation and accumulation measured by two different ultrasonic
devices – one (red) mounted on a fixed pole to measure ice and firn ablation and one (blue) mounted on the AWS
to measure only snow height.
Albedo decrease

17
Ablation stake network:
Figure: In May 2016 a total of 11 ablation stakes have been drilled into the ice. Stakes consist of 2m-segments.
The lower stakes are 4 segments coupled to 8m long stakes, the upper ones are 3 segments coupled to 6m long
stakes. At the bottom there are plastic caps to avoid thermal conduction and to enlarge the surface area. At every
link the coupler pole is fixed with two rivets.
Table: Dimensions of the Aluminium Poles.
Length Outside
diameter Inside
diameter Wall thickness
[cm] [mm] [mm] [mm]
poles 200.0 33 27 3
coupler 29.5 26 4
Table: Measurements at the ablation stakes in May 2016 and May 2017.
Stake
ID
Stake
Length Elev.
snow
depth
2016
snow
depth
2017
dh to
snow
surf. 2016
dh to
snow
surf.
2017
in
ice/firn
2016
in
ice/firn
2017
ice/firn
ablation
2016
ice/firn
density
mass
balance
15/16 comment
[m] [m a.s.l.] [cm] [cm] [cm] [cm] [cm] [cm] [cm] [103kg/m³] [mm w.e.]
1 8 379 211 216 -50 639 not found 2017
2 8 438 192 153 -70 100 678 547 -131 900 -1179
3 8 500 147 170 37 190 616 440 -176 900 -1584
4 8 592 150 179 -73 50 723 571 -152 900 -1368
5 8 646 174 195 -10 120 636 485 -151 900 -1359
6-os 6 688 200 210 86 139 314 251 -63 650 -410 dh 2017 est
6-mid 6 688 200 210 76 129 324 261 -63 650 -410 dh 2017 est
6-ons 6 688 200 210 80 133 320 257 -63 650 -410 dh 2017 est
7 6 724 220 212 -5 61 385 327 -58 650 -377 corrected
8 6 776 190 211 50 81 360 308 -52 650 -338
9 6 801 270 215 2 62 328 323 -5 600 -30 corrected
10 6 859 214 210 133 150 253 240 -13 600 -78 corrected
11 6 868 255 255 106 110 239 235 -4 600 -24

18
Figure: Map of the measurement points of mass balance 2016 with the Orthofoto of 11.8.2016 in the
background.

19
Figure: Map of the measurement points of mass balance 2016 with the Orthofoto of July 12th 2016 in the
background. The Orthofoto is a SPOT satellite acquisition. Contains data from Styrelsen for Dataforsyning og
Effektivisering (SDFE), Denmarks Højdemodel, Januar 2016, downloaded from kortforsyningen.dk.

20
Overflight August 2016
On August 11th 2016 (close to the end of summer on August 29th 2016) the surface of Freya Glacier has
been photographed within 44 fotos from an Airplane by Anders Anker Bjørk. The fotos were created
with a CANON EOS MARK II, 24mm fixed zoom, 21 MPx. They have been matched and orthorectified
using a structure from motion workflow and registered by using visible points from the 2013 sfm-
model. The horizontal accuracy of the resulting orthofoto is approx. 5 meters. In the lower part of the
glacier the bare ice surface is exposed, while the upper part is mainly covered by firn originating from
the two last positive mass balance years of 2014 and 2015. Only a very small part of the glacier is still
covered by what looks like winter snow, but this might also be a product of repeating refreezing events.

21
Figure: Thumbnails of 39 out of the 44 fotos from the plane overflight on August 11th 2016.

22
Figure: GCP locations and error estimates.
Figure: Left: Camera Locations and image overlap.
Right: Hillshade of the final DEM.

23
Table: Control Points error statistics.
Table: Check Points error statistics.

24
Figure: Resulting Orthofoto of
Freya Glacier, 2016-08-11

25
Figures: Top:The glacier surface on 11.8.2016 during the
overflight and on 29.8.2016, the day before the first
snowfall. Fotos from the Automatic Camera.
Right: Orthofoto generated from the Automatic Camera
picture above (11.8.2016). Background is a coloured
hillshade to illustrate the non visible areas from the site of
Cam 1. Visible feateures of the overflight Orthofoto of
2016-08-11 and the DEM 2013 have been used to
orthorectify the camera images.
11.8.2016, Overflight
29.8.2016, End of summer
26
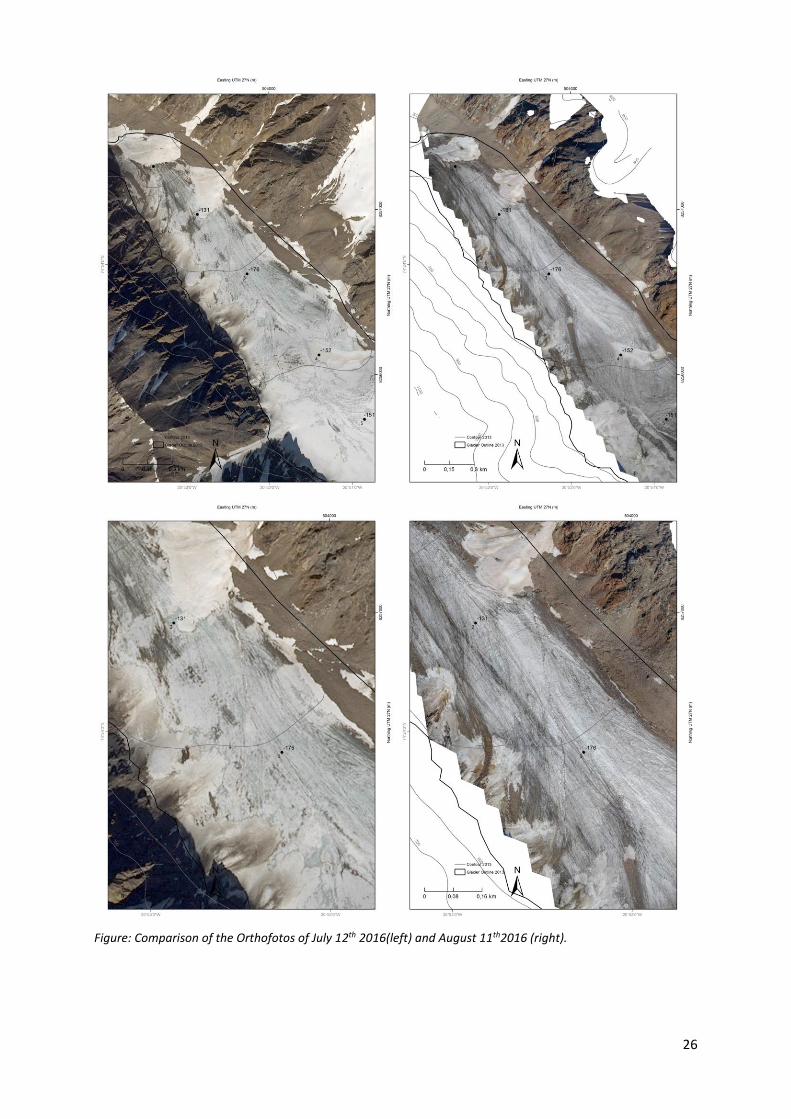
Figure: Comparison of the Orthofotos of July 12th 2016(left) and August 11th2016 (right).

27
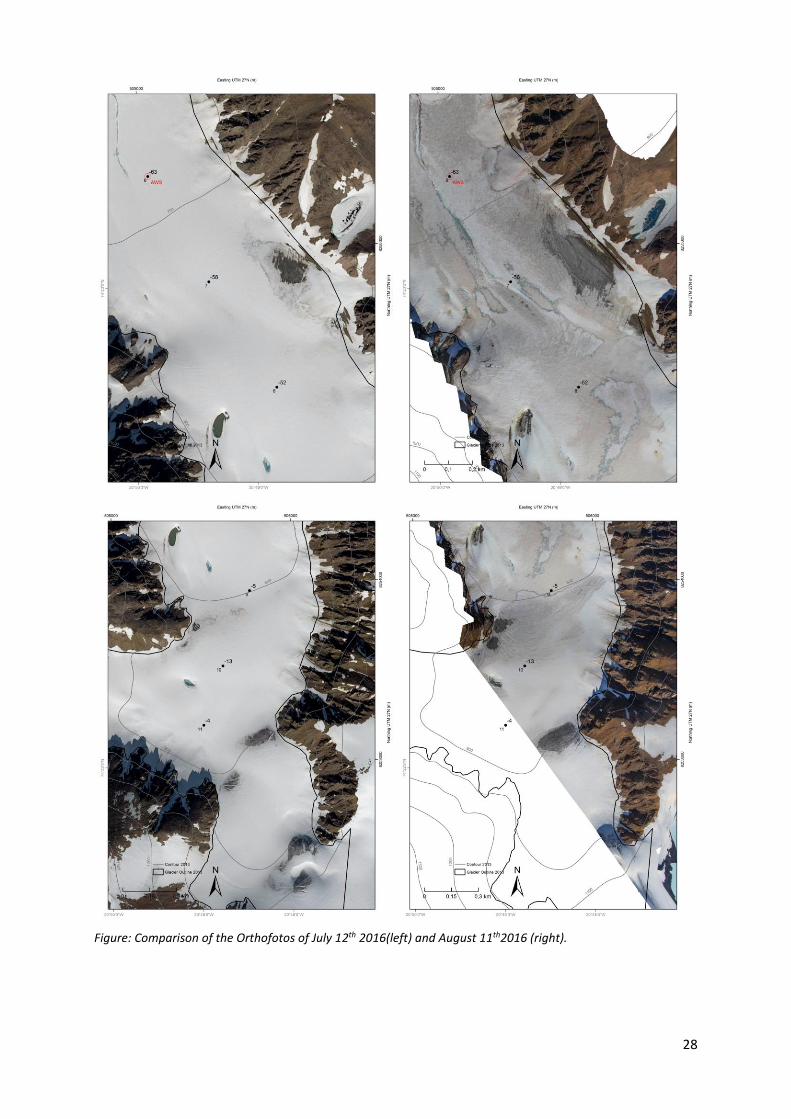
Figure: Comparison of the Orthofotos of July 12th 2016(left) and August 11th2016 (right).
28
Figure: Comparison of the Orthofotos of July 12th 2016(left) and August 11th2016 (right).

29
Annual Mass Balance
The day of minimum snow cover was 29.8.2016. On that day it rained and in the evening was the first
snowfall. The next snowfall was on 2.9.2016. Date of overflight and generation of the orthofoto was
11.8.2016, the surface was very similar to minimum snowcover. At the AWS we had 20-25cm ablation
between 11.8. and 30.8.
Table: Ablation stake height change between Mai 2016 and Mai 2017. At least the upper 3 stakes had unrealistic
readings, the values have been corrected according to visual mass balance seen on the fotos. There might have
occurred vertical movement of the stakes.
Figure: Winter (left) and annual (right) mass balance distribution on Freya Glacier 2015/16. The spatial
distribution is generated by prescribing interpolation values (grey dots), which are based on previous mass
balance distributions or best guess approximations. The estimated accuracy of the glacier wide annual mass
balance is approximately 100 mm w.e.
ID Length East North Lat Lon Elev. dh density mb 15/16 comment
[m] [utm] [utm] [°] [°] [m a.s.l.] [cm] [kg/m³] [mm w.e.]
1 8 503302 8257260 74.4053 -20.8899 379 - not found
2 8 503567 8256970 74.4027 -20.8812 438 -131 900 -1179
3 8 503868 8256610 74.3995 -20.8712 500 -176 900 -1584
4 8 504303 8256120 74.3951 -20.8567 592 -152 900 -1368
5 8 504579 8255730 74.3915 -20.8475 646 -151 900 -1359
6 6 505048 8255280 74.3875 -20.8320 688 -63 650 -410
7 6 505303 8254840 74.3836 -20.8235 724 -58 650 -377 corrected
8 6 505587 8254400 74.3796 -20.8141 776 -52 650 -338
9 6 505771 8253940 74.3755 -20.8080 801 -5 600 -30 corrected
10 6 505623 8253520 74.3717 -20.8130 859 -13 600 -78 corrected
11 6 505517 8253190 74.3688 -20.8166 868 -4 600 -24

30
Table: Mass Balance 2014/15 evaluated on elevation bands.
Figure: Mass balance distribution with elevation. Bars: Glacier area distribution. Green: Mb-point measurements.
Grey: Grid values of interpolated mb raster. Black: mb mean values on 100m elevation bands. Red: mb mean
values on 25m elevation bands.
Date/
Time
Date/
Time end
Elev min
[m a.s.l.]
Elev max
[m a.s.l.]
SaZ
[km2]
BaZ
[106kg]
baZ
[kg/m2]
BwZ
[106 kg]
bwZ
[kg/m2]
2015 2016 1300 1400 0.001 0 -80 0 419
2015 2016 1200 1300 0.155 -6 -37 75 485
2015 2016 1100 1200 0.190 -3 -17 115 604
2015 2016 1000 1100 0.278 -10 -35 178 639
2015 2016 900 1000 0.633 -1 -1 449 709
2015 2016 800 900 0.804 -45 -56 583 725
2015 2016 700 800 1.064 -364 -342 719 676
2015 2016 600 700 1.073 -1009 -940 672 626
2015 2016 500 600 0.586 -839 -1432 320 546
2015 2016 400 500 0.370 -443 -1197 229 618
2015 2016 300 400 0.136 -127 -934 93 680
2015 2016 200 300 0.014 -19 -1390 8 612
2015 2016 5.304 -2866 -540 3440 649
mb [mm w.e.]
m
a.s.l.

31
Table: Mass balance periods at Freya Glacier:
MB Period
Date/Time start@annual
balance
Date/Time end@annual
balance
Date/Time start@winter
balance
Date/Time end@winter
balance
2007/2008 11.08.2007 23.08.2008 01.09.2007 12.05.2008
2008/2009 23.08.2008 24.08.2009
2009/2010 24.08.2009 21.08.2010
2010/2011 21.08.2010 23.08.2011
2011/2012 23.08.2011 14.08.2012 20.09.2011 26.04.2012
2012/2013 14.08.2012 14.08.2013 25.08.2012 05.05.2013
2013/2014 14.08.2013 18.08.2014 14.08.2013 27.04.2014
2014/2015 18.08.2014 17.08.2015 01.09.2014 06.05.2015
2015/2016 17.08.2015 29.08.2016 17.08.2015 10.05.2016
Table: Mass Balance Results of Freya Glacier:
Figure: Time series of mean annual and winter mass balance of Freya Glacier in meters water equivalent.
Year
Sc
[km^2]
Bc
[10^6kg]
bc
[kg/m^2]
Sa
[km^2]
Ba
[10^6kg]
ba
[kg/m^2]
S
[km^2]
B
[10^6kg]
b
[kg/m^2]
Bw
[10^6kg]
bw
[kg/m^2]
ELA
[m a.s.l.] AAR
07/08 0.82 116 22 4.48 -2857 -539 5.30 -2741 -517 3682 694 1000 0.16
08/09 2.18 271 51 3.13 -2789 -526 5.30 -2518 -475 800 0.41
09/10 0.32 58 11 4.98 -4365 -823 5.30 -4307 -812 >1300 0.06
10/11 0.31 59 11 5.00 -5020 -946 5.30 -4961 -935 >1300 0.06
11/12 2.27 300 57 3.03 -1345 -254 5.30 -1044 -197 4856 916 750 0.43
12/13 0.16 20 4 5.15 -7413 -1398 5.30 -7393 -1394 1009 190 >1300 0.03
13/14 5.00 2102 396 0.30 -13 -2 5.30 2089 394 5853 1104 < 270 0.94
14/15 3.72 1342 253 1.59 -826 -156 5.30 516 97 4957 935 670 0.70
15/16 0.78 37 7 4.52 -2902 -547 5.30 -2865 -540 3440 649 950 0.15

32
Figure: Correlation 1) of 6 years of annual and winter mass balances. 2) of 9 years of annual mass balance and
accumulation area ratio (AAR), 3) of 9 years of annual mass balance and equilibrium line altitude (ELA).

33
Acknowledgements
The authors thank Anders Anker Bjørk from the Natural History Museum of Denmark for taking the
fotographs of Freya Glacier in August 2016 and the Zackenberg Research Station for providing logistic
support during field work. We thank also Gerhard Keuschnig and Flori Radlherr from foto-webcam.eu
for the good collaboration and especially their commitment and efforts to adapt the automatic camera
system to Arctic conditions and for data transfer via Iridium-Satellite. Finally, we thank Kirstine Skov
for fieldwork assistance.

34

35
Appendix: AWS Maintainence/Establishment Details (7.5.2016)
Figure: Calibration constants of the net radiometer: (SWU/SWL/LWU/LWL//10.59/10.82/11.52/9.57)

36

37