mass timber market analysis - montana dnrc
TRANSCRIPT

Mass Timber Market Analysis
C o m p l e t e d f o r : C o u n c i l o f W e s t e r n S t a t e F o r e s t e r s
N o v e m b e r 2 0 1 8

The Beck Group, Forest Products Planning & Consulting Portland, Oregon
P a g e 2
TABLE OF CONTENTS
PAGE
CHAPTER 1 – INTRODUCTION ........................................................................................................ 1
1.1 Mass Timber ..................................................................................................................................... 1
1.2 The Case for Mass Timber ................................................................................................................ 1
1.3 Mass Timber Building Materials ....................................................................................................... 2
CHAPTER 2 – MASS TIMBER DEMAND............................................................................................ 5
2.1 Growth of The Mass Timber Market ................................................................................................ 5
2.2 Mass Timber Market Activity ........................................................................................................... 6
2.3 Barriers to Mass Timber Market Growth ......................................................................................... 7
2.4 Mass Timber in Building Codes ........................................................................................................ 8
2.5 Estimates of Market Potential for CLT ........................................................................................... 10
CHAPTER 3 – LUMBER AND MASS TIMBER SUPPLY ....................................................................... 13
3.1 Existing and Planned CLT Manufacturers ....................................................................................... 13
3.2 North American Lumber Production .............................................................................................. 13
3.3 Types of Lumber Used in CLT ......................................................................................................... 19
CHAPTER 4 – SUPPLY/DEMAND BALANCE .................................................................................... 23
CHAPTER 5 – SUMMARY AND CONCLUSIONS ............................................................................... 25

The Beck Group, Forest Products Planning & Consulting Portland, Oregon
P a g e 1
CHAPTER 1 – INTRODUCTION
The Beck Group (BECK), a Portland Oregon based forest products planning and consulting firm, analyzed the market for mass timber within the Council of Western State Foresters (CWSF) region (17 Western US states and 6 US affiliated Pacific Islands), with a focus on the likely impact on timber demand in the region. The CWSF’s Forest Utilization Network served as the sponsor for this project, leveraging funds from the USFS Forest Products Laboratory, and contracted through the University of Nebraska.
The scope of work included evaluation of the recent and future demand for Mass Timber in the region, the existing and planned manufacturer suppliers of mass timber products, review of existing and planned mass timber projects (buildings) in the region, analysis of lumber supply and demand (apart from mass timber applications), and a supply/demand balance summary. This report summarizes BECK’s findings.
1.1 MASS TIMBER
Mass Timber is defined as building construction where the primary load bearing members in the structure are made up of wood, including engineered wood products and/or large dimension solid sawn wood. Mass Timber is the term used to differentiate this building method from more traditional construction methods such as concrete, steel and light structural wood framing (also known as “stick” framing) common in single family homes. Mass Timber construction for large buildings is very new to North America. The first commercial CLT (a form of Mass Timber - see Section 1.3 for a description of Mass Timber types) project in the U.S. was constructed in 2011, but CLT has been in use in Europe since the 1990’s.
The rising popularity of Mass Timber construction in North America is of particular interest to wood products manufacturers and timberland owners because the primary application for Mass Timber is in large, multistory buildings that are traditionally constructed with concrete and steel. Because Mass Timber use largely displaces non-wood building materials (rather than cannibalizing existing markets for wood), there is potential for increased overall demand for wood products, and therefore logs/timber.
Mass Timber buildings may include combinations of different wood-based products such as CLT, glulam beams, and solid sawn posts, as well as incorporating structural steel and concrete in some areas.
1.2 THE CASE FOR MASS TIMBER
Mass Timber is gaining popularity in North America for a variety of reasons. While some may be tempted to think it is a passing fad, consider that Mass Timber construction can boast significant advantages over other construction methods. These advantages, discussed below, should give Mass Timber real staying power in the building industry.
Total Project Cost 1.2.1
For many projects, a building utilizing Mass Timber can deliver significant cost savings. While the cost of the delivered materials may be equivalent to (or higher than) comparable concrete and steel structural members, Mass Timber can offer savings in a variety of other ways including smaller/less substantial foundations (due to wood’s favorable strength to weight ratio leading to a lighter weight structure), reduced construction time (offsite panel manufacturing can lead to 20% reduced on-site construction schedule), and reduced on-site skilled labor requirements (stemming from shorter construction times and offsite panel manufacturing).

CHAPTER 1 – INTRODUCTION
The Beck Group, Forest Products Planning & Consulting Portland, Oregon
P a g e 2
Reduced Skilled Labor Requirements 1.2.2
As mentioned above, the amount of on-site skilled labor required for many Mass Timber structures is much lower than comparable concrete and steel buildings. Offsite manufacturing of Mass Timber panels can be accomplished with lower skilled workers and lower overall labor costs. With labor shortages impacting much of the construction industry, the reduced labor requirements associated with Mass Timber can be a significant advantage.
Seismic Performance 1.2.3
With proper design, Mass Timber structures can perform very well in areas where earthquakes and seismic activity are a concern.
Fire Performance 1.2.4
The surface of large wood framing members will “char” in the event of a structure fire, protecting the inner layers of wood from structural damage. Recent laboratory burn tests of Mass Timber products have addressed concerns regarding fire safety in large wooden structures. Mass Timber structures far outperform stick framed structures and, due to the charring effect, can even outperform steel structures during very high temperature fires in which steel will melt, deform, and fail.
Blast Performance 1.2.5
The U.S. Department of Defense has conducted tests to observe the blast resistance of CLT panels, with very favorable results.
Aesthetics and Livability 1.2.6
Many people prefer to live and work in buildings where exposed wood is a key feature. Mass Timber can deliver this through revealing wood structural elements in living and work spaces.
Environmental Impact 1.2.7
Mass Timber is growing a reputation for delivering a smaller environmental footprint relative to comparable steel and concrete buildings. Environmental benefits include use of renewable raw materials (wood), superior thermal efficiency (leading to lower energy usage over the life of the building), and lower carbon footprint (both in terms of on-site carbon sequestration, and avoided manufacturing emissions).
1.3 MASS TIMBER BUILDING MATERIALS
Mass Timber describes a broad category of building materials and methods that utilize large wooden members as the primary structural elements in a building. While Mass Timber does include traditional building methods such as post and beam, it is new panelized products like CLT that are gaining media attention and attracting architects, builders, and building occupants to explore wood as the construction material of choice for large buildings. Key products are described and discussed below.
Cross Laminated Timber 1.3.1
CLT is a panelized structural engineered wood product that can be used in all major structural building parts (floors, interior and exterior walls, and roof). CLT is made of multiple layers of lumber, with each layer having the wood grain oriented perpendicular to the adjacent layer. The layers are pressed

CHAPTER 1 – INTRODUCTION
The Beck Group, Forest Products Planning & Consulting Portland, Oregon
P a g e 3
together with a specialized adhesive. CLT panels used for building construction are commonly 8’ to 12’ in width, 20’ to 60’ in length, and 3.5” to 9” in thickness.
CLT Panel Layout Illustration1
By fastening together layers of lumber in alternating orientation, the strength, dimensional stability, and fire resistance of CLT panels is much, much greater than the individual pieces of lumber would produce.
CLT is produced in dedicated manufacturing facilities that include machinery for remanufacturing, finger-jointing, and surfacing lumber, glue applicators and specialized panel presses, and computer controlled (CNC) routers for trimming panels to size and cutting out openings for doors, windows, etc.
Most CLT panels are customized for a specific building project, meaning that the exact width, length, thickness (and arrangement of layers), and other properties of each panel is specified based on the planned building project. Openings for doors and windows, and openings or channels for electrical, plumbing, HVAC, etc. are commonly pre-planned and cut out at the manufacturing facility using CNC routers. Having completely pre-fabricated panels minimizes the amount of labor at the construction site, and speeds construction dramatically.
After the manufacturing phase, CLT panels are transported to the construction site, typically by truck. The massive panels are hoisted into place using cranes, with straps or cables attached to “pick points” that can be preinstalled on the panels and removed after the panel is put in place.
Nail Laminated Timber and Dowel Laminated Timber 1.3.2
NLT and DLT are massive wood composite panels like CLT but instead of using adhesive to bond each layer to the next, nails or wooden dowels are used as fasteners to hold the panel together. Because they do not require the specialized presses used in (adhesive based) CLT manufacturing, NLT and DLT may be assembled in a temporary or makeshift workshop facility located close to the construction site or panels may be assembled in place at the building site.
1 Illustration source: FP Innovations

CHAPTER 1 – INTRODUCTION
The Beck Group, Forest Products Planning & Consulting Portland, Oregon
P a g e 4
In most cases, NLT and DLT are used in horizontal applications (floors, roof decks) and not walls, so there is less need for precision-machined openings such as those required for doors and windows.
While the metal nails used in NLT can dull or damage saws and routers, DLT is made entirely wood and does not present the same machining challenges.
Mass Plywood Panels 1.3.3
Mass Plywood Panels (MPP) are another innovative panelized Mass Timber product, currently produced by a single operation located in Oregon (Freres Lumber). MPPs are veneer based (rather than lumber-based) and constructed by gluing together many layers of thin veneer in various combinations of grain orientation. MPP applications are very similar to those of standard CLT, though the manufacturer boasts that using veneer-based panels can lead to reduced panel thickness and/or longer unsupported spans compared to lumber-based panels.
Glue Laminated Beams 1.3.4
Glue laminated beams, or glulam, are an engineered wood composite made up of multiple layers of lumber, bonded with adhesive to form a larger beam. Most glulam is made from standard dimension lumber (2x4, 2x6, 2x8). Glulam beams are typically much stronger than an equivalent sized solid sawn beam, and can be made into a variety of customizable sizes and shapes including very long lengths and cambered or curved/arched structures.
Glulam is a very well-established product that has been in use in both residential and nonresidential construction for many years. In Mass Timber structures, glulam is commonly used as a supporting member for panels (CLT, etc.) and in post and beam structures.
Post and Beam 1.3.5
Post and beam construction, using large dimension (6” thick and larger) solid sawn lumber, has been popular in high end homes for many years but recently has been enjoying increased popularity in a variety of larger multifamily residential buildings as well as nonresidential buildings of all kinds (office buildings, schools, warehouses, etc.). In these larger buildings, structural loadings are typically higher than single family residences, so larger dimension posts and beams, and/or engineered wood composites such as glulam may be used. In many cases, post and beam frames make up the structural element of a building frame, while nonstructural walls will commonly be constructed with light wood framing. In structures where mass timber panels make up the floor elements, wood posts and beams are often used as the supporting vertical structural elements.
Heavy Timber Decking 1.3.6
Heavy timber decking can be used in horizontal applications (floor and roof) where the full engineered properties of panelized products such as CLT are not required. Heavy timber decking consists of a single layer of timbers (usually 3x6 or 4x6) joined edgewise with tongue and groove profiles on each piece. Timber decking has more frequently been used in regions where construction labor is lower in cost, giving this labor-intensive application an advantage over CLT or NLT panels.

The Beck Group, Forest Products Planning & Consulting Portland, Oregon
P a g e 5
CHAPTER 2 – MASS TIMBER DEMAND
2.1 GROWTH OF THE MASS TIMBER MARKET
Because the Mass Timber industry is so young, there are no industry associations collecting and publishing data related to the amount of wood products going into Mass Timber structures. So, measuring the actual amount of solid sawn timbers, CLT, glulam, and other engineered wood products being used in Mass Timber structures is difficult to do with accuracy. But, with the amount of buzz from news sources about new projects being constructed, it is clear that the industry is growing very quickly. One indicator of the rapid growth of the market is the number of new projects being designed and constructed. WoodWorks is a non-profit organization focused on supporting the use of wood in non-residential and multifamily buildings. They offer technical support to architects, engineers, builders and developers who are interested in using wood, and have been instrumental in promoting CLT and other Mass Timber systems. WoodWorks has provided input to most of the Mass Timber structures that have been designed and/or built in the United States, and the organization keeps track of the number of Mass Timber projects they become aware of (whether they offer direct assistance or not). The following chart illustrates the number of new U.S. Mass Timber projects, by year.
U.S. Mass Timber Projects by Year
As the chart illustrates, the number of projects initiated each year has grown rapidly, from fewer than 20 in 2014 to well over 200 (estimated) by the end of 2018.
0
50
100
150
200
250
2014 2015 2016 2017 2018E

CHAPTER 3 – LUMBER AND MASS TIMBER SUPPLY
The Beck Group, Forest Products Planning and Consulting Services
Portland, Oregon P a g e 6
2.2 MASS TIMBER MARKET ACTIVITY
As of September 2018, WoodWorks2 has identified well over 400 Mass Timber projects in the U.S. Of these, construction has begun (and/or finished) on just about one-third, while the remaining two-thirds are in the planning phase. The following table details projects in the CWSF region. As the table shows, most projects to date have been in three West Coast states – California, Washington, and Oregon.
Mass Timber Projects in CWSF Region3
In Design Started or
Built Total
Alaska
0
Arizona
0
California 39 23 62
Colorado 6 9 15
Hawaii 1
1
Idaho 2 1 3
Kansas 1
1
Montana 1 5 6
Nebraska 1 1 2
Nevada
0
New Mexico 1
1
North Dakota
0
Oregon 22 14 36
South Dakota
0
Utah 2
2
Washington 22 15 37
Wyoming 1
1
CWSF Total 99 68 167
U.S. Total 282 157 439 Thus far, Mass Timber projects are about evenly split between projects that primarily use solid sawn lumber (post and beam, heavy timber decking) and those that use Mass Timber panels (CLT, NLT), as illustrated in the following chart.
2 For more information, or the latest updates on Mass Timber projects, see the WoodWorks web site:
http://www.woodworks.org/publications-media/building-trends-mass-timber/ 3 No data was available for CWSF’s six island regions

CHAPTER 3 – LUMBER AND MASS TIMBER SUPPLY
The Beck Group, Forest Products Planning and Consulting Services
Portland, Oregon P a g e 7
Mass Timber Projects by Primary Structural Material
2.3 BARRIERS TO MASS TIMBER MARKET GROWTH
Building Codes 2.3.1
A primary barrier to the use of Mass Timber in buildings in the U.S. is that many of the existing building codes are tailored to traditional building systems such as concrete and steel for large multistory buildings, and light wood framing (dimension lumber, etc.) for smaller buildings. Until recently, anyone in the U.S. desiring to construct a building using Mass Timber would have to use an “alternate means” process, requiring the building authorities to evaluate the building design on a case by case basis. This process can be costly and take a lot of time and effort on the part of the design/build team, which creates a significant barrier to the use of Mass Timber.
While building codes specific to Mass Timber are in the process of being adopted in the U.S., this remains a barrier to expansion in market growth. Section 2.4 of this report provides more details on the progress of updating building codes to include Mass Timber materials and methods.
Awareness and Understanding 2.3.2
Because Mass Timber is a relatively new construction method, many architects, engineers, and builders know little about it. In addition to being aware that Mass Timber construction is an option, the industry needs to understand structural properties and the many different details (fastener and connection systems, appropriate interior and exterior wall coverings, plumbing, electrical and HVAC layout) that can be impacted by using a new building method.
Awareness is growing rapidly thanks to the efforts of nonprofit organizations such as WoodWorks and Think Wood, who are producing informational literature, conferences, webinars, and video content to increase awareness of Mass Timber in key circles of influence in the large building construction industry. The content is designed to improve overall awareness about Mass Timber and to address questions and concerns people may have. Specifically, they can help to identify which Mass Timber materials and
Heavy Timber Decking
Post & Beam
CLT
NLT

CHAPTER 3 – LUMBER AND MASS TIMBER SUPPLY
The Beck Group, Forest Products Planning and Consulting Services
Portland, Oregon P a g e 8
methods may be the best fit for a specific application, and situations where Mass Timber does (or does not) offer advantages over more traditional building methods.
Supply Limitations 2.3.3
As of fall 2018, there are only 5 North American manufacturers that are certified to produce CLT (or MPP) for structural applications (under PRG-320)4. A single large structure can tie up production at a manufacturing facility for weeks or months at a time, meaning that new building projects may have to wait for panels. CLT can also be imported from overseas manufacturers (there are several large suppliers in Europe), but this can lead to increased costs and, again, extended wait times for overseas shipping.
In some cases, architects and builders are interested in using CLT but supplies are limited in the desired time frame. Sometimes this leads to use of another Mass Timber method/material (such as NLT, DLT, or heavy decking), but in other cases the building winds up reverting to more traditional construction methods.
The addition of new CLT manufacturing capacity is critical to the continued expansion of Mass Timber utilization. Fortunately, there are several more North American facilities in the process of being constructed or working toward certification, and more proposed manufacturing facilities in the works. See Chapter 3 of this report for a listing of Mass Timber panel manufacturers and their current operational status.
2.4 MASS TIMBER IN BUILDING CODES
As discussed earlier in this report, getting Mass Timber included in building codes will remove a significant barrier to the technology’s adoption in the marketplace. While there is an international body that develops building codes (the International Code Council or ICC), it is up to state and local (county, municipal) authorities to adopt these codes, creating a patchwork effect for adoption of any new building codes. The following section of this report describes progress being made toward code adoption in various U.S. jurisdictions.
2015 International Building Codes 2.4.1
In early 2015, the ICC adopted new codes allowing the use of CLT in buildings up to 6 stories (for offices, or 5 for residential). This was a significant step forward, and cheered by Mass Timber advocates. However, CLT use in taller buildings (Tall Wood) was not addressed in this code update. Because CLT is viewed as having the most competitive advantages (in terms of cost and appropriateness of application) in buildings that are 6-16 stories tall, the 2015 IBC adoption was considered only a partial victory.
As always, it takes time for new codes developed by the ICC to be adopted at state and local levels. The following map (developed by the American Wood Council) illustrates the adoption progress of the 2015 International Building Codes on a state by state basis.
4 PRG-320 is the standard covering the manufacturing, qualification, and quality assurance requirements for cross-
laminated timber (CLT)

CHAPTER 3 – LUMBER AND MASS TIMBER SUPPLY
The Beck Group, Forest Products Planning and Consulting Services
Portland, Oregon P a g e 9
Adoption of International Building Code Standards
As the map illustrates, many of the states represented in the CWSF have adopted International Building Codes. Specifically, the California market, which represents more than half of projected CLT demand (see Section 2.5 of this report) in the CWSF region, has adopted the 2015 IBC statewide.5
2021 International Building Codes 2.4.2
The ICC is in the process of developing new codes for the 2021 edition of the IBC. Specific to Mass Timber, the codes currently being considered include provisions for the use of CLT in buildings up to 18 stories in height (i.e., Tall Wood). The Tall Wood provisions overcame a significant hurdle in the adoption process on October 25th, 2018 by passing a key vote at a public comment hearing. The final outcome of these code changes is expected sometime in December 2018.
Oregon and Washington 2.4.3
As of August 2018, Oregon has proactively enacted the Tall Wood building code provisions developed by the ICC, even before they are officially approved as part of the IBC. Washington is expected to do the same very soon (possibly before the end of 2018). Oregon and Washington have been leaders in the adoption of Mass Timber construction.
5 For more complete information see the American Wood Council’s web site: https://www.awc.org/codes-
standards/code-adoption-map Data for CWSF’s six island members are not included in the AWC listing.

CHAPTER 3 – LUMBER AND MASS TIMBER SUPPLY
The Beck Group, Forest Products Planning and Consulting Services
Portland, Oregon P a g e 10
2.5 ESTIMATES OF MARKET POTENTIAL FOR CLT
FP Innovations Market Assessment 2.5.1
In 2013, FP Innovations6 published a CLT Handbook that included an estimate of the potential market for CLT in the United States. The estimate was based on the assumption that CLT-based construction could capture 5% - 15% of the existing markets for non-residential and multifamily construction. At 5% market share, the demand would be approximately 60 million cubic feet of CLT per year. At 15%, total demand would be 180 million cubic feet. Importantly, FP Innovations did not make any predictions as to how long it would take to achieve these levels of market penetration.
The 17 state CWSF region accounts for approximately 26% of the total U.S. construction market evaluated in the FP Innovations report, meaning that at 5% market share, the regional demand for CLT would be approximately 16 million cubic feet. At 15% share, the regional demand would be 48 million cubic feet per year.7
PNW CLT Demand Study 2.5.2
In 2016, Forterra8 collaborated with Heartland LLC, Washington State University, and University of Washington to develop a twenty-year forecast of CLT demand (2016 through 2035). This demand forecast was specific to the Pacific Northwest region (Washington, Oregon, Idaho, Montana). While the FP Innovations market estimate was based on market penetration of the broad construction market, the Forterra study was focused specifically on building types where CLT is most likely to have competitive advantages over conventional concrete and steel construction designs. It also took into account market hurdles such as code acceptance and dissemination of information and education within the construction industry.
The total forecast demand for CLT in the PNW is 1.2 million cubic feet in 2020, with demand expected to approximately double every five years into the future.9
CLT Market Demand for CWSF Region 2.5.3
The Forterra report is very useful in that it considers the specific types of structures where CLT is most likely to gain market share. Unfortunately, it does not include anticipated market demand in the 13 additional Western states that are members of the CWSF. However, if we assume that the rate of adoption in the four PNW states covered by this study is reasonably similar to that of the other states in the region, we can use the state by state demand information developed by FP Innovations to arrive at a reasonable estimate of demand for the entire CWSF region. The FP Innovations report anticipates demand of 2.1 million cubic feet for Oregon, Washington, Idaho, and Montana (based on 5% market share). In 2020, the Forterra report predicts CLT demand of 1.2 million cubic feet for these same states, a ratio of about 58%. Applying this same ratio to the remaining CWSF states provides an estimate of the total regional demand, as shown in the following table.
6 FP Innovations is a non-profit organization serving the Canadian forest products Industry
7 For more information on the FP Innovations market assessment, see CLT Handbook Chapter 1, Section 9
https://fpinnovations.ca/Pages/CltForm.aspx 8 Forterra is a non-profit organization focused on land conservation in the state of Washington
9 For more information on the CLT Demand Study for the Pacific Northwest, see the Forterra web site:
https://forterra.org/subpage/clt

CHAPTER 3 – LUMBER AND MASS TIMBER SUPPLY
The Beck Group, Forest Products Planning and Consulting Services
Portland, Oregon P a g e 11
Estimated CLT Market for CWSF Region10, 2020 (millions of cubic feet)
Alaska N/A
Arizona 0.55
California 5.50
Colorado 0.55
Hawaii N/A
Idaho 0.13
Kansas 0.29
Montana 0.03
Nebraska 0.07
Nevada 0.11
New Mexico 0.14
North Dakota 0.05
Oregon 0.12
South Dakota 0.19
Utah 0.39
Washington 0.92
Wyoming 0.05
Total 9.10
As the table illustrates, the projected demand for the CWSF region in 2020 is 9 million cubic feet of CLT. At this level, 8-12 CLT typical-scale manufacturing facilities would be required to supply the total demand. Given Forterra’s projection that the CLT market will continue to double every five years after 2020, the regional demand in 2025 would be approximately 18 million cubic feet.
Please note that more than half of the total projected demand for the CWSF region is in the state of California, so CLT market acceptance in that state is critical to the overall demand for the region. As discussed in Section 2.2 of this report, there is substantial current and planned activity in California, which provides confidence that the projected demand levels are reasonable.
Timber Demand from CLT Production 2.5.4
To provide a measurement of market demand that is useful to foresters, BECK has analyzed the process of converting logs into lumber, and lumber into CLT in order to estimate the total amount of log demand that could be directly attributable to CLT production.
CLT volumes are based on the actual gross cubic measurement of the panel (not accounting for door and window cutouts, etc.) To translate this to nominal board foot lumber volumes (the tally basis for most softwood lumber sales), waste and manufacturing losses must be accounted for as well as accounting for difference between actual cubic and finished lumber sizes. Assuming the feedstock is 2x6 and 2x8 dimension lumber, BECK estimates that 21.4 nominal board feet of lumber will be required for every cubic foot of CLT produced. This number can vary depending on practices and procedures at the CLT manufacturer.
10
No data was available for CWSF’s six island regions

CHAPTER 3 – LUMBER AND MASS TIMBER SUPPLY
The Beck Group, Forest Products Planning and Consulting Services
Portland, Oregon P a g e 12
To get from nominal lumber volume to delivered log volume, lumber recovery (the difference between board feet log scale and board feet of lumber produced from that log scale tally) must be accounted for. The amount of lumber recovered from a given log varies significantly from one mill to the next and depends heavily on log size, species, and the mix of lumber products being produced. For purposes of developing this conversion factor, BECK has assumed an overall lumber recovery level of 1.8 board feet of lumber per board foot of logs based on Scribner short log scale.
The following table illustrates the estimated log demand associated with varying levels of CLT demand.
CWSF Region Estimated CLT Demand Translated to Log Demand
Unit Conversion
factor 2020 CLT Demand
2025 CLT Demand
CLT Demand Cubic feet
9,100,000 18,200,000
CLT to Lumber
21.4
Lumber demand Board feet (nominal)
194,740,000 389,480,000
Lumber to Logs
1.8
Log demand
Board feet Scribner (short
log)
108,188,889 216,377,778
As the table illustrates, at the projected 2020 CWSF regional demand level of 9.1 million cubic feet of CLT, the associated demand for logs would be 108 million board feet (short log Scribner basis) 11. At the 2025 estimated demand of 18.2 million cubic feet of CLT, the demand for logs would be 216 million board feet of logs. To put these figures in context, Western sawmills currently demand approximately 8 billion board feet of logs per year.
11
For a rough conversion to Scribner long log scale, reduce the calculated log volume by 20%

The Beck Group, Forest Products Planning & Consulting Portland, Oregon
P a g e 13
CHAPTER 3 – LUMBER AND MASS TIMBER SUPPLY
3.1 EXISTING AND PLANNED CLT MANUFACTURERS
As of October 2018, four North American CLT manufacturing plants (and one mass plywood panel plant) are operating and certified under PRG-320 to produce structural/architectural panels. Five more panel operations are operational but either not yet certified, or not seeking certification (StructureCraft produces NLT and DLT – products that cannot be certified under PRG-320, and Sterling produces CLT for crane and access mats for the oil industry, and not for architectural purposes).
Two plants are currently under construction (both in the state of Washington), and three more have been announced.
North American Mass Timber Panel Manufacturers
Location
Est. Lumber Demand
Primary Species
2018 Status
Company City State /Province (MMBF)
Nordic Chibougamau Quebec 60-70 Spruce-Pine-Fir Operating, certified
Structurlam Penticton British Columbia 20-30 Spruce-Pine-Fir Operating, certified
Smartlam Columbia Falls Montana 20-30 Douglas fir Operating, certified
DR Johnson Riddle Oregon 60-70 Douglas fir Operating, certified
Freres Lyons Oregon N/A Douglas fir Producing MPP
StructureCraft Abbotsford British Columbia 40-50 Spruce-Pine-Fir Producing NLT, DLT
Intl. Beams Dothan Alabama 20-30 Southern Pine Operating
Leaf EWP Devlin Ontario 10-15 Spruce-Pine-Fir Operating
Element5 Ripon Quebec 20-30 Spruce-Pine-Fir Operating
Sterling Lumber Phoenix Illinois 40-50 Unknown Operating
Katerra Spokane Washington 100+ Unknown Under construction
Vaagen Timbers Colville Washington 40-50 Douglas fir Under construction
Smartlam TBA Maine Announced
LignaCLT Millinocket Maine Announced
Sterling Lumber Lufkin Texas Announced
As the table illustrates, when operating at capacity, the panel manufacturers located in the CWSF region will require more than 200 million board feet of lumber per year (sum of figures in bold). This is roughly in line with the 2020 CLT demand estimate discussed in Section 2.5 of this report.
3.2 NORTH AMERICAN LUMBER PRODUCTION
While this report is focused ultimately on the demand for timber in the CWSF region, it is important to note that dimension lumber markets across North America are very fluid, with lumber commonly traveling thousands of miles before reaching its end user. So, it is important to consider not only lumber production within the CWSF region, but also the broader scope of lumber markets and production across North America.

CHAPTER 3 – LUMBER AND MASS TIMBER SUPPLY
The Beck Group, Forest Products Planning and Consulting Services
Portland, Oregon P a g e 14
Historical North American Lumber Supply 3.2.1
North American softwood lumber production bottomed out in 2009 during the depths of the Great Recession and has been slowly climbing back to historically “normal” levels ever since. The following table illustrates production trends in each region.
North American Softwood Lumber Production and Consumption12
(billions of board feet – lumber tally)
2009 2010 2011 2012 2013 2014 2015 2016
Canadian Production 18.8 22.1 22.0 23.2 24.4 24.6 26.7 28.3
- British Columbia 9.7 11.4 12.0 12.3 12.7 12.6 13.2 13.6
- East of Rockies 9.1 10.6 10.0 10.9 11.7 12.0 13.5 14.8
U.S. Production 23.4 24.8 26.5 28.3 31.6 31.6 31.6 32.7
- West 10.4 11.1 11.6 12.6 13.5 14.1 13.5 13.9
- South 11.8 12.4 13.5 14.3 16.7 16.1 16.7 17.3
- Other 1.3 1.3 1.4 1.4 1.5 1.5 1.5 1.5 Total N.A. Production 42.2 46.9 48.5 51.5 56.0 56.2 58.3 61.0
Exports 3.7 5.1 7.0 6.9 7.3 6.6 6.3 5.9
Imports 0.9 0.8 0.8 0.7 0.8 1.0 1.1 1.4 Apparent Consumption 39.4 42.6 42.3 45.3 49.5 50.6 53.1 56.5
Major Trends in North American Lumber Supply 3.2.2
The North American softwood lumber industry is in the midst of some dramatic shifts in timber supply and production capacity, with supplies of available timber shrinking in key producing areas and production capacity expanding in others.
3.2.2.1 Reduction in Timber Supply - British Columbia
Most timber harvested in Canada comes from “crown lands” managed by provincial governments, and most timber harvested from crown lands comes from timber license agreements held by wood products manufacturers, so government policies in each of the major producing provinces have a significant impact on lumber supplies.
British Columbia is the largest lumber producing region in Canada, amounting to nearly ½ of the country’s total lumber production (13.6 of 28.3 billion board feet in 2016), and the vast majority of this output comes from the Province’s Interior region. Massive tree mortality in the last decade or more across Interior British Columbia as a result of Mountain Pine Beetle (MPB) infestation has resulted in significant drops in Annual Allowable Cut (AAC), or timber harvest, on crown lands. In the late 1990’s, before the massive die-off of timber, the AAC in Interior BC was around 50 million cubic meters. Allowable harvest levels increased for a number of years in an attempt to salvage the dead and dying timber, but those volumes have begun to drop, and are expected to settle out at around 40 million cubic meters (a drop of 20% compared to historical levels) by 2025.
12
Source: WWPA

CHAPTER 3 – LUMBER AND MASS TIMBER SUPPLY
The Beck Group, Forest Products Planning and Consulting Services
Portland, Oregon P a g e 15
British Columbia Interior Annual Allowable Cut13
3.2.2.2 Reduction in Timber Supply – Eastern Canada
Quebec is Canada’s second largest province in terms of lumber production (6.6 of 28.3 billion board feet in 2016), and it is experiencing an overall reduction in AAC, as well. In this case the reduction in timber harvest is a result of changes to the way sustainable timber harvest rates were calculated, as well as environmental restrictions leading to more and more of forested land being moved into “reserved” status for wildlife habitat, etc. As the following chart illustrates, the AAC levels have dropped by more than 1/3 compared to historical norms.
13
Source BC Ministry of Forests
0
10
20
30
40
50
60
70
80
Mil
lio
n M
3
Forecast

CHAPTER 3 – LUMBER AND MASS TIMBER SUPPLY
The Beck Group, Forest Products Planning and Consulting Services
Portland, Oregon P a g e 16
Quebec Annual Allowable Cut14
Ontario - another significant producing province - is experiencing similar reductions in AAC, also due to shifting environmental policies.
In summary, Canada as a nation is facing declining supplies of timber and, consequently, softwood lumber production. Several Canadian softwood sawmills have already closed as a result of the declining timber availability, and more are expected to do so in the coming years.
3.2.2.3 Expansion of SYP Lumber Supply
While timber and lumber supplies in Canada are declining, lumber capacity in the U.S. Southern Pine region is booming. The following table lists new Southern Pine sawmills that have been built or announced with startup dates ranging from 2017 to 2020. The list includes greenfield mills (brand new construction) as well as significantly rebuilt operations (in which case only incremental capacity is listed).
14
Source: Forest Economic Advisors
16
18
20
22
24
26
28
30
32
34
1990 1995 2000 2005 2010 2015 2020
Mil
lio
n M
3
Forecast

CHAPTER 3 – LUMBER AND MASS TIMBER SUPPLY
The Beck Group, Forest Products Planning and Consulting Services
Portland, Oregon P a g e 17
New Southern Pine Sawmills
Company Location State Startup Date Capacity
(mmbf/yr)
Biewer Lumber Newton MS 2017 - Q1 250
Conifex El Dorado AR 2018 - Q1 180
Weyerhaeuser Dierks AR 2018 - Q2 80
Georgia Pacific Talladega AL 2018 - Q3 230
West Fraser Opelika AL 2018 - Q3 75
Vicksburg FP Vicksburg MS 2018 - Q3 100
Klausner Enfield NC 2019 350
Rex Lumber Troy AL 2019 - Q2 240
JV - Tolko/Hunt Urania LA 2019 - Q1 200
Weyerhaeuser Millport AL 2019 - Q1 215
Angelina FP Lufkin TX 2019 - Q2 220
Georgia Pacific Warrenton GA 2019 - Q2 250
Westervelt Southern AL 2019-Q2 250
Georgia Pacific Albany County GA 2019 Q4 300
Canfor Washington GA 2020 Q1 275
Total
3,215
In addition to the 3.2 billion board feet of new sawmill capacity listed above, it is anticipated that three or more new mills will be announced in the near future. On top of capacity from new mills, existing mills across the South are adding incremental capacity through milling equipment upgrades and adding dry kilns. BECK anticipates that the total capacity expansion across the South will total at least 5 billion board feet in the space of less than 5 years.
As a frame of reference, consider that total SYP lumber production in 2016 was 17.3 billion board feet. This means a capacity expansion of 30% in a relatively short period of time. While this also represents a very large increase in timber consumption, the relatively short rotation age in Southern Pine region has contributed to building standing timber inventories since before the Great Recession, so log supplies should be adequate to supply the new lumber capacity for several years at least.
Projected North American Lumber Production 3.2.3
The Beck Group has developed a projection of North American lumber production through 2023, as illustrated in the following table.

CHAPTER 3 – LUMBER AND MASS TIMBER SUPPLY
The Beck Group, Forest Products Planning and Consulting Services
Portland, Oregon P a g e 18
North American Softwood Lumber Production15
2015 2016 2017 2018E 2019F 2020F 2021F 2022F 2023F
Canadian Production 26.7 28.3 28.4 28.1 28.0 28.3 28.6 28.9 29.0
- British Columbia 13.2 13.6 13.0 12.7 12.5 12.7 12.9 13.1 13.2
- East of Rockies 13.5 14.8 15.4 15.4 15.5 15.6 15.7 15.8 15.8
U.S. Production 31.6 32.7 33.8 34.8 37.3 39.1 40.8 42.5 44.2
- West 13.5 13.9 13.9 13.9 14.1 15 15.5 16 16.5
- South 16.7 17.3 18.3 19.3 21.6 22.5 23.7 24.9 26.1
- Other 1.5 1.5 1.6 1.6 1.6 1.6 1.6 1.6 1.6
Total N.A. Production 58.3 61.0 62.2 62.9 65.3 67.4 69.4 71.4 73.2
U.S. housing starts are the primary driver of lumber demand in North America. The projected figures assume that housing starts will generally continue on an improving trend toward an estimated underlying demand of 1.5 million housing starts, and takes into consideration the recent contraction of timber supplies in Canada and the expansion of sawmill capacity in the U.S. South.
Lumber Markets 3.2.4
Dimension lumber is a commodity traded across North America. While certain regions demonstrate preferences for a specific species of lumber, those preferences are price sensitive, so lumber produced in one region is largely substitutable for lumber produced in another region. Because of this, it is common for lumber to travel long distances to its end user. While Texas sawmills produce Southern Pine lumber, it is common for a hardware store in Texas to carry Douglas Fir from the Pacific Northwest, or Spruce-Pine-Fir from Canada.
The primary use of dimension lumber is in home construction. New home construction and home repair and remodeling are the leading end-uses of softwood lumber, as illustrated in the following table.
End Use Markets for Softwood Lumber
Repair and Remodeling 40%
Residential Construction 35%
Industrial 20%
Non-residential Construction 5%
Total 100%
3.2.4.1 Historical and Projected Lumber Prices
The Beck Group developed a forecast of dimension lumber prices through 2023. The forecast pricing is compared to historical prices in the following chart.
15
Sources: Historical data – WWPA, Projection – The Beck Group

CHAPTER 3 – LUMBER AND MASS TIMBER SUPPLY
The Beck Group, Forest Products Planning and Consulting Services
Portland, Oregon P a g e 19
Dimension Lumber Price – History and Forecast
As the chart shows, lumber prices can be quite volatile, varying by nearly $300 per thousand board feet from 2009 through 2018. In 2018 lumber prices reached record levels (though in the second half of the year they have been on a downward trend). The forecast anticipates lower lumber prices in 2019 before they begin to climb again in response to continued growth in lumber demand as housing starts climb to meet an underlying demand of approximately 1.5 million units per year.
3.3 TYPES OF LUMBER USED IN CLT
Building products used in structural applications are typically required to meet nationally or internationally recognized specifications and CLT is no exception. The ANSI standard for performance-rated CLT is known as PRG-320, and this standard specifies the raw materials that can be used for structural CLT (among other requirements and specifications).
While PRG-320 contains broad specifications that may apply to a wide variety of lumber types (species, grades, sizes), this report will focus on the types of lumber that are most commonly produced and available in the marketplace. Specifically, the focus is on dimension lumber (nominally 2” thick by 4”-12” wide) unless otherwise noted.
Allowable Lumber Species 3.3.1
PRG-320 specifies that CLT can contain any softwood species recognized by the American Lumber Standards Committee (ASLC) with a minimum specific gravity of 0.35 as published in the National Design Specification for Wood Construction. The following table illustrates published specific gravities for key species relevant to the CWSF region.
0
100
200
300
400
500
600
19
95
19
96
19
97
19
98
19
99
20
00
20
01
20
02
20
03
20
04
20
05
20
06
20
07
20
08
20
09
20
10
20
11
20
12
20
13
20
14
20
15
20
16
20
17
20
18
E
20
19
F
20
20
F
20
21
F
20
22
F
20
23
F
$ p
er t
ho
usa
nd
bo
ard
fee
t

CHAPTER 3 – LUMBER AND MASS TIMBER SUPPLY
The Beck Group, Forest Products Planning and Consulting Services
Portland, Oregon P a g e 20
Species/Group Specific Gravity
Douglas Fir-Larch 0.50
Engelmann Spruce-Lodgepole Pine 0.38
Hem-Fir 0.43
Ponderosa Pine 0.43
Redwood 0.37
Sitka Spruce 0.43
Western Cedars 0.36
Western Hemlock 0.47
As the table illustrates, all the key lumber producing species in the region would qualify for use in CLT panels.
Surfacing Requirements 3.3.2
All lumber must be surfaced to meet PRG-320 specifications. Most dimension lumber available in the marketplace is surfaced adequately to create a smooth surface for layup in a CLT panel, however the most common adhesives used in CLT manufacturing require the lumber to be surfaced no more than 48 hours prior to adhesive application to ensure proper bonding. So, most CLT manufacturers re-surface the lumber as part of the manufacturing process.
Allowable Lumber Sizes 3.3.3
PRG-320 specifies that lumber used in CLT must be at least 5/8” and at most 2” in thickness. Thus, dimension lumber fits well within these requirements, even if it is re-surfaced prior to layup as part of the manufacturing process.
Allowable widths are based on relationship to the thickness. In the major strength direction of the panel, lumber width must be at least 1.75 times the thickness, meaning that any common dimension lumber size (2x4 – 2x12) would qualify, even after re-surfacing.
In the minor strength direction, lumber width must be at least 3.5 times the thickness. In this case, a 2x4 would not qualify, but dimension lumber 2x6 and larger would qualify.
Depending on the specific panel construction, the layers of a CLT panel oriented in the minor strength direction will typically make up 1/3 to 1/2 of the total volume of the panel. Thus, standard 2x4 lumber cannot be used in 1/3 to 1/2 of total CLT panel volume.
The following table shows the average distribution of lumber widths produced at dimension mills in the U.S. West. The table is based on data collected by BECK as part of benchmarking analysis.

CHAPTER 3 – LUMBER AND MASS TIMBER SUPPLY
The Beck Group, Forest Products Planning and Consulting Services
Portland, Oregon P a g e 21
Size % of Total
2x4 35%
2x6 31%
2x8 11%
2x10 12%
2x12 9%
Other 2%
Total 100%
The following chart illustrates historical average prices for different sizes of Inland Fir & Larch dimension lumber. Price trends for other Western species are similar.
Because 2x6 and 2x8 lumber are usable throughout CLT panels and are typically lower in price than larger sizes of dimension lumber, BECK expects that most CLT manufacturers will target these sizes for use as feedstock.
340
360
380
400
420
440
460
480
2x4 2x6 2x8 2x10 2x12
$ p
er t
ho
usa
nd
bo
ard
fee
t
Average Dimension Lumber Prices: 2012-2018 Inland Fir&Larch #2/Btr
CHAPTER 3 – LUMBER AND MASS TIMBER SUPPLY
The Beck Group, Forest Products Planning and Consulting Services
Portland, Oregon P a g e 22
Allowable Lumber Grades 3.3.4
In layers parallel to the major strength direction of the panel, the lumber must be visual grade #2 or better. In perpendicular layers (those oriented in the minor strength direction), visual grade #3 or better is allowed.
The layers oriented in the major strength direction typically make up 1/2 to 2/3 of the total volume of the panel. Thus, 1/2 to 2/3 of lumber used in CLT cannot be #3 grade.
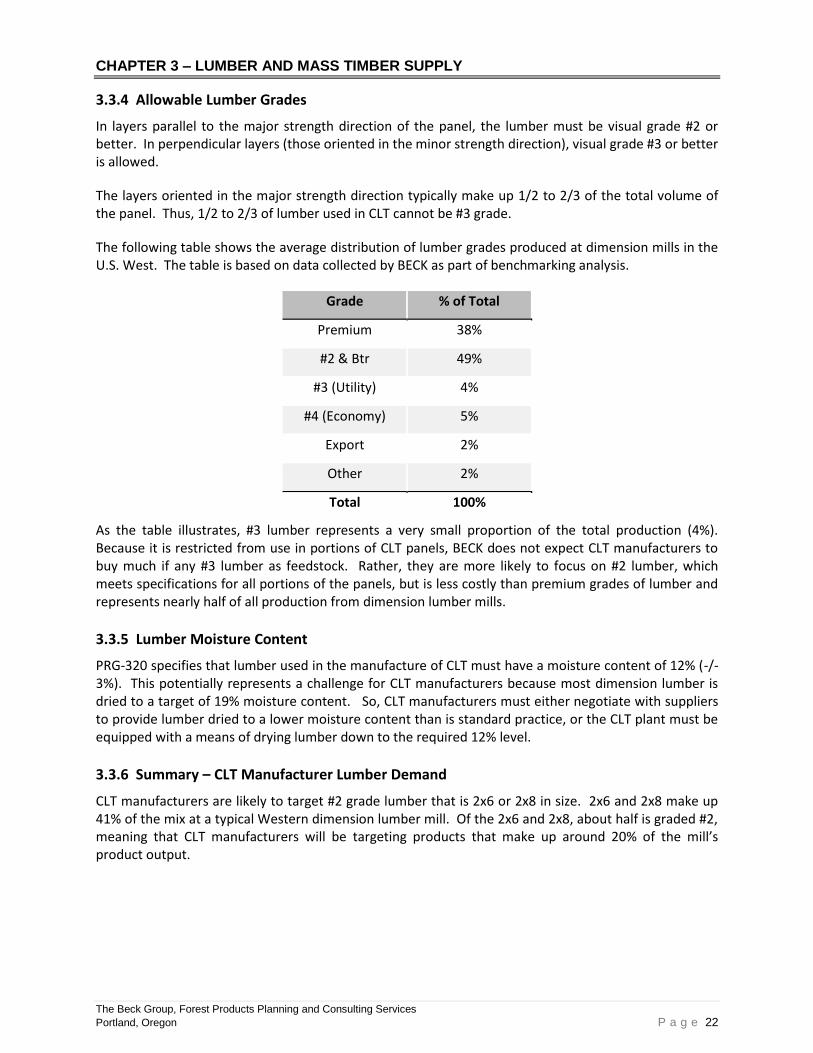
The following table shows the average distribution of lumber grades produced at dimension mills in the U.S. West. The table is based on data collected by BECK as part of benchmarking analysis.
Grade % of Total
Premium 38%
#2 & Btr 49%
#3 (Utility) 4%
#4 (Economy) 5%
Export 2%
Other 2%
Total 100%
As the table illustrates, #3 lumber represents a very small proportion of the total production (4%). Because it is restricted from use in portions of CLT panels, BECK does not expect CLT manufacturers to buy much if any #3 lumber as feedstock. Rather, they are more likely to focus on #2 lumber, which meets specifications for all portions of the panels, but is less costly than premium grades of lumber and represents nearly half of all production from dimension lumber mills.
Lumber Moisture Content 3.3.5
PRG-320 specifies that lumber used in the manufacture of CLT must have a moisture content of 12% (-/- 3%). This potentially represents a challenge for CLT manufacturers because most dimension lumber is dried to a target of 19% moisture content. So, CLT manufacturers must either negotiate with suppliers to provide lumber dried to a lower moisture content than is standard practice, or the CLT plant must be equipped with a means of drying lumber down to the required 12% level.
Summary – CLT Manufacturer Lumber Demand 3.3.6
CLT manufacturers are likely to target #2 grade lumber that is 2x6 or 2x8 in size. 2x6 and 2x8 make up 41% of the mix at a typical Western dimension lumber mill. Of the 2x6 and 2x8, about half is graded #2, meaning that CLT manufacturers will be targeting products that make up around 20% of the mill’s product output.

The Beck Group, Forest Products Planning and Consulting Services
Portland, Oregon P a g e 23
CHAPTER 4 – SUPPLY/DEMAND BALANCE
The Beck Group anticipates that U.S. housing starts will increase at a faster rate than lumber production in North America. Lumber demand, being closely linked to housing starts, is likely to outpace supply (even apart from the increased demand related to Mass Timber projects), as illustrated in the following chart.
Lumber Production vs Housing Starts
This will lead to a combination of the following:
1. Lumber prices will increase as the supply/demand balance tilts toward a constraint in overall supply (as described in Section 3.2 of this report).
2. Lumber currently being exported to offshore destinations (especially China) will be redirected to U.S. markets.
3. Lumber imports from overseas (especially Europe) will increase, similar to what occurred during the last U.S. lumber market peak (2004-2005).
These effects could be mitigated somewhat if additional supplies of timber and lumber become available. Possibilities for this include:
1. A significant reduction in overseas log exports from the Coastal West, diverting more logs to domestic sawmills.
850
950
1,050
1,150
1,250
1,350
1,450
1,550
1,650
45.0
50.0
55.0
60.0
65.0
70.0
75.0
80.0
85.0
90.0
2015 2016 2017 2018E 2019F 2020F 2021F 2022F 2023F
tho
usa
nd
s o
f h
ou
sin
g st
arts
bill
ion
s o
f b
oar
d f
ee
t
Total N.A. Lumber Production U.S. Housing Starts

The Beck Group, Forest Products Planning and Consulting Services
Portland, Oregon P a g e 24
2. Additional sawmill capacity could be developed in the U.S. South (beyond what has already been described in this report).
3. A significant expansion of timber harvest from U.S. public lands (especially U.S. Forest Service lands in the Western U.S.).
Regarding the expansion of timber harvest from U.S. public lands, the U.S. Forest Service reports that in some areas it has seen fewer timber sales fall prey to litigation due to engaging in collaborative planning efforts with environmental groups and industry representatives16. The Forest Service has lost much of its experienced staff and internal ability to prepare timber sales and is unlikely to expand timber harvests by any significant volume with existing staffing levels. However, stemming from the 2014 Farm Bill, state forestry departments can assist with federal timber harvest and forest restoration activities using Good Neighbor authority. Several Western states have already entered into Good Neighbor Authority agreements and may drive additional volumes of federal timber to market. In many Western regions, sawmills do have untapped production capacity (i.e., through expanding operating hours, etc.) and could accept additional volumes of timber if it is priced appropriately relative to lumber markets.
16
http://www.eastoregonian.com/eo/local-news/20181023/national-forest-logging-on-upward-track-official-says

The Beck Group, Forest Products Planning and Consulting Services
Portland, Oregon P a g e 25
CHAPTER 5 – SUMMARY AND CONCLUSIONS
The market for Mass Timber in large, multistory buildings is expanding rapidly, carried in part by the buzz around new products such as CLT, and by targeted educational/information campaigns.
The business case for Mass Timber is solid, with potential benefits including lower cost, strong fire and seismic performance, aesthetics, and environmental performance.
Progress is being made to reduce barriers to the expansion of Mass Timber markets, including building code revisions, increased building industry awareness of Mass Timber, and expanding supplies of Mass Timber products.
The market for CLT in the CWSF region is estimated to be 9 million cubic feet in 2020 (translating to ~100 million Scribner board feet of increased log demand). By 2025, the market is expected to double.
Mass timber panel manufacturing is expanding rapidly to meet growing demand. Of the 15 existing and announced plants, 5 are located in CWSF states.
CLT producers will likely focus on purchasing #2 grade lumber in 2x6 and 2x8 sizes. This combination of grade and size represents about 20% of the output of a typical dimension lumber mill.
Reductions in timber supply across Canada have limited that country’s total softwood lumber production potential, but lumber production capacity is expanding rapidly across the U.S. South.
Overall, North American lumber production is expected to rise over the next five years, but demand is expected to rise even faster.
Log demand will be strong in Western states throughout the forecast, with the potential to draw additional volumes of timber from forest restoration treatments, especially on undermanaged federal lands. State forest programs may have the opportunity to drive more federal timber into the market using Good Neighbor Authority agreements.