west-wide climate risk assessments - montana dnrc
TRANSCRIPT

West-Wide Climate Risk Assessments: Irrigation Demand and Reservoir Projections
Missouri Headwaters Basin Study and Impacts Assessment
Stakeholder Meeting – December 1, 2016

Background
• Public Law 111-11, Subtitle F (SECURE Water Act, SWA, 2009) § 9503.
• Climate change risks for water and environmental resources in “major Reclamation river basins.”
• Reclamation’s WaterSMART (Sustain and Manage America’s Resources for Tomorrow) program
1. Basin Studies
2. West-Wide Climate Risk Assessments
(WWCRAs)
3. Landscape Conservation Cooperatives
(LCCs)
SECURE – Science and Engineering to Comprehensively Understand and Responsibly Enhance
8 major Reclamation River Basins

SECURE Water Act Reporting
• Risks – Change in snowpack
– Groundwater recharge and discharge
– Increases in water demand or reservoir evaporation as result of increasing temperature
• Impacts – Ability to deliver water
– Hydroelectric power generation
– Recreation at Reclamation facilities
– Fish and wildlife habitat
– Endangered, threatened, candidate species
– Water quality issues
– Flow dependent ecological resiliency
– Flood control management
Goals
• Provide a scientifically sound and widely accepted basis for estimating historical and future irrigation water demands and reservoir evaporation
• Utilize gridded weather data of historical and future climate variables: • Historical (Maurer et al. 2002, (1950-1999))
• Future BCSD (Bias-Correction Spatial Disaggregation) GCM projections
• Apply a widely accepted approach for regional computation of reference ET, crop ET, irrigation water requirements, and lake/reservoir evaporation
• ASCE Penmen-Monteith standardized reference ET (ASCE-PM)
• Modified FAO-56 dual crop coefficient approach to calculate crop ET
• Complementary Relationship Lake Evaporation model (CRLE) to calculate reservoir evaporation

Crop ET – ET Demands Model
• ET Demands model is a ASCE-PM reference ET and dual crop coefficient model (Allen and Robison, 2009; Huntington and Allen, 2010)
• ASCE-PM – daily temperature, solar radiation, dewpoint, wind speed
• Used to compute crop ET and net irrigation water requirements
• Considers variable growing season lengths based on 30 day average
temperature, growing degree days (GDD), and killing frost temperatures
• T30 and GDD thresholds control planting, greenup, development and harvest were calibrated for a crop specific to that basin
• Growing and non-growing season estimation of daily ET
• Maintains daily soil and root zone water balances to simulate irtrigation events, estimate effective precipitation, and ultimately the Net Irrigation Water Requirement (NIWR)
• NIWR = Crop ET – (PPT – runoff – deep perc.)

Meteorology and Climate • Use gridded climate to force irrigation water demand and
reservoir evaporation models • Historical - ⅛° grid, Maurer et al. (2002), 1950-1999
• Future - Bias Correction, Spatially Disaggregation (BCSD) CMIP3 gridded data (downscaled to the Maurer ⅛° grid)
• 3 emission paths (B1 [low], A1B [med], A2 [high]) used
• 16 GCMs
• 112 climate projections
• 3 futures used to assess changes in demand through the 21st century
• 2010-2039 (2020s)
• 2040-2069 (2050s)
• 2070-2099 (2080s)
• Further bias correction to NWS/COOP weather station data was performed to Maurer and BCSD data
• Account for differences in Temp and PPT (i.e. account for elevation differences between the station and ⅛° grid grid cell)
• Represent valley floor conditions (i.e. where agriculture and reservoirs are)

Meteorology • Valley / agricultural NWS/COOP Met Nodes (>700) were used for simulating historical and
future climate, irrigation demands, and reservoir evaporation
• Met Node results were assigned to respective HUC8s (1 - 2 Met Nodes for each HUC8)

Climate • 5 climate change scenarios utilizing ensemble informed hybrid delta
(HDe) method for forcing crop ET model
• Warm, Dry (S1)
• Warm, Wet (S2)
• Hot, Dry (S3)
• Hot, Wet (S4)
• Central Tendency (S5)
S1 S2
S3 S4
S5

Open Water Evaporation Modeling • The Complementary Relationship Lake Evaporation (CRLE) model (Morton et al.,
1985) was utilized to simulate open water evaporation from 12 reservoirs / lakes
• Energy balance based approach
• Takes into account seasonal heat storage leading to the potential shift in seasonal evaporation
• Relies on commonly measured and estimated climate observations (air temp, solar radiation, dewpoint)
• Relatively insensitive to the contrasts between the open water and land environments

Meteorology and Climate
Agrimet
COOP with long record
for bias correction
of BCSD
CRLE model Met Node example: American Falls Reservoir, Columbia Basin
• Used COOP/NWS
station for bias correction of Maurer and BCSD data
• Estimated daily (Tmax-Tmin) and solar using bias corrected Maurer and future BCSD
• Estimated mean monthly dewpoint depression from nearby Agrimet station
• Transient climate
1/8 deg. cells
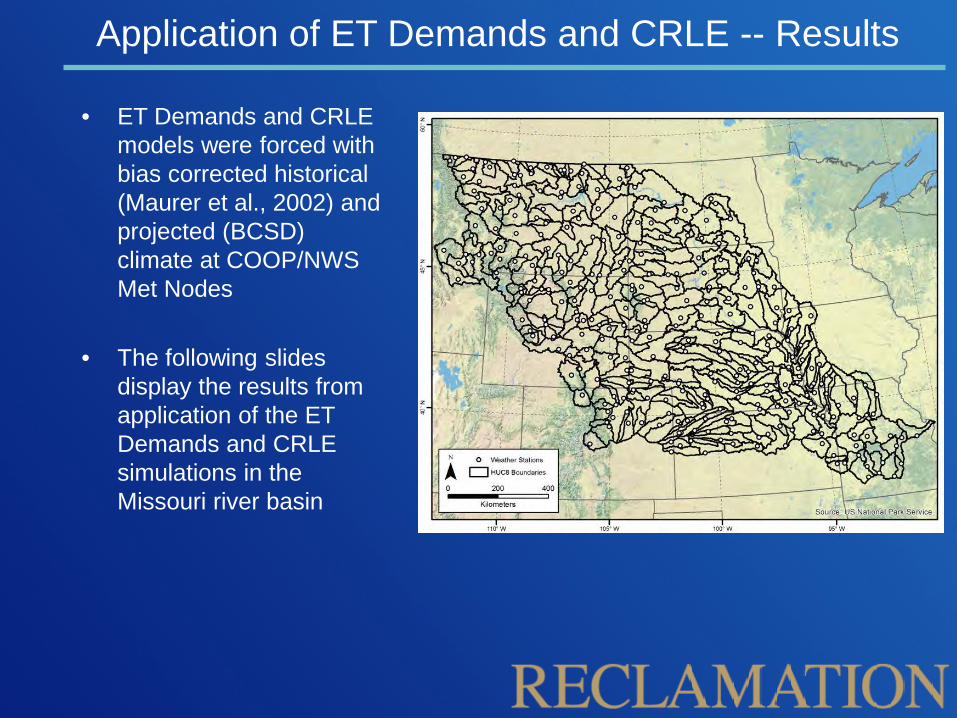
Application of ET Demands and CRLE -- Results
• ET Demands and CRLE
models were forced with bias corrected historical (Maurer et al., 2002) and projected (BCSD) climate at COOP/NWS Met Nodes
• The following slides display the results from application of the ET Demands and CRLE simulations in the Missouri river basin
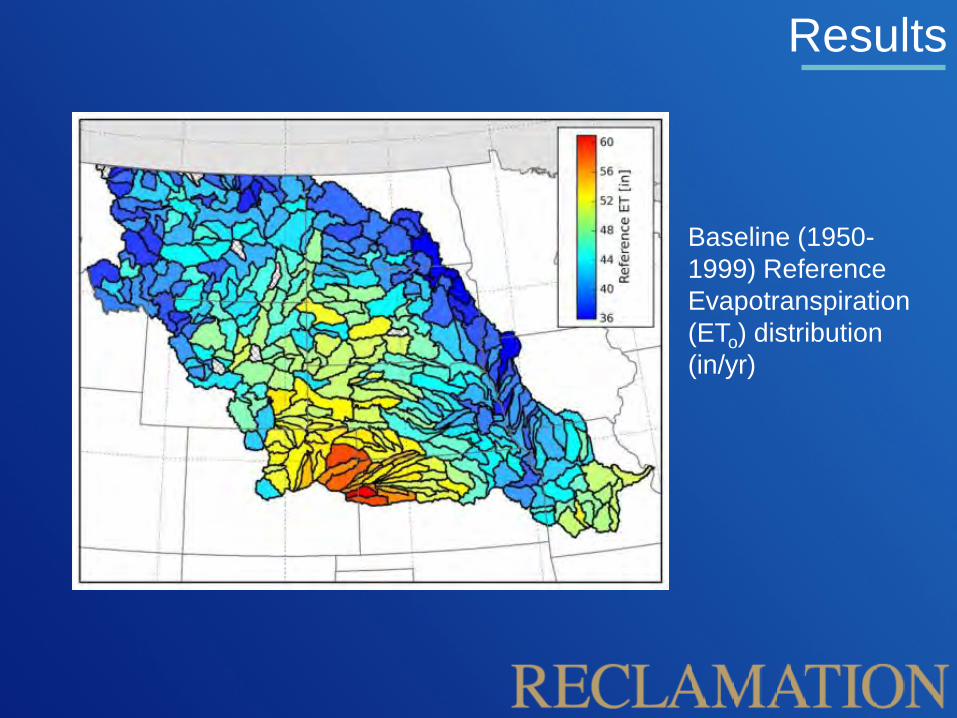
Results
Baseline (1950-1999) Reference Evapotranspiration (ETo) distribution (in/yr)

Results
Baseline (1950-1999) Crop Evapotranspiration distribution (in/yr)

Results
Baseline (1950-1999) Net Irrigation Water Requirement distribution (in/yr)
NIWR = f(PPT & Crop ET)
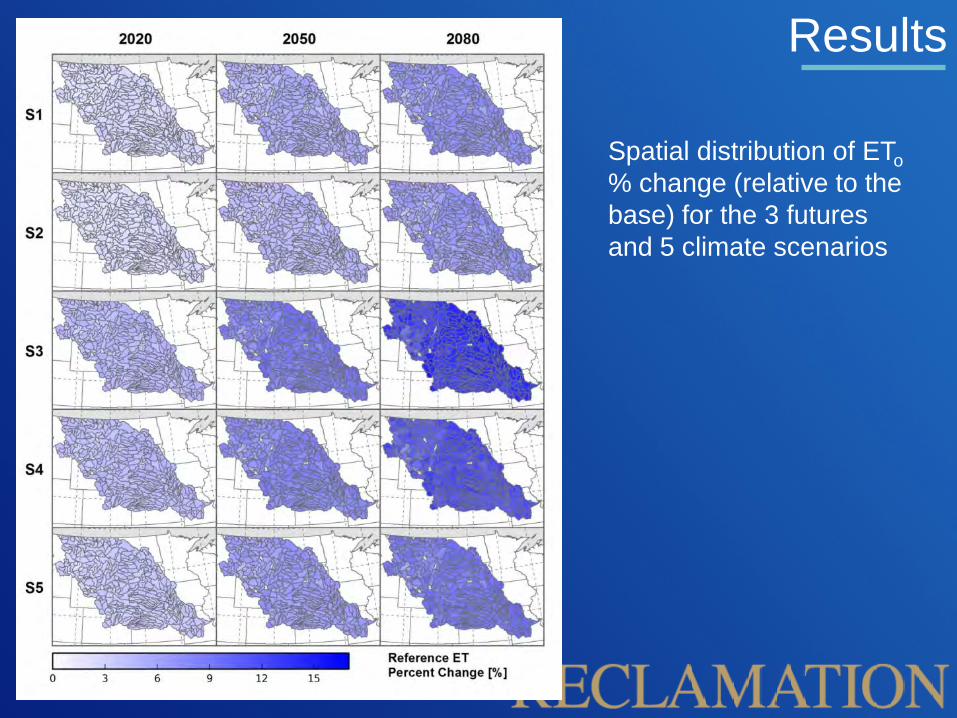
Results
Spatial distribution of ETo % change (relative to the base) for the 3 futures and 5 climate scenarios

Results
Spatial distribution of crop ET % change (relative to the base) for the 3 futures and 5 climate scenarios

Results
Spatial distribution of Net Irrigation Water Requirement (NIWR) % change (relative to the base) for the 3 futures and 5 climate scenarios
NIWR = f(PPT & Crop ET)

Agricultural Cropping
Crop types and acreages for each basin were developed from the following sources: Basin Crop Source
San Joaquin Cropland Data Layer
Sacramento Cropland Data Layer
Colorado Ag Statistics Service Census of Agriculture Cropland Data Layer
Klamath Irrigation Project Data Cropland Data Layer
Missouri Great Plains Regional Database
Rio Grande Cropland Data Layer
Truckee Cropland Data Layer
Columbia Cropland Data Layer

CRLE -- Results

Results
Canyon Ferry median, 5th and 95th percentile annual Precipitation, Temperature, Evaporation and Net Evaporation (evaporation minus precipitation)

Results
Canyon Ferry mean monthly ensemble median and 5th and 95th percentile reservoir evaporation and net evaporation.

West-Wide Summary • Precipitation projections are highly variable and basin dependent, with the
ensemble median scenario (S5) showing both slight increases and decreases within most basins.
• Temperature shows a persistent increasing trend from the baseline level.
• Reference evapotranspiration is projected to increase in all basins.
• Crop evapotranspiration is projected to increase in areas where perennial crops are grown, and with smaller increases, and sometime slight decreases, in areas where annual crops are grown. For the static phenology (baseline temp. for annual crops only) case, crop evapotranspiration in most all basins and subareas is projected to increase.
• Because the NIWR incorporates growing season and non-growing season soil moisture gains and losses from precipitation, bare soil evaporation, and crop ET, projections of NIWR are largely uncertain and heavily dependent on the precipitation scenario being considered.
• The ensemble median of annual reservoir evaporation and net evaporation is projected to increase in all basins.

West-Wide Summary

Contributing Authors:
Reclamation Subhrendu Gangopadhyay
David King
Mark Spears
Alan Harrison
Tom Pruitt
Desert Research Institute Justin Huntington
Charles Morton
Christian Dunkerly
Mark Lobsinger
Daniel McEvoy
Andy Joros
University of Idaho Richard Allen
Report Website http://www.usbr.gov/watersmart/wcra/

Questions?
Twin Falls, ID – Reclamation AgriMet