massachusetts srec-i and srec-ii update april 10, … · 37,028 19,737 606,748 128,995 -100,000...
TRANSCRIPT

Massachusetts SREC-I and SREC-II Update
April 10, 2018
CONTENTS
• MA SREC-I Exempt-Load Adjusted Compliance Obligations
• 2017 MA SREC-I Supply and Demand Forecast
• 2018 MA SREC-I Supply and Demand Forecast
• MA2017 & MA2018 SREC-I Pricing
• MA SREC-II Eligible Cumulative Build Rates
• MA SREC-II Change in Solar Build Rates
• MA SREC-II Exempt-Load Adjusted Compliance Obligations
• 2017 MA SREC-II Supply and Demand Forecast
• 2018 MA SREC-II Supply and Demand Forecast
• MA2017 & MA2018 SREC-II Pricing
Disclaimer. This document, data, and/or any of its components (collectively, the “Materials”) are for informational purposes only. The Materials are not intended as investment, tax, legal, or financial advice, or
as an offer or solicitation for the purpose or sale of any financial instrument. SRECTrade, Inc. does not warranty or guarantee the market data or other information included herein, as to its completeness,
accuracy, or fitness for a particular purpose, express or implied, and such market data and information are subject to change without notice. Past performance should not be taken as an indication or guarantee
of future performance, and no representation or warranty, express or implied, is made regarding future performance. Any comments or statements made herein do not necessarily reflect those of SRECTrade,
Inc. SRECTrade, Inc. may have issued, and may in the future issue, other communications, data, or reports that are inconsistent with, and reach different conclusions from, the information presented herein.
Copyright. This document is protected by copyright laws and contains material proprietary to SRECTrade, Inc. This document, data, and/or any of its components (collectively, the “Materials”) may not be
reproduced, republished, distributed, transmitted, displayed, broadcasted or otherwise disseminated or exploited in any manner without the express prior written permission of SRECTrade, Inc. The receipt or
possession of the Materials does not convey any rights to reproduce, disclose, or distribute its contents, or to manufacture, use, or sell anything that it may describe, in whole or in part. If consent to use the
Materials is granted, reference and sourcing must be attributed to the Materials and to SRECTrade, Inc. If you have questions about the use or reproduction of the Materials, please contact SRECTrade, Inc.2
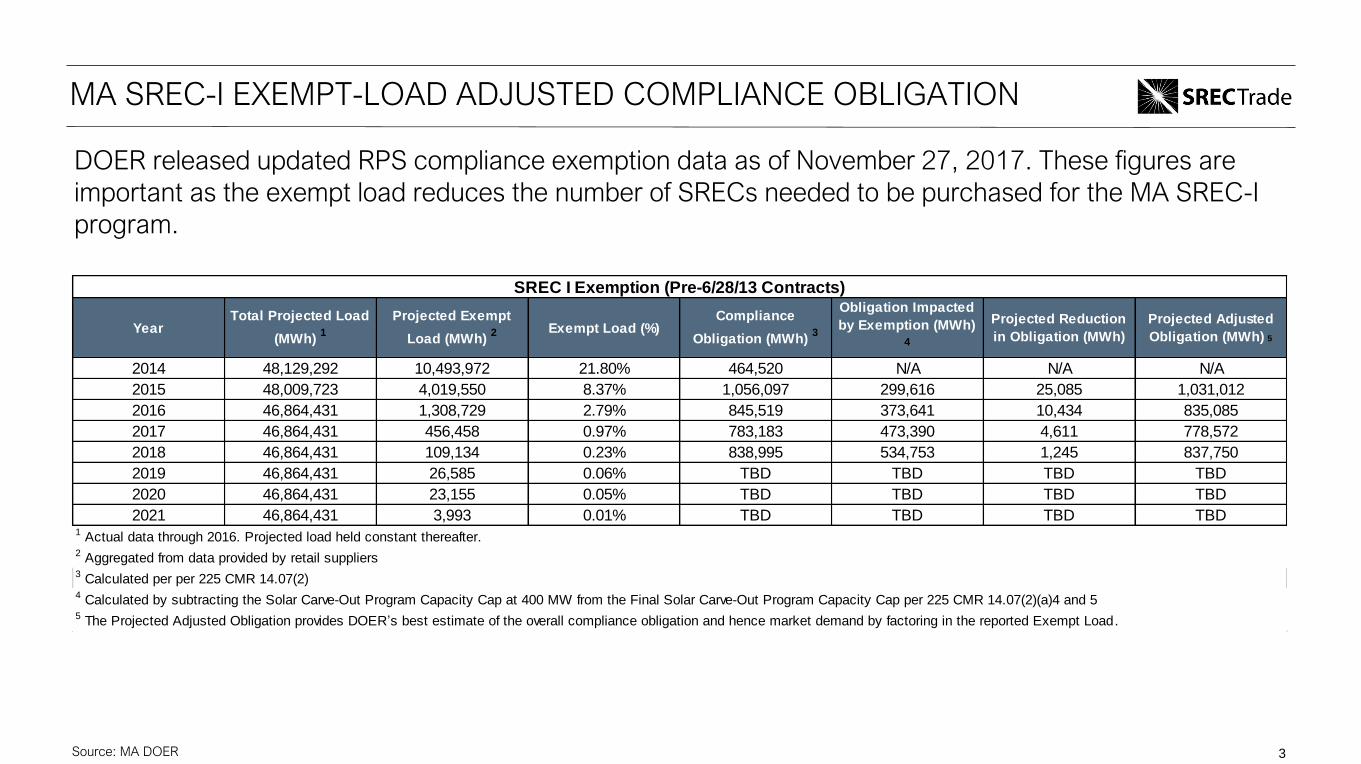
MA SREC-I EXEMPT-LOAD ADJUSTED COMPLIANCE OBLIGATION
DOER released updated RPS compliance exemption data as of November 27, 2017. These figures are
important as the exempt load reduces the number of SRECs needed to be purchased for the MA SREC-I
program.
3Source: MA DOER
YearTotal Projected Load
(MWh) 1
Projected Exempt
Load (MWh) 2 Exempt Load (%)
Compliance
Obligation (MWh) 3
Obligation Impacted
by Exemption (MWh) 4
Projected Reduction
in Obligation (MWh)
Projected Adjusted
Obligation (MWh) 5
2014 48,129,292 10,493,972 21.80% 464,520 N/A N/A N/A
2015 48,009,723 4,019,550 8.37% 1,056,097 299,616 25,085 1,031,012
2016 46,864,431 1,308,729 2.79% 845,519 373,641 10,434 835,085
2017 46,864,431 456,458 0.97% 783,183 473,390 4,611 778,572
2018 46,864,431 109,134 0.23% 838,995 534,753 1,245 837,750
2019 46,864,431 26,585 0.06% TBD TBD TBD TBD
2020 46,864,431 23,155 0.05% TBD TBD TBD TBD
2021 46,864,431 3,993 0.01% TBD TBD TBD TBD
5 The Projected Adjusted Obligation provides DOER’s best estimate of the overall compliance obligation and hence market demand by factoring in the reported Exempt Load.
SREC I Exemption (Pre-6/28/13 Contracts)
1 Actual data through 2016. Projected load held constant thereafter.2 Aggregated from data provided by retail suppliers3 Calculated per per 225 CMR 14.07(2)4 Calculated by subtracting the Solar Carve-Out Program Capacity Cap at 400 MW from the Final Solar Carve-Out Program Capacity Cap per 225 CMR 14.07(2)(a)4 and 5
19,737 37,028
606,748
128,995
-
100,000
200,000
300,000
400,000
500,000
600,000
700,000
800,000
900,000
MA SREC-I 2017 Generation and Compliance Obligation (SRECs)
Reminted SRECs Banked SRECs
SRECs Generated Q1/17, Q2/17, and Q3/17 Proj. SREC Generation Q4/17
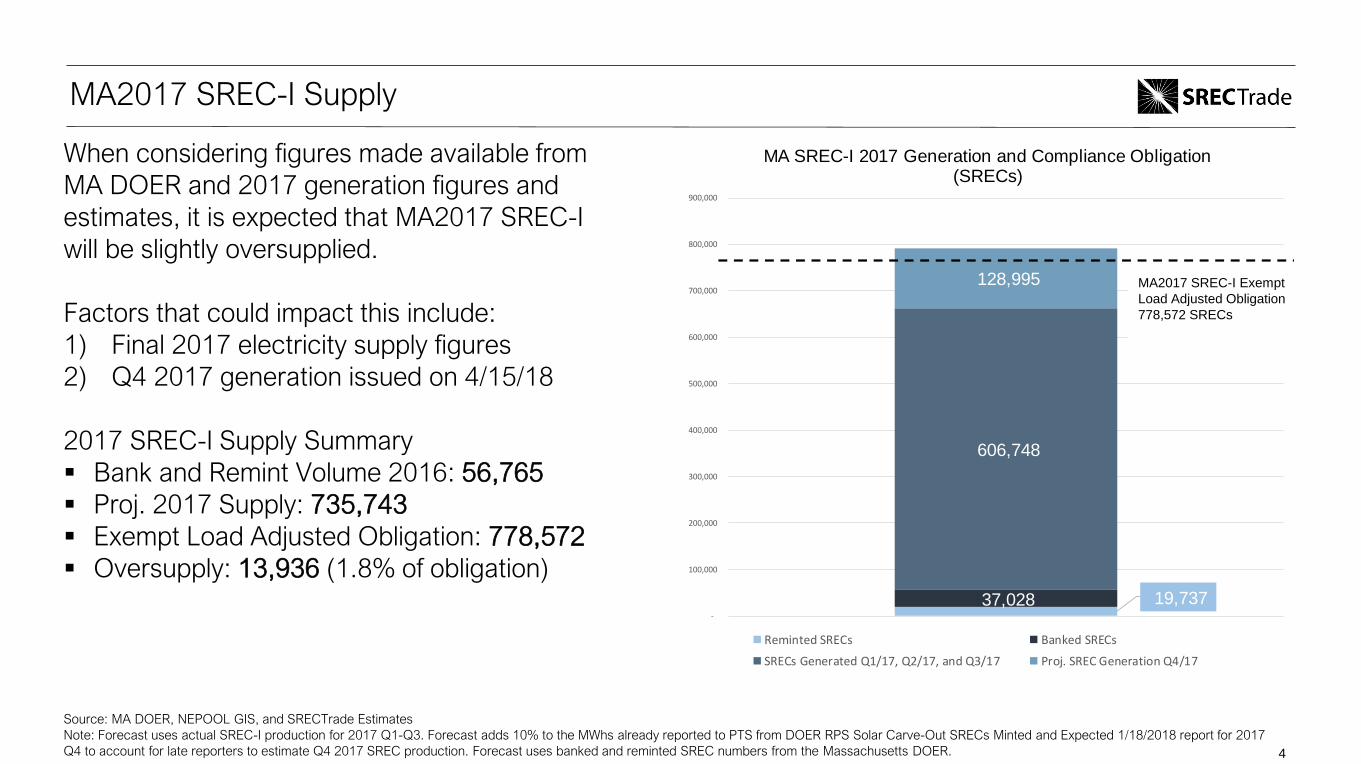
MA2017 SREC-I Supply
When considering figures made available from
MA DOER and 2017 generation figures and
estimates, it is expected that MA2017 SREC-I
will be slightly oversupplied.
Factors that could impact this include:
1) Final 2017 electricity supply figures
2) Q4 2017 generation issued on 4/15/18
2017 SREC-I Supply Summary
▪ Bank and Remint Volume 2016: 56,765
▪ Proj. 2017 Supply: 735,743
▪ Exempt Load Adjusted Obligation: 778,572
▪ Oversupply: 13,936 (1.8% of obligation)
Source: MA DOER, NEPOOL GIS, and SRECTrade Estimates
Note: Forecast uses actual SREC-I production for 2017 Q1-Q3. Forecast adds 10% to the MWhs already reported to PTS from DOER RPS Solar Carve-Out SRECs Minted and Expected 1/18/2018 report for 2017
Q4 to account for late reporters to estimate Q4 2017 SREC production. Forecast uses banked and reminted SREC numbers from the Massachusetts DOER. 4
MA2017 SREC-I Exempt
Load Adjusted Obligation
778,572 SRECs
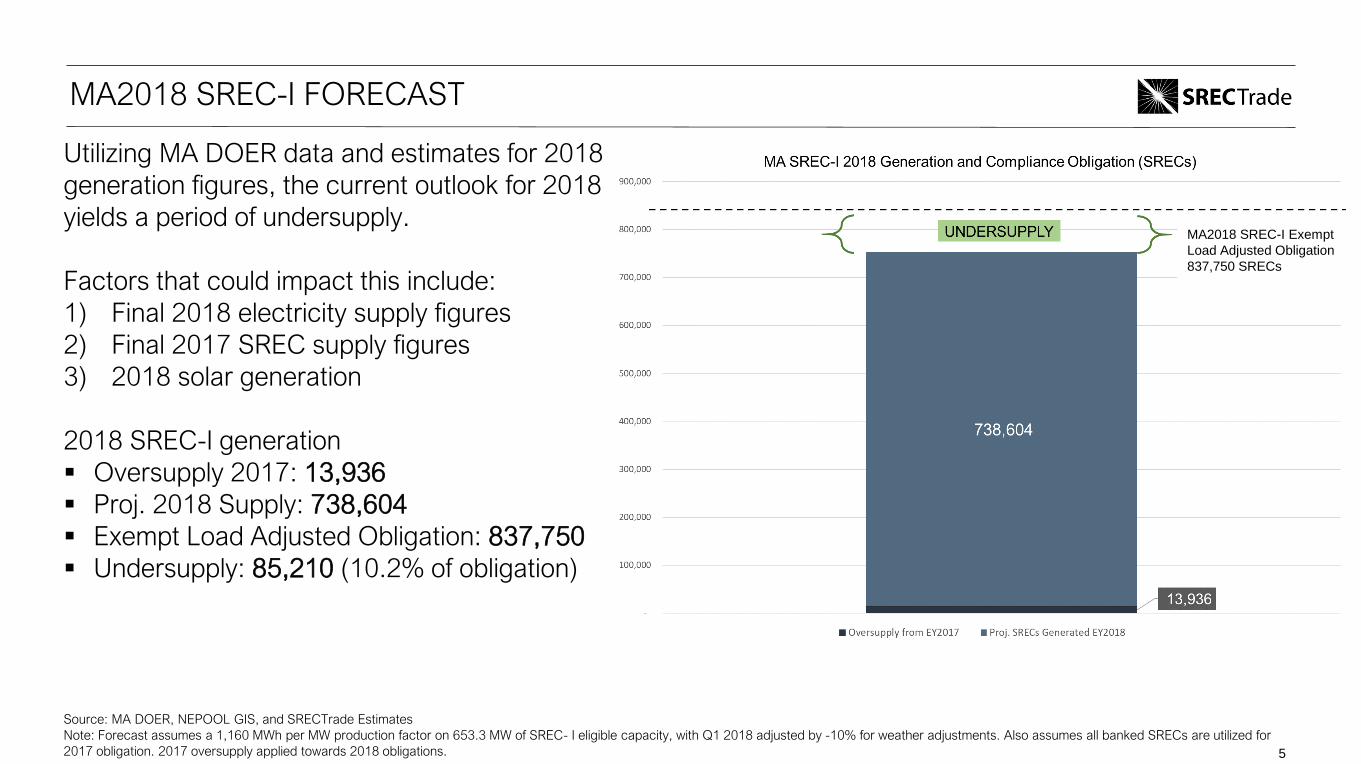
MA2018 SREC-I FORECAST
Utilizing MA DOER data and estimates for 2018
generation figures, the current outlook for 2018
yields a period of undersupply.
Factors that could impact this include:
1) Final 2018 electricity supply figures
2) Final 2017 SREC supply figures
3) 2018 solar generation
2018 SREC-I generation
▪ Oversupply 2017: 13,936
▪ Proj. 2018 Supply: 738,604
▪ Exempt Load Adjusted Obligation: 837,750
▪ Undersupply: 85,210 (10.2% of obligation)
Source: MA DOER, NEPOOL GIS, and SRECTrade Estimates
Note: Forecast assumes a 1,160 MWh per MW production factor on 653.3 MW of SREC- I eligible capacity, with Q1 2018 adjusted by -10% for weather adjustments. Also assumes all banked SRECs are utilized for
2017 obligation. 2017 oversupply applied towards 2018 obligations. 5
MA2018 SREC-I Exempt
Load Adjusted Obligation
837,750 SRECs

MA2017 & MA2018 SREC-I PRICING
Source: SRECTrade Market Insights
MA
Current MA17 SREC-I market: $303 bid @ $310 offer
Current MA18 SREC-I market: $340 bid @ $350 offer
6
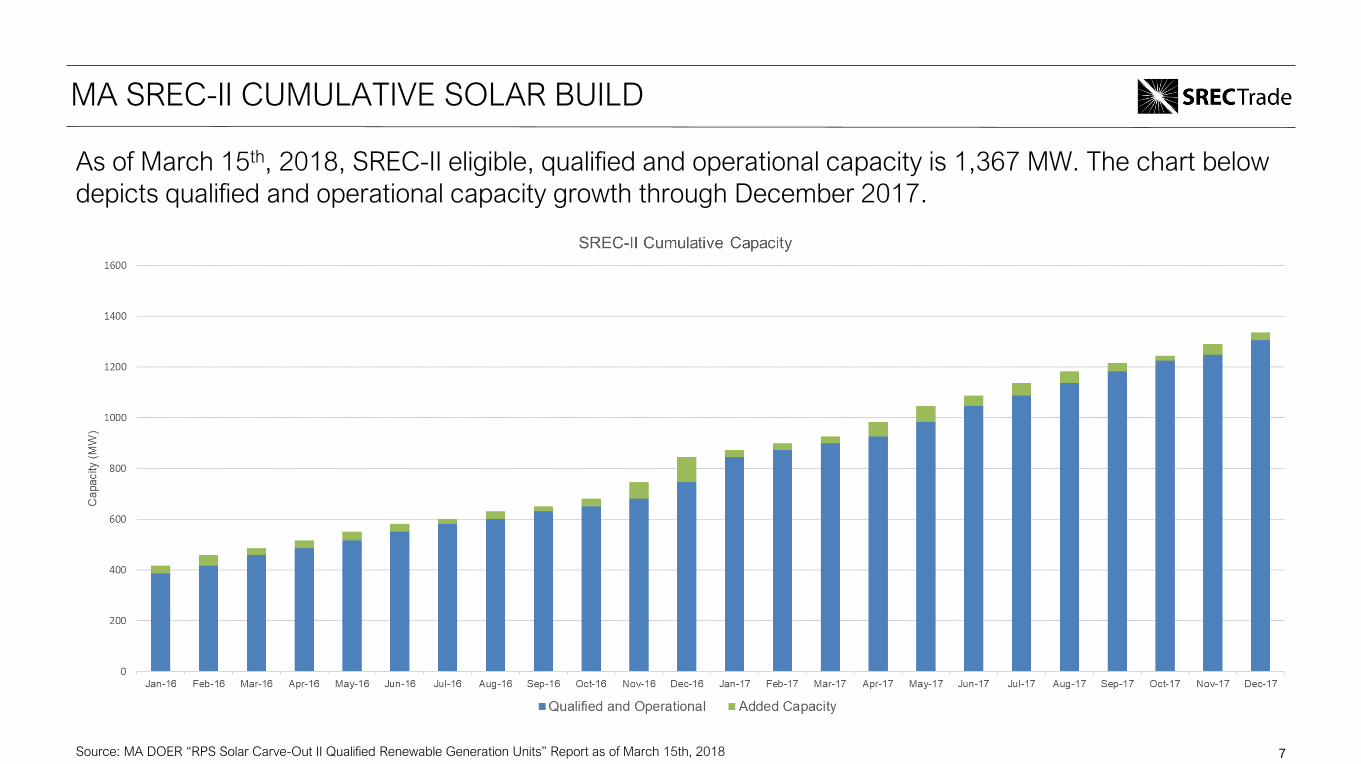
MA SREC-II CUMULATIVE SOLAR BUILD
As of March 15th, 2018, SREC-II eligible, qualified and operational capacity is 1,367 MW. The chart below
depicts qualified and operational capacity growth through December 2017.
Source: MA DOER “RPS Solar Carve-Out II Qualified Renewable Generation Units” Report as of March 15th, 2018 7
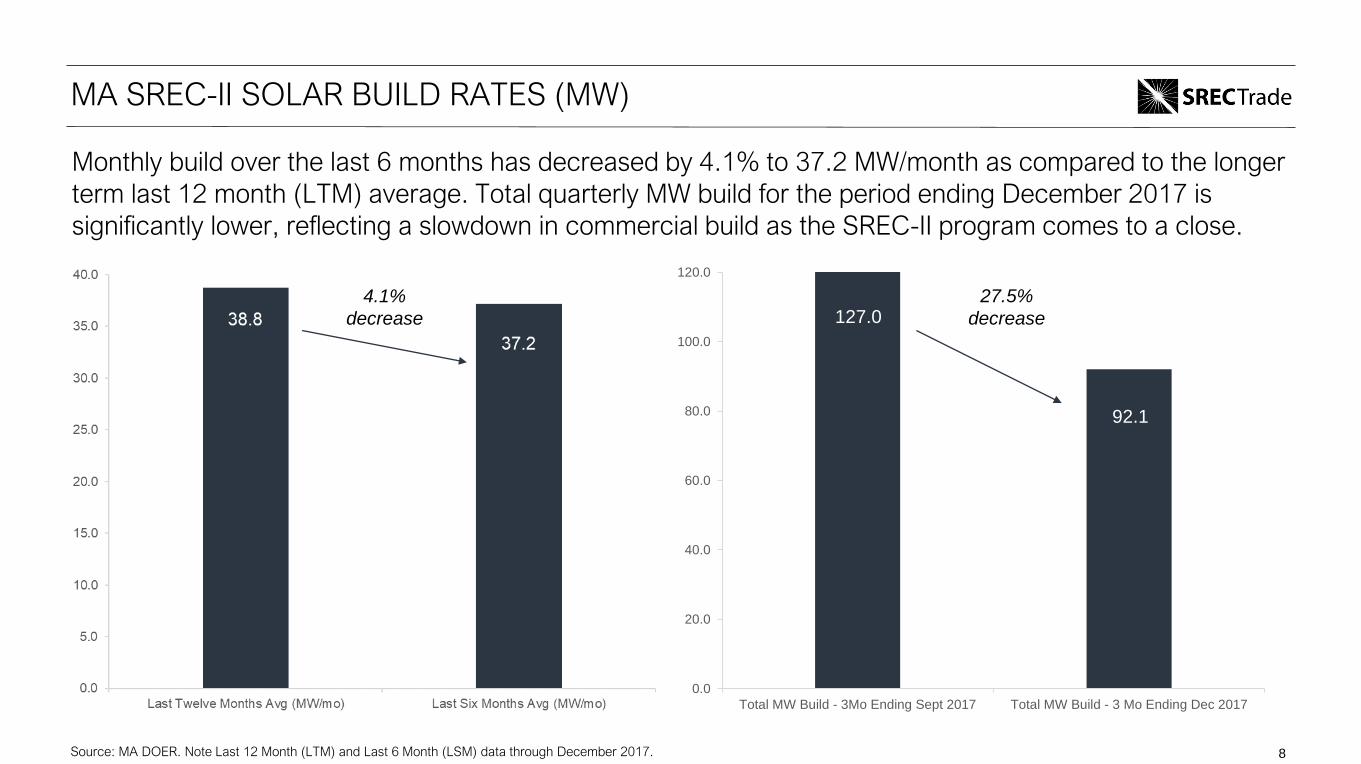
127.0
92.1
0.0
20.0
40.0
60.0
80.0
100.0
120.0
Total MW Build - 3Mo Ending Sept 2017 Total MW Build - 3 Mo Ending Dec 2017
MA SREC-II SOLAR BUILD RATES (MW)
Source: MA DOER. Note Last 12 Month (LTM) and Last 6 Month (LSM) data through December 2017.
Monthly build over the last 6 months has decreased by 4.1% to 37.2 MW/month as compared to the longer
term last 12 month (LTM) average. Total quarterly MW build for the period ending December 2017 is
significantly lower, reflecting a slowdown in commercial build as the SREC-II program comes to a close.
8
4.1%
decrease
27.5%
decrease
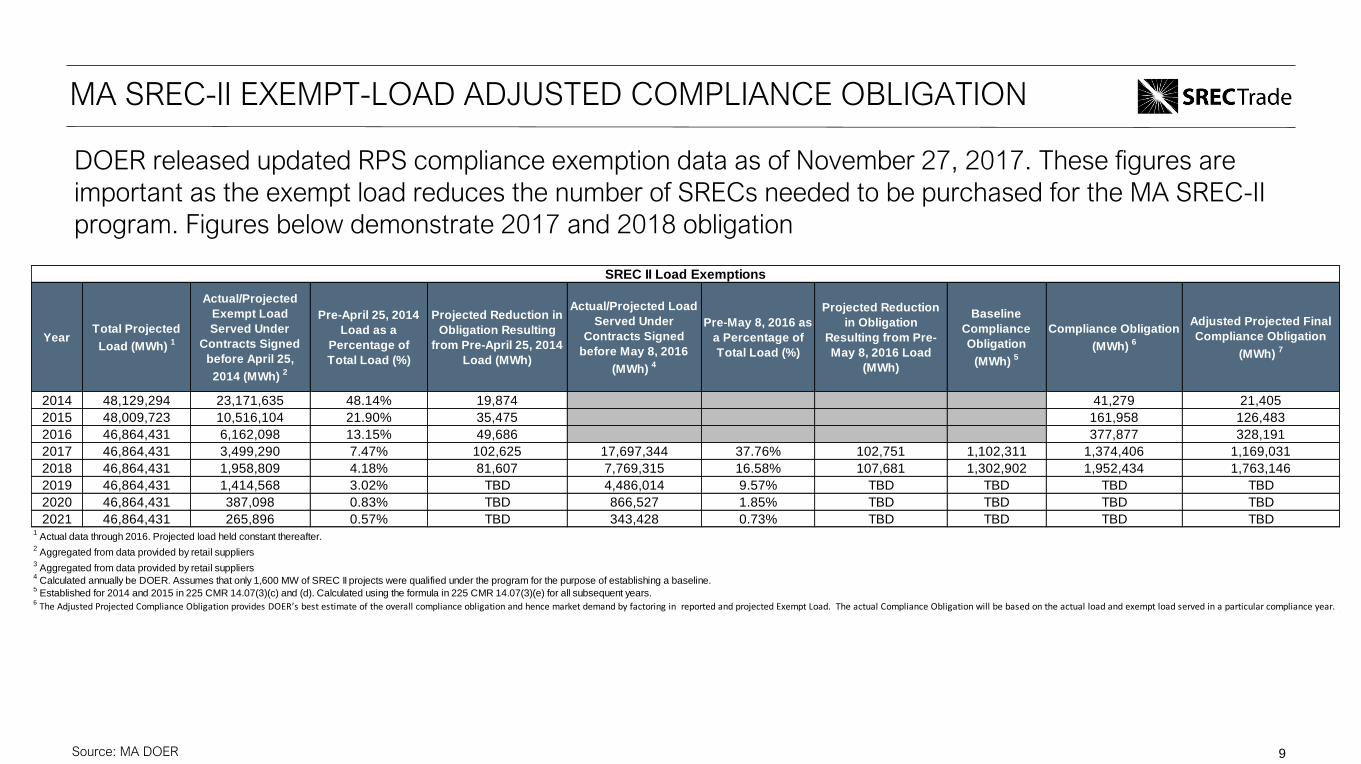
MA SREC-II EXEMPT-LOAD ADJUSTED COMPLIANCE OBLIGATION
DOER released updated RPS compliance exemption data as of November 27, 2017. These figures are
important as the exempt load reduces the number of SRECs needed to be purchased for the MA SREC-II
program. Figures below demonstrate 2017 and 2018 obligation
9Source: MA DOER
YearTotal Projected
Load (MWh) 1
Actual/Projected
Exempt Load
Served Under
Contracts Signed
before April 25,
2014 (MWh) 2
Pre-April 25, 2014
Load as a
Percentage of
Total Load (%)
Projected Reduction in
Obligation Resulting
from Pre-April 25, 2014
Load (MWh)
Actual/Projected Load
Served Under
Contracts Signed
before May 8, 2016
(MWh) 4
Pre-May 8, 2016 as
a Percentage of
Total Load (%)
Projected Reduction
in Obligation
Resulting from Pre-
May 8, 2016 Load
(MWh)
Baseline
Compliance
Obligation
(MWh) 5
Compliance Obligation
(MWh) 6
Adjusted Projected Final
Compliance Obligation
(MWh) 7
2014 48,129,294 23,171,635 48.14% 19,874 41,279 21,405
2015 48,009,723 10,516,104 21.90% 35,475 161,958 126,483
2016 46,864,431 6,162,098 13.15% 49,686 377,877 328,191
2017 46,864,431 3,499,290 7.47% 102,625 17,697,344 37.76% 102,751 1,102,311 1,374,406 1,169,031
2018 46,864,431 1,958,809 4.18% 81,607 7,769,315 16.58% 107,681 1,302,902 1,952,434 1,763,146
2019 46,864,431 1,414,568 3.02% TBD 4,486,014 9.57% TBD TBD TBD TBD
2020 46,864,431 387,098 0.83% TBD 866,527 1.85% TBD TBD TBD TBD
2021 46,864,431 265,896 0.57% TBD 343,428 0.73% TBD TBD TBD TBD
6 The Adjusted Projected Compliance Obligation provides DOER’s best estimate of the overall compliance obligation and hence market demand by factoring in reported and projected Exempt Load. The actual Compliance Obligation will be based on the actual load and exempt load served in a particular compliance year.
SREC II Load Exemptions
4 Calculated annually be DOER. Assumes that only 1,600 MW of SREC II projects were qualified under the program for the purpose of establishing a baseline.
5 Established for 2014 and 2015 in 225 CMR 14.07(3)(c) and (d). Calculated using the formula in 225 CMR 14.07(3)(e) for all subsequent years.
1 Actual data through 2016. Projected load held constant thereafter.
2 Aggregated from data provided by retail suppliers
3 Aggregated from data provided by retail suppliers
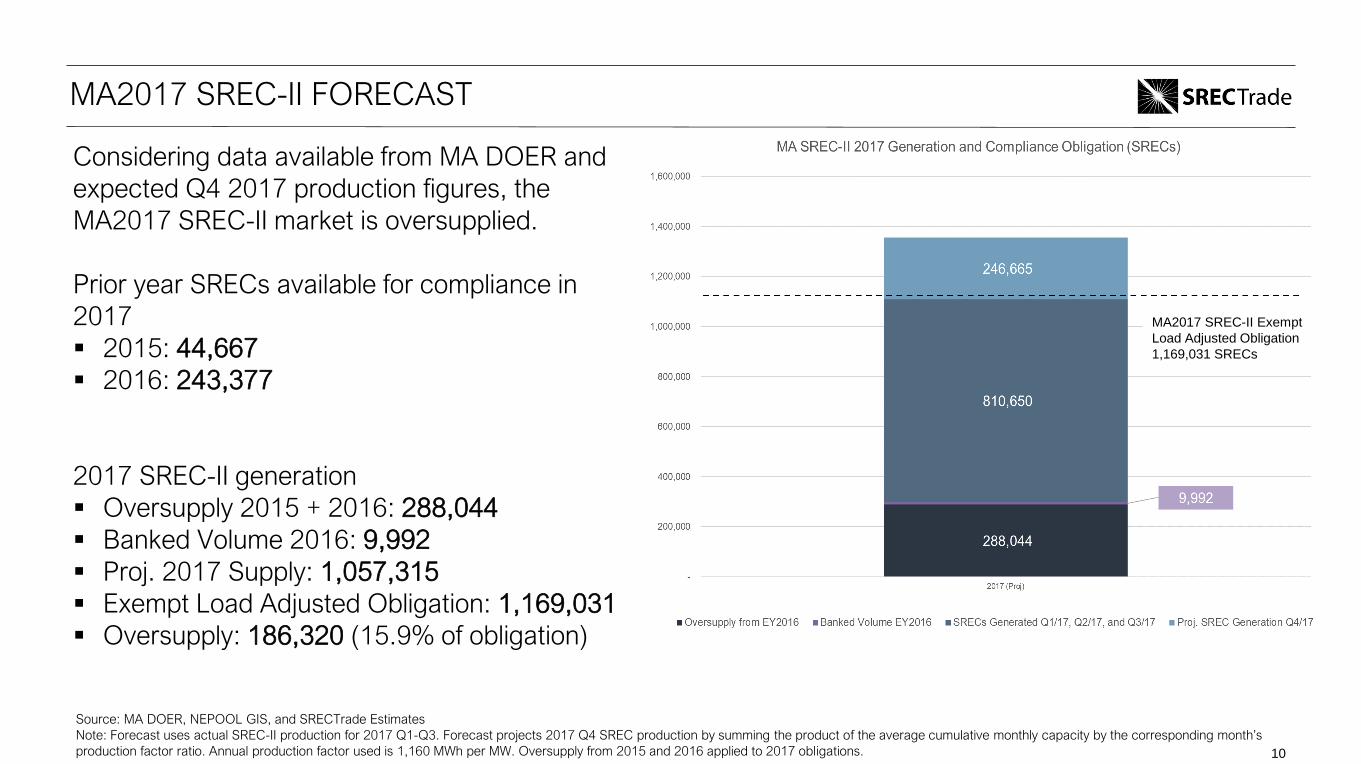
MA2017 SREC-II FORECAST
Considering data available from MA DOER and
expected Q4 2017 production figures, the
MA2017 SREC-II market is oversupplied.
Prior year SRECs available for compliance in
2017
▪ 2015: 44,667
▪ 2016: 243,377
2017 SREC-II generation
▪ Oversupply 2015 + 2016: 288,044
▪ Banked Volume 2016: 9,992
▪ Proj. 2017 Supply: 1,057,315
▪ Exempt Load Adjusted Obligation: 1,169,031
▪ Oversupply: 186,320 (15.9% of obligation)
Source: MA DOER, NEPOOL GIS, and SRECTrade Estimates
Note: Forecast uses actual SREC-II production for 2017 Q1-Q3. Forecast projects 2017 Q4 SREC production by summing the product of the average cumulative monthly capacity by the corresponding month’s
production factor ratio. Annual production factor used is 1,160 MWh per MW. Oversupply from 2015 and 2016 applied to 2017 obligations. 10
MA2017 SREC-II Exempt
Load Adjusted Obligation
1,169,031 SRECs
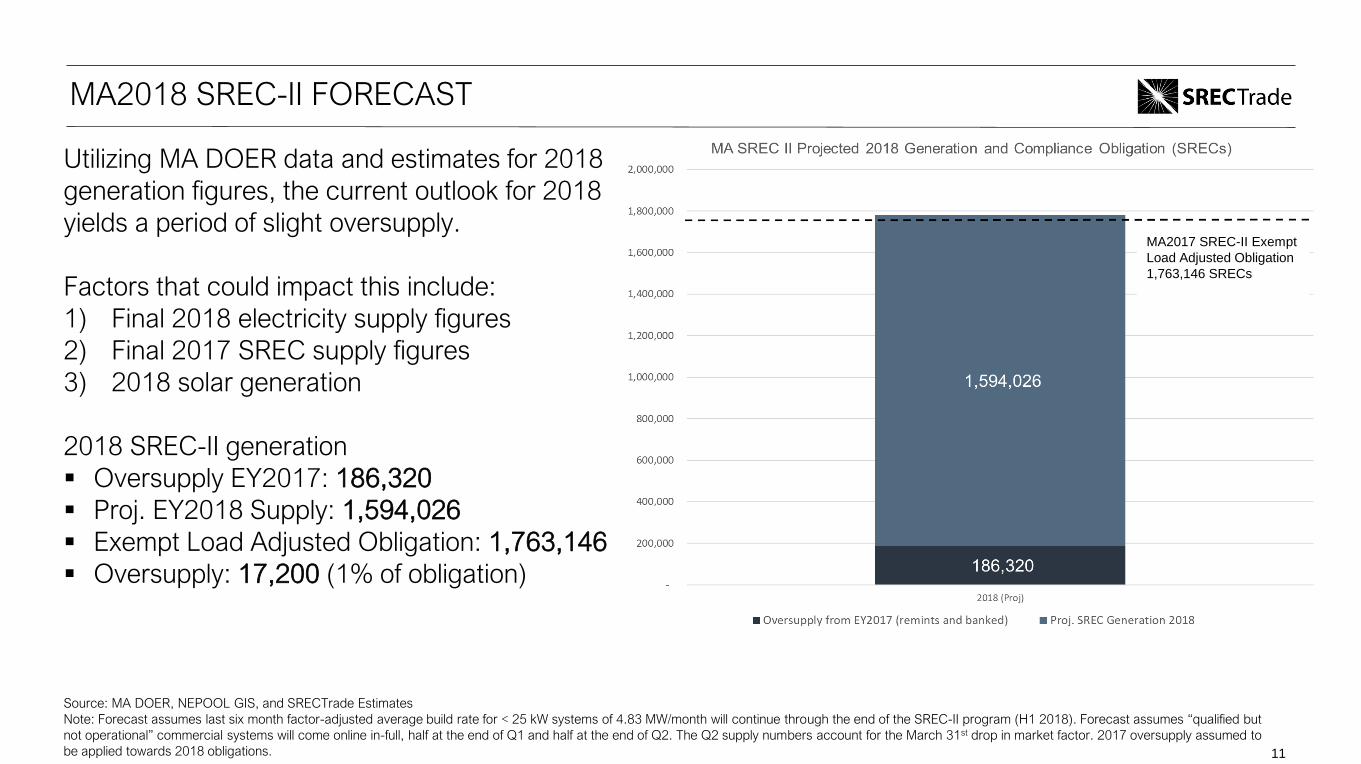
MA2018 SREC-II FORECAST
Utilizing MA DOER data and estimates for 2018
generation figures, the current outlook for 2018
yields a period of slight oversupply.
Factors that could impact this include:
1) Final 2018 electricity supply figures
2) Final 2017 SREC supply figures
3) 2018 solar generation
2018 SREC-II generation
▪ Oversupply EY2017: 186,320
▪ Proj. EY2018 Supply: 1,594,026
▪ Exempt Load Adjusted Obligation: 1,763,146
▪ Oversupply: 17,200 (1% of obligation)
Source: MA DOER, NEPOOL GIS, and SRECTrade Estimates
Note: Forecast assumes last six month factor-adjusted average build rate for < 25 kW systems of 4.83 MW/month will continue through the end of the SREC-II program (H1 2018). Forecast assumes “qualified but
not operational” commercial systems will come online in-full, half at the end of Q1 and half at the end of Q2. The Q2 supply numbers account for the March 31st drop in market factor. 2017 oversupply assumed to
be applied towards 2018 obligations. 11
MA2017 SREC-II Exempt
Load Adjusted Obligation
1,763,146 SRECs
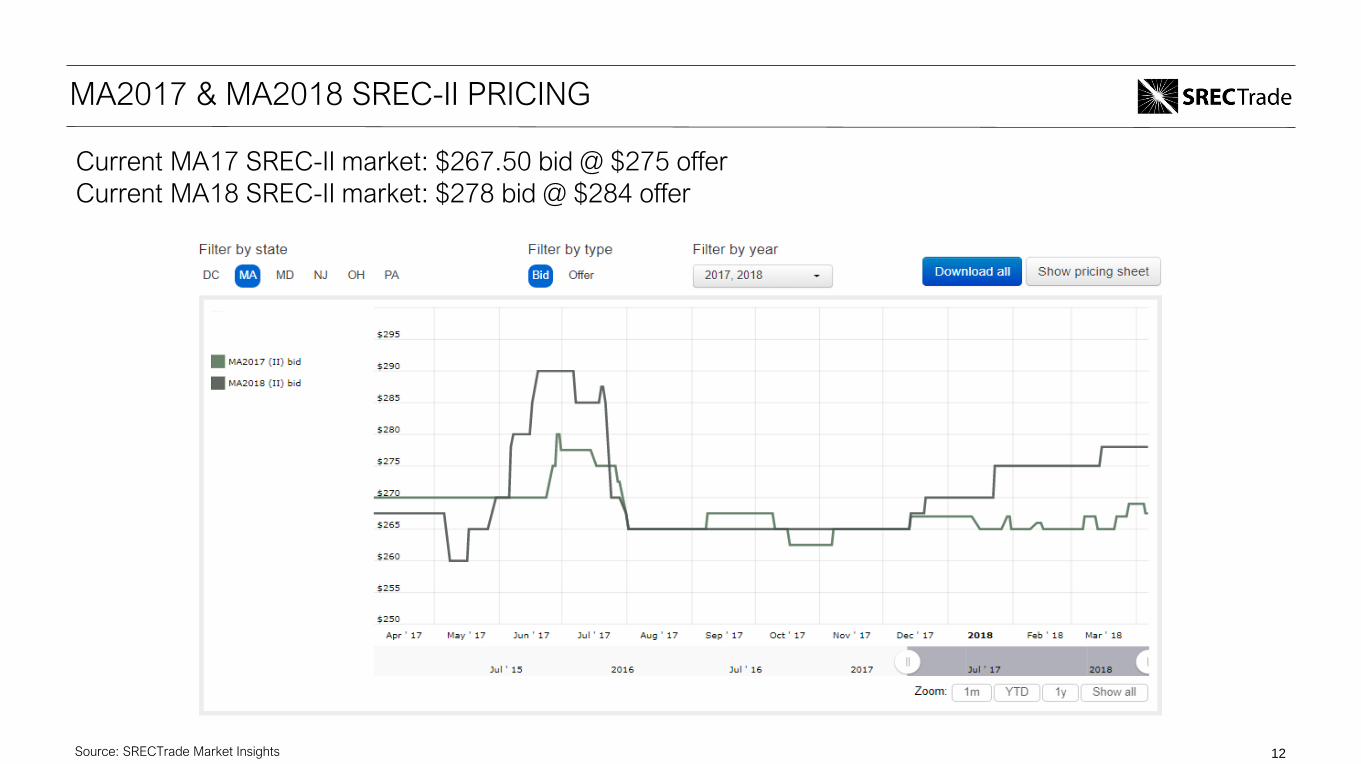
MA2017 & MA2018 SREC-II PRICING
Source: SRECTrade Market Insights
Current MA17 SREC-II market: $267.50 bid @ $275 offer
Current MA18 SREC-II market: $278 bid @ $284 offer
12