maxim integrated products, inc.d18rn0p25nwr6d.cloudfront.net/cik-0000743316/4eb83dec-ec4e-4d6… ·...
TRANSCRIPT

UNITED STATESSECURITIES AND EXCHANGE COMMISSION
Washington, D.C. 20549
FORM 10-K
(Mark One)
ý ANNUAL REPORT PURSUANT TO SECTION 13 OR 15(d) OF THE SECURITIES EXCHANGE ACT OF 1934
For the Fiscal Year Ended June 29, 2019
OR
o TRANSITION REPORT PURSUANT TO SECTION 13 OR 15(d) OF THE SECURITIES EXCHANGE ACT OF 1934
Commission File Number 001-34192
MAXIM INTEGRATED PRODUCTS, INC.(Exact name of Registrant as specified in its charter)
Delaware 94-2896096(State or other jurisdiction ofincorporation or organization)
(I.R.S. EmployerIdentification No.)
160 Rio RoblesSan Jose, California 95134
(Address of Principal Executive Offices) (Zip Code)
Registrant's telephone number, including area code: (408) 601-1000
Securities registered pursuant to Section 12(b) of the Act:
Title of each class Common stock, $0.001 par value
Trading SymbolMXIM
Name of each exchange on which registered The NASDAQ Global Select Market
Securities registered pursuant to Section 12(g) of the Act: None
Indicate by check mark if the registrant is a well-known seasoned issuer, as defined in Rule 405 of the Securities Act.
Yes ý No o
Indicate by check mark if the registrant is not required to file reports pursuant to Section 13 or Section 15(d) of the Act. Yes o No ý
Indicate by check mark whether the registrant (1) has filed all reports required to be filed by Sections 13 or 15(d) of the Securities Exchange Act of 1934 during the preceding 12months (or for such shorter period that the registrant was required to file such reports), and (2) has been subject to such filing requirements for the past 90 days. Yes ý Noo
Indicate by check mark whether the registrant has submitted electronically and posted on its corporate Web site, if any, every Interactive Data File required to be submitted andposted pursuant to Rule 405 of Regulation S-T (§232.405 of this chapter) during the preceding 12 months (or for such shorter period that the registrant was required to submitand post such files). Yes ý No o
Indicate by check mark whether the registrant is a large accelerated filer, an accelerated filer, a non-accelerated filer, or a smaller reporting company. See the definitions of“large accelerated filer,” “accelerated filer” and “smaller reporting company” in Rule 12b-2 of the Exchange Act.:
Large Accelerated Filer ý
Accelerated Filer o
Non-accelerated Filer o
Smaller Reporting Company o Emerging growth company o
If an emerging growth company, indicate by check mark if the registrant has elected not to use the extended transition period for complying with any new or revisited financialaccounting standards provided pursuant to Section 13(a) of the Exchange Act. o
Indicate by check mark whether the registrant is a shell company (as defined in Rule 12b-2 of the Exchange Act). Yes o No ý
The aggregate market value of the voting stock held by non-affiliates of the Registrant based upon the closing price of the common stock on December 29, 2018 as reported byThe NASDAQ Global Select Market was $8,902,453,605 . Shares of voting stock held by executive officers, directors and holders of more than 5% of the outstanding votingstock have been excluded from this calculation because such persons may be deemed to be affiliates. Exclusion of such shares should not be construed to indicate that any ofsuch persons possesses the power, direct or indirect, to control the Registrant, or that any such person is controlled by or under common control with the Registrant.

Number of shares outstanding of the Registrant's Common Stock, $0.001 par value, as of August 8, 2019 : 271,272,841 .
Documents Incorporated By Reference:
(1) Portions of the Registrant's Proxy Statement for its 2019 Annual Meeting of Stockholders, to be filed subsequently, are incorporated by reference into Part III of thisreport.
1

MAXIM INTEGRATED PRODUCTS, INC.
INDEX
Forward-Looking Statements 3 Part I 4Item 1. Business 4Item 1A. Risk Factors 9Item 1B. Unresolved Staff Comments 19Item 2. Properties 19Item 3. Legal Proceedings 19Item 4. Mine Safety Disclosures 20 Part II 20Item 5. Market for Registrant's Common Equity, Related Stockholder Matters and Issuer Purchases of Equity Securities 20Item 6. Selected Financial Data 21Item 7. Management's Discussion and Analysis of Financial Condition and Results of Operations 23Item 7A. Quantitative and Qualitative Disclosures about Market Risk 30Item 8. Financial Statements and Supplementary Data 31Item 9. Changes in and Disagreements with Accountants on Accounting and Financial Disclosure 31Item 9A. Controls and Procedures 32Item 9B. Other Information 33 Part III 33Item 10. Directors, Executive Officers, and Corporate Governance 33Item 11. Executive Compensation 34Item 12. Security Ownership of Certain Beneficial Owners and Management and Related Stockholder Matters 34Item 13. Certain Relationships and Related Transactions, and Director Independence 34Item 14. Principal Accountant Fees and Services 34 Part IV 36Item 15. Exhibits and Financial Statement Schedules 36Item 16. Form 10-K Summary 79Signatures 80
2

FORWARD-LOOKING STATEMENTS
This Annual Report on Form 10-K (this “Annual Report”) contains forward-looking statements within the meaning of Section 27A of the Securities Act of 1933,as amended, and Section 21E of the Securities Exchange Act of 1934, as amended (the “Exchange Act”). These statements are based on our current expectationsand could be affected by the uncertainties and risk factors described throughout this filing and particularly in Part I, Item I - Business, Part I, Item 1A - RiskFactors and Part II, Item 7 - Management's Discussion and Analysis of Financial Condition and Results of Operations. These statements relate to, among otherthings, sales, gross margins, operating expenses, capital expenditures and requirements, liquidity, asset dispositions, product development and R&D efforts,potential growth opportunities, manufacturing plans, pending litigation, effective tax rates and tax reserves for uncertain tax positions, and are indicated by wordsor phrases such as “anticipate,” “expect,” “outlook,” “foresee,” “forecast,” “estimate,” “believe,” “should,” “could,” “intend,” “potential,” “will,” “may,” “might,”“plan,” “seek,” “predict,” “project” and variations of such words and similar words or expressions and the negatives of those terms. These statements involveknown and unknown risks, uncertainties and other factors that could cause actual results, performance or achievements to differ materially from expectations.These forward-looking statements should not be relied upon as predictions of future events as we cannot assure you that the events or circumstances reflected inthese statements will be achieved or will occur. For a discussion of some of the factors that could cause actual results to differ materially from our forward-lookingstatements, see the discussion on “Risk Factors” that appears in Part I, Item 1A of this Annual Report and other risks and uncertainties detailed in this and our otherreports and filings with the Securities and Exchange Commission (“SEC”). Given these uncertainties, you should not place undue reliance on these forward-looking statements. These forward-looking statements represent our beliefs and assumptions only as of the date of this Annual Report. We undertake no obligationto update forward-looking statements to reflect developments or information obtained after the date hereof and disclaim any obligation to do so except as requiredby applicable laws.
3

PART I
ITEM 1. BUSINESS
Overview
Maxim Integrated Products, Inc. (“Maxim Integrated” or the “Company” and also referred to as “we,” “our” or “us”) designs, develops, manufactures and marketsa broad range of linear and mixed-signal integrated circuits, commonly referred to as analog circuits, for a large number of customers in diverse geographicallocations. The analog market is fragmented and characterized by many diverse applications, a great number of product variations and, with respect to many circuittypes, relatively long product life cycles. We are a global company with a wafer manufacturing facility in the U.S., test facilities in the Philippines and Thailand,and sales and circuit design offices around the world. We also utilize third parties for manufacturing and assembly of our products. The major end-markets inwhich our products are sold are the Automotive, Communications and Data Center, Computing, Consumer, and Industrial markets.
We are a Delaware corporation originally incorporated in California in 1983. The mailing address for our headquarters is 160 Rio Robles, San Jose, California95134, and our telephone number is (408) 601-1000. Additional information about us is available on our website at www.maximintegrated.com. The contents ofour website are not incorporated into this Annual Report.
We have a 52-to-53-week fiscal year that ends on the last Saturday in June. Accordingly, every fifth or sixth fiscal year will be a 53-week fiscal year. Fiscal year2019 was a 52-week fiscal year. Fiscal year 2018 was a 53-week fiscal year. Fiscal year 2017 was a 52-week fiscal year. Fiscal year 2020 will be a 52-week fiscalyear.
We make available through our website, free of charge, our Annual Reports on Form 10-K, Quarterly Reports on Form 10-Q, Current Reports on Form 8-K, proxystatements and any amendments to those reports or statements filed or furnished pursuant to the Exchange Act, as soon as reasonably practicable after they areelectronically filed with or furnished to the SEC. The SEC also maintains an internet site at www.sec.gov that contains such reports and statements filedelectronically with the SEC by the Company. We also use our Investor Relations website at investor.maximintegrated.com as a routine channel for distribution ofother important information, such as news releases, analyst presentations and financial information. We assume no obligation to update or revise any forward-looking statements in this Annual Report, whether as a result of new information, future events or otherwise, unless we are required to do so by applicable laws. Acopy of this Annual Report is available without charge and can be accessed at our website at investor.maximintegrated.com.
The Linear and Mixed-Signal Analog Integrated Circuit Market
All electronic signals generally fall into one of two categories, linear or digital. Linear (or analog) signals represent real world phenomena, such as temperature,pressure, sound or speed, and are continuously variable over a wide range of values. Digital signals represent the “ones” and “zeros” of binary arithmetic and areeither on or off.
Three general classes of semiconductor products arise from this distinction between linear and digital signals:
• digital devices, such as memories and microprocessors that operate primarily in the digital domain;• linear devices, such as amplifiers, references, analog multiplexers and switches that operate primarily in the analog domain; and• mixed-signal devices such as data converter devices that combine linear and digital functions on the same integrated circuit and interface
between the analog and digital domains.
Our strategy has been to target both the linear and mixed-signal markets, often collectively referred to as the analog market. However, some of our products areexclusively or principally digital. While our focus continues to be on the linear and mixed-signal market, our capabilities in the digital domain enable developmentof new mixed-signal and other products with highly sophisticated digital characteristics.
Our linear and mixed-signal products serve five major end-markets: (i) Automotive, (ii) Communications and Data Center, (iii) Computing, (iv) Consumer and (v)Industrial. These major end-markets and their corresponding markets are noted in the table below:
4

MAJOR END-MARKET MARKET AUTOMOTIVE Infotainment Powertrain Body Electronics Safety & Security COMMUNICATIONS & DATA CENTER Base Stations Data Center Data Storage Network & Datacom Servers
Telecom Other Communications COMPUTING Desktop Computers
Notebook Computers Peripherals & Other Computer
CONSUMER Smartphones
Digital Cameras Handheld Computers Home Entertainment & Appliances Wearables
Other Consumer INDUSTRIAL Automatic Test Equipment
Control & Automation Electrical Instrumentation
Financial Terminals Medical Security
USB Extension Other Industrial
Product Quality
We employ a system addressing quality and reliability of our products from initial design through wafer fabrication, assembly, testing and final shipment. We havereceived ISO 9001, IATF16949 and ISO 14001 certifications for all wafer fabrication, assembly, final test and shipping facilities. Based on industry standardrequirements, we conduct reliability stress testing on the products we manufacture and sell. Through this testing, we can detect and accelerate the presence ofdefects that may arise over the life of a product.
Manufacturing
We primarily utilize third party foundries as well as our own wafer fabrication facility for the production of our wafers. The broad range of products demanded bythe analog integrated circuit market requires multiple manufacturing process technologies. As a result, many different process technologies are currently used forwafer fabrication of our products. The majority of processed wafers are also subject to parametric and functional testing at either our facilities or third-partyvendors. In fiscal year 2007, we entered into a supply agreement with Seiko Epson Corporation (“Epson”). In fiscal year 2010, we entered into a supply agreement withPowerchip Semiconductor Manufacturing Corp. (“Powerchip”) to provide 300mm wafer capacity. In fiscal year 2014, we entered into a supply agreement withUMC Corporation (“UMC”). In fiscal year 2016, we entered into a supply agreement with TowerJazz Texas, Inc. (formerly known as TJ Texas, Inc.)("TowerJazz"), an indirect wholly-owned subsidiary of Tower Semiconductor Ltd. In fiscal year 2018, we ramped production at our most recently added partnerfoundry, Fujitsu Ltd. ("Fujitsu"). Epson and Fujitsu in Japan and UMC and Powerchip in Taiwan manufacture products for us under rights and licenses using ourproprietary technology. In fiscal years 2019 , 2018 and 2017 , wafers manufactured by our partner foundries
5

and merchant foundries (e.g., Taiwan Semiconductor Manufacturing Company Limited) represented 65% , 73% and 75% respectively, of our total wafermanufacturing.
Once wafer manufacturing has been completed, wafers are sorted in order to determine which integrated circuits on each wafer are functional and which aredefective. We currently perform the majority of wafer sorting, final testing and shipping activities at two company-owned facilities, located in Cavite, thePhilippines and Chonburi Province, Thailand, although we also utilize independent subcontractors for some wafer sorting.
We process wafers for products that utilize chip scale packaging (“CSP”), also known as wafer level packaging (“WLP”). CSP, or WLP, enables integrated circuitsto be attached directly to a printed circuit board without the use of a traditional plastic package. Historically, we utilized internal manufacturing resources as wellas independent subcontractors to perform WLP manufacturing. In fiscal year 2016, we announced our intent to shut down our WLP manufacturing facility locatedin Dallas, Texas and completed this shutdown in fiscal year 2017. The manufacturing operations of the Dallas manufacturing facility were transferred to ourBeaverton, Oregon factory and assembly subcontractors, which is also part of our manufacturing transformation. Currently, all WLP processes are done externally. Integrated circuit assembly is performed by foreign assembly subcontractors, located in China, Japan, Malaysia, the Philippines, Taiwan, Thailand, Singapore andSouth Korea, where wafers are separated into individual integrated circuits and assembled into a variety of packages.
After assembly has been completed, a majority of the assembled products are shipped to our facilities located in Cavite, the Philippines or Chonburi Province,Thailand, where the packaged integrated circuits undergo final testing and preparation for customer shipment. In addition, we also utilize independentsubcontractors to perform final testing.
The majority of our finished products ship directly from either Cavite, the Philippines or Chonburi Province, Thailand to customers worldwide or to otherCompany locations for sale to end-customers or distributors.
Customers, Sales and Marketing
We market our products worldwide through a direct-sales and applications organization and through our own and other unaffiliated distribution channels to a broadrange of customers in diverse industries. Our products typically require a sophisticated technical sales and marketing effort. Our sales organization is divided intodomestic and international regions. Distributors and direct customers generally buy on an individual purchase order basis, rather than pursuant to long-termagreements.
Certain distributors have agreements with us which allow for certain sales price rebates or price adjustments on certain inventory if we change the price of thoseproducts. Certain distributor agreements also permit distributors to exchange a portion of certain purchases on a periodic basis. As is customary in thesemiconductor industry, our distributors may also market other products that compete with our products.
We derived approximately 46% of our fiscal year 2019 revenue from sales made through distributors which includes distribution sales to Samsung and catalogdistributors. Our primary distributor is Avnet Electronics ("Avnet") which accounted for 22% , 25% and 22% of our revenues in fiscal years 2019 , 2018 and 2017 ,respectively. Avnet, like our other distributors, is not an end customer, but rather serves as a channel of sale to many end users of our products. Sales to Samsung,our largest single end customer (through direct sales and distributors), accounted for approximately 10% of net revenues in fiscal years 2019 , 2018 and 2017 . Nosingle customer (other than Avnet and Samsung) nor single product accounted for 10% or more of net revenues in fiscal years 2019 , 2018 and 2017 . Based oncustomers’ ship-to locations, international sales accounted for approximately 89% , 88% and 88% of our net revenues in fiscal years 2019 , 2018 and 2017 ,respectively. See Note 10: “Segment Information” in the Notes to Consolidated Financial Statements in Part IV, Item 15(a) of this Annual Report.
Seasonality
Our revenue is generally influenced on a quarterly basis by customer demand patterns and new product introductions. A large number of our products have beenincorporated into consumer electronic products, which are subject to seasonality and fluctuations in demand.
Foreign Operations
6

We conduct business in numerous countries outside of the United States (“U.S.”). Our international business is subject to numerous risks, including fluctuations inforeign currency exchange rates and controls, import and export controls, and other laws, policies and regulations of foreign governments. Refer to our discussionof risks related to our foreign operations as included in Item 1A, Risk Factors and our discussion of foreign income included in Item 7 under “Results ofOperations” included in this Annual Report. Refer to net revenues from unaffiliated customers by geographic region included in Note 10: “Segment Information”in the Notes to Consolidated Financial Statements in Part IV, Item 15(a) of this Annual Report. Backlog
At June 29, 2019 and June 30, 2018 , our current quarter backlog was approximately $391.3 million and $441.1 million , respectively. Our current quarter backlogincludes customer request dates to be filled within the next three months. As is customary in the semiconductor industry, these orders may be canceled in mostcases without penalty to customers. Accordingly, we believe that our backlog is not a reliable measure for predicting future revenues. All backlog amounts havebeen adjusted for estimated future distribution ship and debit pricing adjustments.
Research and Development
We believe that research and development is critical to our future competitiveness. Objectives for the research and development function include:
• new product definition and development of differentiated products;• design of products with performance differentiation that achieve high manufacturing yield and reliability;• development of, and access to, manufacturing processes and advanced packaging;• development of hardware, software, and algorithms to support the acceptance and design-in of our products in the end customer's system; and• development of high-integration products across multiple end markets.
Our research and development plans require engineering talent and tools for product definition, electronic design automation (“EDA”), circuit design, processtechnologies, test development, test technology, packaging development, software development and applications support. Research and development expenseswere $435.2 million , $450.9 million and $454.0 million in fiscal years 2019 , 2018 and 2017 , respectively. See “Research and Development” under Item 7,Management's Discussion and Analysis of Financial Condition and Results of Operations, for more information.
Competition
The linear and mixed-signal analog integrated circuit industry is intensely competitive, and virtually all major semiconductor companies presently compete with, orconceivably could compete with, some portion of our business.
We believe the principal elements of competition include:
• technical innovation;• service and support;• time to market;• business, operational, marketing and financial strategy;• differentiated product performance and features;• quality and reliability;• product pricing and delivery capabilities;• customized design and applications;• business relationship with customers;• experience, skill and productivity of employees and management; and• manufacturing competence and inventory management.
Our principal competitors include, but are not limited to, ams AG, Analog Devices, Inc., Cirrus Logic, Inc., Monolithic Power Systems, Inc., NXP SemiconductorsN.V., Semtech Corporation, Silicon Laboratories, and Texas Instruments Inc. We expect increased competition in the future from other emerging and establishedcompanies as well as through consolidation of our competitors within the semiconductor industry.
Patents, Licenses and Other Intellectual Property Rights
7

We rely upon both know-how and patents to develop and maintain our competitive position.
It is our policy to seek patent protection for significant inventions that may be patented, though we may elect, in certain cases, not to seek patent protection evenfor significant inventions if other protection, such as maintaining the invention as a trade secret, is considered by us to be more advantageous. In addition, we haveregistered certain of our mask sets under the Semiconductor Chip Protection Act of 1984, as amended. We hold a number of patents worldwide with expirationdates ranging from calendar year 2019 to 2038. We have also registered several of our trademarks and copyrights in the United States and other countries.
Employees
As of June 29, 2019 , we employed 7,131 persons.
Environmental Regulations
Our compliance with foreign, federal, state and local laws and regulations that have been enacted to regulate the environment has not had a material adverse effecton our capital expenditures, earnings, or competitive or financial position.
Executive Officers
For information regarding our current executive officers, see Part III, Item 10 of this Annual Report.
8

ITEM 1A. RISK FACTORS
The following risk factors and other information included in this Annual Report should be carefully considered. The risks and uncertainties described below arenot the only ones we face. Additional risks and uncertainties not presently known to us or that we presently deem less significant may also adversely affect ourbusiness.
The sale of our products and our results of operations are dependent upon demand from the end markets of our customers, which is cyclical.
Our products are sold in the following major end-markets: (i) Automotive, (ii) Communications and Data Center, (iii) Computing, (iv) Consumer, and (v)Industrial. The demand for our products is subject to the strength of these five major end-markets that we serve and to some extent the overall economic climate.We often experience decreases and increases in demand for our products primarily due to the end-market demand of our customers. Our business and results ofoperations may be adversely affected if demand for our products decreases or if we are unable to meet an increase in demand without significantly increasing thelead-time for the delivery of our products. The semiconductor market historically has been cyclical with periods of increased demand and rapid growth followed byperiods of oversupply and subsequent contraction and subject to significant and often rapid increases and decreases in product demand. As a result, changes couldhave adverse effects on our results of operation.
The loss of, or substantial reduction in sales to, any of our large customers could have a material adverse effect on our business, financial condition, andresults of operations.
A reduction in demand or loss of one or more of our large customers may adversely affect our business. For example, sales to Samsung, our largest single endcustomer (through direct sales and distributors), accounted for approximately 10% of net revenues in fiscal years 2019, 2018 and 2017. The delay, significantreduction in, or loss of, orders from any one or more of our large customers (including curtailments of purchases due to a change in the design, manufacturing orsourcing policies or practices of these customers or the timing of customer inventory adjustments) or demands of price concessions from any one or more of ourlarge customers could have a material adverse effect on our net revenues and results of operations.
Our global operations subject us to risks associated with changes in trade policies, including international trade disputes, and domestic or internationalpolitical, social, economic or other conditions.
We are subject to the political and legal risks inherent in international operations. Exposure to political instabilities, different business policies and varying legal orregulatory standards, including, but not limited to, international trade disputes, could result in the imposition of tariffs, sanctions, restrictions on the U.S. importand export controls and other trade restrictions or barriers, which could negatively impact economic activity and lead to a contraction of customer demand. Forexample, in 2018, the U.S. and China began to impose partial tariffs on each other's products, and the trade tension between the two countries has escalated in2019. In addition, the U.S. has and may continue to focus on the business practices of specific foreign companies, including large technology companies based inChina, which may result in future U.S. government actions impacting our ability to do business with such companies. The possibility of a deteriorating traderelationship may put us at a disadvantage in competition with non-U.S. companies and lead to a decreased customer demand for our products in the long-term dueto the growing economic risks and geopolitical uncertainty between the U.S. and China. International trade disputes could also result in various forms ofprotectionist trade legislation and other protectionist measures that could limit the Company’s ability to operate its business and have a negative effect on end-market demand, which could have a material adverse impact on our results of operations and financial condition. Additionally, political and economic changes orvolatility, political unrest, civil strife, public corruption and other economic or political uncertainties in certain countries, such as the Philippines, could interruptand negatively affect our business operations. We have been impacted by these problems in the past, but none have materially affected our results of operations.Problems in the future or not-yet-materialized consequences of past problems could affect deliveries of our products to our customers, possibly resulting inbusiness interruptions, substantially delayed or lost sales and/or increased expenses that cannot be passed on to our customers, any of which could ultimately havea material adverse effect on our business.
Incorrect forecasts, reductions, cancellations or delays in orders for our products and volatility in customer demand could adversely affect our results ofoperations.
As is customary in the semiconductor industry, customer orders may be canceled in most cases without penalty to the customers. Some customers place orders thatrequire us to manufacture products and have them available for shipment, even though the customer may be unwilling to make a binding commitment to purchaseall, or even any, of the products. In other cases, we manufacture products based on forecasts of customer demands. As a result, we may incur inventory andmanufacturing costs in
9

advance of anticipated sales and are subject to the risk of cancellations of orders, potentially leading to an initial inflation of backlog followed by a sharp reduction.Because of the possibility of order cancellation, backlog should not be used as a measure of future revenues. Furthermore, canceled or unrealized orders, especiallyfor products meeting unique customer requirements, may also result in an inventory of unsaleable products, causing potential inventory write-downs, some ofwhich could be substantial and could have a material adverse effect on our gross margins and results of operations.
We may experience difficulties implementing our new global execution system, which may adversely affect our ability to effectively supply products to ourcustomers.
We have been implementing a new global execution system (“GES”) as part of our efforts to integrate inventory movement with our financial reporting system.This implementation is a major undertaking and requires significant employee time and financial resources. While we have invested significant resources inplanning and project management, implementation issues may arise. For example, we may experience staff turnover, which may delay the implementation of GES.Additionally, unforeseen issues may arise, which could disrupt the implementation of GES. Any disruptions, delays or deficiencies in the design and theimplementation or operation of GES could disrupt or reduce our supply chain execution and operational efficiency which may lead to our inability to effectivelysupply products to our customers and may impact the accuracy of our financial reporting. Our inability to successfully manage the implementation of GES couldmaterially adversely affect our business, results of operations and financial condition.
Our operating results may be adversely affected by our inability to timely develop new products through our research and development efforts. We may beunsuccessful in developing and selling new products necessary to maintain or expand our business.
The marketplace for our products is constantly changing and we are required to make substantial ongoing investments in our research and development. Thesemiconductor industry is characterized by rapid technological change, variations in manufacturing efficiencies of new products, and significant expenditures forcapital equipment and product development. New product introductions are a critical factor for maintaining or increasing future revenue growth and sustained orincreased profitability. However, they can present significant business challenges because product development commitments and expenditures must be made wellin advance of the related revenues. The success of a new product depends on a variety of factors including accurate forecasts of long-term market demand andfuture technological developments, accurate anticipation of competitors' actions and offerings, timely and efficient completion of process design and development,timely and efficient implementation of manufacturing and assembly processes, product performance, quality and reliability of the product, and effective marketing,revenue and service.
Our manufacturing operations may be interrupted or suffer yield problems.
The manufacture and design of integrated circuits is highly complex. We may experience a disruption in factory operations, manufacturing problems in achievingacceptable yields, or product delivery delays in the future as a result of, among other things, outdated infrastructure, upgrading or expanding existing facilities,equipment malfunctioning, construction delays, changing our process technologies, capacity constraints, or new technology qualification delays, particularly in ourinternal fabrication facilities. For example, our internal fabrication facility at Beaverton, Oregon requires additional investment to, among other things, upgrade itsinfrastructure and manufacturing equipment. In connection with the upgrading of our facilities, we may experience a disruption in factory operations, which couldresult in damages to the facilities and stoppages to the operations of the facilities. Additionally, our internal fabrication facilities may be harmed or renderedinoperable due to damages resulting from fire, natural disaster, unavailability of electric power or other causes, which may render it difficult or impossible for us tomanufacture our products for some period of time.
If our internal fabrication facilities become unavailable to us, it would be time consuming, difficult, and costly to arrange for new manufacturing facilities to supplyour products given the nature of our products. In addition, our third party's manufacturing facilities may not be available to us due to natural or man-made disasters,labor unrest, political conditions or other causes. To the extent we experience disruptions at our wafer fabrication facilities or we do not achieve acceptablemanufacturing yields, our results of operations could be adversely affected.
Our dependence on subcontractors for assembly, test, freight, wafer fabrication and logistic services and certain manufacturing services may cause delaysbeyond our control in delivering products to our customers.
We rely on subcontractors located in various parts of the world for assembly and CSP packaging services, freight and logistic services, wafer fabrication, andsorting and testing services. For example, in connection with the sale of our semiconductor wafer fabrication facility in San Antonio, Texas to TowerJazz Texas,Inc. (formerly known as TJ Texas, Inc.) ("TowerJazz"), an indirect
10

wholly-owned subsidiary of Tower Semiconductor Ltd. (“Tower”), in the third quarter of fiscal year 2016, we entered into a long-term supply agreement withTowerJazz, pursuant to which we procure from TowerJazz certain quantities of silicon wafers upon which integrated circuits are made that are designed by us.None of the subcontractors we currently use are affiliated with us. Reliability problems experienced by our subcontractors or the inability to promptly replace anysubcontractor could cause serious problems in delivery and quality resulting in potential product liability to us. Such problems could impair our ability to meet ourrevenue plan in the fiscal year period impacted by the disruption. Failure to meet the revenue plan may materially adversely impact our results of operations.
Any disruptions in our sort, assembly, test, freight, and logistic operations or in the operations of our subcontractors, including, but not limited to, the inability orunwillingness of any of our subcontractors to produce or timely deliver adequate supplies of processed wafers, integrated circuit packages, or tested productsconforming to our quality standards, or other required products or services could damage our reputation, relationships, and goodwill with customers. Furthermore,finding alternate sources of supply or initiating internal wafer processing for these products may not be economically feasible.
Our critical information systems are subject to cyber-attacks, data breaches, interruptions, and failures.
We rely on several information technology systems to provide products and services, process orders, manage inventory, process shipments to customers, keepfinancial, employee, and other records, and operate other critical functions. Maintaining the security of our information technology systems is important to ourbusiness and reputation. These information technology systems are subject to damage or interruption from a number of potential sources. Security breaches,including cyber-attacks, phishing attacks, denial-of-service attacks, or attempts to misappropriate or compromise confidential or proprietary information orsabotage enterprise information technology systems, are becoming increasingly frequent and more sophisticated. We currently have developed, and are in theprocess of developing more systems and procedures that include, among other things, ongoing internal risk assessments to identify vulnerabilities, an internalgroup dedicated to reviewing cybersecurity threats, and the adoption of an information security policy. Although we take steps to detect and investigate securityincidents and implement protections to prevent their recurrence, in some cases, we might be unable to anticipate or prevent all attacks because the techniques usedto obtain unauthorized access to or sabotage networks and systems are constantly evolving. Despite our efforts to mitigate risks associated with cybersecurityevents, our information technology systems may still be susceptible to adaptive persistent threats, catastrophic cybersecurity attacks, damage, disruptions, orshutdowns due to power outages, hardware failures, computer malware and viruses, telecommunication failures, user errors, or other events. Risks associated withthese threats include, but are not limited to, loss of intellectual property, impairment of our ability to conduct our operations, disruption of our customers’operations, loss or damage to our customer data delivery systems, and increased costs to prevent, respond to or mitigate catastrophic cybersecurity events. Aprolonged systemic disruption in the information technology systems could result in the loss of sales and customers and significant consequential costs, whichcould adversely affect our business. In addition, cybersecurity breaches of our information technology systems could result in the misappropriation or unauthorizeddisclosure of sensitive or confidential information belonging to us or to our customers, partners, suppliers, or employees. Our business and reputation could beharmed, and we could be subject to legal and regulatory claims which could result in significant financial or reputational damage.
Our results of operations could be adversely affected by warranty claims and product liability.
We face an inherent risk of exposure to product liability suits in connection with reliability problems or other product defects that may affect our customers. Ourproducts are used by a variety of industries, including the automotive and medical industries. Failure of our products to perform to specifications, or other productdefects, could lead to substantial damage to both the end product in which our device has been placed and to the user of such end product. Although we takemeasures to protect against product defects, if a product liability claim is brought against us, the cost of defending the claim could be significant and any adversedetermination could have a material adverse effect on our results of operations.
If we fail to attract and retain qualified personnel, our business may be harmed.
Our success depends to a significant extent upon the continued service of our chief executive officer, our other executive officers, and key management andtechnical personnel, particularly our experienced engineers and business unit managers, and on our ability to continue to attract, retain, and motivate qualifiedpersonnel. The loss of the services of one or several of our executive officers could have a material adverse effect on our Company. In addition, we could bematerially adversely affected if the turnover rates for engineers and other key personnel increases significantly or we are unsuccessful in attracting, motivating andretaining qualified personnel. Should we lose one or more engineers who are key to a project's completion during the course of a particular project, the completionof such project may be delayed which could negatively affect customer relationships and goodwill and have a material adverse effect on our results of operations.
11

Our independent distributors and sales representatives may underperform relative to our expectations, terminate their relationship with us or fail to makepayments on outstanding accounts receivable to us, which would adversely affect our financial results.
A portion of our sales is realized through independent electronics distributors that are not under our direct control. These independent sales organizations generallyrepresent product lines offered by several companies and thus could underperform for various reasons, including as a result of reducing their sales efforts applied toour products, or terminate their distribution relationship with us. In fiscal 2019, 46% of our revenues were generated from distributors, the largest of which wasAvnet, our primary world-wide distributor, which accounted for 22% of our revenues. We require certain foreign distributors to provide a letter of credit to us in anamount up to the credit limit set for accounts receivable from such foreign distributors. The letter of credit provides for collection on accounts receivable from theforeign distributor should the foreign distributor default on their accounts receivable to us. Where credit limits have been established above the amount of the letterof credit, we are exposed for the difference. We do not require letters of credit from any of our domestic distributors and are not contractually protected againstaccounts receivable default or bankruptcy by these distributors. The inability to collect open accounts receivable could adversely affect our results of operationsand financial condition. Termination of a significant distributor, whether at our or the distributor's initiative, or the general underperformance of a significantdistributor could be disruptive and harmful to our current business. Additional factors that could adversely affect us include the difficulties of managingindependent sales organizations due to any matter involving fraud or dishonesty on the part of the independent distributors and sales representatives. It is oftendifficult to anticipate or immediately detect such misconduct of an independent third party.
If we fail to enter into future vendor managed inventory arrangements or fail to supply the specific product or quantity under such arrangements, the results ofour operations and financial condition may be materially adversely impacted.
We enter into arrangements with certain original equipment manufacturers (“OEMs”) and electronic manufacturing services (“EMS”) partners to consignquantities of certain products within proximity of the OEMs and EMS partners' manufacturing location. The inventory is physically segregated at these locationsand we retain title and risk of loss related to this inventory until such time as the OEM or EMS partner pulls the inventory for use in its manufacturingprocess. Once the inventory is pulled by the OEM or EMS partner, title and risk of loss pass to the customer, at which point we relieve inventory and recognizerevenue and the related cost of goods sold. The specific quantities to be consigned are based on a forecast provided by the OEM or EMS partner. Generally, thearrangements with the OEMs and EMS partners provide for transfer of title and risk of loss once product has been consigned for a certain length of time.
We believe these arrangements will continue to grow in terms of number of customers and products and will increase in proportion to consolidated netrevenues. Should we be unable or unwilling to enter into such agreements as requested by OEMs or EMS partners, our results of operations may be materiallyadversely impacted. In addition, should we be unable to supply the specific product in the quantity needed by the OEM or EMS partner as reflected in theirforecast, we may be liable for damages, including, but not limited to, lost revenues and increased production costs which could have a material adverse impact onour results of operations and financial condition. Should we supply product in excess of the OEM or EMS partners' actual usage, any inventory not consumed maybecome excess or obsolete, which would result in an inventory write-down that could materially adversely affect our results of operations.
We may be unable to adequately protect our proprietary rights, which may impact our ability to compete effectively.
We rely upon know-how, trade secrets, and patents to develop and maintain our competitive position. There can be no assurance that others will not develop orpatent similar technology or reverse engineer our products or that the confidentiality agreements upon which we rely will be adequate to protect our interests.Moreover, the laws of some foreign countries generally do not protect proprietary rights to the same extent as the United States, and we may encounter problems inprotecting our proprietary rights in those foreign countries. Periodically, we have been asked by certain prospective customers to provide them with broad licensesto our intellectual property rights in connection with the sale of our products to them. Such licenses, if granted, may have a negative impact on the value of ourintellectual property portfolio. Other companies have obtained patents covering a variety of semiconductor designs and processes, and we could be required toobtain licenses under some of these patents or be precluded from making and selling products that are alleged to be infringing, if such patents are valid and otherdesign and manufacturing solutions are not available. There can be no assurance that we would be able to obtain licenses, if required, upon commerciallyreasonable terms or at all.
12

We may suffer losses and business interruption if our products infringe the intellectual property rights of others.
In the past, it has been common in the semiconductor industry for patent holders to offer licenses on reasonable terms and rates. Although the practice of offeringlicenses appears to be generally continuing, in some situations, typically where the patent directly relates to a specific product or family of products, patent holdershave refused to grant licenses. In any of those cases, there can be no assurance that we would be able to obtain any necessary license on terms acceptable to us, if atall, or that we would be able to re-engineer our products or processes in a cost-effective manner to avoid claims of infringement. Any litigation in such a situationcould involve an injunction to prevent the sales of a material portion of our products, the reduction or elimination of the value of related inventories and theassessment of a substantial monetary award for damages related to past sales, all of which could have a material adverse effect on our results of operations andfinancial condition.
We may experience losses related to intellectual property indemnity claims.
We provide intellectual property indemnification for certain customers, distributors, suppliers and subcontractors for attorney fees and damages and costs awardedagainst these parties in certain circumstances in which our products are alleged to infringe third party intellectual property rights, including patents, registeredtrademarks and copyrights. In certain cases, there are limits on and exceptions to our potential liability for indemnification relating to intellectual propertyinfringement claims. We cannot estimate the amount of potential future payments, if any, that we might be required to make as a result of these agreements. Todate, we have not been required to pay significant amounts for intellectual property indemnification claims. However, there can be no assurance that we will nothave significant financial exposure under those intellectual property indemnification obligations in the future.
Our financial results may be adversely affected by increased tax rates and exposure to additional tax liabilities.
On June 18, 2019, the U.S. Treasury and the Internal Revenue Service released temporary regulations under Internal Revenue Code (“IRC”) Section 245A(“Section 245A”), as enacted by the Tax Cuts and Jobs Act, and IRC Section 954(c)(6) (the “Temporary Regulations”), which apply retroactively to intercompanydividends occurring after December 31, 2017. The Temporary Regulations limit the applicability of the foreign personal holding company income (“FPHCI”) look-through exception for certain intercompany dividends received by a controlled foreign corporation. Before application of the retroactive Temporary Regulations,the Company benefited in fiscal years 2018 and 2019 from the FPHCI look-through exception. The Company has analyzed the relevant Temporary Regulationsand concluded that they were not validly issued. Therefore, the Company has not accounted for the effects of the retroactive Temporary Regulations in its results ofoperations for fiscal year 2019. The Company believes it has strong arguments in favor of its position and that it has met the more likely than not recognitionthreshold that its position will be sustained. The Company intends to vigorously defend its position, however, due to the uncertainty involved in challenging thevalidity of regulations as well as a potential litigation process, there can be no assurances that the relevant Temporary Regulations will be invalidated, modified orthat a court of law will rule in favor of the Company. An unfavorable resolution of this issue could have a material adverse impact on our results of operations andfinancial condition.
We are subject to taxation in various countries and jurisdictions. Significant judgment is required to determine tax liabilities on a worldwide basis. Any significantincrease in our future effective tax rates could reduce net income for future periods and may have a material adverse impact on our results of operations. A numberof factors may increase our future effective tax rates, including, but not limited to:
• the jurisdictions in which profits are determined to be earned and taxed;
• changes in our global structure that involve changes to investment in technology outside of the United States;
• the resolution of issues arising from tax audits with various tax authorities,
13

• changes in the valuation of our deferred tax assets and liabilities;
• adjustments to estimated taxes upon finalization of various tax returns;
• increases in expenses not deductible for tax purposes, including impairments of goodwill in connection with acquisitions;
• changes in available tax credits;
• changes in share-based compensation;
• changes in tax laws or the interpretation of such tax laws, including laws or rules enacted by countries in response to the Base Erosion and Profit Shifting(“BEPS”) project conducted by the Organization for Economic Co-operation and Development (“OECD”); and
• changes in generally accepted accounting principles.
Our operating results may be adversely affected by unfavorable economic and market conditions.
The global economic environment could subject us to increased credit risk should customers be unable to pay us, or delay paying us, for previously purchasedproducts. Accordingly, reserves for doubtful accounts and write-offs of accounts receivable may increase. In addition, weakness in the market for end users of ourproducts could harm the cash flow of certain of our distributors and resellers who could then delay paying their obligations to us or experience other financialdifficulties. This would further increase our credit risk exposure and potentially cause delays in our recognition of revenue on sales to these customers.
If economic or market conditions deteriorate globally, in the United States or in other key markets, our business, operating results, and financial condition may bematerially and adversely affected.
Shortage of raw materials or supply disruption of such raw materials could harm our business.
The semiconductor industry has experienced a large expansion of fabrication capacity and production worldwide over time. As a result of increasing demand fromsemiconductor, solar and other manufacturers, availability of certain basic materials and supplies, and of subcontract services, has been limited from time to timeover the past several years, and could come into short supply again if overall industry demand exceeds the supply of these materials and services in the future.
We purchase materials and supplies from many suppliers, some of which are sole-sourced. If the availability of these materials and supplies is interrupted, we maynot be able to find suitable replacements. In addition, from time to time natural disasters can lead to a shortage of some materials due to disruption of themanufacturer's production. We continually strive to maintain availability of all required materials, supplies and subcontract services. However, we do not havelong-term agreements providing for all of these materials, supplies and services, and shortages could occur as a result of capacity limitations or productionconstraints on suppliers that could have a material adverse effect on our ability to achieve our production requirements.
We may be liable for additional production costs and lost revenues to certain customers with whom we have entered into customer supply agreements if we areunable to meet certain product quantity and quality requirements.
We enter into contracts with certain customers whereby we commit to supply quantities of specified parts at a predetermined scheduled delivery date. The numberof such arrangements continues to increase as this practice becomes more commonplace. Should we be unable to supply the customer with the specific part at thequantity and product quality desired and on the scheduled delivery date, the customer may incur additional production costs. In addition, the customer may loserevenues due to a delay in receiving the parts necessary to have the end-product ready for sale to its customers or due to product quality issues. Under certaincustomer supply agreements, we may be liable for direct additional production costs or lost revenues. If products are not shipped on time or are quality deficient,we may be liable for penalties and resulting damages. Such liability, should it arise, and/or our inability to meet these commitments to our customers may have amaterial adverse impact on our results of operations and financial condition and could damage our relationships with the affected customers, reputation andgoodwill.
Our products may fail to meet new industry standards or requirements and the efforts to meet such industry standards or requirements could be costly.
14

Many of our products are based on industry standards that are continually evolving. Our ability to compete in the future will depend on our ability to identify andensure compliance with these evolving industry standards. The emergence of new industry standards could render our products incompatible with productsdeveloped by major systems manufacturers. As a result, we could be required to invest significant time and effort and to incur significant expense to redesign ourproducts to ensure compliance with relevant standards. If our products are not in compliance with prevailing industry standards or requirements, we could missopportunities to achieve crucial design wins which in turn could have a material adverse effect on our business, operations and financial results.
Our operating results may be adversely affected by increased competition and consolidation of competitors in our market.
The semiconductor industry has experienced significant consolidation in recent years. As a result, we experience intense competition from a number of companies,some of which have significantly greater financial, manufacturing and marketing resources than us, as well as greater technical resources and proprietaryintellectual property rights than us. The principal elements of competition include product performance, functional value, quality and reliability, technical serviceand support, price, diversity of product line, and sale of integrated system solutions which combine the functionality of multiple chips on one chip for a price aspart of a complete system solution and delivery capabilities. We believe we compete favorably with respect to these factors, although we may be at a disadvantagein comparison to companies with broader product lines, greater technical service and support capabilities and larger research and development budgets. We may beunable to compete successfully in the future against existing or new competitors and our operating results may be adversely affected by increased competition orour inability to timely develop new products to meet the needs of our customers. In addition, our competitors may become more aggressive in their pricingpractices which may adversely impact our gross margins and market share. For example, our competitors may offer lower prices than us, or they may pricemultiple products or services in a bundle to provide additional incentives that we may not be able to match. We may be unable to mitigate the negative effects ofsuch price competition, which may adversely affect our operating results.
Extensions in lead-time for delivery of products could adversely affect our future growth opportunities and results of operations.
Supply constraints, which may include limitations in manufacturing capacity, could impede our ability to grow revenues and meet increased customer demands forour products. Our results of operations may be adversely affected if we fail to meet such increase in demand for our products without significantly increasing thelead-time required for our delivery of such products. Any significant increase in the lead-time for delivery of products may negatively affect our customerrelationships, reputation as a dependable supplier of products and ability to obtain future design wins, while potentially increasing order cancellations, aged,unsaleable or otherwise unrealized backlog, and the likelihood of our breach of supply agreement terms. Any of the foregoing factors could negatively affect ourfuture revenue growth and results of operations.
We are subject to a variety of domestic and international laws and regulations that could impose substantial costs on us and may adversely affect our business.
We are subject to numerous U.S. and international laws, rules and regulations covering a wide variety of subject matters, including, but not limited to, data privacyand protection, environment, safety and health, exports and imports, bribery and corruption, tax, labor and employment, competition, market access, andintellectual property ownership and infringement. Compliance with these laws, rules and regulations may be onerous and expensive and could restrict our ability tooperate our business. If we fail to comply or if we become subject to enforcement activity, we could be subject to fines, penalties or other legal liability.Furthermore, should these laws, rules and regulations be amended or expanded, or new ones enacted, we could incur materially greater compliance costs orrestrictions on our ability to operate our business.
Among other laws and regulations, we are subject to the General Data Protection Regulation (“GDPR”) effective in the European Union (“EU”), which created adata protection compliance regime that imposed substantial obligations on companies collecting, processing and transferring personal data and may imposesignificant penalties for non-compliance. Similarly, certain jurisdictions in the United States and some countries in which we operate may consider or have passedlegislation implementing data protection requirements that could require us to change our business practices and increase the cost and complexity of compliance. Inaddition to GDPR, we are subject to the U.S. Customs and Export Regulations, including U.S. International Traffic and Arms Regulations and similar laws, whichcollectively control import, export and sale of technologies by companies and various other aspects of the operation of our business, and the Foreign CorruptPractices Act and similar anti-bribery laws, which prohibit companies from making improper payments to government officials for the purposes of obtaining orretaining business.
While our Company’s policies and procedures mandate compliance with such laws and regulations, there can be no assurance that our employees and agents willalways act in strict compliance. If we fail to comply or if we become subject to enforcement activity, we could be subject to fines, penalties or other legal liability.Furthermore, should these laws, rules and regulations be amended
15

or expanded, or new ones enacted, we could incur materially greater compliance costs or restrictions on our ability to operate our business, which could have amaterial adverse impact on our results of operations and financial condition. Our failure or inability to comply with existing or future laws, rules or regulations, orchanges to existing laws, rules or regulations could subject us to fines, penalties or other legal liability.
Our quarterly operating results may fluctuate, which could adversely impact our common stock price.
We believe that period-to-period comparisons of our results of operations are not necessarily meaningful and should not be relied upon as indicators of futureperformance. Our operating results have in the past been, and will continue to be, subject to quarterly fluctuations as a result of numerous factors, some of whichmay contribute to more pronounced fluctuations in an uncertain global economic environment. These factors include, but are not limited to, the following:
• Fluctuations in demand for our products and services;
• Loss of a significant customer or significant customers electing to purchase from another supplier;
• Reduced visibility into our customers' spending plans and associated revenue;
• The level of price and competition in our product markets;
• Our pricing practices, including our use of available information to maximize pricing potential;
• The impact of the uncertain economic and credit environment on our customers, channel partners, and suppliers, including their ability to obtain financingor to fund capital expenditures;
• The overall movement toward industry consolidations among our customers and competitors;
• Below industry-average growth of the non-consumer segments of our business;
• Announcements and introductions of new products by our competitors;
• Our ability to generate sufficient earnings and cash flow to pay dividends to our stockholders;
• Deferrals of customer orders in anticipation of new products or product enhancements (introduced by us or our competitors);
• Our ability to meet increases in customer orders in a timely manner;
• Striking an appropriate balance between short-term execution and long-term innovation;
• Our ability to develop, introduce, and market new products and enhancements and market acceptance of such new products and enhancements; and
• Our levels of operating expenses.
Environmental, safety and health laws and regulations could force us to expend significant capital and incur substantial costs.
Various foreign and domestic federal, state, and local government agencies impose a variety of environmental, safety and health laws and regulations on thestorage, handling, use, discharge and disposal of certain chemicals, gases and other substances used or produced in the semiconductor manufacturing process aswell as the health and safety regulations related to our employees. Historically, compliance with these regulations has not had a material adverse effect on ourcapital expenditures, earnings, or competitive or financial position. There can be no assurance, however, that interpretation and enforcement of current or futureenvironmental, safety and health laws and regulations will not impose costly requirements upon us. Any failure by us to adequately control the storage, handling,use, discharge or disposal of regulated substances could result in fines, sales limitations, suspension of production, alteration of wafer fabrication processes andlegal liability, which may materially adversely impact our financial condition, results of operations or liquidity.
16

In addition, some of our customers and potential customers may require that we implement operating practices that are more stringent than applicable legalrequirements with respect to health regulations, environmental matters or other items. As a result, these requirements may increase our own costs regardingdeveloping, administering, monitoring and auditing these customer-requested practices at our own sites and those in our supply chain.
We may pursue acquisitions and investments that could harm our operating results and may disrupt our business.
We have made and will continue to consider making strategic business investments, alliances, and acquisitions we consider necessary or desirable to gain access tokey technologies that we believe will complement our existing technical capability and support our business model objectives. Investments, alliances, andacquisitions involve risks and uncertainties that may negatively impact our future financial performance and result in an impairment of goodwill. If integration ofour acquired businesses is not successful, we may not realize the potential benefits of an acquisition or suffer other adverse effects that we currently do not foresee.We may also need to enter new markets in which we have no or limited experience and where competitors in such markets have stronger market positions.
We also invest in early-to-late stage private companies to further our strategic objectives and support key business initiatives. These strategic investments may notperform as expected. We cannot provide assurance that these companies will operate in a manner that will increase or maintain the value of our investment. If theseprivate companies fail, we may not realize a return on our investments. Thus, all of our investments are subject to a risk of a partial or total loss of investmentcapital.
Any of the foregoing, and other factors, could harm our ability to achieve anticipated levels of profitability from acquired businesses or to realize other anticipatedbenefits of acquisitions. In addition, because acquisitions of high technology companies are inherently risky, no assurance can be given that our previous or futureacquisitions will be successful and will not adversely affect our business, operating results, or financial condition.
Material impairments of our goodwill or intangible assets could adversely affect our results of operations.
Goodwill is reviewed for impairment annually or more frequently if certain impairment indicators arise or upon the disposition of a significant portion of areporting unit. The review compares the fair value for each reporting unit to its associated book value including goodwill. A decrease in the fair value associatedwith a reporting unit resulting from, among other things, unfavorable changes in the estimated future discounted cash flow of the reporting unit, may require us torecognize impairments of goodwill. Our intangible assets are amortized over their estimated useful lives, but they are reviewed for impairment whenever events orchanges in circumstances indicate that the carrying amount of the asset may not be recoverable. If the sum of the future undiscounted cash flows expected to resultfrom the use of the intangible asset and its eventual disposition is less than the carrying amount of the asset, we would recognize an impairment loss to the extentthe carrying amount of the asset exceeds its fair value.
Our debt covenants may limit us from engaging in certain transactions or other activities.
We have entered into debt arrangements that contain certain covenants which may limit the manner in which we conduct our business. For example, the debtindentures that govern our outstanding notes include covenants that, under certain circumstances, limit our ability to grant liens on our facilities and to enter intosale and leaseback transactions, which could limit our ability to secure additional debt funding in the future. In circumstances involving a change of control of theCompany followed by a downgrade of the rating of the notes, we would be required to make an offer to repurchase the affected notes at a purchase price greaterthan the aggregate principal amount of such notes, plus accrued and unpaid interest. Our ability to repurchase the notes in such events may be limited by our then-available financial resources or by the terms of other agreements to which we are a party. Although we currently have the funds necessary to retire this debt, fundsmight not be available to repay the notes when they become due in the future.
We are required to comply with the covenants set forth in our debt indentures. If we breach any of the covenants and do not obtain a waiver from the note holdersor lenders, then, subject to cure periods, any outstanding indebtedness may be declared immediately due and payable.
Business interruptions from natural disasters could harm our ability to produce products.
We operate our business in worldwide locations. Some of our facilities and those of our subcontractors are located in areas of the world that are susceptible todamage from natural disasters and other significant disruptions, including earthquakes, typhoons, hurricanes, tsunamis, floods, fires, water shortages and othernatural catastrophic events. In the event of a natural disaster, we may suffer a disruption in our operations that could adversely affect our results of operations.
17

Our financial condition, operations and liquidity may be materially adversely affected in the event of a catastrophic loss for which we are self-insured.
We are primarily self-insured with respect to many of our commercial risks and exposures. Based on management's assessment and judgment, we have determinedthat it is generally more cost effective to self-insure these risks. The risks and exposures we self-insure include, but are not limited to, fire, property and casualty,natural disasters, product defects, political risk, general liability, theft, counterfeits, patent infringement, certain employment practice matters and medical benefitsfor many of our U.S. employees. Should there be catastrophic loss from events such as fires, explosions, earthquakes, or other natural disasters, among many otherrisks, or adverse court or similar decisions in any area in which we are self-insured, our financial condition, results of operations, and liquidity may be materiallyadversely affected.
We may be materially adversely affected by currency fluctuations.
We conduct our manufacturing and other operations in various worldwide locations. A portion of our operating costs and expenses at foreign locations are paid inlocal currencies. Many of the materials used in our products and much of the manufacturing process for our products are supplied by foreign companies or by ourforeign operations, such as our test operations in the Philippines and Thailand. Approximately 89%, 88% and 88% of our net revenues in fiscal years 2019, 2018and 2017, respectively, were from international sales. Currency exchange fluctuations could decrease revenue and increase our operating costs, the cost ofcomponents manufactured abroad, and the cost of our products to foreign customers, or decrease the costs of products produced by our foreign competitors.
Exiting certain product lines or businesses, or restructuring our operations, may adversely affect certain customer relationships and produce results that differfrom our intended outcomes.
The nature of our business requires strategic changes from time to time, including restructuring our operations and divesting and consolidating certain product linesand businesses. The sale of facilities, or the exiting of certain product lines or businesses, may adversely affect certain customer relationships, which may have amaterial adverse effect on our business, financial condition, and results of operations. Additionally, our ability to timely shut down our facilities or otherwise exitproduct lines and businesses, or to close or consolidate operations, depends on a number of factors, many of which are outside of our control. If we are unable toshut down a facility or exit a product line or business in a timely manner, or to restructure our operations in a manner we deem to be advantageous, this could havea material adverse effect on our business, financial condition, and results of operations. Even if the sale of a facility or divestment is successful, we may faceindemnity and other liability claims by the acquirer or other parties.
Our stock price may be volatile.
The market price of our common stock may be volatile and subject to wide fluctuations. Fluctuations have occurred and may continue to occur in response tovarious factors, many of which are beyond our control.
In addition, the market prices of securities of technology companies, including those in the semiconductor industry, generally have been and remain volatile. Thisvolatility has significantly affected the market prices of securities of many technology companies for reasons frequently unrelated to the operating performance ofthe specific companies. If our actual operating results or future forecasted results do not meet the expectations of securities analysts or investors, who may derivetheir expectations by extrapolating data from recent historical operating results, the market price of our common stock may decline. Accordingly, you may not beable to resell shares of our common stock at a price equal to or higher than the price you paid for them.
Due to the nature of our compensation programs, some of our executive officers sell shares of our common stock each quarter or otherwise periodically, includingpursuant to trading plans established under Rule 10b5-1 of the Securities Exchange Act of 1934, as amended. Regardless of the reasons for such sales, analysts andinvestors could view such actions in a negative light and the market price of our stock could be adversely affected as a result of such periodic sales.
Our certificate of incorporation contains certain anti-takeover provisions that may discourage, delay or prevent a hostile change in control of our Company.
Our certificate of incorporation permits our Board of Directors to authorize the issuance of up to 2,000,000 shares of preferred stock and to determine the rights,preferences and privileges and restrictions applicable to such shares without any further vote or action by our stockholders. Any such issuance might discourage,delay or prevent a hostile change in control of our Company, which may be considered beneficial to our stockholders.
18

ITEM 1B. UNRESOLVED STAFF COMMENTS
None.
ITEM 2. PROPERTIES
Our worldwide headquarters is in San Jose, California. Manufacturing and other operations are conducted in several locations worldwide. The following tableprovides certain information regarding our principal offices and manufacturing facilities at June 29, 2019 :
Principal Properties Use(s)
ApproximateFloor Space
(sq. ft.)Cavite, the Philippines Manufacturing, engineering, and administrative 489,000 San Jose, California Corporate headquarters, engineering, sales, and administrative 435,000 Beaverton, Oregon Wafer fabrication, engineering, and administrative 312,000 Chonburi Province, Thailand Manufacturing, engineering, and administrative 144,000 Dallas, Texas† Engineering, sales, and administrative 82,000 Chandler, Arizona Engineering, sales, and administrative 65,000 Bangalore, India† Engineering and administrative 49,000 Colorado Springs, Colorado† Engineering and administrative 28,000 Dublin, Ireland† Administrative and sales 20,000
† Leased.
In addition to the property listed in the above table, we also lease sales, engineering, administration and manufacturing offices and other premises at variouslocations in the United States and internationally under operating leases, none of which are material to our future cash flows. These leases expire at various datesthrough 2030 . We anticipate no difficulty in retaining occupancy of any of our other manufacturing, office or sales facilities through lease renewals prior toexpiration or through month-to-month occupancy or in replacing them with equivalent facilities.
We expect these facilities to be adequate for our business purposes through at least the next 12 months.
ITEM 3. LEGAL PROCEEDINGS
Legal Proceedings
We are party or subject to various legal proceedings and claims, either asserted or unasserted, which arise in the ordinary course of business, including proceedingsand claims that relate to intellectual property matters. While the outcome of these matters cannot be predicted with certainty, we do not believe that the outcome ofany of these matters, individually or in the aggregate, will result in losses that are materially in excess of amounts already recognized or reserved, if any.
Indemnifications
We indemnify certain customers, distributors, suppliers, and subcontractors for attorney fees, damages, and costs awarded against such parties in certaincircumstances in which our products are alleged to infringe third party intellectual property rights, including patents, registered trademarks, or copyrights. Theterms of our indemnification obligations are generally perpetual from the effective date of the agreement. In certain cases, there are limits on and exceptions to ourpotential liability for indemnification relating to intellectual property infringement claims.
Pursuant to our charter documents and separate written indemnification agreements, we have certain indemnification obligations to our current officers, employees,and directors, as well as certain former officers and directors.
19

ITEM 4. MINE SAFETY DISCLOSURES
Not applicable.
PART II
ITEM 5. MARKET FOR REGISTRANT'S COMMON EQUITY, RELATED STOCKHOLDER MATTERS AND ISSUER PURCHASES OF EQUITYSECURITIES
Our common stock is traded on the NASDAQ Global Select Market (“NASDAQ”) under the symbol MXIM. As of August 8, 2019 , there were approximately 650stockholders of record of our common stock.
Issuer Purchases of Equity Securities
The following table summarizes the activity related to stock repurchases for the three months ended June 29, 2019 :
Issuer Purchases of Equity Securities (in thousands, except per share amounts)
Total Number of SharesPurchased
Average Price Paid perShare
Total Number ofShares Purchased as
Part of PubliclyAnnounced Plans or
Programs
Maximum AmountThat May Yet Be
Purchased Under thePlans or Programs
Mar 31, 2019 - Apr. 27, 2019 436 $ 57.46 436 $ 1,192,002Apr. 28, 2019 - May 25, 2019 574 $ 56.42 574 $ 1,159,633May 26, 2019 - Jun. 29, 2019 797 $ 56.02 797 $ 1,114,982
Total 1,807 $ 56.50 1,807 $ 1,114,982
On July 20, 2017, the Board of Directors of the Company authorized the repurchase of up to $1.0 billion of the Company's common stock.
On October 30, 2018, the Board of Directors of the Company authorized the repurchase of up to $1.5 billion of the Company’s common stock. The stockrepurchase authorization does not have an expiration date and the pace of repurchase activity will depend on factors such as current stock price, levels of cashgeneration from operations, cash requirements, and other factors. The prior repurchase authorization by the Company’s Board of Directors for the repurchase ofcommon stock was cancelled and superseded by this repurchase authorization.
During fiscal year 2019 , we repurchased approximately 9.8 million shares of our common stock for $539.2 million . As of June 29, 2019 , we had a remainingauthorization of $1.1 billion for future share repurchases. The number of shares to be repurchased and the timing of such repurchases will be based on severalfactors, including the price of the Company's common stock and liquidity and general market and business conditions.
Stock Performance Graph
The line graph below compares the cumulative total stockholder return on our common stock with the cumulative total return of the NASDAQ Composite Index,the Standard & Poor's (S&P) 500 Index, and the Philadelphia Semiconductor Index for the five years ended June 29, 2019 . The graph and table assume that $100was invested on June 27, 2014 (the last day of trading for the fiscal year ended June 28, 2014 ) in each of our common stock, the NASDAQ Composite Index, theS&P 500 Index, and the Philadelphia Semiconductor Index, and that all dividends were reinvested. Cumulative returns shown on the graph are based on our fiscalyear.
This performance graph shall not be deemed “filed” for purposes of Section 18 of the Exchange Act or incorporated by reference into any of our filings under theSecurities Act or the Exchange Act, except as shall be expressly set forth by specific reference in such filing. The returns shown are based on historical results andare not intended to suggest or predict future performance.
20

Base Year Fiscal Year Ended
June 28,
2014 June 27,
2015 June 25,
2016 June 24,
2017 June 30,
2018 June 29,
2019Maxim Integrated Products, Inc. $ 100.00 $ 106.10 $ 110.89 $ 149.60 $ 196.71 $ 207.26NASDAQ Composite $ 100.00 $ 116.85 $ 109.63 $ 147.61 $ 178.85 $ 192.77S&P 500 $ 100.00 $ 109.37 $ 108.37 $ 132.43 $ 150.59 $ 166.27Philadelphia Semiconductor $ 100.00 $ 112.86 $ 111.38 $ 182.66 $ 224.57 $ 254.46
ITEM 6. SELECTED FINANCIAL DATA
Set forth below is a summary of certain consolidated financial information with respect to the Company as of the dates and for the periods indicated. The followingselected financial data as of June 29, 2019 and June 30, 2018 and for the years ended June 29, 2019 , June 30, 2018 and June 24, 2017 are derived from and shouldbe read in conjunction with, and are qualified by reference to, Item 7 - Management's Discussion and Analysis of Financial Condition and Results of Operationsand Item 8 - Financial Statements and Supplementary Data, and notes thereto included elsewhere in Part IV, Item 15(a) of this Annual Report. The followingselected financial data as of June 24, 2017 , June 25, 2016 , and June 27, 2015 and for the years ended June 25, 2016 and June 27, 2015 have been derived from ourconsolidated financial statements not included herein. The historical results are not necessarily indicative of the results to be expected in any future period. Weadopted Accounting Standards Codification Topic 606 (Topic 606) , effective July 1, 2018, using the modified retrospective method. The reported results for fiscalyear 2019 reflect the application of Topic 606, while the reported results for prior fiscal years are not adjusted and continue to be reported under Topic 605.
21

Fiscal Year Ended
June 29,
2019 June 30,
2018 June 24,
2017 June 25,
2016 June 27,
2015 (in thousands, except percentages and per share data)Consolidated Statement of Income Data: Net revenues $ 2,314,329 $ 2,480,066 $ 2,295,615 $ 2,194,719 $ 2,306,864Cost of goods sold 813,823 853,945 849,135 950,331 1,034,997
Gross margin $ 1,500,506 $ 1,626,121 $ 1,446,480 $ 1,244,388 $ 1,271,867
Gross margin % 64.8% 65.6% 63.0% 56.7% 55.1%
Operating income $ 747,098 $ 833,448 $ 694,777 $ 313,849 $ 237,280
% of net revenues 32.3% 33.6% 30.3% 14.3% 10.3%
Net income $ 827,486 $ 467,318 $ 571,613 $ 227,475 $ 206,038
Earnings per share
Basic net income per share $ 3.01 $ 1.66 $ 2.02 $ 0.80 $ 0.73Diluted net income per share $ 2.97 $ 1.64 $ 1.98 $ 0.79 $ 0.71
Weighted-average shares used in thecalculation of earnings per share:
Basic 274,966 280,979 283,147 285,081 283,675Diluted 278,777 285,674 287,974 289,479 288,949
Dividends declared and paid per share $ 1.84 $ 1.56 $ 1.32 $ 1.20 $ 1.12
As of
June 29,
2019 June 30,
2018 June 24,
2017 June 25,
2016 June 27,
2015 (in thousands)
Consolidated Balance Sheet Data: Cash, cash equivalents and short-terminvestments $ 1,898,332 $ 2,626,399 $ 2,744,839 $ 2,230,668 $ 1,626,119Working capital $ 2,168,333 $ 2,413,014 $ 3,026,597 $ 2,197,645 $ 1,936,226Total assets $ 3,743,982 $ 4,451,561 $ 4,570,233 $ 4,234,616 $ 4,216,071Long-term debt, excluding current portion $ 992,584 $ 991,147 $ 1,487,678 $ 990,090 $ 987,687Total stockholders' equity $ 1,845,276 $ 1,930,940 $ 2,202,694 $ 2,107,814 $ 2,290,020
22

ITEM 7. MANAGEMENT'S DISCUSSION AND ANALYSIS OF FINANCIAL CONDITION AND RESULTS OF OPERATIONS
The following discussion and analysis should be read in conjunction with our Consolidated Financial Statements and notes thereto included in Part IV, Item 15(a),the risk factors included in Part I, Item 1A, and the “forward-looking statements” and other risks described herein and elsewhere in this Annual Report.
Overview
We are a global company with manufacturing facilities in the United States, the Philippines and Thailand, and sales offices and design centers throughout theworld. We design, develop, manufacture and market linear and mixed-signal integrated circuits, commonly referred to as analog circuits, for a large number ofcustomers in diverse geographical locations. The analog market is fragmented and characterized by diverse applications, a great number of product variations and,with respect to many circuit types, relatively long product life cycles. The major end-markets in which we sell our products are the automotive, communicationsand data center, computing, consumer and industrial markets. We are incorporated in the State of Delaware.
Critical Accounting Policies
The methods, estimates and judgments we use in applying our most critical accounting policies have a significant impact on the results we report in our financialstatements. The Securities and Exchange Commission (“SEC”) has defined the most critical accounting policies as the ones that are most important to thepresentation of our financial condition and results of operations, and that require us to make our most difficult and subjective accounting judgments, often as aresult of the need to make estimates of matters that are inherently uncertain. Based on this definition, our most critical accounting policies include revenuerecognition, which impacts the recording of net revenues; valuation of inventories, which impacts costs of goods sold and gross margins; the assessment ofrecoverability of long-lived assets, which impacts impairment of long-lived assets; assessment of recoverability of intangible assets and goodwill, which impactsimpairment of goodwill and intangible assets; accounting for income taxes, which impacts the income tax provision; and assessment of litigation andcontingencies, which impacts charges recorded in cost of goods sold, selling, general and administrative expenses and income taxes. These policies and theestimates and judgments involved are discussed further below. We have other significant accounting policies that either do not generally require estimates andjudgments that are as difficult or subjective, or it is less likely that such accounting policies would have a material impact on our reported results of operations for agiven period. Our significant accounting policies are described in Note 2 to the Consolidated Financial Statements included in this Annual Report.
Revenue Recognition
We recognize revenue for sales to direct customers and sales to distributors when a customer obtains control of promised goods or services in an amount thatreflects the consideration which we expect to receive in exchange for those goods or services. The transaction price is calculated as selling price net of variableconsiderations, such as distributor price adjustments. In determining the transaction price, we evaluate whether the price is subject to refund or adjustment todetermine the net consideration that is expected to be realized. The transaction price does not include amounts collected on behalf of another party, such as salestaxes or value added tax. We elected the practical expedient to not disclose the value of unsatisfied performance obligations for (i) contracts with an originalexpected length of one year or less and (ii) contracts for which we recognize revenue at the amount to which we have the right to invoice for services performed.We estimate returns for sales to direct customers and distributors based on historical return rates applied against current period gross revenue. Specific customerreturns and allowances are considered within this estimate.
Accounts receivable from direct customers and distributors are recognized and inventory is relieved upon shipment as title to inventories generally transfers uponshipment, at which point we have a legally enforceable right to collection under normal terms. Accounts receivable related to consigned inventory is recognizedwhen the customer takes title to such inventory from its consigned location, at which point inventory is relieved, title transfers, and we have a legally enforceableright to collection under the terms of the agreement with the related customers. Customers are generally required to pay for products and services within ourstandard terms, which is net 30 days from the date of invoice.
We estimate potential future returns and sales allowances related to current period product revenue. Management analyzes historical returns, changes in customerdemand and acceptance of products when evaluating the adequacy of returns and sales allowances. Estimates made may differ from actual returns and salesallowances. These differences may materially impact reported revenue and amounts ultimately collected on accounts receivable. Historically, such differences havenot been material.
23

Distributor price adjustments are estimated based on our historical experience rates and also considering economic conditions and contractual terms. To date,actual distributor claims activity has been materially consistent with the estimates we have made based on our historical rates.
Our revenue arrangements do not contain significant financing components. Revenue is recognized over a period of time when it is assessed that performanceobligations are satisfied over a period rather than at a point in time. When any of the following criteria is fulfilled, revenue is recognized over a period of time:
(a) The customer simultaneously receives and consumes the benefits provided by the performance completed.(b) Performance creates or enhances an asset (for example, work in process) that the customer controls as the asset is created or enhanced.(c) Performance does not create an asset with an alternative use, and has an enforceable right to payment for performance completed to date.
Inventories
Inventories are stated at the lower of (i) standard cost, which approximates actual cost on a first-in-first-out basis, or (ii) net realizable value. Our standard costrevision policy is to monitor manufacturing variances and revise standard costs on a quarterly basis. Because of the cyclical nature of the market, inventory levels,obsolescence of technology, and product life cycles, we generally write-down inventories to net realizable value based on forecasted product demand. Actualdemand and market conditions may be lower than those projected by us. This difference could have a material adverse effect on our gross margin should inventorywrite-downs beyond those initially recorded become necessary. Alternatively, should actual demand and market conditions be more favorable than those estimatedby us, gross margin could be favorably impacted as we release these reserves upon the ultimate product shipment. During fiscal years 2019 and 2018 , we had netinventory write-downs of $36.1 million and $21.4 million , respectively. When the Company records a write-down on inventory, it establishes a new, lower costbasis for that inventory, and subsequent changes in facts and circumstances will not result in the restoration or increase in that newly established cost basis.
Long-Lived Assets
We evaluate the recoverability of property, plant and equipment in accordance with Accounting Standards Codification (“ASC”) No. 360, Property, Plant, andEquipment (“ASC 360”). We perform periodic reviews to determine whether facts and circumstances exist that would indicate that the carrying amounts ofproperty, plant and equipment might not be fully recoverable. If facts and circumstances indicate that the carrying amount of property, plant and equipment mightnot be fully recoverable, we compare projected undiscounted net cash flows associated with the related asset or group of assets over their estimated remaininguseful lives against their respective carrying amounts. In the event that the projected undiscounted cash flows are not sufficient to recover the carrying value of theassets, the assets are written down to their estimated fair values based on the expected discounted future cash flows attributable to the assets. Evaluation ofimpairment of property, plant and equipment requires estimates in the forecast of future operating results that are used in the preparation of the expected futureundiscounted cash flows. Actual future operating results and the remaining economic lives of our property, plant and equipment could differ from our estimatesused in assessing the recoverability of these assets. These differences could result in impairment charges, which could have a material adverse impact on our resultsof operations.
Intangible Assets and Goodwill
We account for intangible assets in accordance with ASC No. 350, Intangibles-Goodwill and Other (“ASC 350”). We review goodwill and purchased intangibleassets for impairment annually and whenever events or changes in circumstances indicate the carrying value of an asset may not be recoverable, such as whenreductions in demand or significant economic slowdowns in the semiconductor industry are present.
Intangible asset reviews are performed when indicators exist that could indicate the carrying value may not be recoverable based on comparisons to undiscountedexpected future cash flows. If this comparison indicates that there is impairment, the impaired asset is written down to fair value, which is typically calculatedusing: (i) quoted market prices or (ii) discounted expected future cash flows utilizing a discount rate consistent with the guidance provided in FASB ConceptsStatement No. 7, Using Cash Flow Information and Present Value in Accounting Measurements. Impairment is based on the excess of the carrying amount overthe fair value of those assets.
24

Goodwill represents the excess of the purchase price in a business combination over the fair value of net tangible and intangible assets acquired. In accordance withASC 350, the Company tests goodwill for impairment at the reporting unit level (operating segment or one level below an operating segment) on an annual basis ormore frequently if the Company believes indicators of impairment exist. As part of its analysis, the Company first performs a qualitative assessment to determine ifit is more likely than not that the fair value of a reporting unit is less than its carrying amount. If, as a result of the qualitative assessment, the Company determinesthat it is more likely than not that the fair value of a reporting unit is less than its carrying amount, then the Company performs the quantitative goodwillimpairment test. This test involves comparing the fair values of the applicable reporting units with their aggregate carrying values, including goodwill. TheCompany generally determines the fair value of the Company's reporting units using the income approach methodology of valuation that includes the discountedcash flow method as well as the market approach which includes the guideline company method. If the carrying amount of a reporting unit exceeds the reportingunit's fair value, the Company recognizes an impairment of goodwill measured as the amount by which a reporting unit’s carrying value exceeds its fair value withthe loss recognized not to exceed the total amount of goodwill allocated to the reporting unit.
Accounting for Income Taxes
We must make certain estimates and judgments in the calculation of income tax expense, determination of uncertain tax positions, and in the determination ofwhether deferred tax assets are more likely than not to be realized. The calculation of our income tax expense and income tax liabilities involves dealing withuncertainties in the application of complex tax laws and regulations.
ASC No. 740-10, Income Taxes (“ASC 740-10”), prescribes a recognition threshold and measurement framework for financial statement reporting and disclosureof tax positions taken or expected to be taken on a tax return. Under ASC 740-10, a tax position is recognized in the financial statements when it is more likely thannot, based on the technical merits, that the position will be sustained upon examination, including resolution of any related appeals or litigation processes. A taxposition that meets the recognition threshold is then measured to determine the largest amount of the benefit that has a greater than 50% likelihood of beingrealized upon settlement. Although we believe that our computation of tax benefits to be recognized and realized are reasonable, no assurance can be given that thefinal outcome will not be different from what was reflected in our income tax provisions and accruals. Such differences could have a material impact on our netincome and operating results in the period in which such determination is made. See Note 15: “Income Taxes” in the Notes to Consolidated Financial Statementsincluded in Part IV, Item 15(a) of this Annual Report for further information related to ASC 740-10.
We evaluate our deferred tax asset balance and record a valuation allowance to reduce the net deferred tax assets to the amount that is more likely than not to berealized. In the event it is determined that the deferred tax assets to be realized in the future would be in excess of the net recorded amount, an adjustment to thedeferred tax asset valuation allowance would be recorded. This adjustment would increase income in the period such determination was made. Likewise, should itbe determined that all or part of the net deferred tax asset would not be realized in the future, an adjustment to increase the deferred tax asset valuation allowancewould be charged to income in the period such determination is made. In assessing the need for a valuation allowance, historical levels of income, expectations andrisks associated with estimates of future taxable income and ongoing prudent and practicable tax planning strategies are considered. Realization of our deferred taxasset is dependent primarily upon future taxable income in the U.S. and certain foreign jurisdictions. Our judgments regarding future profitability may change dueto future market conditions, changes in U.S. or international tax laws and other factors. These changes, if any, may require material adjustments to the net deferredtax asset and an accompanying reduction or increase in net income in the period in which such determinations are made.
Litigation and Contingencies
From time to time, we receive notices that our products or manufacturing processes may be infringing the patent or other intellectual property rights of others,notices of stockholder litigation or other lawsuits or claims against us. We periodically assess each matter in order to determine if a contingent liability inaccordance with ASC No. 450, Contingencies (“ASC 450”), should be recorded. In making this determination, management may, depending on the nature of thematter, consult with internal and external legal counsel and technical experts. We expense legal fees associated with consultations and defense of lawsuits asincurred. Based on the information obtained, combined with management's judgment regarding all of the facts and circumstances of each matter, we determinewhether a contingent loss is probable and whether the amount of such loss can be estimated. Should a loss be probable and estimable, we record a contingent lossin accordance with ASC 450. In determining the amount of a contingent loss, we take into consideration advice received from experts in the specific matter, thecurrent status of legal proceedings, settlement negotiations which may be ongoing, prior case history and other factors. Should the judgments and estimates madeby management be incorrect, we may need to record additional contingent losses that could materially adversely impact our results of operations. Alternatively, ifthe judgments and estimates made by management are incorrect and a particular contingent loss does not occur, the contingent loss recorded would be reversedthereby favorably impacting our results of operations.
25

Results of OperationsThe following table sets forth certain Consolidated Statements of Income data expressed as a percentage of net revenues for the periods indicated:
For the Year Ended
June 29,
2019 June 30,
2018 June 24,
2017Net revenues 100.0 % 100.0 % 100.0 %Cost of goods sold 35.2 % 34.4 % 37.0 %
Gross margin 64.8 % 65.6 % 63.0 %Operating expenses:
Research and development 18.8 % 18.2 % 19.8 %Selling, general and administrative 13.3 % 13.0 % 12.7 %Intangible asset amortization 0.1 % 0.2 % 0.4 %Impairment of long-lived assets — % — % 0.3 %Severance and restructuring expenses 0.2 % 0.6 % 0.5 %Other operating expenses (income), net — % (0.1)% (1.0)%
Total operating expenses 32.6 % 32.0 % 32.7 %Operating income (loss) 32.3 % 33.6 % 30.3 %
Interest and other income (expense), net 0.3 % (0.3)% (0.7)%Income before taxes 32.6 % 33.3 % 29.6 %Provision (benefit) for income taxes (3.2)% 14.4 % 4.7 %
Net income 35.8 % 18.8 % 24.9 %
The following table shows pre-tax stock-based compensation included in the components of the Consolidated Statements of Income reported above as a percentageof net revenues for the periods indicated:
For the Year Ended
June 29,
2019 June 30,
2018 June 24,
2017
Cost of goods sold 0.4% 0.4% 0.4%Research and development 1.8% 1.5% 1.6%Selling, general and administrative 1.5% 1.3% 1.1%
3.7% 3.2% 3.1%
A review of our fiscal year 2019 performance compared to fiscal year 2018 performance appears below. A review of our fiscal year 2018 performance compared tofiscal year 2017 performance is set forth in Part II, Item 7 of the Form 10-K for the fiscal year ended June 30, 2018 under the caption "Results of Operations".
Net Revenues
We reported net revenues of $2.3 billion and $2.5 billion in fiscal years 2019 and 2018 , respectively. Our net revenues in fiscal year 2019 decreased by 7%compared to our net revenues in fiscal year 2018 .
Revenue from industrial products was down 11% due to lower demand for control and automation, automatic test equipment and security products, partially offsetby higher demand for USB extension products. Revenue from communications and data center products was down 15% due to lower demand for network anddatacom and server products. Revenue from consumer products was down 6% due to lower demand in smartphones and home entertainment products, partiallyoffset by higher demand in handheld computers and wearable products. Revenue from automotive products was up 6%, driven by increased demand for powertrainand safety and security products.
The decrease in revenue was also partially driven by the 52-week fiscal year 2019 compared to the 53-week fiscal year 2018.
26

Approximately 89% and 88% of our net revenues in fiscal years 2019 and 2018 , respectively, were derived from customers located outside the United States,primarily in Asia and Europe. Less than 1.0% of our sales are denominated in currencies other than U.S. dollars. The impact of changes in foreign exchange rateson net revenues and our results of operations for fiscal years 2019 and 2018 were immaterial.
Gross Margin
Our gross margin as a percentage of net revenue was 64.8% in fiscal year 2019 compared to 65.6% in fiscal year 2018 . Our gross margin decreased byapproximately 1 percentage point, primarily due to lower revenue.
Research and Development
Research and development expenses were $435.2 million and $450.9 million for fiscal years 2019 and 2018 , respectively, which represented 18.8% and 18.2% ofnet revenues, respectively. The $15.7 million decrease in research and development expenses was due to lower salaries and other personnel related costs.
The level of research and development expenditures as a percentage of net revenues will vary from period to period depending, in part, on the level of net revenuesand on our success in recruiting the technical personnel needed for our new product introductions and process development. We view research and developmentexpenditures as critical to maintaining a high level of new product introductions, which in turn are critical to our plans for future growth.
Selling, General and Administrative
Selling, general and administrative expenses were $308.6 million and $322.9 million in fiscal years 2019 and 2018 , respectively, which represented 13.3% and13.0% of net revenues, respectively. The $14.3 million decrease in selling, general and administrative expenses was due to lower salaries and other personnelrelated costs, and lower travel expenses.
The level of selling, general and administrative expenditures as a percentage of net revenues will vary from period to period, depending on the level of net revenuesand our success in recruiting sales and administrative personnel needed to support our operations.
Severance and Restructuring Expenses
Severance and restructuring expenses were $5.6 million in fiscal year 2019 and $15.1 million in fiscal year 2018 , which represented 0.2% and 0.6% of netrevenues, respectively. The $9.4 million decrease was primarily due to fewer restructuring programs and activities during fiscal year 2019.
For further details on our restructuring plans and charges recorded, please refer to Note 16: “Restructuring Activities” in our consolidated financial statementsincluded in Part IV, Item 15(a) to this Annual Report.
Interest and Other Income (Expense), Net
Interest and other income (expense), net was $7.3 million in fiscal year 2019 and $(8.6) million in fiscal year 2018 , which represented 0.3% and (0.3)% of netrevenues, respectively. The increase in interest and other income (expense) of $15.9 million was attributable to increased interest income from cash equivalents andshort-term investments, and gains from long-term investments. In addition, interest expense was lower due to the repayment of $500.0 million of notes inNovember 2018.
Provision (Benefit) for Income Taxes
Our annual income tax expense (benefit) was ($73.1) million and $357.6 million fiscal years 2019 and 2018, respectively. The effective tax rate was (9.7)% and43.3% for fiscal years 2019 and 2018, respectively.
On December 22, 2017 legislation, commonly referred to as the Tax Cuts and Jobs Act (the “Act”), was enacted. The Act reduced the federal statutory tax ratefrom 35% to 21%, effective January 1, 2018, which results in federal statutory tax rates for the Company of 21% and 28.1% (average of a 35% rate for the first halfof fiscal year 2018 and a 21% rate for the second half of fiscal year 2018) for fiscal years 2019 and 2018, respectively.
27

The Act included a one-time tax on accumulated unremitted earnings of our foreign subsidiaries (“Transition Tax”). SEC Staff Accounting Bulletin No. 118allowed the use of provisional amounts (reasonable estimates) if accounting for the income tax effects of the Act was not completed. Provisional amounts must beadjusted within a one-year measurement period from the enactment date of the Act. In the second quarter of fiscal year 2018, the Company recorded a $236.9million provisional Transition Tax charge. During the measurement period the Company gathered information and analyzed available guidance and in the secondquarter of fiscal year 2019 recorded a $22.1 million Transition Tax charge, which increased the Company’s fiscal year 2019 tax rate by 2.9%. As of the end of thesecond quarter of fiscal year 2019 accounting for the income tax effects of the Act was completed.
The Act included Global Intangible Low-Taxed Income (“GILTI”) provisions, which first impact the Company in fiscal year 2019. The GILTI provisionseffectively subject income earned by the Company’s foreign subsidiaries to current U.S. tax at a rate of 10.5%, less foreign tax credits. The Company has elected totreat tax generated by the GILTI provisions as a period expense.
In fiscal year 2019, the Company reversed $221.5 million of uncertain tax position reserves and $30.1 million of related interest reserves, net of federal and statebenefits, primarily due to the fiscal fourth quarter settlement of an audit of the Company’s fiscal year 2009 through fiscal year 2011 federal corporate income taxreturns, which also settled intercompany buy-in license payment issues for fiscal years 2012 through fiscal year 2019. $140.7 million of fiscal year 2009 throughfiscal year 2018 advance tax payments made in June 2018 were applied to additional federal tax liabilities generated by the settlement. The reversal of uncertaintax position reserves for intercompany transfer pricing issues increased accumulated unremitted foreign earnings, which resulted in an additional Transition Taxcharge of $47.7 million in the fiscal fourth quarter.
Our fiscal year 2019 effective tax rate was lower than the statutory tax rate primarily due to the $251.6 million reversal of uncertain tax position and related interestreserves, and earnings of foreign subsidiaries, generated primarily by our international operations managed in Ireland, that were taxed at lower rates. These impactswere partially offset by tax generated by GILTI provisions and a $68.7 million Transition Tax charge.
Our fiscal year 2018 effective tax rate was higher than the statutory rate primarily due to a $236.9 million provisional charge for the Transition Tax, a $13.7 millioncharge to remeasure deferred taxes at the enactment date of the Act to reflect the federal statutory rate reduction, and $17.1 million of interest accruals forunrecognized tax benefits, partially offset by earnings of foreign subsidiaries, generated primarily by our international operations managed in Ireland, that weretaxed at lower rates, and $11.1 million of excess tax benefits generated by the settlement of share-based awards.
We have various entities domiciled within and outside the United States. The following is a breakout of our U.S. and foreign income (loss) before income taxes:
For the Year Ended
June 29,
2019 June 30,
2018 June 24,
2017 (in thousands)Domestic pre-tax income $ 103,016 $ 149,056 $ 154,628Foreign pre-tax income 651,405 675,829 524,961
Total $ 754,421 $ 824,885 $ 679,589
A relative increase in earnings in lower tax jurisdictions, such as Ireland, may lower our consolidated effective tax rate, while a relative increase in earnings inhigher tax jurisdictions, such as the United States, may increase our consolidated effective tax rate.
In fiscal year 2019 the percentage of pre-tax income from our foreign operations increased, which was primarily due to lower foreign amortization andintercompany royalty expenses. The impact of pre-tax income from foreign operations reduced our effective tax rate by 15.8 percentage points in fiscal year 2019as compared to 16.7 percentage points in fiscal year 2018. The rate reduction for foreign operations is the expected tax on foreign operations at the federal statutorytax rate less actual tax on foreign operations. The lower fiscal year 2019 tax rate benefit from foreign operations was primarily due to a reduction of the Company’sfederal statutory tax rate from 28.1% to 21%, partially offset by lower intercompany royalty expenses.
In fiscal year 2018 the percentage of pre-tax income from our foreign operations increased, which was primarily due a fiscal year 2017 gain from the sale of theCompany’s micro-electromechanical systems (MEMS) business line that increased domestic pre-tax income. The impact of pre-tax income from foreign operationsreduced our effective tax rate by 16.7 percentage points in fiscal year 2018 as compared to 20.2 percentage points in fiscal year 2017. The rate reduction for foreignoperations is the expected tax on foreign operations at the federal statutory tax rate less actual tax on foreign operations. The lower fiscal year 2018 tax rate benefitfrom foreign operations was primarily due to a reduction of the Company’s federal statutory tax rate from 35% to 28.1%.
28

Recently Issued Accounting Pronouncements
Refer to our discussion of recently issued accounting pronouncements as included in Part IV, Item 15. Exhibits and financial statement schedules, Note 2:“Summary of Significant Accounting Policies”.
Financial Condition, Liquidity and Capital Resources
Financial Condition
Cash flows were as follows:
For the Year Ended
June 29,
2019 June 30,
2018 June 24,
2017 (in thousands)Net cash provided by operating activities $ 875,840 $ 819,464 $ 773,657Net cash provided by (used in) investing activities 856,911 (710,066) (325,396)Net cash provided by (used in) financing activities (1,518,893) (812,035) (307,369)
Net increase (decrease) in cash and cash equivalents $ 213,858 $ (702,637) $ 140,892
Operating Activities
Cash provided by operating activities is net income adjusted for certain non-cash items and changes in certain assets and liabilities.
Cash provided by operating activities was $875.8 million in fiscal year 2019 , an increase of $56.4 million compared with fiscal year 2018 . This increase wasprimarily caused by an increase in net income of $360.2 million, and partially offset by changes in income tax liabilities.
Investing Activities
Investing cash flows consist primarily of capital expenditures, net investment purchases and maturities, and acquisitions.
Cash provided by investing activities was $856.9 million in fiscal year 2019 , an increase of $1.6 billion compared with fiscal year 2018 . The change was due to$377.3 million increase in maturities of available-for-sale securities and a $1.2 billion decrease in purchases of available-for-sale securities.
Financing Activities
Financing cash flows consist primarily of new borrowings, repurchases of common stock, issuance and repayment of notes payables, payment of dividends tostockholders, proceeds from stock option exercises and employee stock purchase plan and withholding tax payments associated with net share settlements of equityawards.
Net cash used in financing activities was $1.5 billion in fiscal year 2019 , an increase of $706.9 million compared with fiscal year 2018 . Changes in cash used infiscal year 2019 included a payment of $500.0 million of debt, a $131.2 million increase in repurchases of common stock, and an increase of $67.5 million individend payments.
Liquidity and Capital Resources
Our primary source of liquidity is our cash flows from operating activities resulting from net income and management of working capital.
As of June 29, 2019 , our available funds consisted of $1.9 billion in cash, cash equivalents and short-term investments.
In November 2018, the Company repaid $500.0 million of principal and related outstanding interest of the Company's 2.5% coupon notes.
29

In January 2019, the Company terminated its $350.0 million revolving credit facility with certain institutional lenders.
On October 30, 2018, we were authorized to repurchase up to $1.5 billion of the Company's common stock. During the years ended June 29, 2019 and June 30,2018, we repurchased an aggregate of $539.2 million and $408.0 million, respectively, of the Company's common stock.
We anticipate that the available funds and cash generated from operations will be sufficient to meet cash and working capital requirements, including theanticipated level of capital expenditures, common stock repurchases, debt repayments and dividend payments for at least the next twelve months.
Contractual Obligations
The following table summarizes our significant contractual obligations at June 29, 2019 , and the effect such obligations are expected to have on our liquidity andcash flows in future periods:
Payment due by period
Total Less than 1
year 1-3 years 4-5 years More than 5
years (in thousands)Operating lease obligations (1) $ 72,544 $ 11,162 $ 21,567 $ 17,602 $ 22,213Outstanding debt obligations (2) 1,000,000 — — 500,000 500,000Interest payments associated with debt obligations (3) 200,562 34,125 68,250 47,156 51,031Inventory related purchase obligations (4) 416,969 64,067 100,926 87,323 164,653Transition Tax (5) 282,681 20,512 49,937 71,784 140,448
Total $ 1,972,756 $ 129,866 $ 240,680 $ 723,865 $ 878,345
(1) We lease some facilities under non-cancelable operating lease agreements that expire at various dates through 2030 .(2) Outstanding debt represents amounts primarily due for our long-term notes.(3) Interest payments calculated based on contractual payment requirements under the debt agreements.(4) We order some materials and supplies in advance or with minimum purchase quantities. We are obligated to pay for the materials and supplies when received. We alsoentered into a long-term supply agreement with a semiconductor foundry, TowerJazz, to supply finished wafers on our existing processes and products, which contains minimumpurchase requirements.(5) Transition tax on accumulated unremitted earnings of foreign subsidiaries at December 31, 2017, paid in eight interest-free installments beginning in September 2018.
Purchase orders for the purchase of the majority of our raw materials and other goods and services are not included above. Our purchase orders generally allow forcancellation without significant penalties. We do not have significant agreements for the purchase of raw materials or other goods specifying minimum quantitiesor set prices that exceed our expected short-term requirements.
As of June 29, 2019, our gross unrecognized income tax benefits were $220.4 million which excludes $31.7 million of accrued interest. We are unable to make areasonably reliable estimate of the timing of payments of these amounts, if any, in individual years due to uncertainties in the timing or outcomes of either actual oranticipated tax audits. As a result, these amounts are not included in the table above.
Off-Balance-Sheet Arrangements
As of June 29, 2019 , we did not have any material off-balance-sheet arrangements, as defined in Item 303(a)(4)(ii) of SEC Regulation S-K.
ITEM 7A. QUANTITATIVE AND QUALITATIVE DISCLOSURES ABOUT MARKET RISK
Interest Rate Risk
Our exposure to market risk for changes in interest rates relates primarily to our cash and cash equivalents, short-term investments and notes payable. See Note 5:“Financial Instruments” in the Notes to Consolidated Financial Statements included in this Annual
30

Report. We do not use derivative financial instruments to hedge the ongoing risk of interest rate volatility. At June 29, 2019 , we maintained a significant portfolioof money market fund investments, which are included in cash and cash equivalents. These money market funds are generally invested only in U.S. government oragency securities and are all available on a daily basis. Our short-term investments are in U.S. government, corporate and bank debt securities. Our long-term notespayable are all fixed rate securities and as such, we have no financial statement risk associated with changes in interest rates related to these notes.
To assess the interest rate risk associated with our outstanding long-term debt portfolio, we performed sensitivity analysis for our long-term notes as of June 29,2019 , using a modeling technique that measures the change in the fair values arising from a hypothetical 100 basis points increase in the levels of interest ratesacross the entire yield curve, with all other variables held constant. The discount rates used were based on the market interest rates in effect at June 29, 2019 . Thesensitivity analysis indicated that a hypothetical 100 basis points increase in interest rates would result in a reduction in the fair values of our long-term notes of$50.7 million .
Foreign Currency Risk
We generate less than 1.0% of our revenues in various global markets based on orders obtained in currencies other than the U.S. Dollar. We incur expendituresdenominated in non-U.S. currencies, primarily the Philippine Peso and the Thai Baht associated with our manufacturing activities in the Philippines and Thailand,respectively, and expenditures for sales offices and research and development activities undertaken outside of the U.S. We are exposed to fluctuations in foreigncurrency exchange rates primarily on cash flows for expenditures, orders, and accounts receivable from sales in these foreign currencies. We have established riskmanagement strategies designed to reduce the impact of volatility of future cash flows caused by changes in the exchange rate for these currencies. These strategiesreduce, but do not entirely eliminate, the impact of currency exchange rate movements. We do not use derivative financial instruments for speculative or tradingpurposes. We routinely hedge our exposure to certain foreign currencies with various financial institutions in an effort to minimize the impact of certain currencyexchange rate fluctuations. If a financial counterparty to any of our hedging arrangements experiences financial difficulties or is otherwise unable to honor theterms of the foreign currency hedge, we may experience financial losses.
For derivative instruments that are designated and qualify as cash flow hedges under ASC No. 815, Derivatives and Hedging (“ASC 815”), the effective portion ofthe gain or loss on the derivative is reported as a component of accumulated other comprehensive income or loss and reclassified into earnings into the samefinancial statement line as the item being hedged, and in the same period or periods during which the hedged transaction affects earnings. Gains and losses on thederivative representing either hedge ineffectiveness or hedge components excluded from the assessment of effectiveness are recognized each period in interest andother income (expense), net.
For derivative instruments that are not designated as hedging instruments under ASC 815, gains and losses are recognized each period in interest and other income(expense), net. All derivatives are foreign currency forward contracts to hedge certain foreign currency denominated assets or liabilities. The gains and losses onthese derivatives largely offset the changes in the fair value of the assets or liabilities being hedged.
As of June 29, 2019 , we had outstanding foreign currency derivative contracts with a total notional amount of $89.2 million . If overall foreign currency exchangerates appreciated (depreciated) uniformly by 10% against the U.S. dollar, our foreign currency derivative contracts outstanding as of June 29, 2019 wouldexperience an approximately $4.7 million gain (loss).
Foreign Exchange Contracts
The net unrealized gain or loss, if any, is potentially subject to market and credit risk as it represents appreciation (decline) of the hedge position against the spotexchange rates. The net realized and unrealized gains or losses from hedging foreign currency denominated assets and liabilities were immaterial during the fiscalyears ended June 29, 2019 and June 30, 2018 .
ITEM 8. FINANCIAL STATEMENTS AND SUPPLEMENTARY DATA
The financial statements and supplementary data required by this Item are set forth at the pages indicated in Part IV, Item 15(a) of this Annual Report andincorporated by reference herein.
ITEM 9. CHANGES IN AND DISAGREEMENTS WITH ACCOUNTANTS ON ACCOUNTING AND FINANCIAL DISCLOSURE
None.
31

ITEM 9A. CONTROLS AND PROCEDURES
Evaluation of Disclosure Controls and Procedures
Our management, with the participation of our chief executive officer (“CEO”) and our chief financial officer (“CFO”), evaluated the effectiveness of ourdisclosure controls and procedures as defined in Rules 13a-15(e) and 15d-15(e) of the Exchange Act as of June 29, 2019 . These disclosure controls and proceduresare designed to provide reasonable assurance that information required to be disclosed in the reports we file or submit under the Exchange Act is recorded,processed, summarized and reported within the time periods specified in the SEC rules and forms, and that such information is accumulated and communicated toour management, including our CEO and our CFO, to allow timely decisions regarding required disclosures. Based on the evaluation, our CEO and our CFO haveconcluded that our disclosure controls and procedures were effective at the reasonable assurance level as of June 29, 2019 .
Management's Annual Report on Internal Control over Financial Reporting
Our management is responsible for establishing and maintaining adequate internal control over financial reporting, as defined in Rules 13a-15(f) and 15d-15(f)under the Exchange Act. Internal control over financial reporting is a process designed by, or under the supervision of, the Company's CEO and CFO and effectedby the Company's Board of Directors, management, and other personnel to provide reasonable assurance regarding the reliability of financial reporting and thepreparation of financial statements for external purposes in accordance with generally accepted accounting principles. Our management, with the participation ofour CEO and our CFO, assessed the effectiveness of our internal control over financial reporting as of June 29, 2019 . Management's assessment of internal controlover financial reporting was conducted using the criteria in the Internal Control - Integrated Framework (2013) issued by the Committee of SponsoringOrganizations of the Treadway Commission. Our management has concluded that, as of June 29, 2019 , our internal control over financial reporting was effective,based on these criteria. PricewaterhouseCoopers LLP, an independent registered public accounting firm, audited the effectiveness of the Company's internalcontrol over financial reporting, as of June 29, 2019 , as stated within their report which is included herein.
Changes in Internal Control over Financial Reporting
There were no changes in our internal control over financial reporting during the quarter ended June 29, 2019 that have materially affected or are reasonably likelyto materially affect, our internal control over financial reporting.
Inherent Limitations on the Effectiveness of Internal Controls over Financial Reporting and Disclosure Controls and Procedures
A system of internal control over financial reporting is intended to provide reasonable assurance regarding the reliability of financial reporting and the preparationof financial statements in accordance with GAAP and no control system, no matter how well designed and operated, can provide absolute assurance. The design ofany control system is based in part upon certain assumptions about the likelihood of future events, and there can be no assurance that any design will succeed inachieving its stated goals under all potential future conditions. Because of its inherent limitations, internal control over financial reporting may not prevent ordetect financial statement errors and misstatements. Also, projection of any evaluation of effectiveness to future periods is subject to the risk that controls maybecome inadequate because of changes in conditions or that the degree of compliance with the policies or procedures may deteriorate.
32

ITEM 9B. OTHER INFORMATION None.
PART III
ITEM 10. DIRECTORS, EXECUTIVE OFFICERS AND CORPORATE GOVERNANCE
Other than as follows, the information required by this Item is incorporated by reference from the Company's Proxy Statement for the 2019 Annual Meeting ofStockholders under the headings “Audit Committee and Audit Committee Financial Expert,” “Proposal No. 1 - Election of Directors” and “Delinquent Section16(a) Reports”,
Information About Our Executive Officers
The following is information regarding our executive officers, including their positions and ages as of July 29, 2019.
Name Age PositionTunç Doluca 61 President and Chief Executive Officer Bruce E. Kiddoo 58 Senior Vice President, Chief Financial Officer and Chief Accounting OfficerVivek Jain 59 Senior Vice President, Technology and Manufacturing GroupEdwin B. Medlin 62 Senior Vice President, Chief Legal, Administrative, and Compliance OfficerChristopher J. Neil 53 Senior Vice President, New VenturesBryan J. Preeshl 57 Senior Vice President, QualityDavid Loftus 58 Vice President, Worldwide Sales and Marketing
Tunç Doluca has served as a director of Maxim Integrated as well as the President and Chief Executive Officer since January 2007. He joined Maxim Integrated inOctober 1984 and served as Vice President from 1994 to 2004. He was promoted to Senior Vice President in 2004 and Group President in May 2005. Prior to1994, he served in a number of integrated circuit development positions. Mr. Doluca holds a BSEE degree from Iowa State University and an MSEE degree fromthe University of California, Santa Barbara.
Bruce E. Kiddoo joined Maxim Integrated in September 2007 as Vice President of Finance. On October 1, 2008, Mr. Kiddoo was appointed Chief FinancialOfficer and Principal Accounting Officer of Maxim Integrated and was appointed Senior Vice President in September 2009. Prior to joining Maxim Integrated, Mr.Kiddoo held various positions at Broadcom Corporation, a global semiconductor company, beginning in December 1999. Mr. Kiddoo served as Broadcom’sCorporate Controller and Principal Accounting Officer from July 2002 and served as Vice President from January 2003. He also served as Broadcom’s ActingChief Financial Officer from September 2006 to March 2007. Mr. Kiddoo holds a BS degree in Applied Science from the United States Naval Academy and anMBA degree from the College of William & Mary. In January 2019, Mr. Kiddoo informed the Company that he was planning to retire in the second half ofcalendar year 2019, subject to the identification of and transition to a new Chief Financial Officer.
Vivek Jain joined Maxim Integrated in April 2007 as Vice President responsible for our wafer fabrication operations. In June 2009, Mr. Jain was promoted toSenior Vice President with expanded responsibility for managing test and assembly operations in addition to wafer fabrication operations. Prior to joining MaximIntegrated, Mr. Jain was with Intel Corporation as Plant Manager for Technology Development and Manufacturing Facility in Santa Clara, California from 2000.Mr. Jain holds a BS degree in Chemical Engineering from the Indian Institute of Technology at New Delhi, an MS degree in Chemical Engineering from PennState University, and an MS degree in Electrical Engineering from Stanford University. Edwin B. Medlin joined Maxim Integrated in November 1999 as Director and Associate General Counsel. He was promoted to Vice President and Senior Counselin April 2006, was appointed General Counsel in September 2010, and he was promoted to Senior Vice President and General Counsel in May 2015. In July 2019,Mr. Medlin was promoted to Chief Legal, Administrative, and Compliance Officer and remains a Senior Vice President of the Company. Prior to joining MaximIntegrated, he was with the law firm of Ropers, Majeski, Kohn and Bentley between 1987 and 1994 where he held various positions, including director. Between1994 and 1997, he held the positions of General Counsel, and later, General Manager, at Fox Factory, Inc., a privately held manufacturing company. Between 1997and 1999 he held the positions of General Counsel and later, Vice President of Global Sales and Marketing, at RockShox, Inc., a publicly traded corporation. Mr.Medlin holds a degree in Economics from the University of California, Santa Barbara, and a Juris Doctorate from Santa Clara University.
33

Christopher J. Neil joined Maxim Integrated in September 1990, was promoted to Vice President in April 2006, was named Division Vice President in September2009 and was promoted to Senior Vice President in September 2011. In May 2015, Mr. Neil was appointed to create and lead Maxim Ventures, the Company’sventure arm. Prior to 2006, he held several engineering and executive management positions. Mr. Neil holds BSEE and MSEE degrees from the MassachusettsInstitute of Technology.
Bryan J. Preeshl joined Maxim Integrated in 1990 as a Senior Failure Analysis Engineer and held various senior management roles in the quality organizationbefore being promoted to Vice President of Quality in 2010 and Senior Vice President of Quality in 2016. Prior to joining Maxim Integrated, Mr. Preeshl heldnumerous quality-related positions at National Semiconductor, ZyMOS, Monolithic Memories, and Advanced Micro Devices. Mr. Preeshl holds a degree inElectronics Engineering Technology from the DeVry Institute of Technology in Phoenix, Arizona.
David Loftus joined Maxim Integrated as its Vice President of Worldwide Sales and Marketing in 2015. Immediately prior to joining Maxim Integrated, Mr.Loftus led Worldwide Insights, a management consulting firm he founded in Atlanta. Earlier, he led the worldwide sales organizations for Cypress Semiconductorand Intersil Corporation. Before his tenure at Intersil, Mr. Loftus spent 17 years with Xilinx, as Vice President and General Manager for its Spartan ProductsDivision and as Vice President and Managing Director for the Company's Asia Pacific operations. Mr. Loftus holds a degree in Electrical Engineering and aMasters in Management from Georgia Institute of Technology.
Code of Business Conduct and Ethics
We have a Code of Business Conduct and Ethics (the “Code of Ethics”), which applies to all directors and employees, including, but not limited to, our principalexecutive officer and principal financial and accounting officer. The Code of Ethics is designed to promote: (i) honest and ethical conduct, including the ethicalhandling of actual or apparent conflicts of interest arising from personal and professional relationships, (ii) full, fair, accurate, timely and understandable disclosurein reports and documents that we are required to file with the SEC and in other public communications, (iii) compliance with applicable governmental laws, rulesand regulations, (iv) the prompt internal reporting of violations of the Code of Ethics to an appropriate person or group, and (v) accountability for adherence to theCode of Ethics. A copy of the Code of Ethics is available on our website at http://www.maximintegrated.com/en/aboutus/maxim-corporate-policies.html . TheCompany intends to satisfy the disclosure requirement regarding any amendment to, or a waiver from, a provision of the Code of Ethics for the Company'sprincipal executive officer, principal financial officer or principal accounting officer by posting such information on its website. The contents of our website arenot incorporated into this Annual Report.
ITEM 11. EXECUTIVE COMPENSATION
The information required by this item is incorporated by reference from the Company's Proxy Statement for the 2019 Annual Meeting of Stockholders under theheadings “Director Compensation,” “Compensation Discussion and Analysis,” “Compensation Committee Report” and “Executive Compensation.”
ITEM 12. SECURITY OWNERSHIP OF CERTAIN BENEFICIAL OWNERS AND MANAGEMENT AND RELATED STOCKHOLDER MATTERS
Equity Compensation Plan Information
The information required by this item is incorporated by reference from the Company's Proxy Statement for the 2019 Annual Meeting of Stockholders under theheading “Equity Compensation Plan Information” and “Security Ownership of Certain Beneficial Owners, Directors and Management.”
ITEM 13. CERTAIN RELATIONSHIPS AND RELATED TRANSACTIONS, AND DIRECTOR INDEPENDENCE
The information required by this item is incorporated by reference from the Company’s Proxy Statement for the 2019 Annual Meeting of Stockholders under theheadings “Corporate Governance and Board of Directors Matters” and “Certain Relationships and Related Transactions.”
ITEM 14. PRINCIPAL ACCOUNTANT FEES AND SERVICES
34

The information required by this item is incorporated by reference from the Company's Proxy Statement for the 2019 Annual Meeting of Stockholders under theheadings “Report of the Audit Committee of the Board of Directors” and “Independent Public Accountants.”
35

PART IV
ITEM 15. EXHIBITS AND FINANCIAL STATEMENT SCHEDULES
(a) The following are filed as part of this Report:
Page (1) Financial Statements 37 Consolidated Balance Sheets at June 29, 2019 and June 30, 2018 37 Consolidated Statements of Income for each of the three years in the period ended June 29, 2019 38 Consolidated Statements of Comprehensive Income for each of the three years in the period ended June 29, 2019 39 Consolidated Statements of Stockholders' Equity for each of the three years in the period ended June 29, 2019 40 Consolidated Statements of Cash Flows for each of the three years in the period ended June 29, 2019 41 Notes to Consolidated Financial Statements 42 Report of Independent Registered Public Accounting Firm 72 (2) Financial Statement Schedule
The following financial statement schedule is filed as part of this Annual Report on Form 10-K and should be read in conjunctionwith the financial statements.
Schedule II - Valuation and Qualifying Accounts 74
All other schedules are omitted because they are not applicable, or because the required information is included in the consolidatedfinancial statements or notes thereto.
(3) The Exhibits filed as a part of this Report are listed in the attached Index to Exhibits.
(b) Exhibits .
See attached Index to Exhibits.
36
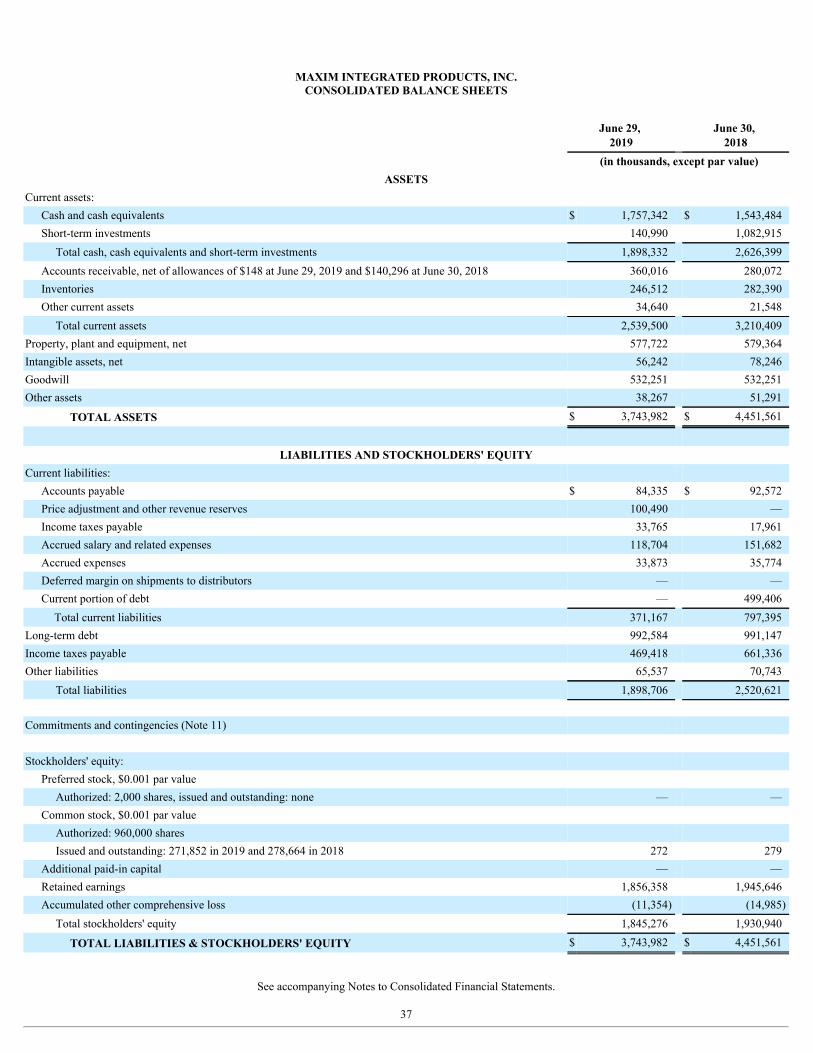
MAXIM INTEGRATED PRODUCTS, INC.CONSOLIDATED BALANCE SHEETS
June 29,
2019 June 30,
2018 (in thousands, except par value)
ASSETSCurrent assets:
Cash and cash equivalents $ 1,757,342 $ 1,543,484Short-term investments 140,990 1,082,915
Total cash, cash equivalents and short-term investments 1,898,332 2,626,399Accounts receivable, net of allowances of $148 at June 29, 2019 and $140,296 at June 30, 2018 360,016 280,072Inventories 246,512 282,390Other current assets 34,640 21,548
Total current assets 2,539,500 3,210,409Property, plant and equipment, net 577,722 579,364Intangible assets, net 56,242 78,246Goodwill 532,251 532,251Other assets 38,267 51,291
TOTAL ASSETS $ 3,743,982 $ 4,451,561
LIABILITIES AND STOCKHOLDERS' EQUITY
Current liabilities:
Accounts payable $ 84,335 $ 92,572Price adjustment and other revenue reserves 100,490 —Income taxes payable 33,765 17,961Accrued salary and related expenses 118,704 151,682Accrued expenses 33,873 35,774Deferred margin on shipments to distributors — —Current portion of debt — 499,406
Total current liabilities 371,167 797,395Long-term debt 992,584 991,147Income taxes payable 469,418 661,336Other liabilities 65,537 70,743
Total liabilities 1,898,706 2,520,621 Commitments and contingencies (Note 11)
Stockholders' equity:
Preferred stock, $0.001 par value Authorized: 2,000 shares, issued and outstanding: none — —
Common stock, $0.001 par value Authorized: 960,000 shares Issued and outstanding: 271,852 in 2019 and 278,664 in 2018 272 279
Additional paid-in capital — —Retained earnings 1,856,358 1,945,646Accumulated other comprehensive loss (11,354) (14,985)
Total stockholders' equity 1,845,276 1,930,940
TOTAL LIABILITIES & STOCKHOLDERS' EQUITY $ 3,743,982 $ 4,451,561
See accompanying Notes to Consolidated Financial Statements.
37

MAXIM INTEGRATED PRODUCTS, INC.CONSOLIDATED STATEMENTS OF INCOME
For the Years Ended
June 29,
2019 June 30,
2018 June 24,
2017 (in thousands, except per share data)
Net revenues $ 2,314,329 $ 2,480,066 $ 2,295,615Cost of goods sold 813,823 853,945 849,135 Gross margin 1,500,506 1,626,121 1,446,480Operating expenses: Research and development 435,222 450,943 453,977 Selling, general and administrative 308,617 322,918 291,511 Intangible asset amortization 3,041 4,467 9,189 Impairment of long-lived assets 753 892 7,517 Severance and restructuring expenses 5,632 15,060 12,453 Other operating expenses (income), net 143 (1,607) (22,944) Total operating expenses 753,408 792,673 751,703 Operating income (loss) 747,098 833,448 694,777Interest and other income (expense), net 7,323 (8,563) (15,188)Income (loss) before taxes 754,421 824,885 679,589Provision (benefit) for income taxes (73,065) 357,567 107,976
Net income (loss) $ 827,486 $ 467,318 $ 571,613
Earnings (loss) per share: Basic $ 3.01 $ 1.66 $ 2.02
Diluted $ 2.97 $ 1.64 $ 1.98
Weighted-average shares used in the calculation of earnings (loss) per share: Basic 274,966 280,979 283,147
Diluted 278,777 285,674 287,974
Dividends declared and paid per share $ 1.84 $ 1.56 $ 1.32
See accompanying Notes to Consolidated Financial Statements.
38

MAXIM INTEGRATED PRODUCTS, INC.CONSOLIDATED STATEMENTS OF COMPREHENSIVE INCOME
For the Years Ended
June 29,
2019 June 30,
2018 June 24,
2017 (in thousands)Net income $ 827,486 $ 467,318 $ 571,613Other comprehensive income (loss), net of tax:
Change in net unrealized gains and (losses) on available-for-sale securities, net of tax benefit(expense) of $(175) in 2019, $184 in 2018, and $0 in 2017 3,629 (2,436) (1,723)Change in net unrealized gains and (losses) on cash flow hedges, net of tax benefit (expense) of$(354) in 2019, $291 in 2018, and $(137) in 2017 1,808 (1,401) 510Change in net unrealized gains and (losses) on postretirement benefits, net of tax benefit(expense) of $42 in 2019, $115 in 2018, and $(2,988) in 2017 (1,806) (1,258) 5,542
Other comprehensive income (loss), net 3,631 (5,095) 4,329
Total comprehensive income $ 831,117 $ 462,223 $ 575,942
See accompanying Notes to Consolidated Financial Statements.
39
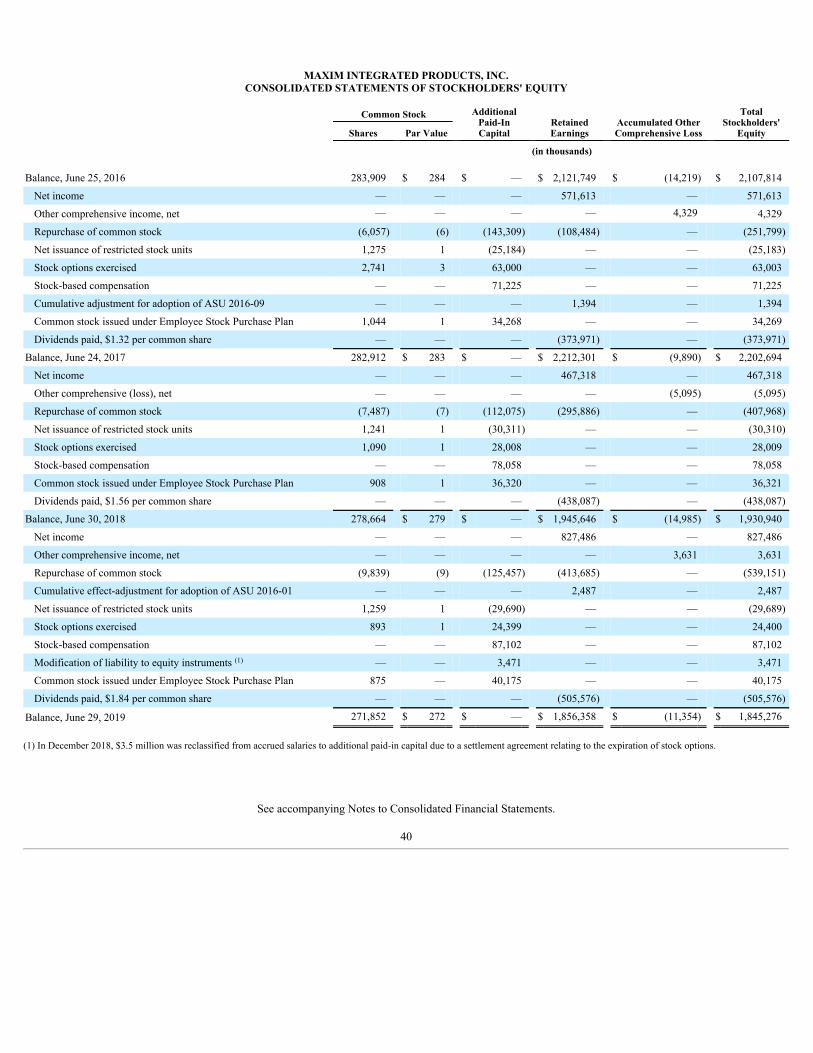
MAXIM INTEGRATED PRODUCTS, INC.CONSOLIDATED STATEMENTS OF STOCKHOLDERS' EQUITY
Common Stock AdditionalPaid-InCapital
RetainedEarnings
Accumulated OtherComprehensive Loss
TotalStockholders'
Equity Shares Par Value (in thousands) Balance, June 25, 2016 283,909 $ 284 $ — $ 2,121,749 $ (14,219) $ 2,107,814
Net income — — — 571,613 — 571,613
Other comprehensive income, net — — — — 4,329 4,329
Repurchase of common stock (6,057) (6) (143,309) (108,484) — (251,799)
Net issuance of restricted stock units 1,275 1 (25,184) — — (25,183)
Stock options exercised 2,741 3 63,000 — — 63,003
Stock-based compensation — — 71,225 — — 71,225
Cumulative adjustment for adoption of ASU 2016-09 — — — 1,394 — 1,394
Common stock issued under Employee Stock Purchase Plan 1,044 1 34,268 — — 34,269
Dividends paid, $1.32 per common share — — — (373,971) — (373,971)
Balance, June 24, 2017 282,912 $ 283 $ — $ 2,212,301 $ (9,890) $ 2,202,694
Net income — — — 467,318 — 467,318
Other comprehensive (loss), net — — — — (5,095) (5,095)
Repurchase of common stock (7,487) (7) (112,075) (295,886) — (407,968)
Net issuance of restricted stock units 1,241 1 (30,311) — — (30,310)
Stock options exercised 1,090 1 28,008 — — 28,009
Stock-based compensation — — 78,058 — — 78,058
Common stock issued under Employee Stock Purchase Plan 908 1 36,320 — — 36,321
Dividends paid, $1.56 per common share — — — (438,087) — (438,087)
Balance, June 30, 2018 278,664 $ 279 $ — $ 1,945,646 $ (14,985) $ 1,930,940
Net income — — — 827,486 — 827,486
Other comprehensive income, net — — — — 3,631 3,631
Repurchase of common stock (9,839) (9) (125,457) (413,685) — (539,151)
Cumulative effect-adjustment for adoption of ASU 2016-01 — — — 2,487 — 2,487
Net issuance of restricted stock units 1,259 1 (29,690) — — (29,689)
Stock options exercised 893 1 24,399 — — 24,400
Stock-based compensation — — 87,102 — — 87,102
Modification of liability to equity instruments (1) — — 3,471 — — 3,471
Common stock issued under Employee Stock Purchase Plan 875 — 40,175 — — 40,175
Dividends paid, $1.84 per common share — — — (505,576) — (505,576)
Balance, June 29, 2019 271,852 $ 272 $ — $ 1,856,358 $ (11,354) $ 1,845,276
(1) In December 2018, $3.5 million was reclassified from accrued salaries to additional paid-in capital due to a settlement agreement relating to the expiration of stock options.
See accompanying Notes to Consolidated Financial Statements.
40

MAXIM INTEGRATED PRODUCTS, INC.CONSOLIDATED STATEMENTS OF CASH FLOWS
For the Years Ended
June 29,
2019 June 30,
2018 June 24,
2017 (in thousands)Cash flows from operating activities: Net income $ 827,486 $ 467,318 $ 571,613Adjustments to reconcile net income to net cash provided by operating activities:
Stock-based compensation 86,977 78,685 71,117Depreciation and amortization 110,745 144,974 164,292Deferred taxes 13,957 27,715 (7,895)Loss on sale of property, plant and equipment 3,967 995 16,365Impairment of long-lived assets — 42 1,462(Gain) loss on investments in privately-held companies, net (3) 850 6,720(Gain) on sale of business — — (26,620)Changes in assets and liabilities:
Accounts receivable 21,090 (19,714) 78Inventories 36,003 (32,776) (21,215)Other current assets (14,901) 32,368 (3,547)Accounts payable (10,272) 9,560 (6,205)Income taxes payable (176,114) 117,654 60,798Deferred margin on shipments to distributors — (14,974) (23,805)All other accrued liabilities (23,095) 6,767 (29,501)
Net cash provided by operating activities 875,840 819,464 773,657 Cash flows from investing activities:
Purchases of property, plant and equipment (82,823) (65,782) (51,421)Proceeds from sale of property, plant, and equipment 340 5,823 10,792Proceeds from sale of available-for-sale securities 30,192 107,291 50,994Proceeds from maturity of available-for-sale securities 1,130,514 753,249 75,000Proceeds from sale of business — — 42,199Payment in connection with business acquisition, net of cash acquired (2,949) (57,773) —Purchases of available-for-sale securities (214,587) (1,447,354) (450,135)Purchases of privately-held companies' securities (3,176) (5,520) (2,825)Other investing activities (600) — —
Net cash provided by (used in) investing activities 856,911 (710,066) (325,396) Cash flows from financing activities
Contingent consideration paid (9,052) — —Repayment of notes payable (500,000) — (250,000)Issuance of debt — — 500,000Debt issuance cost — — (3,688)Net issuance of restricted stock units (29,689) (30,310) (25,183)Proceeds from stock options exercised 24,400 28,009 63,003Issuance of common stock under employee stock purchase program 40,175 36,321 34,269Repurchase of common stock (539,151) (407,968) (251,799)Dividends paid (505,576) (438,087) (373,971)
Net cash used in financing activities (1,518,893) (812,035) (307,369) Net increase (decrease) in cash and cash equivalents 213,858 (702,637) 140,892Cash and cash equivalents:
Beginning of year 1,543,484 2,246,121 2,105,229
End of year $ 1,757,342 $ 1,543,484 $ 2,246,121

Supplemental disclosures of cash flow information: Cash paid, net, for income taxes $ 98,104 $ 189,100 $ 76,243Cash paid for interest $ 40,376 $ 46,625 $ 29,375
Noncash financing and investing activities:
Accounts payable related to property, plant and equipment purchases $ 12,090 $ 8,833 $ 3,853
See accompanying Notes to Consolidated Financial Statements.
41

MAXIM INTEGRATED PRODUCTS, INC.NOTES TO CONSOLIDATED FINANCIAL STATEMENTS
NOTE 1: NATURE OF OPERATIONS
Maxim Integrated Products, Inc. (“Maxim Integrated”, the “Company,” “we,” “us” or “our”), incorporated in Delaware, designs, develops, manufactures, andmarkets a broad range of linear and mixed-signal integrated circuits, commonly referred to as analog circuits, for a large number of customers in diversegeographical locations. The Company also provides a range of high-frequency process technologies and capabilities for use in custom designs. The analog marketis fragmented and characterized by diverse applications and a great number of product variations with varying product life cycles. Maxim Integrated is a globalcompany with a manufacturing facility in the United States, testing facilities in the Philippines and Thailand, and sales and circuit design offices throughout theworld. Integrated circuit assembly is performed by foreign assembly subcontractors, located in countries throughout Asia, where wafers are separated intoindividual integrated circuits and assembled into a variety of packages. The major end-markets in which the Company's products are sold are the automotive,communications and data center, computing, consumer and industrial markets.
The Company has a 52-to-53-week fiscal year that ends on the last Saturday of June. Accordingly, every fifth or sixth year will be a 53-week fiscal year. Fiscalyear 2019 was a 52-week fiscal year (ended on June 29, 2019 ). Fiscal years 2018 and 2017 were 53-week and 52-week fiscal years, respectively. Fiscal years 2018and 2017 ended on June 30, 2018 , and June 24, 2017 , respectively.
NOTE 2: SUMMARY OF SIGNIFICANT ACCOUNTING POLICIES
Use of Estimates
The preparation of financial statements in conformity with accounting principles generally accepted in the United States requires management to make estimatesand assumptions that affect the reported amounts of assets and liabilities, the disclosure of contingent assets and liabilities at the date of the financial statementsand the reported amounts of revenues and expenses during the reporting period. Such estimates relate to the useful lives and fair value of fixed assets, valuationallowance for deferred tax assets, reserves relating to uncertain tax positions, allowances for doubtful accounts, customer returns and allowances, allowance fordistributor credits, inventory valuation, reserves relating to litigation matters, assumptions about the fair value of reporting units, accrued liabilities and reserves,assumptions related to the calculation of stock-based compensation and the value of intangibles acquired and goodwill associated with business combinations. TheCompany bases its estimates and judgments on its historical experience, knowledge of current conditions and its beliefs of what could occur in the future, givenavailable information. Actual results may differ from those estimates, and such differences may be material to the financial statements.
Basis of Presentation
The consolidated financial statements include the accounts of the Company and all of its majority-owned subsidiaries. Intercompany balances and transactionshave been eliminated in consolidation.
Cash Equivalents and Investments
The Company considers all highly liquid financial instruments purchased with an original maturity of three months or less at the date of purchase to be cashequivalents. Cash and cash equivalents consist of demand accounts, money market funds, U.S. Treasury securities, agency securities, corporate debt securities,certificates of deposit, and commercial paper. Short-term investments consist primarily of U.S. treasury debt securities with original maturities beyond threemonths at the date of purchase, agency securities, corporate debt securities, certificates of deposit, and commercial paper.
The Company's short-term investments are considered available-for-sale and classified as short-term as these investments generally consist of highly marketablesecurities that are available to meet near-term cash requirements. Such securities are carried at fair market value based on market quotes and other observableinputs. Unrealized gains and losses, net of tax, on securities in this category are reported as equity in the Consolidated Statement of Comprehensive Income.Realized gains and losses on sales of investment securities are determined based on the specific identification method and are included in Interest and other income(expense), net in the Consolidated Statements of Income.
The Company's long-term equity investments consist of investments in privately-held companies without readily determinable fair values and are included in Otherassets on the Consolidated Balance Sheets. Equity investments are measured using the measurement alternative, which is defined as cost, less impairment, adjustedfor observable price changes from orderly transactions
42

MAXIM INTEGRATED PRODUCTS, INC.NOTES TO CONSOLIDATED FINANCIAL STATEMENTS
for identical or similar investments of the same issuer. The Company uses various inputs to evaluate equity investments including valuations of recent financingevents as well as other information regarding the issuer’s historical and forecasted performance.
Derivative Instruments
The Company incurs expenditures denominated in non-U.S. currencies, primarily the Philippine Peso and the Thai Baht associated with the Company'smanufacturing activities in the Philippines and Thailand, respectively, and European Euro, Indian Rupee, Taiwan New Dollar, South Korean Won, Chinese Yuan,Japanese Yen, Singapore Dollar, and Canadian Dollar expenditures for sales offices and research and development activities undertaken outside of the U.S. TheCompany is exposed to fluctuations in foreign currency exchange rates for cash flows for expenditures and on orders and accounts receivable from sales in theseforeign currencies. The Company has established risk management strategies designed to reduce the impact of volatility of future cash flows caused by changes inthe exchange rate for these currencies. These strategies reduce, but do not entirely eliminate, the impact of currency exchange rates movements.
Currency forward contracts are used to offset the currency risk of non-U.S. dollar-denominated assets and liabilities. The Company typically enters into currencyforward contracts to hedge exposures associated with its expenditures denominated in European Euro, Philippine Peso and South Korean Won. The Company alsohedges smaller expense exposures in several other foreign currencies. The Company enters into currency forward contracts to hedge its accounts receivable andbacklog denominated in European Euro, Japanese Yen and British Pound. Changes in fair value of the underlying assets and liabilities are generally offset by thechanges in fair value of the related currency forward contract.
The Company uses currency forward contracts to hedge exposure to variability in anticipated non-U.S. dollar-denominated cash flows. These contracts aredesignated as cash flow hedges and recorded on the Consolidated Balance Sheets at their fair market value. The maturities of these instruments are generally lessthan six months . For derivative instruments that are designated and qualify as cash flow hedges, the effective portion of the gain or loss on the derivative isreported as a component of accumulated other comprehensive income (loss) and reported within the Consolidated Statements of Comprehensive Income. Theseamounts have been reclassified into earnings in the same period or periods during which the hedged transaction affects earnings. For derivative instruments that arenot designated as hedging instruments, gains and losses are recognized immediately in “Interest income (expense) and other, net” in the Consolidated Statements ofIncome.
Fair Value of Financial Instruments
The Company measures certain financial assets and liabilities at fair value based on the exchange price that would be received for an asset or paid to transfer aliability (an exit price) in the principal or most advantageous market for the asset or liability in an orderly transaction between market participants.
Inventories
Inventories are stated at the lower of (i) standard cost, which approximates actual cost on a first-in-first-out basis, or (ii) net realizable value. The Company'sstandard cost revision policy is to monitor manufacturing variances and revise standard costs on a quarterly basis. Because of the cyclical nature of the market,inventory levels, obsolescence of technology, and product life cycles, the Company generally writes down inventories to net realizable value based on forecastedproduct demand.
Property, Plant and Equipment
Property, plant and equipment are stated at cost. Depreciation is primarily computed on the straight-line method over the estimated useful lives of the assets, whichrange from 2 to 15 years for machinery, equipment and software and up to 40 years for buildings and building improvements. Leasehold improvements areamortized over the lesser of their useful lives or the remaining term of the related lease. When assets are retired or otherwise disposed of, the cost and accumulateddepreciation or amortization is removed from the accounts and any resulting gain or loss is reflected in the Consolidated Statements of Income. The classificationis based mainly on whether the asset is operating or not.
The Company evaluates the recoverability of property, plant and equipment in accordance with Accounting Standards Codification (“ASC”) No. 360, Property,Plant, and Equipment (“ASC 360”). The Company performs periodic reviews to determine whether facts and circumstances exist that would indicate that thecarrying amounts of property, plant and equipment are not recoverable and exceed their fair values. If facts and circumstances indicate that the carrying amounts ofproperty, plant and equipment might not be fully recoverable, projected undiscounted net cash flows associated with the related asset or group of assets over theirestimated remaining useful lives are compared against their respective carrying amounts. In the event that the projected undiscounted
43

MAXIM INTEGRATED PRODUCTS, INC.NOTES TO CONSOLIDATED FINANCIAL STATEMENTS
cash flows are not sufficient to recover the carrying value of the assets, the assets are written down to their estimated fair values based on their expected discountedfuture cash flows attributable to those assets. All long-lived assets classified as held for sale are reported at the lower of carrying amount or fair market value, lessexpected selling costs.
Intangible Assets and Goodwill
The Company accounts for intangible assets in accordance with ASC No. 350, Intangibles-Goodwill and Other (“ASC 350”). The Company reviews goodwill andpurchased intangible assets for impairment annually in the fourth fiscal quarter and whenever events or changes in circumstances indicate the carrying value of anasset may not be recoverable, such as when reductions in demand or significant economic slowdowns in the semiconductor industry are present.
Intangible asset reviews are performed when indicators exist that could indicate the carrying value may not be recoverable based on comparisons to undiscountedexpected future cash flows. If this comparison indicates that there is impairment, the impaired asset is written down to fair value, which is typically calculatedusing: (i) quoted market prices or (ii) discounted expected future cash flows utilizing a discount rate consistent with the guidance provided in FASB ConceptsStatement No. 7, Using Cash Flow Information and Present Value in Accounting Measurements . Impairment is based on the excess of the carrying amount overthe fair value of those assets.
Goodwill represents the excess of the purchase price in a business combination over the fair value of net tangible and intangible assets acquired. In accordance withASC 350, the Company tests goodwill for impairment at the reporting unit level (operating segment or one level below an operating segment) on an annual basis ormore frequently if the Company believes indicators of impairment exist. In accordance with ASC 350-20-35-3, the Company performs a qualitative assessment todetermine if it is more likely than not that the fair value of a reporting unit is less than its carrying amount. If, as a result of the qualitative assessment, theCompany determines that it is more likely than not that the fair value of a reporting unit is less than its carrying amount, then the Company performs thequantitative goodwill impairment test. This test involves comparing the fair values of the applicable reporting units with their aggregate carrying values, includinggoodwill. The Company determines the fair value of the Company's reporting units using the income approach methodology of valuation that includes thediscounted cash flow method as well as the market approach which includes the guideline company method. If the carrying amount of a reporting unit exceeds thereporting unit's fair value, the Company recognizes an impairment of goodwill measured as the amount by which a reporting unit’s carrying value exceeds its fairvalue with the loss recognized not to exceed the total amount of goodwill allocated to the reporting unit.
Product Warranty
The Company generally warrants its products for one year from the date of shipment against defects in materials, workmanship and material non-conformance tothe Company’s specifications. The general warranty policy provides for the repair or replacement of defective products or a credit to the customer’s account. Inlimited circumstances, the Company may consider extending its warranty for up to five years. It may also include limited financial responsibility, such as thepayment of monetary compensation to reimburse a customer for its financial losses beyond repairing or replacing the product or crediting the customer’s accountshould the product not meet the Company’s specifications, or to reimburse a customer for losses or damages that result from the defective product.
Accruals are based on specifically identified claims and on the estimated, undiscounted cost of incurred-but-not-reported claims. If there is a material increase inthe rate of customer claims compared with the Company's historical experience or if the Company's estimates of probable losses relating to specifically identifiedwarranty exposures require revision, the Company may record a charge against future cost of sales. The short-term and long-term portions of the product warrantyliability are included within the balance sheet captions Accrued expenses and Other liabilities, respectively, in the accompanying Consolidated Balance Sheets.
Retirement Benefits
The Company provides medical benefits to certain former and current employees pursuant to certain retirement agreements. The Company also provides retirementbenefits to employees located in the Philippines and in other countries. These benefits to individuals are accounted for pursuant to a documented plan under ASCNo. 715, Compensation-Retirement Benefits (“ASC 715”) . As of July 1, 2018, the Company adopted new accounting guidance that changed how postretirementbenefit plans present net periodic benefit cost in their income statement. This new guidance required the Company to report only the service cost component asoperating expense, while other components of net benefit costs are reported in other income, outside of income from operations. Unrecognized actuarial gains andlosses and prior service cost are amortized on a straight-line basis over the remaining estimated service period of participants. The measurement date for the plan isfiscal year end.
44

MAXIM INTEGRATED PRODUCTS, INC.NOTES TO CONSOLIDATED FINANCIAL STATEMENTS
Income Taxes
The Company accounts for income taxes using an asset and liability approach as prescribed in ASC No. 740-10, Income Taxes (“ASC 740-10”). The Companyrecords the amount of taxes payable or refundable for the current and prior years and deferred tax assets and liabilities for the future tax consequences of eventsthat have been recognized in the Company's financial statements or tax returns. A valuation allowance is recorded to reduce deferred tax assets when it is morelikely than not that a tax benefit will not be realized.
ASC 740-10 prescribes a recognition threshold and measurement framework for the financial statement reporting and disclosure of an income tax position taken orexpected to be taken on a tax return. Under ASC 740-10, a tax position is recognized in the financial statements when it is more likely than not, based on thetechnical merits, that the position will be sustained upon examination, including resolution of any related appeals or litigation processes. A tax position that meetsthe recognition threshold is then measured to determine the largest amount of the benefit that has a greater than 50% likelihood of being realized upon settlement.The Company recognizes interest and penalties related to unrecognized tax benefits as a component of the provision for income taxes in the ConsolidatedStatements of Income.
The calculation of tax liabilities involves significant judgment in estimating the impact of uncertainties in the application of complex tax laws across multiple taxjurisdictions. Although ASC 740-10 provides clarification on the accounting for uncertainty in income taxes recognized in the financial statements, the recognitionthreshold and measurement framework will continue to require significant judgment by management. Resolution of these uncertainties in a manner inconsistentwith the Company's expectations could have a material impact on the Company's results of operations.
Revenue Recognition
The Company recognizes revenue for sales to direct customers and distribution customers ("distributors") when a customer obtains control of promised goods orservices in an amount that reflects the consideration which the Company expects to receive in exchange for those goods or services. The transaction price iscalculated as selling price net of variable considerations, such as distributor price adjustments. In determining the transaction price, the Company evaluateswhether the price is subject to refund or adjustment to determine the net consideration to which it is expected to realize. The transaction price does not includeamounts collected on behalf of another party, such as sales taxes or value added tax. The Company elected the practical expedient to not disclose the value ofunsatisfied performance obligations for (i) contracts with an original expected length of one year or less and (ii) contracts for which it recognizes revenue at theamount to which it has the right to invoice for services performed. The Company estimates returns for sales to direct customers and distributors based on historicalreturn rates applied against current period gross revenue. Specific customer returns and allowances are considered within this estimate.
Accounts receivable from direct customers and distributors are recognized and inventory is relieved upon shipment as title to inventories generally transfers uponshipment, at which point the Company has a legally enforceable right to collection under normal terms. Accounts receivable related to consigned inventory isrecognized when the customer takes title to such inventory from its consigned location, at which point inventory is relieved, title transfers, and the Company has alegally enforceable right to collection under the terms of the agreement with the related customers. Customers are generally required to pay for products andservices within the Company’s standard terms, which is net 30 days from the date of invoice.
The Company estimates potential future returns and sales allowances related to current period product revenue. Management analyzes historical returns, changes incustomer demand and acceptance of products when evaluating the adequacy of returns and sales allowances. Estimates made may differ from actual returns andsales allowances. These differences may materially impact reported revenue and amounts ultimately collected on accounts receivable. Historically, suchdifferences have not been material.
Distributor price adjustments are estimated based on the Company's historical experience rates and also considering economic conditions and contractual terms. Todate, actual distributor claims activity has been materially consistent with the estimates that the Company has made based on its historical rates.
The Company's revenue arrangements do not contain significant financing components. Revenue is recognized over a period of time when it is assessed thatperformance obligations are satisfied over a period rather than at a point in time. When any of the following criteria is fulfilled, revenue is recognized over a periodof time:
45

MAXIM INTEGRATED PRODUCTS, INC.NOTES TO CONSOLIDATED FINANCIAL STATEMENTS
(a) The customer simultaneously receives and consumes the benefits provided by the performance completed. (b)Performance creates or enhances an asset (forexample, work in process) that the customer controls as the asset is created or enhanced. (c) Performance does not create an asset with an alternative use, and hasan enforceable right to payment for performance completed to date.
The Company had historically recognized a portion of revenue through certain distributors at the time the distributor resold the product to its end customer (alsoreferred to as the sell-through basis of revenue recognition) given the difficulty in estimating the ultimate price of these product shipments and amount of potentialreturns. The Company continuously reassesses its ability to reliably estimate the ultimate price of these products and the amount of potential returns and, over thepast several years, has made investments in its systems and updates to processes around its distribution channel to improve the quality of the information forpreparing such estimates. As a result of this continuous reassessment, the Company recognizes all revenue from distributors upon shipment to the distributor (alsoreferred to as the sell-in basis of revenue recognition) as of second quarter of fiscal year 2018.
Related Party Transactions
A member of the Company's Board of Directors is also a member of the Board of Directors of Flextronics International Ltd. During the fiscal years ended June 29,2019 , June 30, 2018 , and June 24, 2017 , the Company sold approximately $44.7 million , $61.6 million , and $70.4 million , respectively, in products toFlextronics International Ltd., a contract manufacturer, in the ordinary course of its business.
Research and Development Costs
Research and development costs are expensed as incurred. Such costs consist primarily of expenditures for labor and benefits, masks, prototype wafers anddepreciation.
Shipping Costs
Shipping costs billed to customers are included in net revenues and the related shipping costs are included in cost of goods sold in the Consolidated Statements ofIncome.
Stock-Based Compensation
Stock-based compensation cost is measured at the grant date, based on the fair value of the awards ultimately expected to vest and is recognized as an expense, ona straight-line basis, over the requisite service period. ASC No. 718, Compensation-Stock Compensation, allows forfeitures to be either expensed as incurred orestimated at the time of grant and revised if necessary in subsequent periods if actual forfeitures or vesting differ from those estimates. The Company has elected toestimate forfeitures at the time of grant and update if necessary. Such updates could have a material effect on the Company's operating results.
Restructuring
Post-employment benefits accrued for workforce reductions related to restructuring activities in the United States are accounted for under ASC No. 712,Compensation-Nonretirement Postemployment Benefits . A liability for post-employment benefits is recorded when payment is probable, the amount is reasonablyestimable, and the obligation relates to rights that have vested or accumulated. In accordance with ASC No. 420, Exit or Disposal Cost Obligations , generallycosts associated with restructuring activities initiated outside the United States have been recognized when they are incurred.
The Company continually evaluates the adequacy of the remaining liabilities under its restructuring initiatives. Although the Company believes that these estimatesaccurately reflect the costs of its restructuring plans, actual results may differ, thereby requiring the Company to record additional provisions or reverse a portion ofsuch provisions.
Foreign Currency Translation and Remeasurement
The U.S. dollar is the functional currency for the Company's foreign operations. Using the U.S. dollar as the functional currency, monetary assets and liabilities areremeasured at the year-end exchange rates. Certain non-monetary assets and liabilities are remeasured using historical rates. Consolidated Statements of Incomeare remeasured at the average exchange rates during the year. Foreign exchange gains and losses as recorded in the Consolidated Statements of Income for allperiods presented were not material.
46

MAXIM INTEGRATED PRODUCTS, INC.NOTES TO CONSOLIDATED FINANCIAL STATEMENTS
Earnings Per Share
Basic earnings per share are computed using the weighted average number of common shares outstanding during the period. Diluted earnings per share incorporatethe potentially dilutive incremental shares issuable upon the assumed exercise of stock options, the assumed vesting of outstanding restricted stock units andmarket stock units, and the assumed issuance of common stock under the stock purchase plan. The number of incremental shares from the assumed issuance ofcommon stock under the stock purchase plan is calculated by applying the treasury stock method.
Litigation and Contingencies
From time to time, the Company receives notices that its products or manufacturing processes may be infringing the patent or other intellectual property rights ofothers, notices of stockholder litigation or other lawsuits or claims against the Company. The Company periodically assesses each matter in order to determine if acontingent liability in accordance with ASC No. 450, Contingencies ("ASC 450") should be recorded. In making this determination, management may, dependingon the nature of the matter, consult with internal and external legal counsel and technical experts. The Company expenses legal fees associated with consultationsand defense of lawsuits as incurred. Based on the information obtained, combined with management's judgment regarding all of the facts and circumstances ofeach matter, the Company determines whether a contingent loss is probable and whether the amount of such loss can be estimated. Should a loss be probable andestimable, the Company records a contingent loss in accordance with ASC No. 450. In determining the amount of a contingent loss, the Company takes intoconsideration advice received from experts in the specific matter, current status of legal proceedings, settlement negotiations which may be ongoing, prior casehistory and other factors. Should the judgments and estimates made by management be incorrect, the Company may need to record additional contingent lossesthat could materially adversely impact its results of operations. Alternatively, if the judgments and estimates made by management are incorrect and a particularcontingent loss does not occur, the contingent loss recorded would be reversed thereby favorably impacting the Company's results of operations.
Pursuant to the Company's charter documents and separate written indemnification agreements, the Company has certain indemnification obligations to its currentofficers and directors, as well as certain former officers and directors. The indemnification agreements provide, among other things, that the Company willindemnify each of its directors and officers, under the circumstances and to the extent provided therein, for expenses, damages, judgments, fines, and settlementseach may be required to pay in actions or proceedings to which he or she may be made a party by reason of his or her position or positions as a director, officer orother agent of the Company, and otherwise to the fullest extent permitted under Delaware law and the Company’s bylaws.
Concentration of Credit Risk
Due to the Company's credit evaluation and collection process, bad debt expenses have not been significant. Credit risk with respect to trade receivables is limitedbecause a large number of geographically diverse customers make up the Company's customer base, thus spreading the credit risk. The Company derivedapproximately 46% of its fiscal year 2019 revenue from sales made through distributors which includes distribution sales to Samsung and catalog distributors. TheCompany's primary distributor is Avnet Electronics (“Avnet”). Avnet, like the Company's other distributors, is not an end customer, but rather serves as a channelof sale to many end users of the Company's products. Avnet accounted for 22% , 25% and 22% of revenues in fiscal years 2019 , 2018 and 2017 , respectively, and21% and 22% of accounts receivable as of June 29, 2019 and June 30, 2018 , respectively. Sales to Samsung, the Company's largest single end customer (throughdirect sales and distributors), accounted for 10% of net revenues in fiscal years 2019 , 2018 and 2017 , and 6% and 12% of accounts receivable as of June 29, 2019and June 30, 2018 , respectively. No other customer accounted for 10% or more of the Company's revenues in the fiscal years 2019 , 2018 , and 2017 . Onecustomer, WTMicroelectronics, accounted for 11% and 13% of accounts receivable as of June 29, 2019 and June 30, 2018 , respectively. No other customeraccounted for 10% or more of the Company's accounts receivable as of June 29, 2019 and June 30, 2018 .
The Company maintains cash, cash equivalents, and short-term investments with various high credit quality financial institutions, limits the amount of creditexposure to any one financial institution or instrument, and is exposed to credit risk in the event of default by these institutions to the extent of amounts recorded atthe balance sheet date. To date, the Company has not incurred losses related to these investments.
Recently Issued Accounting Pronouncements
(i) New Accounting Updates Recently Adopted
In May 2014, the Financial Accounting Standards Board ("FASB") issued Accounting Standard Update ("ASU") 2014-09, Revenue from Contracts with Customers(Topic 606) . This standard provides a single set of guidelines for revenue recognition to be used
47

MAXIM INTEGRATED PRODUCTS, INC.NOTES TO CONSOLIDATED FINANCIAL STATEMENTS
across all industries. Under the new standard, revenue is recognized when a customer obtains control of promised goods or services in an amount that reflects theconsideration to which the entity expects to be entitled in exchange for those goods or services. In addition, the new standard requires reporting companies todisclose the nature, amount, timing, and uncertainty of revenue and cash flows arising from contracts with customers.
On July 1, 2018, the Company adopted Topic 606 and related amendments (ASU 2015-14, Deferral of the Effective Date ; ASU 2016-08, Principal versus AgentConsiderations ; ASU 2016-10, Identifying Performance Obligations and Licensing , ASU 2016-12, Narrow-Scope Improvements and Practical Expedients andASU 2016-20, Technical Corrections and Improvements to Topic 606, Revenue from Contracts with Customers ) using the modified retrospective method appliedto all contracts that are not completed at the date of initial application (i.e., July 1, 2018). Results for reporting periods beginning after July 1, 2018 are presentedunder Topic 606, while prior period amounts are not adjusted and continue to be reported in accordance with historic accounting standards under Topic 605.
There was no impact on the opening retained earnings as of July 1, 2018 due to the adoption of Topic 606. However, in conjunction with the adoption of the newstandard, the Company recorded a reclassification of accrued revenue reserves for price adjustments and other revenue reserves from accounts receivable, net toprice adjustment and other revenue reserves within current liabilities.
The cumulative effect of the changes to the Consolidated Balance Sheet from the adoption of Topic 606 was as follows (in thousands):
As of June 30, 2018 Effect of Adoption of
Topic 606 As of July 1, 2018Accounts receivable, net $ 280,072 $ 141,652 $ 421,724Price adjustment and other revenue reserves — 141,652 141,652
Balance Sheet Reclassification
Under Topic 605, the gross amount of accrued revenue reserves for price adjustments and other revenue reserves of $141.7 million was included within accountsreceivable, net as of June 30, 2018. Subsequent to the adoption of Topic 606, such balances are presented on a gross basis as accrued price adjustments and otherrevenue reserves, which is presented in the price adjustment and other revenue reserves balance sheet caption.
The adoption of Topic 606 has no impact on the total cash flows from operating, investing, or financing activities on the Consolidated Statements of Cash Flows.
The following table summarizes the impacts of adopting Topic 606 on the Company’s Consolidated Balance Sheet as of June 29, 2019 (in thousands):
As Reported If Reported Under Topic
605 Effect of Adoption of
Topic 606Accounts receivable, net $ 360,016 $ 259,526 $ 100,490Price adjustment and other revenue reserves 100,490 — 100,490
Practical Expedients and Elections
• The Company does not disclose the value of unsatisfied performance obligations for (i) contracts with an original expected length of one year or less and(ii) contracts for which the Company recognizes revenue at the amount to which it has the right to invoice for services performed.
• The Company has elected to account for shipping and handling costs as fulfillment costs after the customer obtains control of the goods.• The Company has elected to exclude sales, use, value added, and some excise taxes, if applicable, from the measurement of the transaction price.
In January 2016, the FASB issued ASU 2016-01, Financial Instruments - Overall (Subtopic 825-10): Recognition and Measurement of Financial Assets andFinancial Liabilities, with further classifications made recently with the issuance of ASU 2018-03 and ASU 2018-04, which provides guidance for the recognition,measurement, presentation, and disclosure of financial assets and
48

MAXIM INTEGRATED PRODUCTS, INC.NOTES TO CONSOLIDATED FINANCIAL STATEMENTS
liabilities. The application of this ASU was made by the means of a cumulative-effect adjustment to the balance sheet for the equity securities that qualify for thepractical expedient to estimate fair value using the net asset value per share. The amendments related to equity securities without readily determinable fair values(including disclosure requirements) is being applied prospectively to equity investments that exist as of the date of adoption. The Company adopted ASU 2016-01in the first quarter of fiscal year 2019. As a result of this adoption, the Company recognized an increase of $2.5 million , net of tax, in retained earnings at thebeginning of fiscal year 2019.
In March 2017, the FASB issued ASU 2017-07, Compensation - Retirement Benefits (Topic 715): Improving the Presentation of Net Periodic Pension Cost andNet Periodic Postretirement Benefit Cost , which requires employers that offer or maintain defined benefit plans to disaggregate the service component from theother components of net benefit cost and provides guidance on presentation of the service component and the other components of net benefit cost in the statementof operations. The application of ASU 2017-07 requires retrospective basis for all periods presented. The Company adopted ASU 2017-07 in the first quarter offiscal year 2019. The adoption of this guidance did not have a material impact on the Company's consolidated financial statements.
In May 2017, the FASB issued ASU 2017-09, Compensation - Stock Compensation (Topic 718): Scope of Modification Accounting. The amendments in thisstandard provide guidance about which changes to the terms or conditions of a share-based payment award require an entity to apply modification accounting inTopic 718. Unless the changes in terms or conditions meet all three criteria outlined in the guidance, modification accounting should be applied. The three criteriarelate to changes in the terms and conditions that affect the fair value, vesting conditions, or classification of a share-based payment award. The guidance isrequired to be applied prospectively to an award modified on or after the adoption date. The Company adopted ASU 2017-09 in the first quarter of fiscal year2019. The adoption of this guidance did not have an impact on the Company's consolidated financial statements.
In February 2018, the FASB issued ASU 2018-02, Income Statement - Reporting Comprehensive Income (Topic 220): Reclassification of Certain Tax Effects fromAccumulated Other Comprehensive Income . This standard provides guidance about the reclassification from accumulated other comprehensive income to retainedearnings for stranded tax effects resulting from the Tax Cuts and Jobs Act. The Company adopted ASU 2018-02 in the first quarter of fiscal year 2019. There wasno material change to the Company's consolidated financial statements as a result of this adoption.
(ii) Recent Accounting Updates Not Yet Effective
In February 2016, the FASB issued ASU 2016-02, Leases (ASC 842) . ASU 2016-02 states that lessees will recognize a lease liability for the commitment to makelease payments and right-of-use asset for the underlying asset, for the duration of the lease. In July of 2018, the FASB issued ASU 2018-10 and ASU 2018-11which provides improvements to ASU 2016-02 and an additional transition method option, respectively. This transition method allows a company to apply the newlease accounting standard on adoption date and recognize a cumulative-effect adjustment to the opening balance of retained earnings. ASU 2016-02 will beeffective for the Company starting in the first quarter of fiscal year 2020.
The Company does not expect to restate prior periods under the new standard following the transition relief provided by ASU 2018-11. The Company will electmultiple practical expedients permitted under the transition guidance, including the practical expedient package and the combining of lease and non-leasecomponents practical expedient. The Company will also create an accounting policy to keep leases with an initial term of 12 months or less off the balance sheet.The Company will recognize those lease payments in the Consolidated Statements of Income on a straight-line basis over the lease term. The Company has completed its preliminary impact evaluation of the new lease accounting standard on its Consolidated Financial Statements and expects torecognize new right-of-use-assets and lease liabilities of approximately $55.0 million to $70.0 million on the Consolidated Balance Sheet. The Company does notexpect the change to have a material impact on the Consolidated Statements of Income and the Consolidated Statements of Cash Flows. Further, upon adoption, theCompany will expand its financial statement disclosures to present additional details of its leasing arrangements.
In August 2018, the FASB issued ASU 2018-13, Fair Value Measurement (Topic 820): Disclosure Framework - Changes to the Disclosure Requirements for FairValue Measurement, which improves disclosures by removing, modifying and adding disclosure requirements related to fair value measurements. The updatehighlights adjustments in disclosures for changes in the fair value of Level 1, Level 2, and Level 3 instruments. This guidance is effective beginning in the firstquarter of fiscal year 2021, with early adoption permitted. The Company does not believe that this update will have a material impact on its consolidated financialstatements.
49

MAXIM INTEGRATED PRODUCTS, INC.NOTES TO CONSOLIDATED FINANCIAL STATEMENTS
NOTE 3: BALANCE SHEET COMPONENTS
Inventories consist of:
June 29,
2019 June 30,
2018 (in thousands)
Raw materials $ 16,121 $ 16,251Work-in-process 160,273 173,859Finished goods 70,118 92,280
Total inventories $ 246,512 $ 282,390
Property, plant and equipment, net, consist of:
June 29,
2019 June 30,
2018 (in thousands)
Land $ 17,720 $ 17,731Buildings and building improvements 265,191 254,733Machinery, equipment and software 1,367,606 1,309,487
Total 1,650,517 1,581,951Less: accumulated depreciation and amortization (1,072,795) (1,002,587)
Total property, plant and equipment, net $ 577,722 $ 579,364
The Company recorded $86.4 million , $94.4 million and $108.5 million of depreciation expense in fiscal years 2019 , 2018 and 2017 , respectively. There was noaccelerated depreciation expense included in depreciation expense in fiscal years 2019 and 2018 , and $4.2 million of accelerated depreciation expense in fiscalyear 2017 , resulting from the change in estimated useful lives of certain long-lived assets included in restructuring plans.
Accrued salary and related expenses consist of:
June 29,
2019 June 30,
2018(in thousands)
Accrued bonus $ 71,466 $ 92,288Accrued vacation 30,251 30,695Accrued salaries 8,329 8,210Accrued fringe benefits 4,807 4,752Other 3,851 15,737
Total accrued salary and related expenses $ 118,704 $ 151,682
NOTE 4: FAIR VALUE MEASUREMENTS
The FASB established a fair value hierarchy that prioritizes the inputs to valuation techniques used to measure fair value. This hierarchy requires an entity tomaximize the use of observable inputs and minimize the use of unobservable inputs when measuring fair value. Three levels of inputs that may be used to measurefair value are as follows:
Level 1 - Quoted (unadjusted) prices in active markets for identical assets or liabilities.
The Company's Level 1 assets consist of money market funds.
Level 2 - Observable inputs other than quoted prices included in Level 1, such as quoted prices for similar assets or liabilities in active markets, quoted prices foridentical or similar assets or liabilities in markets that are not active, or other inputs that are observable or can be corroborated by observable market data forsubstantially the full term of the asset or liability.
50
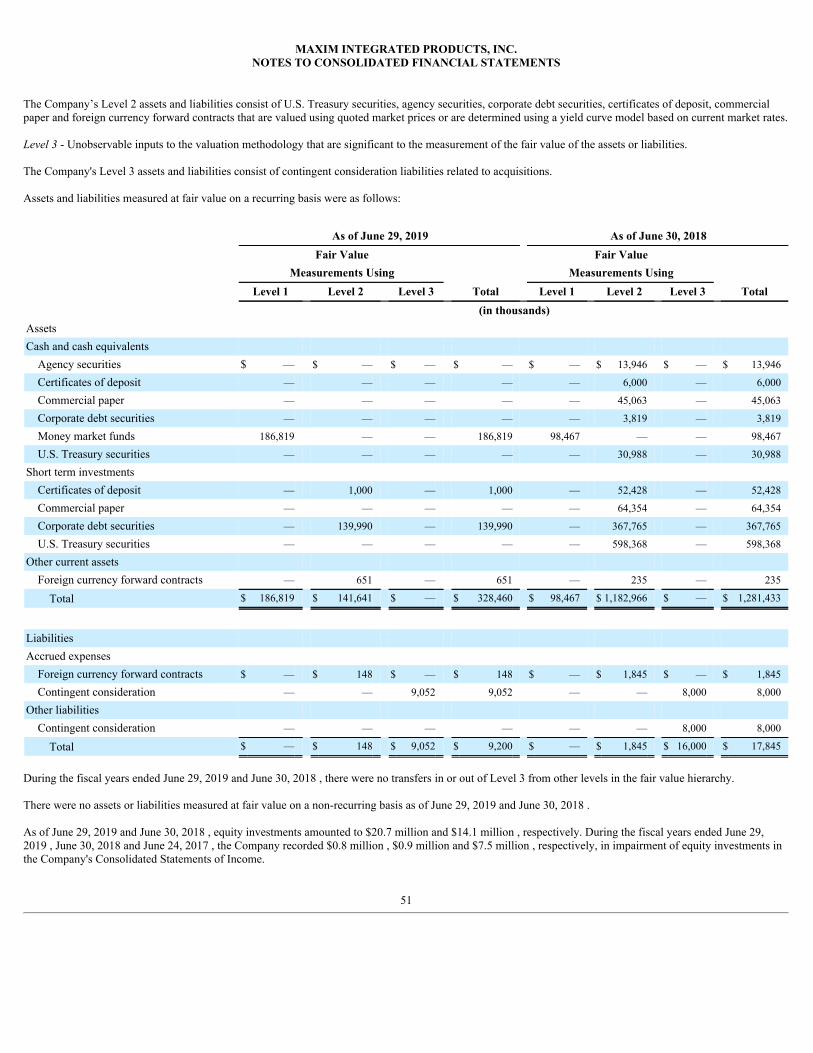
MAXIM INTEGRATED PRODUCTS, INC.NOTES TO CONSOLIDATED FINANCIAL STATEMENTS
The Company’s Level 2 assets and liabilities consist of U.S. Treasury securities, agency securities, corporate debt securities, certificates of deposit, commercialpaper and foreign currency forward contracts that are valued using quoted market prices or are determined using a yield curve model based on current market rates.
Level 3 - Unobservable inputs to the valuation methodology that are significant to the measurement of the fair value of the assets or liabilities.
The Company's Level 3 assets and liabilities consist of contingent consideration liabilities related to acquisitions.
Assets and liabilities measured at fair value on a recurring basis were as follows:
As of June 29, 2019 As of June 30, 2018 Fair Value Fair Value Measurements Using
Total Measurements Using
Total Level 1 Level 2 Level 3 Level 1 Level 2 Level 3 (in thousands)Assets Cash and cash equivalents Agency securities $ — $ — $ — $ — $ — $ 13,946 $ — $ 13,946
Certificates of deposit — — — — — 6,000 — 6,000
Commercial paper — — — — — 45,063 — 45,063
Corporate debt securities — — — — — 3,819 — 3,819
Money market funds 186,819 — — 186,819 98,467 — — 98,467
U.S. Treasury securities — — — — — 30,988 — 30,988
Short term investments Certificates of deposit — 1,000 — 1,000 — 52,428 — 52,428
Commercial paper — — — — — 64,354 — 64,354
Corporate debt securities — 139,990 — 139,990 — 367,765 — 367,765
U.S. Treasury securities — — — — — 598,368 — 598,368
Other current assets Foreign currency forward contracts — 651 — 651 — 235 — 235
Total $ 186,819 $ 141,641 $ — $ 328,460 $ 98,467 $ 1,182,966 $ — $ 1,281,433
Liabilities Accrued expenses Foreign currency forward contracts $ — $ 148 $ — $ 148 $ — $ 1,845 $ — $ 1,845
Contingent consideration — — 9,052 9,052 — — 8,000 8,000
Other liabilities Contingent consideration — — — — — — 8,000 8,000
Total $ — $ 148 $ 9,052 $ 9,200 $ — $ 1,845 $ 16,000 $ 17,845
During the fiscal years ended June 29, 2019 and June 30, 2018 , there were no transfers in or out of Level 3 from other levels in the fair value hierarchy.
There were no assets or liabilities measured at fair value on a non-recurring basis as of June 29, 2019 and June 30, 2018 .
As of June 29, 2019 and June 30, 2018 , equity investments amounted to $20.7 million and $14.1 million , respectively. During the fiscal years ended June 29,2019 , June 30, 2018 and June 24, 2017 , the Company recorded $0.8 million , $0.9 million and $7.5 million , respectively, in impairment of equity investments inthe Company's Consolidated Statements of Income.
51

MAXIM INTEGRATED PRODUCTS, INC.NOTES TO CONSOLIDATED FINANCIAL STATEMENTS
NOTE 5: FINANCIAL INSTRUMENTS
Short-term investments
Fair values were as follows:
June 29, 2019 June 30, 2018
Amortized Cost Gross Unrealized
Gain
GrossUnrealized
Loss Estimated Fair
Value Amortized Cost Gross Unrealized
Gain
GrossUnrealized
Loss Estimated Fair
Value
(in thousands)Available-for-sale investments Certificates of deposit $ 1,000 $ — $ — $ 1,000 $ 52,429 $ — $ (1) $ 52,428Commercial paper — — — — 64,354 — — 64,354Corporate debt securities 140,031 68 (109) 139,990 369,734 39 (2,008) 367,765U.S. Treasury securities — — — — 600,068 10 (1,710) 598,368Total available-for-saleinvestments $ 141,031 $ 68 $ (109) $ 140,990 $ 1,086,585 $ 49 $ (3,719) $ 1,082,915
In the fiscal years ended June 29, 2019 and June 30, 2018 , the Company did not recognize any impairment charges on short-term investments. All available-for-sale investments have maturity dates between April 1, 2019 and March 12, 2021.
Derivative instruments and hedging activities
The Company incurs expenditures denominated in non-U.S. currencies, primarily the Philippine Peso and the Thai Baht associated with the Company'smanufacturing activities in the Philippines and Thailand, respectively, and European Euro, Indian Rupee, Taiwan New Dollar, South Korean Won, Chinese Yuan,Japanese Yen, Singapore Dollar, and Canadian Dollar expenditures for sales offices and research and development activities undertaken outside of the U.S.
The Company has established a program that exclusively utilizes foreign currency forward contracts to offset the risks associated with the effects of certain foreigncurrency exposures. The Company does not use these foreign currency forward contracts for trading purposes.
Derivatives designated as cash flow hedging instruments
The Company designates certain forward contracts as hedging instruments pursuant to ASC No. 815, Derivatives and Hedging (“ASC 815”). As of June 29, 2019and June 30, 2018 , respectively, the notional amounts of the forward contracts the Company held to purchase international currencies were $48.5 million and$49.7 million , respectively, and the notional amounts of forward contracts the Company held to sell international currencies were $0 million and $1.2 million ,respectively.
Derivatives not designated as hedging instruments
As of June 29, 2019 and June 30, 2018 , respectively, the notional amounts of the forward contracts the Company held to purchase international currencies were$19.6 million and $21.1 million , respectively, and the notional amounts of forward contracts the Company held to sell international currencies were $21.1 millionand $21.3 million , respectively. The fair values of outstanding foreign currency forward contracts and gain (loss) included in the Consolidated Statements ofIncome were not material for the fiscal years ended June 29, 2019 and June 30, 2018 .
52
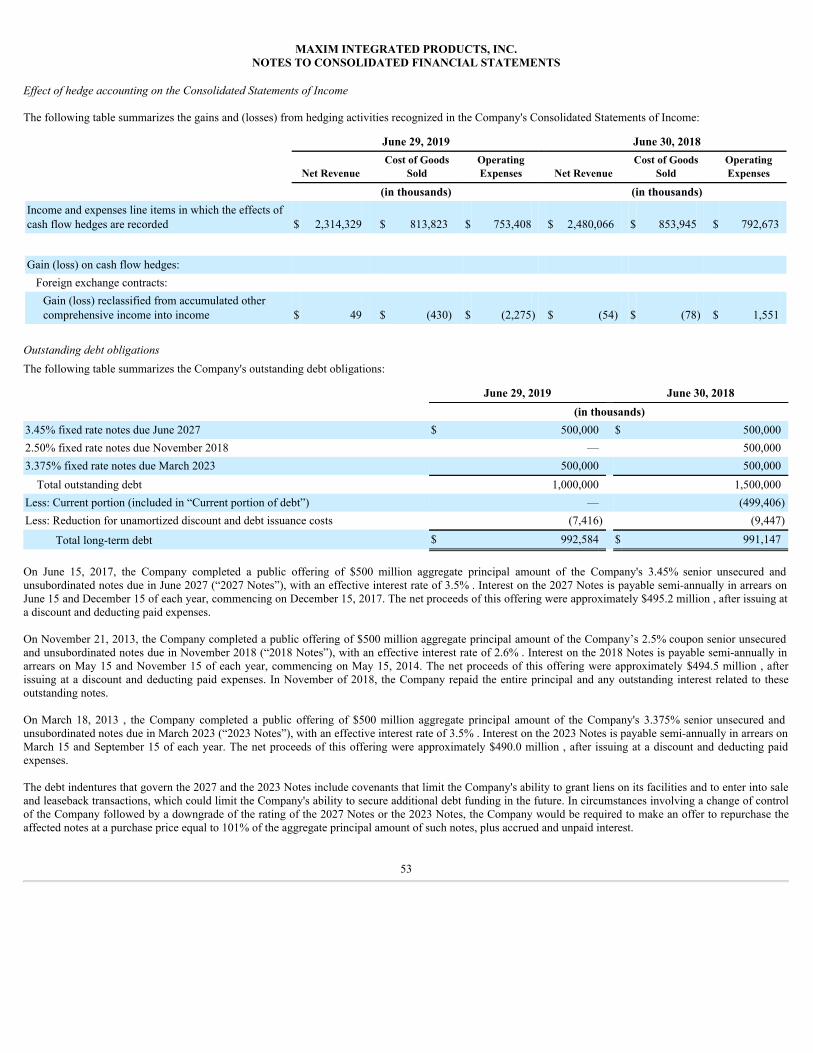
MAXIM INTEGRATED PRODUCTS, INC.NOTES TO CONSOLIDATED FINANCIAL STATEMENTS
Effect of hedge accounting on the Consolidated Statements of Income
The following table summarizes the gains and (losses) from hedging activities recognized in the Company's Consolidated Statements of Income:
June 29, 2019 June 30, 2018
Net Revenue Cost of Goods
Sold OperatingExpenses Net Revenue
Cost of GoodsSold
OperatingExpenses
(in thousands) (in thousands)Income and expenses line items in which the effects ofcash flow hedges are recorded $ 2,314,329 $ 813,823 $ 753,408 $ 2,480,066 $ 853,945 $ 792,673
Gain (loss) on cash flow hedges: Foreign exchange contracts:
Gain (loss) reclassified from accumulated othercomprehensive income into income $ 49 $ (430) $ (2,275) $ (54) $ (78) $ 1,551
Outstanding debt obligationsThe following table summarizes the Company's outstanding debt obligations:
June 29, 2019 June 30, 2018 (in thousands)3.45% fixed rate notes due June 2027 $ 500,000 $ 500,0002.50% fixed rate notes due November 2018 — 500,0003.375% fixed rate notes due March 2023 500,000 500,000 Total outstanding debt 1,000,000 1,500,000Less: Current portion (included in “Current portion of debt”) — (499,406)Less: Reduction for unamortized discount and debt issuance costs (7,416) (9,447)
Total long-term debt $ 992,584 $ 991,147
On June 15, 2017, the Company completed a public offering of $500 million aggregate principal amount of the Company's 3.45% senior unsecured andunsubordinated notes due in June 2027 (“2027 Notes”), with an effective interest rate of 3.5% . Interest on the 2027 Notes is payable semi-annually in arrears onJune 15 and December 15 of each year, commencing on December 15, 2017. The net proceeds of this offering were approximately $495.2 million , after issuing ata discount and deducting paid expenses.
On November 21, 2013, the Company completed a public offering of $500 million aggregate principal amount of the Company’s 2.5% coupon senior unsecuredand unsubordinated notes due in November 2018 (“2018 Notes”), with an effective interest rate of 2.6% . Interest on the 2018 Notes is payable semi-annually inarrears on May 15 and November 15 of each year, commencing on May 15, 2014. The net proceeds of this offering were approximately $494.5 million , afterissuing at a discount and deducting paid expenses. In November of 2018, the Company repaid the entire principal and any outstanding interest related to theseoutstanding notes.
On March 18, 2013 , the Company completed a public offering of $500 million aggregate principal amount of the Company's 3.375% senior unsecured andunsubordinated notes due in March 2023 (“2023 Notes”), with an effective interest rate of 3.5% . Interest on the 2023 Notes is payable semi-annually in arrears onMarch 15 and September 15 of each year. The net proceeds of this offering were approximately $490.0 million , after issuing at a discount and deducting paidexpenses.
The debt indentures that govern the 2027 and the 2023 Notes include covenants that limit the Company's ability to grant liens on its facilities and to enter into saleand leaseback transactions, which could limit the Company's ability to secure additional debt funding in the future. In circumstances involving a change of controlof the Company followed by a downgrade of the rating of the 2027 Notes or the 2023 Notes, the Company would be required to make an offer to repurchase theaffected notes at a purchase price equal to 101% of the aggregate principal amount of such notes, plus accrued and unpaid interest.
53

MAXIM INTEGRATED PRODUCTS, INC.NOTES TO CONSOLIDATED FINANCIAL STATEMENTS
The Company accounts for all the notes above based on their amortized cost. The discount and expenses are being amortized to Interest and other income(expense), net in the Consolidated Statements of Income over the life of the notes. The interest expense is recorded in Interest and other income (expense), net inthe Consolidated Statements of Income. Amortized discount and expenses, as well as interest expense associated with the notes was $41.4 million , $49.5 millionand $31.7 million during the years ended June 29, 2019 , June 30, 2018 , and June 24, 2017 , respectively.
The estimated fair value of the Company's outstanding debt obligations was approximately $1.0 billion as of June 29, 2019 . The estimated fair value of the debt isbased primarily on observable market inputs and is a Level 2 measurement.
The Company recorded interest expense of $43.5 million , $50.2 million , and $34.3 million during the fiscal years ended June 29, 2019 , June 30, 2018 , andJune 24, 2017 , respectively.
Credit facilities In January 2019, the Company terminated its $350 million revolving credit facility with certain institutional lenders. As of June 30, 2018, the Company had notborrowed any amounts from this credit facility and was in compliance with all debt covenants.
Other financial instruments
For the balance of the Company's financial instruments, cash equivalents, accounts receivable, accounts payable and other accrued liabilities, the carrying amountsapproximate fair value due to their short maturities.
NOTE 6: STOCK-BASED COMPENSATION
At June 29, 2019 , the Company had one stock incentive plan, the Company's 1996 Stock Incentive Plan (the “1996 Plan”) and one employee stock purchase plan,the 2008 Employee Stock Purchase Plan (the “2008 ESPP”). The 1996 Plan was adopted by the Board of Directors to provide the grant of incentive stock options,non-statutory stock options, restricted stock units (“RSUs”), and market stock units (“MSUs”) to employees, directors, and consultants.
Pursuant to the 1996 Plan, the exercise price for incentive stock options and non-statutory stock options is determined to be the fair market value of the underlyingshares on the date of grant. Options typically vest ratably over a four-year period measured from the date of grant. Options generally expire no later than sevenyears after the date of grant, subject to earlier termination upon an optionee's cessation of employment or service.
RSUs granted to employees typically vest ratably over a four-year period and are converted into shares of the Company's common stock upon vesting, subject tothe employee's continued service to the Company over that period. RSUs granted after August 2017 will continue to vest post-employment at the Company forcertain individuals satisfying specific eligibility requirements.
MSUs granted to employees typically vest over a four-year period and are converted into shares of the Company's common stock upon vesting, subject to theemployee's continued service to the Company over that period. The number of shares that are released at the end of the performance period can range from zero toa maximum cap depending on the Company's performance. For MSUs granted prior to September 2017, the performance metrics of this program are based onrelative performance of the Company’s stock price as compared to the Semiconductor Exchange Traded Fund index SPDR S&P (the “XSD”). For MSUs grantedafter August 2017, the performance metrics for this program are based on the total shareholder return ("TSR") of the Company relative to the TSR of the othercompanies included in the XSD. These MSUs vest based upon annual performance subject to continued service through the end of the four-year cliff period. MSUsgranted after August 2017 will continue to vest post-employment at the Company for certain individuals satisfying specific eligibility requirements.
54

MAXIM INTEGRATED PRODUCTS, INC.NOTES TO CONSOLIDATED FINANCIAL STATEMENTS
The following tables show total stock-based compensation expense by type of award, and the resulting tax effect, included in the Consolidated Statements ofIncome for fiscal years 2019 , 2018 and 2017 :
For the year ended June 29, 2019
Stock Options
Restricted StockUnits and Other
Awards
Employee StockPurchase Plan
Total
(in thousands)Cost of goods sold $ 35 $ 7,728 $ 2,324 $ 10,087Research and development 9 36,182 5,433 41,624Selling, general and administrative 232 32,078 2,956 35,266
Pre-tax stock-based compensation expense $ 276 $ 75,988 $ 10,713 $ 86,977
Less: income tax effect 8,443
Net stock-based compensation expense $ 78,534
For the year ended June 30, 2018
Stock Options
Restricted StockUnits and Other
Awards
Employee Stock PurchasePlan
Total
(in thousands)Cost of goods sold $ 212 $ 8,131 $ 2,098 $ 10,441Research and development 518 32,088 4,442 37,048Selling, general and administrative 700 28,162 2,334 31,196
Pre-tax stock-based compensation expense $ 1,430 $ 68,381 $ 8,874 $ 78,685
Less: income tax effect 9,342
Net stock-based compensation expense $ 69,343
For the year ended June 24, 2017
Stock Options
Restricted StockUnits and Other
Awards
Employee Stock PurchasePlan
Total
(in thousands)Cost of goods sold $ 536 $ 6,630 $ 1,928 $ 9,094Research and development 1,654 29,504 4,514 35,672Selling, general and administrative 1,424 22,713 2,214 26,351
Pre-tax stock-based compensation expense $ 3,614 $ 58,847 $ 8,656 $ 71,117
Less: income tax effect 12,934
Net stock-based compensation expense $ 58,183
The expenses included in the Consolidated Statements of Income related to Restricted Stock Units and Other Awards include expenses related to MSUs of $11.1million , $7.8 million and $3.6 million for fiscal years 2019 , 2018 and 2017 , respectively.
Stock Options
The fair value of options granted to employees under the 1996 Plan is estimated on the date of grant using the Black-Scholes option valuation model.
The Company did not grant any stock options in fiscal years 2019 , 2018 or 2017 .
55

MAXIM INTEGRATED PRODUCTS, INC.NOTES TO CONSOLIDATED FINANCIAL STATEMENTS
The following table summarizes outstanding, exercisable and vested and expected to vest stock options as of June 29, 2019 and their activity during fiscal years2019 , 2018 and 2017 :
Options Weighted AverageRemaining Contractual
Term (in years)
AggregateIntrinsic Value (1)
Number of Shares Weighted Average
Exercise Price Balance, June 25, 2016 5,935,079 $25.11
Options Granted — — Options Exercised (2,741,659) 22.98 Options Cancelled (393,413) 27.07
Balance, June 24, 2017 2,800,007 26.92 Options Granted — — Options Exercised (1,090,163) 25.69 Options Cancelled (21,591) 26.47
Balance, June 30, 2018 1,688,253 27.72 Options Granted — — Options Exercised (907,401) 27.22 Options Cancelled (3,439) 28.08
Balance, June 29, 2019 777,413 $28.30 1.2 $ 24,501,637
Exercisable as of June 29, 2019 777,413 $28.30 1.2 $ 24,501,637
Vested and expected to vest, June 29, 2019 777,413 $28.30 1.2 $ 24,501,637
(1) Aggregate intrinsic value represents the difference between the exercise price and the closing price per share of the Company's common stock on June 28, 2019, the lastbusiness day preceding the fiscal year end, multiplied by the number of options outstanding, exercisable or vested and expected to vest as of June 29, 2019 .
The total intrinsic value of options exercised during fiscal years 2019 , 2018 and 2017 were $27.5 million , $30.7 million and $55.1 million , respectively.
Restricted Stock Units and Other Awards
The fair value of RSUs and other awards under the Company’s 1996 Plan is estimated using the value of the Company’s common stock on the date of grant,reduced by the present value of dividends expected to be paid on the Company’s common stock prior to vesting. The Company also estimates forfeitures at thetime of grant and makes revisions to forfeitures on a quarterly basis.
The weighted average fair value of RSUs and other awards granted was $53.97 , $44.95 and $37.33 per share for fiscal years 2019 , 2018 and 2017 , respectively.
56

MAXIM INTEGRATED PRODUCTS, INC.NOTES TO CONSOLIDATED FINANCIAL STATEMENTS
The following table summarizes outstanding and expected to vest RSUs and other awards as of June 29, 2019 and their activity during fiscal years 2019 , 2018 and2017 :
Number ofShares
Weighted AverageRemaining Contractual
Term (in years)
AggregateIntrinsicValue (1)
Balance, June 25, 2016 6,620,813 Restricted stock units and other awards granted 2,237,679 Restricted stock units and other awards released (1,876,050) Restricted stock units and other awards cancelled (1,040,319)
Balance, June 24, 2017 5,942,123 Restricted stock units and other awards granted 1,989,959 Restricted stock units and other awards released (1,794,029) Restricted stock units and other awards cancelled (613,621)
Balance, June 30, 2018 5,524,432 Restricted stock units and other awards granted 1,694,294 Restricted stock units and other awards released (1,779,317) Restricted stock units and other awards cancelled (521,103)
Balance, June 29, 2019 4,918,306 2.6 $ 294,213,065
Expected to vest as of June 29, 2019 4,173,396 2.5 $ 249,652,544
(1) Aggregate intrinsic value for RSUs and other awards represents the closing price per share of the Company's common stock on June 28, 2019, the last business daypreceding the fiscal year end, multiplied by the number of RSUs and other awards outstanding, or expected to vest as of June 29, 2019 .
The Company withheld shares totaling $29.7 million in value as a result of employee withholding taxes based on the value of the RSUs on their vesting date for thefiscal year ended June 29, 2019 . The total payments for the employees' tax obligations to the taxing authorities are reflected as financing activities within theConsolidated Statements of Cash Flows.
As of June 29, 2019 , there was $147.9 million of unrecognized compensation cost related to 4.9 million unvested RSUs and other awards, which is expected to berecognized over a weighted average period of approximately 2.6 years.
Market Stock Units
The Company uses the Monte Carlo simulation model to measure the fair value of its market stock units on the date of grant. The Company also estimatesforfeitures at the time of grant and makes revisions to forfeitures on a quarterly basis.
The weighted-average fair value of MSUs granted was $75.48 , $51.03 and $37.29 per share for fiscal years 2019 , 2018 and 2017 , respectively.
57

MAXIM INTEGRATED PRODUCTS, INC.NOTES TO CONSOLIDATED FINANCIAL STATEMENTS
The following table summarizes the number of MSUs outstanding and expected to vest as of June 29, 2019 and their activity during fiscal years 2019 , 2018 and2017 :
Number ofShares
Weighted AverageRemaining Contractual
Term (in years)
AggregateIntrinsicValue (1)
Balance, June 25, 2016 673,532 Market stock units granted 308,432 Market stock units released — Market stock units cancelled (163,936)
Balance, June 24, 2017 818,028 Market stock units granted 292,336 Market stock units released — Market stock units cancelled (31,300)
Balance, June 30, 2018 1,079,064 Market stock units granted 247,804 Market stock units released (13,594) Market stock units cancelled (264,742)
Balance, June 29, 2019 1,048,532 2.6 $ 62,723,184
Expected to vest as of June 29, 2019 890,205 2.5 $ 53,252,070
(1) Aggregate intrinsic value for MSUs represents the closing price per share of the Company’s common stock on June 28, 2019, the last business day preceding the fiscalquarter-end, multiplied by the number of MSUs outstanding or expected to vest as of June 29, 2019 .
As of June 29, 2019 , there was $28.2 million of unrecognized compensation cost related to 1.0 million unvested MSUs, which is expected to be recognized over aweighted average period of approximately 2.6 years.
At June 29, 2019 , the Company had 19.8 million shares of its common stock available for issuance to employees and other recipients under the 1996 Plan.
Employee Stock Purchase Plan
Employees are granted rights to acquire common stock under the 2008 ESPP.
The Company issued 0.9 million shares of its common stock for total consideration of $40.2 million related to the 2008 ESPP during the fiscal year ended June 29,2019 . As of June 29, 2019 , the Company had 6.3 million shares of its common stock reserved and available for future issuance under the 2008 ESPP.
The fair value of shares granted to employees under the 2008 ESPP in fiscal years 2019 , 2018 and 2017 has been estimated at the date of grant using the Black-Scholes option valuation model using the following assumptions for the offering periods outstanding:
For the Year Ended
June 29,
2019 June 30,
2018 June 24,
2017Expected holding period (in years) 0.5 0.5 0.5Risk-free interest rate 1.6% - 2.6% 0.8% - 2.1% 0.5% - 1.1%Expected stock price volatility 19.6% - 32.7% 19.1% - 32.7% 19.1% - 30.4%Dividend yield 2.8% - 3.4% 2.8% - 3.4% 3.0% - 3.6%
As of June 29, 2019 , there was $6.9 million of unrecognized compensation expense related to the 2008 ESPP.
58

MAXIM INTEGRATED PRODUCTS, INC.NOTES TO CONSOLIDATED FINANCIAL STATEMENTS
NOTE 7: EARNINGS PER SHARE
Basic earnings per share are computed using the weighted average number of shares of common stock outstanding during the period. For purposes of computingbasic earnings per share, the weighted average number of outstanding shares of common stock excludes unvested RSUs and other awards as well as MSUs. Dilutedearnings per share incorporates the incremental shares issuable upon the assumed exercise of stock options, assumed release of unvested RSUs and other awards aswell as MSUs, and assumed issuance of common stock under the 2008 ESPP using the treasury stock method.
The following table sets forth the computation of basic and diluted earnings per share:
For the Year Ended
June 29,
2019 June 30,
2018 June 24,
2017 (in thousands, except per share data)
Numerator for basic earnings per share and diluted earnings per share Net income $ 827,486 $ 467,318 $ 571,613
Denominator for basic earnings per share 274,966 280,979 283,147 Effect of dilutive securities: Stock options, ESPP, RSUs and MSUs 3,811 4,695 4,827
Denominator for diluted earnings per share 278,777 285,674 287,974
Earnings per share: Basic $ 3.01 $ 1.66 $ 2.02
Diluted $ 2.97 $ 1.64 $ 1.98
For the fiscal years ended June 29, 2019 , June 30, 2018 and June 24, 2017 no stock options were excluded from the calculation of diluted earnings per share.
NOTE 8: GOODWILL AND INTANGIBLE ASSETS
Goodwill
The Company monitors the recoverability of goodwill recorded in connection with acquisitions, by reporting unit, annually, or more often if events or changes incircumstances indicate that the carrying amount may not be recoverable.
In fiscal years 2019 and 2018, the Company elected to perform a qualitative analysis to assess impairment of goodwill rather than to perform the quantitativegoodwill impairment test. The key qualitative factors considered in the assessment included the change in the industry and competitive environment, marketcapitalization, and overall financial performance. Based on the results of this qualitative analysis, the Company determined that it was more likely than not that thefair value of each reporting unit exceeded its carrying value. The Company concluded that goodwill was not impaired in fiscal years 2019 and 2018.
Activity and goodwill balances for the fiscal years ended June 29, 2019 and June 30, 2018 were as follows:
Goodwill (in thousands)Balance, June 24, 2017 $ 491,015
Acquisitions 41,889Adjustments (653)
Balance, June 30, 2018 532,251Acquisitions —Adjustments —
Balance, June 29, 2019 $ 532,251
59

MAXIM INTEGRATED PRODUCTS, INC.NOTES TO CONSOLIDATED FINANCIAL STATEMENTS
During the fiscal years ended June 29, 2019 and June 30, 2018 , the Company recorded $0 and $41.9 million , respectively, of goodwill in connection withacquisitions. Please refer to Note 9: "Acquisitions".
Intangible Assets
The useful lives of amortizing intangible assets are as follows:
Asset LifeIntellectual property 1-10 yearsCustomer relationships 3-10 yearsTrade name 1-4 yearsPatents 5 years
Intangible assets consisted of the following:
June 29, 2019 June 30, 2018
Original
Cost AccumulatedAmortization Net
OriginalCost
AccumulatedAmortization Net
(in thousands)Intellectual property $ 487,346 $ 445,558 $ 41,788 $ 485,465 $ 423,869 $ 61,596Customer relationships 116,505 105,901 10,604 116,294 103,217 13,077Trade name 9,974 8,914 1,060 9,340 8,588 752Patent 2,500 2,500 — 2,500 2,469 31
Total amortizable intangible assets 616,325 562,873 53,452 613,599 538,143 75,456In-process Research and Development(IPR&D) 2,790 — 2,790 2,790 — 2,790
Total intangible assets $ 619,115 $ 562,873 $ 56,242 $ 616,389 $ 538,143 $ 78,246
During the fiscal year ended June 30, 2018 , $5.8 million of IPR&D, that was acquired during the fiscal year, was completed and reclassified to amortizableIntellectual Property.
The following table presents the amortization expense of intangible assets and its presentation in the Consolidated Statements of Income:
For the Year Ended
June 29,
2019 June 30,
2018 June 24,
2017 (in thousands)Cost of goods sold $ 21,689 $ 46,063 $ 46,484Intangible asset amortization 3,041 4,467 9,189
Total intangible asset amortization expenses $ 24,730 $ 50,530 $ 55,673
60

MAXIM INTEGRATED PRODUCTS, INC.NOTES TO CONSOLIDATED FINANCIAL STATEMENTS
The following table represents the estimated future amortization expense of intangible assets as of June 29, 2019 :
AmountFiscal Year (in thousands) 2020 $ 15,0682021 13,3682022 7,6892023 7,2052024 4,229Thereafter 5,893
Total amortizable intangible assets $ 53,452
NOTE 9: ACQUISITIONS
On January 26, 2018, the Company acquired a privately-held corporation specializing in the development of high performance USB and video extensiontechnology. Total cash consideration paid in connection with this acquisition was $57.8 million , net of cash acquired. The Company also agreed to pay up to anadditional $16.0 million if the acquired business achieves certain financial milestones for the annual periods ending August 31, 2018 and August 31, 2019. Out ofthe $16.0 million contingent consideration, $8 million was paid during the year ended June 29, 2019. The acquired assets included $26.0 million of developedtechnology and $10.5 million of other intangible assets. The Company also recorded $41.9 million of goodwill in connection with this acquisition. The goodwill isnot deductible for tax purposes.
There were no material acquisitions completed during fiscal years 2019 and 2017.
NOTE 10: SEGMENT INFORMATION
The Company designs, develops, manufactures and markets a broad range of linear and mixed-signal integrated circuits. All of the Company's products aredesigned through a centralized R&D function, are manufactured using centralized manufacturing (internal and external) and sold through a centralized sales forceand shared wholesale distributors.
The Company currently has one operating segment. In accordance with ASC No. 280, Segment Reporting (“ASC 280”), the Company considers operatingsegments to be components of the Company’s business for which separate financial information is available that is evaluated regularly by the Company’s ChiefOperating Decision Maker in deciding how to allocate resources and in assessing performance. The Chief Operating Decision Maker for the Company wasassessed and determined to be the CEO. The CEO reviews financial information presented on a consolidated basis for purposes of allocating resources andevaluating financial performance. Accordingly, the Company has determined that it has a single operating and reportable segment.
Enterprise-wide information is provided in accordance with ASC 280. Geographical revenue information is based on customers’ ship-to location. Long-lived assetsconsist of property, plant and equipment. Property, plant and equipment information is based on the physical location of the assets at the end of each fiscal year.
Net revenues from unaffiliated customers by geographic region were as follows:
For the Year Ended
June 29,
2019 June 30,
2018 June 24,
2017 (in thousands)
United States $ 257,350 $ 306,453 $ 286,732China 812,686 885,319 843,371Rest of Asia 756,928 786,814 718,540Europe 428,750 440,658 390,488Rest of World 58,615 60,822 56,484
Total $ 2,314,329 $ 2,480,066 $ 2,295,615
61

MAXIM INTEGRATED PRODUCTS, INC.NOTES TO CONSOLIDATED FINANCIAL STATEMENTS
Net property, plant, and equipment by geographic region were as follows:
Fiscal Year Ended
June 29,
2019 June 30,
2018 (in thousands)
United States $ 379,308 $ 361,432Philippines 102,634 120,657Rest of World 95,780 97,275
Total $ 577,722 $ 579,364
NOTE 11: COMMITMENTS AND CONTINGENCIES
Legal Proceedings
The Company is party or subject to various other legal proceedings and claims, either asserted or unasserted, which arise in the ordinary course of business,including proceedings and claims that relate to intellectual property matters. While the outcome of these matters cannot be predicted with certainty, the Companydoes not believe that the outcome of any of these matters, individually or in the aggregate, will result in losses that are materially in excess of amounts alreadyrecognized or reserved, if any.
Commitments
The Company leases certain of its facilities under various operating leases that expire at various dates through June 2030 . The lease agreements generally includerenewal provisions and require the Company to pay property taxes, insurance, and maintenance costs.
Future annual minimum payments for all commitments are as follows:
Payment due by period
Total Fiscal year
2020 Fiscal year
2021 Fiscal year
2022 Fiscal year
2023 Fiscal year
2024 Thereafter (in thousands)Operating leaseobligations (1) $ 72,544 $ 11,162 $ 11,073 $ 10,494 $ 9,931 $ 7,671 $ 22,213Inventory related purchaseobligations (2) 416,969 64,067 54,148 46,778 44,821 42,502 164,653
Total $ 489,513 $ 75,229 $ 65,221 $ 57,272 $ 54,752 $ 50,173 $ 186,866
(1) The Company leases some facilities under non-cancelable operating lease agreements that expire at various dates through 2030 .(2) The Company orders some materials and supplies in advance or with minimum purchase quantities. The Company is obligated to pay for the materials and supplies when
received. Additionally, in 2016 the Company entered into a long-term supply agreement with the semiconductor foundry TowerJazz to supply finished wafers on existingMaxim processes and products which contains minimum purchase requirements.
Purchase orders for the purchase of the majority of the Company's raw materials and other goods and services are not included in the table. The Company'spurchase orders generally allow for cancellation without significant penalties. The Company does not have significant agreements for the purchase of raw materialsor other goods specifying minimum quantities or set prices that exceed its expected short-term requirements.
Rental expense amounted to approximately $10.2 million , $10.2 million , and $12.0 million in fiscal years 2019 , 2018 and 2017 , respectively.
62

MAXIM INTEGRATED PRODUCTS, INC.NOTES TO CONSOLIDATED FINANCIAL STATEMENTS
Indemnification
The Company indemnifies certain customers, distributors, suppliers and subcontractors for attorney fees and damages and costs awarded against such parties incertain circumstances in which the Company's products are alleged to infringe third party intellectual property rights, including patents, registered trademarks orcopyrights. The terms of the Company's indemnification obligations are generally perpetual from the effective date of the agreement. In certain cases, there arelimits on and exceptions to the Company's potential liability for indemnification relating to intellectual property infringement claims.
Pursuant to the Company's charter documents and separate written indemnification agreements, the Company has certain indemnification obligations to its currentofficers, employees and directors, as well as certain former officers and directors.
NOTE 12: COMPREHENSIVE INCOME
The changes in accumulated other comprehensive income (loss) by component and related tax effects in the fiscal years ended June 29, 2019 and June 30, 2018were as follows:
Unrealized gain(loss) on
intercompanyreceivables
Unrealized gain (loss)on postretirement
benefits
Cumulativetranslationadjustment
Unrealized gain(loss) on cash flow
hedges
Unrealized gain(loss) on available-for-sale securities
Total
(in thousands)Balance, June 24, 2017 $ (6,280) $ (1,258) $ (1,136) $ 18 $ (1,234) $ (9,890)
Other comprehensiveincome (loss) beforereclassifications — (1,510) — (273) (2,620) (4,403)Amounts reclassified out ofaccumulated othercomprehensive income(loss) — 137 — (1,419) — (1,282)Tax effects — 115 — 291 184 590Other comprehensiveincome (loss) — (1,258) — (1,401) (2,436) (5,095)
Balance, June 30, 2018 $ (6,280) $ (2,516) $ (1,136) $ (1,383) $ (3,670) $ (14,985)Other comprehensiveincome (loss) beforereclassifications — — — (494) 3,804 3,310Amounts reclassified out ofaccumulated othercomprehensive income(loss) — (1,848) — 2,656 — 808Tax effects — 42 — (354) (175) (487)Other comprehensiveincome (loss) — (1,806) — 1,808 3,629 3,631
Balance, June 29, 2019 $ (6,280) $ (4,322) $ (1,136) $ 425 $ (41) $ (11,354)
Amounts reclassified out of Unrealized gain (loss) on postretirement benefits were included in Selling, general and administrative in the Consolidated Statementsof Income. Amounts reclassified out of Unrealized gain (loss) on cash flow hedges were included in Net revenues, Cost of goods sold and Other operatingexpenses (income), net in the Consolidated Statements of Income.
NOTE 13: COMMON STOCK REPURCHASES
On July 20, 2017, the Board of Directors of the Company authorized the repurchase of up to $1.0 billion of the Company's common stock. The stock repurchaseauthorization did not have an expiration date and the pace of repurchase activity depended on factors
63
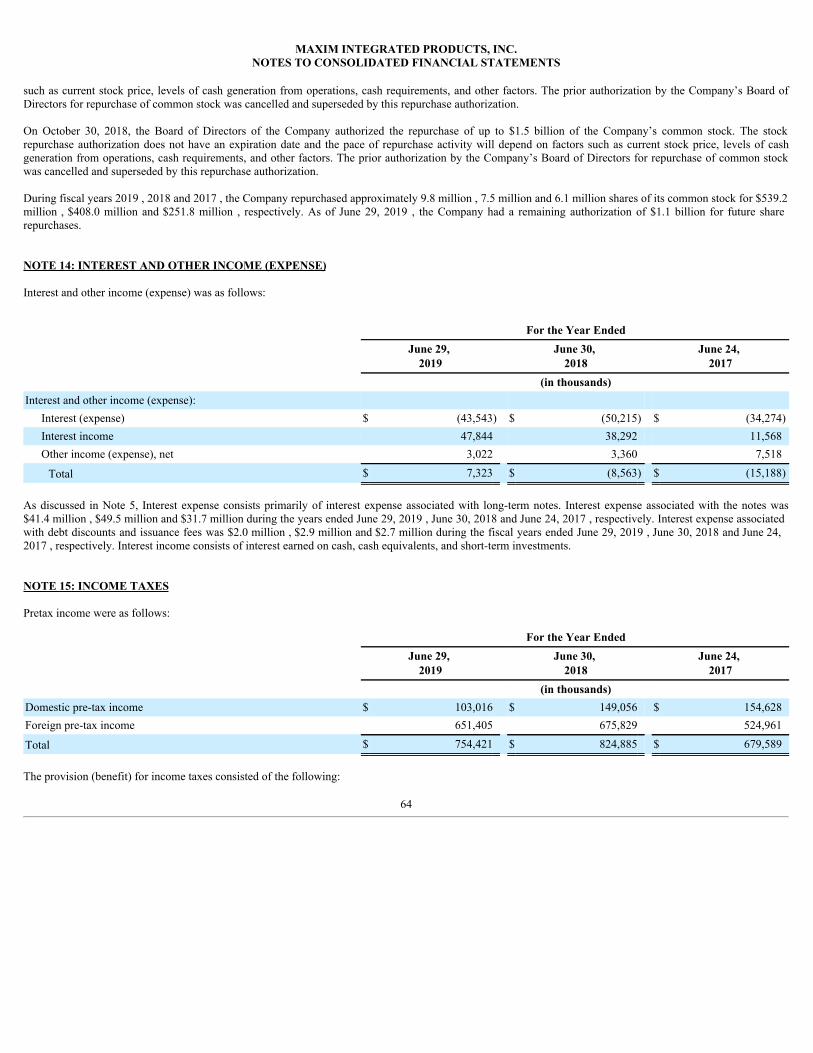
MAXIM INTEGRATED PRODUCTS, INC.NOTES TO CONSOLIDATED FINANCIAL STATEMENTS
such as current stock price, levels of cash generation from operations, cash requirements, and other factors. The prior authorization by the Company’s Board ofDirectors for repurchase of common stock was cancelled and superseded by this repurchase authorization.
On October 30, 2018, the Board of Directors of the Company authorized the repurchase of up to $1.5 billion of the Company’s common stock. The stockrepurchase authorization does not have an expiration date and the pace of repurchase activity will depend on factors such as current stock price, levels of cashgeneration from operations, cash requirements, and other factors. The prior authorization by the Company’s Board of Directors for repurchase of common stockwas cancelled and superseded by this repurchase authorization.
During fiscal years 2019 , 2018 and 2017 , the Company repurchased approximately 9.8 million , 7.5 million and 6.1 million shares of its common stock for $539.2million , $408.0 million and $251.8 million , respectively. As of June 29, 2019 , the Company had a remaining authorization of $1.1 billion for future sharerepurchases.
NOTE 14: INTEREST AND OTHER INCOME (EXPENSE)
Interest and other income (expense) was as follows:
For the Year Ended
June 29,
2019 June 30,
2018 June 24,
2017 (in thousands)Interest and other income (expense):
Interest (expense) $ (43,543) $ (50,215) $ (34,274)Interest income 47,844 38,292 11,568Other income (expense), net 3,022 3,360 7,518
Total $ 7,323 $ (8,563) $ (15,188)
As discussed in Note 5, Interest expense consists primarily of interest expense associated with long-term notes. Interest expense associated with the notes was$41.4 million , $49.5 million and $31.7 million during the years ended June 29, 2019 , June 30, 2018 and June 24, 2017 , respectively. Interest expense associatedwith debt discounts and issuance fees was $2.0 million , $2.9 million and $2.7 million during the fiscal years ended June 29, 2019 , June 30, 2018 and June 24,2017 , respectively. Interest income consists of interest earned on cash, cash equivalents, and short-term investments.
NOTE 15: INCOME TAXES
Pretax income were as follows:
For the Year Ended
June 29,
2019 June 30,
2018 June 24,
2017 (in thousands)Domestic pre-tax income $ 103,016 $ 149,056 $ 154,628Foreign pre-tax income 651,405 675,829 524,961
Total $ 754,421 $ 824,885 $ 679,589
The provision (benefit) for income taxes consisted of the following:
64

MAXIM INTEGRATED PRODUCTS, INC.NOTES TO CONSOLIDATED FINANCIAL STATEMENTS
For the Year Ended
June 29,
2019 June 30,
2018 June 24,
2017 (in thousands)
Federal Current $ (114,494) $ 318,288 $ 107,303
Deferred 12,874 25,769 (8,171)State Current 9,842 117 (361) Deferred 2,196 1,325 (436)Foreign Current 17,562 11,450 8,930 Deferred (1,045) 618 711
Total provision (benefit) for income taxes $ (73,065) $ 357,567 $ 107,976
A reconciliation of the Company's Federal statutory tax rate to the Company's effective tax rate is as follows:
For the Year Ended
June 29,
2019 June 30,
2018 June 24,
2017Federal statutory rate 21.0 % 28.1 % 35.0 %State tax, net of federal benefit 1.4 0.2 (0.2)General business credits (0.9) (0.8) (1.3)Effect of foreign operations (15.8) (16.7) (20.2)Stock-based compensation 0.7 0.4 0.1Interest accrual for uncertain tax positions 1.1 2.1 2.1Transition Tax 9.0 28.7 —Global intangible low taxed income 7.4 — —Deferred tax remeasurement — 1.6 —Settlement of uncertain tax positions (33.4) — —Other (0.2) (0.3) 0.4
Effective tax rate (9.7)% 43.3 % 15.9 %
On December 22, 2017 legislation, commonly referred to as the Tax Cuts and Jobs Act (the “Act”), was enacted. The Act reduced the federal statutory tax ratefrom 35.0% to 21.0% , effective January 1, 2018, which results in federal statutory tax rates for the Company of 21.0% , 28.1% (average of a 35.0% rate for thefirst half of fiscal year 2018 and a 21.0% rate for the second half of fiscal year 2018) and 35.0% for fiscal years 2019, 2018 and 2017, respectively. In fiscal year2018 the Company recorded a $13.7 million charge to remeasure deferred taxes as of the enactment date of the Act to reflect the federal statutory rate reduction.
The Act included a one-time tax on accumulated unremitted earnings of our foreign subsidiaries (“Transition Tax”). SEC Staff Accounting Bulletin No. 118allowed the use of provisional amounts (reasonable estimates) if accounting for the income tax effects of the Act was not completed. Provisional amounts must beadjusted within a one-year measurement period from the enactment date of the Act. In the second quarter of fiscal year 2018, the Company recorded a $236.9million provisional Transition Tax charge. During the measurement period the Company gathered information and analyzed available guidance and in the secondquarter of fiscal year 2019 recorded a $22.1 million Transition Tax charge, which increased the Company’s fiscal year 2019 tax rate by 2.9% . As of the end of thesecond quarter of fiscal year 2019 accounting for the income tax effects of the Act was completed.
The Act included Global Intangible Low-Taxed Income (“GILTI”) provisions, which first impact the Company in fiscal year 2019. The GILTI provisionseffectively subject income earned by the Company’s foreign subsidiaries to current U.S. tax at a rate of 10.5% , less foreign tax credits. The Company has electedto treat tax generated by the GILTI provisions as a period expense.
In fiscal year 2019, the Company reversed $221.5 million of uncertain tax position reserves and $30.1 million of related interest reserves, net of federal and statebenefits, primarily due to the fiscal fourth quarter settlement of an audit of the Company’s fiscal
65

MAXIM INTEGRATED PRODUCTS, INC.NOTES TO CONSOLIDATED FINANCIAL STATEMENTS
year 2009 through fiscal year 2011 federal corporate income tax returns, which also settled intercompany buy-in license payment issues for fiscal years 2012through 2019. $140.7 million of fiscal year 2009 through fiscal year 2018 advance tax payments made in June 2018 were applied to additional federal tax liabilitiesgenerated by the settlement. The reversal of uncertain tax position reserves for intercompany transfer pricing issues increased accumulated unremitted foreignearnings, which resulted in an additional Transition Tax charge of $47.7 million in the fiscal fourth quarter.
On June 18, 2019, the U.S. Treasury and the Internal Revenue Service released temporary regulations under Internal Revenue Code (“IRC”) Section 245A(“Section 245A”), as enacted by the Act, and IRC Section 954(c)(6) (the “Temporary Regulations”), which apply retroactively to intercompany dividendsoccurring after December 31, 2017. The Temporary Regulations limit the applicability of the foreign personal holding company income (“FPHCI”) look-throughexception for certain intercompany dividends received by a controlled foreign corporation. Before application of the retroactive intercompany TemporaryRegulations, the Company benefited in fiscal years 2018 and 2019 from the FPHCI look-through exception. The Company has analyzed the relevant TemporaryRegulations and concluded that they were not validly issued. Therefore, the Company has not accounted for the effects of the retroactive Temporary Regulations inits results of operations for fiscal year 2019. The Company believes it has strong arguments in favor of its position and that it has met the more likely than notrecognition threshold that its position will be sustained. The Company intends to vigorously defend its position, however, due to the uncertainty involved inchallenging the validity of regulations as well as a potential litigation process, there can be no assurances that the relevant Temporary Regulations will beinvalidated, modified or that a court of law will rule in favor of the Company. An unfavorable resolution of this issue could have a material adverse impact on theCompany's results of operations and financial condition.
As of June 29, 2019 , the Company's foreign subsidiaries have accumulated undistributed earnings of approximately $368.0 million that are intended to beindefinitely reinvested outside the U.S. No deferred tax liability has been recognized for the repatriation of these earnings. At June 29, 2019 the unrecognizeddeferred tax liability on these earnings was $26.4 million .
Deferred income taxes reflect the net tax effects of temporary differences between the carrying amounts of assets and liabilities for financial reporting purposes andthe amounts used for income tax purposes. The components of the Company's deferred tax assets and liabilities were as follows:
June 29,
2019 June 30,
2018 (in thousands)
Deferred tax assets: Accrued compensation $ 7,990 $ 8,361 Stock-based compensation 9,788 10,071 Net operating loss carryovers 40,067 40,989 Tax credit carryovers 93,269 90,968 Other reserves and accruals not currently deductible for tax purposes 21,584 29,903 Other 11,500 8,562Total deferred tax assets 184,198 188,854
Deferred tax liabilities: Fixed assets and intangible assets cost recovery, net (52,567) (52,704) Unremitted earnings of foreign subsidiaries (7,428) (1,532) Other (3,712) (2,553)Total deferred tax liabilities (63,707) (56,789)
Net deferred tax assets before valuation allowance 120,491 132,065Valuation allowance (131,798) (128,128)
Net deferred tax assets (liabilities) $ (11,307) $ 3,937
The valuation allowance as of June 29, 2019 and June 30, 2018 primarily relates to certain state and foreign net operating loss carryforwards and certain state taxcredit carryforwards. The valuation allowance increased by $3.7 million in fiscal year 2019 .
As of June 29, 2019 , the Company has $16.7 million of federal net operating loss carryforwards expiring at various dates between fiscal years 2022 and 2033,$37.0 million of state net operating loss carryforwards expiring at various dates through fiscal year
66

MAXIM INTEGRATED PRODUCTS, INC.NOTES TO CONSOLIDATED FINANCIAL STATEMENTS
2033, $132.2 million of foreign net operating loss carryforwards with no expiration date, $111.4 million of state tax credit carryforwards with no expiration date,and $6.6 million of state tax credit carryforwards expiring at various dates through fiscal year 2034.
The Company classifies unrecognized tax benefits as (i) a current liability to the extent that payment is anticipated within one year; (ii) a non-current liability to theextent that payment is not anticipated within one year; or (iii) a reduction to deferred tax assets to the extent that the unrecognized tax benefit relates to deferred taxassets such as operating loss or tax credit carryforwards or to the extent that operating loss or tax credit carryforwards would be able to offset the additional taxliability generated by unrecognized tax benefits.
A reconciliation of the change in gross unrecognized tax benefits, excluding interest, penalties and the federal benefit for state unrecognized tax benefits, is asfollows:
For the Year Ended
June 29,
2019 June 30,
2018 June 24,
2017 (in thousands)
Balance as of beginning of year $ 591,458 $ 539,569 $ 482,745Tax positions related to current year: Addition 6,974 48,646 57,791Tax positions related to prior year:
Addition 20,851 3,806 1,059Reduction (236,705) — (1,410)
Settlements (161,847) — —Lapses in statutes of limitations (334) (563) (616)
Balance as of end of year $ 220,397 $ 591,458 $ 539,569
Prior year tax position activity in fiscal year 2019 includes the reversal of $221.5 million of tax reserves, primarily due to the settlement of an audit of theCompany’s fiscal year 2009 through fiscal year 2011 federal corporate income tax returns, which also settled intercompany buy-in license payment issues for fiscalyears 2012 through fiscal year 2019. Fiscal year 2019 settlements include $140.7 million of fiscal year 2009 through fiscal year 2018 advance tax payments madein June 2018 that were applied to additional federal tax liabilities generated by the federal tax audit settlement.
The total amount of gross unrecognized tax benefits as of June 29, 2019 that, if recognized, would affect the effective tax rate is $168.1 million . $52.3 million ofunrecognized tax benefits would be offset by an increase in the valuation allowance for deferred tax assets and thus would not affect the effective tax rate.
The Company does not expect its unrecognized tax benefits to change significantly within the next 12 months.
The Company reports interest and penalties related to unrecognized tax benefits as a component of income tax expense. The gross amount, before the federal andstate benefit, of interest and penalties recognized in income tax expense during the fiscal years ended June 29, 2019 , June 30, 2018 , and June 24, 2017 was$(30.2) million , $27.8 million and $22.4 million , respectively, and the total amount of interest and penalties accrued as of June 29, 2019 , June 30, 2018 , andJune 24, 2017 was $31.7 million , $61.9 million , and $71.4 million , respectively.
The Company’s federal corporate income tax returns are audited on a recurring basis by the Internal Revenue Service (“IRS”). In fiscal year 2017, the IRScommenced an audit of the Company’s federal corporate income tax returns for fiscal years 2012 through 2014, which is ongoing. The Company expects that infiscal year 2020 the IRS will commence an audit of the Company's federal corporate income tax returns for fiscal years 2015 through 2017.
A summary of the fiscal tax years that remain subject to examination, as of June 29, 2019 , for the Company's major tax jurisdictions are as follows:
United States - Federal 2012 - ForwardIreland 2015 - Forward
67

MAXIM INTEGRATED PRODUCTS, INC.NOTES TO CONSOLIDATED FINANCIAL STATEMENTS
NOTE 16: RESTRUCTURING ACTIVITIES
During the fiscal year ended June 29, 2019 , the Company recorded $5.6 million in “Severance and restructuring expenses" in the Consolidated Statements ofIncome related to various restructuring plans designed to reduce costs. These charges were primarily associated with continued reorganization of certain businessunits and functions, which impacted multiple job classifications and locations, as well as employee enrollments in voluntary separation programs.
During the fiscal year ended June 30, 2018 , the Company recorded $15.1 million in “Severance and restructuring expenses" in the Consolidated Statements ofIncome related to various restructuring plans designed to reduce costs. These charges were primarily associated with continued reorganization of certain businessunits and functions, which impacted multiple job classifications and locations, as well as employee enrollments in voluntary separation programs.
During the fiscal year ended June 24, 2017 , the Company recorded $12.5 million in “Severance and restructuring expenses" in the Consolidated Statements ofIncome related to various restructuring plans designed to reduce costs. These charges were primarily associated with continued reorganization of certain businessunits and functions and the closure of the Dallas, Texas campus, including ceasing operations of its wafer level packaging (“WLP”) manufacturingfacilities. Multiple job classifications and locations were impacted by these activities. In connection with the WLP closure, the Company recorded accelerateddepreciation charges of $3.5 million in “Cost of goods sold” and $0.8 million in "Operating expenses" in the Consolidated Statements of Income.
Restructuring Accruals
The Company has accruals for severance and restructuring payments within Accrued salary and related expenses in the accompanying Consolidated BalanceSheets. The following table summarizes changes in the accruals associated with these restructuring activities during the fiscal years ended June 29, 2019 andJune 30, 2018 :
Balance,June 24,
2017
Fiscal Year 2018 Balance,June 30,
2018
Fiscal Year 2019 Balance,June 29,
2019 Charges Cash
Payments Change inEstimates Charges
CashPayments
Change inEstimates
(in thousands)
Severance - All plans $ 526 $ 15,464 $ (12,617) $ (404) $ 2,969 $ 5,632 $ (7,446) $ (28) $ 1,127
Charges and changes in estimates are included in Severance and restructuring expenses in the accompanying Consolidated Statements of Income.
Change in estimate
Due to the above-mentioned restructuring activities, the Company recorded accelerated depreciation resulting from the change in estimated useful lives of certainlong-lived assets included in restructuring plans. This change in estimate resulted in additional expense and therefore impacted operating income, net income andearnings per share during the year ended June 24, 2017. Specifically, operating income decreased by $4.2 million ; net income decreased by $3.9 million ; basicearnings per share decreased by $0.01 ; and diluted earnings per share decreased by $0.02 . The change in estimate had no material impact to the Company’sfinancial statements during the fiscal years ended June 29, 2019 and June 30, 2018.
NOTE 17: BENEFITS
Defined contribution plan
U.S. employees are automatically enrolled in the Maxim Integrated 401(k) Plan (the "Plan") when they meet eligibility requirements, unless they declineparticipation. Under the terms of the Plan, the Company matches 100% of the employee contributions for the first 3% of employee eligible compensation and anadditional 50% match for the next 2% of employee eligible compensation, up to the IRS Annual Compensation Limits. Total defined contribution expense was$11.6 million , $12.6 million and $12.4 million in fiscal years 2019 , 2018 and 2017 , respectively.
Non-U.S. Pension Benefits
68

MAXIM INTEGRATED PRODUCTS, INC.NOTES TO CONSOLIDATED FINANCIAL STATEMENTS
The Company sponsors defined-benefit pension plans in certain countries. Consistent with the requirements of local law, the Company deposits funds for certainplans with insurance companies, with third party trustees, or into government-managed accounts, and accrues for the unfunded portion of the obligation.
The Company sponsors retirement plans for employees in the Philippines and certain other countries. These plans are non-contributory and defined benefit typesthat provide retirement to employees equal to one-month salary for every year of credited service. The benefits are paid in a lump sum amount upon retirement orseparation from the Company. Total defined benefit liability was $12.6 million and $11.2 million as of June 29, 2019 and June 30, 2018 , respectively. Totalaccumulated other comprehensive loss related to this retirement plan was $3.0 million , $1.0 million and $0.6 million for the fiscal years 2019 , 2018 , and 2017 ,respectively.
U.S. Employees Postretirement Medical Expense & Funded Status Reconciliation
The Company provides postretirement medical expenses to certain former employees of Dallas Semiconductor and to certain Maxim Integrated executives. TheCompany adopted the postretirement medical plan as a result of the Company's acquisition of Dallas Semiconductor in 2001. A reconciliation of the funded statusof these postretirement benefits, is as follows:
June 29, 2019
Estimated Fiscal Year2020 Expense
June 30, 2018
Fiscal Year 2019Expense
(in thousands, except percentages)Accumulated postretirement benefit obligation (APBO): Retirees and beneficiaries $ (18,241) $ (18,023) Active participants (1,437) (1,367)
Funded status $ (19,678) $ (19,390)
Actuarial gain (loss) $ 118 $ 1,279 Prior service cost — — Amounts recognized in accumulated other comprehensiveincome: Net actuarial loss $ 1,172 $ 1,054 Prior service cost 606 962
Total $ 1,778 $ 2,016
Net periodic postretirement benefit cost: Interest cost $ 695 $ 741Amortization:
Prior service cost 356 356
Total net periodic postretirement benefit cost $ 1,051 $ 1,097
Employer contributions $ 747 $ 571
Economic assumptions: Discount rate 3.6% 3.9% Medical trend 7.25% - 5.0% 7.5%-5.0%
69

MAXIM INTEGRATED PRODUCTS, INC.NOTES TO CONSOLIDATED FINANCIAL STATEMENTS
The following benefit payments are expected to be paid:
Non-Pension BenefitsFiscal Year (in thousands)2020 $ 7472021 8192022 8772023 8932024 948Thereafter 15,394
Total $ 19,678
Dallas Semiconductor Split-Dollar Life Insurance
As a result of the Company's acquisition of Dallas Semiconductor in 2001, the Company assumed responsibility associated with a split-dollar life insurance policyheld by a former Dallas Semiconductor director. The policy is owned by the individual with the Company retaining a limited collateral assignment.
The Company had $6.9 million and $5.5 million included in Other assets in the Consolidated Balance Sheets as of June 29, 2019 and June 30, 2018 , respectively,associated with the limited collateral assignment to the policy. The Company had a $8.2 million and $6.3 million obligation included in Other Liabilities in theConsolidated Balance Sheets as of June 29, 2019 and June 30, 2018 , respectively, related to the anticipated continued funding associated with the policy.
NOTE 18: QUARTERLY FINANCIAL DATA (UNAUDITED)
Quarter EndedFiscal Year 2019 June 29, 2019 March 30, 2019 December 29, 2018 September 29, 2018
(in thousands, except percentages and per share data)Net revenues $ 556,545 $ 542,383 $ 576,906 $ 638,495Cost of goods sold 200,154 201,552 203,858 208,259
Gross margin $ 356,391 $ 340,831 $ 373,048 $ 430,236
Gross margin % 64.0% 62.8% 64.7% 67.4%Operating income $ 173,571 $ 157,140 $ 182,204 $ 234,183
% of net revenues 31.2% 29.0% 31.6% 36.7%Net income (1) $ 367,558 $ 130,613 $ 131,892 $ 197,423
Earnings per share: Basic $ 1.35 $ 0.48 $ 0.48 $ 0.71
Diluted $ 1.33 $ 0.47 $ 0.47 $ 0.70
Shares used in the calculation of earnings per share: Basic 272,382 273,221 276,252 278,045
Diluted 275,834 276,610 280,008 282,454
Dividends declared and paid per share $ 0.46 $ 0.46 $ 0.46 $ 0.46
(1) The fiscal quarter ended June 29, 2019 includes $251.6 million of net income from the release of uncertain tax position and related interest reserves and a $47.7 millionTransition Tax charge. The fiscal quarter ended December 29, 2018 includes a $22.1 million Transition Tax charge. For details, refer to Note 15: “Income Taxes”.
70

MAXIM INTEGRATED PRODUCTS, INC.NOTES TO CONSOLIDATED FINANCIAL STATEMENTS
Quarter EndedFiscal Year 2018 June 30, 2018 March 31, 2018 December 30, 2017 September 23, 2017
(in thousands, except percentages and per share data)Net revenues (1) $ 633,154 $ 648,599 $ 622,637 $ 575,676Cost of goods sold 214,486 224,653 212,961 201,845
Gross margin $ 418,668 $ 423,946 $ 409,676 $ 373,831
Gross margin % 66.1% 65.4% 65.8% 64.9%Operating income $ 222,395 $ 224,838 $ 201,048 $ 185,166
% of net revenues 35.1% 34.7% 32.3% 32.2%Net income (loss) (2) $ 194,172 $ 193,627 $ (75,015) $ 154,533
Earnings (loss) per share: Basic $ 0.70 $ 0.69 $ (0.27) $ 0.55
Diluted $ 0.68 $ 0.68 $ (0.27) $ 0.54
Weighted-average shares used in the calculation of earnings (loss)per share: Basic 279,304 280,850 281,560 282,170
Diluted 283,934 285,881 281,560 286,437
Dividends declared and paid per share $ 0.42 $ 0.42 $ 0.36 $ 0.36
(1) The fiscal quarter ended December 30, 2017 , includes an incremental $22.0 million of revenue from beginning to recognize revenue with a certain distributor (less itsestimate of future price adjustments and returns) upon shipment to the distributor (also referred to as the sell-in basis of revenue recognition). It also includes a $236.9million provisional Transition Tax charge. For details, refer to Note 15: “Income Taxes”.
71

Report of Independent Registered Public Accounting Firm
To the Board of Directors and Stockholders of Maxim Integrated Products, Inc.
Opinions on the Financial Statements and Internal Control over Financial Reporting
We have audited the accompanying consolidated balance sheets of Maxim Integrated Products, Inc. and its subsidiaries (the “Company”) as of June 29, 2019 andJune 30, 2018 , and the related consolidated statements of income, comprehensive income, stockholders’ equity and cash flows for each of the three years in theperiod ended June 29, 2019 , including the related notes and financial statement schedule listed in the index appearing under Item 15(a)(2) (collectively referred toas the “consolidated financial statements”). We also have audited the Company's internal control over financial reporting as of June 29, 2019 based on criteriaestablished in Internal Control - Integrated Framework (2013) issued by the Committee of Sponsoring Organizations of the Treadway Commission (COSO).
In our opinion, the consolidated financial statements referred to above present fairly, in all material respects, the financial position of the Company as of June 29,2019 and June 30, 2018 , and the results of its operations and its cash flows for each of the three years in the period ended June 29, 2019 in conformity withaccounting principles generally accepted in the United States of America. Also in our opinion, the Company maintained, in all material respects, effective internalcontrol over financial reporting as of June 29, 2019 , based on criteria established in Internal Control - Integrated Framework (2013) issued by the COSO.
Change in Accounting Principle
As discussed in Note 2 to the consolidated financial statements, the Company changed the manner in which it accounts for revenue from contracts with customersin fiscal year 2019 .
Basis for Opinions
The Company's management is responsible for these consolidated financial statements, for maintaining effective internal control over financial reporting, and forits assessment of the effectiveness of internal control over financial reporting, included in Management's Annual Report on Internal Control over FinancialReporting appearing under Item 9A. Our responsibility is to express opinions on the Company’s consolidated financial statements and on the Company's internalcontrol over financial reporting based on our audits. We are a public accounting firm registered with the Public Company Accounting Oversight Board (UnitedStates) (PCAOB) and are required to be independent with respect to the Company in accordance with the U.S. federal securities laws and the applicable rules andregulations of the Securities and Exchange Commission and the PCAOB.
We conducted our audits in accordance with the standards of the PCAOB. Those standards require that we plan and perform the audits to obtain reasonableassurance about whether the consolidated financial statements are free of material misstatement, whether due to error or fraud, and whether effective internalcontrol over financial reporting was maintained in all material respects.
Our audits of the consolidated financial statements included performing procedures to assess the risks of material misstatement of the consolidated financialstatements, whether due to error or fraud, and performing procedures that respond to those risks. Such procedures included examining, on a test basis, evidenceregarding the amounts and disclosures in the consolidated financial statements. Our audits also included evaluating the accounting principles used and significantestimates made by management, as well as evaluating the overall presentation of the consolidated financial statements. Our audit of internal control over financialreporting included obtaining an understanding of internal control over financial reporting, assessing the risk that a material weakness exists, and testing andevaluating the design and operating effectiveness of internal control based on the assessed risk. Our audits also included performing such other procedures as weconsidered necessary in the circumstances. We believe that our audits provide a reasonable basis for our opinions.
Definition and Limitations of Internal Control over Financial Reporting
A company’s internal control over financial reporting is a process designed to provide reasonable assurance regarding the reliability of financial reporting and thepreparation of financial statements for external purposes in accordance with generally accepted accounting principles. A company’s internal control over financialreporting includes those policies and procedures that (i) pertain to the maintenance of records that, in reasonable detail, accurately and fairly reflect the transactionsand dispositions of the assets of the company; (ii) provide reasonable assurance that transactions are recorded as necessary to permit preparation of financialstatements in accordance with generally accepted accounting principles, and that receipts and
72
expenditures of the company are being made only in accordance with authorizations of management and directors of the company; and (iii) provide reasonableassurance regarding prevention or timely detection of unauthorized acquisition, use, or disposition of the company’s assets that could have a material effect on thefinancial statements.
Because of its inherent limitations, internal control over financial reporting may not prevent or detect misstatements. Also, projections of any evaluation ofeffectiveness to future periods are subject to the risk that controls may become inadequate because of changes in conditions, or that the degree of compliance withthe policies or procedures may deteriorate.
/s/ PricewaterhouseCoopers LLP
San Jose, California
August 21, 2019
We have served as the Company’s auditor since 2016 .
73

MAXIM INTEGRATED PRODUCTS, INC.SCHEDULE II - VALUATION AND QUALIFYING ACCOUNTS
Balance atBeginning of
Period Additions
Deductions
Balance atEnd ofPeriod
(in thousands)Price adjustments and other revenue reserves Year ended June 29, 2019 (1) $ — $ 568,550 $ (468,061) $ 100,489
Returns and allowances Year ended June 29, 2019 (1) $ 140,115 $ 698 $ (140,664) $ 148 Year ended June 30, 2018 $ 46,575 $ 659,023 $ (565,483) $ 140,115 Year ended June 24, 2017 $ 31,461 $ 143,950 $ (128,836) $ 46,575
(1) Subsequent to the adoption of Topic 606 on July 1, 2018, the revenue reserve allowances are presented on a gross basis as accrued Price adjustments and otherrevenue reserves in the Consolidated Balance Sheet. See Note 2 - Summary of Significant Accounting Policies.
74
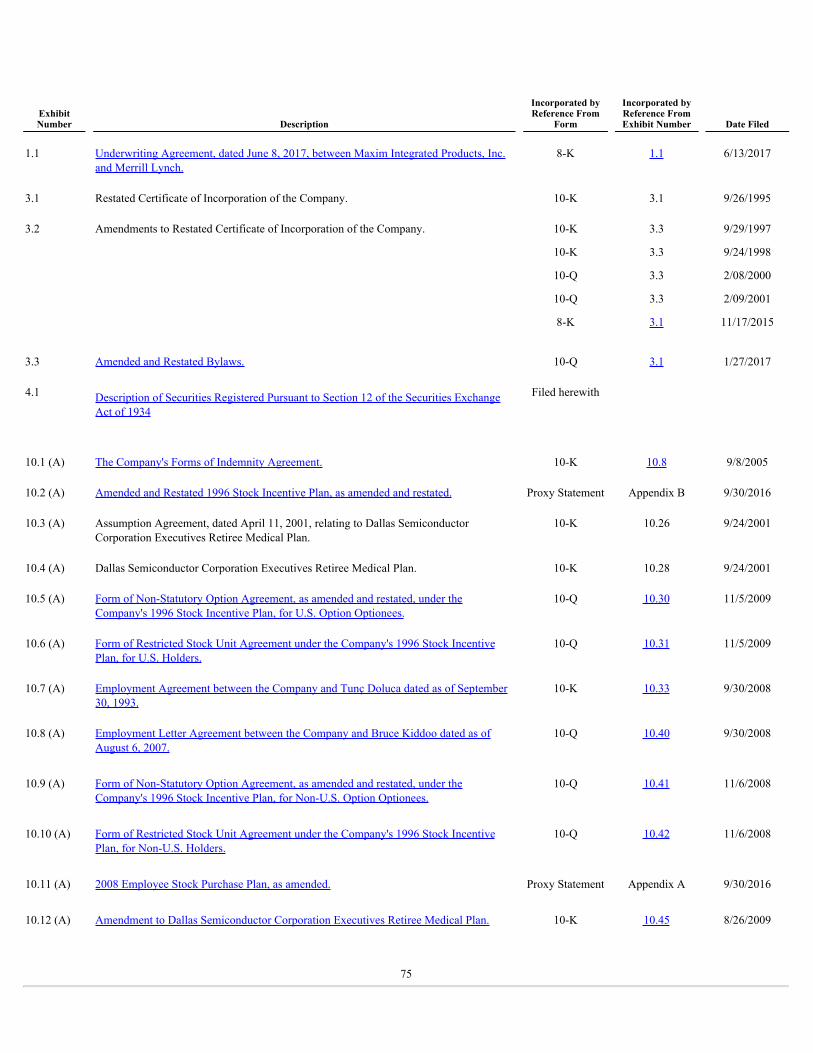
ExhibitNumber Description
Incorporated byReference From
Form
Incorporated byReference FromExhibit Number Date Filed
1.1
Underwriting Agreement, dated June 8, 2017, between Maxim Integrated Products, Inc.and Merrill Lynch.
8-K
1.1
6/13/2017
3.1 Restated Certificate of Incorporation of the Company. 10-K 3.1 9/26/1995 3.2
Amendments to Restated Certificate of Incorporation of the Company.
10-K
10-K
10-Q
10-Q
8-K
3.3
3.3
3.3
3.3
3.1
9/29/1997
9/24/1998
2/08/2000
2/09/2001
11/17/2015
3.3 Amended and Restated Bylaws. 10-Q 3.1 1/27/2017 4.1
Description of Securities Registered Pursuant to Section 12 of the Securities ExchangeAct of 1934
Filed herewith
10.1 (A) The Company's Forms of Indemnity Agreement. 10-K 10.8 9/8/2005 10.2 (A) Amended and Restated 1996 Stock Incentive Plan, as amended and restated. Proxy Statement Appendix B 9/30/2016 10.3 (A)
Assumption Agreement, dated April 11, 2001, relating to Dallas SemiconductorCorporation Executives Retiree Medical Plan.
10-K
10.26
9/24/2001
10.4 (A) Dallas Semiconductor Corporation Executives Retiree Medical Plan. 10-K 10.28 9/24/2001 10.5 (A)
Form of Non-Statutory Option Agreement, as amended and restated, under theCompany's 1996 Stock Incentive Plan, for U.S. Option Optionees.
10-Q
10.30
11/5/2009
10.6 (A)
Form of Restricted Stock Unit Agreement under the Company's 1996 Stock IncentivePlan, for U.S. Holders.
10-Q
10.31
11/5/2009
10.7 (A)
Employment Agreement between the Company and Tunç Doluca dated as of September30, 1993.
10-K
10.33
9/30/2008
10.8 (A)
Employment Letter Agreement between the Company and Bruce Kiddoo dated as ofAugust 6, 2007.
10-Q
10.40
9/30/2008
10.9 (A)
Form of Non-Statutory Option Agreement, as amended and restated, under theCompany's 1996 Stock Incentive Plan, for Non-U.S. Option Optionees.
10-Q
10.41
11/6/2008
10.10 (A)
Form of Restricted Stock Unit Agreement under the Company's 1996 Stock IncentivePlan, for Non-U.S. Holders.
10-Q
10.42
11/6/2008
10.11 (A) 2008 Employee Stock Purchase Plan, as amended. Proxy Statement Appendix A 9/30/2016 10.12 (A) Amendment to Dallas Semiconductor Corporation Executives Retiree Medical Plan. 10-K 10.45 8/26/2009
75

ExhibitNumber Description
Incorporated byReference From
Form
Incorporated byReference FromExhibit Number Date Filed
10.13 (A) Change In Control Employee Severance Plan for U.S. Based Employees. 10-Q 10.4 10/20/2017 10.14 (A) Change In Control Employee Severance Plan for Non-U.S. Based Employees. 10-Q 10.5 10/20/2017 10.15 (A)
Equity Award Policy Acceleration Of Vesting In The Event of A Change In Control ForEmployees Based Outside The U.S.
10-Q
10.6
10/20/2017
10.16
Credit Agreement, dated October 13, 2011, and amended on June 27, 2014, by andamong the Company, as borrower, JPMorgan Chase Bank, N.A. as AdministrativeAgent, Bank of America, N.A., Wells Fargo Bank, National Association and MorganStanley MUFG Loan Partners, LLC, as Co-Documentation Agents, and the lenders partythereto (the “Credit Agreement”).
10-Q
10.52
10/26/2011
10.17
Underwriting Agreement, dated March 11, 2013, between the Company and J.P. MorganSecurities LLC.
8-K
1.1
3/14/2013
10.18 Underwriting Agreement, dated June 8, 2017, between the Company and Merrill Lynch. 8-K 1.1 6/13/2017 10.19
Third Supplemental Indenture, dated as of November 21, 2013, between the Companyand Wells Fargo Bank, National Association, as trustee.
8-K
4.1
11/21/2013
10.20
Indenture, dated June 10, 2010, between the Company and Wells Fargo Bank, NationalAssociation, as trustee.
S-3
4.4
6/10/2010
10.21
Second Supplemental Indenture, dated as of March 18, 2013, between the Company andWells Fargo Bank, National Association, as trustee.
8-K
4.1
3/21/2013
10.22
Fourth Supplemental Indenture, dated as of June 15, 2017, between the Company andWells Fargo Bank, National Association, as trustee.
8-K
4.1
6/20/2017
10.23 (A) Form of Global Performance Share Agreement. 10-Q 10.1 10/20/2017 10.24 (A) Form of Global Restricted Stock Unit Agreement. 10-Q 10.2 10/20/2017 10.25 (A) Form of Global Employee Stock Purchase Plan Agreement. 10-Q 10.3 10/20/2017 10.26 Second Amendment to Credit Agreement, dated July 21, 2015. 10-K 10.23 8/18/2015 10.27 Third Amendment to Credit Agreement, dated June 13, 2016. 10-K 10.25 8/12/2016 10.28 †
Supply Agreement between the Company and TowerJazz Texas, Inc. (formerly known asTJ Texas, Inc.), a Delaware corporation and indirect wholly-owned subsidiary of TowerSemiconductor Ltd., an Israeli corporation, executed as of November 18, 2015.
10-Q/A
10.1
5/10/2016
10.29
Credit Agreement by and between Maxim Holding Company Ltd. and The Bank ofTokyo-Mitsubishi UFJ, Ltd., New York Branch, dated June 23, 2016.
8-K
10.1
6/24/2016
76

ExhibitNumber Description
Incorporated byReference From
Form
Incorporated byReference FromExhibit Number Date Filed
10.30
Guaranty by Maxim Integrated Products, Inc. in favor of The Bank of Tokyo-MitsubishiUFJ, Ltd., New York Branch, dated June 23, 2016.
8-K
10.2
6/24/2016
12.1 Statement of Ratio of Income to Fixed Charges. Filed herewith 21.1 Subsidiaries of the Company. Filed herewith 23.1
Consent of PricewaterhouseCoopers LLP, Independent Registered Public AccountingFirm.
Filed herewith
24.1 Power of Attorney (contained in the signature page to this Form 10-K). Filed herewith 31.1
Certification of Chief Executive Officer Pursuant to Section 302 of the Sarbanes-OxleyAct of 2002.
Filed herewith
31.2
Certification of Chief Financial Officer Pursuant to Section 302 of the Sarbanes-OxleyAct of 2002.
Filed herewith
32.1
Certification of Chief Executive Officer Pursuant to 18 U.S.C. Section 1350, as AdoptedPursuant to Section 906 of the Sarbanes-Oxley Act of 2002.
Filed herewith
32.2
Certification of Chief Financial Officer Pursuant to 18 U.S.C. Section 1350, as AdoptedPursuant to Section 906 of the Sarbanes-Oxley Act of 2002.
Filed herewith
101.INS XBRL Instance Document101.SCH XBRL Taxonomy Extension Schema101.CAL XBRL Taxonomy Extension Calculation Linkbase101.DEF XBRL Taxonomy Extension Definition Document101.LAB XBRL Taxonomy Extension Label Linkbase101.PRE XBRL Taxonomy Extension Presentation Linkbase
____________________(A) Management contract or compensatory plan or arrangement.
† Portions of the exhibit (indicated by bracketed asterisks) have been omitted pursuant to an order granted by the Securities and Exchange Commission for
confidential treatment.
77

C ORPORATE D ATA AND S TOCKHOLDER I NFORMATION
Independent Registered Public Accounting FirmPricewaterhouseCoopers LLPSan Jose, California
Registrar/Transfer AgentComputershareCanton, Massachusetts
Corporate Headquarters160 Rio RoblesSan Jose, California 95134(408) 601-1000
Stock Listing
At August 8, 2019 , there were approximately 650 stockholders of record of the Company's common stock as reported by Computershare. Maxim Integratedcommon stock is traded on the Nasdaq Global Select Market under the symbol “MXIM”.
78

ITEM 16. FORM 10-K SUMMARY
None.
79

SIGNATURE
Pursuant to the requirements of Section 13 or 15(d) of the Securities Exchange Act of 1934, the Registrant has duly caused this Report to be signed on its behalf bythe undersigned, thereunto duly authorized.
August 21, 2019 MAXIM INTEGRATED PRODUCTS, INC.
By:/s/ Bruce E. Kiddoo Bruce E. Kiddoo Senior Vice President, Chief Financial Officer and Chief Accounting Officer
80

P OWER OF A TTORNEY
KNOW ALL PERSONS BY THESE PRESENTS, that each person whose signature appears below constitutes and appoints each of Tunç Doluca and Bruce E.Kiddoo, jointly and severally, as his or her true and lawful attorneys-in-fact and agents, with full power of substitution and re-substitution, for him or her and in hisor her name, place and stead, in any and all capacities, to sign any and all amendments (including post-effective amendments) to this Annual Report on Form 10-K,and to file the same, with all exhibits thereto, and other documents in connection therewith, with the Securities and Exchange Commission, granting unto saidattorneys-in-fact and agents, and each of them, full power and authority to do and perform each and every act and thing requisite and necessary to be done inconnection therewith and about the premises, as fully to all intents and purposes as he might or could do in person, hereby ratifying and confirming all that saidattorneys-in-fact and agents, or any of them, or their or his substitute or substitutes, may lawfully do or cause to be done by virtue hereof.
Pursuant to the requirements of the Securities Exchange Act of 1934, the report has been signed below by the following persons on behalf of the registrant and inthe capacities and on the dates indicated.
Signature Title Date /s/ Tunç Doluca President, Director and Chief Executive Officer August 21, 2019Tunç Doluca (Principal Executive Officer)
/s/ Bruce E. Kiddoo Senior Vice President, Chief Financial Officer and Chief Accounting Officer August 21, 2019Bruce E. Kiddoo (Principal Financial and Accounting Officer)
/s/ William P. Sullivan Director and Chairman of the Board August 21, 2019William P. Sullivan
/s/ Tracy C. Accardi Director August 21, 2019Tracy C. Accardi
/s/ James R. Bergman Director August 21, 2019James R. Bergman /s/ Joseph R. Bronson Director August 21, 2019Joseph R. Bronson Director August 21, 2019Robert E. Grady /s/ William D. Watkins Director August 21, 2019William D. Watkins
/s/ MaryAnn Wright Director August 21, 2019MaryAnn Wright
81

Exhibit 4.1
Description of Securities Registered Pursuant to Section 12 of the Securities Exchange Act of 1934
As of August 21, 2019 , Maxim Integrated Products, Inc., a Delaware corporation (the “Company,” “we,” or “our”), had one class of securities registered underSection 12 of the Securities Exchange Act of 1934, as amended: Common Stock, par value $0.001 (the “Common Stock”). The following summary includes a briefdescription of the Common Stock as well as certain related information.
General
Pursuant to the Company’s Restated Certificate of Incorporation, as amended (the “Certificate of Incorporation”), the authorized capital stock of the Companyconsists of 962,000,000 shares, consisting of 960,000,000 shares of Common Stock and 2,000,000 shares of preferred stock having a par value of $.001 per share(the “Preferred Stock”).
Common Stock
Voting Rights
Except as otherwise required by law, the Certificate of Incorporation or the Company’s Amended and Restated Bylaws, as amended (the “Bylaws”), eachstockholder has one vote in respect of each share of Common Stock that has been held by such stockholder and registered in such stockholder's name on the booksof the Company. There is no cumulative voting in the election of directors.
Dividend, Liquidation and Other Rights
Holders of Common Stock are entitled to receive dividends if and when declared by the Company's Board of Directors out of funds legally available.
In the event of the Company’s liquidation or dissolution, holders of the Company's Common Stock are entitled to receive proportionately the Company's net assetsavailable for distribution to stockholders after the payment of all debts and other liabilities and subject to the prior rights of any outstanding preferred stock that theCompany's Board of Directors may designate and issue in the future. Holders of Common Stock have no preemptive, subscription, redemption or conversionrights. The rights, preferences, and privileges of holders of Common Stock are subject to and may be adversely affected by the rights of the holders of shares ofany series of Preferred Stock that the Company’s Board of Directors may designate and issue in the future.
Certain Business Combinations
Article Seventh of our Certificate of Incorporation requires the affirmative vote of the holders of at least sixty-six and two-thirds percent (66-2/3%) of the votingpower of the then outstanding shares of capital stock of the Company entitled to vote generally in the election of directors (the “Voting Stock”), voting together asa single class, to approve certain “business combinations,” including mergers, sales or transfers of assets and other corporate actions involving any “interestedstockholder” (as defined in the Certificate of Incorporation) or an affiliate of an interested stockholder, unless a majority of disinterested directors have approvedthe action and certain other conditions are met. Furthermore, the provisions Article Seventh may not be amended or repealed, in any respect, unless such action isapproved by the affirmative vote of the holders of sixty-six and two-third percent (66-2/3%) or more of the outstanding Voting Stock, voting as a single class.
Certain Other Provisions of Our Certificate of Incorporation or Bylaws
The Certificate of Incorporation and/or the Company’s Bylaws, include the following provisions, not previously discussed above, that may have an effectof delaying, deferring or preventing a change in control of the Company:

• our Bylaws establish an advance notice procedure for stockholders to submit proposed nominations of persons for election to our Board of Directors andother proposals for business to be brought before an annual meeting of our stockholders;
• our Board of Directors may issue shares of Preferred Stock, with designations, rights and preferences as may be determined from time to time by ourBoard of Directors; and
• amendments to the Certificate of Incorporation require the approval by a majority vote of the Company's Board of Directors and also by a majority voteof the outstanding shares of the Company’s capital stock entitled to vote thereon.
The following summary does not purport to be complete and is subject to, and qualified in its entirety by, the full text of our Certificate of Incorporation andBylaws. For additional information we encourage you to read: the Certificate of Incorporation and Bylaws, each of which are exhibits to our Annual Report onForm 10-K; and applicable provisions of the General Corporation Law of the State of Delaware, including Section 203.

EXHIBIT 12.1
MAXIM INTEGRATED PRODUCTS, INC.Statement of Ratio of Income to Fixed Charges
(Dollar amounts in millions)
Years ended
June 29,
2019 June 30,
2018 June 24,
2017 June 25,
2016 June 27,
2015
Income before provision for income taxes $ 754.4 $ 824.9 $ 679.6 $ 285.1 $ 246.2
Fixed Charges: Interest portion of rental expense $ 0.5 $ 0.5 $ 0.6 $ 0.5 $ 0.5Interest expense 43.5 50.2 34.3 32.7 32.5Amortized premiums, discounts and capitalizedexpenses related to the debt 2.1 2.9 2.4 2.4 2.4
Total fixed charges $ 46.1 $ 53.6 $ 37.3 $ 35.6 $ 35.4
Ratio of income to fixed charges 17x 16x 20x 9x 8x

EXHIBIT 21.1
SUBSIDIARIES OF THE COMPANY
Name of Subsidiary Jurisdiction of Incorporation
Maxim Integrated Products UK Limited United Kingdom
Maxim Integrated Products GmbH Germany
Maxim Gesellschaft fur elektronische integrierte Baustine GmbH Germany
Maxim France SARL France
Maxim Integrated Products GmbH Austria
Maxim Integrated Products (Ireland) Holdings Limited Ireland
Maxim Integrated Products International Limited Ireland
Maxim Integrated Products International Sales Limited Ireland
Maxim Japan Co., Ltd. Japan
Maxim Integrated Products Korea Inc. Korea
Maxim Philippines Operating Corporation Philippines
Maxim Philippines Holding Corporation Philippines
Maxim Philippines Land Corporation * Philippines
* This Subsidiary is 40% owned by the Registrant.
Maxim (I.P.) Enterprise Solutions Corporation Philippines
Maxim Integrated Products (Thailand) Co., Ltd. Thailand
MXIM Circuits Design Shanghai Limited China
Maxim India Integrated Circuit Design Private Limited India
Maxim Mikroelektronik Tasarim ve Gelistirme Ltd. Sti Turkey
.

Name of Subsidiary Jurisdiction of Incorporation
Maxim International Holding, Inc. Delaware
L&L Engineering, LLC New Hampshire
Maxim Technology Ltd. Cayman Islands
Maxim Holding Company Ltd. Cayman Islands
Maxim Semiconductor Corporation (Taiwan) Delaware
Maxim Integrated Products Asia Limited Hong Kong
Maxim Dallas (Shanghai) Semiconductor Trading Co. Ltd. China
Mobilygen Corporation California
Innova Card France
Teridian Semiconductor Holdings Corp. Delaware
Teridian Semiconductor Intermediate Holding Corp. Delaware
Teridian Semiconductor Corporation California
Phyworks Limited United Kingdom
Maxim Integrated Products India Sales Private Limited India
IPR Limited Cayman Islands
Calvatec Limited United Kingdom
Genasic Design Systems Ltd. United Kingdom
Maxim Integrated GmbH Austria
Metrixx Limited United Kingdom
Maxim Integrated Germany GmbH Germany
Cambridge Analog Technologies, Inc. Delaware
TagArray, Inc. Delaware
Bedrock Automation Platforms, Inc. Delaware

Name of Subsidiary Jurisdiction of Incorporation
Scintera Networks LLC Delaware
Volterra Semiconductor LLC Delaware
Volterra Asia Pte. Ltd. Singapore
Volterra Global Marketing Ltd. Cayman Islands
Volterra Semiconductor Technology (Shanghai) Co. Ltd. China
Maxim Integrated Products International Sales Japan GK Japan
Maxim Island Holdings Corporation Canada
Icron Technologies Corporation Canada

EXHIBIT 23.1
CONSENT OF INDEPENDENT REGISTERED PUBLIC ACCOUNTING FIRM
We hereby consent to the incorporation by reference in the Registration Statements on Form S‑8 (Nos. 333-103163, 333-122559, 333-132888, 333-157416, 333-164640, 333-171824, 333-179249, 333-186214, 333-193731, 333-201862, 333-209093, 333-215790, and 333-222730) of Maxim Integrated Products, Inc. of our report dated August 21, 2019 relating to the financial statements, financial statementschedule and the effectiveness of internal control over financial reporting, which appears in this Form 10‑K.
/s/ PricewaterhouseCoopers LLPSan Jose, CaliforniaAugust 21, 2019

Exhibit 31.1CERTIFICATION
I, Tunç Doluca, certify that:
1. I have reviewed this Annual Report on Form 10-K of Maxim Integrated Products, Inc.;
2. Based on my knowledge, this report does not contain any untrue statement of a material fact or omit to state a material fact necessary to make the statementsmade, in light of the circumstances under which such statements were made, not misleading with respect to the period covered by this report;
3. Based on my knowledge, the financial statements, and other financial information included in this report, fairly present in all material respects the financialcondition, results of operations and cash flows of the registrant as of, and for, the periods presented in this report;
4. The registrant's other certifying officers and I are responsible for establishing and maintaining disclosure controls and procedures (as defined in Exchange ActRules 13a-15 (e) and 15d-15 (e)) and internal control over financial reporting (as defined in Exchange Act Rules 13a-15(f) and 15d-15(f))for the registrant andhave:
a) Designed such disclosure controls and procedures, or caused such disclosure controls and procedures to be designed under our supervision, to ensure thatmaterial information relating to the registrant, including its consolidated subsidiaries, is made known to us by others within those entities, particularly duringthe period in which this report is being prepared;
b) Designed such internal control over financial reporting, or caused such internal control over financial reporting to be designed under our supervision, toprovide reasonable assurance regarding the reliability of financial reporting and the preparation of financial statements for external purposes in accordancewith generally accepted accounting principles;
c) Evaluated the effectiveness of the registrant's disclosure controls and procedures and presented in this report our conclusions about the effectiveness of thedisclosure controls and procedures, as of the end of the period covered by this report based on such evaluation; and
d) Disclosed in this report any change in the registrant's internal control over financial reporting that occurred during the registrant's most recent fiscal quarter(the registrant's fourth fiscal quarter in the case of an annual report) that has materially affected, or is reasonably likely to materially affect, the registrant'sinternal control over financial reporting; and
5. The registrant's other certifying officer(s) and I have disclosed, based on our most recent evaluation of internal control over financial reporting, to the registrant'sauditors and the audit committee of the registrant's board of directors (or persons performing the equivalent functions):
a) All significant deficiencies and material weaknesses in the design or operation of internal control over financial reporting which are reasonably likely toadversely affect the registrant's ability to record, process, summarize and report financial information; and
b) Any fraud, whether or not material, that involves management or other employees who have a significant role in the registrant's internal control overfinancial reporting.
Date: August 21, 2019 /s/Tunç Doluca Tunç Doluca President and Chief Executive Officer

Exhibit 31.2CERTIFICATION
I, Bruce E Kiddoo, certify that:
1. I have reviewed this Annual Report on Form 10-K of Maxim Integrated Products, Inc.;
2. Based on my knowledge, this report does not contain any untrue statement of a material fact or omit to state a material fact necessary to make the statementsmade, in light of the circumstances under which such statements were made, not misleading with respect to the period covered by this report;
3. Based on my knowledge, the financial statements, and other financial information included in this report, fairly present in all material respects the financialcondition, results of operations and cash flows of the registrant as of, and for, the periods presented in this report;
4. The registrant's other certifying officers and I are responsible for establishing and maintaining disclosure controls and procedures (as defined in Exchange ActRules 13a-15 (e) and 15d-15 (e)) and internal control over financial reporting (as defined in Exchange Act Rules 13a-15(f) and 15d-15(f))for the registrant andhave:
a) Designed such disclosure controls and procedures, or caused such disclosure controls and procedures to be designed under our supervision, to ensure thatmaterial information relating to the registrant, including its consolidated subsidiaries, is made known to us by others within those entities, particularly duringthe period in which this report is being prepared;
b) Designed such internal control over financial reporting, or caused such internal control over financial reporting to be designed under our supervision, toprovide reasonable assurance regarding the reliability of financial reporting and the preparation of financial statements for external purposes in accordancewith generally accepted accounting principles;
c) Evaluated the effectiveness of the registrant's disclosure controls and procedures and presented in this report our conclusions about the effectiveness of thedisclosure controls and procedures, as of the end of the period covered by this report based on such evaluation; and
d) Disclosed in this report any change in the registrant's internal control over financial reporting that occurred during the registrant's most recent fiscal quarter(the registrant's fourth fiscal quarter in the case of an annual report) that has materially affected, or is reasonably likely to materially affect, the registrant'sinternal control over financial reporting; and
5. The registrant's other certifying officer(s) and I have disclosed, based on our most recent evaluation of internal control over financial reporting, to the registrant'sauditors and the audit committee of the registrant's board of directors (or persons performing the equivalent functions):
a) All significant deficiencies and material weaknesses in the design or operation of internal control over financial reporting which are reasonably likely toadversely affect the registrant's ability to record, process, summarize and report financial information; and
b) Any fraud, whether or not material, that involves management or other employees who have a significant role in the registrant's internal control overfinancial reporting.
Date: August 21, 2019 /s/Bruce E. Kiddoo
Bruce E. Kiddoo
Senior Vice President, Chief Financial Officer and Chief Accounting Officer

Exhibit 32.1
CERTIFICATE OF CHIEF EXECUTIVE OFFICER
In connection with the periodic report of Maxim Integrated Products, Inc. (the "Company") on Form 10-K for the period ended June 29, 2019 as filed with theSecurities and Exchange Commission (the "Report"), I, Tunç Doluca, Chief Executive Officer of the Company, hereby certify as of the date hereof, solely forpurposes of Title 18, Chapter 63, Section 1350 of the United States Code, that to the best of my knowledge:
1. the Report fully complies with the requirements of Section 13(a) or 15(d), as applicable, of the Securities Exchange Act of 1934, and
2. the information contained in the Report fairly presents, in all material respects, the financial condition and results of operations of the Company at thedates and for the periods indicated.
This Certification has not been, and shall not be deemed, "filed" with the Securities and Exchange Commission.
Date: August 21, 2019
By: /s/Tunç Doluca
Tunç DolucaPresident and Chief Executive Officer
This certification shall not be deemed to be incorporated by reference into any filing under the Securities Act of 1933, as amended or the Securities Exchange Actof 1934, as amended.
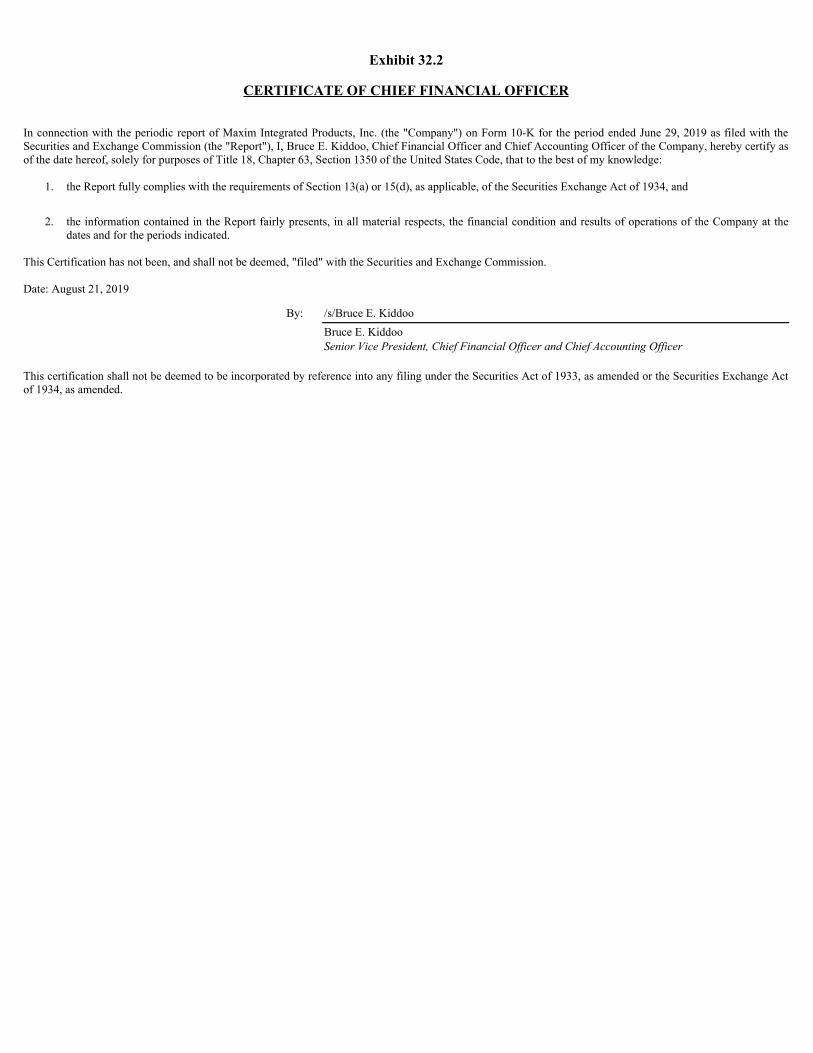
Exhibit 32.2
CERTIFICATE OF CHIEF FINANCIAL OFFICER
In connection with the periodic report of Maxim Integrated Products, Inc. (the "Company") on Form 10-K for the period ended June 29, 2019 as filed with theSecurities and Exchange Commission (the "Report"), I, Bruce E. Kiddoo, Chief Financial Officer and Chief Accounting Officer of the Company, hereby certify asof the date hereof, solely for purposes of Title 18, Chapter 63, Section 1350 of the United States Code, that to the best of my knowledge:
1. the Report fully complies with the requirements of Section 13(a) or 15(d), as applicable, of the Securities Exchange Act of 1934, and
2. the information contained in the Report fairly presents, in all material respects, the financial condition and results of operations of the Company at thedates and for the periods indicated.
This Certification has not been, and shall not be deemed, "filed" with the Securities and Exchange Commission.
Date: August 21, 2019
By: /s/Bruce E. Kiddoo
Bruce E. KiddooSenior Vice President, Chief Financial Officer and Chief Accounting Officer
This certification shall not be deemed to be incorporated by reference into any filing under the Securities Act of 1933, as amended or the Securities Exchange Actof 1934, as amended.