mbta scorecard - september 2009 - fina 9 30 2009m · similar spike in ridership as more people...
TRANSCRIPT

MBTA SCORECARD – SEPTEMBER 2009 – PAGE 1
MESSAGE FROM THE GENERAL MANAGER Dear reader, Thank you for reading the first edition of the MBTA ScoreCard. This ScoreCard reflects the MBTA’s commitment to safe and reliable transportation and its goal of being transparent and accountable. At the MBTA we are constantly working to improve the quality of the service we deliver to our customers. With this ScoreCard we begin publishing the same performance metrics that we use internally to measure our progress towards meeting our service quality goals. This is the first step in a new effort to publicly report performance at the MBTA. In this edition, we report on performance in the following key areas:
• Ridership: How many people ride the MBTA’s services every day? How does ridership break down by type of service?
• On-Time Performance: How often are different MBTA services on time? How does the MBTA measure what’s on time and what isn’t?
• Infrastructure: Good track maintenance is vital to safe and fast subway service. What condition are the MBTA’s tracks in?
• Dropped Trips: Does the MBTA run all the trips that are scheduled? Why might a trip not be run? What percentage of the scheduled trips run on my bus route or subway line?
• Vehicle Reliability: How reliable are the MBTA’s buses and trains? What is the MBTA doing to maintain and improve its vehicles?
• Safety: Safety is the highest priority at the MBTA. How often do safety-related incidents occur? What is the MBTA doing to enhance safety every day?
This report represents a new beginning for transparency and accountability at the MBTA. In the future, we plan to increase the numbers and breadth of measures included in this report. This report is for you, and as always your feedback is very important to us. How can we make it better? Please email us with comments and suggestions at [email protected]. Thank you for taking the time to read the ScoreCard, and we look forward to providing more information on our performance in the future. William Mitchell Acting General Manager
MBTA SCORECARD SEPTEMBER 2009

MBTA SCORECARD – SEPTEMBER 2009 – PAGE 2
Ridership Breakdown By Service Type - August 2009
Heavy Rail40%
Private Carrier Bus.2%
Commuter Rail11%
The RIDE1%
Water Transportation.5%
Bus and Trackless Trolley29%
Light Rail19%
Average Ridership per Weekday by Month, in millions (July 2007-Present)
0.8
0.9
1
1.1
1.2
1.3
1.4
Jan-
07
Mar
-07
May
-07
Jul-0
7
Sep-0
7
Nov-0
7
Jan-
08
Mar
-08
May
-08
Jul-0
8
Sep-0
8
Nov-0
8
Jan-
09
Mar
-09
May
-09
Jul-0
9
Increasing ridership is always a goal at the MBTA. There are many factors that impact ridership, including the economy, gas prices, and quality of service. In the summer and fall of 2008, a spike in gas prices caused a similar spike in ridership as more people looked to save money by riding the T. In 2009 the economic slowdown meant people were taking fewer trips for work or shopping, and ridership declined slightly.
Ridership measures the average number of trips taken on MBTA services each weekday. It represents “unlinked trips,” the most common way to measure transit ridership, which counts every time any customer boards an MBTA vehicle. For example if a customer takes the bus to Harvard Square and transfers to the Red Line there to go downtown, that would count as two unlinked trips, one on a bus and one on heavy rail. Bus and subway ridership is estimated based on CharlieCard or CharlieTicket or cash transactions on MBTA fareboxes and faregates. A certain percent is then added to account for people who ride without interacting with that equipment (like those who transfer within downtown subway stations, those who show their passes to an inspector, or children). That percentage is calculated based on periodic studies and ridership counts conducted in-person. Currently, not every farebox is emptied and scanned each day, so even though ridership information is collected electronically
it’s not immediately available at the end of the month. However, the MBTA’s goal is to have daily counts available from the Automated Fare Collection (AFC) system in the future. Before the MBTA finished installing its new Automated Fare Collection system in January 2007, bus and subway ridership were based on pass sales and the money and tokens collected from fareboxes and turnstiles. Less data was collected and it was not always easy to assign numbers to one month or the next, so the data collected after January 2007 is more precise than the data collected before it. Commuter rail and boat ridership is from counts made of every trip by the Conductor and the ferry operator, respectively. Paratransit ridership (THE RIDE) is based on the service’s reservation and scheduling system.
SPOTLIGHT ON RIDERSHIP
Ridership: Percentage change compared to same month of previous year August 2009 -July 2009
Jul-09, -7.4%
Jun-09, -3.6%
May-09, -1.1%
Mar-09, -4.8% Apr-09,
-4.9%
Feb-09, 4.9%
Jan-09, -3.2%
Dec-08, 6.7%
Nov-08, 4.1%
Oct-08, -4.0%
Sep-08, 10.2%
Aug-08, 5.7%
Source: Operations and Service Development

MBTA SCORECARD – SEPTEMBER 2009 – PAGE 3
Derivation of Average Weekday Ridership, July 2009 Data Bus and Trackless Trolley: Transactions from fareboxes and faregates 304,379 Allocate shared gate entries (South Station) (from survey) 3,477 Children, Evasion, Rear Door, Flash Passes: - Farebox transactions (add 12.7%) 38,187 - Faregate transactions (add 3.5%) 251 Ungated transfers at South Station (from survey) 4,609 Total Unlinked Passenger Trips 350,903 Heavy Rail (Red, Orange, Blue) Transactions from faregates 366,537 Allocate shared gate entries (Park Street, etc.) (from survey) -5,156 Children, Evasion (add 3.5%) 12,648 Ungated transfers (from survey) 96,799 Total Unlinked Passenger Trips 470,828 Light Rail (Green, Mattapan) Transactions from fareboxes and faregates 138,043 Allocate shared gate entries (Park Street, etc.) (from survey) 1,678 Children, Evasion, Rear Door, Flash Passes: - Faregate transactions (add 3.5%) 3,355 - Farebox transactions (add 22.0%) 7,898 Ungated Transfers (from survey) 79,335 Total Unlinked Passenger Trips 230,308 THE RIDE 6,228 Commuter Rail 137,691 Water Transportation 5,900 Private Carrier Bus 2,649 ALL MODES Total Unlinked Passenger Trips per Weekday 1,204,508
SPOTLIGHT ON RIDERSHIP

MBTA SCORECARD – SEPTEMBER 2009 – PAGE 4
On-time performance measures how closely the service ran to the schedule, as experienced by the customer. Many factors affect on-time performance. Some, like mechanical problems or speed restrictions, are within the MBTA’s control. Others, like medical emergencies and delayed freight trains blocking commuter rail traffic, are not. Regardless of the cause the MBTA strives to work around problems, minimize delay, and maximize on-time performance. The MBTA Service Delivery Policy defines how on-time performance is measured and what the goals are. To keep the measurement an accurate representation of customer experience, it works differently for different modes of travel. On the subway system customers walk up to the platform and wait for the next train. They don’t know when exactly the trips are scheduled, only that service runs every so many minutes. So the subway on-time performance standard is all about the wait between trains. On heavy rail lines the actual time between trains starting their trips must be within 150% of the scheduled time between trips. For example, if in the peak a trip on the Blue Line is scheduled to leave 4 minutes after the prior trip, and it starts more than 2 minutes late, that results in a gap between trains of more than 6 minutes, over 150% of the scheduled 4-minute interval; the trip would not be considered to be on time. The MBTA’s goal is for at least 95% of trips to be on time on each line. Data is recorded by track circuits and the control center computer system.
Red Line
80%82%84%86%88%90%92%94%96%98%
100%
Sep-0
4
Nov-0
4
Jan-0
5
Mar-05
May-0
5Ju
l-05
Sep-0
5
Nov-0
5
Jan-0
6
Mar-0
6
May-06
Jul-0
6
Sep-0
6
Nov-0
6
Jan-0
7
Mar-07
May-0
7Ju
l-07
Sep-0
7
Nov-0
7
Jan-0
8
Mar-0
8
May-08
Jul-0
8
Sep-0
8
Nov-0
8
Jan-0
9
Mar-09
May-09
Goal: 95%
The Red Line has seen substantial improvements over the past 5 years, from an average of 85% in September 2004 to 96% in August 2009. This was the result of a concentrated effort to improve the service, which included track infrastructure improvements to reduce speed restrictions, a schedule change and the creation of a standby train to fill gaps as needed, and maintenance improvements.
ON-TIME PERFORMANCE REPORT

MBTA SCORECARD – SEPTEMBER 2009 – PAGE 5
Orange Line
80%82%84%86%88%90%92%94%96%98%
100%
Sep-0
4
Nov-0
4
Jan-0
5
Mar-05
May-0
5Ju
l-05
Sep-0
5
Nov-0
5
Jan-0
6
Mar-0
6
May-06
Jul-0
6
Sep-0
6
Nov-0
6
Jan-0
7
Mar-07
May-0
7Ju
l-07
Sep-0
7
Nov-0
7
Jan-0
8
Mar-0
8
May-08
Jul-0
8
Sep-0
8
Nov-0
8
Jan-0
9
Mar-09
May-09
Goal: 95%
Orange Line performance has held strong for years, owing to good train maintenance, track maintenance, and signal upgrades. The line experiences only the occasional dip in performance, most recently in May 2009, when for part of the month operational procedures on the line changed while a signal problem was repaired.
Blue Line
80%82%84%86%88%90%92%94%96%98%
100%
Sep-0
4
Nov-0
4
Jan-0
5
Mar-05
May-0
5Ju
l-05
Sep-0
5
Nov-0
5
Jan-0
6
Mar-0
6
May-06
Jul-0
6
Sep-0
6
Nov-0
6
Jan-0
7
Mar-07
May-0
7Ju
l-07
Sep-0
7
Nov-0
7
Jan-0
8
Mar-0
8
May-08
Jul-0
8
Sep-0
8
Nov-0
8
Jan-0
9
Mar-09
May-09
Goal: 95%
The Blue Line’s on-time performance has been mostly steady with lower numbers recorded in early 2008. Part of this is actually a data problem. The introduction of 6-car trains led to some departure times being captured incorrectly, which was corrected in March 2009.
Green Line As a light rail line the Green Line uses a different train-tracking technology than the MBTA’s heavy rail lines. Its train tracking system is used for on-time performance reporting, but performing the analysis is most practical on a periodic rather than a monthly basis. The MBTA is in the early stages of a project to replace the vehicle tracking system on the 112-year-old line with cutting edge technology. On-time performance data on the line is collected periodically for the biennial Service Plan, a public process to implement schedule changes that improve performance and better match service to the public’s needs. When it was evaluated for the 2008 Service Plan, all four branches of the Green Line passed the light rail headway standard that requires 85% of trips to start within 150% of the scheduled interval, but the Green Line did not pass an additional standard that requires 95% of intervals in the central subway to be 3 minutes or less. The Service Plan evaluation resulted in a number of schedule changes to improve performance on the line. More recently, based on ongoing monitoring and analysis, the MBTA added time into the schedule to improve reliability (winter and spring 2009) and added additional service on the E branch to accommodate increased ridership (fall 2009).
ON-TIME PERFORMANCE REPORT

MBTA SCORECARD – SEPTEMBER 2009 – PAGE 6
Commuter Rail On-Time Performance (November 2005-Present)
50%
55%
60%
65%
70%
75%
80%
85%
90%
95%
100%
Nov 2
005
Jan 2
006
Mar
2006
May
2006
Jul 2
006
Sep 2
006
Nov 2
006
Jan 2
007
Mar
2007
May
2007
Jul 2
007
Sep 2
007
Nov 2
007
Jan 2
008
Mar
2008
May
2008
Jul 2
008
Sep 2
008
Nov 2
008
Jan 2
009
Mar
2009
May
2009
Jul 2
009
0-4 Minutes Late
5-9 Minutes Late
10+ Minutes LateGoal: 95%
Commuter rail customers plan to ride a specific scheduled trip, and are delayed if that trip is late. Commuter rail trips are deemed to be “on time” if they arrive between 0 and 4 minutes after the scheduled time. The MBTA’s goal is for at least 95% of trips to be on time on each commuter rail branch. The MBTA also tracks how many trips are between 0 and 9 minutes late, which includes some trips that are not technically “on time” but are still relatively close to schedule. Data is recorded in logs kept by dispatchers. Over the last few years the on-time performance (OTP) on Commuter Rail has improved. Improved OTP is the cumulative effect of minor improvements throughout the system. On the commuter rail, small problems can have an impact on OTP overtime as delays can compound across the system. Below are a number of adjustments made recently to improve OTP: On the Fairmont, Haverhill, Worcester, Old Colony and Greenbush lines schedule adjustments have been made taking account of track projects or speed restrictions. By adjusting schedules with regard to track conditions, the commuter rail is better able to meet schedules. The track improvement projects on these lines will help over the long term to reduce speed restrictions and improve schedule adherence. Lastly, better oversight of the mechanical department with a greater focus on preventative maintenance has led to a decrease in mechanical failures.
ON-TIME PERFORMANCE REPORT

MBTA SCORECARD – SEPTEMBER 2009 – PAGE 7
Although the overall OTP has improved, some lines occasionally see a drop in OTP. Some of this is caused during the better weather in the spring and summer when these aforementioned track projects are scheduled. For example, over the last few months the Middleboro Line has seen an increase in speed restrictions due to the deterioration of concrete ties on that line. These ties are to be replaced, but in the interim the OTP has decreased. Also, on the Worcester Line recently, the track owner, CSX has been doing some track and switch replacement work which eventually will improve OTP, but has caused delays as work is completed.
Commuter Rail On-Time Performance By Line – August 2009
0% 10% 20% 30% 40% 50% 60% 70% 80% 90% 100%
SYSTEM TOTAL
SOUTH SIDE
Greenbush
Plymouth/Kingston
Middleboro
Fairmount
Stoughton
Providence
Franklin
Needham
Worcester
NORTH SIDE
Fitchburg
Lowell
Haverhill
Newburyport
Rockport
Meets On Time policy (0-4 mins late) 5-9 mins late 10+ mins lateGOAL:95%
ON-TIME PERFORMANCE REPORT

MBTA SCORECARD – SEPTEMBER 2009 – PAGE 8
Subway Speed Restriction Impacts – By Line (April 2004-Present)
0
10
20
30
40
50
60
Jan-04
Mar-04
May-04
Jul-0
4
Sep-04
Nov-04
Jan-05
Mar-05
May-05
Jul-0
5
Sep-05
Nov-05
Jan-06
Mar-06
May-06
Jul-0
6
Sep-06
Nov-06
Jan-07
Mar-07
May-07
Jul-0
7
Sep-07
Nov-07
Jan-08
Mar-08
May-08
Jul-0
8
Sep-08
Nov-08
Jan-09
Mar-09
May-09
Jul-0
9
Min
utes
RED BLUE ORANGE GREEN
Speed restrictions measure the amount of slowdown caused by track conditions in the MBTA subway system. The condition of the MBTA’s tracks is constantly monitored. If a length of track falls below standards in some way – if the rail is worn down, if the ties will need to be replaced soon, if extreme heat has caused the rails to warp slightly or “kink” – then a speed restriction is be put in place, and trains are operate at a reduced speed when traveling that section of track until it is repaired. Using speed restrictions where there are track problems ensures safety for our customers. Resolving track problems in a timely manner leads to fewer speed restrictions, which in turn mean faster and more reliable service. The MBTA’s goal is to maintain the current low impact of speed restrictions (to fewer than 10.0 minutes for all lines.) If there is a half-mile section of track on the Green Line built for a speed of 30 mph, it will take 1 minute for a train to travel it; if that speed is restricted to 10 mph it will take a train 3 minutes instead of 1, for a travel time impact of 2 minutes. If that were the only speed restriction on the Green Line then the total Green Line impact would be two minutes. Because this is a measure of track condition, it does not matter whether the track is out on one branch or in the middle of the central subway; it counts as 2 minutes whether it affects all the trains or just those traveling on one branch. Trains don’t operate at the maximum speed allowed by track conditions at all times (they slow down to a stop to pick up passengers, for instance) so the real-world impact on travel time may be less than the number represents. Starting in 2005, when the impact number was 127.5 minutes for all lines (Red 34.2, Blue 15.5, Orange 21.0, Green 56.8) the MBTA focused additional resources on reducing the number of speed restrictions, leading to improvements in speed and reliability on all subway lines. The current total impact number for all lines is 10.3 (Red 2.4, Blue 3.2, Orange 0.0, Green 4.7).
SPEED RESTRICTIONS REPORT

MBTA SCORECARD – SEPTEMBER 2009 – PAGE 9
DROPPED TRIPS REPORT The MBTA strives to come as close as possible to operating every scheduled trip on every day. First the MBTA works to have enough operators, well-maintained vehicles and track, and good schedules. Even with those, however, there are still going to be some times when too many operators call in sick, or vehicles break down, or a track problem or a traffic jam slows down service. To counteract these problems the MBTA keeps a certain number of extra operators and vehicles on standby to fill in trips that would otherwise be prevented from running. The MBTA has reduced the number of dropped trips considerably over the past few years, by making improvements in each of the underlying causes listed above: having enough operators, having reliable equipment, having good tracks and signals, having good schedules, and having enough standby vehicles. If a trip is missed on a frequent bus route or a subway line the MBTA will spread out other trips on the route to try to fill the gap as much as possible. If there’s no way to avoid missing a trip on an infrequent route the MBTA will notify as many customers as it can by posting the information on its website, notifying staff at the customer support hotline, and sending a T-Alert email and text message to affected customers who subscribe to that service. Subway On the subway system it’s possible to have a standby train on every line, and even use it to provide extra service when it’s not needed to fill in a gap. Because of this subway lines sometimes end up operating even more trips than were actually scheduled. RED LINE
92.0%
93.0%
94.0%
95.0%
96.0%
97.0%
98.0%
99.0%
100.0%
101.0%
102.0%
103.0%
104.0%
Jun-04 Dec-04 Jun-05 Dec-05 Jun-06 Dec-06 Jun-07 Dec-07 Jun-08 Dec-08 Jun-09
August 2009: 101.1%
Starting in 2006 the MBTA made a concentrated effort to reduce the number of missed trips on the Red Line. Steps taken include improvements to track condition and mechanical reliability; better use of existing personnel to perform extra work when needed, including the use of Inspectors to operate trains when no Operators are available; and two standby trains, one added in late 2006 and another added in early 2009. As a result the Red Line has gone from a low of about 95% of scheduled trips being operated in late 2005 to a high of about 101% of scheduled trips being operated in mid 2009.

MBTA SCORECARD – SEPTEMBER 2009 – PAGE 10
DROPPED TRIPS REPORT ORANGE LINE
92.0%
93.0%
94.0%
95.0%
96.0%
97.0%
98.0%
99.0%
100.0%
101.0%
102.0%
103.0%
104.0%
Jun-04 Dec-04 Jun-05 Dec-05 Jun-06 Dec-06 Jun-07 Dec-07 Jun-08 Dec-08 Jun-09
August 2009: 99.7%
The Orange Line has gradually increased the number of scheduled trips run, due in large part to improved maintenance.
GREEN LINE
92.0%
93.0%
94.0%
95.0%
96.0%
97.0%
98.0%
99.0%
100.0%
101.0%
102.0%
103.0%
104.0%
Jun-04 Dec-04 Jun-05 Dec-05 Jun-06 Dec-06 Jun-07 Dec-07 Jun-08 Dec-08 Jun-09
August 2009: 103.2%
Green Line has increased the percentage of scheduled trips that are operated and now most often runs more, rather than fewer, than the number of scheduled trips. This was done through an improvement in vehicle reliability, particularly with improvements to the low-floor accessible "Type 8" trolleys, and the addition of standby trains.

MBTA SCORECARD – SEPTEMBER 2009 – PAGE 11
DROPPED TRIPS REPORT BLUE LINE
92.0%
93.0%
94.0%
95.0%
96.0%
97.0%
98.0%
99.0%
100.0%
101.0%
102.0%
103.0%
104.0%
105.0%
106.0%
Jun-04 Dec-04 Jun-05 Dec-05 Jun-06 Dec-06 Jun-07 Dec-07 Jun-08 Dec-08 Jun-09
August 2009: 100.1%
The Blue Line has long used standby trains to provide extra service where possible, and usually operates more than the scheduled number of trips.

MBTA SCORECARD – SEPTEMBER 2009 – PAGE 12
BUS PERFORMANCE REPORT The strategy to minimize dropped trips is slightly different for bus than it is for subway. It is not possible to have a bus on standby on each of 200 bus routes, so standby buses are distributed strategically throughout the service area so they can get in position on one of many routes quickly. To keep them available for many routes they are not routinely used to provide extra service. Even then it is not always possible to fill every gap. When it’s not possible to operate every trip, Bus Operations works to minimize the impact to customers. If one route runs every 5 minutes and one route runs every hour, then missing a trip on the frequent route will have less of an impact than dropping a trip on the hourly route, so they will sometimes borrow a bus from a frequent route to cover a trip on an infrequent one. If a subway disruption makes it necessary to run an unscheduled shuttle with buses, Operations will mobilize many operators and buses as quickly as it can, including those on standby, those scheduled to go back to the garage for the night, and some of those on the most frequent bus routes. OVERALL BUS DROPPED TRIPS
97.0%
98.0%
99.0%
100.0%
101.0%
Jun-04 Dec-04 Jun-05 Dec-05 Jun-06 Dec-06 Jun-07 Dec-07 Jun-08 Dec-08 Jun-09
August 2009: 99.1%
The following pages show percentages of bus round trips run by garage and route in August 2009. Each bar reflects the number of scheduled trip by route. The green portion of each bar reflects the number of trips run while the red section reflects trips dropped. At the end of each bar is the number for percentage of trips run.
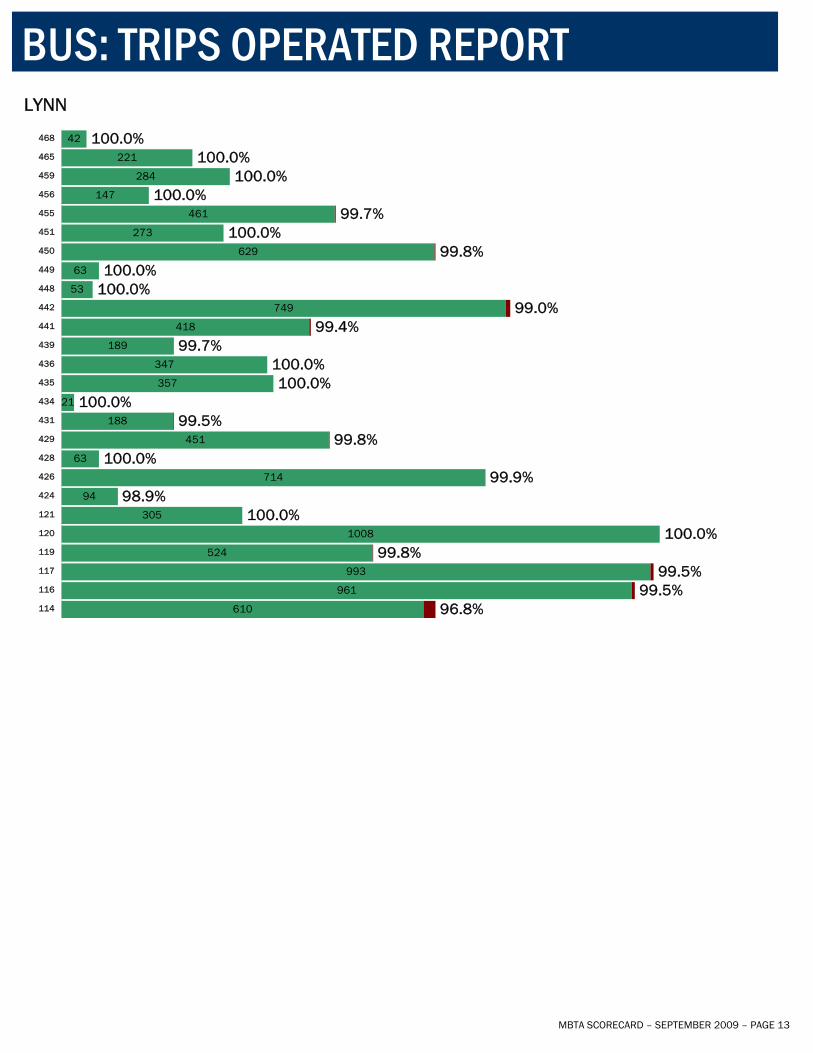
MBTA SCORECARD – SEPTEMBER 2009 – PAGE 13
BUS: TRIPS OPERATED REPORT LYNN
610
961
993
524
1008
305
94
714
63
451
188
21
357
347
189
418
749
53
63
629
273
461
147
284
221
42
96.8%99.5%
99.5%99.8%
100.0%100.0%
98.9%99.9%
100.0%99.8%
99.5%100.0%
100.0%100.0%
99.7%99.4%
99.0%100.0%100.0%
99.8%100.0%
99.7%100.0%
100.0%100.0%
100.0%
114
116
117
119
120
121
424
426
428
429
431
434
435
436
439
441
442
448
449
450
451
455
456
459
465
468

MBTA SCORECARD – SEPTEMBER 2009 – PAGE 14
BUS: TRIPS OPERATED REPORT CHARLESTOWN
1311419
787855
1514721
878792
396660
7971176
990398
880784
1154934
3189501502
377792
387366
11356356
179458
42373
440
98.3%99.8%
98.6%99.3%
94.2%99.5%
99.5%99.2%
99.2%99.8%
99.8%98.2%
98.2%99.7%
99.7%99.5%
98.1%98.8%
94.3%99.3%99.5%
99.6%99.2%
99.5%99.6%
100.0%99.7%99.6%
100.0%99.1%
100.0%98.7%
99.8%
89
90
91
92
93
94
95
96
97
99
100
101
104
105
106
108
109
110
111
112
131
132
134
136
137
194
325
326
352
354
355
411
430

MBTA SCORECARD – SEPTEMBER 2009 – PAGE 15
BUS: TRIPS OPERATED REPORT CABOT
2352377
1371894
10221809
8881453
20911218
1061377
7221868
2551146
22531443
12541365
971701
2581524
766689
1962422121
137961
619272
1027640
315294
95315
221719
1339731
98.7%99.7%
100.0%99.1%
99.3%99.0%
99.4%99.5%
98.6%99.1%
99.0%99.6%
99.7%98.8%
98.3%66.2%
98.9%99.6%
98.7%99.2%
99.4%99.6%
97.5%99.8%
99.9%99.4%
98.8%100.0%
100.0%100.0%
100.0%98.4%
99.9%99.5%
98.7%99.9%
100.0%100.0%
100.0%100.0%
100.0%99.2%
99.6%99.5%
145789
101115161718192223252843444547555759606566
170171193500501502503504505553554555556558CT1CT2CT3

MBTA SCORECARD – SEPTEMBER 2009 – PAGE 16
BUS: TRIPS OPERATED REPORT BENNETT
462
784
504
504
1056
1578
2276
985
2816
721
273
473
3426
932
859
829
970
242
462
1162
1086
1211
587
137
99.9%99.5%
100.0%100.0%
99.6%99.5%
99.4%99.8%
99.3%99.5%
100.0%100.0%
98.3%99.7%
95.1%99.9%
99.3%100.0%
100.0%99.7%
99.5%98.5%
99.7%100.0%
62
64
67
68
69
70
71
72
73
74
75
76
77
78
79
80
83
84
85
86
87
88
350
351

MBTA SCORECARD – SEPTEMBER 2009 – PAGE 17
BUS: TRIPS OPERATED REPORT ARBORWAY
430
1287
712
1088
494
844
826
1999
3585
461
2271
833
1128
751
692
515
763
1184
262
597
630
440
21
21
11
99.9%99.6%
99.6%99.6%
100.0%99.2%99.6%
99.1%98.7%
99.8%98.3%
99.2%99.5%
99.3%99.9%
100.0%99.5%
99.7%99.8%
99.7%100.0%
99.7%100.0%100.0%100.0%
14
21
24
26
27
29
30
31
32
33
34
35
36
37
38
40
41
42
48
50
51
52
191
192
249
SOUTHAMPTON
2673
2258
2940
1596
3526
99.0%
100.0%
100.0%
100.0%
99.9%
39
Waterfront SL1
Waterfront SL2
Waterfront trunk
Washington Street

MBTA SCORECARD – SEPTEMBER 2009 – PAGE 18
BUS: TRIPS OPERATED REPORT QUINCY
914
735
504
441
210
672
672
944
200
945
84
878
1259
587
336
504
1018
336
933
252
189
11
100.0%100.0%
99.9%100.0%
100.0%100.0%100.0%
99.9%100.0%
100.0%100.0%
99.5%99.9%
99.8%100.0%
100.0%100.0%
100.0%99.8%
100.0%100.0%
100.0%
201
202
210
211
212
214
215
216
217
220
221
222
225
230
236
238
240
245
274
275
276
277
\

MBTA SCORECARD – SEPTEMBER 2009 – PAGE 19
MAINTENANCE PERFORMANCE REPORT Mean Miles Between Failures (MMBF) is an industry-standard measurement of vehicle reliability. It measures the average number of miles a vehicle travels between breakdowns. If one vehicle travels 5,000 miles in a month, and breaks down twice during that time, that vehicle has an MMBF of 2,500. Higher numbers are better. The values can fluctuate greatly from month to month because just one or two failures will make a big difference when the total number of failures is already low. High MMBF is achieved through ongoing vehicle maintenance, which includes everything from oil changes to major midlife overhauls, and by periodically buying new vehicles to replace old ones as they reach the end of their useful life. Vehicle maintenance constantly analyzes trends and works to engineer solutions to mechanical problems to keep all vehicles running as reliably as possible. Bus
0
2,000
4,000
6,000
8,000
10,000
12,000
August 2009: 5 ,445
Goal: 6,000
The MBTA changed the methodology used for calculating bus MMBF in April 2006 to only include failures that resulted in a customer impact (i.e. failing to run a trip.) If an engine overheated and a bus had to be taken out of service, that would count as a failure. If the wheelchair ramp’s motor stopped working and the operator had to operate the ramp by hand that would not. In July 2007 the MBTA adopted a more aggressive goal for MMBF reflecting the replacement of many older buses with newer ones and a general improvement in reliability. Since then the MBTA has exceeded its goal most months. The MBTA has begun the mid-life overhaul of 298 CNG-powered buses to keep them in peak operating condition for the second half of their life. Since entering service in 2003 these buses have operated a total of over 40 million miles. This rehabilitation includes overhauls of the engine, transmission, fuel system, air conditioning, axles, suspension and brakes; as well as bodywork, electrical work, and painting.

MBTA SCORECARD – SEPTEMBER 2009 – PAGE 20
MAINTENANCE PERFORMANCE REPORT Blue Line
0
10,000
20,000
30,000
40,000
50,000
60,000
70,000
80,000
90,000
100,000
August 2009: 15,713
Goal: 26,000
The Blue Line is in the midst of phasing out 30-year-old trains with brand new ones, enabling six-car-long trains for the first time in the Blue Line’s history. In the long run this will improve Blue Line reliability, but in the short term while the bugs are worked out of the new trains there may be periods when the new trains do not perform as reliably as the old ones. No matter how much testing is done on trains under simulated conditions, operating them in revenue service for over 100 miles every day will tax the trains more and reveal problems that had been missed. The MBTA and the vendor are working together to identify trends and make modifications to improve reliability. Orange Line
0
20,000
40,000
60,000
80,000
100,000
120,000
August 2009: 30,673
Goal: 32,000
Orange Line trains are about 30 years old, and are kept running reliably through pro-active and attentive maintenance. The highly skilled and knowledgeable maintenance staff is able to meet MMBF requirements by following the historical and effective maintenance programs. New trains are anticipated to replace the current fleet in 2015.

MBTA SCORECARD – SEPTEMBER 2009 – PAGE 21
MAINTENANCE PERFORMANCE REPORT Red
0
10,000
20,000
30,000
40,000
50,000
60,000
70,000
80,000
90,000
August 2009: 50,045
Goal: 39,000
Red Line trains are between 15 and 40 years old, and are kept running reliably through pro-active and attentive maintenance. New trains to replace part of the fleet are anticipated to enter service in 2018. Staff is increasingly shifting attention to preventive maintenance (as opposed to corrective maintenance to address problems that have occurred). Current initiatives include an overhaul project for the “#2 cars,” which will restore a number of vital system components to as-new condition. Planned overhauls of selected components of the #1 cars and #3 cars are expected to greatly improve their reliability as well. With the planned maintenance improvements, programs and procedures, MMBF on the Red Line should continue to improve. Green
0
2,000
4,000
6,000
8,000
10,000
12,000
August 2009: 4 ,472
Goal: 5,500
Green Line trolleys range in age from just a couple years old to 25 years old. New trolleys are anticipated to increase the fleet size in late 2014 in order to support the planned Somerville / Medford extension of the Green Line. The MBTA anticipates replacing part of the existing Green Line fleet in late 2019. The low-floor accessible “Type 8” trolleys had a number of reliability problems when they first entered service, which led to a decrease in overall Green Line MMBF. In December 2005 the MBTA reached an agreement with the manufacturer that included reengineering problem areas to improve reliability. As the improvements were implemented they led to an increase in reliability, and the Green Line is now more reliable than before the Type 8 trolleys were introduced. MMBF on the Green Line is projected to improve in 2010 through several projects: the overhaul of selected systems on the older “Type 7” trolleys in mid 2010; preventive maintenance upgrades to air compressor and

MBTA SCORECARD – SEPTEMBER 2009 – PAGE 22
brake system on the Type 8 trolleys; and improvements to the effectiveness and efficiency of the Green Line workforce for routine corrective and preventive maintenance activities. All issues that delay or interrupt service on any line are thoroughly investigated by managers and engineers in order to identify and implement the best solutions. Commuter Rail
0
2,000
4,000
6,000
8,000
10,000
12,000
14,000
16,000
18,000
August 2009: 5 ,954
Goal: 10,200
The Commuter Rail Fleet is comprised of eighty locomotives ranging in age from 6 to 30 years, as well as four hundred and ten coaches. New locomotives to replace part of the fleet are scheduled to enter service in 2014. Locomotive maintenance requires preventative maintenance, corrective maintenance, mid-life overhauls, and engine overhauls. There is currently an ongoing engine overhaul of twenty-five locomotives. Railroad Operations is currently reviewing the maintenance practices of the Massachusetts Bay Commuter Railroad Company (MBCR), who operates Commuter Rail service for the MBTA under contract. Strict adherence to all manufacturer-recommended maintenance practices, policies, and procedures will improve the reliability of the locomotive fleet.
MAINTENANCE PERFORMANCE REPORT

MBTA SCORECARD – SEPTEMBER 2009 – PAGE 23
Heavy Rail: NTD Related Passenger Accidents/Incidents per 100,000 miles
0.1210
0.1020
0.0420
0.0572 0.0582
0.0489
0.0382
0.0000
0.0200
0.0400
0.0600
0.0800
0.1000
0.1200
0.1400
Jan-2009 Feb-2009 Mar-2009 Apr-2009 May-2009 Jun-2009 Jul-2009
The MBTA Safety Department exists to maximize the safety of MBTA customers and employees through the design, implementation, support, and oversight of safe work practices. The success of this mission will ultimately enhance customer, employee, and public safety. The safety department develops and implements safety plans and programs, performs safety audits, and maintains safety guidelines through employee training. Additionally, the Safety Department tracks all accidents and incidents on the T. The Safety Department is responsible for reporting all required safety and security data to the National Transit Database (NTD) and the Department of Public Utilities (DPU). This data is utilized by the MBTA to measure safety on the T and by the FTA to track accident/incident trends in the industry. The following charts show the number of accidents/incidents that occur on the MBTA by month in 2009. The numbers used were those reported to the NTD for each month. For a full listing of NTD reportable incidents visit: http://www.ntdprogram.gov/ntdprogram/. The charts show the number of accidents per 100,000 miles traveled by passenger on the MBTA. For safety purposes it allows us to take our safety record and compare it across our own modes and other services because it lets you put everything on a common and customer-centric baseline. (If a much smaller bus system somewhere else has 5 accidents a month, and we have 6 in our bus system, that doesn't mean their system is safer than ours because we're providing a lot more service in the first place.) For comparison, in the United States in 2008 there were about 0.2 auto accidents per 100,000 vehicle-miles traveled.
In order to minimize accidents/incidents on the Heavy Rail system, the Safety Department has taken the following measures:
• Performs routine safety audits of all transit stations to note and correct safety hazards. • Increase the number of track and platform audits. • Perform audit of Tunnel lighting. • Establish a zero tolerance policy pertaining to use of cell phones and all other electronic devices while
operating an MBTA vehicle.
SPOTLIGHT ON SAFETY
MBTA SCORECARD – SEPTEMBER 2009 – PAGE 24
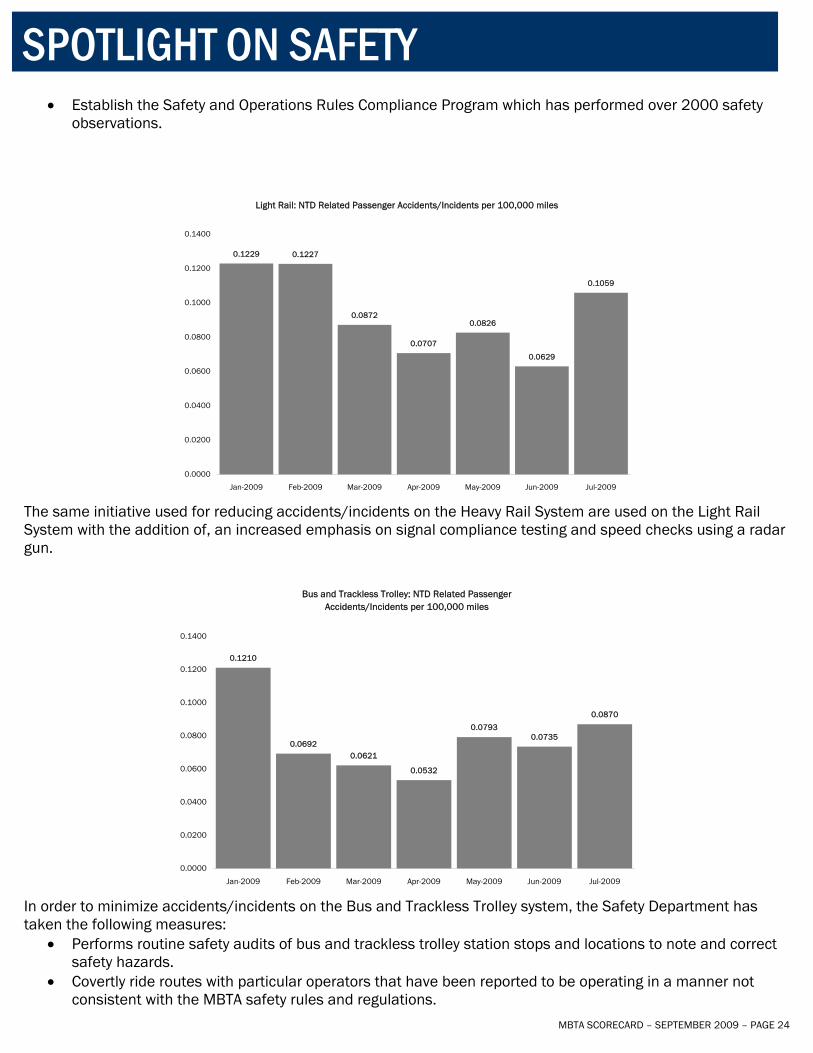
• Establish the Safety and Operations Rules Compliance Program which has performed over 2000 safety observations.
Light Rail: NTD Related Passenger Accidents/Incidents per 100,000 miles
0.1229 0.1227
0.0872
0.0707
0.0826
0.0629
0.1059
0.0000
0.0200
0.0400
0.0600
0.0800
0.1000
0.1200
0.1400
Jan-2009 Feb-2009 Mar-2009 Apr-2009 May-2009 Jun-2009 Jul-2009
The same initiative used for reducing accidents/incidents on the Heavy Rail System are used on the Light Rail System with the addition of, an increased emphasis on signal compliance testing and speed checks using a radar gun.
Bus and Trackless Trolley: NTD Related Passenger Accidents/Incidents per 100,000 miles
0.1210
0.06920.0621
0.0532
0.07930.0735
0.0870
0.0000
0.0200
0.0400
0.0600
0.0800
0.1000
0.1200
0.1400
Jan-2009 Feb-2009 Mar-2009 Apr-2009 May-2009 Jun-2009 Jul-2009
In order to minimize accidents/incidents on the Bus and Trackless Trolley system, the Safety Department has taken the following measures:
• Performs routine safety audits of bus and trackless trolley station stops and locations to note and correct safety hazards.
• Covertly ride routes with particular operators that have been reported to be operating in a manner not consistent with the MBTA safety rules and regulations.
SPOTLIGHT ON SAFETY

MBTA SCORECARD – SEPTEMBER 2009 – PAGE 25
• Routinely visit our bus and facilities to speak with employees to offer our assistance on any issue that they may have and feel is safety related and needs to be corrected (IE. additional signage, filling potholes).
• Established a zero tolerance policy pertaining to use of cell phones and all other electronic devices while operating an MBTA vehicle.
SPOTLIGHT ON SAFETY