mbti relationships and self-report questionnaire scale scores
TRANSCRIPT

“
ABSTRACTType interactions were examined for the scale scores ofthree self-report questionnaires: the Individual TalentSurvey—a DISC instrument, the Guilford-ZimmermanTemperament Survey, and the Orientation Inventory. Asexpected, significant interactions occurred primarily atthe level of the two-way interactions, i.e., the Pairs, andthese interactions often included embedded effects forthe preferences on the Myers-Briggs Type Indicator®
(MBTI®) instrument. The results demonstrated theprimacy of the preferences on the MBTI instrument,with the interactions almost always secondary to them.
Consistent with other research, the present findingsincluded many significant effects for the individualpreferences and two-way interactions, diminishedeffects for the three-way interactions, and impover-ished, i.e., inconsequential, effects for the four-wayinteractions, i.e., the whole types.
INTRODUCTIONAlthough the interactive nature of type is fundamentalfor type theory, relatively little research has examinedtype interactions. Theoretically, each individual combi-nation and type represents a unique configuration in
Type Interactions: MBTI® Relationships and Self-Report Questionnaire Scale ScoresJJaammeess HH.. RReeyynniieerrsseeReynierse Associates
JJoohhnn BB.. HHaarrkkeerrThe Harker Organization
64Journal of Psychological Type®
Issue 6a JUN 05
”
Over twenty-five years of publishing research articles related to the theory andapplications of psychological type and the Myers-Briggs Type Indicator® instrument.
Published by the Center for Applications of Psychological TypeThomas G. Carskadon, Ph.D., Editor
C A P T
Research with self-report questionnaire scale scores as thedependent variables produced several type interactions, primarily at the level of the two-way interactions. Type interactions wereusually secondary to the preferences, demonstrating the importanceand primacy of the MBTI® preferences.
Journal of Psychological Type®, Volume 64, June 2005
which the whole is greater than the sum of the parts,i.e., the effects for any combination and type reflectadditional meaning that extends beyond any additiverelationship of the individual preferences (e.g., Myers,1962; Reynierse, 2000; Reynierse &Harker, 2000).
Reynierse (2000) proposed asynthesis of the Five Factor Model(FFM) and type theory in which thedirection of type combinations isfrom the least complex to morecomplex forms. This position identi-fied the dichotomous preferences asthe fundamental unit of analysis fortype combinations and redirectedattention away from the four-wayinteraction and whole types (e.g.,Hammer, 1998; Myers, McCaulley, Quenk, & Hammer,1998) to the two-way interactions or Pairs. From thisperspective, the locus of primary, interactive type effectsoccurs at the most basic interactive level, i.e., for thetwo-way interactions, with higher-order combinationsaccounting for reduced levels of additional variance(Reynierse).
Research on the structure of personality has oftenrelied on the natural language terms used to describepeople (e.g., John, 1990). Reynierse and Harker (2000,2001) used this lexical approach to examine typeinteractions based on the MBTI instrument. An alterna-tive research strategy for personality research uses self-report questionnaires (John), an approach that also hasbeen used for type research (e.g., Hester, 1996;Johnson, 1997). Questionnaire scales often includemultiple concepts (factors) that are relatively complexcompared to lexical trait descriptors (John). In view of Mitchell’s (1995) suggestion that the eight MBTIpreferences can be viewed as multifaceted constructsthat include many separate aspects, or facets, and theextension of this analysis to the selection of dependentvariables for testing the interactions in type theory(Myers et al., 1998), questionnaire scale scores areparticularly attractive dependent variables for typeresearch.
In the present research, two studies examined therelationship of the MBTI measure and type interactionsfor the scale scores of three separate personalityquestionnaires. In the first study, MBTI preferences andtheir interactions were examined for the scale scores ofthe Individual Talent Survey, a DISC-type instrument
(ITS Manual, 1976). In the second study, MBTI prefer-ences and their interactions were examined for the scalescores of the Guilford-Zimmerman TemperamentSurvey (Guilford, Guilford, & Zimmerman, 1978;
Guilford, Zimmerman, & Guilford,1976) and for the OrientationInventory (Bass, 1977). Both studiesinvestigated the implications ofReynierse’s (2000) synthesis of theFFM with type theory, specifically,that the locus of primary, interactivetype effects occurs at the most basicinteractive level (for the two-wayinteractions). Secondarily, question-naire scale scores were selected and examined as exemplars of multi-faceted dependent variables that are
congruent with Mitchell’s (1995) view of themultifaceted character of psychological type.
STUDY 1DISC measures of personality have their origins in thework of Marston (1928), who developed a model of four distinctive forms of human emotion, and thelater construction of Activity Vector Analysis by Clarke(Clarke, 1956; Merenda & Clarke, 1959, 1968), a measurement system based on this model. Cleaver (see Reynierse, Ackerman, Fink, & Harker, 2000)introduced the DISC terminology and an alternative,forced-choice approach, for measuring thesedimensions.
In general, the theoretical structure and back-ground for DISC is less formal than for the MBTIinstrument, and DISC has nowhere near either theresearch base or the theoretical base of the MBTI tool.DISC is attractive, however, because of its frequent use within business organizations, the implieddichotomization and bipolarity of its four dimensions,and its complementarity to the MBTI measure.Reynierse et al. (2000) provided an overview of DISCmeasures of personality.
METHODParticipants. The sample consisted of 382 individuals,277 men (72.5%) and 105 women (27.5%), who com-pleted either the Expanded Analysis Report (EAR, i.e.,MBTI instrument Form K) or MBTI instrument Form F,and the Individual Talent Survey, a DISC instrument.Individual cases came from organizations in business
58
”“Although the interactive
nature of type isfundamental for type theory, relatively littleresearch has examined
type interactions.

Type Interactions: MBTI® Relationships and Self-Report Questionnaire Scale Scores
and industry and reflect a variety of business situations.All of these individuals were managers, entrepreneurs,or professionals primarily within private sector, businessorganizations. The type distribution for this sample issummarized in Table 1 (SEE PAGE 60).
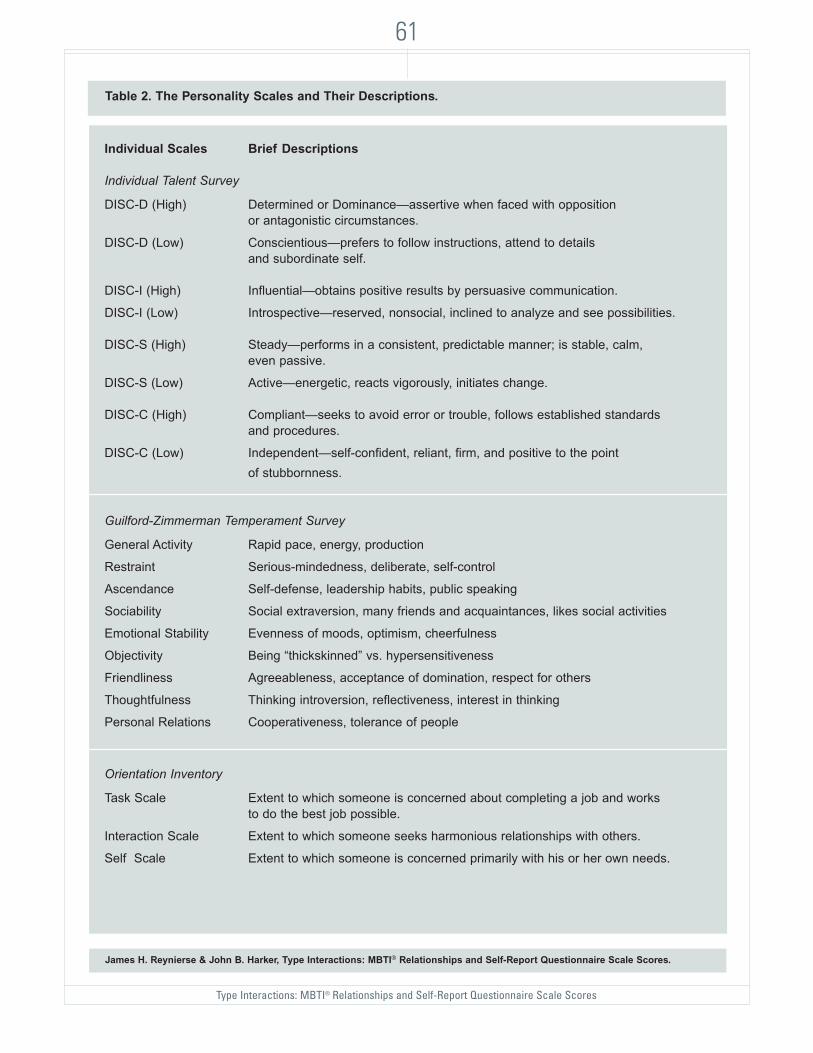
Measure. The high end of each scale usuallyidentifies the four DISC scales. However, each scale hasimplicit bipolarity in which relatively high and lowscores for each dimension are usually referred to as“High” or “Low,” e.g., High D or Low D, but in fact areopposite categories with separate definitions (Reynierseet al., 2000). Descriptions of the DISC scales aresummarized in Table 2 (SEE PAGE 61).
Procedure. Participants completed both the MBTIinstrument and the Individual Talent Survey (ITS), aDISC measure of personality (ITS Manual, 1976).Individual dichotomous preference scale scores on theMBTI measure were converted to continuous scalescores as is necessary for correlation and regressionanalyses (Myers & McCaulley, 1985). With this conver-sion, scores less than 100 indicate a preference for thefirst letter of each preference pair (E, S, T, and J),whereas scores greater than 100 indicate a preferencefor the second, opposite letter (I, N, F, and P). In orderto generate scores for the interaction terms, individualcontinuous scores were multiplied for each MBTI com-bination or interaction as is necessary for hierarchicalregression. For example, for the E–I X S–N interaction,each individual’s E–I continuous score was multipliedby his or her S–N continuous score.
Analysis of the DISC dependent variables took twoforms. First, and most simply, each of the four DISCscales was analyzed separately, i.e., analysis reflectedperformance and strength of response on a particularscale. However, DISC scale scores have implied bipolar-ity in which the “profile shape” and relative position ofthe scales to each other are important. Determining the profile shape provides relative numerical weightsranging from 1 to 9, which in turn identify the degreeto which each individual DISC scale score is low (1–4),at one’s personal midpoint (5), or high (6–9), relative toeach other. Thus, the second analysis was based on theconverted scores that described the DISC profile shapeand the dichotomization of scale scores into high and low DISC categories (ITS Manual, 1976). Twoindependent raters, whose judgments were brought intoharmony by review of the differences and consensualagreement, determined individual profile shapes.
A regression model was constructed that included
59
the 4 main effects, 6 two-way interactions, 4 three-wayinteractions, and the four-way interaction that occur for the MBTI preferences and their combinationsembedded in the types. A forward stepwise hierarchicalregression analysis was performed on each of theseparate DISC scale scores and on the converted DISCscale scores that described the profile shape, using theCSS: Statistica statistical analysis package (CSS: StatisticaManual, 1995). Thus, for each dependent variable, the15 terms in the regression equation were analyzed insuccessive steps, i.e., the main effects were entered first,followed by the simple interactions, and the morecomplex interactions. In addition, analysis of theresiduals determined the percentage of varianceuniquely accounted for by significant main effects orinteractions. Significant interactions were analyzedfurther by visual inspection of the plotted data, one-wayanalysis of variance (ANOVA), and individual meanscompared by Duncan’s critical range tests. In each case,effects for the individual preferences were confirmed byt tests.
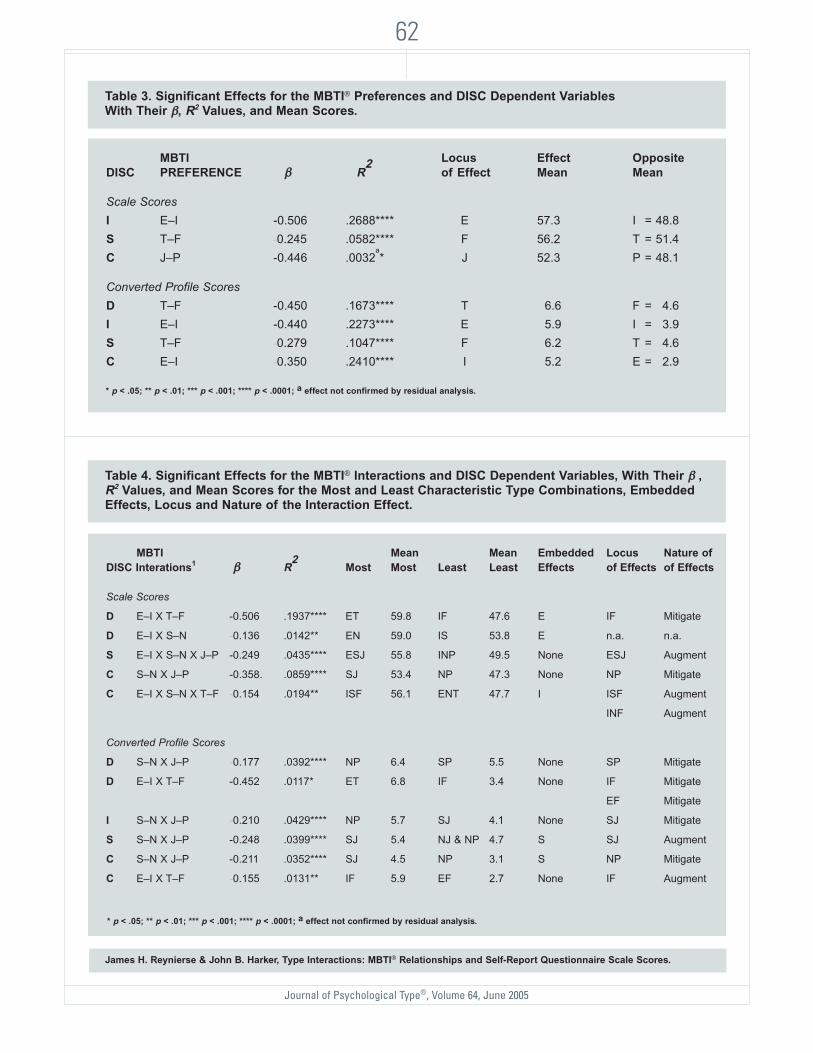
RESULTSThe significant effects for the MBTI preferences andinteractions are summarized in TABLES 3 and 4 (SEE
PAGE 62), respectively. The significant preference effectswere unambiguous and accounted for 5.8 to 26.9% ofthe type-related variance. Two of the DISC scale scoresshowed clear preference effects, as high DISC I and Sscores were significantly associated with MBTI scale Eand F scores, respectively. DISC relationships to thepreferences were clearer for the converted DISC profile scores, as high D, I, S, and C profile scores weresignificantly associated with MBTI scale T, E, F, and Ipreference scores, respectively.
Significant interactions occurred more frequentlyat the locus of the two-way interactions. Three-wayinteractions occurred only for DISC scale scores (Table4), and no significant four-way interactions were found.
Interpretation of interactions is more complexthan for main effects. Thus, two-way interactions occuracross two variables, with the locus of the effect—forthe current interactions—usually identified with asingle Pair, reflecting the ordinal nature of these interac-tions in which the rank order of effects remainedconstant and variables did not intersect (Pedhazur,1982). In addition, the interaction can augment, i.e.,magnify or enhance the effect, or mitigate, i.e., decreaseor lessen it, depending on the direction of the

Journal of Psychological Type®, Volume 64, June 2005
60
The Sixteen Complete Types
ISTJ ISFJ INFJ INTJn = 47 n = 9 n = 9 n = 44(12.3%) (2.4%) (2.4%) (11.5%)+ + + + + + + + + + + + + + ++ + + + + + + + + + ++ + + +
ISTP ISFP INFP INTPn = 15 n = 6 n = 15 n = 24(3.9%) (1.6%) (3.9%) (6.3%)+ + + + + + + + + + + + + + +
+
ESTP ESFP ENFP ENTPn = 14 n = 7 n = 31 n = 45(3.7%) (1.8%) (8.1%) (11.8%)+ + + + + + + + + + + + + + + +
+ + + + + + + ++ +
ESTJ ESFJ ENFJ ENTJn = 53 n = 10 n = 9 n = 44(13.9%) (2.6%) (2.4%) (11.5%)+ + + + + + + + + + + + + + ++ + + + + + + + + ++ + + + + +
Dichotomous Preferences
E n = 213 (55.8%)I n = 169 (44.2%)
S n = 161 (42.2%)N n = 221 (57.8%)
T n = 286 (74.9%)F n = 296 (25.1%)
J n = 225 (58.9%)P n = 157 (41.1%)
Pairs and Temperaments
IJ n = 109 (28.5%)IP n = 160 (15.7%)EP n = 197 (25.4%)EJ n = 116 (30.4%)
ST n = 129 (33.8%)SF n =1 32 (58.4%)NF n = 164 (16.8%)NT n = 157 (41.1%)
SJ n = 119 (31.2%)SP n = 142 (11.0%)NP n = 115 (30.1%)NJ n = 106 (27.8%)
TJ n = 188 (49.2%)TP n = 198 (25.6%)FP n = 159 (15.4%)FJ n = 137 (59.7%)
IN n = 192 (24.1%)EN n = 129 (33.8%)IS n = 177 (20.2%)ES n = 184 (22.0%)
ET n = 156 (40.8%)EF n = 157 (14.9%)IF n = 139 (10.2%)IT n = 130 (34.0%)
James H. Reynierse & John B. Harker, Type Interactions: MBTI® Relationships and Self-Report Questionnaire Scale Scores.
Jungian Types (E) Jungian Types (I) Dominant Types
n % n % n %E–TJ 97 25.4 I–TP 39 10.2 Dt. T 136 35.6E–FJ 19 5.0 I–FP 21 5.5 Dt. F 40 10.5ES–P 21 5.5 IS–J 56 14.7 Dt. S 77 20.2EN–P 76 19.9 IN–J 53 13.9 Dt. N 129 33.8
Table 1. Type Distribution of the Study 1 (DISC) Sample.
N = 382 + = 1% of N I = Selection Ratio Index *p<.05 **p<.01 ***p<.001
Type Interactions: MBTI® Relationships and Self-Report Questionnaire Scale Scores
61
Individual Scales Brief Descriptions
Individual Talent Survey
DISC-D (High) Determined or Dominance—assertive when faced with opposition or antagonistic circumstances.
DISC-D (Low) Conscientious—prefers to follow instructions, attend to details and subordinate self.
DISC-I (High) Influential—obtains positive results by persuasive communication.
DISC-I (Low) Introspective—reserved, nonsocial, inclined to analyze and see possibilities.
DISC-S (High) Steady—performs in a consistent, predictable manner; is stable, calm, even passive.
DISC-S (Low) Active—energetic, reacts vigorously, initiates change.
DISC-C (High) Compliant—seeks to avoid error or trouble, follows established standards and procedures.
DISC-C (Low) Independent—self-confident, reliant, firm, and positive to the point of stubbornness.
Guilford-Zimmerman Temperament Survey
General Activity Rapid pace, energy, production
Restraint Serious-mindedness, deliberate, self-control
Ascendance Self-defense, leadership habits, public speaking
Sociability Social extraversion, many friends and acquaintances, likes social activities
Emotional Stability Evenness of moods, optimism, cheerfulness
Objectivity Being “thickskinned” vs. hypersensitiveness
Friendliness Agreeableness, acceptance of domination, respect for others
Thoughtfulness Thinking introversion, reflectiveness, interest in thinking
Personal Relations Cooperativeness, tolerance of people
Orientation Inventory
Task Scale Extent to which someone is concerned about completing a job and works to do the best job possible.
Interaction Scale Extent to which someone seeks harmonious relationships with others.
Self Scale Extent to which someone is concerned primarily with his or her own needs.
James H. Reynierse & John B. Harker, Type Interactions: MBTI® Relationships and Self-Report Questionnaire Scale Scores.
Table 2. The Personality Scales and Their Descriptions.
Journal of Psychological Type®, Volume 64, June 2005
62
James H. Reynierse & John B. Harker, Type Interactions: MBTI® Relationships and Self-Report Questionnaire Scale Scores.
Table 3. Significant Effects for the MBTI® Preferences and DISC Dependent Variables With Their ββ, R2 Values, and Mean Scores.
MBTI Locus Effect OppositeDISC PREFERENCE ββ R
2of Effect Mean Mean
Scale Scores I E–I -0.506 .2688**** E 57.3 I = 48.8S T–F -0.245 .0582**** F 56.2 T = 51.4C J–P -0.446 .0032
a* J 52.3 P = 48.1
Converted Profile ScoresD T–F -0.450 .1673**** T 6.6 F = 4.6I E–I -0.440 .2273**** E 5.9 I = 3.9S T–F -0.279 .1047**** F 6.2 T = 4.6C E–I -0.350 .2410**** I 5.2 E = 2.9
* p < .05; ** p < .01; *** p < .001; **** p < .0001; a effect not confirmed by residual analysis.
Table 4. Significant Effects for the MBTI® Interactions and DISC Dependent Variables, With Their ββ ,R2 Values, and Mean Scores for the Most and Least Characteristic Type Combinations, EmbeddedEffects, Locus and Nature of the Interaction Effect.
MBTI Mean Mean Embedded Locus Nature ofDISC Interations1 ββ R
2Most Most Least Least Effects of Effects of Effects
Scale Scores
D E–I X T–F -0.506 .1937**** ET 59.8 IF 47.6 E IF Mitigate
D E–I X S–N -0.136 .0142** EN 59.0 IS 53.8 E n.a. n.a.
S E–I X S–N X J–P -0.249 .0435**** ESJ 55.8 INP 49.5 None ESJ Augment
C S–N X J–P -0.358. .0859**** SJ 53.4 NP 47.3 None NP Mitigate
C E–I X S–N X T–F -0.154 .0194** ISF 56.1 ENT 47.7 I ISF Augment
INF Augment
Converted Profile Scores
D S–N X J–P -0.177 .0392**** NP 6.4 SP 5.5 None SP Mitigate
D E–I X T–F -0.452 .0117* ET 6.8 IF 3.4 None IF Mitigate
EF Mitigate
I S–N X J–P -0.210 .0429**** NP 5.7 SJ 4.1 None SJ Mitigate
S S–N X J–P -0.248 .0399**** SJ 5.4 NJ & NP 4.7 S SJ Augment
C S–N X J–P -0.211 .0352**** SJ 4.5 NP 3.1 S NP Mitigate
C E–I X T–F -0.155 .0131** IF 5.9 EF 2.7 None IF Augment
* p < .05; ** p < .01; *** p < .001; **** p < .0001; a effect not confirmed by residual analysis.

63
Type Interactions: MBTI® Relationships and Self-Report Questionnaire Scale Scores
exaggerated effect.1 For example, converted DISC Sprofile scores (TABLE 4) varied along an SJ–NJ/NPdimension, with the locus of the interactive effect at theSJ Pair, where it had an augmenting effect. By contrast,converted DISC D profile scores varied along an SP–NPdimension, with the locus of the interactive effect at theSP Pair, where it had a mitigating effect.
Finally, significant interactions indicate that theadditive model has failed, and it is impossible to obtainunbiased estimates of the main effects (Lubin, 1961).Further analyses based on one-way ANOVA and a com-parison of individual means (Lubin), identified severalsignificant effects for the preferences that were embed-ded in the interactions, i.e., were not previously identi-fied by hierarchical regression, and that were obviousupon inspecting the plotted data for these interactions.These embedded preference effects are also summarizedin TABLE 4.
Although each significant interaction accounted
for 1.3 to 19.4% of type-related variance, the embeddedpreference effects summarized in TABLE 4 compromisethese effects. For example, for DISC D scale scores, thesignificant E–I X T–F interaction had an R2 = .1937 butalso included an embedded effect for the E preference.Examination of the Pair means indicates that a portionof this variance estimate for the interaction included this E–I preference effect.1 Considering all the type-related variance identified in these analyses, the MBTIpreferences accounted for 47.8% of scale score and80.3% of the converted profile score variance. Bycontrast, collectively the interactions accounted for52.2% of scale score and 19.7% of the converted profilescore variance. However, the variance estimates areclearly underestimated for the preferences and over-stated for the interactions, because variance estimatesfor the interactions included embedded main effects for the preferences alone (TABLE 4). The mean scores for significant interactions are presented in TABLE 5.
James H. Reynierse & John B. Harker, Type Interactions: MBTI® Relationships and Self-Report Questionnaire Scale Scores.
Table 5. Effects (Means) for All Significant Interactions for the Individual Talent Survey DISC ScaleScores and Converted DISC Profile Scores, With Locus of Effect in Bold.
Measurement MBTIScale Interaction Pair (or Triad) Mean Scores
Individual Talent Survey DISC Scale ScoresDISC D E–I X T–F ET = 59.8 EF = 56.6 IT = 56.2 IF = 47.6DISC D E–I X S–N ES = 58.9 EN = 59.0 IS = 53.8 IN = 54.6DISC C S–N X J–P SJ = 53.4 SP = 50.3 NJ = 51.0 NP = 47.3
DISC S E–I X S–N X J–P ESJ = 55.8 ESP = 50.5 ENJ = 54.5 ENP = 50.9ISJ = 54.2 ISP = 54.4 INJ = 49.6 INP = 49.5
DISC C E–I X S–N X T–F EST = 51.2 ESF = 51.3 ENT = 47.7 ENF = 48.3IST = 53.7 ISF = 56.1 INT = 50.0 INF = 53.0
Converted Profile ScoresDISC D S–N X J–P SJ = 6.1 SP = 5.5 NJ = 6.2 NP = 6.4DISC D E–I X T–F ET = 6.8 EF = 5.5 IT = 6.5 IF = 3.4DISC I S–N X J–P SJ = 4.1 SP = 5.3 NJ = 5.1 NP = 5.7DISC S S–N X J–P SJ = 5.4 SP = 5.2 NJ = 4.7 NP = 4.7DISC C S–N X J–P SJ = 4.5 SP = 4.1 NJ = 4.0 NP = 3.1DISC C E–I X T–F ET = 3.0 EF = 2.7 IT = 4.9 IF = 5.9

Journal of Psychological Type®, Volume 64, June 2005
STUDY 2The rationale for this study was identical to that ofStudy 1, but Study 2 explored the generality ofinteractive type effects with a different set of self-reportquestionnaires, the Guilford-Zimmerman TemperamentSurvey (GZTS) and the Orientation Inventory.
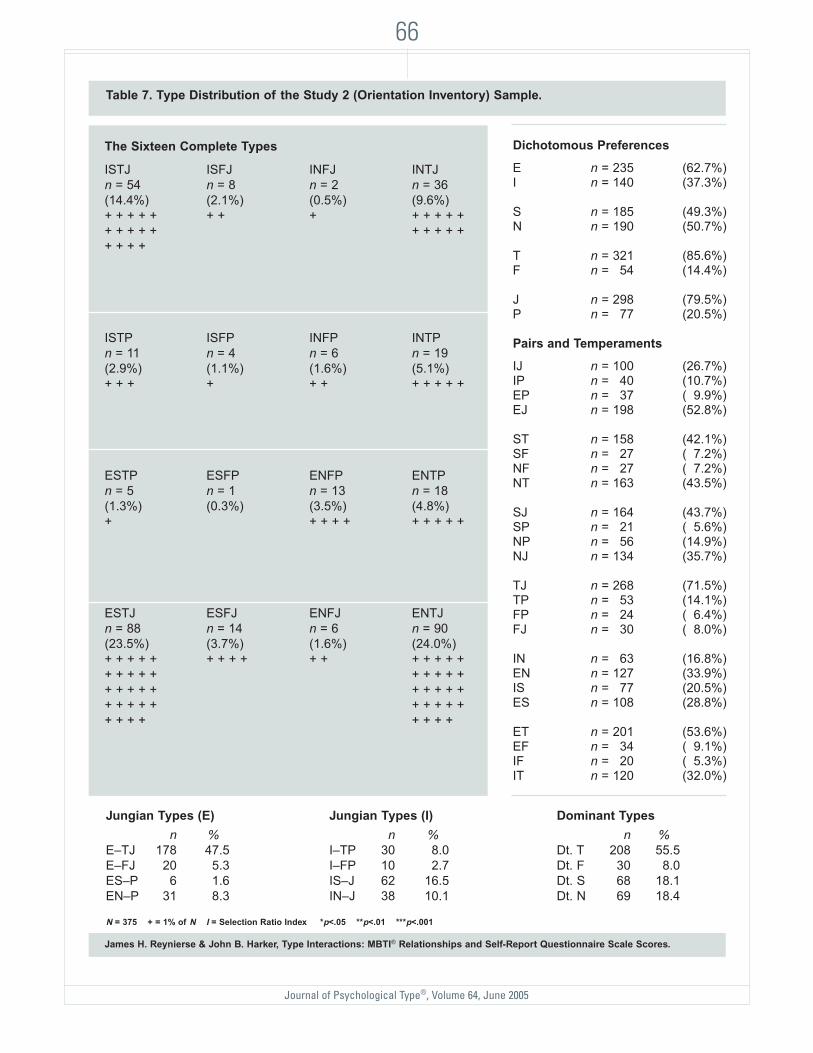
METHODParticipants. One sample consisted of 456 individu-als, 419 men (91.9%) and 37 women (8.1%), whocompleted either MBTI instrument Form F or G and theGZTS. A related sample consisted of 375 individuals,343 men (91.5%) and 32 women (8.5%), whocompleted either MBTI instrument Form F or G and theOrientation Inventory. Individual cases came fromorganizations in business and industry and reflect avariety of business situations. All participants weremanagement trainees, managers, executives, or profes-sionals primarily within private sector, business organi-zations. The type distribution for the GZTS andOrientation Inventory samples are summarized inTABLES 6 AND 7 (SEE PAGES 65 AND 66), respectively.
GZTS and Orientation Inventory Measuresof Personality. The GZTS includes 10 scales, of whichthe Masculinity Scale was not scored. Descriptions ofthe 9 scored and analyzed scales are summarized inTABLE 2. Guilford et al. (1976, 1978) described andinterpreted the GZTS scales in greater detail.
The Orientation Inventory (Bass, 1977) is based ona theory of interpersonal behavior in organizations thatidentifies three mutually exclusive sources of job satis-faction: getting the job done (Task), having a happy timewith others (Interaction), or gaining some self-satisfyingends (Self). The three scales of the Orientation Inventoryprovide measures of these sources of job satisfaction and are summarized in TABLE 2 (SEE PAGE 61).
Procedure. The procedures were identical tothose of Study 1 except that participants completed theMBTI measure, GZTS, and the Orientation Inventory.As before, individual dichotomous preference scalescores on the MBTI measure were converted tocontinuous scores, and a forward stepwise hierarchicalregression analysis was performed on each of theseparate GZTS and Orientation Inventory scale scoresusing the CSS: Statistica statistical analysis package(CSS: Statistica Manual, 1995). Thus, for each dependentvariable, the 15 terms in the regression equation wereanalyzed in successive steps, i.e., the main effects were
entered first, followed by the simple interactions, andthe more complex interactions. In addition, analysis ofthe residuals determined the percentage of varianceuniquely accounted for by significant main effects orinteractions. Significant interactions were analyzedfurther by visual inspection of the plotted data, one-wayANOVA, and individual means compared by Duncan’scritical range tests. In each case, effects for thepreferences were confirmed by t tests.
RESULTSThe significant effects for the MBTI preferences andinteractions are summarized in TABLES 8 AND 9 (SEE
PAGES 67 AND 68–69), respectively. The significantpreference effects were often large, accounting for 0.94to 64.40% of the type-related variance. Particularlystriking preference effects occurred for GZTS Sociabilityassociated with E on the MBTI measure and GZTSRestraint with J on the MBTI measure. Similarly, theOrientation Inventory Task Scale was associated with Tand the Orientation Inventory Interaction Scale wasassociated with F.
Significant interactions occurred most frequently at the locus of the two-way interactions. There were fourthree-way interactions (TABLE 9), and no significantfour-way interactions were found. As in Study 1,embedded effects were found for most of theinteractions, and these embedded effects occurred for 12 of the 19 significant interactions (63.2%).Considering all the type-related variance identified inthese analyses, the MBTI preferences accounted for46.6% of the variance, whereas the interactionsaccounted for 53.4% of the variance, results that weresimilar to the scale score effects of Study 1. However, the variance estimates are clearly underestimated for the preferences and overstated for the interactions,because variance estimates for the interactions includedembedded main effects for the preferences alone (TABLE
9). The mean scores for significant interactions arepresented in TABLE 10 (SEE PAGE 70).
An overview and summary of the significant effects for both studies is presented in TABLE 11 (SEE
PAGE 70). It is interesting to note that for both studies,the frequency of significant effects was greatest for thetwo-way interactions. However, considering effects forthe preferences that were embedded in the interactions,the most frequent significant effects occurred for thepreferences.
64

Type Interactions: MBTI® Relationships and Self-Report Questionnaire Scale Scores
65
The Sixteen Complete Types
ISTJ ISFJ INFJ INTJn = 61 n = 8 n = 4 n = 47(13.4%) (1.8%) (0.9%) (10.3%)+ + + + + + + + + + + + ++ + + + + + + + + ++ + +
ISTP ISFP INFP INTPn = 17 n = 4 n = 9 n = 20(3.7%) (0.9%) (2.0%) (4.4%)+ + + + + + + + + + +
ESTP ESFP ENFP ENTPn = 7 n = 1 n = 14 n = 26(1.5%) (0.2%) (3.1%) (5.7%)+ + + + + + + + + +
+
ESTJ ESFJ ENFJ ENTJn = 110 n = 17 n = 9 n = 102(24.1%) (3.7%) (2.0%) (22.4%)+ + + + + + + + + + + + + + + ++ + + + + + + + + ++ + + + + + + + + ++ + + + + + + + + ++ + + + + +
Dichotomous Preferences
E n = 286 (62.7%)I n = 170 (37.3%)
S n = 225 (49.3%)N n = 231 (50.7%)
T n = 390 (85.5%)F n = 266 (14.5%)
J n = 358 (78.5%)P n = 298 (21.5%)
Pairs and Temperaments
IJ n = 120 (26.3%)IP n = 150 (11.0%)EP n = 148 (10.5%)EJ n = 238 (52.2%)
ST n = 195 (42.8%)SF n =1 30 (56.6%)NF n = 136 (57.9%)NT n = 195 (42.8%)
SJ n = 196 (43.0%)SP n = 129 (56.4%)NP n = 169 (15.1%)NJ n = 162 (35.5%)
TJ n = 320 (70.2%)TP n = 170 (15.4%)FP n = 128 (56.1%)FJ n = 138 (58.3%)
IN n = 180 (17.5%)EN n = 151 (33.1%)IS n = 190 (19.7%)ES n = 135 (29.6%)
ET n = 245 (53.7%)EF n = 141 (59.0%)IF n = 125 (55.5%)IT n = 145 (31.8%)
James H. Reynierse & John B. Harker, Type Interactions: MBTI® Relationships and Self-Report Questionnaire Scale Scores.
Table 6. Type Distribution of the Study 2 (Guilford-Zimmerman Temperament Survey) Sample.
Jungian Types (E) Jungian Types (I) Dominant Types
n % n % n %E–TJ 212 46.5 I–TP 37 8.1 Dt. T 249 54.6E–FJ 26 5.7 I–FP 13 2.8 Dt. F 39 8.6ES–P 8 1.8 IS–J 69 15.1 Dt. S 77 16.9EN–P 40 8.8 IN–J 51 11.2 Dt. N 91 20.0
N = 456 + = 1% of N I = Selection Ratio Index *p<.05 **p<.01 ***p<.001
Journal of Psychological Type®, Volume 64, June 2005
66
The Sixteen Complete Types
ISTJ ISFJ INFJ INTJn = 54 n = 8 n = 2 n = 36(14.4%) (2.1%) (0.5%) (9.6%)+ + + + + + + + + + + + ++ + + + + + + + + ++ + + +
ISTP ISFP INFP INTPn = 11 n = 4 n = 6 n = 19(2.9%) (1.1%) (1.6%) (5.1%)+ + + + + + + + + + +
ESTP ESFP ENFP ENTPn = 5 n = 1 n = 13 n = 18(1.3%) (0.3%) (3.5%) (4.8%)+ + + + + + + + + +
ESTJ ESFJ ENFJ ENTJn = 88 n = 14 n = 6 n = 90(23.5%) (3.7%) (1.6%) (24.0%)+ + + + + + + + + + + + + + + ++ + + + + + + + + ++ + + + + + + + + ++ + + + + + + + + ++ + + + + + + +
Dichotomous Preferences
E n = 235 (62.7%)I n = 140 (37.3%)
S n = 185 (49.3%)N n = 190 (50.7%)
T n = 321 (85.6%)F n = 254 (14.4%)
J n = 298 (79.5%)P n = 277 (20.5%)
Pairs and Temperaments
IJ n = 100 (26.7%)IP n = 140 (10.7%)EP n = 137 (59.9%)EJ n = 198 (52.8%)
ST n = 158 (42.1%)SF n =1 27 (57.2%)NF n = 127 (57.2%)NT n = 163 (43.5%)
SJ n = 164 (43.7%)SP n = 121 (55.6%)NP n = 156 (14.9%)NJ n = 134 (35.7%)
TJ n = 268 (71.5%)TP n = 153 (14.1%)FP n = 124 (56.4%)FJ n = 130 (58.0%)
IN n = 163 (16.8%)EN n = 127 (33.9%)IS n = 177 (20.5%)ES n = 108 (28.8%)
ET n = 201 (53.6%)EF n = 134 (59.1%)IF n = 120 (55.3%)IT n = 120 (32.0%)
James H. Reynierse & John B. Harker, Type Interactions: MBTI® Relationships and Self-Report Questionnaire Scale Scores.
Table 7. Type Distribution of the Study 2 (Orientation Inventory) Sample.
Jungian Types (E) Jungian Types (I) Dominant Types
n % n % n %E–TJ 178 47.5 I–TP 30 8.0 Dt. T 208 55.5E–FJ 20 5.3 I–FP 10 2.7 Dt. F 30 8.0ES–P 6 1.6 IS–J 62 16.5 Dt. S 68 18.1EN–P 31 8.3 IN–J 38 10.1 Dt. N 69 18.4
N = 375 + = 1% of N I = Selection Ratio Index *p<.05 **p<.01 ***p<.001
Type Interactions: MBTI® Relationships and Self-Report Questionnaire Scale Scores
DISCUSSIONThe present research demonstrated that the MBTIinstrument is related to other measurement instrumentsin statistically significant, meaningful ways. All threemeasures—DISC, GZTS, and Orientation Inventoryscale scores—relate meaningfully to MBTI dimensionsand provide interpretive value to the MBTI instrumentand type constructs. To the extent that these measuresaccurately describe human behavior, they providefurther validation for the MBTI tool as a measurementinstrument.
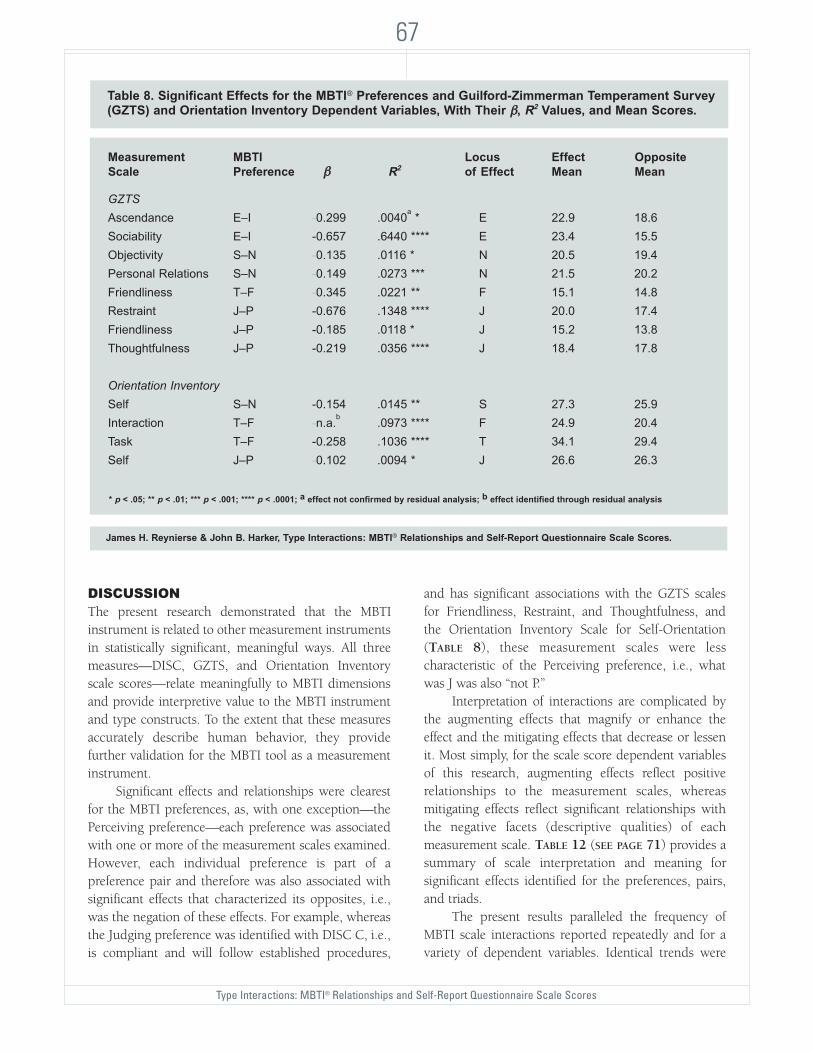
Significant effects and relationships were clearestfor the MBTI preferences, as, with one exception—thePerceiving preference—each preference was associatedwith one or more of the measurement scales examined.However, each individual preference is part of apreference pair and therefore was also associated withsignificant effects that characterized its opposites, i.e.,was the negation of these effects. For example, whereasthe Judging preference was identified with DISC C, i.e.,is compliant and will follow established procedures,
and has significant associations with the GZTS scales for Friendliness, Restraint, and Thoughtfulness, and the Orientation Inventory Scale for Self-Orientation (TABLE 8), these measurement scales were lesscharacteristic of the Perceiving preference, i.e., whatwas J was also “not P.”
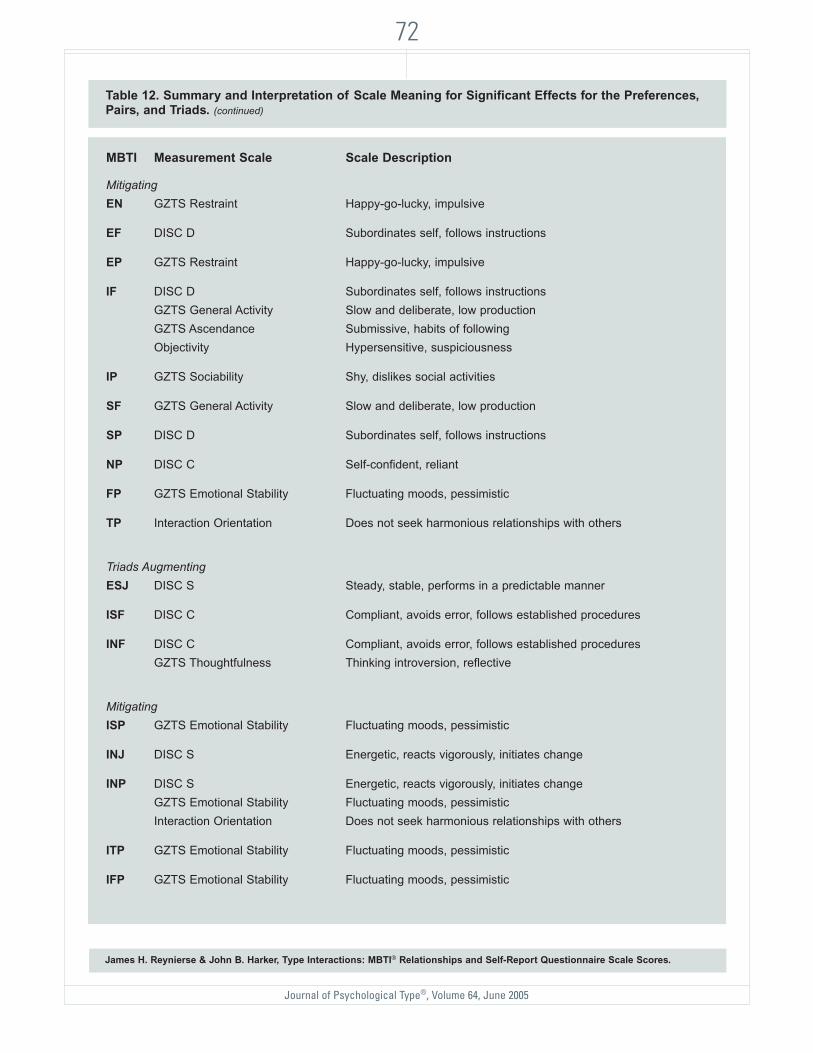
Interpretation of interactions are complicated bythe augmenting effects that magnify or enhance theeffect and the mitigating effects that decrease or lessenit. Most simply, for the scale score dependent variablesof this research, augmenting effects reflect positiverelationships to the measurement scales, whereasmitigating effects reflect significant relationships withthe negative facets (descriptive qualities) of eachmeasurement scale. TABLE 12 (SEE PAGE 71) provides asummary of scale interpretation and meaning forsignificant effects identified for the preferences, pairs,and triads.
The present results paralleled the frequency ofMBTI scale interactions reported repeatedly and for avariety of dependent variables. Identical trends were
67
James H. Reynierse & John B. Harker, Type Interactions: MBTI® Relationships and Self-Report Questionnaire Scale Scores.
Measurement MBTI Locus Effect OppositeScale Preference ββ R2 of Effect Mean Mean
GZTSAscendance E–I -0.299 .0040a * E 22.9 18.6Sociability E–I -0.657 .6440 **** E 23.4 15.5Objectivity S–N -0.135 .0116 * N 20.5 19.4Personal Relations S–N -0.149 .0273 *** N 21.5 20.2Friendliness T–F -0.345 .0221 ** F 15.1 14.8Restraint J–P -0.676 .1348 **** J 20.0 17.4Friendliness J–P -0.185 .0118 * J 15.2 13.8Thoughtfulness J–P -0.219 .0356 **** J 18.4 17.8
Orientation InventorySelf S–N -0.154 .0145 ** S 27.3 25.9Interaction T–F -n.a.b .0973 **** F 24.9 20.4Task T–F -0.258 .1036 **** T 34.1 29.4Self J–P -0.102 .0094 * J 26.6 26.3
Table 8. Significant Effects for the MBTI® Preferences and Guilford-Zimmerman Temperament Survey(GZTS) and Orientation Inventory Dependent Variables, With Their ββ, R2 Values, and Mean Scores.
* p < .05; ** p < .01; *** p < .001; **** p < .0001; a effect not confirmed by residual analysis; b effect identified through residual analysis

Journal of Psychological Type®, Volume 64, June 2005
68
James H. Reynierse & John B. Harker, Type Interactions: MBTI® Relationships and Self-Report Questionnaire Scale Scores.
Measurement MBTIScale Interactions1 ββ R2 Most
GZTS General Activity E–I X T–F -0.445 .1656 **** ET continued >
General Activity S–N X T–F 0.239 .0290 **** NT continued >
Restraint E–I X J–P 0.338 .0994 **** IJ continued >
Restraint E–I X S–N -0.165 .0154 ** IN continued >
Ascendance E–I X T–F -0.447 .3022 **** ET continued >
Ascendance S–N X T–F -0.145 .0916 **** NT continued >
Sociability E–I X J–Pb -0.226 .0029 * EP continued >
Emotional Stability S–N X J–P -0.547 .0139 ** NJ continued >
Emotional Stability E–I X T–F X J–P -0.225 .1463 **** ETP continued >
Emotional Stability T–F X J–P n.a.c n.a.c TJ continued >
Emotional Stability E–I X S–N X J–P -0.345 .0071 * ENJ continued >
Objectivity E–I X T–F -0.223 .1091 **** ET continued >
Objectivity E–I X J–P -0.158 .0144 ** EJ continued >
Thoughtfulness E–I X T–Fd -0.179 .0119 * IF continued >
Thoughtfulness E–I X S–N X T–F b,d -0.396 .0263 *** INF continued >
Personal Relations E–I X J–P -0.206 .0489 **** EJ continued >
Orientation InventoryInteraction T–F X J–P -n.a.b,e .0973 **** FJ continued >
Interaction E–I X S–N X J–P -n.a.e .0340 **** ESP/ENP continued >
Task E–I X S–N -0.301 .0611 **** IN continued >
Table 9. Significant Effects for the MBTI® Interactions and GZTS and Orientation InventoryDependent Variables, With Their ββ, R2 Values, and Mean Scores for the Most and Least CharacteristicType Combinations, Embedded Effects, Locus and Nature of the Interaction Effect.
* p < .05; ** p < .01; *** p < .001; **** p < .0001; a although effect for E–I not confirmed by residual analysis, by inspection it is clear that the effect and R2 includes a substantial preference effect for E; b doubtful or trivial effect; c embedded interaction identified through ANOVA;d weak effect not confirmed by ANOVA or individual comparisons; e effect identified through residual analysis.

Type Interactions: MBTI® Relationships and Self-Report Questionnaire Scale Scores
69
James H. Reynierse & John B. Harker, Type Interactions: MBTI® Relationships and Self-Report Questionnaire Scale Scores.
Measurement Mean Mean Embedded Locus NatureScale Most Least Least Effects of Effect of Effect
GZTS General Activity 22.7 IF 16.3 E IF Mitigate
General Activity 22.4 SF 18.5 N, T SF Mitigate
Restraint 21.2 EP 15.8 I EP Mitigate
Restraint 20.6 EN 18.5 I EN Mitigate
Ascendance 23.0 IF 15.0 Ea, N IF Mitigate
Ascendance 22.5 SF 18.8 N, T NT Augment
Sociability 23.6 IP 14.8 None IP Mitigate
Emotional Stability 23.5 SP 20.3 None NJ Augment
Emotional Stability 24.0 IFP 16.2 E, T, TF X JP ITP & IFP Mitigate
Emotional Stability 23.1 FP 18.5 T, J FP Mitigate
Emotional Stability 24.3 INP 18.5 E ISP & INP Mitigate
Objectivity 21.0 IF 15.6 E IF Mitigate
Objectivity 20.9 IP 16.9 E IP Mitigate
Thoughtfulness 19.3 ET 18.0 None IF Augment
Thoughtfulness 20.3 IST 17.8 None INF Augment
Personal Relations 21.4 IP 18.0 None IP Mitigate
Orientation InventoryInteraction 25.0 TP 20.1 None TP Mitigate
Interaction 23.4 INP 17.9 None TINP Mitigate
Task 35.5 ES 32.0 N IN Augment
Table 9. Significant Effects for the MBTI® Interactions and GZTS and Orientation InventoryDependent Variables, With Their ββ, R2 Values, and Mean Scores for the Most and Least CharacteristicType Combinations, Embedded Effects, Locus and Nature of the Interaction Effect. (continued)
* p < .05; ** p < .01; *** p < .001; **** p < .0001; a although effect for E–I not confirmed by residual analysis, by inspection it is clear that the effect and R2 includes a substantial preference effect for E; b doubtful or trivial effect; c embedded interaction identified through ANOVA;d weak effect not confirmed by ANOVA or individual comparisons; e effect identified through residual analysis.

Journal of Psychological Type®, Volume 64, June 2005
70
James H. Reynierse & John B. Harker, Type Interactions: MBTI® Relationships and Self-Report Questionnaire Scale Scores.
Measurement MBTIScale Interaction Pair (or Triad) Mean Scores
Guilford-Zimmerman Temperament SurveyGeneral Activity E–I X T–F ET = 22.7 EF = 21.4 IT = 20.5 IF = 16.3General Activity S–N X T–F ST = 21.3 SF = 18.5 NT = 22.4 NF = 20.4Restraint E–I X J–P EJ = 19.5 EP = 15.8 IJ = 21.2 IP = 19.0Restraint E–I X S–N ES = 19.3 EN = 18.5 IS = 20.4 IN = 20.6Ascendance E–I X T–F ET = 23.0 EF = 22.3 IT = 19.3 IF = 15.0Ascendance S–N X T–F ST = 20.7 SF = 18.8 NT = 22.5 NF = 20.2Sociability E–I X J–P EF = 23.4 EP = 23.6 IJ = 15.8 IP = 14.8Emotional Stability S–N X J–P SJ = 22.2 SP = 20.3 NJ = 23.5 NP = 20.9Emotional Stability T–F X J–P TJ = 23.1 TP = 21.7 FJ = 20.6 FP = 18.5Objectivity E–I X T–F ET = 21.0 EF = 19.9 IT = 19.0 IF = 15.6Objectivity E–I X J–P EJ = 20.9 EP = 20.7 IJ = 19.1 IP = 16.9Thoughtfulness E–I X T–F ET = 18.1 EF = 18.6 IT = 18.4 IF = 19.3Personal Relations E–I X J–P EJ = 21.4 EP = 21.2 IJ = 21.0 IP = 18.0
Emotional Stability E–I X T–F X J–P ETJ = 23.6 ETP = 24.0 EFJ = 20.7 EFP = 20.5ITJ = 22.0 ITP = 19.6 IFJ = 20.3 IFP = 16.2
Emotional Stability E–I X S–N X J–P ESJ = 22.4 ESP = 24.0 ENJ = 24.3 ENP = 22.6ISJ = 21.9 ISP = 18.9 INJ = 21.7 INP = 18.5
Thoughtfulness E–I X S–N X T–F EST = 18.1 ESF = 18.5 ENT = 18.0 ENF = 18.6IST = 17.8 ISF = 18.2 INT = 19.0 INF = 20.3
Orientation InventoryInteraction T–F X J–P TJ = 20.4 TP = 20.1 FJ = 25.0 FP = 24.8Task E–I X S–N ES = 32.0 EN = 34.1 IS = 32.6 IN = 35.5
Interaction E–I X S–N X J–P ESJ = 21.7 ESP = 23.4 ENJ = 20.4 ENP = 23.4ISJ = 20.5 ISP = 22.2 INJ = 20.3 INP = 17.9
Table 10. Effects (Means) for All Significant Interactions for the Guilford-Zimmerman TemperamentSurvey and Orientation Inventory Scale Scores, With Locus of Effect in Bold.
Study 1 + Embedded Total Effects Study 1 Study 2 Study 2 Effects Effects
Preferences 7 12 19 22 412-Way interactions 9 15 24 1 253-Way interactions 2 4 6 0 64-Way interaction 0 0 0 0 0
Table 11. Frequency of Significant Effects for the MBTI® Preferences, Interactions, and EmbeddedEffects for Study 1, Study 2, and the Combined Studies.

Type Interactions: MBTI® Relationships and Self-Report Questionnaire Scale Scores
71
James H. Reynierse & John B. Harker, Type Interactions: MBTI® Relationships and Self-Report Questionnaire Scale Scores.
MBTI Measurement Scale Scale Description
PreferencesE DISC I Influence, persuasability
GZTS Ascendance Leadership, persuasabilityGZTS Sociability Social extraversion, has many friends/acquaintances
I DISC C Compliant, avoids error, follows established procedures
S Self-Orientation Concerned with own needs
N GZTS Objectivity Thick-skinnedGZTS Personal Relations Cooperativeness, tolerance of people
T DISC D Determined, dominant, assertiveTask Orientation Concerned with completing a job
F DISC S Steady, stable, performs in a predictable mannerGZTS Friendliness Agreeableness, shows respect for othersInteraction Orientation Seeks harmonious relationships with others
J DISC C Compliant, avoids error, follows established proceduresGZTS Friendliness Agreeableness, shows respect for othersGZTS Restraint Serious-mindedness, deliberate, and self-controlledGZTS Thoughtfulness Thinking introversion, reflectiveSelf-Orientation Concerned with own needs
P None
Pairs AugmentingIN Task Orientation Concerned with completing a job
IF DISC C Compliant, avoids error, follows established proceduresGZTS Thoughtfulness Thinking introversion, reflective
SJ DISC S Steady, stable, performs in a predictable manner
NT GZTS Ascendance Leadership, persuasability
NJ GZTS Emotional Stability Evenness of moods, optimism, and cheerfulness
Table 12. Summary and Interpretation of Scale Meaning for Significant Effects for the Preferences,Pairs, and Triads.
Continued on next page >
Journal of Psychological Type®, Volume 64, June 2005
72
James H. Reynierse & John B. Harker, Type Interactions: MBTI® Relationships and Self-Report Questionnaire Scale Scores.
MBTI Measurement Scale Scale Description
MitigatingEN GZTS Restraint Happy-go-lucky, impulsive
EF DISC D Subordinates self, follows instructions
EP GZTS Restraint Happy-go-lucky, impulsive
IF DISC D Subordinates self, follows instructionsGZTS General Activity Slow and deliberate, low productionGZTS Ascendance Submissive, habits of followingObjectivity Hypersensitive, suspiciousness
IP GZTS Sociability Shy, dislikes social activities
SF GZTS General Activity Slow and deliberate, low production
SP DISC D Subordinates self, follows instructions
NP DISC C Self-confident, reliant
FP GZTS Emotional Stability Fluctuating moods, pessimistic
TP Interaction Orientation Does not seek harmonious relationships with others
Triads AugmentingESJ DISC S Steady, stable, performs in a predictable manner
ISF DISC C Compliant, avoids error, follows established procedures
INF DISC C Compliant, avoids error, follows established proceduresGZTS Thoughtfulness Thinking introversion, reflective
MitigatingISP GZTS Emotional Stability Fluctuating moods, pessimistic
INJ DISC S Energetic, reacts vigorously, initiates change
INP DISC S Energetic, reacts vigorously, initiates changeGZTS Emotional Stability Fluctuating moods, pessimisticInteraction Orientation Does not seek harmonious relationships with others
ITP GZTS Emotional Stability Fluctuating moods, pessimistic
IFP GZTS Emotional Stability Fluctuating moods, pessimistic
Table 12. Summary and Interpretation of Scale Meaning for Significant Effects for the Preferences,Pairs, and Triads. (continued)

Type Interactions: MBTI® Relationships and Self-Report Questionnaire Scale Scores
obtained by Myers et al. (1998) for ratings of 73personal preferences, by Reynierse and Harker (2000,2001) for lexical descriptors, by Reynierse, Harker,Fink, and Ackerman (2001) for business values, and bySundstrom, Koenigs, and Huet-Cox (1996) for personalvalues important for teamwork. In each study, includingthe present one, there were many significant effects forthe individual preferences and two-way interactions,diminished effects for the three-way interactions, andimpoverished, i.e., inconsequential effects for the four-way interaction. From a theoretical perspective, theseresults are consistent with Reynierse’s (2000) synthesisof the FFM with type theory in which the locus ofprimary, interactive type effects occurs at the most basic interactive level, i.e., for the two-way interactions, but are inconsistent with the whole-type view (e.g., Hammer, 1998; Myers et al., 1998). Finally, thepresumed multifaceted character of complex, question-naire scales (Mitchell, 1995) had minimal impact for theproduction of higher-order interactions.
NOTES1Traditional type theory emphasizes the synergisticnature of type interactions in which the interactionproduces new, positive forms. In this sense, type theoryis couched exclusively in terms of positive, augmentingeffects, whereas many empirical interaction effects,including those reported in this paper, are in factmitigating. Interaction is a complex statistical effect andboth the mitigating and embedded effects reportedthroughout this paper complicate interpreting typeinteractions.
In general, augmenting interactions increase themagnitude of the effect, whereas mitigating interactions
decrease the effect. This can be illustrated by examiningthe means for the DISC-D scale scores for the E–I X T–Finteraction, where ET = 59.8, EF = 56.6, IT = 56.2, andIF = 47.6 and for the DISC-D converted profile scoresfor the same E–I X T–F interaction, where ET = 6.8, EF = 5.5, IT = 6.5, and IF = 3.4. Note that in each casethere is a mitigating effect, as the locus of the effect is atthe IF Pair (Mean = 47.6 and 3.4, respectively). In eachcase, the IF score is significantly lower than the ET, EF, and IT mean scores—and therefore it is a mitigatingeffect.
By contrast, the DISC-C converted profile scoresfor the E–I X T–F interactions are an example of anaugmenting interaction effect. DISC-C converted profilescores include ET = 2.98, EF = 2.73, IT = 4.94, and IF = 5.90. Note that in this example the effect is at thelocus of the IF Pair (Mean = 5.90), where it has a significantly larger effect than does IT (Mean = 4.94)relative to the ET and EF conditions—and therefore itis an augmenting effect.
These examples also illustrate the embeddedeffects reported throughout this paper. There is anembedded effect for the DISC-D scale scores, as analy-sis of the effects showed a significant difference betweenthe T and F conditions. This is an example of anembedded effect, because the T–F difference was notidentified earlier through hierarchical regression butonly became apparent upon further examination of the simple effects that comprise the interaction. Suchembedded effects decrease the magnitude of reportedinteractions. However, the very obvious E–I differencefor the DISC-C converted profile scores was identifiedthrough hierarchical regression (SEE TABLE 3, PAGE 62)and therefore is not an embedded effect.
73

Journal of Psychological Type®, Volume 64, June 2005
74
REFERENCES
Bass, B. M. (1977). Manual: The Orientation Inventory. Palo Alto,CA: Consulting Psychologists Press.
Clarke, W. V. (1956). The construction of an industrial selectionpersonality test. The Journal of Psychology, 41, 379–394.
CSS: STATISTICA Manual (1995). Tulsa, OK: Statsoft, Inc.
Guilford, J. P., Guilford, J. S., & Zimmerman, W. S. (1978). TheGuilford-Zimmerman Temperament Survey Manual. BeverlyHills, CA: Sheridan Psychological Services, Inc.
Guilford, J. S., Zimmerman, W. S., & Guilford, J. P. (1976). TheGuilford-Zimmerman Temperament Survey Handbook. SanDiego: EdITS Publishers.
Hammer, A. L. (1998). Item response theory in the MBTI Revision.Bulletin of Psychological Type, 21(1), 40–41.
Hester, C. (1996). The relationship of personality, gender, and ageto Adjective Check List profiles of the ideal romantic partner.Journal of Psychological Type, 36, 28–35.
Individual Talent Survey Administration and Scoring Manual (1976).Providence, RI: Advanced Management Research Institute.
John, O. P. (1990). The “Big Five” factor taxonomy: Dimensions ofpersonality in the natural language and in questionnaires. InL. E. Pervin (Ed.), Handbook of personality: Theory andresearch (pp. 66–100). New York: The Guilford Press.
Johnson, A. K. (1997). Conflict-handling intentions and the MBTI:A construct validity study. Journal of Psychological Type, 43,29–39.
Lubin, A. (1961). The interpretation of significant interaction.Educational and Psychological Measurement, 21, 807–817.
Marston, W. M. (1928). Emotions of normal people. New York:Harcourt Brace.
Merenda, P. F., & Clarke, W. V. (1959). Factor analysis of a measureof “social self.” Psychological Reports, 5, 597–605.
Merenda, P. F., & Clarke, W. V. (1968). Relationships among AVAand ACL scales as measured on a sample of college students.Journal of Clinical Psychology, 24, 52–60.
Mitchell, W. D. (1995). Empirical verification of the Jungian typol-ogy. In J. Newman (Ed.), Measures of the five-factor model andpsychological type: A major convergence of research and theory(pp. 43–65). Theory and Research Symposium, Tenth
Biennial International Conference. Kansas City, MO:Association for Psychological Type.
Myers, I. B. (1962). Manual: The Myers-Briggs Type Indicator. PaloAlto, CA: Consulting Psychologists Press.
Myers, I. B., & McCaulley, M. H. (1985). Manual: A guide to thedevelopment and use of the Myers-Briggs Type Indicator (2ndedition). Palo Alto, CA: Consulting Psychologists Press.
Myers, I. B., McCaulley, M. H., Quenk, N. L., & Hammer, A. L.(1998). MBTI® Manual: A guide to the development and use ofthe Myers-Briggs Type Indicator (3rd ed.). Palo Alto, CA:Consulting Psychologists Press.
Pedhazur, E. J. (1982). Multiple regression in behavioral research(2nd ed.). New York: Holt, Rinehart and Winston.
Reynierse, J. H. (2000). The combination of preferences and theformation of MBTI types. Journal of Psychological Type, 52,18–31.
Reynierse, J. H., Ackerman, D., Fink, A. A., & Harker, J. B. (2000).The effects of personality and management role on perceivedvalues in business settings. International Journal of Value-Based Management, 13, 1–13.
Reynierse, J. H., & Harker, J. B. (2000). Waiting for Godot, thesearch for the Holy Grail, and the futility of obtaining mean-ingful whole-type effects. Journal of Psychological Type, 53,11–18.
Reynierse, J. H., & Harker, J. B. (2001). The interactive and addi-tive nature of psychological type. Journal of PsychologicalType, 58, 6–32.
Reynierse, J. H., Harker, J. B., Fink, A. A., & Ackerman, D. (2001).Personality and perceived business values: Synergistic effectsfor the Myers-Briggs Type Indicator and management rat-ings. International Journal of Value-Based Management, 14,259–271.
Sundstrom, E., Koenigs, R. J., & Huet-Cox, G. D. (1996).Personality and perceived values: Myers-Briggs TypeIndicator and coworker ratings on SYMLOG. In S. E. Hare & A. P. Hare (Eds.), SYMLOG field theory: Organizationalconsultation, value differences, personality and social perception(pp. 155–173). Westport, CT: Praeger.

C O N TA C T
Type Interactions: MBTI® Relationships and Self-Report Questionnaire Scale Scores
James H. Reynierse is an industrial-organizational psychologist with a Ph.D. in experimental psychology fromMichigan State University. He was a postdoctoral fellow at Indiana University (Psychology) and a Senior ScientistFellow at the University of Edinburgh (Zoology). Following a 10-year research and teaching career in highereducation, he spent 25 years in business—10 years in human resource management and 15 years as a managementconsultant. He has published extensively, most recently on the cognitive styles of business managers, executives, andentrepreneurs, theoretical issues related to type and the MBTI® instrument, and issues related to business values.Previously he was Editor and on the Editorial Board of the journal Human Resource Planning and is currently on theEditorial Board of the Journal of Psychological Type®. Now retired, he enjoys “puttering around” on and “chipping outof the sand traps” of the type table.
John B. Harker went to college at Temple University, where he received his B.A. in 1944. In 1949, he received anM.A. in psychology from the University of Pennsylvania. He took employment in 1949 at the First PennsylvaniaCompany in the Personnel Department under Edward N. Hay, as Test Administrator. Here he used the MBTI®
instrument, Form C under the guidance of Isabel Myers as part of Mr. Hay’s collaboration with Isabel. Mr. Harker wasemployed at First National Bank of Boston in Personnel Research from 1951–1958. He then went into business as amanagement consultant in personnel administration activities from 1958 until his retirement in 1988. He has anongoing interest in MBTI research initiated in conjunction with Organization Renewal Associates under a grant fromCPP, Inc. and in collaboration with James H. Reynierse.
James H. Reynierse, Ph.D.320 Angus Road
Chesapeake, VA 23322(757) 547-2416
This Journal is being made available through the collaborative efforts of Dr. Tom Carskadon, Editor of the Journal of Psychological Type, andthe Center for Applications of Psychological Type, Inc., CAPT, worldwide publisher.
The Journal of Psychological Type is a registered trademark of Thomas G. Carskadon, United States.
CAPT is a not-for-profit organization dedicated to the meaningful application and ethical use of psychological type as measured through theMyers-Briggs Type Indicator® instrument.
Myers-Briggs Type Indicator, Myers-Briggs, and MBTI are trademarks or registered trademarks of the Myers-Briggs Type Indicator Trust inthe United States and other countries.
Copyright © 2005 by Thomas G. Carskadon, Editor.
75