measurement and traceability - isotech.info · measurement and traceability 1.1 introduction...
TRANSCRIPT
1Measurement and Traceability
1.1 Introduction
Let’s start with a thought experiment.You’ve just bought this book, but you’re concerned about the growing piles of
unread books lying around the house. Impulsively you decide that it’s time to builda bookshelf, and telephone the local timber merchants and ask them to deliver somesuitable timber.
‘How much?’, they say.‘Eight metres ought to be enough’, you reply.‘What’s a metre?’
After some discussion and free exchange of ideas, you find that you and the timbermerchants do not use the same measures of length. How can you communicate yourneeds?
Over the millennia, we have tended to use assorted body parts (feet, nails, inches,cubits, hands, palms, yards, etc.) to communicate measures of length. This might workwell enough with the timber merchants but there are occasions when something morerigid and precise is required. The time also comes when we must interact with peopleother than the timber merchants, and eventually with the rest of the world. Then theonly practical solution is for us all to share a single standard for each measure.
The concept of traceability has evolved to describe measurements that can be relatedto a common standard. To make traceability practical on a worldwide scale a hugenumber of people have to be involved defining the units, disseminating the units throughcalibration laboratories, manufacturing instruments, setting specifications for the manu-facturers, and, finally, using the instruments and measurement results. Consequently,complex and extensive systems have evolved to provide for physical measurementstandards, assessments of technical competence and the development of measurementprotocols. For those of you whose business is measurement, achieving traceability andworking with the measurement community will have a greater impact on your businessthan any technological advance in measurement technique.
This chapter is primarily background material answering some of the ‘what’ and‘why’ questions of measurement, and describing how to interact with the rest of themeasurement community. We begin by delving into measurement theory: what is ameasurement, and why do we measure? This is followed by a short history of theevolution of temperature as a physical concept and the primary methods for measuringtemperature. The last sections provide an overview of the systems that have evolvednationally and internationally to make traceability practical: the international system
2 1 MEASUREMENT AND TRACEABILITY
of units, accreditation systems and documentary standards systems. We describe whatthey do and why they are there.
1.2 Measurement
1.2.1 What is a measurement?
Measurement is one of the most fundamental tasks carried out by humans, or any otherspecies. All knowledge of the world is gained through the senses, and our ability tosurvive comes from our reactions to that knowledge. Our curiosity, intelligence andself-awareness are adaptations that allow us to prepare for the unexperienced, and oursensors and measuring instruments extend our knowledge of the universe beyond thatacquirable from our senses alone.
For those of us working inside corporate organisations survival and risk have slightlydifferent meanings from the biological sense, but whether we or our organisations makemeasurements for commerce, control or curiosity the ultimate motivation is the same:improving survival and minimising risk.
One way of identifying the reason for making a measurement is to determine howit affects our actions. For commercial measurements, the answer is simple becausemeasurements are the basis of contracts. A buyer agrees to pay for a certain quantityof goods and his or her decision on whether to buy or not depends on the quantity andprice. In commerce, measurements affect decisions about sale and purchase.
Measurements are often associated with control or regulatory mechanisms. In air-conditioning systems, temperature measurements determine whether heat flows areincreased or decreased. Measurements of rust in cars control their roadworthiness,and measurements of toxicity control the quality of the environment. In each casethe measurements precede decisions to increase or decrease, reject or accept, or toprosecute or not prosecute.
With curiosity-driven measurements the decisions are less obvious. In science,experiments are used as the basis for developing and testing theory or models ofphenomena, and at each stage of the development a scientist makes a decision: doesthis work, does that work, what if we do this, etc.? Eighty years after Einstein publishedhis general theory of relativity researchers are still making measurements to test thevalidity of the theory. Again measurements are made to aid in the making of decisions.
The accepted metrological definition of a measurement is in two parts:
Measurement:The set of operations having the object of determining a value of a quantity.
Result of a measurement:The value attributed to a measurand obtained by measurement.
While these two definitions are technically correct, they are so because of a tautology.The dictionary definition of a quantity is something that has a value, and a measurandis the thing being measured. Consequently, these are self-evident statements ratherthan definitions. More importantly, they are not especially helpful in distinguishing

1.2 MEASUREMENT 3
a measurement from a meaningless assignment of numbers. We offer an alternativedefinition that applies to both the process and the result:
Measurement (alternative definition):The symbolic representation of a state, event or attribute to aid in the making of adecision.
This definition highlights three important aspects of measurement not apparent fromthe first two definitions:
(1) The results of measurement need not be numeric: grade A, red and sodium are alllegitimate measurement results in the appropriate context. One of the most valu-able aspects of symbolic representation is that we use the symbols in our modelsto make predictions. Mathematical models and numeric symbols particularly helpto quantify predictions that might otherwise be qualitative or subjective.
(2) Every measurement has a purpose. This is the distinction we seek between ameaningful measurement and meaningless assignment of numbers. In a greatmany measurements, especially outside the calibration laboratory, the purposeinfluences the design and outcome of the measurement. Consequently, measure-ment results may have meaning only within the context of that purpose. Resultsused for other purposes or gathered without purpose are potentially dangerous.
(3) Decisions are associated with risks and rewards. This highlights the need toknow the uncertainty in a measurement in order to assess the risk or optimise themeasurement.
These three points are the main themes of Sections 1.2.2 to 1.2.4.
Exercise 1.1
Consider some of the measurements you make. What decisions do they influence?What are some of the risks and rewards associated with those decisions?
1.2.2 Measurement scales
In this section, we look at some of the basic systems for the symbolic representationof measurement results: our measurement scales. Table 1.1 provides a coarse summaryof the various types of measurement scale that we use. The classification given in thetable is based on the algebraic properties underlying the measurement scales. Whilethere are other systems of classification we have chosen this one in order to highlightthe fundamental limitations associated with the different systems of representation.
Nominal scales
Measurements on nominal scales are essentially a naming, and often the results do notlook like measurements at all. An example familiar to most is the number on a footballplayer’s shirt. In many sports, the number on a player’s shirt indicates the position the

4 1 MEASUREMENT AND TRACEABILITY
Table 1.1 A classification of measurement scales based on possible mathematical operations
Scaletype
Description Operations Examples
Nominal A renaming; canestablishequivalence
= Colours (red, blue)Team numbers (e.g. football)Stellar spectral types (O,B,A,F,G,. . .)
Ordinal Can establish order =< > Moh hardnessRockwell hardnessBeaufort wind scaleFahrenheit and Celsius scales
Interval Can establishmeaningfuldifferences
= <> +− Date, time of dayYearLatitude and longitudeCentigrade temperature scale
Metric orratio
Can establishmeaningful ratios
= <> + − × ÷ All SI scales, e.g. lengthMassFrequencyThermodynamic temperature
Countingornatural
Counts of objects orevents, an integermetric scale
= <> + − × ÷ Apples, busesBirthdays
sports person plays on the field. In Rugby Union, for example, the numbers 11 and14 refer to the left and right wings. But the numbers carry no numeric meaning: it ismeaningless to say that a number 14 player is any better than a number 11, or thatthe number 14 is twice as good as the number 7. However, it is possible to establishequivalence: a number 14 in one team plays in the same position and requires the sameskills as the number 14 in another team. In this case, the measurement is performedwhen a coach determines the player’s position.
Other examples of nominal scales include colours, the names of plants, and theclassification of chemicals such as alcohols and acids. Indeed most of our language isbased on nominal assignments. All of our verbs, nouns and adjectives are verbal andwritten symbols for actions, objects and attributes. One of the key aspects of nominalscales is that each classification or naming must have its own standard or definition.Thus, for example, each of us has to learn what red and blue or apples and pears arebefore we can make use of the symbols.
Ordinal scales
As its name implies, results on ordinal scales convey some sense of order. As withnominal scales, ordinal results need not be numerical. Perhaps one of the most famousordinal scales, amongst English-speaking parents and children at least, is the one usedby Goldilocks at the house of the three bears: too little, just right, and too much.This is the very same scale underlying many commercial transactions. A more typicalexample is the Moh hardness scale (Table 1.2), a scale once used by mineralogists tohelp identify minerals on the basis of hardness. The scale is constructed so that eachmineral listed is harder than those below it. In this way the mineralogist can determine

1.2 MEASUREMENT 5
Table 1.2 Moh’s scale of hardness
Hardness Mineral standard
10 Diamond9 Sapphire8 Topaz7 Quartz6 Feldspar5 Apatite4 Flourspar3 Calcite2 Gypsum1 Talc
the hardness of an unknown mineral by determining which minerals scratch it. Strictlyspeaking, the scale measures resistance to scratching rather than hardness.
Other examples include the Beaufort wind strength scale, the Mercalli earthquakeintensity scale, examination grades, credit ratings, library codes, and most of the earlytemperature scales. As can be seen from the examples, ordinal scales are characterisedby several standards or definitions, one for each of the defined points on the scale.
In many cases ordinal scales also have a specified interpolating instrument thatmakes it possible to assign values in between the defined points. A very large numberof chemical measurement scales are constructed this way, for example using standardsolutions and a spectrometer to interpolate between the standards. The InternationalTemperature Scale of 1990 (ITS-90) is also an ordinal scale, where the defined pointsare the various melting, freezing and triple points of pure substances, and the inter-polating instruments include platinum resistance thermometers, vapour-pressure ther-mometers and radiation thermometers. With many ordinal measurements, the responseof the interpolating instrument is known to be non-linear but it is still possible to tellwhen one sample has a greater concentration of a particular compound than another,or higher temperature than another.
Interval scales
Interval scales are those that are known to be linear in some fundamental sense, and arethe simplest scale type to allow meaningful comparison of differences. Interval scalestypically have an arbitrary zero. Familiar examples include the latitude and longitudescales, which are used to determine position on the surface of the earth. The longitudescale requires two standards to define it: the position of the zero, which is arbitrarilychosen to be Greenwich, and the number of degrees in a full revolution of the earth,which is arbitrarily chosen to be 360. It is possible to compare changes in longitudemeaningfully, or to add and subtract intervals of longitude, but it is still not meaningfulto talk about ratios. Statements such as ‘a country at 40 degrees of longitude is twicethe country at 20 degrees of longitude’ are nonsense.
Other examples of interval scales include all of the time scales that we use to tellthe time of day, date and year, and the 4 mA to 20 mA current loop representation usedby many industrial instruments (a symbol need not be a squiggle on paper). One of theearliest thermodynamic temperature scales, the centigrade scale, was an interval scalebased on the definition of the melting and boiling points of water at 0 °C and 100 °C

6 1 MEASUREMENT AND TRACEABILITY
respectively. Because interval scales are the first that enable us to talk meaningfullyabout intervals, these are the first scales that allow us to do normal statistics, that is tocalculate means and standard deviations. On more primitive scales, we have to adoptdifferent statistical techniques that do not require the concept of meaningful intervals.
Metric scales
Metric scales are those that have a natural zero. On such scales, we can usefullytalk about ratios and fractions. Metric scales include all of the familiar SI scales oflength, mass, thermodynamic temperature, etc. On the mass scale, for example, weknow exactly what zero mass means, we can add and subtract mass, and we can talkmeaningfully about dividing a mass into fractions or doubling and tripling a mass. Thekey attribute of metric scales that distinguishes them from other scales is that only onestandard is required to define each completely. The mass scale is defined in terms of theprototype kilogram stored in a safe in a basement of the Bureau International des Poidset Mesures (BIPM) in Paris. All other measurements reported on the mass scale areexpressed as ratios with respect to the kilogram. The standard used to define the scaleis known as the metric or the unit of the scale. Metric scales are also known as ratioscales, and the literal translation of the word metrology, from the Greek metrologia, isthe study of ratios.
Perhaps the most important of our metric scales is also one of the earliest: thenatural or counting scale. Early in our cultural development we learned to count apples,oranges, etc. However, it was apparently not until the time of the Greek mathematiciansthat it was recognised that numbers had properties independent of the objects. That is,the problem of ‘2 apples plus 3 apples’ is fundamentally the same as ‘2 oranges plus3 oranges’, and can be generalised without reference to any object. However, we mustremember that the measurement scales for counting oranges and apples are differentbecause they have different metrics, one orange and one apple respectively, and onecannot take one apple from two oranges and obtain a meaningful result.
The log-ratio scales form a special class of interval scales that are actually basedon metric quantities. Because of the very large range of values encountered, it is oftenconvenient to transform metric measurements to a logarithmic scale. These scales aretypically constructed as
value on log scale = constant × log (value/reference value) .
There are two definitions required to define a log-ratio scale: the multiplying constantand the reference value. Examples of such scales include the various decibel scales,the visual magnitude of stars, and the Richter scale for the energy dissipated in earth-quakes. On these scales equal intervals correspond to constant multiplying factors ofthe underlying metric quantity. An interval of 10 dB corresponds to a 10 times increasein power, five steps of visual magnitude correspond to 100 times decrease in the bright-ness of stars, and two steps on the Richter scale correspond to a 1000 times increasein the energy dissipated in an earthquake.
The progression of scales given above suggests that as the nature of quantities andmeasurements becomes well understood, the associated scales evolve towards metricscales. Science begins with classification — stamp collecting as Lord Rutherford calledit. This evolutionary trend is common, but it is not universal. Some scales can never be
1.2 MEASUREMENT 7
metric: colour will always be a three-dimensional scale based on two interval quantitiesand one metric quantity, and the Rockwell hardness scales will always be ordinal scales.Also, not all nominal scales are primitive. The models and mathematics underlying thecurrent descriptions of fundamental particles, with demonstrably nominal attributeslike beauty, charm, top and bottom, are amongst the most sophisticated that we havedeveloped. Similarly the models and mathematics underlying chemical reactions, whichare described by symbols like NaCl and H2O, are also sophisticated.
The influence of scale type on traceability
In order to communicate results unambiguously it is necessary for each of us to sharethe same scale for a quantity and to have access to the standards that define the scale.For metric scales the traceability problem is relatively simple: all measurements haveto be related to a single standard. For the other scale types, the traceability problemcan be more complicated because more standards are required.
Many interval scales can be expressed in terms of metric quantities, so the trace-ability problem is not too difficult. The log-ratio scale, for example, requires a definitionof the multiplying constant, which can be defined without error, and a reference value,which in most cases takes the place of the unit on metric scales. All of the time scales(time of day, year, etc.) rely on measurements of time interval (a metric quantity) andan arbitrarily defined zero. Angle scales, such as latitude and longitude, also rely onangle interval and an arbitrary zero.
Ordinal scales are the most problematic in respect of traceability. They requirea minimum of two standards, and in many cases require an approved or specifiedinterpolating instrument. To realise the Moh hardness scale the mineralogist has tocarry samples of the 10 minerals that define the scale. A large number of measurementsbased on calibrated scales are in fact carried out on ordinal scales, and in particularmany chemical measurements fall into this category.
Nominal scales typically have the greatest number of standards associated with them,usually one for each possible category on the scale. The standards may be descriptiveor based on artefacts such as standard reference materials. At one time, for example,there was a descriptive definition for each of the elements in the periodic table, basedon the distinguishing chemical and physical properties. Nowadays the definitions ofthe elements are based on the number of protons in the nucleus of an atom, which isderived from the natural scale.
The influence of scale type on treatment of uncertainty
According to the ISO Guide for the expression of uncertainty in measurement (ISOGuide), an uncertainty is the range of values that may reasonably be attributed to ameasurand. Just how one goes about characterising a range depends on the scale type.The fewer mathematical operations that are permitted on a scale the fewer optionsthere are available for statistical analysis. Table 1.3 summarises the various statisticaloperations available on the different measurement scales.
To clarify the meaning of uncertainty on nominal scales we have to remember thatresults are used to make decisions, and when we characterise uncertainties we arein fact concerned about the likelihood of making wrong decisions. The problem with

8 1 MEASUREMENT AND TRACEABILITY
Table 1.3 The options available for characterising the dispersion of results (uncertainties)depend on the mathematical options available. Each scale has available the measures of averageand dispersion as indicated and those of the scales above it
Scale type Allowable Statistical Statistical measureoperations average of dispersion
Nominal = Mode Non-parametricOrdinal = <> Median PercentilesInterval = <> + − Arithmetic mean Standard deviationMetric =<> + − × ÷ Geometric or harmonic mean Per cent deviation
nominal scales is that there are many ways of being wrong. Chemical tests for lead, forexample, may confuse lead with other heavy metals: mercury, tin, cadmium, antimonyand other neighbours of lead in the periodic table. The consequences of failing toidentify the other metals correctly may all have different consequences, depending ofcourse on the purpose of the measurements. With measurements on nominal scales itis usually necessary to consider every possible outcome of the measurements, so riskand uncertainty analyses can become complex.
With ordinal scales, the problem becomes much simpler because measurementscan be wrong in only one of two ways, too big or too small (this is the Goldilocksscale), and sometimes only in one way (pass–fail). Risk is then evaluated strictly interms of the distribution of probabilities for particular outcomes, which can usually becharacterised simply in terms of percentiles.
With metric and interval scales, the distributions of possible results can often beexpressed in terms of a model based on metric parameters. Thus all of the classicaldistributions, such as the normal, geometric, chi-square, Poisson, binomial, etc., can beused to characterise uncertainty. In this way, the description of the distributions can berendered in terms of one or two numbers. This greatly simplifies risk and uncertaintyanalysis.
With metric scales, an additional possibility is available, namely geometric orharmonic analysis, which is based on distributions measured in terms of ratio ratherthan interval. An analysis of quantities measured on log-ratio scales using intervalstatistics is effectively a ratio analysis of the underlying metric quantity. Note that theISO Guide strictly applies only to interval and metric scales, since the concepts of anarithmetic mean and standard deviation depend on meaningful measures of difference.However, many ordinal scales approximate metric scales or are sufficiently linear oversmall ranges to be treated as interval scales for the purposes of statistical analysis.Chapter 2 gives a detailed treatment of uncertainty in measurement as it is applied tometric and interval scales.
Exercise 1.2
Consider the following examples where numbers are assigned to objects orstates. In what context could they be interpreted as measurements? Consider thenumbers on a roulette wheel, street numbers, the ‘seed’ used to start a randomnumber generator, a car numberplate, and a musical note indicated on a musicalmanuscript. To what type of measurement scale to they belong?

1.2 MEASUREMENT 9
1.2.3 The problem of definition and the importance ofpurpose
Consider the statement
water temperature = 20° C ± 1 °C.
The description ‘water temperature’ is a shorthand statement for something like ‘thetemperature of the chilled water on the outlet side of heat exchanger no. 2 on theUpside Downs site of the Moojoose Dairy Company’. The problem of clearly definingthe measurand is called the problem of definition, and has two parts, one simple andone rather subtle and complex.
The first and simplest part of the problem of definition relates to the identification ofthe quantity measured. In principle, as given in the example above, all that is requiredis to provide sufficient information to allow the measurement to be repeated. Influencesmay also have to be specified, for example the operating conditions of the plant andthe time of day that the measurement was made.
The second and most difficult part of the problem of definition relates to the tech-nical definition of the attribute that is being measured. In this case, what do we meanby temperature? As we shall see in Chapter 4, the temperature of a system is strictlydefined only in conditions of thermal equilibrium, that is no net flow of heat betweenany of the components of the system. The catch in the tail of this definition is thatnormally we are only interested in temperature because we want to understand some-thing about the flow of heat from the system.
In the calibration laboratory our calibration baths and furnaces are designed to havea controlled volume that is in thermal equilibrium. A measure of the temperature hasonly one possible meaning and there can be no confusion. In contrast, in some indus-trial situations the system is so far from thermal equilibrium that different thermometersread different temperatures. A fluorescent tube is a good example. The electron temper-ature may be 30 000 °C, and the colour temperature of the radiation from the tube isabout 5600 °C. Yet the tube is cool enough to touch. In cases where there is no thermalequilibrium the concept of temperature is at the very least ambiguous, at worst mean-ingless. Yet any thermometer immersed into a non-equilibrium system will indicate atemperature. In order to make a meaningful measurement we have to understand thepurpose of the measurement.
Heat is transported by conduction, convection and radiation. The thermal interac-tion of any system with a second system depends on the relative contributions of thedifferent modes of heat flow. (This topic is covered in detail in Chapter 4.) If weare interested in a temperature that describes the thermal conditions experienced bythe second system then the only meaningful way to define a temperature is to use athermometer that duplicates the thermal conditions obtained when the second systemis placed in thermal contact with the first. The definition of temperature is then deter-mined as much by the thermometer as the system of interest. That is, the meaning oftemperature is determined by the purpose of the measurements. With the fluorescenttube, the design of the thermometer and the results of the measurement depend onwhether we are interested in the current density at the electrodes, the colour renderingproperties of the lamp, or whether there is a burn risk to human fingers.

10 1 MEASUREMENT AND TRACEABILITY
In the most precise temperature measurements, the insertion of a thermometerusually causes a measurable disturbance. Examples include the heat dissipated byresistance thermometers, the loss of radiation through apertures in blackbody cavities,and heat losses along the stems of all insertion thermometers. In most of these casesthe system remains very close to equilibrium and the physics of the measurementprocess is well enough known to allow us to model the effects and apply corrections,or to enable the measurement to be designed so the effects are negligible. This topicis covered in detail in Chapter 4.
Even in large industrial plants modelling can be an effective solution to the problem.For example, sections of the wall of a large chemical reactor could be considered tohave zero net heat flow; for example, a 100 kW flux into the reactor wall is balanced bya 100 kW flux out of the wall. So long as the thermometer is smaller than the volumeover which the temperature can be said to be constant we can measure a meaningfultemperature.
Where measurements take on high monetary value or are associated with highrisks, it is important that the technique employed be acceptable to all parties. This isthe rationale for many documentary standards, not just in temperature measurementbut measurement in general. A particular example might be a safety standard wherethe temperature of a surface is measured using a thermocouple mounted in a ‘standardfinger’, which duplicates the thermal properties of the human finger. In this way, the‘temperature measurement’ has little utility as a measure of temperature but significantutility as an assessment of burn risk.
Measurements with definition problems are often the source of great argument.Unfortunately most scientists are passively taught to ignore the possibility of definitionproblems. Physicists in particular are taught that the aim of their science is to eliminatehuman subjectivity from their models of the universe. This is an admirable aim butthere follow the inevitable problems of making conceptual definitions and modelsuseful. To a theoretical physicist a length is the distance between two points. To ametrologist the most accurate measure of the length of a gauge block is the meandistance at 20 °C between the two end-planes, which are ideally parallel, with oneplane defined optically and the other defined by a monolayer of oil and mechanicalinterference with a flat surface of the same mechanical finish. The first definition isconceptual, the second is practical and driven by a purpose: the need to disseminatepractical standards of length at the least uncertainty. Thus for all of our measurementsthe quantities we measure are to a degree approximations to some conceptual ideal,with the non-ideal aspects of the measurement managed or controlled according to apurpose. Usually the further we get from the calibration laboratory the less control wehave over the non-idealities or influence variables, and the more difficult our definitionproblems become.
The telltale sign of a definition problem is a measurement where the result seemsto vary with the measurement technique. Such measurements tend to be subjective anda source of argument until the purpose has been properly identified. In thermometry,surfaces, gases and flames are particular problems.
Note that measurements made for one purpose may not be useful for anotherpurpose. While documentary standards can be useful guides for factors affecting aparticular measurement, blindly applying standards to measurements for which they

1.2 MEASUREMENT 11
were not designed can lead to misleading or valueless results. Similarly, taking measure-ments of some handy attribute ‘just in case’ can also be risky if the measurement islater found to be ill suited to the required purpose.
Exercise 1.3
Think about alternative definitions of length and how they might depend onpurpose. For example, the length of a pendulum, the length of an athlete’s jumpin the long jump pit, the distance between Paris and Beijing by air or road. Howdo they compare to the theoretical physicist’s definition?
1.2.4 Decision, risk and uncertainty
All measurements eventually contribute to a decision, and associated with each decisionare risk and reward. In this section we take a very brief look at the evaluation of risk,as this can affect the design and interpretation of measurements. The simplest casesoccur when a single measurement leads to a pass or fail decision. In complex cases,multiple measurements contribute to a figure of merit that is the basis of decisions. Inevery case, the quality of the decision is affected by the uncertainty in the measurement.Figure 1.1 shows one example and Table 1.4 shows the possible outcomes of decisionsbased on the measurement.
Once the consequences of a decision have been identified, the decision process andmeasurement can be modified to maximise the rewards and minimise the risks. Inorder to avoid the high costs associated with the ‘incorrect-pass’ risks (Table 1.4) theusual strategy is to increase the pass–fail criterion, as in Figure 1.1. For this reason,industries supplying goods on the basis of net weight usually overfill their containers.
The required increase in the pass–fail criterion is determined by the uncertainty inthe measurements. Thus by reducing the uncertainty one can also reduce risk or increase
Fail Pass
True product grade Modified pass line
Figure 1.1 A simple decision made on the basis of a single measurement. If the true value isas indicated then, because of the uncertainty in the measurement, the result of the measurementmay be anywhere under the curve. The shaded area indicates the probability of making a wrongdecision

12 1 MEASUREMENT AND TRACEABILITY
Table 1.4 The possible outcomes of decisions based on uncertain measurements
Pass Fail
Correct Correct identification of satisfactoryproduct or plant operation. Thisis where the company makesmost of its profit
Correct identification ofpoor-quality product orsub-optimal operation. Thiseliminates risk of prosecution,plant failure or customerdissatisfaction
Incorrect These decisions carry a highexternal risk or cost, possibleplant failure, prosecution forsubstandard goods, or consumerdissatisfaction
These decisions carry an internalcost, often associated with unusedplant capacity, wasted product,unnecessary reprocessing, or lowprices for second-grade product
the rewards. In some cases the benefits of improved measurements can vastly outweighthe costs. Examples of this are found in the petroleum industry where measurementsare made to 0.01 °C to enable thousands of tonnes of aviation fuel to be classified atthe highest grade. This phenomenon is common where pass–fail criteria are definedor regulated, and large quantities of product are involved.
Commonly the most costly wrong decisions are associated with catastrophe: plantfailure or huge costs from which there is no recovery. In these cases, the optimisation isstraightforward: keep well away from the catastrophe. It is also common for industriesto forget the internal costs associated with ‘incorrect–fail’, a reason for the emphasison this quarter in quality management systems. From the measurement perspective thekey factor that makes any optimisation possible is knowledge of the uncertainty in themeasurement. In Chapter 2 we give a guide to expression of uncertainty in measure-ment. Readers interested in the optimisation of decision making should consult bookson game theory, and may find risk analysis software available for spreadsheets useful.
Exercise 1.4
Do a risk benefit analysis on a temperature measurement system used for thetemperature control of a baking oven. The decision table for this example is morecomplex than Table 1.4 since the measurement has three outcomes too high, justright and too low instead of the two-outcome pass–fail example of Table 1.4.
1.3 Temperature
In this section, we describe the evolution of temperature measurement from the perspec-tives of a classical historian, a physicist and a meteorologist. The main purpose is toprovide a historical background for subsequent chapters and to illustrate the princi-ples outlined in previous sections. The history of temperature measurement is a goodexample of the evolution of the measurement of a poorly understood ordinal quantityto a metric quantity founded on sound physical principles. The differences betweenthe physicist’s and the meteorologist’s approaches also highlight differences between
1.3 TEMPERATURE 13
scientific and applied measurements, and in particular the importance of purpose andaccepted measurement protocol in the design of applied measurements.
1.3.1 The evolution of the temperature scale
The very first record of a temperature scale belongs to the Greek Galen (AD 130–200)who identified eight degrees of temperamentum, which he used to characterise thetemperament of his patients and the effects of his medicines. He also defined a neutraltemperature based on equal mixtures of boiling water and ice. However, he did nothave a thermometer so the temperature was presumably assessed with the physician’shand. A more sophisticated version of Galen’s scale of temperament surfaced again tohelp physicians in the sixteenth century.
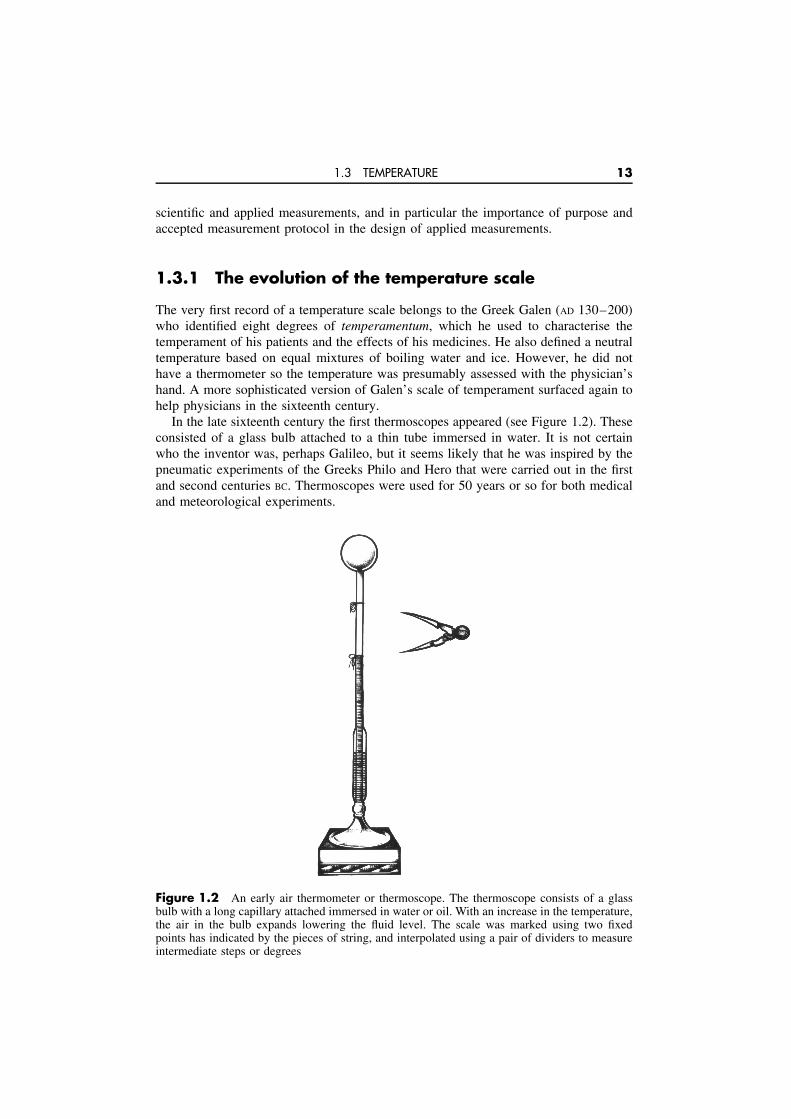
In the late sixteenth century the first thermoscopes appeared (see Figure 1.2). Theseconsisted of a glass bulb attached to a thin tube immersed in water. It is not certainwho the inventor was, perhaps Galileo, but it seems likely that he was inspired by thepneumatic experiments of the Greeks Philo and Hero that were carried out in the firstand second centuries BC. Thermoscopes were used for 50 years or so for both medicaland meteorological experiments.
Figure 1.2 An early air thermometer or thermoscope. The thermoscope consists of a glassbulb with a long capillary attached immersed in water or oil. With an increase in the temperature,the air in the bulb expands lowering the fluid level. The scale was marked using two fixedpoints has indicated by the pieces of string, and interpolated using a pair of dividers to measureintermediate steps or degrees

14 1 MEASUREMENT AND TRACEABILITY
Ferdinand II of Tuscany made the first sealed thermometer using wine spirit in 1641.This was the first device that we would recognise as a thermometer and was a majoradvance: a liquid sensor sealed against atmospheric pressure variations and evaporation,and degrees of temperature permanently marked on the stem. Subsequent developmentsof thermometers focused on improved methods of manufacture, especially on the choiceof thermometric fluid and glass, and the method of fixing the scale.
By the early eighteenth century most liquid-in-glass thermometers were stable andhad a reproducible scale. Typically the scales were marked using the temperatures offixed points, such as melting snow, body temperature and boiling water (see Figure 1.3).The scale was then divided into a convenient number of steps or degrees. These scalesare clearly ordinal scales with fixed points, and with the temperatures in betweendetermined by interpolation using the expansion of the thermometric fluid, usuallymercury. The familiar scales of Fahrenheit and Celsius are good examples of thesetypes of scales. Elegant experiments involving the mixing of known volumes of hotand cold mercury, or hot and cold wine spirit, enabled experimenters to establish thatmercury is a more linear thermometric fluid than spirit, but that both are non-linear tosome extent.
In the late eighteenth century Gay-Lussac and Charles, building on the ingeniouswork of Amontons 100 years earlier, were both able to demonstrate that the thermalexpansion coefficients of different gases were almost identical. Although Amontons hadsuggested that the linear expansion of gases with temperature implied that only onefixed point was required to calibrate a thermometer (i.e. to establish a metric scale), anda number of experiments determined values for absolute zero (−273.15 °C), the sugges-tion was not adopted. Chappuis, working at the BIPM, refined gas thermometry further.He had been charged with the responsibility of calibrating a set of mercury-in-glassthermometers by gas thermometry. During a series of remarkable studies comparingtemperatures determined using different gases he showed that the gas thermometerdid in fact have a small gas species dependence, and that a scale based on hydrogen,although not ideal, was probably accurate to better than 0.01 °C. In 1889 the ConferenceGenerale des Poids et Mesures (CGPM), at its first meeting, adopted the first officialtemperature scale, the ‘normal hydrogen’ scale. Because of the known dependence ofthe scale on the non-ideal properties of hydrogen the initial filling pressure of the ther-mometer was also specified. This scale was still not a metric scale; instead the scalewas defined by fixing the interval between the ice point and steam point to be 100 °C.The scale was an ordinal approximation to an interval scale based on two fixed pointsand an almost linear interpolating instrument.
The first proposals to use the variation of electrical resistance to measure temperaturecame from Davy in 1821 and later Siemens in 1861. However, it took the elaborateexperiments and refinements in the construction of platinum resistance thermometersby Callendar to get the resistance thermometer accepted. By comparing the platinumresistance thermometer with the gas thermometer, Callendar and others were ableto show that platinum has a parabolic or quadratic characteristic. In 1899 Callendarproposed a temperature scale that would be more practical than the ‘normal hydrogen’scale, based on three fixed points: the ice point, the steam point and the melting pointof sulphur. The scale was defined by fixing the interval between the ice point and steampoint to be 100 °C, with the sulphur point defined to be 444.5 °C as determined by a gasthermometer calibrated at the other two points. Callendar’s proposal, again an ordinal

1.3 TEMPERATURE 15
Figure 1.3 A thermometer from the mid-eighteenth century. It has a large bulb because ofthe large capillary. Note too the inverted scale, which was common in cooler countries wherethere was more interest in the number of degrees of cold than in the number of degrees of heat
approximation to an interval scale, was extended to a wider range of temperaturesusing more fixed points and was adopted in 1927.
The latter half of the nineteenth century saw the beginning of the golden age ofphysics and with it the development of the sciences of thermodynamics and statisticalmechanics. Despite these theoretical developments giving meaning to temperature andsuggesting a metric temperature scale, it took approximately 100 years before a metricscale was formally adopted. In 1960 the unit of temperature, the kelvin, was defined

16 1 MEASUREMENT AND TRACEABILITY
Temperature (°C)
−200 −100 0 100 200 300 400 500 600
0.025
0
−0.025
−0.050
−0.075
−0.100
t 90−t
68 (
K)
Figure 1.4 The differences between ITS-90 and the earlier scale IPTS-68
as 1/273.16 of the temperature of the triple point of water. There was also a change inthe way temperatures were reported. Prior to 1960, measurements on the temperaturescale were reported as degrees Kelvin (°K), meaning ‘steps’ on Kelvin’s scale. Since1960 measurements have been reported as numbers of kelvin, kelvin being the unit forthe metric scale.
The advantage of Callendar’s platinum resistance scale was that it was more highlyreproducible, simpler and more practical to realise than a thermodynamic scale basedpurely on a gas thermometer. Even today, thermodynamic measurements prove to beextraordinarily difficult, and may cost as much as 20 person-years of effort to achieveaccuracies an order of magnitude short of that necessary to support scientific researchand commerce. The most practical solution is to adopt a ‘wire scale’, a scale based onhighly reproducible thermometers, calibrated at fixed points, for which the temperatureshave been determined by thermodynamic means.
As we have already noted the first wire scale was adopted in 1927 and covered therange from −190 °C upwards. Since then there have been revisions in the internationaltemperature scale occurring in 1948, 1968 and 1990. These revisions have providedimprovements in respect of closer approximation of the thermodynamic temperature,improved interpolating equations, extensions to lower temperatures, and greater acces-sibility for users. Figure 1.4 shows the differences between ITS-90 and the InternationalPractical Temperature Scale of 1968 (IPTS-68), and equations and a table of differenceare given in Appendix A. Chapter 3 discusses ITS-90 in detail.
1.3.2 Thermodynamic temperature
For most materials temperature can be considered to be a measure of the density of heatin a body. While this interpretation appeals to intuition and is useful in many situations,it is not especially helpful when comparing different materials or materials near boilingpoints or other phase transitions. A better model is required. A thermodynamic analysisof Carnot engines (a particular form of ideal heat engine) shows that the efficiency of

1.3 TEMPERATURE 17
reversible heat engines depends only on temperature. In particular the ratio of heat Q1
taken in at a high temperature θ1 to the heat Q2 given out at a lower temperature θ2
depends purely on the ratio of a function of the temperatures:
Q1
Q2= f (θ1)
f (θ2), (1.1)
where θ is any empirical measure of temperature. Kelvin’s breakthrough was to recog-nise that the relationship could be used to define the temperature T :
Q1
Q2= T1
T2. (1.2)
Kelvin was also able to show that this definition leads to an equation for ideal gasesof the form
PV = constant × T , (1.3)
so that Kelvin’s definition of temperature is equivalent to the gas scale originallyproposed by Amontons, and implemented by Chappuis in 1889. While Kelvin’sapproach provides a definition of temperature, it does not provide much insight intothe nature of the temperature. A diagram of a gas thermometer designed by Kelvin isshown is Figure 1.5.
It took the combined work of Maxwell, Boltzmann and Gibb, using what is nowknown as statistical mechanics, to solve the problem. By considering the movement
Mercurymanometer
Thermostaticchamber
Hydrogengas
Glasspiston
Mercuryreservoirs
Figure 1.5 A constant-pressure hydrogen-gas thermometer designed by Kelvin. The glasspiston is adjusted so that the pressure from the mercury manometer is constant. Under theseconditions the volume of gas in the thermostatic chamber is proportional to temperature. Thevolume of the chamber is indicated by the displacement of the piston. The other mercurycontainers provide seals for the piston

18 1 MEASUREMENT AND TRACEABILITY
Table 1.5 Some of the equations of state that have been used as the basis for thermometersto measure the thermodynamic temperature
Thermometer Equation of state
Gas thermometer: pressure, P , and volume, V , of gasversus number of molecules, n, and temperature
PV = nkT = NRT
Total radiation thermometer: total radiance, L, versustemperature
L = 2π5k4
15c2h3T 4
Spectral band radiation thermometer: spectral radiance,Lλ, versus wavelength, λ, and temperature
Lλ = 2hc2
λ5
[exp
(hc
λkT
)− 1
]−1
Acoustic thermometer: speed of sound, cs, versusspecific heat ratio, γ , molecular mass, m, andtemperature
c2s = γ kT
m= γRT
M
Noise thermometer: mean square noise voltage V 2T
versus real part of impedance, Z, bandwidth, �f , andtemperature
V 2T = 4kT Re(Z)�f
molar gas constant, R = 8.314 447 2 J mol−1 K−1 speed of light, c = 299 792 458 m s−1
Planck’s constant, h = 6.626 068 76 × 10−34 J s Boltzmann’s constant, k = 1.380 650 3 × 10⁻²³ J K−1
and collisions of individual atoms in a closed box they were able to show that thermalequilibrium requires the mean kinetic energy of all the atoms to be the same. Whenapplied to an ideal gas they obtained the result
PV = constant × < mv2/2 >, (1.4)
where 〈mv2/2〉 is the average kinetic energy of each atom in the gas. Comparisonof this equation with Equation (1.3) shows that the temperature is proportional to theaverage kinetic energy of each atom, which finally gives a meaning to temperature thatwe can comprehend relatively easily. Note that the total kinetic energy of moleculargases is higher than that for monatomic gases because they can rotate and vibrate; inthat case the temperature is proportional to the mean translational kinetic energy.
When the principles of thermodynamics and statistical mechanics are applied toother idealised systems we obtain equations of state that may be exploited in thermo-dynamic thermometers. A few of the equations and the corresponding thermometersare described in Table 1.5. All of these thermometers have been, and continue to be,used to measure temperature on the thermodynamic scale. Unfortunately the accu-racy of thermodynamic thermometers falls well short of the repeatability and easeof use required for both research and commerce. Figure 1.6 summarises the latestmeasurements of the differences between the thermodynamic scale and ITS-90. Thedistributions of results presented are indicative of the accuracy of the thermodynamicthermometers. By comparison the ITS-90 scale achieves a repeatability of about 1 mKover the same temperature range.
1.3.3 Meteorological temperatures
In contrast with thermodynamic measurements, which represent the best efforts tomeasure temperature in accordance with the theoretical concepts, meteorological

1.3 TEMPERATURE 19
Temperature (°C)−250 0 250 500 750 1000
0.06
0.05
0.04
0.03
0.02
0.01
0
−0.01
−0.02
T−T
90(K
)Gas thermometer
Spectral radiation thermometer
Acoustic thermometer
Figure 1.6 The latest measurements of the differences between ITS-90 and the thermody-namic temperature scale
temperature measurements are amongst the most empirical. In this section we discussmeteorological temperature in more detail to highlight some of the difficulties of givingmeaning to temperature measurements when the system of interest is not in thermalequilibrium.
Some of the earliest thermometry observations recorded the change in temperatureduring the day. It was hoped that the measurements would correspond to how hotor cold a person felt, but this was not always the case. Lakes felt warm in winterand cool in summer, but the thermometers indicated otherwise. Problems also arosewhen people compared observations. An observer at one site, where the thermometerwas kept in a living room heated by a fire, would find that the temperature variationwas less than that of an observer who kept the thermometer in a spare room. Anotherobserver, who thought that thermometers should be located outside the window on thesunny side of the house, found an even wider temperature variation.
It took some time before everybody was convinced that meteorological readingsshould be taken outdoors, even though temperature variations could be greater thanfor measurements made indoors. Debate continued as measurement techniques becamemore refined: should the thermometer be near a building, shaded from the sun, protectedfrom the wind, and how large should the thermometer be?
Finally, after about 150 years, meteorologists settled on the Stevensen screen, asshown in Figure 1.7, to protect and mount the thermometer. The screen has double-louvred walls with the louvres sloping in opposite directions to allow the air to circulateyet block all radiation from direct access to the chamber. The screen must be mountedat a fixed height above the ground, a minimum distance from buildings and trees,and the paint used on the screens is specified. The thermometer is also specified andmust be calibrated to 0.1 °C. Despite the tight specification based on 250 years ofdevelopment the screens are only expected to be reproducible to about 1.5 °C!
So what then is the correct meteorological temperature? Ideally, we want to measurethe air temperature, but this is not possible with a contact or immersion-type ther-mometer. In an ideal situation, such as a stirred liquid, the thermometer is in verygood thermal contact with the liquid and very poor thermal contact with everything

20 1 MEASUREMENT AND TRACEABILITY
Mer
cury
man
omet
er
Hyd
roge
n ga
sG
lass
pis
ton
Mercuryreservoirs
Figure 1.7 An early constant-pressure hydrogen gas thermometer designed by Kelvin. Thevolume of gas in the thermostatted chamber can be altered by adjusting the glass piston so thatthe pressure from the mercury manometer is constant. The other mercury containers providesealing for the piston
else around it. Therefore, it reads a temperature very close to that of the liquid. Airon the other hand has a very poor thermal conductivity, a very low thermal mass, istransparent to most infrared radiation and is extremely viscous (its kinematic viscosityis similar to that of treacle!). In air, a thermometer is in poor contact with everything.The still air that could be said to be in immediate contact with the thermometer mayhave a mass much less than a gram, far less than the mass of the thermometer. If theconditions become windy, effectively increasing the mass of air in contact with thethermometer, then thermal contact with the air can improve by more than 100 times.At room temperature, everything radiates infrared radiation totalling about 500 W m−2,

1.4 TRACEABILITY 21
so the thermometer is in radiative contact with literally everything around it. Thisradiative contact is not trivial and is very difficult to control. The relative effect ofconduction and radiation also depends on the size of the thermometer.
In the final analysis the thermometer measures a very complex weighted averageof the temperature of the air and all of the other objects around it, and it proves tobe practically impossible to eliminate the effects of the other objects. However, withthe use of screens and the other constraints it is practical to establish a measurementprotocol that controls the most significant influence effects and delivers a result closeto the physical definition. This ensures that results in different parts of the world arecomparable. Thus with meteorological measurements the temperature has an uncertainphysical meaning but does provide an internationally accepted basis for comparingmeteorological conditions related to human comfort.
The use of the Stevenson screen highlights a traceability issue common to allmeasurements, which is essentially a problem of giving meaning to the measuredquantity. Whereas a physicist (or any other theoretical scientist) may have a conciseconceptual definition of the quantity measured, in almost every practical measurementthere are problems leading to ambiguities or uncertainty. Therefore, if the measure-ment is to have meaning or be comparable with similar measurements made elsewherewe must follow accepted measurement protocols. In this example, the ‘meteorologicaltemperature’ is defined by international standards for the screens and thermometers,and anyone who wants to claim to have measured the meteorological temperature mustconform to those standards.
1.4 Traceability
1.4.1 Defining traceabilityThe ISO definition of traceability is:
Traceability:The property of a result of a measurement whereby it can be related to appropriatestandards, generally national or international standards, through an unbroken chainof comparisons each with a stated uncertainty.
There is considerable scope for variation in the interpretation of this definition. Inorder to clarify the meaning let us consider a few of the possible interpretations andinvestigate their limitations. While we discuss these options, we should keep in mindthat the purpose of traceability is to enable different users, potentially on opposite sidesof the world, to compare measurement results meaningfully.
Case 1: The dictionary interpretation
The word traceable has a wide range of colloquial meanings, the most appropriatebeing ‘able to be followed to the source’. This adds nothing to the ISO definition,but does highlight two important points. The ISO definition tells us where the chainbegins and ends. Specifically, it begins with the measurement result, not with theinstrument. Secondly the uncertainty provides a measure of the proximity to the sourceof traceability.

22 1 MEASUREMENT AND TRACEABILITY
Case 2: The measurement scale interpretation
Following our exposition in Section 1.2.2 on measurement scales we could argue thattraceability simply requires all measuring instruments to use the same measurementscale. However, this is not a very discerning interpretation. If we look around us wefind that almost all of our measuring instruments indicate results in terms of the SIscales, so we must conclude that almost every measurement is already traceable. It hasalso happened on occasions that very good thermometers, such as standard platinumresistance thermometers, have been ‘calibrated’ using very poor thermometers such asthermocouples. In such cases the scale on the calibrated thermometer is not as goodas it could or should be. Thus it is useful to have a measure of the quality of the scaleand, as we noted in Section 1.2.4, it is necessary to know the uncertainty to makesensible decisions. Both arguments provide the rationale for the requirement in theISO definition for stating the uncertainties.
Case 3: The filing cabinet interpretation
Let us suppose that for each measuring instrument used to make traceable measure-ments there is a calibration certificate kept in a filing cabinet, which allows the locationof another filing cabinet to be traced, and so on, until a filing cabinet containing a certifi-cate for the primary standard is found in a national measurement institute. Let us furthersuppose that each of these certificates appears to be a good and useful certificate; thatis, each reports the uncertainties in measurements obtained with the instrument, underthe appropriate specified conditions. The problem here is that possession of a certificateis no assurance that the final measurement, or indeed any of the measurements, havebeen carried out competently.
Case 4: The laboratory accreditation interpretation
In this case each of the laboratories involved in the calibration of the instrumentsand the final measurements is required to have the filing cabinets and certificates,but is additionally subject to an independent and expert audit of the entire measure-ment process. In this scenario, there is no real opportunity for measurement resultsto become corrupted in any sense (unless we question the competence of the accred-iting body, and there are accreditation processes for them too). This requirement foran assessment of technical competence is not stated in the ISO definition of trace-ability, but accreditation to ISO 17025 General requirements for the competence oftesting and calibration laboratories has become the practical working definition oftraceability.
To summarise, we can interpret the ISO definition to mean:
Traceability (alternative definition):The ability to demonstrate the accuracy of a measurement result in terms ofappropriate national or international standards.
For thermometry, the appropriate standard is the SI kelvin.

1.4 TRACEABILITY 23
1.4.2 Achieving traceability
So how is traceability achieved in practice? Clearly a substantial community effort isrequired. In general there are three main requirements for an international measurementsystem, as follows.
A source of primary physical standards
Primary physical standards are required to provide a unique definition of the measure-ment scales. Easily the most important source is the SI, Systeme International d’unites,which defines a system of seven base measurement scales, and primary physical stan-dards for the unit for each of those scales. The scales for a large number of othermetric quantities are also derived from the seven base scales. The SI is managed andmaintained under a diplomatic treaty originally signed in 1875.
A large number of measurements are also made on non-SI scales, especially nominal,ordinal and interval scales, and these scales also require standards. These include forexample: proprietary colour scales owned by the manufacturers of printing inks; scalesbased on tightly specified testing machines such as for Rockwell hardness, engineoctane rating for fuel, and viscosity; and chemical scales for complex mixtures thatare based on certified reference materials.
A source of documentary standards
With difficult measurements, as we found with meteorological temperatures, it is some-times necessary to agree on a measurement protocol in order to be able to makecomparable measurements. This is true also for measurements of viscosity, thermalresistance and electrical resistance; indeed almost all temperature-related product tests.Test methods for these quantities are usually standardised and published as documentarystandards.
Documentary standards are also used to define other protocols, some of which havea direct effect on measurements. These include standardised responses for platinumresistance thermometers and thermocouples, mechanical specifications for electricalinstruments and parts, software specifications and interfaces, and quality assurancesystems. While such standards may not have a direct impact on traceability they dobenefit the measurement community by ensuring that sensors, instrumentation andsystems made by different manufacturers are equivalent or compatible.
The documentary standards system is a rather mixed group of national and interna-tional organisations, and some centred on professional societies or particular industries.
A source of independent third-party assessors
Measurements are quite unlike many of the products that we buy. When we buy atelevision set or a banana we can see something of the quality of the product that weare buying. With a measurement there is generally no way to tell from the result wereceive whether the measurement is of good or bad quality. Measurements are alsodifferent in another way. Whereas a television manufacturer might like to change the

24 1 MEASUREMENT AND TRACEABILITY
model each year or provide additional marketing gimmicks, a measurement sold onthe basis of being made in terms of the ITS-90 temperature scale should mean nomore and no less. In a sense the terms ‘kelvin’, the other SI units and other primarystandards have accepted meanings, and the measurement community cannot afford toallow those meanings to become corrupted. If changes in meaning were allowed asupplier of measurements would be able to tender on the basis of the largest kelvin orthe shortest metre. Chaos would soon result.
Given that a calibration or testing laboratory has followed documentary standardsand calibrated its equipment, it must demonstrate that it has conformed to the commu-nity expectation in respect of measurement standards and technical procedures. Themost important accreditation bodies are those accrediting to ISO 17025 General require-ments for the competence of testing and calibration laboratories. Most countries nowhave organisations that offer accreditation and are recognised through mutual recogni-tion agreements and the International Laboratory Accreditation Co-operation (ILAC).This ensures that the results from laboratories endorsed by these organisations areaccepted in other countries. Because of the importance of measurement in the devel-opment and utilisation of technology, and the technological standing of countries asperceived by their trading partners, accrediting organisations are usually establishedunder government regulations.
There are also other third-party assessment schemes. These are often associated withspecific industries such as the military or aviation industry. Increasingly, however, theseschemes are evolving towards and merging with the ISO 17025 system.
In the following sections we investigate these three components in more detail.
1.5 The SI
1.5.1 The metre conventionIn a museum in Utrecht lies a thermometer with 18 different scales marked on awide board behind the thermometer tube. The early 1700s were a time when eachthermometer manufacturer had its own proprietary scale and natural philosophers wereonly beginning to appreciate the value of meteorological observations that could becompared with those made at other places. This was a lesson that traders have knownsince at least the time of the pharaohs. Nowadays temperature is one of the mostmeasured quantities and is associated with commerce and technology reaching acrossevery continent. Were we still to have 18 scales, disasters like the recent NASA MarsClimate Orbiter fiasco, which was caused by the confusion of SI and Imperial units forthe small translational forces imparted by the jets that rotated the satellite, would becommonplace. The only way to be sure of the clear communication of measurementresults is for all users of the measurements to share a common system of measurement.
The seeds of the SI system were planted by King Louis XVI at the time of the FrenchRevolution; he wanted a decimal system of measurement. The metre was defined tobe 1/10 000 000 of the distance between the Equator and the North Pole as measuredalong the quadrant that passes through Paris. (That the earth has a circumferencethat is almost exactly 40 000 km is no coincidence.) After the definition of the metre,the kilogram was defined to be the weight of 1 cubic decimetre of water. Platinum

1.5 THE SI 25
artefact standards representing these two quantities were deposited in the Archives dela Republique in Paris. All measures of length and weight were derived from thesestandards, and hence these scales were amongst the first to be implemented as trulymetric scales.
By the middle of the nineteenth century international trade was on the increaseand a number of eminent scientists and industrialists of the time foresaw the valueof a universal system of measurement and lobbied their governments intensively. Themetric system was the obvious choice since it was well established in several Euro-pean countries. Seventy-five years after King Louis XVI founded the metric system,on 20 May 1875, 17 nations signed a diplomatic treaty, the Convention du Metre.This established an international organisation, and a laboratory, the Bureau Interna-tional des Poids et Mesures (BIPM), on land set aside by the French government,with the responsibility of maintaining standards of measurement for the metre, thekilogram and the second. Over the years the responsibility has been extended to coverthe ampere, the kelvin, the candela and the mole. Approximately 50 countries are nowsignatories to the Metre Convention and almost all of the world’s 190+ independentstates use the SI. However, the importance of the treaty is not so much that it estab-lishes a metric system of units but rather that nations agree on the meaning of theunits.
Figure 1.8 shows the various organs of the Convention du Metre. Delegates frommember countries meet at the Conference Generale des Poids et Mesures (CGPM) atfour-yearly intervals to approve the latest recommendations on improvements to the SIand the operation of the organisation. Nearly all of the recommendations come from theother parts of the organisational structure to which member nations have the opportunityto contribute. The consultative committees in particular are made up from experts ineach measurement discipline, usually from the world’s national measurement standardslaboratories, and have the responsibility for overseeing and encouraging appropriateresearch into the various units. This ensures that the units have sufficient accuracy tomeet the ever-increasing needs of commerce and technology, and can be made readilyavailable to those who need them.
When the Metre Convention was signed it was envisaged that the BIPM wouldmaintain the primary standards for all of the various scales. However, scales basedon a single artefact are troublesome. As the number of measurements traceable tothat artefact increases so too does the value of the artefact. The need to protect itfrom damage becomes paramount and it becomes very difficult to disseminate manymeasurements at the highest accuracy. The alternative, which has been pursued vigor-ously, is to base the standards on fundamental physical constants, in the same waythat temperature is defined in terms of the triple point of water. This ensures that thestandards can be rebuilt easily if damaged and in principle copied by every nationalstandards laboratory. Nowadays only one artefact standard is maintained at the BIPM,namely the kilogram. It is hoped that in the near future, the kilogram will join theother units and be defined in terms of fundamental physical constants.
1.5.2 The SI units and conventionsThe SI units are divided into two classes: base units and derived units. In principle,some of the base units are unnecessary since they can be related to each other through

26 1 MEASUREMENT AND TRACEABILITY
CGPM
Conférence générale des poids et mesures: four-yearly meetingbetween delegates from member states
CIPM
Comité international des poids et mesures: 18 experts elected byCGPM to supervise the BIPM and affairs of the convention du mètre
Consultative committees
BIPM
Convention du mètre1875
(diplomatic treaty)
Bureau international despoids et mesures: internationalcentre for metrology, laboratory
and office
National laboratoriesresearch and disseminate
realisations of the SI
Representatives fromnational laboratories andother experts who giveadvice to the CIPM onmatters relating to the
units
Figure 1.8 The structure and responsibilities of the various organs of the Metre Convention
measurements of the fundamental physical constants; however, they are necessary forthe most accurate measurements and are regarded as dimensionally independent. Thecurrent SI definitions for the base units are as follows:
The second (s), the unit of time interval: The second is the duration of 9 192 631770 periods of the radiation corresponding to the transition between the two hyperfinelevels of the ground state of the caesium atom.
The metre (m), the unit of length: The metre is the length of the path travelled bylight in a vacuum during a time interval of 1/299 792 458 of a second.
The kilogram (kg), the unit of mass: The kilogram is the unit of mass, equal to themass of the international prototype kilogram.
The ampere (A), the unit of electric current: The ampere is that constant currentwhich, if maintained in two straight parallel conductors of infinite length, of circular

1.5 THE SI 27
cross-section and placed 1 metre apart in a vacuum, would produce between theseconductors a force equal to 2π × 10−7 newton, per metre of length.
The kelvin (K), the unit of thermodynamic temperature: The kelvin is the fraction1/273.16 of the thermodynamic temperature of the triple point of water.
The candela (cd), the unit of luminous intensity: The luminous intensity, in a givendirection, of a source that emits monochromatic radiation of frequency 540 × 1012
hertz and has a radiant intensity in that direction of 1/683 of a watt per steradian.
The mole (mol), the unit of amount of substance: The amount of substance of asystem that contains as many elementary entities as there are atoms in 0.012 kilogramsof carbon-12. When the mole is used, the elementary entities must be specified andmay be atoms, molecules, ions, electrons, other particles, or specified groups of suchparticles.
The derived units are formed from products and powers of the base units accordingto the algebraic formulae linking the quantities involved. Thus, for example, velocityis measured as metres per second, the ratio of two of the base units. A few of thederived units prove to be so useful that they are given special names and symbols;these are given in Table 1.6.
In order to avoid confusion in the presentation of results the SI conventions shouldbe adhered to.
Table 1.6 The SI derived units with special names and symbols
Derived quantity SI derived unit
Special name SymbolPlane angle radian rad = m · m−1
Solid angle steradian sr = m2 · m−2
Frequency hertz Hz = s−1
Force newton N = kg · m · s−2
Pressure pascal Pa = kg · m−1 · s−2
Energy joule J = kg · m2 · s−2
Power, radiant flux watt W = kg · m2 · s−3
Electric charge coulomb C = A · sElectric potential difference volt V = kg · m2 · s−3 · A−1
Capacitance farad F = kg−1 · m−2 · s4 · A2
Electric resistance ohm � = kg · m2 · s−3 · A−2
Electric conductance siemens S = �−1
Magnetic flux weber Wb = kg · m2 · s−2 · A−1
Magnetic flux density tesla T = kg · s−2 · A−1
Inductance henry H = kg · m2 · s−2 · A−2
Celsius temperature degree Celsius °C = KLuminous flux lumen lm = cd · srIlluminance lux lx = cd · m−2
Activity becquerel Bq = s−1
Absorbed dose gray Gy = m2 · s−2
Dose equivalent sievert SV = m2 · s−2

28 1 MEASUREMENT AND TRACEABILITY
Use of names for units
• When written in full, the names of all SI units start with a lower-case letter, exceptat the beginning of a sentence; for example, kelvin not Kelvin or degrees kelvin,degrees Celsius not Degrees Celsius.
• The symbols are lower case except when named after a person. Hence K is thesymbol for kelvin. When written in full, the names of the units may be made pluralaccording to the rules of English grammar; for example, ‘temperature difference inkelvins’.
Use of the symbols for units
• Symbols should be used to denote the units when reporting numerical results,and the full name when referring to units in written text. The symbol should beseparated from the last digit by a single space, e.g. 273.15 K not 273.15 K.
• When reporting quantities with compound units formed by the product of two ormore units, the unit symbols should be separated by a half-high dot, dot or a space;for example, for metre-kelvin: m.K or m.K or m K, but not mK, which impliesmillikelvin.
• When reporting quantities with compound units formed by ratios of two or moreunits, exponentiation or a single solidus may be used. Parentheses should be usedto prevent ambiguities: for example, W/m2 or W.m−2; J/(kg.°C) or J.kg−1°C−1 notJ/kg/°C.
Decimal points and commas
• Numbers less than one should have a single zero before the decimal point. Acomma should be used as the decimal point. In English-speaking countries a doton the line is more commonly used, e.g. 0.1 °C or 0,1 °C, but not .1 °C.
Table 1.7 The most commonly usedSI prefixes
Factor Prefix Symbol
1012 tera T109 giga G106 mega M103 kilo k102 hecto h10 deca da
10−1 deci d10−2 centi c10−3 milli m10−6 micro µ10−9 nano n10−12 pico p10−15 femto f
1.6 DOCUMENTARY STANDARDS 29
• To facilitate the reading of numbers with many digits, the digits may be sepa-rated into groups of three counting from the decimal point. The groups should beseparated by a space, never a comma, which may be confused for a decimal point.
Use of prefixes for symbols
• The most commonly used prefixes are given in Table 1.7.
• When joining a prefix and SI unit symbol, there is no space between the prefixsymbol and the unit symbol, e.g. 10 mK or 10 m °C, not 10 m K.
1.6 Documentary Standards
From a traceability perspective the most important contribution of documentary stan-dards to thermometry is in the area of test methods. There are very few properties ofmaterials that do not change with temperature, and consequently a very high percentageof test methods involve the measurement of temperature.
Documentary standards also cover a number of aspects of interest to thermometrists,including:
• Specifications for the response of platinum resistance thermometers and thermo-couples, and the dimensions and scales for liquid-in-glass thermometers.
• Colour codes for thermocouple lead wires, and colours and dimensions of thermo-couple plugs and sockets.
• The materials and dimensions for sheathing materials and thermowells (the protec-tive pockets used for mounting thermocouples in industrial plants).
• Dimensional and electrical specifications for industrial instrumentation such astemperature controllers.
• Specifications for furnaces and ovens, especially those used for heat treatment andsterilisation.
• Electrical and communication standards for instrument interfaces.• Quality assurance and laboratory accreditation systems.
A short summary of major standards organisations relevant to thermometry is given inTable 1.8.
It is notable that only a few of the standards organisations are truly international.Consequently, there may be differences between standards from different organisa-tions, apparently for the same device or protocol. Particular examples include thestandards for platinum resistance thermometers and thermocouples, where there aresmall differences. As the standards have been revised following the change to theITS-90 temperature scale, many of the standards have become harmonised.
It is beyond the scope of this book to catalogue all of the temperature-relatedstandards available from these organisations. Your local standards organisations willhave catalogues available and may be able to advise which standards are relevant. Inaddition, most of the organisations now have Internet sites, with good search enginesand on-line shops. Many of the organisations also have application guides and manuals

30 1 MEASUREMENT AND TRACEABILITY
Table 1.8 Some of the larger standards organisations that produce thermometry-related docu-mentary standards
Acronym Title Internet address
ANSI American National Standards Institute www.ansi.orgASTM American Society for Testing and Materials www.astm.orgBSI British Standards Institution www.bsi-global.comDIN Deutsches Institut fur Normung www.din.deIEC International Electrotechnical Commission www.iec.chIP Institute of Petroleum www.petroleum.co.ukISO International Organisation for Standardisation www.iso.chJIS Japanese Industrial Standards www.tokyo.jsa.or.jpOIML International Organisation for Legal Metrology www.oiml.org
for particular measurement disciplines, and booklets giving detailed information onthe SI.
Exercise 1.5
Spend an hour or so visiting some of the Internet sites given in Table 1.8 andsearch for standards and documents relating to temperature. If you have responsi-bilities for product testing you should try searching on a few relevant keywords.
1.7 Laboratory Accreditation to ISO/IEC17025
The standard, ISO/IEC 17025:1999 General requirements for the competence of testingand calibration laboratories, has evolved from the ISO Guide 25 of the same name.The standard applies to all calibrations and testing laboratories whether using stan-dard, non-standard or laboratory-developed methods. The standard has two groups ofrequirements: managerial and technical.
The managerial requirements are equivalent to those required under the ISO 9001and ISO 9002 quality systems, and include the following:
• The laboratory’s management must be committed to a quality scheme by ensuringthat policies and objectives are communicated to, and understood and implementedby, all laboratory personnel.
• Independence and financial stability of the laboratory are desirable. Where the labo-ratory is part of a larger organisation it is particularly important for the laboratoryto act independently. There should be no conflicts of interest.
• Quality systems must be properly documented. Procedures must be written to coverthe responsibilities of the staff. Documentation control is needed to ensure that thestaff use the latest procedures.
• New work must be reviewed to understand its requirements and determine whetherthe laboratory can carry it out.

1.7 LABORATORY ACCREDITATION TO ISO/IEC 17025 31
• Records should be made and kept for all work. Regulatory or contractual require-ments may determine the length of time to hold records.
• Complaints and corrective action procedures are essential, especially for the controlof sub-standard testing work.
• Control over procurement of equipment, consumables and services requires proce-dures to see that they are of appropriate quality; for example, calibration certificatessupplied with test equipment.
The technical requirements include the following:
• Staff should be properly qualified and a regular training programme should be inplace.
• Accommodation and environment provisions must be adequate for staff, test equip-ment and test samples.
• There must be adequate management and control of test equipment. This is anessential feature for traceability, which translates into the whole life of a piece oftest equipment being properly documented.
• Calibration of test equipment must be carried out in a timely and proficient manner.
• Test methods, whether in-house or standard methods, must be validated.
• If sampling is involved in any of the work then the laboratory should have asampling plan and procedures.
• There must be procedures for the identification of items for test, and for safehandling and storage, to ensure the integrity of the item.
• Test reports and certificates must be well specified in terms of content and format.
• The laboratory should participate in proficiency testing programmes or employ otherstatistical techniques, where appropriate, to enhance the confidence in procedures.
Because calibration laboratories provide an important link in the traceability chain tothe SI, and may affect many clients downstream from the laboratory, the accreditationprocess for calibration laboratories tends to be more stringent than that for testinglaboratories, especially in respect of the care of instruments and in the assessment ofuncertainty. This is recognised in the ISO 17025 standard. In some countries, separateaccreditation bodies deal with testing and calibration.
If you or your laboratory is considering accreditation you should remember that theaccreditation authority is not a customer but a supplier of a service. You are paying theauthority to represent your clients’ interests, and you should be treated as their client.It is not a regulatory authority, although it may request conformance to documentarystandards if that is what your clients expect, and will judge whether you are conformingto any documentary standards that you nominate. Remember too that when it assessesyour laboratory it acts on behalf of its other clients who expect it to help maintain theintegrity of the various parts of the measurement system. The service it provides isthe acceptance of your test and measurement results by a wide range of internationalcustomers.
Users of measurement results should be careful to distinguish between accreditationand certification. In the quality industry, accreditation is a jargon term applied strictly

32 1 MEASUREMENT AND TRACEABILITY
to companies assessed for competence according to the ISO 17025 standard. Whenapplied to organisations, certification simply means that the company has implementedan ISO 9000 management system, which has no explicit requirement for technicalcompetence.
1.8 National Measurement System
Having knowledge of what is necessary for good measurements (i.e. to achieve trace-ability) is of no use unless the theory can be put into practice. Much of what isrequired is beyond the direct influence of any individual. Fortunately most govern-ments have taken an interest in their country’s ability to measure because it affectsthe country’s wealth and welfare, and standing with trading partners. Planning of thenational measurement system (NMS) by government also ensures that the necessaryservices are available to enable regulatory and contractual requirements to be metby industry. The total of the measurement services inside a country can be consideredtogether as the NMS, a concept that has grown in importance over the last few decades.
Good measurement practice requires several services to be readily available:
• calibration of instruments;
• training of staff in measurement techniques;
• regulation of trade measurement;
• endorsement of results by accreditation;
• specifications and procedures for measurements;
• supply of measuring instruments; and
• repair and servicing of instruments.
In this section we consider the first three of these topics. Accreditation and docu-mentary standards have been covered already in sufficient detail, and repair and supplyof servicing is normally provided by non-government organisations.
Figure 1.9 outlines the formal components of a national measurement system thatare external to its users, that is calibration, specification and accreditation. The figuregives an outline only; in a well-organised NMS there are many components, includingsecond- and third-tier calibration laboratories and standards committees, and manymore interactions.
For measurements to have legal standing countries must have laws providing formeasurement units, and for the laws to be effective a national measurement institute(NMI) is required to hold primary measurement standards. Such laws provide a basisfor national and international trade, consumer protection, and environmental and healthmanagement. Where the best accuracies are required the NMI will realise the physicaldefinitions of the units in accordance with the SI definitions and BIPM guidelines, andmaintain these as the primary standards. International obligations can also be met byusing reference standards calibrated by the BIPM or other NMIs.
The infrastructure requirement of maintaining uniform measures is the most impor-tant of the NMI’s responsibilities and is met most simply by providing calibrationservices. While this satisfies the prime function in support of legislation and trade,

1.8 NATIONAL MEASUREMENT SYSTEM 33
Metre conventionILAC
ISOIEC
Nationalstandardslaboratory
Calibrationlaboratory
Testinglaboratory
Calibrationaccreditation
Testingaccreditation
Standardsassociation
Figure 1.9 Traceability links in a national measurement system. The main traceability pathis shown by the heavy line. Documentary input that affects the path is shown by the other lines.Accreditation bodies for testing and calibration may be separate from each other
the end-users of the NMI’s ‘product’ are generally distributed wherever the country’sproducts are exported. In order to satisfy all clients the NMI must not only ensure thatthe country’s measures are uniform but also establish the credibility of its standardson the international stage. To this end the BIPM has extended its responsibilities tothe maintenance of a mutual recognition arrangement (MRA) that enables one countryto recognise another’s measurement standards. To participate in the MRA the NMImust be an associate signatory to the Metre Convention, participate in internationalcomparisons of measurement standards, have a quality system equivalent to ISO 17025,and publish relevant contributions to metrological science. The MRA, which laid the‘ground rules’ for recognition, was signed in October 1999, and will gradually takeeffect over the next five years or so.
The NMIs also provide a pool of expertise that makes a valuable contribution to acountry. The links with other NMIs and familiarity with new measurement techniquesoften mean that the NMIs provide a way of introducing new measurement technologyto a country, and of keeping up with international trends. To this end most NMIs offertraining courses and participate in accreditation assessments, as well as carrying outconsultancy for specific clients.
Generally the NMI has no powers of enforcement, and experience shows that withina country some enforcement is required to protect consumers and the general public.To this end most countries have a legal metrology organisation. Its responsibility is toensure that traders’ weights and measures are correct and that the public is not beingdefrauded in any transactions. Again there is an international connection through theOrganisation Internationale de Metrologie Legale (OIML). It provides experience andresources to aid countries in the establishment and enforcement of appropriate law.
Training is essential throughout the whole NMS to ensure that those involved aretechnically competent to make measurements. Unlike the other three components, there

34 1 MEASUREMENT AND TRACEABILITY
is no recognised organisational structure to achieve this, and it is rare to find tertiaryeducation institutes providing formal measurement training. Usually measurementexpertise is absorbed by osmosis as a part of other technical training courses, or passedon as lore from other staff. Indeed much of the subject matter lacks a formal basis foran educational curriculum. In many countries, most of the government-operated bodiesin the NMS offer short training courses in their respective disciplines.
Exercise 1.6
Draw a diagram similar to Figure 1.9 for your temperature measurements. Thennote how the procedures differ for any other measurements you make. If possibleobtain the names and addresses of the organisations involved in these proceduresand the name of a contact person. Include any linkages to organisations outsideyour NMS.
Indicate in the diagram if you are subject to more than one accreditation bodyor standards association and show their international linkages. Scientific userscan give the relevant scientific references instead of the organisations. Are yourmeasurements traceable according to the definitions given in this chapter?
Further Reading
Measurement and measurement scalesC W Churchman and P Ratooch (1959) Measurement: Definitions and theories , John Wiley,
New York.B Ellis (1968) Basic Concepts of Measurement , Cambridge University Press, cambridge.Handbook of Measurement Science, John Wiley, Chichester.
Vol 1 Theoretical Fundamentals Ed P H Sydenham (1982).Vol 2 Practical Fundamentals Ed P H Sydenham (1983).Vol 3 Elements of Change, Ed P H Sydenham and of R Thorn (1992).
P H Sydenham, N H Hancock and R Thorn (1989) Introduction to Measurement Science andEngineering , John Wiley, Chichester.
Historical developments
A Klein (1974) The Science of Measurement: A Historical Survey , Dover, New York.W E Knowles-Middleton (1966) A History of the Thermometer and its Use in Meteorology ,
Johns Hopkins University Press, Baltimore, MD.T J Quinn (1990) Temperature, 2nd Edition, Academic Press, London.
Thermodynamic measurements
T J Quinn (1990) Temperature, 2nd Edition,, Academic Press, London.R L Rusby, R P Hudson, M Durieux, K Grohmann, H J Jung, P P M Steur and J V Nicholas
(1996) The status of thermodynamic thermometry, Metrologia 33, 409–414.J F Schooley (1986) Thermometry , CRC Press, Boca Raton.

FURTHER READING 35
The SIISO 31-0:1992 Quantities and Units –General Principles, International Organisation for Stan-
dardisation, Geneva.The International System of Units (1998) BIPM, Paris.
Quality assurance and accreditation
G W Roberts (1983) Quality Assurance in Research and Development , Marcel Dekker,New York.
General reading on temperature measurement
R P Benedict (1984) Fundamentals of Temperature, Pressure, and Flow Measurements , 3rdEdition, John Wiley, New York.
R E Bentley (1998) Handbook of Temperature Measurement, Vols 1, 2 and 3, Spinger-Verlag,Singapore.
T W Kerlin and R L Shepard (1982) Industrial Temperature Measurement , Instrument Societyof America, Research Triangle, NC.
T D McGee (1988) Principles and Methods of Temperature Measurement , John Wiley, NewYork.
L Michalski, K Eckersdorf and J McGhee (1991) Temperature Measurement , John Wiley, Chich-ester.