measurement of the photoelectric effect with the ada4530-1 ...the photoelectric effect has been...
TRANSCRIPT

SCOTT HUNT
SYSTEM APPLICATIONS ENGINEER
LAB & FIELD SCIENTIFIC INSTRUMENTS
ANALOG DEVICES, INC.
Measurement of the
Photoelectric Effect with
the ADA4530-1
Electrometer Op Amp
1

Outline
► Introduction
Background on the Photoelectric Effect
► ADA4530-1 Overview
Performance (vs competition)
Applications and what you can do with it
► How to make a very low-leakage measurement
Layout, guarding, shielding, components, board materials
Techniques used in the Picoammeter System Board
► The Photoelectric Effect demo as a case example
Explanation, Pictures, Results, and Conclusions
2

The Mystery of the Photoelectric Effect
► Discovered by Heinrich Hertz (1887)
► Characterized by Philipp Lenard and later, Robert Millikan
3

Albert Einstein: Light energy is quantized (photons)
► Photon energy is proportional to frequency (E = hf), so when a photon
strikes an electron, the electron is ejected with a specific kinetic energy
► KE = hf – Φ
► We can measure kinetic energy
(KE) by applying a reverse
electric field
(the stopping potential)
KE = e*Vo
► This was cited as the reason
Einstein won the 1921 Nobel Prize
► Millikan won the 1923 Nobel Prize
for the photoelectric effect and the
oil drop experiment
4

Reproducing Lenard’s and Millikan’s Observations
► Use a vacuum tube with an anode and a cathode
► Measure the photocurrent
► Apply a voltage opposing the electron flow to measure KE5

ADA4530-1 Overview
WHAT IS SPECIAL ABOUT IT AND WHAT CAN
IT DO?
6
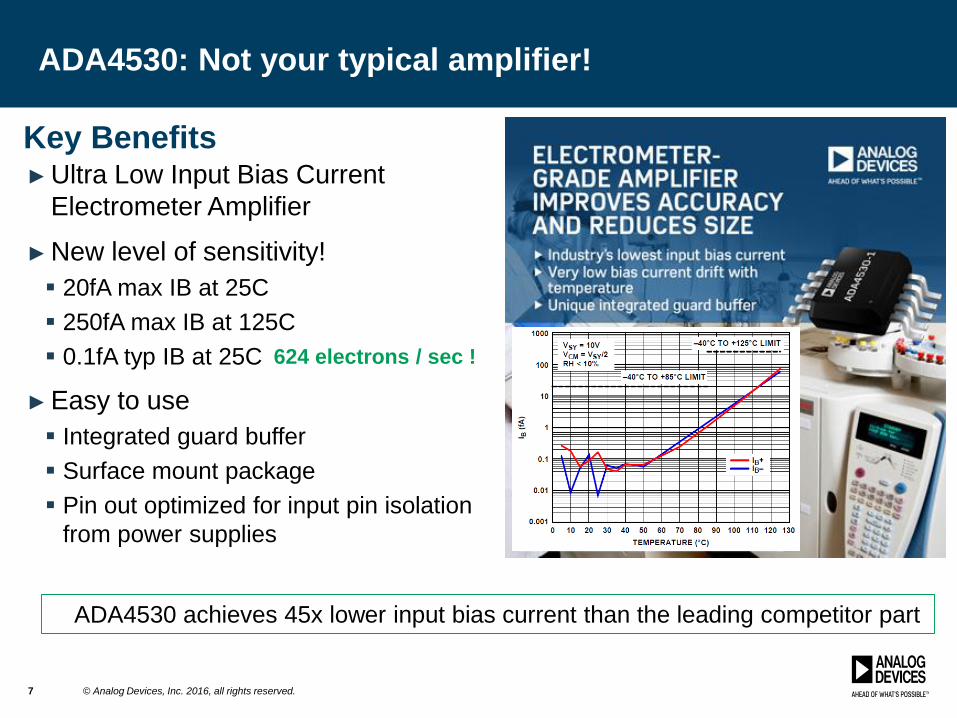
ADA4530: Not your typical amplifier!
7
► Ultra Low Input Bias Current
Electrometer Amplifier
► New level of sensitivity!
20fA max IB at 25C
250fA max IB at 125C
0.1fA typ IB at 25C
► Easy to use
Integrated guard buffer
Surface mount package
Pin out optimized for input pin isolation
from power supplies
Key Benefits
© Analog Devices, Inc. 2016, all rights reserved.
ADA4530 achieves 45x lower input bias current than the leading competitor part
624 electrons / sec !

ADA4530: Electrometer Op AmpUltra Low Bias Current Op Amp with Guard Ring Driver
8
Key Features
► Ultra low bias current► 20 fA @ room max (Production Tested)
► 20 fA @ 85C max
► 250 fA @ 125C max (Production Tested)
► Integrated Guard Buffer
► Wide supply voltage:
±2.5 to ±8V or 5 to 16V
Applications
► Laboratory and Analytical Instrumentation:
Spectrophotometers, Chromatographs, Mass
Spectrometers, Potentiostatic and Amperostatic
Coulometry
► Instrumentation: Picoammeters, Coulombmeters
► Transimpedance Amplifier for Photodiodes, Ion
Chambers, and Working Electrode measurements
► High Impedance Buffering for Chemical Sensors
and Capacitive Sensors
IBIAS VOS max TCVOS max I Noise V Noise ISY Max Bandwidth Op. Voltage Temp
20 fA max 50 µV 0.5 µV/°C 0.01 pA/√Hz 16 nV/√Hz 1.3 mA 2 MHz4.5 V – 16 V
±2.75 to ±8V
-40°C –125°C
Single Released
Package: SOIC-8; 1k OEM $11.40
All specs are TYP unless otherwise stated
NC
3
GRD
2
V-
4
IN+
1IN-
8
V+
5
VOUT
6
GRD
7+ -
Functional Block Diagram
And Pin Out
Conceptual PCB Layout
10
100
1000
20 30 40 50 60 70 80 90 100 110 120 130
Inp
ut
Bia
s C
urr
en
t (f
A)
Temperature (degrees C)
ADA4530-1 Ibias Max Target versus Temperature
V-
IN+
IN-GR
OUT
V+
RF
CF
VDD
VO = IPD * RF
Photodiode TIA Application
GR
VEE
D1
RF
CF
V+V- VO
GND
D1
ADA
4530

Electrometer Applications
As detection limit gets lower and lower, there is a higher need for a precise electrometer that does not introduce error
► Chemical Analyzers
► Chromatography
Gas
Liquid
► Spectroscopy
UV/VIS
Near IR
Fluorescence
► Mass Spectrometer
► Particle Analysis
► NDIR Gas Detection
► Colorimetry
► Water Quality/Testing
► Flame Detection

Low-Leakage Design
A FEW TIPS AND CONSIDERATIONS
(MAKE SURE TO CATCH GUSTAVO CASTRO’S
TALK TOMORROW @12:30 FOR MUCH MORE!)
10

Guidelines on PCB layout, board and solder paste
material
11

LTD and Effects of Humidity
12
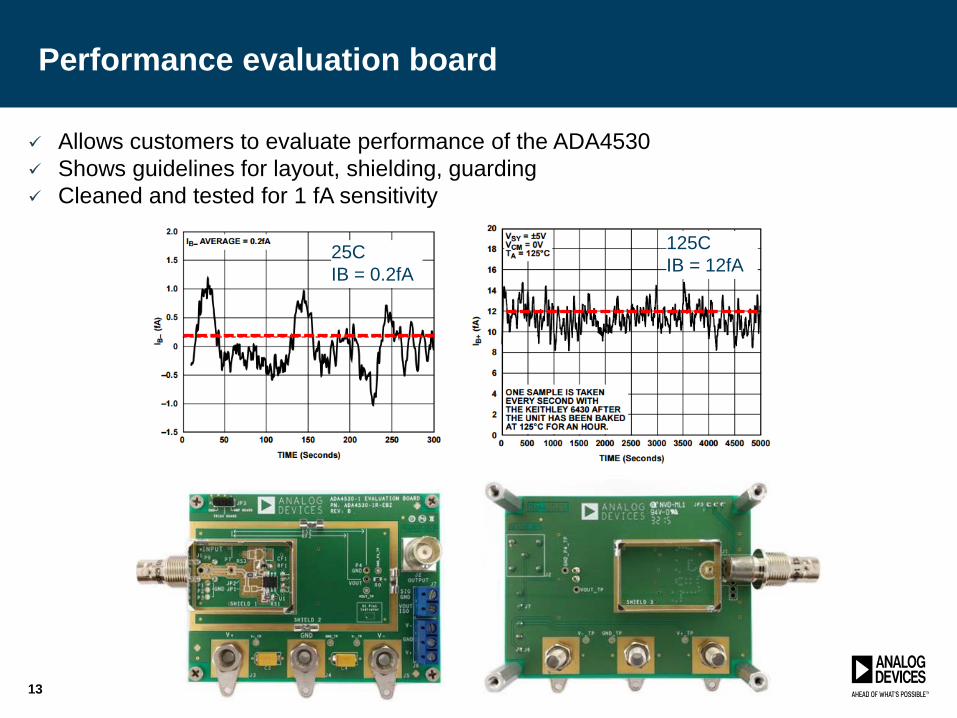
Performance evaluation board
13
Allows customers to evaluate performance of the ADA4530
Shows guidelines for layout, shielding, guarding
Cleaned and tested for 1 fA sensitivity
25C
IB = 0.2fA
125C
IB = 12fA

App Note, User Guide, Evaluation Board
14

The Photoelectric Effect
Demo
AS A LOW-LEAKAGE MEASUREMENT CASE-
STUDY
15

Why does this require electrometer-grade performance?
► ADA4530-1 has less than 0.1fA typical
bias current at 25°C
► 0.1fA = 10-16 Coulombs/sec
10-16/q = 624 electrons per second
► To measure the stopping potential, we
are trying to see the point where Zero
electrons are reaching the anode
16

The ADA4530-1 Picoammeter System Module
17
Learn about this board in more detail in Gustavo Castro’s talk here at 12:30 tomorrow!

The ADA4530-1 Picoammeter System Module
18

Final Setup
20

Sensors Expo
21

Sensors Expo
22
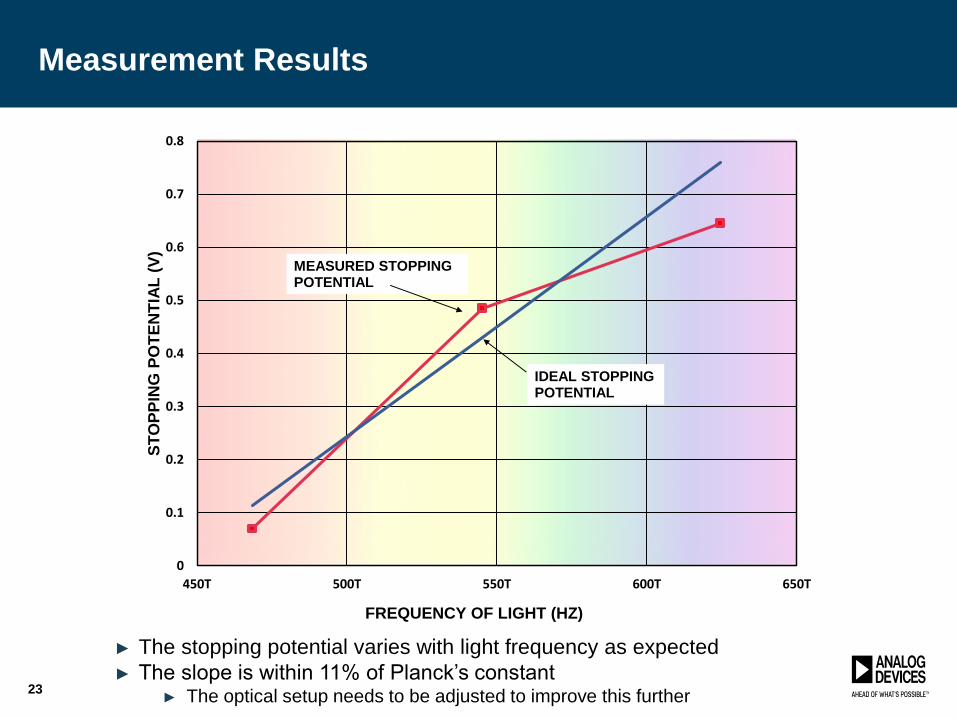
Measurement Results
0
0.1
0.2
0.3
0.4
0.5
0.6
0.7
0.8
450T 500T 550T 600T 650T
ST
OP
PIN
G P
OT
EN
TIA
L (
V)
FREQUENCY OF LIGHT (HZ)
IDEAL STOPPING POTENTIAL
MEASURED STOPPING POTENTIAL
23
► The stopping potential varies with light frequency as expected
► The slope is within 11% of Planck’s constant► The optical setup needs to be adjusted to improve this further

Conclusions
► The Photoelectric Effect has been measured using the ADA4530-1 and
the AD5791
The stopping potential has been shown to be higher for higher frequency light
► Low-current measurement techniques and applications have been
discussed
► Further improvements to the demo could be made
Finer line width light source such as a mercury lamp
Work Function varies based on brightness, better linearity could be obtained by
adding a light sensor and controlling the light intensity to be equal for each color
24

Thank you!
25