measuring and managing information risk: a fair …isaca-denver.org/chapter-resources/controls...
TRANSCRIPT
241Measuring and Managing Information Risk. http://dx.doi.org/10.1016/B978-0-12-420231-3.00011-7Copyright © 2015 Elsevier Inc. All rights reserved.
CHAPTER
Controls 11OVERVIEWControl frameworks abound: Control Objectives for Information and Related Technology, National Institute of Standards and Technology, Payment Card Industry (PCI), and Inter-national Organization for Standardization (ISO) all provide their own taxonomies and lists of controls. In each case, the framework provides a list or description of recom-mended controls and/or the control objectives. Sometimes, the description is specific (e.g., what constitutes acceptable encryption), whereas in other cases, the descriptions are more general (e.g., thou shalt do risk assessments). This is all useful stuff that can help an organization understand whether it’s on the right path, more or less, from a controls perspective. What these frameworks do not tend to do, however, is describe the nature of controls, the relationship between controls, or how to measure/estimate the effectiveness of controls within a risk analysis. Because of this, we believe a deeper understanding of controls is crucial if we want to maximize our risk management effectiveness.
In this chapter, we’ll introduce a set of ontologies for controls that enable us to be more effective in control evaluation and measurement and as a way to help people simply understand controls at a deeper level. We’ll also describe how to think about controls within the context of performing FAIR analyses because not all controls affect risk in the same way. This may seem like an obvious point, but we think you’ll be surprised by where we’ve taken controls analysis. It’s likely a different perspec-tive than you have encountered before, and we think it sheds light on some previously dark corners of the risk analysis problem.
TALKING ABOUT RISKBy the way, if you haven’t noticed, we love mind maps (well, one of us does). If you aren’t already familiar with them, we highly recommend them. They are a marvelous tool for organizing thoughts and illustrating ideas. Truthfully, were it not for mind mapping, FAIR probably would never have been created without them.
HIGH-LEVEL CONTROL CATEGORIESFrom our perspective, there are three high-level categories of controls: • Asset-level controls: Controls applied directly to manage the frequency and/or
magnitude of loss from events that can affect assets (e.g., system configuration and patching, passwords, access privileges, logging, backup and recovery tools
CHAPTER 11 Controls242
and processes, door locks, and HVAC systems). The thing to keep in mind is that loss occurs when threats negatively affect assets, so from that perspective, these controls are the most direct link to managing loss exposure.
• Variance controls: Controls intended to minimize the variance of asset-level controls over time (e.g., policies, standards, education and awareness training, well-defined processes, automation, auditing and testing, and remediation). As we’ll discuss further on, although asset-level controls are the most direct link to loss exposure, managing variance is the key to asset-level control effectiveness over time. In fact, we believe the condition of variance controls is often the best measure of an organization’s overall risk posture.
• Decision-making controls: Those elements that help stakeholders define, adjust, and enforce expectations, and allocate resources to achieve risk management objectives (e.g., organization objectives, laws and regulations, risk tolerance definitions, metrics, reporting, and risk analyses). Another way of thinking about these controls is that they’re intended to prevent, detect, and respond to bad risk management decisions.
We’ll discuss each of these categories and how they work together, beginning
with asset-level controls. Before we discuss these categories, we need to introduce the concept of control relationships.
TALKING ABOUT RISKIn the early days of FAIR, the Resistive Strength factor within the ontology was called Control Strength. Unfortunately, it was soon apparent that people were including all kinds of controls in their estimate of “Control Strength,” including things that should be accounted for elsewhere in the model (e.g., backup processes that affect loss magnitude but not vulnerability). As a result, their Control Strength estimates were sometimes inaccurate. When I (J.J.) realized this, I also realized that I hadn’t thought through the controls aspect of the ontology as thoroughly as I needed to. This led me down a long path of trying to understand—really understand—controls. The results of this understanding are presented within this chapter.
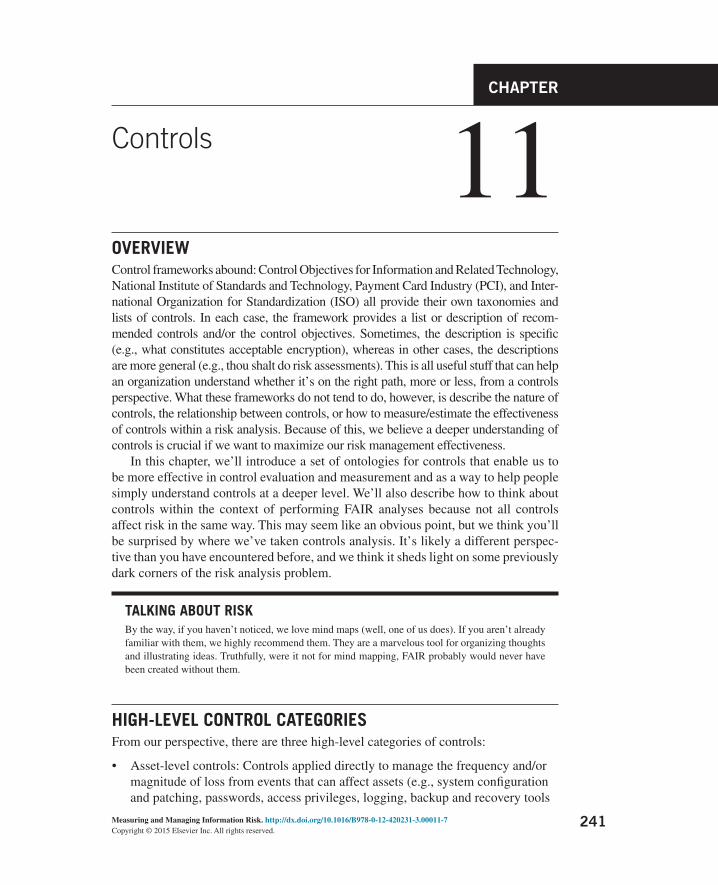
CONTROL RELATIONSHIPSNot surprisingly, controls have relationships between each other. For example, some controls depend on the existence of other controls to be effective. To illustrate this point, let’s start simple. Imagine that there are only three categories of asset-level controls: preventative, detective, and responsive (Figure 11.1). Preventative controls affect the likelihood of a loss event occurring, detective controls enable us to recog-nize when a loss event has occurred, and responsive controls allow us to minimize the loss event’s effect on the organization. (We’ll go deeper soon, but for now we just need to make a couple of key points regarding the relationship between controls of varying types.)
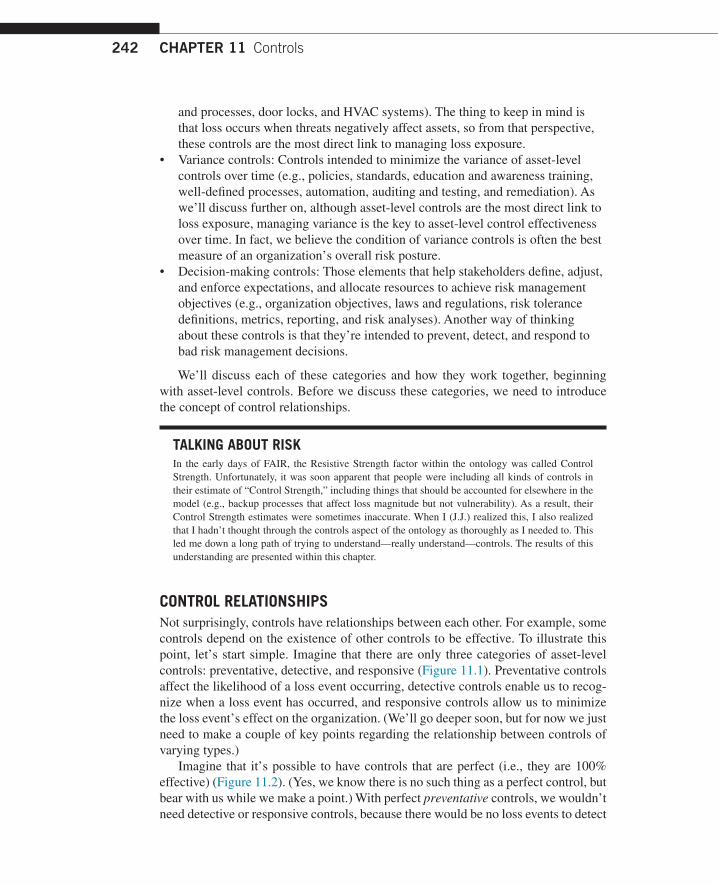
Imagine that it’s possible to have controls that are perfect (i.e., they are 100% effective) (Figure 11.2). (Yes, we know there is no such thing as a perfect control, but bear with us while we make a point.) With perfect preventative controls, we wouldn’t need detective or responsive controls, because there would be no loss events to detect
High-level control categories 243
or respond to. Example: Suppose there were such a thing as unbreakable encryp-tion, both in terms of key strength and how it’s used. With perfect encryption, we wouldn’t need to worry about detecting when someone has broken the encryption, nor would we need to have an incident response capability to manage such an event. (This whole concept of control perfection has got to be driving some of you nuts… Hang in there.)
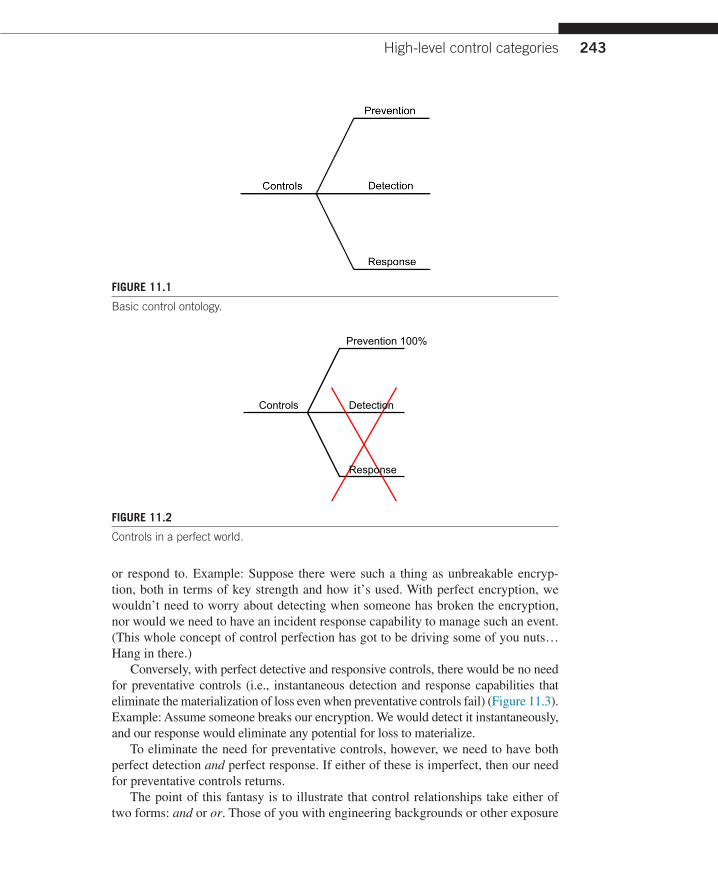
Conversely, with perfect detective and responsive controls, there would be no need for preventative controls (i.e., instantaneous detection and response capabilities that eliminate the materialization of loss even when preventative controls fail) (Figure 11.3). Example: Assume someone breaks our encryption. We would detect it instantaneously, and our response would eliminate any potential for loss to materialize.
To eliminate the need for preventative controls, however, we need to have both perfect detection and perfect response. If either of these is imperfect, then our need for preventative controls returns.
The point of this fantasy is to illustrate that control relationships take either of two forms: and or or. Those of you with engineering backgrounds or other exposure
FIGURE 11.1
Basic control ontology.
Detection
Response
Prevention 100%
Controls
FIGURE 11.2
Controls in a perfect world.
CHAPTER 11 Controls244
to Boolean logic may have already recognized this. Preventative controls have an or relationship with the combination of detection and response controls, whereas detec-tion and response have an and relationship between each other. In other words, we can have preventative controls or detection and response controls.
TALKING ABOUT RISKFor those of you who aren’t familiar with Boolean concepts, simply think of it this way: when an and relationship exists between two controls, both have to be effective for their benefit to be real-ized. For example, you can have the best detection capability in the world, but if your response capabilities are badly broken, then the overall capability is broken. With an or relationship, if either of two controls is effective, then the overall benefit is realized.
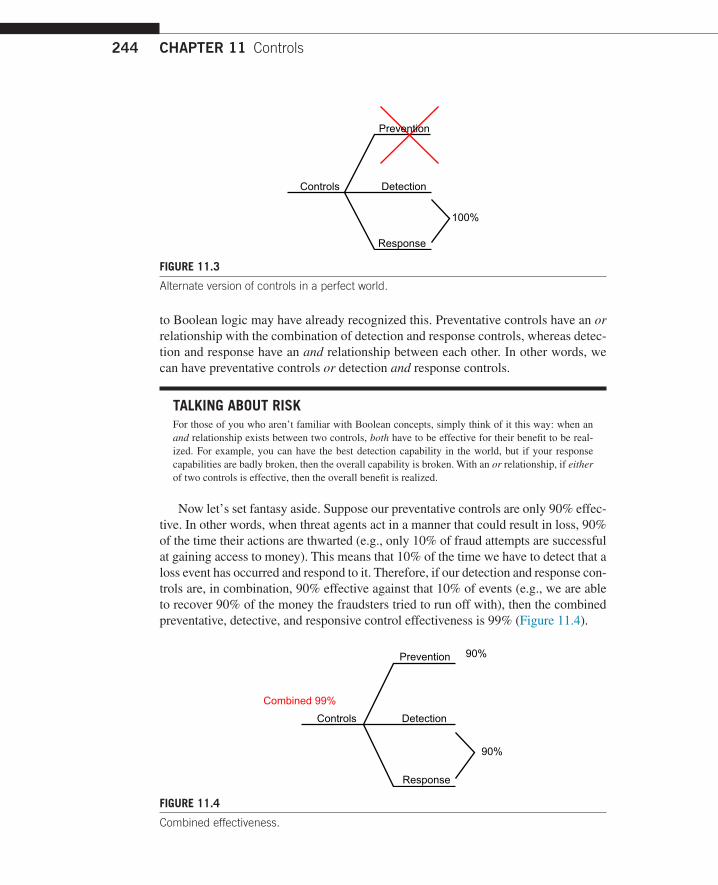
Now let’s set fantasy aside. Suppose our preventative controls are only 90% effec-tive. In other words, when threat agents act in a manner that could result in loss, 90% of the time their actions are thwarted (e.g., only 10% of fraud attempts are successful at gaining access to money). This means that 10% of the time we have to detect that a loss event has occurred and respond to it. Therefore, if our detection and response con-trols are, in combination, 90% effective against that 10% of events (e.g., we are able to recover 90% of the money the fraudsters tried to run off with), then the combined preventative, detective, and responsive control effectiveness is 99% (Figure 11.4).
Detection
100%
Response
Prevention
Controls
FIGURE 11.3
Alternate version of controls in a perfect world.
Detection
Response
90%
90%Prevention
ControlsCombined 99%
FIGURE 11.4
Combined effectiveness.

Asset-level controls 245
Being able to recognize the relationships and dependencies between different controls enables us to more effectively recognize where gaps exists, and prevent gaps in the first place. It also enables us to do a better job of gauging the efficacy of combinations of controls.
ASSET-LEVEL CONTROLSAN ONTOLOGY FOR ASSET-LEVEL CONTROLSAs you can see in Figure 11.5, our controls ontology takes a different approach than most. We’ve found this logical breakdown and additional detail to be extremely helpful in controls analysis and selection. At the first layer of abstrac-tion in this ontology, we have the traditional categories of prevention, detection, and response. Unfortunately, this is about as far as many people tend to go in terms of characterizing the role of different controls. The problem with not going any deeper is that we lose the ability to explicitly evaluate and consider the rela-tionships between controls. This level of abstraction is specific to loss events
FIGURE 11.5
Asset-level control ontology.
CHAPTER 11 Controls246
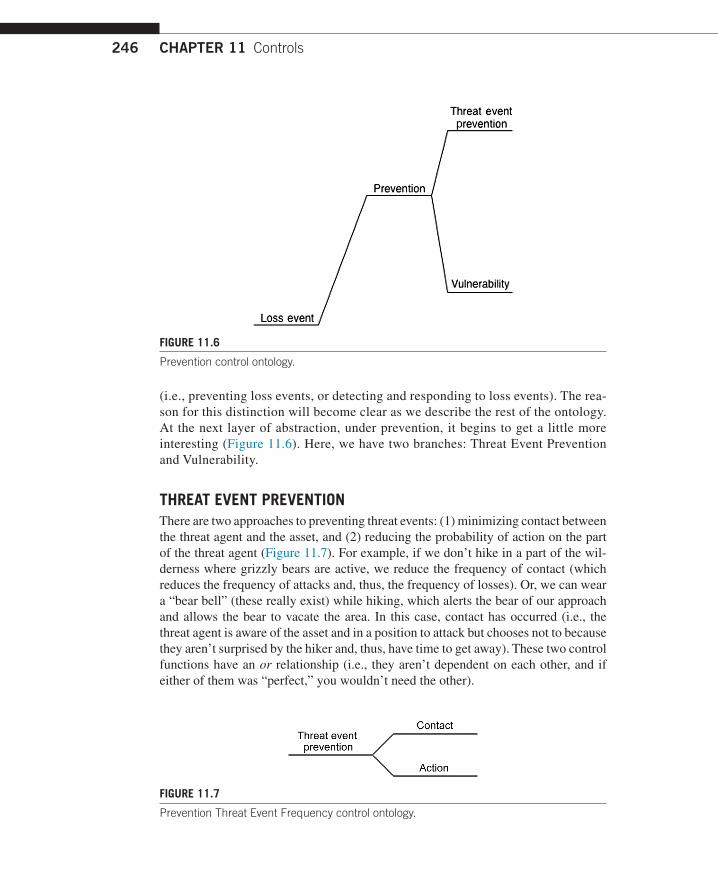
(i.e., preventing loss events, or detecting and responding to loss events). The rea-son for this distinction will become clear as we describe the rest of the ontology. At the next layer of abstraction, under prevention, it begins to get a little more interesting (Figure 11.6). Here, we have two branches: Threat Event Prevention and Vulnerability.
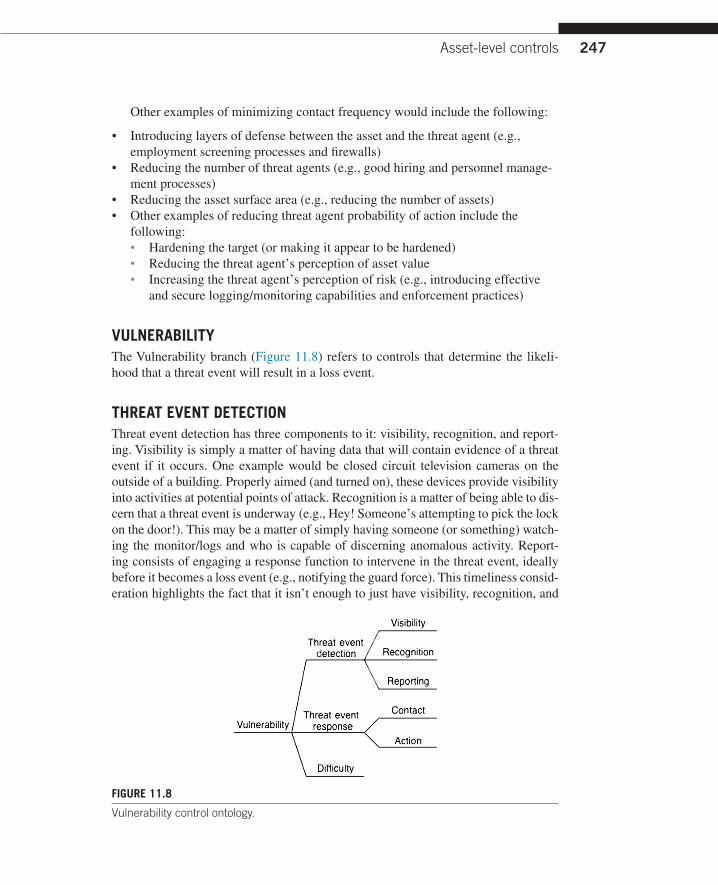
THREAT EVENT PREVENTIONThere are two approaches to preventing threat events: (1) minimizing contact between the threat agent and the asset, and (2) reducing the probability of action on the part of the threat agent (Figure 11.7). For example, if we don’t hike in a part of the wil-derness where grizzly bears are active, we reduce the frequency of contact (which reduces the frequency of attacks and, thus, the frequency of losses). Or, we can wear a “bear bell” (these really exist) while hiking, which alerts the bear of our approach and allows the bear to vacate the area. In this case, contact has occurred (i.e., the threat agent is aware of the asset and in a position to attack but chooses not to because they aren’t surprised by the hiker and, thus, have time to get away). These two control functions have an or relationship (i.e., they aren’t dependent on each other, and if either of them was “perfect,” you wouldn’t need the other).
FIGURE 11.6
Prevention control ontology.
FIGURE 11.7
Prevention Threat Event Frequency control ontology.
Asset-level controls 247
Other examples of minimizing contact frequency would include the following: • Introducing layers of defense between the asset and the threat agent (e.g.,
employment screening processes and firewalls) • Reducing the number of threat agents (e.g., good hiring and personnel manage-
ment processes) • Reducing the asset surface area (e.g., reducing the number of assets) • Other examples of reducing threat agent probability of action include the
following: • Hardening the target (or making it appear to be hardened) • Reducing the threat agent’s perception of asset value • Increasing the threat agent’s perception of risk (e.g., introducing effective
and secure logging/monitoring capabilities and enforcement practices)
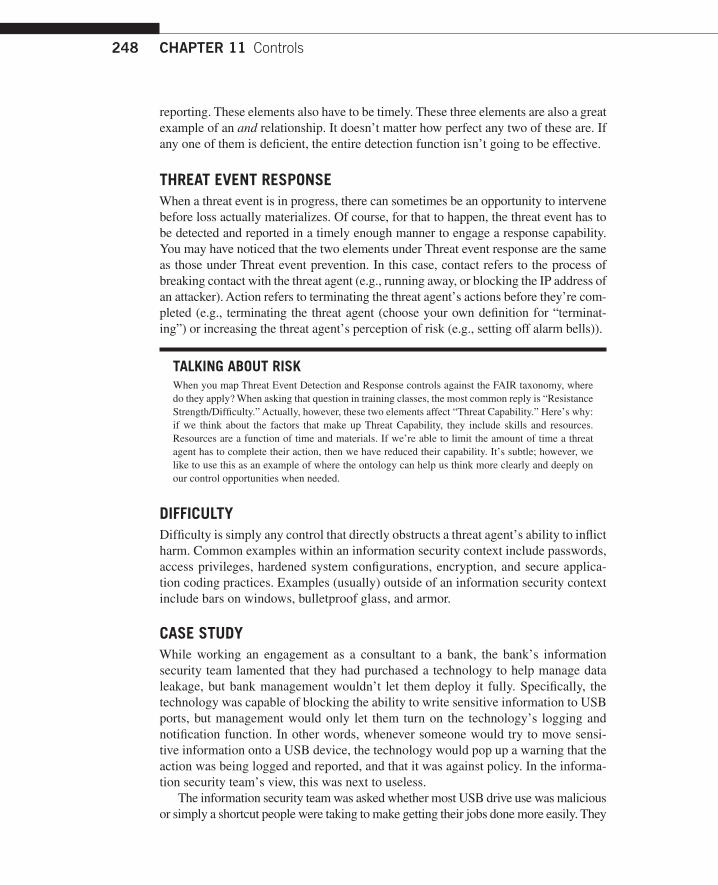
VULNERABILITYThe Vulnerability branch (Figure 11.8) refers to controls that determine the likeli-hood that a threat event will result in a loss event.
THREAT EVENT DETECTIONThreat event detection has three components to it: visibility, recognition, and report-ing. Visibility is simply a matter of having data that will contain evidence of a threat event if it occurs. One example would be closed circuit television cameras on the outside of a building. Properly aimed (and turned on), these devices provide visibility into activities at potential points of attack. Recognition is a matter of being able to dis-cern that a threat event is underway (e.g., Hey! Someone’s attempting to pick the lock on the door!). This may be a matter of simply having someone (or something) watch-ing the monitor/logs and who is capable of discerning anomalous activity. Report-ing consists of engaging a response function to intervene in the threat event, ideally before it becomes a loss event (e.g., notifying the guard force). This timeliness consid-eration highlights the fact that it isn’t enough to just have visibility, recognition, and
FIGURE 11.8
Vulnerability control ontology.
CHAPTER 11 Controls248
reporting. These elements also have to be timely. These three elements are also a great example of an and relationship. It doesn’t matter how perfect any two of these are. If any one of them is deficient, the entire detection function isn’t going to be effective.
THREAT EVENT RESPONSEWhen a threat event is in progress, there can sometimes be an opportunity to intervene before loss actually materializes. Of course, for that to happen, the threat event has to be detected and reported in a timely enough manner to engage a response capability. You may have noticed that the two elements under Threat event response are the same as those under Threat event prevention. In this case, contact refers to the process of breaking contact with the threat agent (e.g., running away, or blocking the IP address of an attacker). Action refers to terminating the threat agent’s actions before they’re com-pleted (e.g., terminating the threat agent (choose your own definition for “terminat-ing”) or increasing the threat agent’s perception of risk (e.g., setting off alarm bells)).
TALKING ABOUT RISKWhen you map Threat Event Detection and Response controls against the FAIR taxonomy, where do they apply? When asking that question in training classes, the most common reply is “Resistance Strength/Difficulty.” Actually, however, these two elements affect “Threat Capability.” Here’s why: if we think about the factors that make up Threat Capability, they include skills and resources. Resources are a function of time and materials. If we’re able to limit the amount of time a threat agent has to complete their action, then we have reduced their capability. It’s subtle; however, we like to use this as an example of where the ontology can help us think more clearly and deeply on our control opportunities when needed.
DIFFICULTYDifficulty is simply any control that directly obstructs a threat agent’s ability to inflict harm. Common examples within an information security context include passwords, access privileges, hardened system configurations, encryption, and secure applica-tion coding practices. Examples (usually) outside of an information security context include bars on windows, bulletproof glass, and armor.
CASE STUDYWhile working an engagement as a consultant to a bank, the bank’s information security team lamented that they had purchased a technology to help manage data leakage, but bank management wouldn’t let them deploy it fully. Specifically, the technology was capable of blocking the ability to write sensitive information to USB ports, but management would only let them turn on the technology’s logging and notification function. In other words, whenever someone would try to move sensi-tive information onto a USB device, the technology would pop up a warning that the action was being logged and reported, and that it was against policy. In the informa-tion security team’s view, this was next to useless.
The information security team was asked whether most USB drive use was malicious or simply a shortcut people were taking to make getting their jobs done more easily. They
Asset-level controls 249
concluded that, by far, the most common use-case was simply as a shortcut. They were then asked what percentage of bank employees, when presented with the technology’s warning message, would complete the act of moving sensitive data to the USB drive. Their estimate was that less than 5% (1 of 20) would complete the act. In other words, even in its “degraded” state, this control was estimated to be approximately 95% effec-tive in terminating this specific (and by far most frequent) threat agent activity, which translates ultimately into a lower loss event frequency. Of course, its effectiveness against a more determined malicious actor would probably be significantly less. Regardless, it was anything but useless.
This may be a good time to point out that, as illustrated in the previous example, controls often provide value in more than one element of the ontology. The data leak-age technology’s blocking function would be an example of Difficulty, whereas its logging, reporting, and notification functions played a role in threat event prevention (by deterring action), threat event detection and response, and loss event manage-ment, as we will see later. As you think about the various controls you use, it’s impor-tant to consider where they fit in the ontology.
TALKING ABOUT RISKWhat role would camouflage play as a control? How about network segmentation? At this point, you should begin asking yourself these kinds of questions. Also, start to think about the and/or relation-ship between combinations of controls.
By the way, one of our pet peeves is the claim that, “Security by obscurity is no security at all.” Really? If that’s the case, then we had better alert our military and intelligence organizations to forget about cover stories and camouflage. Sure, you may not want to depend solely on obscurity, but it has its place as a control and in some circumstances can be quite effective.
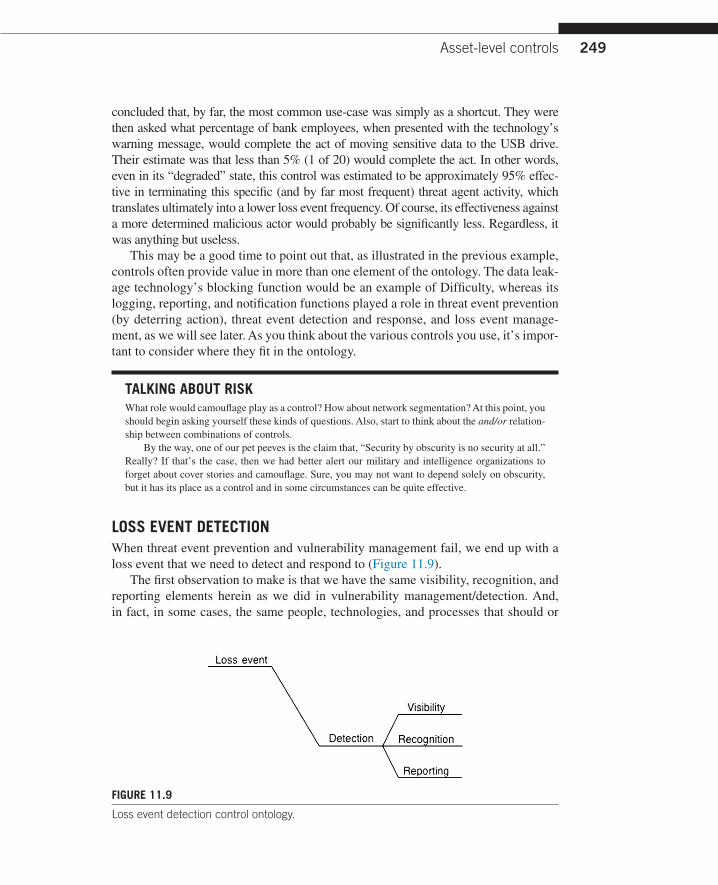
LOSS EVENT DETECTIONWhen threat event prevention and vulnerability management fail, we end up with a loss event that we need to detect and respond to (Figure 11.9).
The first observation to make is that we have the same visibility, recognition, and reporting elements herein as we did in vulnerability management/detection. And, in fact, in some cases, the same people, technologies, and processes that should or
FIGURE 11.9
Loss event detection control ontology.
CHAPTER 11 Controls250
could play a role in vulnerability management/detection actually only play a role here because they aren’t timely enough to enable effective intervention into a threat event before it becomes a loss event.
Examples of loss event detection controls include the following: • Financial audits • Data leakage technologies (not in a blocking mode) • Burglar alarms
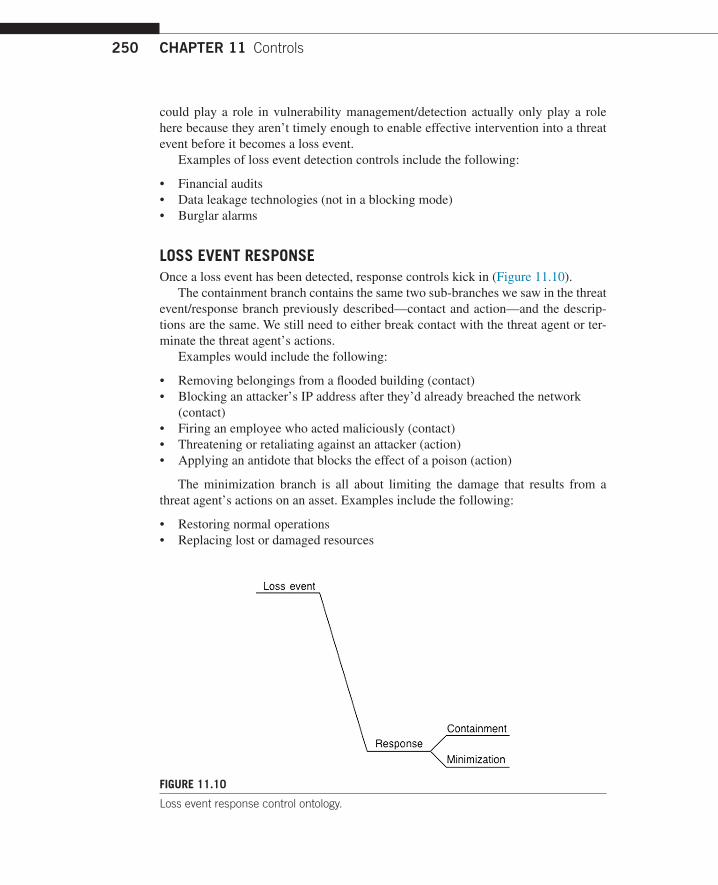
LOSS EVENT RESPONSEOnce a loss event has been detected, response controls kick in (Figure 11.10).
The containment branch contains the same two sub-branches we saw in the threat event/response branch previously described—contact and action—and the descrip-tions are the same. We still need to either break contact with the threat agent or ter-minate the threat agent’s actions.
Examples would include the following: • Removing belongings from a flooded building (contact) • Blocking an attacker’s IP address after they’d already breached the network
(contact) • Firing an employee who acted maliciously (contact) • Threatening or retaliating against an attacker (action) • Applying an antidote that blocks the effect of a poison (action)
The minimization branch is all about limiting the damage that results from a threat agent’s actions on an asset. Examples include the following: • Restoring normal operations • Replacing lost or damaged resources
FIGURE 11.10
Loss event response control ontology.
Asset-level controls 251
• Performing legal or other actions to recover property from perpetrators • Limiting negative secondary stakeholder reactions (e.g., credit monitoring for
customers whose information was compromised, public relations campaign for investors, and voters)
ASSET-LEVEL CONTROL EFFECTIVENESSThere are a couple of things to keep in mind if you want to estimate the effective-ness of controls using this ontology. First, effectiveness should always be estimated as a percentage (e.g., 50% effective). Second, this percentage must be evaluated within the context of the control’s purpose. If it’s a control that affects threat event frequency, then the control’s effectiveness would be estimated in terms of a percent-age reduction in threat event frequency (as illustrated in our earlier case study). If the control’s effect is on vulnerability (i.e., the percentage of time a threat event becomes a loss event), then you would estimate its effect as a percentage reduc-tion in vulnerability. Finally, if a control affects the magnitude of loss from an event, then its effectiveness would be estimated as a percentage reduction in loss magnitude.
The good news is that, in many cases, you can actually measure these effects. Take the banking case study, for example. The organization could, if it chose to, use the data leakage solution for a period of time without the user notification turned on to establish a baseline of questionable activity. It could then turn on notification and see its effect. We’ve done this in the past with data leakage (and other) technologies, and the effect was remarkable, which made it incredibly easy to communicate the technology’s value proposition to management.
TALKING ABOUT RISKWhen we use discrete numeric values in our examples, like “50% effective,” in actual practice, we would almost always make our estimates using distributions (e.g., minimum, 30%; maximum, 50%; most likely, 40%). The reason for this is twofold: (1) it allows us to represent the inevitable uncertainty in our estimates, and (2) it enables us to use Monte Carlo functions in our analyses.
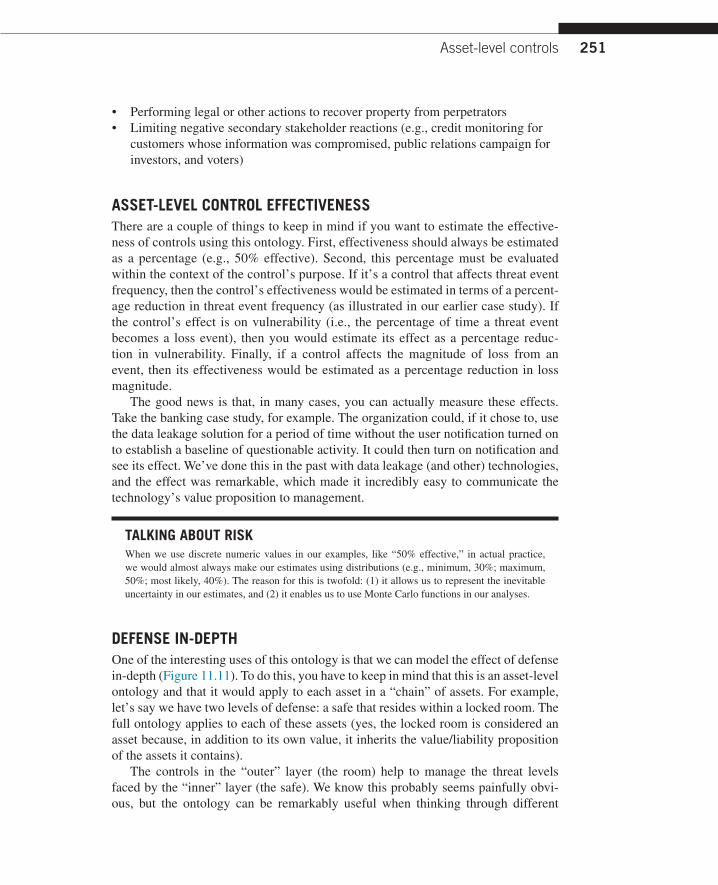
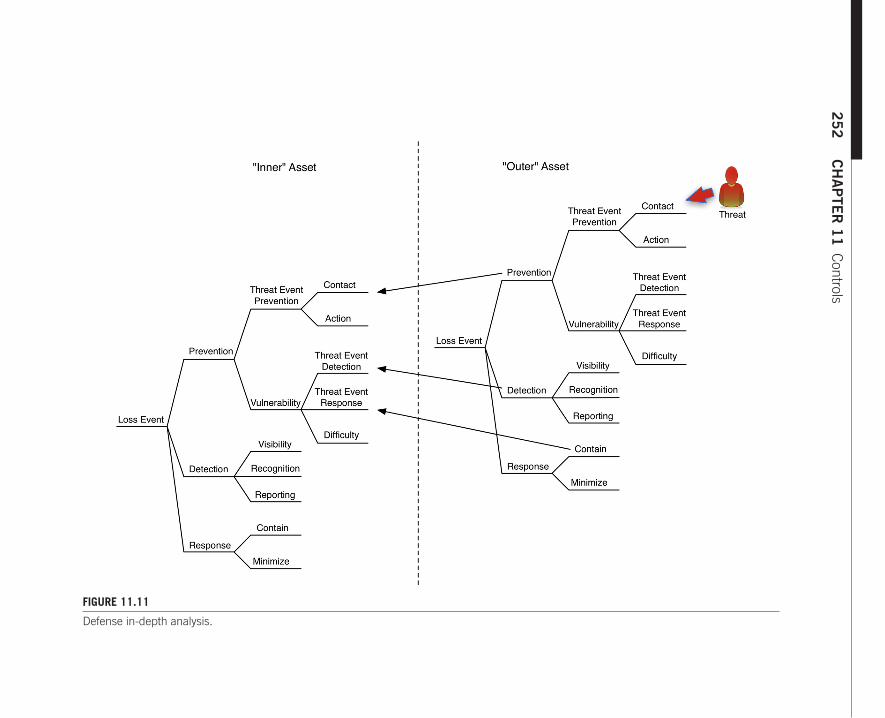
DEFENSE IN-DEPTHOne of the interesting uses of this ontology is that we can model the effect of defense in-depth (Figure 11.11). To do this, you have to keep in mind that this is an asset-level ontology and that it would apply to each asset in a “chain” of assets. For example, let’s say we have two levels of defense: a safe that resides within a locked room. The full ontology applies to each of these assets (yes, the locked room is considered an asset because, in addition to its own value, it inherits the value/liability proposition of the assets it contains).
The controls in the “outer” layer (the room) help to manage the threat levels faced by the “inner” layer (the safe). We know this probably seems painfully obvi-ous, but the ontology can be remarkably useful when thinking through different
CHAPTER
11 Controls252
FIGURE 11.11
Defense in-depth analysis.
Variance controls 253
combinations of controls in a defense in-depth analysis. By the way, this asset-level controls ontology has also (unfortunately?) proven to be helpful while dealing with a breach, because it enables you to be exceptionally thorough in identifying control opportunities that help manage a breach more effectively.
VARIANCE CONTROLSEdwards Deming had it right. From a risk management perspective, exceptional variance from an intended state/condition is the true enemy from a quality perspec-tive. And after all, it’s the quality of security (or lack thereof) that gets organizations into trouble. Ask yourself how many loss events you are familiar with that occurred when all of the controls were operating as intended. Few, if any, coming to mind? The bottom line is that it’s unusual for information security losses to occur when controls are operating in the way they’re designed. This statement should resonate strongly with compliance-minded folks who sometimes claim that the only reason-able/responsible approach to security is to simply ensure that control requirements are being adhered to. They are half right. Of course, the only way to figure out what the appropriate control requirements should be, from a business perspective, is through decisions made by organization stakeholders who are risk informed. Fur-thermore, it’s only by understanding the relevance of variance (from a loss exposure perspective) that management can appropriately prioritize their reactions when vari-ance is discovered.
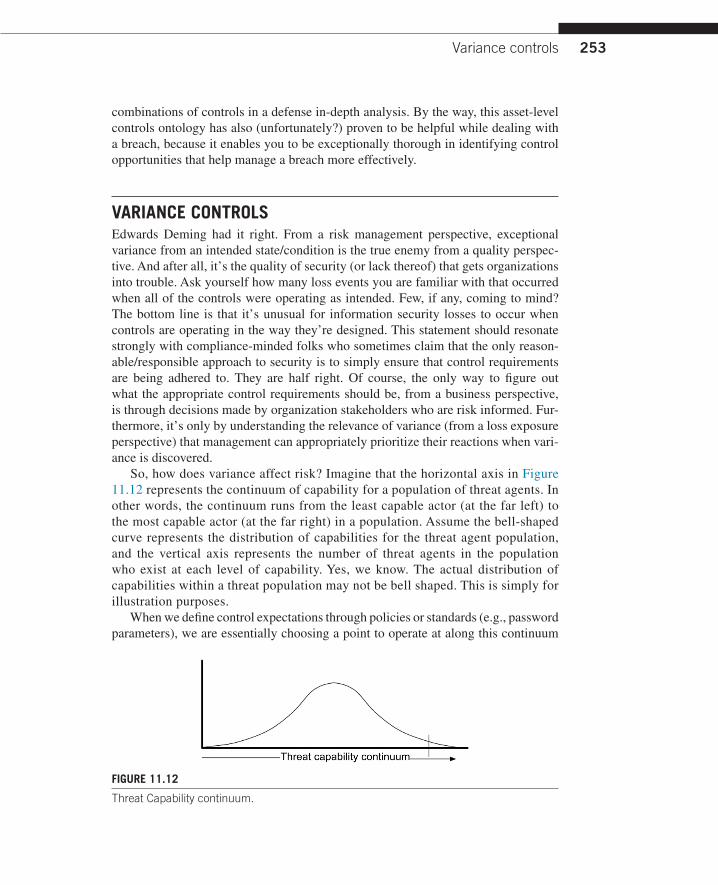
So, how does variance affect risk? Imagine that the horizontal axis in Figure 11.12 represents the continuum of capability for a population of threat agents. In other words, the continuum runs from the least capable actor (at the far left) to the most capable actor (at the far right) in a population. Assume the bell-shaped curve represents the distribution of capabilities for the threat agent population, and the vertical axis represents the number of threat agents in the population who exist at each level of capability. Yes, we know. The actual distribution of capabilities within a threat population may not be bell shaped. This is simply for illustration purposes.
When we define control expectations through policies or standards (e.g., password parameters), we are essentially choosing a point to operate at along this continuum
FIGURE 11.12
Threat Capability continuum.
CHAPTER 11 Controls254
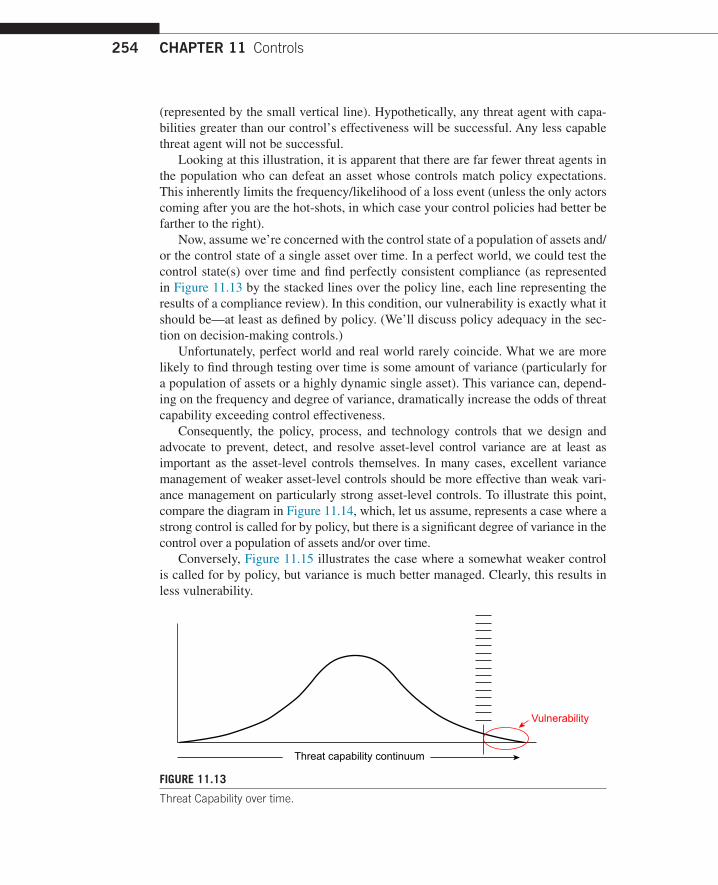
(represented by the small vertical line). Hypothetically, any threat agent with capa-bilities greater than our control’s effectiveness will be successful. Any less capable threat agent will not be successful.
Looking at this illustration, it is apparent that there are far fewer threat agents in the population who can defeat an asset whose controls match policy expectations. This inherently limits the frequency/likelihood of a loss event (unless the only actors coming after you are the hot-shots, in which case your control policies had better be farther to the right).
Now, assume we’re concerned with the control state of a population of assets and/or the control state of a single asset over time. In a perfect world, we could test the control state(s) over time and find perfectly consistent compliance (as represented in Figure 11.13 by the stacked lines over the policy line, each line representing the results of a compliance review). In this condition, our vulnerability is exactly what it should be—at least as defined by policy. (We’ll discuss policy adequacy in the sec-tion on decision-making controls.)
Unfortunately, perfect world and real world rarely coincide. What we are more likely to find through testing over time is some amount of variance (particularly for a population of assets or a highly dynamic single asset). This variance can, depend-ing on the frequency and degree of variance, dramatically increase the odds of threat capability exceeding control effectiveness.
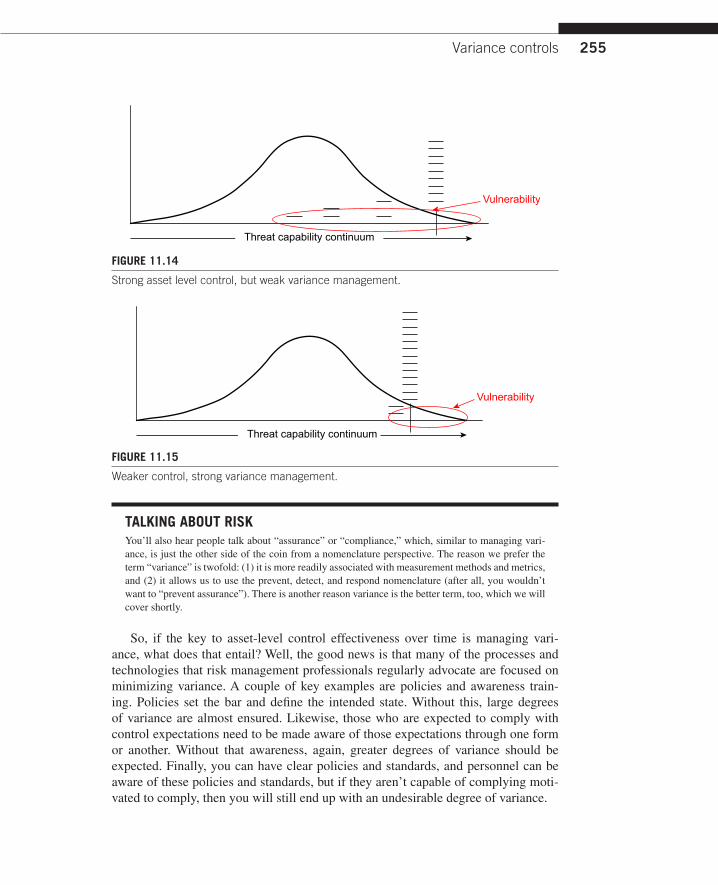
Consequently, the policy, process, and technology controls that we design and advocate to prevent, detect, and resolve asset-level control variance are at least as important as the asset-level controls themselves. In many cases, excellent variance management of weaker asset-level controls should be more effective than weak vari-ance management on particularly strong asset-level controls. To illustrate this point, compare the diagram in Figure 11.14, which, let us assume, represents a case where a strong control is called for by policy, but there is a significant degree of variance in the control over a population of assets and/or over time.
Conversely, Figure 11.15 illustrates the case where a somewhat weaker control is called for by policy, but variance is much better managed. Clearly, this results in less vulnerability.
Vulnerability
Threat capability continuum
FIGURE 11.13
Threat Capability over time.
Variance controls 255
TALKING ABOUT RISKYou’ll also hear people talk about “assurance” or “compliance,” which, similar to managing vari-ance, is just the other side of the coin from a nomenclature perspective. The reason we prefer the term “variance” is twofold: (1) it is more readily associated with measurement methods and metrics, and (2) it allows us to use the prevent, detect, and respond nomenclature (after all, you wouldn’t want to “prevent assurance”). There is another reason variance is the better term, too, which we will cover shortly.
So, if the key to asset-level control effectiveness over time is managing vari-ance, what does that entail? Well, the good news is that many of the processes and technologies that risk management professionals regularly advocate are focused on minimizing variance. A couple of key examples are policies and awareness train-ing. Policies set the bar and define the intended state. Without this, large degrees of variance are almost ensured. Likewise, those who are expected to comply with control expectations need to be made aware of those expectations through one form or another. Without that awareness, again, greater degrees of variance should be expected. Finally, you can have clear policies and standards, and personnel can be aware of these policies and standards, but if they aren’t capable of complying moti-vated to comply, then you will still end up with an undesirable degree of variance.
Threat capability continuum
Vulnerability
FIGURE 11.14
Strong asset level control, but weak variance management.
Threat capability continuum
Vulnerability
FIGURE 11.15
Weaker control, strong variance management.
CHAPTER 11 Controls256
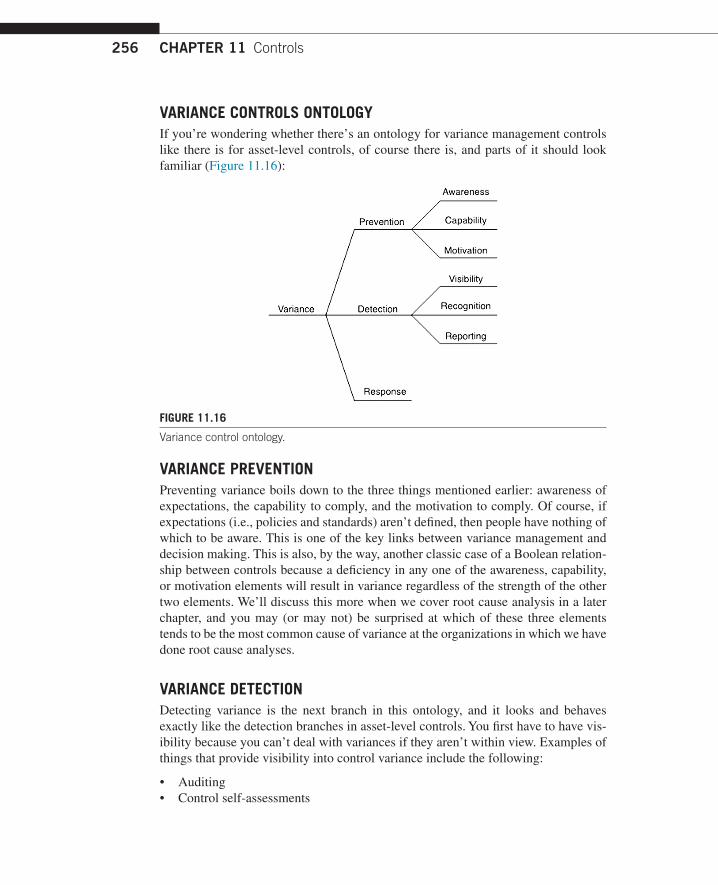
VARIANCE CONTROLS ONTOLOGYIf you’re wondering whether there’s an ontology for variance management controls like there is for asset-level controls, of course there is, and parts of it should look familiar (Figure 11.16):
VARIANCE PREVENTIONPreventing variance boils down to the three things mentioned earlier: awareness of expectations, the capability to comply, and the motivation to comply. Of course, if expectations (i.e., policies and standards) aren’t defined, then people have nothing of which to be aware. This is one of the key links between variance management and decision making. This is also, by the way, another classic case of a Boolean relation-ship between controls because a deficiency in any one of the awareness, capability, or motivation elements will result in variance regardless of the strength of the other two elements. We’ll discuss this more when we cover root cause analysis in a later chapter, and you may (or may not) be surprised at which of these three elements tends to be the most common cause of variance at the organizations in which we have done root cause analyses.
VARIANCE DETECTIONDetecting variance is the next branch in this ontology, and it looks and behaves exactly like the detection branches in asset-level controls. You first have to have vis-ibility because you can’t deal with variances if they aren’t within view. Examples of things that provide visibility into control variance include the following: • Auditing • Control self-assessments
FIGURE 11.16
Variance control ontology.

Variance controls 257
• Second line of defense reviews • Policy compliance reviews • System configuration scanning • Change management processes • Personnel
This last one might raise your eyebrows, but think about it. If you have person-nel in place where controls exist, then you inherently have some degree of visibility. That said, unless people are aware of what the control expectations are, there is little chance that you will have effective recognition—the second element in the detection branch. With that in mind, what would you suppose the relationship is between vis-ibility and recognition? If you said “and,” congratulations!
Recognition, of course, boils down to being able to distinguish that a variant con-dition exists (“Hey, that’s not supposed to be unlocked!”). Then, having recognized a variant condition, the next all-too-obvious element is reporting (i.e., getting the information about a variant condition into the hands of the people/processes that are geared to do something about it, in a timely manner).
Guess what happens without effective variance reporting? Nothing. You can have great visibility and marvelous recognition, but if the reporting function is broken, you’re in trouble. Consequently, this means we have another and relationship and each element in this branch is dependent on the other two for the detection branch to be effective at all. Unfortunately, it is remarkable how often deficient control con-ditions are seen and recognized but not reported. “It’s not my job,” “I didn’t know who to report it to,” or “I didn’t want to get anyone in trouble,” are all too common explanations. This is yet another opportunity for awareness and motivation.
TALKING ABOUT RISKDid you notice the recursive nature of what was just described? Reporting on control variance is itself a control and, as such, the same variance ontology applies (i.e., “How much variance exists in the reporting of control variance?”). It can get a little mind bending but it’s logical once you have wrapped your head around it. We’ll talk about this again a little further on in the chapter.
VARIANCE RESPONSEAfter a variant condition has been reported, there obviously needs to be some sort of response function in place to deal with it. In large part, response boils down to implementing, in a timely manner, whatever remediation decision has been made by the appropriate stakeholder(s). These remediations may, of course, be predefined through policies, standards, and/or guidelines.
TALKING ABOUT RISKIn our experience, it’s common to see control frameworks that include elements regarding preven-tion, detection, and response, but not clearly differentiate whether these elements are intended to prevent, detect, and respond to control problems (variance) or loss events. The fact is these are

CHAPTER 11 Controls258
different parts of the risk problem-space, and differentiation is critical for effectively defining and using metrics, as well as communicating the significance of issues. Terminology and models are not just semantics. They matter in a real sense.
We strongly encourage you to examine whether the organization you work for differentiates between “incidents” that are loss events (e.g., the unauthorized disclosure of sensitive information) and those that are threat events (e.g., an attempted compromise of a web server) and those that are variance events (e.g., a system that isn’t configured properly from a security perspective). These are fundamentally different types of events, and your metrics need to recognize that fact. Too often, we see organizations whose metrics don’t differentiate, which means that decisions driven by these metrics are misinformed.
WHERE AND WHEN VARIANCE OCCURSSo, significant variance is a “bad thing.” Fairly obvious, but when and where does variance raise its ugly head? We’ll bet 9 of 10 of you (or more) can list most of the obvious ones (during design and implementation, when changes occur to the asset, etc.). That said, we are now going to throw you a curve ball. There is another point at which variance occurs on asset-level controls that probably few of you would guess. And here is the pitch—it has nothing directly to do with the control condition. Allow us to explain.
As we discussed earlier, control expectations/requirements are (or should be) set to achieve a desired state of risk. As we have been talking about, when asset-level controls are implemented incorrectly or changes to controls occur, we end up with an unintended (and usually undesirable) level of vulnerability. But what if, instead of changes to controls, we experience an increase in threat capability? Same outcome—increased vulnerability (and thus, risk), which is a variance from the intended level of risk. Consequently, when we say we are “managing variance,” we are actually managing variance in the amount of risk we face, which can be based on control conditions or threat capability.
An all-too-common practical example from the information security disci-pline is when a new exploit is identified in a computer operating system. In this case, the controls haven’t changed, but we nonetheless have an increased level of vulnerability—a level of vulnerability that varies from the intended state. Consequently, when we are defining, implementing, and maintaining controls to manage variance, we also have to include the means of detecting and resolving when threat capability changes. This is why it is so critically important to stay on top of changes in the threat landscape. In our experience, by far, the best way to achieve this is through the use of threat intelligence providers. Few organiza-tions invest the necessary resources to generate truly good threat intelligence on their own.
When threat capability changes occur, we have to engage a response func-tion so that we can make changes to our control conditions and bring the level of vulnerability back to our desired state (e.g., apply a new patch to the system). As we’ll see in an upcoming section, the timeliness of variance detection and response is often critical to the overall effectiveness of variance management.
Variance controls 259
TALKING ABOUT RISKSometimes, we’ll run into someone who will claim that a system was vulnerable even before the new exploit was discovered. After all, the flaw existed all along. The problem with that argument is that threat capability is composed of a threat agent’s skills and resources. However, without a threat agent’s knowledge of the flaw (knowledge being a threat resource), the capability to exploit the flaw did not exist and, thus, the vulnerability associated with that flaw did not exist.
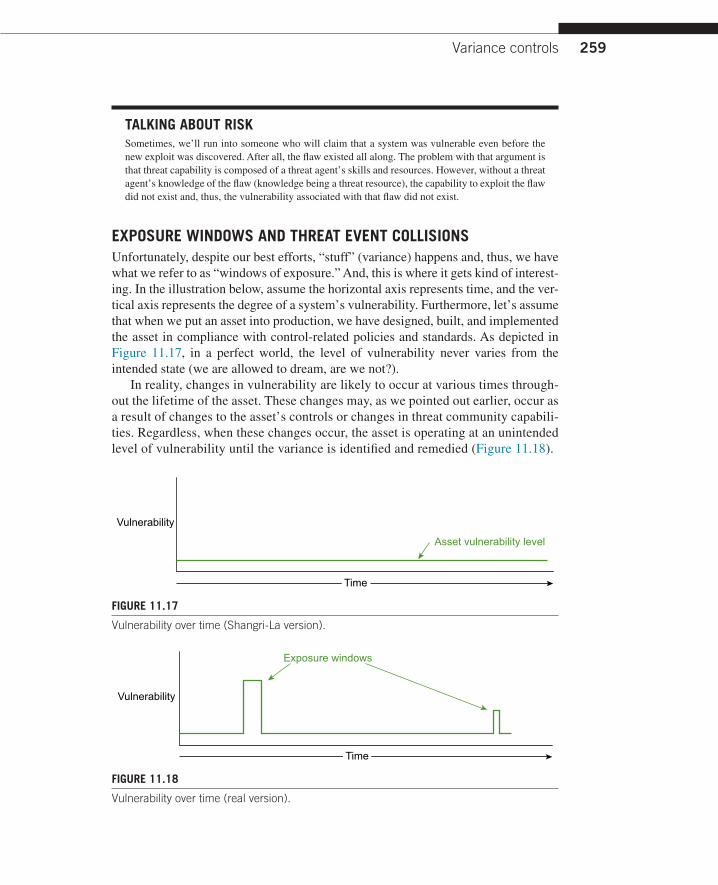
EXPOSURE WINDOWS AND THREAT EVENT COLLISIONSUnfortunately, despite our best efforts, “stuff” (variance) happens and, thus, we have what we refer to as “windows of exposure.” And, this is where it gets kind of interest-ing. In the illustration below, assume the horizontal axis represents time, and the ver-tical axis represents the degree of a system’s vulnerability. Furthermore, let’s assume that when we put an asset into production, we have designed, built, and implemented the asset in compliance with control-related policies and standards. As depicted in Figure 11.17, in a perfect world, the level of vulnerability never varies from the intended state (we are allowed to dream, are we not?).
In reality, changes in vulnerability are likely to occur at various times through-out the lifetime of the asset. These changes may, as we pointed out earlier, occur as a result of changes to the asset’s controls or changes in threat community capabili-ties. Regardless, when these changes occur, the asset is operating at an unintended level of vulnerability until the variance is identified and remedied (Figure 11.18).
Time
Vulnerability
Asset vulnerability level
FIGURE 11.17
Vulnerability over time (Shangri-La version).
Time
Exposure windows
Vulnerability
FIGURE 11.18
Vulnerability over time (real version).
CHAPTER 11 Controls260
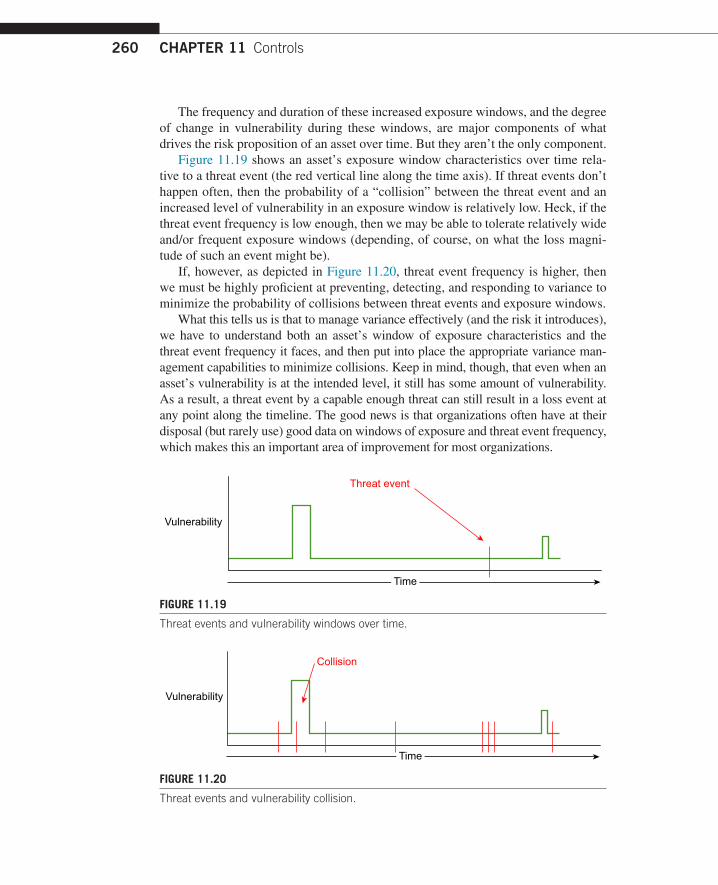
The frequency and duration of these increased exposure windows, and the degree of change in vulnerability during these windows, are major components of what drives the risk proposition of an asset over time. But they aren’t the only component.
Figure 11.19 shows an asset’s exposure window characteristics over time rela-tive to a threat event (the red vertical line along the time axis). If threat events don’t happen often, then the probability of a “collision” between the threat event and an increased level of vulnerability in an exposure window is relatively low. Heck, if the threat event frequency is low enough, then we may be able to tolerate relatively wide and/or frequent exposure windows (depending, of course, on what the loss magni-tude of such an event might be).
If, however, as depicted in Figure 11.20, threat event frequency is higher, then we must be highly proficient at preventing, detecting, and responding to variance to minimize the probability of collisions between threat events and exposure windows.
What this tells us is that to manage variance effectively (and the risk it introduces), we have to understand both an asset’s window of exposure characteristics and the threat event frequency it faces, and then put into place the appropriate variance man-agement capabilities to minimize collisions. Keep in mind, though, that even when an asset’s vulnerability is at the intended level, it still has some amount of vulnerability. As a result, a threat event by a capable enough threat can still result in a loss event at any point along the timeline. The good news is that organizations often have at their disposal (but rarely use) good data on windows of exposure and threat event frequency, which makes this an important area of improvement for most organizations.
Time
Vulnerability
Threat event
FIGURE 11.19
Threat events and vulnerability windows over time.
Time
Vulnerability
Collision
FIGURE 11.20
Threat events and vulnerability collision.
Variance controls 261
TALKING ABOUT RISKWe just read two reports on Internet web security written by two separate information security companies. Both of these reports offered lots of data and statistics about web security: one com-pany1 focusing on the number of vulnerabilities it observed in the thousands of customer websites it provides security for, and the other company2 focusing on data associated with attacks against the customer websites with which it works. The report on vulnerabilities stated that 86% of all websites they tested had at least one serious vulnerability, and that the average window of exposure was 193 days. The report on website attacks stated that, on average, websites were subject to high severity attacks once every 15 days.
What’s wrong with this picture? Both of these companies are highly reputable, seem to have access to solid data, and seem to use reasonable statistical methods. Still, something is just not right. These reports would seem to imply that nearly all of those websites with “serious vulnerabilities” should have been compromised, at least given our premise on the relationship between exposure windows and threat event frequency. Of course, maybe they have been compromised. The report doesn’t provide that information.
Here’s our take on the problem. Given that the analyses underlying the reports were done sepa-rately and independently, there was no effort to correlate the frequencies of specific vulnerabilities against specific attacks (e.g., the probability of an Structured Query Language (SQL) injection attack hitting a site that has an SQL injection vulnerability). Furthermore, as a chief information security officer (CISO) for three organizations, I (J.J.) have become familiar with the odd situation where an application thought to have a specific vulnerability is subjected to attack but isn’t compro-mised. Sometimes, this is because the vulnerability is a false positive or there are compensating con-ditions that keep it from being truly exploited. Other times, it’s because the attack didn’t find that vulnerability among all the web pages and variables on those web pages. Often, the vulnerabilities exist behind an authentication layer and weren’t really accessible to most attacks. And, other times, what someone calls a “Serious Vulnerability” or a “Serious Attack” has to be taken with a grain of salt. Regardless, the point is that we have to exercise a lot more critical thinking and go deeper in our analyses before we can really gain clear and meaningful intelligence from these kinds of data. Don’t get us wrong, though: there was a ton of useful information in both of these reports, and we believe they are absolutely headed in the right direction.
1Whitehat Security Website Security Statistics Report—May 2013.2Imperva Web Application Attack Report—July 2013.
BEYOND ASSET-LEVEL CONTROLSSo far, we’ve been focused on managing variance in asset-level controls. In large part, this is because that’s where threat events and loss occur, but it isn’t the only place where managing variance is important.
As alluded to earlier, the controls used to manage variance (e.g., policies, audits and testing, reporting, and remediation processes) are subject to their own variance-related problems. For example, an organization may have defined a policy or standard regarding the timeliness of remediation activities (a variance control) because it con-sidered that activity to be important from a risk management perspective. If, however, the actual remediation time frame varied significantly from this expectation, then the organization would have larger windows of exposure than it wants and, thus, would not be maintaining its intended risk posture. As you might guess, the same variance man-agement ontology would apply here as it does to asset-level controls. We want to pre-vent variability in variance controls as much as possible through awareness, capability,
CHAPTER 11 Controls262
and motivation; detect it in a timely manner through good visibility, recognition, and reporting; and respond to it in a timely manner by making the appropriate decision makers aware, providing them good information regarding the significance of the vari-ance, and following their direction in resolving the broken variance control.
By now, you’re probably noticing a trend. Variance management seems to apply to almost everything (well, everything that we might call a control). With this in mind, then, it should be no surprise that variance management principles apply to decision-making controls as well, which will be covered further on in this chapter. The bottom line is that variance management is “where it’s at” in terms of effectively dealing with risk. That said, variance management is never going to be effective if the organiza-tion’s risk management decision making is broken. More on that in a minute…
VARIANCE METRICSWe’re going to cover metrics in detail in a later chapter. In our opinion, metrics regarding variance are potentially the most important metrics when it comes to understanding not only the current risk posture of an organization but its ability to manage risk over time. There are three reasons for this: • As we discussed earlier, variance in asset-level controls is usually the great-
est factor when it comes to how much risk an organization has at any given moment.
• Control checklists containing things like, “Do you have a password policy that requires passwords of at least 8 characters in length and a mix of uppercase, lowercase, and numbers?” may tell us the intended state of controls for an orga-nization, but it tells us squat about the actual state of controls. It tells us even less about how much risk the organization is likely to have a year from now.
• As we’ll review in the next section, how much variance an organization has can also be a solid indicator of trouble in an organization’s variance management and decision making.
Consequently, if you can only measure one thing about an organization’s risk
posture (your organization or someone else’s), our suggestion is that you focus on variance. It speaks volumes.
DECISION-MAKING CONTROLSHere again, Deming had it right: the problem almost always boils down to manage-ment. More specifically in the risk management realm, we would submit that it boils down to management decision making. This should not, however, be interpreted as a blanket indictment of people in management positions. Not by a long shot. Many times, they are making the best decisions they can, but they’re hamstrung by bad or missing information, the wrong person is making the decision, or they have insuf-ficient/scarce resources with which to manage the problem.
Decision-making controls 263
In this section, we’ll describe a decision-making ontology and how we categorize decision making. We’ll also touch on how this all fits into a systems view of risk management. By the way, if any of the examples we give sound suspiciously like they come right out of your organization, it’s simply a reflection of the pervasive nature of some of these problems.
COMMON PROBLEMSIt might be helpful to start out by providing a short list of the problems we’ve com-monly seen that are related to suboptimal risk management decision making. As you read this list, ask yourself whether any of them might apply to your organization: • Routine noncompliance with policies • Inconsistent policy enforcement • Lack of clarity regarding accountability • Lack of clarity regarding authority • Frequent changes in risk management focus and direction • Loss events involving assets that no one seemed to know existed • Audit findings that come as a complete surprise
These are all symptoms of the kinds of organizational decision-making problems that the controls in this section can help manage. Because this may be a less famil-iar “control territory” for some of you, we’re going to be a bit more explicit in our descriptions of the problems and controls than we were in the asset-level and vari-ance control sections.
TALKING ABOUT RISKSoapbox warning!! Within the information security discipline, there is a too-common belief that executives don’t care about risk, are willing to accept any amount of risk to meet their business objectives, and just fundamentally do not “get” information security risk. This hasn’t been our expe-rience at all, not even remotely. Our experience has been that if we have done a good job of thinking through and describing meaningful risk conditions and cost-effective risk management options, we have had zero, zilch, nada problems in gaining appropriate levels of executive management atten-tion and support. We used two words in that last sentence, though, that are key: meaningful and appropriate.
Regarding being meaningful: recognize that the risk issues we bring before management are just one slice of a much larger pie of things they have to deal with. They have to focus on and priori-tize not only the risk stuff we take them but decisions related to business opportunities, operational issues, and other forms of risk the organization inevitably wrestles with. Consequently, we need to ensure that we only put problems and solutions before them that are truly relevant, and that we convey this information in terms that are meaningful to them. Usually, this means expressing risk in monetary or mission-related terms and developing cost-benefit analyses for the solutions we recom-mend, which is one of the reasons why FAIR has worked so well for us.
Regarding being appropriate: we may do an outstanding job of risk analysis and business case development, and may even convey this information in terms that make executives stand up and cheer. At the end of the day, though, because of that bigger pie they have to deal with, they may not give us the resources we’ve asked for. And you know what? That is just fine. An “appropriate level of support” is relative to that larger pie and has nothing at all to do with our personal views on whatever the issue was.
CHAPTER 11 Controls264
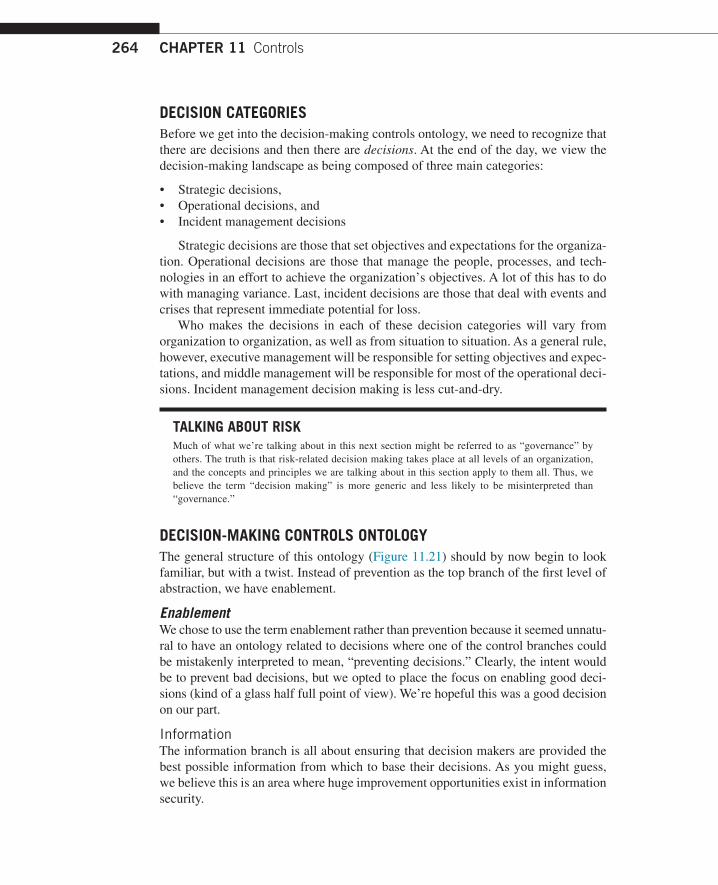
DECISION CATEGORIESBefore we get into the decision-making controls ontology, we need to recognize that there are decisions and then there are decisions. At the end of the day, we view the decision-making landscape as being composed of three main categories: • Strategic decisions, • Operational decisions, and • Incident management decisions
Strategic decisions are those that set objectives and expectations for the organiza-tion. Operational decisions are those that manage the people, processes, and tech-nologies in an effort to achieve the organization’s objectives. A lot of this has to do with managing variance. Last, incident decisions are those that deal with events and crises that represent immediate potential for loss.
Who makes the decisions in each of these decision categories will vary from organization to organization, as well as from situation to situation. As a general rule, however, executive management will be responsible for setting objectives and expec-tations, and middle management will be responsible for most of the operational deci-sions. Incident management decision making is less cut-and-dry.
TALKING ABOUT RISKMuch of what we’re talking about in this next section might be referred to as “governance” by others. The truth is that risk-related decision making takes place at all levels of an organization, and the concepts and principles we are talking about in this section apply to them all. Thus, we believe the term “decision making” is more generic and less likely to be misinterpreted than “governance.”
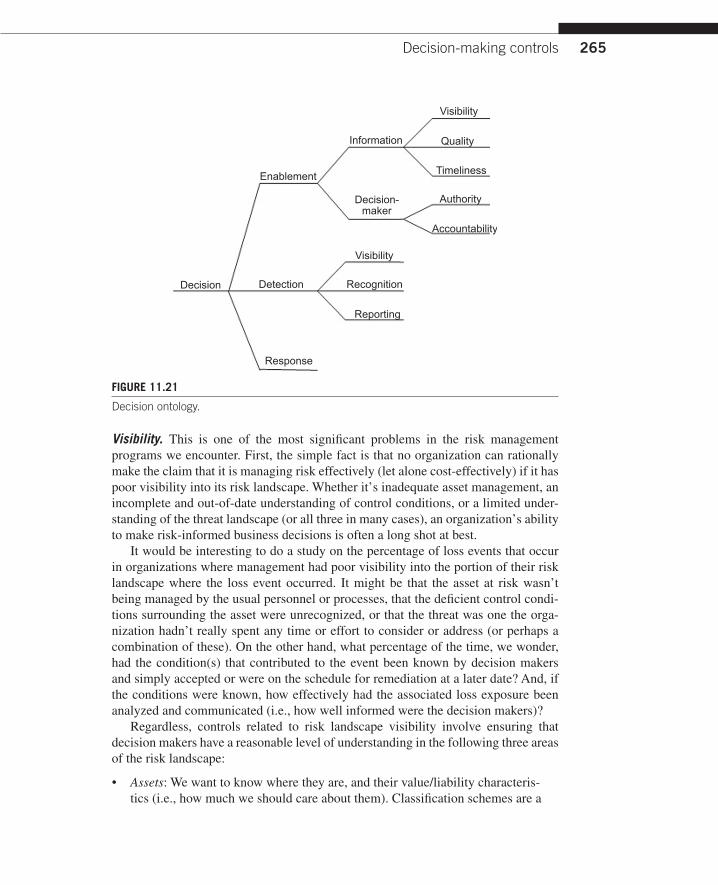
DECISION-MAKING CONTROLS ONTOLOGYThe general structure of this ontology (Figure 11.21) should by now begin to look familiar, but with a twist. Instead of prevention as the top branch of the first level of abstraction, we have enablement.
EnablementWe chose to use the term enablement rather than prevention because it seemed unnatu-ral to have an ontology related to decisions where one of the control branches could be mistakenly interpreted to mean, “preventing decisions.” Clearly, the intent would be to prevent bad decisions, but we opted to place the focus on enabling good deci-sions (kind of a glass half full point of view). We’re hopeful this was a good decision on our part.
InformationThe information branch is all about ensuring that decision makers are provided the best possible information from which to base their decisions. As you might guess, we believe this is an area where huge improvement opportunities exist in information security.
Decision-making controls 265
Visibility. This is one of the most significant problems in the risk management programs we encounter. First, the simple fact is that no organization can rationally make the claim that it is managing risk effectively (let alone cost-effectively) if it has poor visibility into its risk landscape. Whether it’s inadequate asset management, an incomplete and out-of-date understanding of control conditions, or a limited under-standing of the threat landscape (or all three in many cases), an organization’s ability to make risk-informed business decisions is often a long shot at best.
It would be interesting to do a study on the percentage of loss events that occur in organizations where management had poor visibility into the portion of their risk landscape where the loss event occurred. It might be that the asset at risk wasn’t being managed by the usual personnel or processes, that the deficient control condi-tions surrounding the asset were unrecognized, or that the threat was one the orga-nization hadn’t really spent any time or effort to consider or address (or perhaps a combination of these). On the other hand, what percentage of the time, we wonder, had the condition(s) that contributed to the event been known by decision makers and simply accepted or were on the schedule for remediation at a later date? And, if the conditions were known, how effectively had the associated loss exposure been analyzed and communicated (i.e., how well informed were the decision makers)?
Regardless, controls related to risk landscape visibility involve ensuring that decision makers have a reasonable level of understanding in the following three areas of the risk landscape: • Assets: We want to know where they are, and their value/liability characteris-
tics (i.e., how much we should care about them). Classification schemes are a
(QDEOHPHQW
'HFLVLRQ 'HWHFWLRQ
9LVLELOLW\
5HFRJQLWLRQ
5HSRUWLQJ
5HVSRQVH
'HFLVLRQ�PDNHU
,QIRUPDWLRQ
9LVLELOLW\
4XDOLW\
7LPHOLQHVV
$XWKRULW\
$FFRXQWDELOLW\
FIGURE 11.21
Decision ontology.

CHAPTER 11 Controls266
commonly discussed, but rarely effectively applied, approach to setting asset value/liability. Keep in mind, though, the second of these two characteristics—liability. This implies that you also need to understand the external factors that affect loss magnitude, like regulations, contractual agreements, and barriers to customer exit. Controls that can help with this include the following: asset inventory management, classification, and change management. Hey, wait a minute! Isn’t change management a variance control? Why yes it is, but it plays a role here as well. At a strategic level, this information should be high level (e.g., percentage of assets that have been classified, significant changes to the regulatory environment, and significant growth or shrinkage of the asset inventory).
• Controls: Okay, congratulations! Assume that you have great visibility into your assets. You’re still in trouble, though, if you don’t know the asset-level, variance, and decision-making control conditions that exist to protect those assets. Controls that can help with this include audits and various control test-ing processes. Here again, those controls play a role in managing variance but also provide visibility in the broader sense. At a strategic level, this information might include things like significant areas of variance and progress against new control initiatives.
• Threats: Plain and simple—you can’t make good risk decisions if you don’t understand what you’re up against. You need information regarding the frequency of threat events and, in the information security arena at least, you also need intelligence regarding threat capability. For organizations concerned about weather and natural disasters, there are readily available sources of threat intelligence. For physical security, there are always law enforcement agencies. For information security, there are several threat intelligence provid-ers out there; it would be difficult to be a good CISO without engaging one (or at least a happy CISO). At a strategic level, this information might include sig-nificant changes in the threat landscape, or projected changes based on threat intelligence sources.
We wouldn’t be surprised if some readers are concerned about the level of effort
required to evaluate the visibility of these elements. It isn’t as bad as you think. In the metrics chapter, we’ll share an approach to visibility analysis that we believe can be helpful and practical.Information quality. The second most common problem with the information deci-sion makers rely on is that far too often it seems like little to no critical thinking goes into the risk ratings put before management. Let’s give you an example.
I (J.J.) attended a meeting in an organization I was working with where the CISO was briefing leadership on a dire circumstance. Specifically, the informa-tion security team had just finished running a web application security scanner against one of the company’s key web applications and found hundreds of “criti-cal and high-risk vulnerabilities.” You could almost see the blood drain from the faces of these executives, and immediately the conversation turned to how quickly the vulnerabilities could be fixed (at the expense of meeting several key

Decision-making controls 267
business development initiatives). Before things went too far, though, I asked a few questions: • Was this a new application or had it been on the Internet for a while? (Answer:
It had been online for years.) • Were the vulnerabilities new or had they likely been there a while? (Answer:
Many were believed to have been there for months or years.) • Was the application subject to threat events with any regularity? (Answer: Yes, it
was constantly under attack.) • Given the above, how come the company is still in business? (Answer: Blank
stare) • Had the organization regularly engaged consultants to test the security of the
application? (Answer: Yes) • Had they ever compromised the application? (Answer: No) • Were they hiring qualified consultants? (Answer: Yes)
Clearly, something was wrong. Were we to believe the application scan results or the consultants? Or neither? Regardless, the tone in the room changed immediately from one of “Heaven help us!” to “Let’s dig into this and get some better informa-tion.” A little digging and analysis revealed the following: (1) there were only a handful of truly significant vulnerabilities, (2) the frequency of threat events was much lower than believed, and (3) they hadn’t been scoping the consultant work to be very thorough. On the basis of this revised information, management aggressively tackled the most important deficiencies and developed longer-term remediation plans for the rest. They also budgeted for better consultant work.
Here is a quick question for you to see if you’ve been paying attention. Given the previous example, which controls ontology applies? If you said “asset-level con-trols,” you get a silver star. Yes, the weaknesses within the application represented asset-level deficiencies (variances from the desired state) that indicated higher levels of vulnerability and, thus, risk. If you also said, “variance controls,” you get a gold star. The existence of deficiencies in the application represented room for improve-ment in the organization’s ability to prevent variant conditions. You get a platinum star if you also said “decision making” because they were operating with visibility deficiency in terms of good information about control conditions and threat land-scape, and an information quality problem in terms of the scan result accuracy.
TALKING ABOUT RISKIn both the asset-level and variance control ontologies, there were elements labeled “reporting” in the detection branches. Well, reporting to whom? Decision makers, that’s who. And, thus, we have linkages between those ontologies and the decision-making ontology. The reporting branches in these ontologies are the sources of information that will be consumed by the decision-making processes, be they strategic, operational, or incident management related.
We will cover this more specifically in the risk management and metrics chapters, but it is worth pointing out now that the three control ontologies that make up risk management (asset level, variance, and decision making) represent a system of interrelated parts. As a system, what goes on in one can affect the others profoundly, which means the overall risk condition of an organization
CHAPTER 11 Controls268
is fundamentally driven by this system. The problem in our experience is that few organizations explicitly recognize and focus on this systemic/feedback point of view. Oh, there may be tacit rec-ognition at a superficial level, and everybody talks about metrics, but almost nobody really under-stands the details or manages the system through meaningful data and analysis. It is generally off-the-cuff and highly reliant on the experience and intuition of the people within the organiza-tion—talk about variance!
That said, many organizations may feel they just don’t have the resources required to really dive in and optimize their risk management system. We get that. We do believe, however, that by explicitly defining and describing how this system works we are enabling organizations to more easily recognize where they can make incremental improvements in this regard.
It’s a bit harder to identify specific controls regarding information quality. About the closest thing we commonly encounter is when an organization stipulates that its information security personnel have certain certifications (e.g., certified information systems security professional, certified information security manager, and certified in risk and information systems control). The assumption being that certified profes-sionals will provide better quality information to their stakeholders. Although this is true in some respects, as of this writing, none of these certifications (other than the Open Group FAIR certification) cover risk analysis and measurement effectively. This, combined with the prevailing poor risk measurement practices in the informa-tion security industry, leaves us believing that the quality of risk information being given to decision makers represents a major opportunity for improvement in risk management overall. Improvements that organizations should consider include the following: • Having people trained and certified in FAIR (or at least have them read this
book) • Implement a process for risk analysis peer reviews • Requiring periodic third-party reviews of the risk information provided to deci-
sion makers
Another information quality control in which we strongly believe is to have someone (usually the CISO or equivalent) sign his or her name to any risk report being used to drive key decisions (e.g., policy exceptions). This isn’t a signature making him or her directly responsible for the decision being made, but rather his or her signature attests that the risk conditions described in the report are accurate given the information that was available at the time of the report. In other words, although CISOs shouldn’t be held directly responsible for the decisions being made by the business, they should be held accountable for the quality of information used to guide those decisions. As a CISO, I (J.J.) have always implemented this control for two reasons: (1) to differentiate my accountability from those of the decision makers, and (2) to motivate me, and thus my team, to provide the best information we can given our resources. This control has saved my bacon on a couple of occasions when the risk report had indicated significant risk existed, management decided to accept the risk, and a loss event subsequently occurred. In both cases, I wasn’t held accountable for the decision. In conclusion, managing risk effectively requires good information about risk. If that’s broken, then everything else has to be strongly suspect.
Decision-making controls 269
TALKING ABOUT RISKSome people’s response to this attestation of risk information quality control is, “Maybe I ought to call everything high risk so that my backside is always covered.” First, that’s the coward’s way out. Second, they are every bit as likely to lose their job by being overly conservative as not because most business executives will see through that ruse in relatively short order. Look, if someone wants to lead an information security organization, he or she had better get used to the fact that he or she is accountable (formally or not) for helping the organization manage risk as cost-effectively as possible. The only way to do this is to have a solid understanding of risk, risk measurement, and risk management, and be able to communicate information effectively to decision makers. It isn’t a simple job, and it takes a certain amount of intestinal fortitude. In using FAIR, we have been far more comfortable in our ability to meet these requirements.
Information timeliness. Okay, so we have (hopefully) made our point about vis-ibility and information quality, but even the best visibility and highest quality infor-mation is of limited use if it gets to the decision makers too late. From a controls perspective, this is a little bit easier to wrap our arms around. An organization can establish policies and processes that will help ensure timely reporting for each of the three decision types. For strategic decisions, maybe it’s quarterly and year-end reporting. For operational decisions, maybe it is weekly and monthly reporting via metrics and dashboards. For critical deficiencies and loss event management, maybe it is a service-level agreement stating that conditions of certain severities are reported within a certain number of hours. The good news is that we haven’t usually seen as many problems with timeliness as we have with visibility and information quality.
Decision makerGreat information about the risk landscape is for naught if the wrong people are mak-ing decisions. Over the years, we have seen what we believe is gradual improvement on this score in information security. For a long time, it seemed the prevailing mind set was that the CISO should be making policy and other major risk management decisions in organizations. Thankfully, we see more and more recognition that these are ultimately business decisions that need to be made by business executives. There is still room for improvement, to be sure, but at least things seem to be on the right path.
Regardless of the gradual improvement we think we see, this is still an opportu-nity for improvement in many organizations. In our experience, it boils down to two key points: (1) ensuring that decision maker(s) have the authority to make decisions, and (2) ensuring that they will be held accountable for their decisions.Decision-making authority. Ensuring decision-maker authority is critical. Far too often, we have seen mid-level management making risk decisions that should be made at a much higher level within the organization. What makes someone autho-rized to make a decision? Two things come straight to mind, depending on the nature of the decision: (1) having the resources to support the decision and/or (2) having the means to enforce compliance. A great (horrible?) example of “authority gone wrong” is when information security leadership defines the information security policy and doesn’t have it truly vetted and approved by executive management. In this (all too
CHAPTER 11 Controls270
common) example, personnel outside of the information security team often recog-nize that there are no real teeth behind the policies, so they feel free to ignore them. What’s unfortunate is that some risk professionals will argue tooth and nail that exec-utive business management can’t make these decisions intelligently and should cede policy setting to information security leadership. First, executive management didn’t get where they are by being slow witted. Second, the resources to get things done and the ability to apply consequences come from the business, not information security. As we have said before, it is incumbent on risk professionals to make sure they com-municate the issues clearly to executives so that they are making good decisions. If executives don’t “get it,” the blame is on the risk professional, pure and simple.
So, what kind of controls can we apply to help ensure that decisions are made by the right people? There are three that we like a lot: • Clearly defined roles and responsibilities • ARCI (Accountable, Responsible, Consulted, Informed) chart, which is also
sometimes referred to as a RACI chart • Another is similar to an ARCI chart, but it specifically lays out what level of
management is authorized to make risk decisions based on the magnitude of risk and the scope of risk (i.e., whether the risk issue only affects a department, or the entire organization). In some organizations, this is referred to as a Delega-tion of Authority document.
Accountability. Accountability is pretty closely related to authority—or at least you would think so. The problem is that when the wrong person is making a risk deci-sion, he or she can often duck accountability by claiming he or she didn’t know they did not have authority. This is a reasonably legitimate argument if an organization has not clearly defined authority levels. Another common accountability problem is “decision by committee.” When everyone is responsible, nobody’s accountable. A third problem from an accountability perspective is simply the often informal nature of decision documentation (i.e., if someone doesn’t have to sign his or her name to a document, they tend to feel less accountable).
The best accountability control we’ve seen (assuming authority is well defined) is requiring decision makers to sign a statement that explicitly acknowledges their accountability. Most commonly, we see this on risk acceptance documentation and change management approvals. Of course, when an organization is first starting to enforce this as a requirement, there may be resistance by some decision makers. As a result, it’s important that this requirement come from high up in the organization. When this is done right, it is remarkable how much more deliberate and risk averse many decision makers become. They will still take risk, of course, but odds are better that it will be more appropriate risk taking.
DetectionFor the feedback system to be complete, we also need to have the means of detecting when suboptimal risk decisions are being, or have been, made. The structure of this part of the ontology is likely to be familiar and probably obvious to you.
Decision-making controls 271
VisibilityVisibility into risk decision making in general has begun to improve in recent years because an increasing number of organizations implement more formal processes surrounding policy making, policy exceptions, change management, and informa-tion security strategy approvals. This is also one area where governance, risk, and compliance products have sometimes been helpful. However, these aren’t the only, or even necessarily the best, points of visibility into suboptimal decisions. Other great sources include the following: • Internal and external audits • Regulatory examinations • Security testing • Loss events
The first three of these are often explicitly focused on identifying decisions that have (in someone’s opinion) gone awry. For example, findings about inadequate pol-icies and processes are essentially opinions about the decisions that drove those con-ditions. We won’t debate here whether those opinions (and the decisions that helped to inform them) are all that well informed themselves. Nonetheless, the process of examining the decisions an organization makes provides visibility. Loss events can also be a great (if unfortunate) source of visibility into decisions that were poorly informed or made by the wrong person.
Although all four of these sources of visibility exist in most organizations to some degree, our experience has been that it is rare for an organization to explicitly recog-nize them as an opportunity to identify decision-related problems. This boils down to, again, being explicit in your approach to risk management.
RecognitionWe alluded to this previously, but all the visibility in the world is useless if we do not take the time and effort to examine decisions with an eye toward improvement. Was this audit finding due to suboptimal decision making at a policy, process, or other level? Was the information that guided this decision flawed in some material way? Did the right person make the decision? These are the types of questions we must ask if we hope to recognize opportunities for improvement. Absent this, we are stuck in risk management groundhog day—seeing the same decision-making prob-lems repeatedly.
Controls to support the recognition of decision-making problems can include things like building root cause analyses questions into audit management and inci-dent management processes. Other opportunities include things like performing peri-odic reviews of risk analyses being used to guide decisions. After all, there is no reason to wait for an incident or an audit finding to identify a problem.
ReportingHere again, this is straightforward. The good news is (or should be) that the condi-tions resulting from bad decisions are often reported as a natural part of the process.
CHAPTER 11 Controls272
That said, unless decision improvement is an explicit goal, there is a decent chance that identified problems may not be reported. This can be particularly problematic in some cases because the people making suboptimal decisions may be relatively senior in the organization. Consequently, political awareness can be important. Each organi-zation will be different in this regard, but in particularly touchy cases, we will speak directly and confidentially with the decision maker. More often than not though, the fundamental problem is simply that they were operating from bad information.
ResponseFundamentally, response boils down to correcting both whatever causative factors contributed to poor decision making and improving any formal documentation of those suboptimal decisions (e.g., changing bad policies). A significant source of poor information that drives bad decisions is the information security policies themselves. It has to do with the verbiage used in policies and standards. Bottom line—many of the policies and standards we have encountered are nearly unreadable, and people cannot or will not take the time to decipher them. In one organization where I (J.J.) was CISO, I was so appalled at the policy verbiage that I brought in a language expert to evaluate the policies. His verdict—they were written for someone at the grade 23 level; I had no idea there was a literacy level that high! His recommendation was to rewrite them for a sixth grader. We compromised and wrote them at the ninth grade level, which made the information much more accessible.
In addition to grade-level considerations, another problem we are all-too-familiar with is a lack of conciseness. Some organizations (you know who you are) have poli-cies that are pages and pages long, often filled with boilerplate filler that personnel have to dig through to find out what is actually expected of them. Many people sim-ply will not invest the time to do this, which means the policies are next to useless as a means to support decision making. Perhaps the worst example we have ever seen of this was the encryption policy in a financial institution. This policy was more than 60 pages long, filled with all kinds of completely useless information from a variance management perspective. There is virtually no chance that people were going to actu-ally dig through this thing to figure out what the requirements were. We went through this thing with a proverbial hatchet and cut it down to a page and a half.
A possible control to deal with this is to have communications professionals review policies and standards for readability and conciseness. Alternatively, ask yourself whether the average ninth grader would be able to read and understand what is expected of them. If not, there is work to do.
CONTROL WRAP UPAnd there you have it: controls. If you are feeling overwhelmed by what we covered here, the good news is that the risk management and metrics chapters will reinforce much of what we’ve covered. We think you’ll find these concepts become pretty easy to digest and apply as you work with them.