measuring corruption: perception surveys or victimization
TRANSCRIPT
HAL Id: hal-00625179https://hal.archives-ouvertes.fr/hal-00625179
Preprint submitted on 21 Sep 2011
HAL is a multi-disciplinary open accessarchive for the deposit and dissemination of sci-entific research documents, whether they are pub-lished or not. The documents may come fromteaching and research institutions in France orabroad, or from public or private research centers.
L’archive ouverte pluridisciplinaire HAL, estdestinée au dépôt et à la diffusion de documentsscientifiques de niveau recherche, publiés ou non,émanant des établissements d’enseignement et derecherche français ou étrangers, des laboratoirespublics ou privés.
Measuring corruption: perception surveys orvictimization surveys?
Thomas Roca
To cite this version:Thomas Roca. Measuring corruption: perception surveys or victimization surveys?. 2011. �hal-00625179�

Working paper
DT/167/2011
Measuring corruption: perception surveys or victimization surveys?
Towards a better comprehension of populations’
perception mechanisms: Press freedom, Confidence and Gossip
By
Thomas Roca PhD – Lare-Efi, Groupe d’Economie du Développement – Université Montesquieu-Bordeaux IV
Avenue Léon Duguit - 33608 Pessac (France) - tél : 0556848539 - fax : 0556848534 [email protected] – [email protected]
http://lare-efi.u-bordeaux4.fr – http://ged.u-bordeaux4.fr
MEASURING CORRUPTION: PERCEPTION SURVEYS OR VICTIMIZATION SURVEYS? 1
Measuring corruption: perception surveys or victimization surveys?
Towards a better comprehension of populations’ perception mechanisms: press freedom, confidence and gossip
Thomas Roca PhD – Lare-Efi, Groupe d’Economie du Développement – Université Montesquieu-Bordeaux IV
Abstract
While methodologies and survey techniques recorded progress over the years, corruption
measurement remains a many-headed monster. Since 2003 and the first publication of Transparency
International’s Global Corruption Barometer, researchers have access to population’s feeling about the
corruption scourge across institutions. Thereby, wider room emerged for populations’ perceptions in
the field of corruption quantification.
In this paper, we analyze the gulf separating perceived corruption from experienced bribe
situations using global household surveys in a Panel dataset.
We show that the gap between these two types of data can be wide and unevenly distributed across
countries. Introducing further objective and subjective data we try to puzzle out perception
mechanisms.
Résumé
Bien que les techniques d’enquête et les méthodologies se soient améliorées au fil des
années, la mesure corruption demeure problématique. Depuis 2003 et la première publication du
Baromètre Mondial de la Corruption par Transparency International, les chercheurs ont dorénavant
accès aux perceptions des populations pour évaluer l’étendue de la corruption au sein de différentes
administrations.
Dans cet article, nous analysons l’écart entre les perceptions de la corruption et
l’expérience concrète de celle-ci en utilisant des données de panel issues d’enquêtes ménages menées
à une échelle mondiale. Nous comparons ainsi, au sein même des populations, les écarts entre
expériences et perceptions de la corruption, afin d’isoler au mieux les mécanismes à l’œuvre dans la
construction des perceptions. Nous montrons alors que les écarts entre ces deux types de donnée
peuvent être importants et inégalement distribués.
Keywords: Corruption, Global Corruption Barometer, Governance, CPI, Transparency International,
Corruption measurement, Perception indicators, Press freedom, Econometrics, Panel Data, Household surveys.
JEL classification: O11, O17, O19
WORKING PAPER N° 167 2
Content Abstract ................................................................................................................................................. 1
I. Introduction .............................................................................................................................. 2
II. Data and methodology ............................................................................................................. 3
III. Descriptive statistics and data analysis ................................................................................ 4
A. Populations’ perceptions of corruption across institutions .......................................................... 4
B. Comparison across continents and case studies .......................................................................... 6
C. The influence of Press freedom ................................................................................................ 10
D. The role of confidence .............................................................................................................. 11 E. Perception of corruption, from bribe to gossip? ........................................................................ 13
IV. Multivariate analysis .............................................................................................................. 14
A. Methodological issue ................................................................................................................ 14
B. Introducing new controls .......................................................................................................... 16
V. Concluding remarks ............................................................................................................... 18
VI. References ............................................................................................................................... 19
VII. Appendix ................................................................................................................................. 21
I. Introduction Psychologists and cognitive scientists have long studied perception mechanisms and surveys
design, from happiness studies [Cantril, H., (1965); Easterlin, R.A., (1974)] to corruption surveys
[Bertrand, M., Mullainathan, S., (2001); Douhou, S., Magnus, J.R., Van Soest, A., (2011), Jensen,
N.M., Rahman, A., (2011)].
A flourishing literature now studies corruption determinants from the existing various
barometers while performing comparisons with experts' assessments, usually at a national or regional
level [Attila, G. (2008); Moyal, P., Rossi, M., Rossi, T. (2004); Razafrindrakoto, M., Roubaud, F.
(2006)]. A few articles have informed such comparisons at a global-scale [Roca, T. 2010a].
Yet, case studies have informed the different results provided by victimization surveys (or
bribery reporting) and experts’ indicators [Čábelková, I. (2001); Donchev, D., Ujhelyi, G. (2009);
Olken, B., (2006); Razafrindrakoto, M., Roubaud, F. (2006); Rose, R., Mishler, W. (2010).
Nevertheless, only few papers operate cross-sectional studies to identify measurement hazards using
populations’ perceptions and bribery reporting [Mocan, N. (2004), Weber Abramo, C. (2008)].
The existing literature shows that experts’ perceptions and victimization surveys barely agree
regarding the extent of corruption, while some authors even prompted critiques of comparing these
kinds of data, with some contending that there is no reason for them to be strongly correlated, as only
a minority of people actually interacts with public services [Eric Uslaner, cited in Weber Abramo
(2008) p.41]. Perception indicators have also been extensively criticized [see Arnt, C., Oman, C. (2006), etc.] but
remain the only way to “measure the unmeasurable”1.
1 Asas, Z., Faizur, R., (2008)
MEASURING CORRUPTION: PERCEPTION SURVEYS OR VICTIMIZATION SURVEYS? 3
As summarized by Weber Abramo, C. (2008): “Corruption is hard to study empirically. Its many
likely determinants interrelate in complicated ways […] As with other types of criminal activity, it is
hard to observe directly, and so researchers must rely on surveys of corruption’s victims, the accuracy
of which is often difficult to assess."
“The disparities between opinions and experience follow no common pattern from
country to country. If a reasonably common pattern were found, then one could uniformly
“factor out” distortions in the opinion-forming processes of people in order to compare
countries. The absence of such commonality reinforces the conclusion, already stemming
from the analysis of the aggregated data, that the “distance” between opinions and
experiences vary haphazardly from country to country and therefore, perceptions-based
comparisons between countries cannot be linked to differences in the underlying material
conditions.” (Weber Abramo, C. (2008), p.5)
In the line with Weber Abramo’s article, the purpose of this paper is precisely to assess the
accuracy of populations’ perceptions, comparing citizens’ feeling and their experiences with bribe
situations. However, we now propose a systematic analysis of the spread between perceived and
experienced corruption at a global-scale, using surveys from 2006 to 2010 in a panel dataset.
Moreover, contrarily to Claudio Weber Abramo, we suggest that we can identify stylized facts and a
common pattern informing distortions in perception mechanisms.
The first section of this paper describes the data and methodology we use. The second section presents
descriptive statistics of the variable at stake while the last part focuses on the multivariate analysis of
the gulf separating populations’ perceptions and actual experiences with corruption.
II. Data and methodology
To perform this analysis, we gathered data from different sources, crossing objective data and
perception indicators. Thus, we utilized data from the World Bank (GNI per capita, Population size,
Unemployment rate), UNDP (Human Development Index), the International Foundation for Electoral
Systems2 (Election-years); and perception measures from Freedom House (Freedom of the press),
Transparency International / Gallup (Global Corruption Barometers) and The Gallup World Poll
(Confidence data and bribery reporting).
The Global Corruption Barometers (Transparency International) provide, since 2003, aggregated
data at the national level regarding populations’ perceptions of corruption across national
administrations3 (Police, Judiciary system, Public Officials & civil servants, military, Parliament &
legislature, Political Parties, Private sector). Using the Global Corruption Barometers (GCB) from
2006 to 2010, we created a Populations’ Perceptions of Corruption Index (PPCI) gathering
populations’ perceptions towards the institutions people faces the more. However, as the GCBs
coverage is limited, we also introduced data from the Gallup World Poll: Populations’ perceptions of
corruption in Business and Government4.
Aiming to compare perceptions to actual experiences with corruption, we collected data from the
Gallup World Poll (2006 to 2010) regarding populations’ reporting of bribery5.
Subsequently, we created a gap index (GPV), measuring for each country (i) and year (j) (2006 to
2010) the gulf separating perceptions from victimization data (bribery reporting). Using a multivariate
analysis, we finally attempted to inform the determinants of this gap.
2 http://digest.electionguide.org/ 3 http://www.transparency.org/policy_research/surveys_indices/gcb 4 Respectively the percentage of the population stating that Business sector and Government is corrupted. 5 The percentage of the population stating having faced bribe situation the past year.

WORKING PAPER N° 167 4
III. Descriptive statistics and data analysis
A. Populations’ perceptions of corruption across institutions
As a first description of the Global Corruption Barometer data, we performed a factor analysis
(Principal Component Analysis on the pooled dataset) to represent the correlations among the different
perceptions of the population across national institutions.
Extracting two components, one can observe that populations’ perceptions of corruption in
Business and corruption in the Police are the most divergent. This representation seems to provide a
robust picture in line with intuition. Thereby, perceptions of corruption in the police, the judiciary
system and civil servants appear very close, so as perceptions of corruption in government and
political parties. Populations’ evaluation of corruption in the military seems not surprisingly the less
correlated with the other dimensions.
If this first analysis seems to provide a coherent picture, it does not however, give any clue about the
consistency of these perceptions to describe the reality of corruption. As reminded by the existing
literature, perceptions often embody a strong internal coherence.
In order to inform a first comparison between victimization surveys and populations’
perceptions, we constructed a correlation matrix confronting Bribery reporting (Gallup World Poll)
and perceptions of corruption in the institutions people faces the more:
Figure 1. Populations’ perceptions of corruption accros institutions: Principal Component Analysis
Data source: Global Corruption Barometer (2006 to 2010)

MEASURING CORRUPTION: PERCEPTION SURVEYS OR VICTIMIZATION SURVEYS? 5
Table 1 shows that populations’ perceptions are not much correlated with bribe situations.
Perceptions of corruption in Government and the Police are the most associated with victimization
surveys. However, one can argue that people are not likely victim of bribery from government
members, thus, we should consider that corruption in government is a proxy for corruption in the other
administrations. It seems likely that the behavior of government officials reflects the one of civil
servants; exemplary government would likely not tolerate a corrupted administration.
As suggested by the previous factor analysis, corruption in Business and Private sector is only
correlated with corruption in Public officials and Civil Servants (though not strongly).
To investigate the gap between experiences and perceptions, we first aggregated perceptions
data computing a Populations’ Perceptions of Corruption Index (PPCI).
As the Global Corruption Barometer is not available for each country - it covered 88 countries in 2010
to 63 in 2006 - we calculated the PPCI using also the Gallup World Poll data. Ideally, the PPCI would
gather the following 5 dimensions for each year and country: Corruption in Public Officials and Civil
servants (GCB); Corruption in the Local Police (GCB); Corruption in the judiciary system (GCB);
Corruption in business (Gallup WP) and Corruption in Government (Gallup WP).
Nevertheless, to maximize our sample size, we considered reasonable to calculate our index if at least
two dimensions were available:
PPCIi,j = 1/n x Populations’ Perception of Corruption in dimension di,j
n= number of dimension according to data availability (with 2<n<5) Country: i Year: j
Table 1. Correlations Matrix (data: 2009)
Populations’ perception of corruption in...
Government Police Business
Private sector Public officials Civil servants
Judiciary
Victimization surveys
Pearson Correlation .427** .413** -.074 .264* .390** Sig. (2-tailed) .000 .000 .536 .024 .001 N 126 73 73 73 73
Po
pu
lati
on
s’ p
erce
pti
on
of
corr
up
tio
n in
...
Government Pearson Correlation
.698** -.012 .628** .689**
Sig. (2-tailed)
.000 .912 .000 .000 N
81 81 81 81
Police Pearson Correlation
-.076 .736** .753**
Sig. (2-tailed)
.482 .000 .000 N
87 87 87
Business & Private sector
Pearson Correlation
.224* .080 Sig. (2-tailed)
.037 .461
N
87 87
Public officials & Civil servants
Pearson Correlation
.794** Sig. (2-tailed)
.000
N
87
Judiciary
Pearson Correlation
Sig. (2-tailed)
N
**Correlation is significant at the 0.01 level (2-tailed). * at the 0.05 level (2-tailed).

WORKING PAPER N° 167 6
74.0 73.1
57.1
7.2
81.5
37.7 64.5
57.1
22.0
28.1
0
10
20
30
40
50
60
70
80
90
100
Population's perception of
corruption
Population reporting bribery (%
of population)
Freedom of press (Freedom house)
Confidence in Government
(Gallup)
Africa Latin America and the Carribean Europe and North America CIS Asia Pacific Arab countries
B. Comparison across continents and case studies
In order to give a first taste of the distribution of the PPCI among continents, but also to inform
the role of variables that likely influence it, we draw the following chart:
Figure 2 shows that the gap between experience and perceptions of corruption is not evenly
distributed. For instance, if Arab States citizens report bribe situations the more, they also perceive
corruption the less (tie with Europe and North America). On the other hand, Latin America reports a
low level of bribery within victimization surveys while perceives one of the widest scopes of
corruption. We displayed in Table 2. The descriptive statistics we computed supporting this
representation.
Table 2. Descriptive statistics: continents comparison
Continent
Populations' perception of corruption*
Population reporting bribery
(% population)
Freedom of press (Freedom
house)
Confidence in Government
(Gallup)
Accepting bribe never justifiable (% population.
WVS)
Sample size for "Accepting
bribe…"
Africa 74.0 19.8 41.6 51.7 65.0 (N=11)
Latin America and the Caribbean 73.1 9.9 61.9 42.5 75.4 (N=12)
Europe and North America 57.1 7.2 81.5 48.0 77.3 (N=25)
CIS 68.0 20.2 49.3 37.7 66.1 (N=24)
Asia Pacific 63.4 9.1 55.1 64.5 73.0 N=14)
Arab countries 57.1 22.0 28.1 60.3 90.4 (N=9)
*Mean perceptions of corruption in: Government; Police; Business; Private sector; Public officials; Civil servants; Judiciary
Figure 2. Comparison among continents
Data source: Gallup World Poll, Transparency International GCB, Freedom House. (2009)
MEASURING CORRUPTION: PERCEPTION SURVEYS OR VICTIMIZATION SURVEYS? 7
Aiming to evaluate the weight of tolerance towards corruption, we introduced data from the
World Value Surveys (WVS), describing the share of the population stating that “accepting bribe is
never justifiable”; however, the coverage of the WVS appears too limited to provide rigorous
interpretations.
The literature describing perception mechanisms shows that populations tend to report more
systematically the situations interpreted as unfair [Douhou, S., Magnus, J.R., Van Soest, A., (2011)].
Thereby, we would expect higher bribery reporting in countries where populations find bribery the
less justifiable. One may argue that in countries very sensitive towards corruption, people would be
reluctant to give a reliable answer to the bribery question. Nevertheless, the data we use deals with
people facing bribe situation, not with respondents’ actual acceptation to give /or asking for bribe.
Observing tolerance vis-à-vis bribe situations, we are not able to determine any significant
trends. Nevertheless, this first description seems to uncover some evidence in regards to the role of
confidence. A low confidence in government seems to be associated with wider gaps between
experience and perceptions. The influence of press freedom seems more controversial.
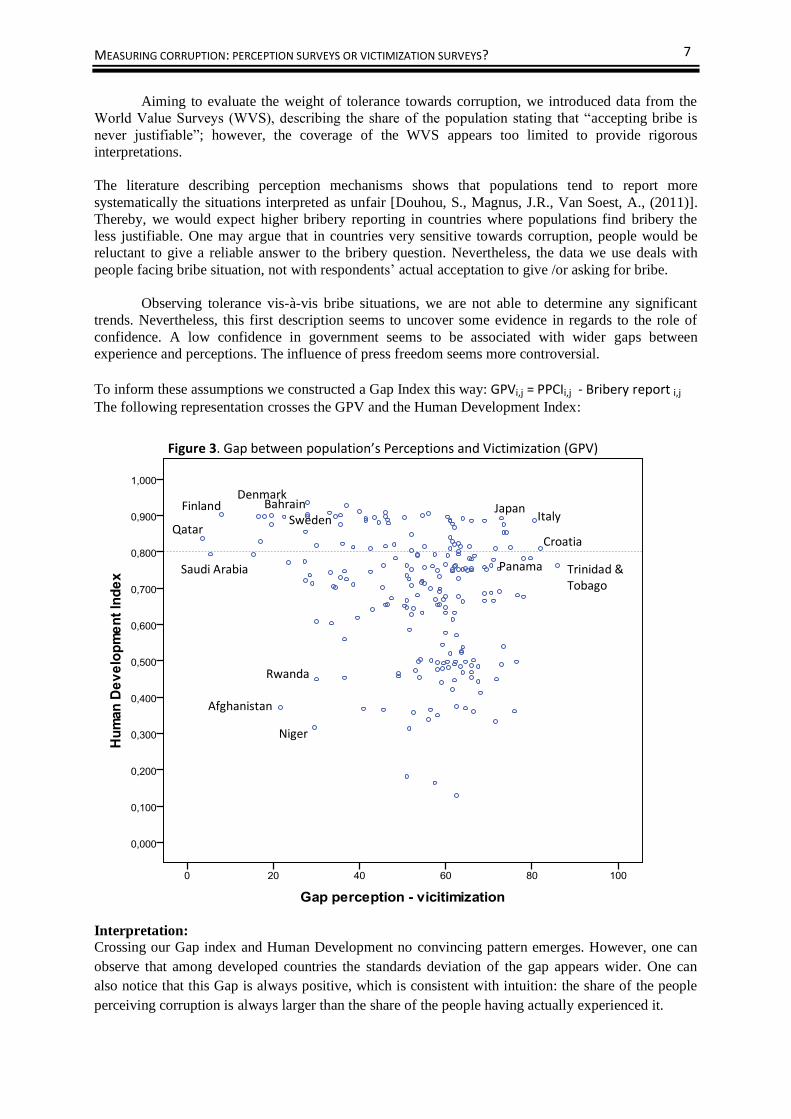
To inform these assumptions we constructed a Gap Index this way: GPVi,j = PPCIi,j - Bribery report i,j The following representation crosses the GPV and the Human Development Index:
Interpretation:
Crossing our Gap index and Human Development no convincing pattern emerges. However, one can
observe that among developed countries the standards deviation of the gap appears wider. One can
also notice that this Gap is always positive, which is consistent with intuition: the share of the people
perceiving corruption is always larger than the share of the people having actually experienced it.
Figure 3. Gap between population’s Perceptions and Victimization (GPV)
Saudi Arabia
Bahrain Sweden
Afghanistan
Niger
Qatar
Panama
Italy
Trinidad & Tobago
Japan
Rwanda
Finland Denmark
Croatia

WORKING PAPER N° 167 8
83
6
56
60 0
10 20 30 40 50 60 70 80 90
100
Population's perception of corruption
Population reporting bribery (% of population)
Freedom of press (Freedom house)
Confidence in Government (Gallup)
Panama*
92
4
77
29 0
10 20 30 40 50 60 70 80 90
100
Population's perception of
corruption
Population reporting bribery (%
of population)
Freedom of press (Freedom house)
Confidence in Government
(Gallup)
Trinidad and Tobago
72
3
79
25 0 10 20 30 40 50 60 70 80 90
100
Population's perception of
corruption
Population reporting
bribery (% of population)
Freedom of press (Freedom
house)
Confidence in Government
(Gallup)
Japan
85
4
71
36 0
10 20 30 40 50 60 70 80 90
100
Population's perception of
corruption
Population reporting bribery
Freedom of press (Freedom house)
Confidence in government
(Gallup)
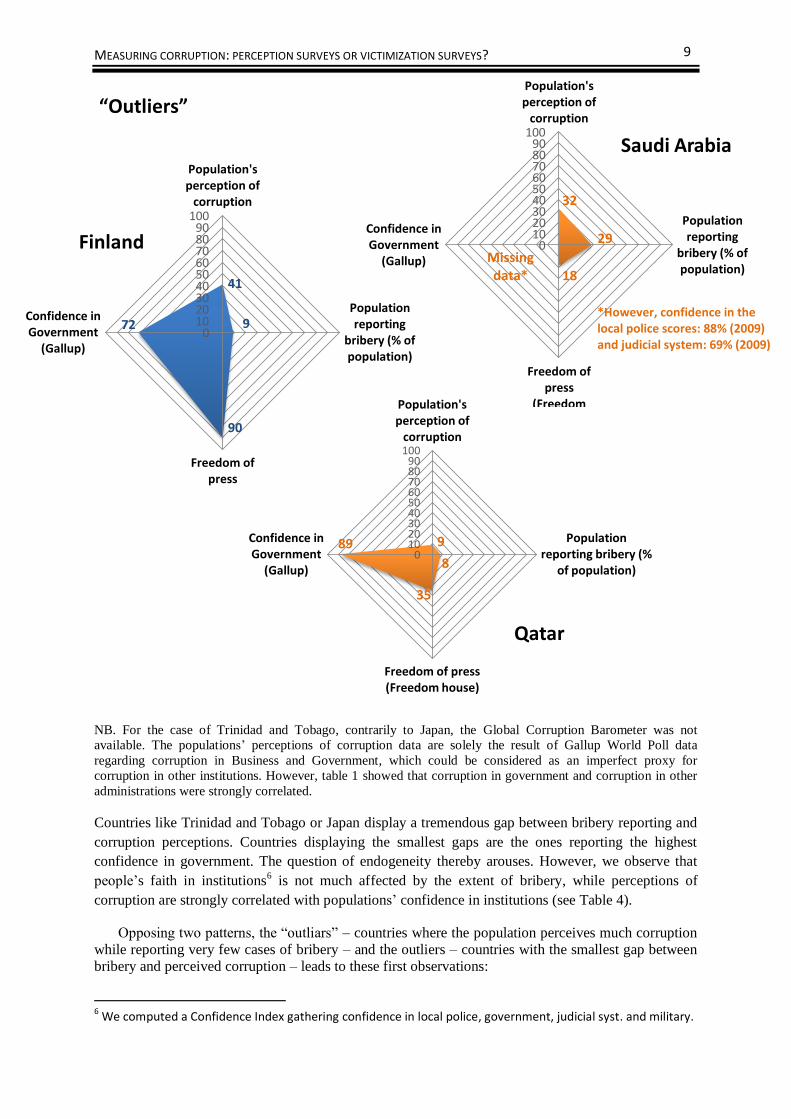
To isolate better the role of press freedom and confidence, we flagged outliers - countries with the
widest or thinner gaps - and draw further charts.
“Outliars”
Confidence in Government (2006-2009) 2006 Panama 36 2007 Panama 25 2008 Panama 31 2009 Panama 60
Source Gallup World Poll
* The latest data available for “Confidence in Government” in Panama
was from 2009. In May 2009 Election took place in Panama. Thus, the
score of this country for this variable rises this year.
Italy
MEASURING CORRUPTION: PERCEPTION SURVEYS OR VICTIMIZATION SURVEYS? 9
41
9
90
72 0
10 20 30 40 50 60 70 80 90
100
Population's perception of
corruption
Population reporting
bribery (% of population)
Freedom of press
(Freedom
Confidence in Government
(Gallup)
Finland
9
8
35
89 0
10 20 30 40 50 60 70 80 90
100
Population's perception of
corruption
Population reporting bribery (%
of population)
Freedom of press (Freedom house)
Confidence in Government
(Gallup)
Qatar
32
29
18 Missing data*
0 10 20 30 40 50 60 70 80 90
100
Population's perception of
corruption
Population reporting
bribery (% of population)
Freedom of press
(Freedom
Confidence in Government
(Gallup)
Saudi Arabia
“Outliers”
NB. For the case of Trinidad and Tobago, contrarily to Japan, the Global Corruption Barometer was not
available. The populations’ perceptions of corruption data are solely the result of Gallup World Poll data
regarding corruption in Business and Government, which could be considered as an imperfect proxy for
corruption in other institutions. However, table 1 showed that corruption in government and corruption in other
administrations were strongly correlated.
Countries like Trinidad and Tobago or Japan display a tremendous gap between bribery reporting and
corruption perceptions. Countries displaying the smallest gaps are the ones reporting the highest
confidence in government. The question of endogeneity thereby arouses. However, we observe that
people’s faith in institutions6 is not much affected by the extent of bribery, while perceptions of
corruption are strongly correlated with populations’ confidence in institutions (see Table 4).
Opposing two patterns, the “outliars” – countries where the population perceives much corruption
while reporting very few cases of bribery – and the outliers – countries with the smallest gap between
bribery and perceived corruption – leads to these first observations:
6 We computed a Confidence Index gathering confidence in local police, government, judicial syst. and military.
*However, confidence in the local police scores: 88% (2009) and judicial system: 69% (2009)
WORKING PAPER N° 167 10
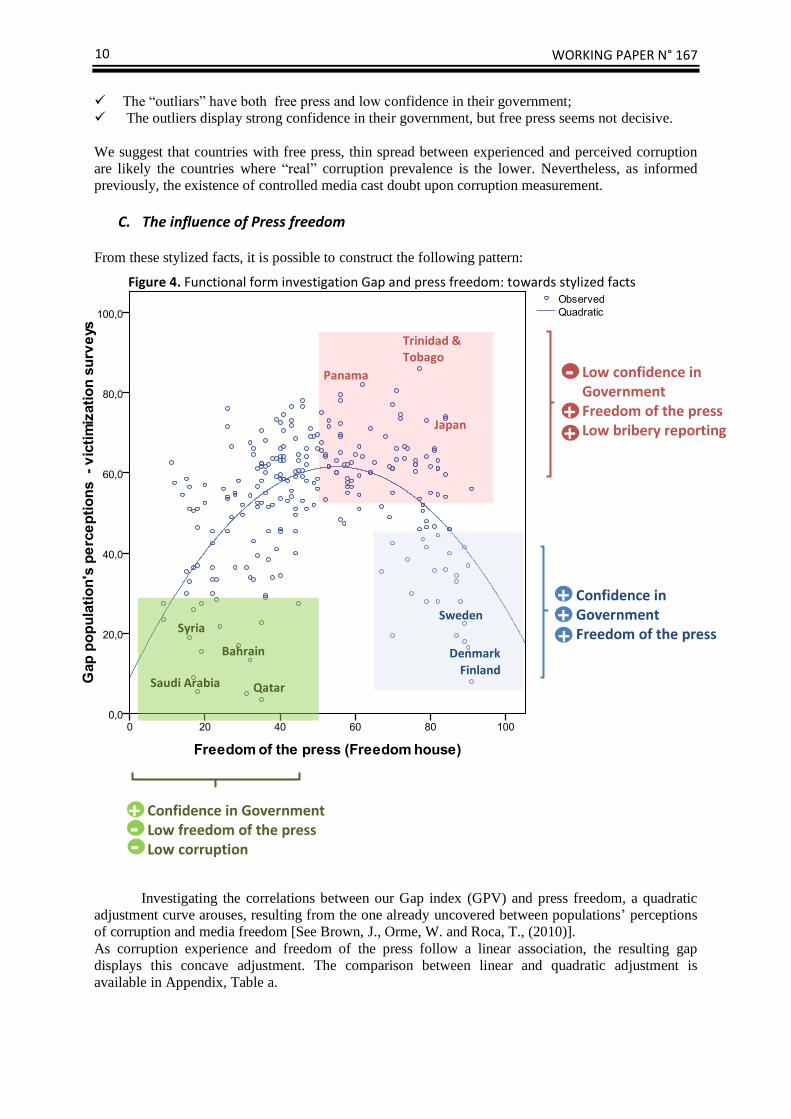
- Low confidence in Government
- Freedom of the press - Low bribery reporting
- Confidence in Government
- Freedom of the press - Low corruption
- Confidence in Government - Low freedom of the press - Low corruption
The “outliars” have both free press and low confidence in their government;
The outliers display strong confidence in their government, but free press seems not decisive.
We suggest that countries with free press, thin spread between experienced and perceived corruption
are likely the countries where “real” corruption prevalence is the lower. Nevertheless, as informed
previously, the existence of controlled media cast doubt upon corruption measurement.
C. The influence of Press freedom From these stylized facts, it is possible to construct the following pattern:
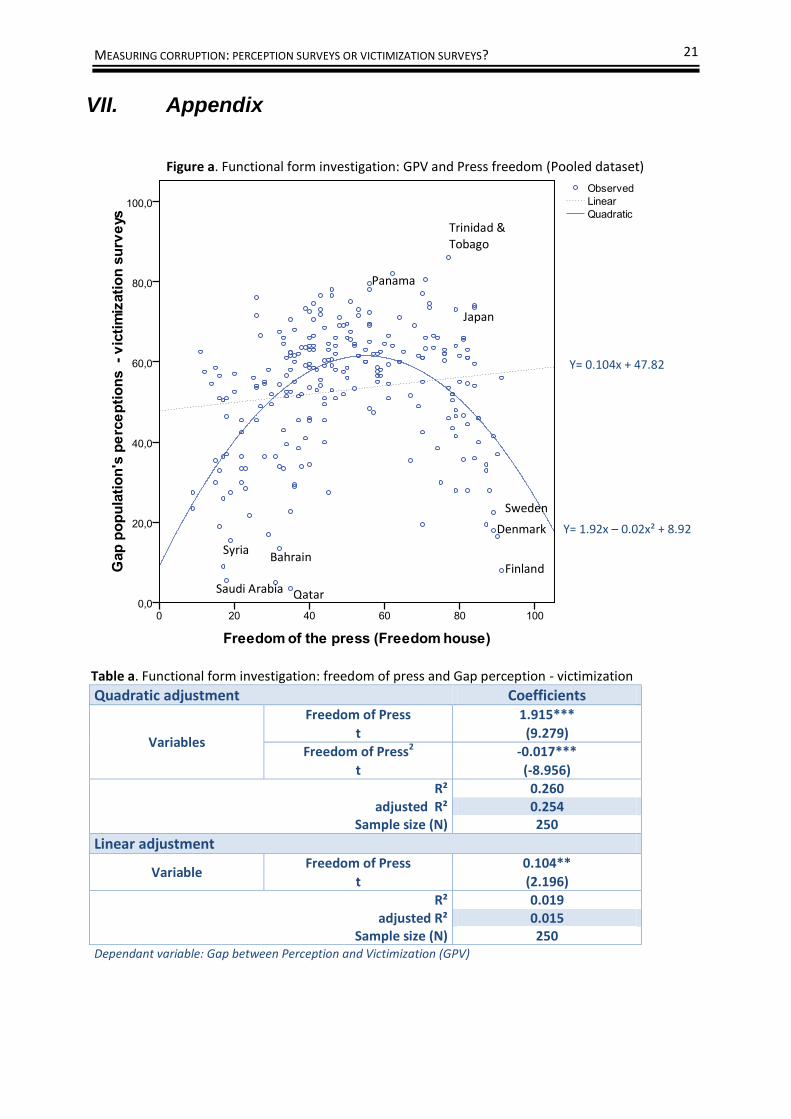
Investigating the correlations between our Gap index (GPV) and press freedom, a quadratic
adjustment curve arouses, resulting from the one already uncovered between populations’ perceptions
of corruption and media freedom [See Brown, J., Orme, W. and Roca, T., (2010)].
As corruption experience and freedom of the press follow a linear association, the resulting gap
displays this concave adjustment. The comparison between linear and quadratic adjustment is
available in Appendix, Table a.
+
-
+
+ + +
+ - -
Figure 4. Functional form investigation Gap and press freedom: towards stylized facts
Qatar Saudi Arabia
Bahrain
Sweden Syria
Denmark
Finland
Trinidad & Tobago
Panama
Japan
MEASURING CORRUPTION: PERCEPTION SURVEYS OR VICTIMIZATION SURVEYS? 11
We observe that populations’ perceptions and bribery reporting tend to converge in
autocracies and in countries where corruption is likely not widespread. For other countries, freedom of
the press seems to enlarge the gap between perceptions and corruption exposure.
It seems likely that in countries suffering from a challenged freedom of the press, perceptions
are mainly the consequence of experience, whereas in accountable democracies, corruption
perceptions are mostly the fact of media reporting.
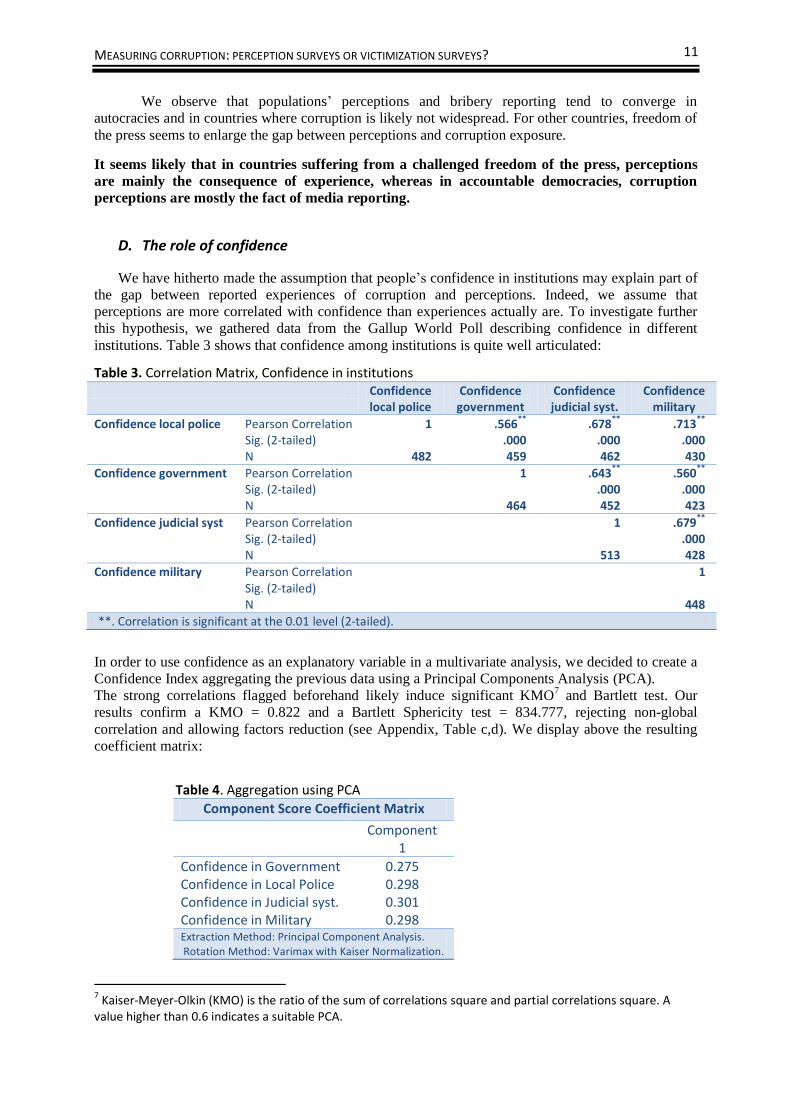
D. The role of confidence
We have hitherto made the assumption that people’s confidence in institutions may explain part of
the gap between reported experiences of corruption and perceptions. Indeed, we assume that
perceptions are more correlated with confidence than experiences actually are. To investigate further
this hypothesis, we gathered data from the Gallup World Poll describing confidence in different
institutions. Table 3 shows that confidence among institutions is quite well articulated:
In order to use confidence as an explanatory variable in a multivariate analysis, we decided to create a
Confidence Index aggregating the previous data using a Principal Components Analysis (PCA).
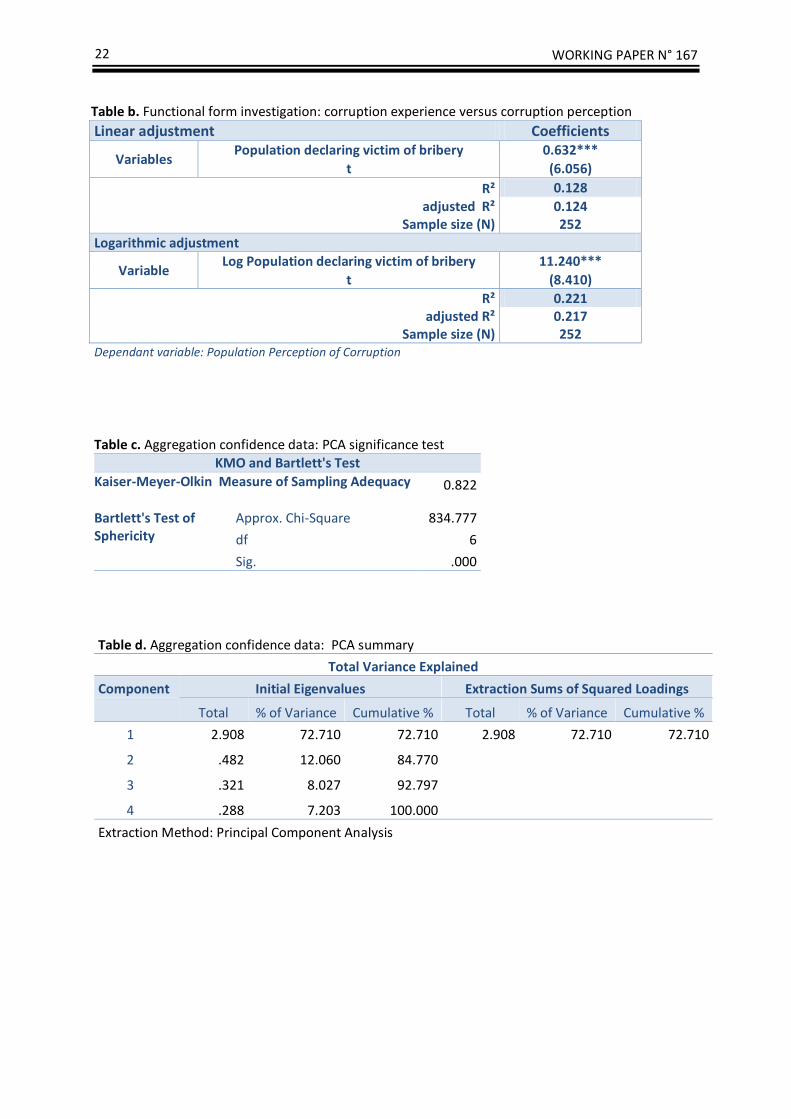
The strong correlations flagged beforehand likely induce significant KMO7 and Bartlett test. Our
results confirm a KMO = 0.822 and a Bartlett Sphericity test = 834.777, rejecting non-global
correlation and allowing factors reduction (see Appendix, Table c,d). We display above the resulting
coefficient matrix:
Table 4. Aggregation using PCA
Component Score Coefficient Matrix
Component 1
Confidence in Government 0.275 Confidence in Local Police 0.298 Confidence in Judicial syst. 0.301 Confidence in Military 0.298 Extraction Method: Principal Component Analysis. Rotation Method: Varimax with Kaiser Normalization.
7 Kaiser-Meyer-Olkin (KMO) is the ratio of the sum of correlations square and partial correlations square. A value higher than 0.6 indicates a suitable PCA.
Table 3. Correlation Matrix, Confidence in institutions Confidence
local police Confidence government
Confidence judicial syst.
Confidence military
Confidence local police Pearson Correlation 1 .566** .678** .713** Sig. (2-tailed) .000 .000 .000 N 482 459 462 430
Confidence government Pearson Correlation 1 .643** .560** Sig. (2-tailed) .000 .000 N 464 452 423
Confidence judicial syst Pearson Correlation 1 .679**
Sig. (2-tailed) .000 N 513 428
Confidence military Pearson Correlation 1 Sig. (2-tailed) N 448
**. Correlation is significant at the 0.01 level (2-tailed).

WORKING PAPER N° 167 12
The endogeneity issue
The role of confidence in corruption assessment appears controversial. Indeed, while corruption
experiences may ruin one’s faith in administration, it also seems likely that people with originally no
confidence in institutions would declare them corrupted answering perception surveys. Thus, an
endogeneity issue arises.
Our purpose is to investigate the gap between perceptions and bribery reporting. Introducing
confidence, we assume that faith would impact more sorely one of the two components of the GPV,
for instance, the perception dimension. Comparing confidence influence towards both experienced and
perceived corruption would provide a first clue for resolving the endogeneity dilemma.
Table 4 displays the correlations among our Confidence Index, Transparency’s Corruption Perception
Index (CPI), Bribery reporting and Populations’ perceptions of corruption.
We observe that whether all three corruption measures are correlated, in an intuitive way with
confidence, experienced corruption appears the less associated with confidence (-0.2339).
Confidence seems, however, strongly correlated (adversely) with populations’ perceptions, while not
much with experts’ perceptions. Furthermore, bribery reporting is not strongly linked with
populations’ perceptions (0.3577), whereas correlation becomes much stronger if we consider experts’
evaluations (0.5158 in absolute value). From these observations, we can draw the following
conclusions:
Populations’ perceptions incorporate people’s faith in administrations;
Confidence in administration is not much affected by corruption experience;
Experts’ perceptions are more associated with corruption experience, and less influenced by
people’s confidence in institutions.
This picture tends to demonstrate that the gulf separating perceptions from experience is likely
influenced by populations’ confidence in administrations and that experts’ assessments almost
certainly provide the most robust corruption evaluation.
Table 4. Correlations matrix: Perceptions, Bribery reporting and Confidence Populations'
Perceptions Corruption Index
Bribery Reporting
CPI (Transparency International)
Confidence Index
Populations' Perceptions Corruption Index
Pearson Correlation 1 0.3577* -0.6441* -0.5148*
Sig. (2-tailed) 0.0000 0.0000 0.0000
N 553 252 540 553
Bribery report
Pearson Correlation 1 -0.5158* -0.2339*
Sig. (2-tailed) 0.0000 0.0001
N 269 265 269
CPI (Transparency International)
Pearson Correlation 1 0.2534*
Sig. (2-tailed) 0.0000
N 876 876
Confidence Index
Pearson Correlation 1
Sig. (2-tailed)
N 985
*. Correlation is significant at the 0.01 level (2-tailed). NB. The negative sign of the CPI is due to its inversed scale (0 standing for the max. of corruption; 10 for the min.)
MEASURING CORRUPTION: PERCEPTION SURVEYS OR VICTIMIZATION SURVEYS? 13
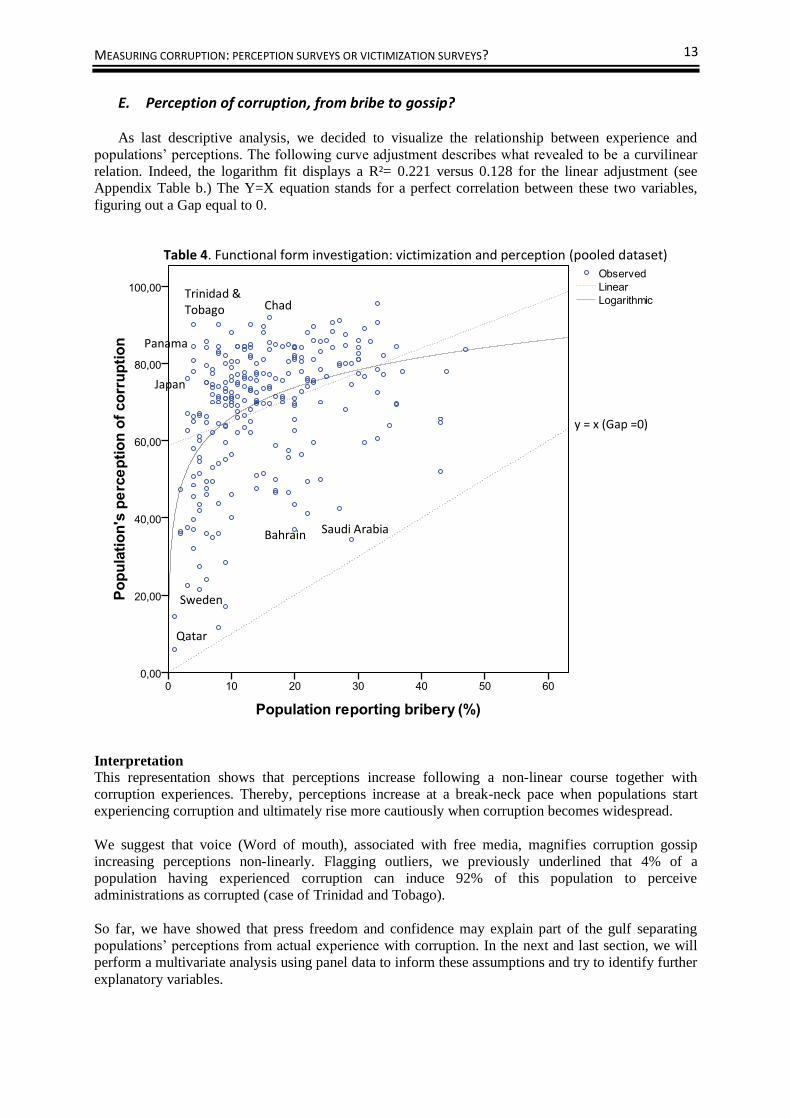
E. Perception of corruption, from bribe to gossip?
As last descriptive analysis, we decided to visualize the relationship between experience and
populations’ perceptions. The following curve adjustment describes what revealed to be a curvilinear
relation. Indeed, the logarithm fit displays a R²= 0.221 versus 0.128 for the linear adjustment (see
Appendix Table b.) The Y=X equation stands for a perfect correlation between these two variables,
figuring out a Gap equal to 0.
Interpretation
This representation shows that perceptions increase following a non-linear course together with
corruption experiences. Thereby, perceptions increase at a break-neck pace when populations start
experiencing corruption and ultimately rise more cautiously when corruption becomes widespread.
We suggest that voice (Word of mouth), associated with free media, magnifies corruption gossip
increasing perceptions non-linearly. Flagging outliers, we previously underlined that 4% of a
population having experienced corruption can induce 92% of this population to perceive
administrations as corrupted (case of Trinidad and Tobago).
So far, we have showed that press freedom and confidence may explain part of the gulf separating
populations’ perceptions from actual experience with corruption. In the next and last section, we will
perform a multivariate analysis using panel data to inform these assumptions and try to identify further
explanatory variables.
Table 4. Functional form investigation: victimization and perception (pooled dataset)
Japan
Trinidad & Tobago Chad
Qatar
Sweden
Saudi Arabia Bahrain
y = x (Gap =0)
Panama
WORKING PAPER N° 167 14
IV. Multivariate analysis
As previously mentioned, we gathered data from various sources in a panel dataset (2006 to 2010,
see section II). We use data aggregated at the national level which, unfortunately, prevent us from
using respondent’s characteristics as control variables. However, we introduced nationally aggregated
controls such as subjective well-being data (Life satisfaction), unemployment rate or election-years.
We assume these variables may grasp populations’ satisfaction, influencing their perceptions of
institutions but not the amount of actual corruption people faces, thereby increasing the gap between
perceived and experienced corruption (GPV).
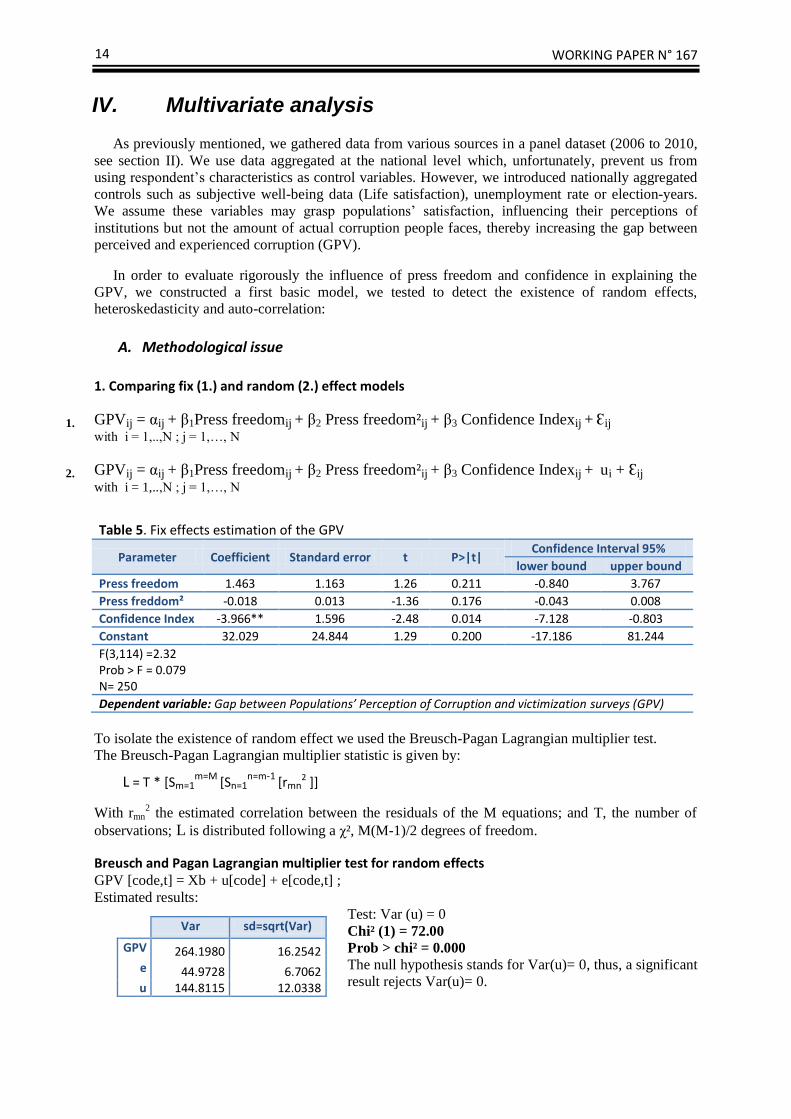
In order to evaluate rigorously the influence of press freedom and confidence in explaining the
GPV, we constructed a first basic model, we tested to detect the existence of random effects,
heteroskedasticity and auto-correlation:
A. Methodological issue
1. Comparing fix (1.) and random (2.) effect models
1. GPVij = αij + β1Press freedomij + β2 Press freedom²ij + β3 Confidence Indexij + Ԑij with i = 1,..,N ; j = 1,…, N
2. GPVij = αij + β1Press freedomij + β2 Press freedom²ij + β3 Confidence Indexij + ui + Ԑij with i = 1,..,N ; j = 1,…, N
To isolate the existence of random effect we used the Breusch-Pagan Lagrangian multiplier test.
The Breusch-Pagan Lagrangian multiplier statistic is given by:
L = T * [Sm=1m=M
[Sn=1n=m-1
[rmn2 ]]
With rmn2 the estimated correlation between the residuals of the M equations; and T, the number of
observations; L is distributed following a χ², M(M-1)/2 degrees of freedom.
Breusch and Pagan Lagrangian multiplier test for random effects GPV [code,t] = Xb + u[code] + e[code,t] ;
Estimated results:
Test: Var (u) = 0
Chi² (1) = 72.00
Prob > chi² = 0.000
The null hypothesis stands for Var(u)= 0, thus, a significant
result rejects Var(u)= 0.
Table 5. Fix effects estimation of the GPV
Parameter Coefficient Standard error t P>|t| Confidence Interval 95%
lower bound upper bound
Press freedom 1.463 1.163 1.26 0.211 -0.840 3.767
Press freddom² -0.018 0.013 -1.36 0.176 -0.043 0.008
Confidence Index -3.966** 1.596 -2.48 0.014 -7.128 -0.803
Constant 32.029 24.844 1.29 0.200 -17.186 81.244
F(3,114) =2.32 Prob > F = 0.079 N= 250
Dependent variable: Gap between Populations’ Perception of Corruption and victimization surveys (GPV)
Var sd=sqrt(Var)
GPV 264.1980 16.2542 e 44.9728 6.7062 u 144.8115 12.0338
MEASURING CORRUPTION: PERCEPTION SURVEYS OR VICTIMIZATION SURVEYS? 15
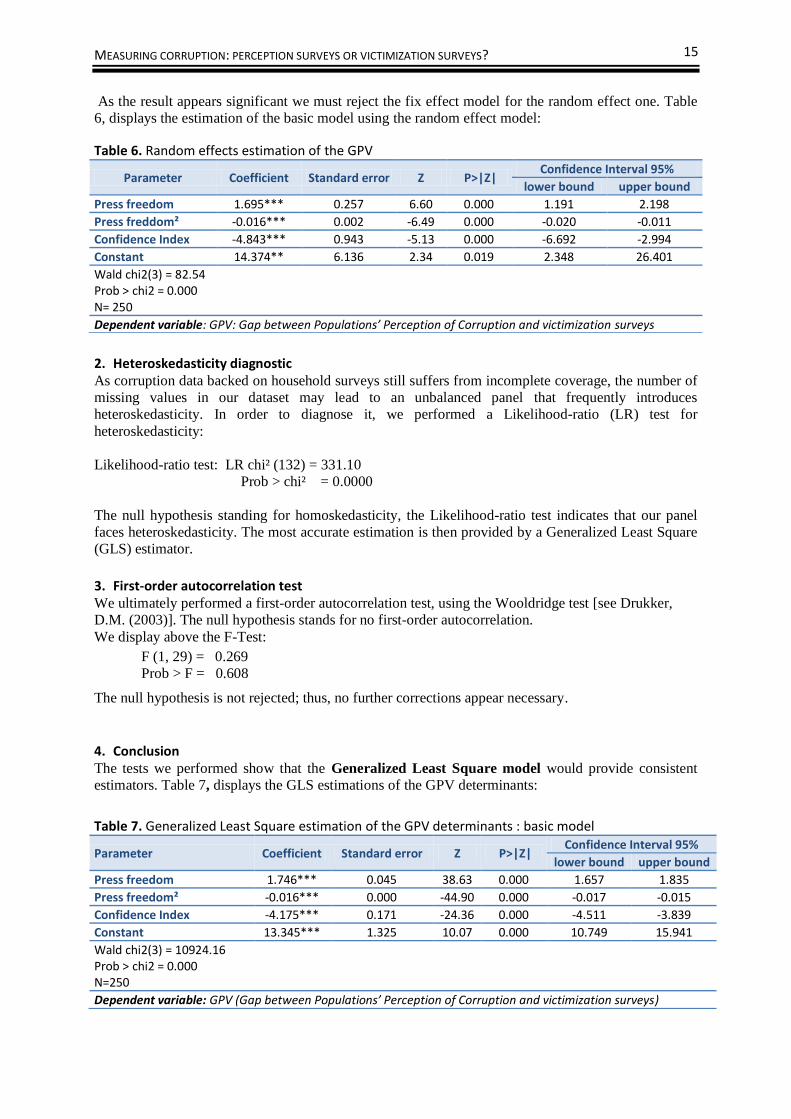
As the result appears significant we must reject the fix effect model for the random effect one. Table
6, displays the estimation of the basic model using the random effect model:
2. Heteroskedasticity diagnostic As corruption data backed on household surveys still suffers from incomplete coverage, the number of
missing values in our dataset may lead to an unbalanced panel that frequently introduces
heteroskedasticity. In order to diagnose it, we performed a Likelihood-ratio (LR) test for
heteroskedasticity:
Likelihood-ratio test: LR chi² (132) = 331.10
Prob > chi² = 0.0000
The null hypothesis standing for homoskedasticity, the Likelihood-ratio test indicates that our panel
faces heteroskedasticity. The most accurate estimation is then provided by a Generalized Least Square
(GLS) estimator.
3. First-order autocorrelation test We ultimately performed a first-order autocorrelation test, using the Wooldridge test [see Drukker,
D.M. (2003)]. The null hypothesis stands for no first-order autocorrelation.
We display above the F-Test:
F (1, 29) = 0.269
Prob > F = 0.608
The null hypothesis is not rejected; thus, no further corrections appear necessary.
4. Conclusion The tests we performed show that the Generalized Least Square model would provide consistent
estimators. Table 7, displays the GLS estimations of the GPV determinants:
Table 6. Random effects estimation of the GPV
Parameter Coefficient Standard error Z P>|Z| Confidence Interval 95%
lower bound upper bound
Press freedom 1.695*** 0.257 6.60 0.000 1.191 2.198
Press freddom² -0.016*** 0.002 -6.49 0.000 -0.020 -0.011
Confidence Index -4.843*** 0.943 -5.13 0.000 -6.692 -2.994
Constant 14.374** 6.136 2.34 0.019 2.348 26.401
Wald chi2(3) = 82.54 Prob > chi2 = 0.000 N= 250
Dependent variable: GPV: Gap between Populations’ Perception of Corruption and victimization surveys
Table 7. Generalized Least Square estimation of the GPV determinants : basic model
Parameter Coefficient Standard error Z P>|Z| Confidence Interval 95%
lower bound upper bound
Press freedom 1.746*** 0.045 38.63 0.000 1.657 1.835
Press freedom² -0.016*** 0.000 -44.90 0.000 -0.017 -0.015
Confidence Index -4.175*** 0.171 -24.36 0.000 -4.511 -3.839
Constant 13.345*** 1.325 10.07 0.000 10.749 15.941
Wald chi2(3) = 10924.16 Prob > chi2 = 0.000 N=250
Dependent variable: GPV (Gap between Populations’ Perception of Corruption and victimization surveys)

WORKING PAPER N° 167 16
Interpretation These results confirm that our predictors provide a strong overall explanatory power - Wald chi2(3) =
10924.16 - supported by 250 observations. The previously uncovered quadratic adjustment between
press freedom and the GPV is now established, so as the adverse correlation with confidence: the less
people trust administrations, the deeper the gap between perceptions and experienced corruption.
B. Introducing new controls While the previous explanatory variables confirm their role, we decided to test other controls. We
introduced objective variables expecting the following behaviors:
1. Logarithm of Growth National Income (GNI): we assume that overall, countries with higher
incomes benefit from more efficient institutions. Moreover, we suppose that wealthier countries
can afford providing descent salaries to their civil servants reducing corruption incentives.
We may this way observe both less perceived and experienced corruption decreasing the gap.
However, the resulting effect seems hard to evaluate and non-mechanical. Outliers profile already
illustrated very different configurations from Japan and Italy to Finland or Qatar.
2. The size of the population: the existing literature stresses that the size of the population matters.
As informed with table 4, perceptions and experienced corruption do not evolve together linearly.
We suggested that media and word-of-mouth significantly influence perceptions which could be in
the first place, the result of corruption exposures. A single corruption deed, flagged in the media
may influence a whole country, whatever the size of its population, explaining that perceptions are
not linearly dependant of experiences using data expressed in percentage of the population. Bigger
countries may thus display wider gap.
3. A binary variable reporting if presidential or legislative elections were organized the year of the
survey. Political scientists usually report high confidence in governments the year following
elections. Yet, we informed the case of Panama showing a confidence leap from 31 to 60 % the
year of election. However, we suppose that confidence grasp much of the effect of an election-year
variable. Furthermore, we were not able to discriminate efficiently by months; however, we
suppressed from our dataset elections that took place at the very end of the year, assuming that
Gallup surveys respondents had already been polled.
We coded the election-year variable this way: 1, elections were organized the year of the survey, 0
if not.
4. Unemployment rate: we assume that a high employment rate prevents populations from
expressing too much negative opinion about governments and institutions. Reversely, we suppose
that populations’ judgment regarding their country leadership may reveal much harsher in an
employment crisis context. Furthermore, literature tends to show that people perceptions tend to be
affected by their fairness feelings (see Douhou, S., Magnus, J.R., Van Soest, A., (2011)).
5. Finally and following the same reasoning, we introduced a subjective measure of well being (Life
satisfaction). Once again, we suppose that citizens are more “indulgent” with government and
administrations when they are satisfied with their lives. Thus, we expect the Gap to decrease with
life satisfaction enhancement.
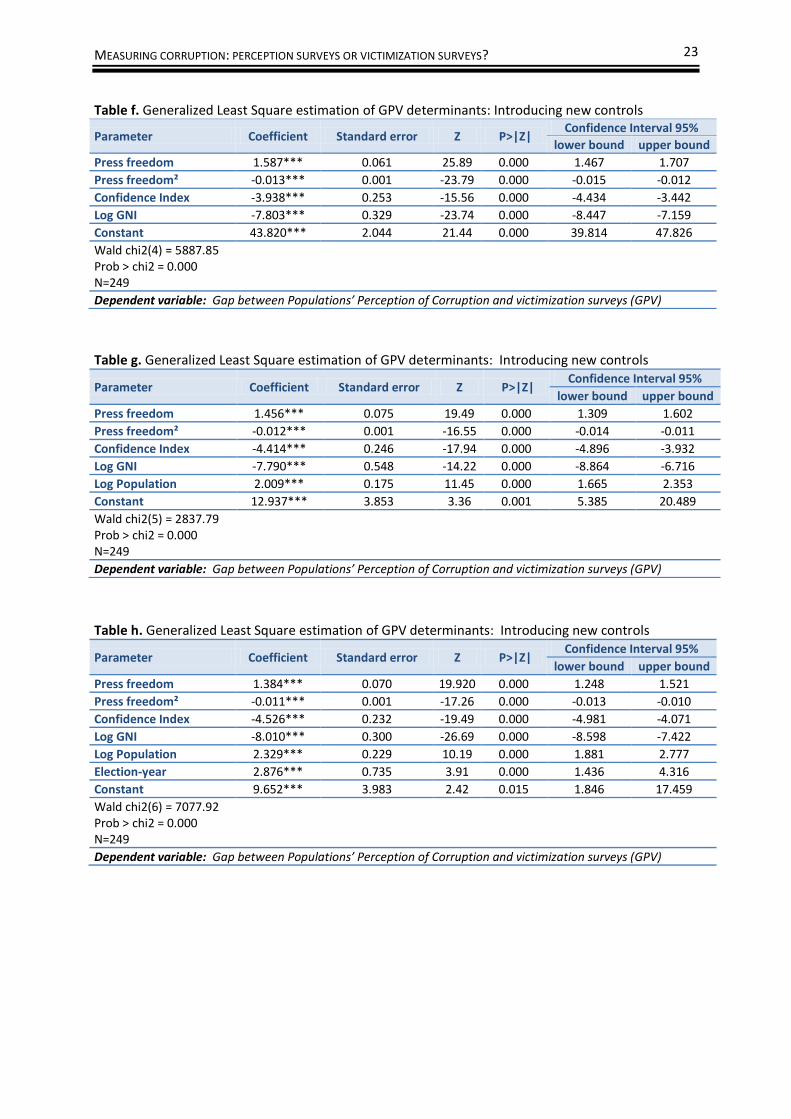
Table 8 gathers estimation results for five new models using these new control variables:
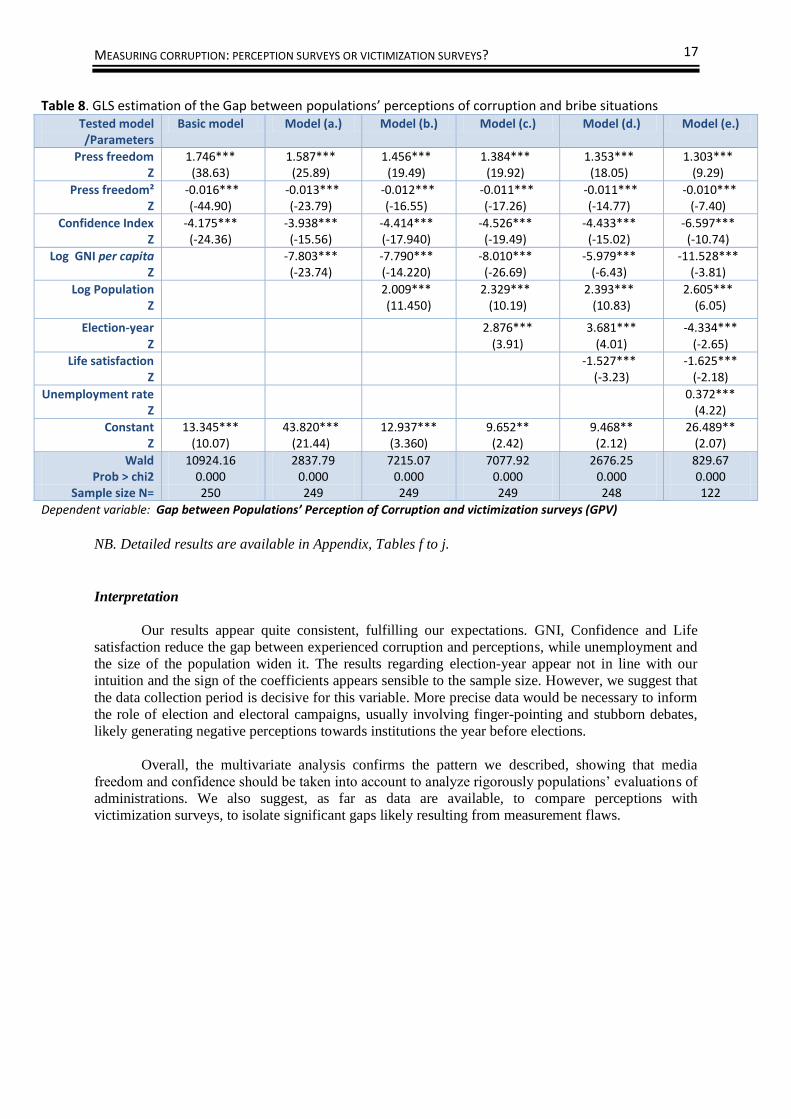
MEASURING CORRUPTION: PERCEPTION SURVEYS OR VICTIMIZATION SURVEYS? 17
NB. Detailed results are available in Appendix, Tables f to j.
Interpretation
Our results appear quite consistent, fulfilling our expectations. GNI, Confidence and Life
satisfaction reduce the gap between experienced corruption and perceptions, while unemployment and
the size of the population widen it. The results regarding election-year appear not in line with our
intuition and the sign of the coefficients appears sensible to the sample size. However, we suggest that
the data collection period is decisive for this variable. More precise data would be necessary to inform
the role of election and electoral campaigns, usually involving finger-pointing and stubborn debates,
likely generating negative perceptions towards institutions the year before elections.
Overall, the multivariate analysis confirms the pattern we described, showing that media
freedom and confidence should be taken into account to analyze rigorously populations’ evaluations of
administrations. We also suggest, as far as data are available, to compare perceptions with
victimization surveys, to isolate significant gaps likely resulting from measurement flaws.
Table 8. GLS estimation of the Gap between populations’ perceptions of corruption and bribe situations Tested model /Parameters
Basic model Model (a.) Model (b.) Model (c.) Model (d.) Model (e.)
Press freedom Z
1.746*** (38.63)
1.587*** (25.89)
1.456*** (19.49)
1.384*** (19.92)
1.353*** (18.05)
1.303*** (9.29)
Press freedom² Z
-0.016*** (-44.90)
-0.013*** (-23.79)
-0.012*** (-16.55)
-0.011*** (-17.26)
-0.011*** (-14.77)
-0.010*** (-7.40)
Confidence Index Z
-4.175*** (-24.36)
-3.938*** (-15.56)
-4.414*** (-17.940)
-4.526*** (-19.49)
-4.433*** (-15.02)
-6.597*** (-10.74)
Log GNI per capita Z
-7.803*** (-23.74)
-7.790*** (-14.220)
-8.010*** (-26.69)
-5.979*** (-6.43)
-11.528*** (-3.81)
Log Population Z
2.009*** (11.450)
2.329*** (10.19)
2.393*** (10.83)
2.605*** (6.05)
Election-year Z
2.876*** (3.91)
3.681*** (4.01)
-4.334*** (-2.65)
Life satisfaction Z
-1.527*** (-3.23)
-1.625*** (-2.18)
Unemployment rate Z
0.372*** (4.22)
Constant Z
13.345*** (10.07)
43.820*** (21.44)
12.937*** (3.360)
9.652** (2.42)
9.468** (2.12)
26.489** (2.07)
Wald 10924.16 2837.79 7215.07 7077.92 2676.25 829.67 Prob > chi2 0.000 0.000 0.000 0.000 0.000 0.000
Sample size N= 250 249 249 249 248 122
Dependent variable: Gap between Populations’ Perception of Corruption and victimization surveys (GPV)

WORKING PAPER N° 167 18
V. Concluding remarks
Using household surveys, we investigated the gap between perceived and experienced
corruption. We gathered data from the Gallup World Poll and Transparency International’s Global
Corruption Barometer, reporting actual corruption experiences, but also population’s perceptions of
corruption in several institutions (Police, Government, Public officials and Civil servants, Judiciary
system and Business).
Our first descriptive analysis showed that the gulf separating these two kinds of data can be
thorough and unevenly distributed among countries. We underlined the role of confidence and press
freedom in perception mechanisms.
Introducing further controls, we showed that populations might be more indulgent towards
administrations if people were satisfied with their lives, employed or living in wealthy countries.
We also suggested that confidence may introduce an endogeneity issue as distrust in institutions could
result from experienced corruption or induce harsh reporting in perception surveys. Nevertheless, we
highlighted that the confidence index we computed was much more correlated with perceptions than
with actual bribe situations. Further research remains however necessary to confirm these first
findings, although instrumental variables seem difficult to identify.
We ultimately uncovered a curvilinear relationship linking experiences to perceptions. We
suggested that word-of-mouth and “gossips” might magnify actual bribery experiences, driving a non-
linear perception swell.
Considering the results of the previous analyses, we would recommend data users to compare
systematically corruption perceptions to victimization surveys – if consistent across countries. We
suggest that the wider the gap between these two types of sources, the less reliable perception data. We
display in appendix - Table m - the top and bottom 30 countries in regard to our Gap index.
Nevertheless, we suggest controlling the GPV using press freedom evaluation since we previously
informed a media bias affecting corruption perceptions in autocracies.
This paper ultimately highlights the need for actionable reliability indices. We will soon propose one
in an upcoming research paper.
Comments and suggestion are much welcomed and may be addressed at: [email protected]
MEASURING CORRUPTION: PERCEPTION SURVEYS OR VICTIMIZATION SURVEYS? 19
VI. References Asas, Z., Faizur, R., 2008, “Corruption: Measuring the Unmeasurable”, MPRA Paper 13882,
University Library of Munich, Germany
Attila, G., 2008, “How do African populations perceive corruption: microeconomic evidence from
Afrobarometer data in twelve countries” CERDI-CNRS, University of Auvergne, Clermont 1
Arnt, C., Oman, C. (2006), Uses and Abuses of Governance Indicators, OECD
Brown, J., Orme, W., and Roca, T., 2010, “Fear and Loathing of the Corruption Perception Index”,
Université Bordeaux IV, GED/158, http://ged.u-bordeaux4.fr/ceddt158.pdf
Čábelková, I., 2001, “Perceptions of Corruption in Ukraine: Are They Correct?”, CERGE-EI Working
Paper No. 176
Cantril, H., 1965, The Pattern of Human Concerns. New Brunswick, N.J. Rutgers University Press
Bertrand, M., Mullainathan, S., 2001, “Do People Mean What They Say? Implications For Subjective
Survey Data”, Massachusetts Institute of Technology -Department of Economics, Working Paper
Series, Working Paper 01-04
Donchev, D., Ujhelyi, G., 2009, “What Do Corruption Indices Measure?”
Douhou, S., Magnus, J.R., Van Soest, A., 2011, “Peer Reporting And The Perception Of Fairness”,
Discussion paper No. 2011-068
Drukker, D. M. 2003, “Testing for serial correlation in linear panel-data models”, Stata Journal 3:
168–177.
Easterlin, R.A., 1974, “Does Economic Growth Improve the Human Lot? Some Empirical Evidence”.
Gujarati, D.N. 2002, Basic Econometrics, McGraw-Hill Higher Education, 4th edition
Green, W. E. 2002, Econometrics Analysis, Pearson Education, 5th edition
Jakob Svensson, J., Reinikka, R., 2004, “Using Micro Surveys to Measure and Explain Corruption”
Jensen, N.M., Rahman, A., 2011, “The Silence of Corruption, Identifying Underreporting of Business
Corruption through Randomized Response Techniques”, the World Bank Policy Research Working
Paper 5696
Knack, S. 2006. “Measuring Corruption in Eastern Europe and Central Asia: A Critique of the Cross-
Country Indicators.” World Bank Policy Research Working Paper 3968, July 2006.
Mocan, N., 2004, “What Determines Corruption? International Evidence from Micro Data”, National
Bureau of Economic Research Working Paper 10460, 2004.
Montinola, G., Jackman, R., 2002, “Sources of Corruption: A Cross-Country Study”, British
Journal of Political Science, Vol 32, pp. 147-170.
Moyal, P. Rossi, M., Rossi, T., 2004, “From the Perception of the Corruption to the Bribe”,
Documentos de trabajo No. 09/04
WORKING PAPER N° 167 20
Olken, B., 2006, “Corruption Perceptions vs. Corruption Reality”, NBER Working Paper Series,
Working Paper 12428, http://www.nber.org/papers/w12428
Razafindrakoto M., Roubaud F., 2006, “How far can we trust the experts’ opinion on corruption? An
experiment based on surveys in francophone Africa”, Transparency International, Pluto Press, London
/Ann Arbor, pp. 292-295.
Roca, T., 2010a, “Assessing Corruption: Expert Surveys versus Household Surveys, Filling the Gap”,
Université Bordeaux IV, GED/160. http://ged.u-bordeaux4.fr/ceddt160.pdf
Roca, T., Alidedeoglu, E., 2010 “Corruption Perceptions: the Trap of Democratization, a Panel Data
Analysis”, Université Bordeaux IV, GED/161. http://ged.u-bordeaux4.fr/ceddt161.pdf
Rose, R., Mishler, W., 2010, “Experience versus perception of corruption: Russia as a test case”,
Global Crime Vol. 11, No2, May 2010, 145-163
Treisman, D., “The Causes of Corruption: A Cross-National Study”, Journal of Public Economics 76
(2000), pp. 399-457.
Treisman, D., 2007, “What Have We Learned About the Causes of Corruption from Ten Years of
Cross-National Empirical Research?" Annual Review of Political Science
Weber Abramo, C., 2008, “How much do perceptions of corruption really tell us?” Economics, No
2008-3 February 12, 2008
Wooldridge, J. M. 2002, Econometric Analysis of Cross Section and Panel Data, Cambridge, MA:
MIT Press.
MEASURING CORRUPTION: PERCEPTION SURVEYS OR VICTIMIZATION SURVEYS? 21
VII. Appendix
Table a. Functional form investigation: freedom of press and Gap perception - victimization
Quadratic adjustment Coefficients
Variables
Freedom of Press 1.915***
t (9.279)
Freedom of Press2 -0.017***
t (-8.956)
R² 0.260 adjusted R² 0.254
Sample size (N) 250
Linear adjustment
Variable Freedom of Press 0.104**
t (2.196)
R² 0.019 adjusted R² 0.015
Sample size (N) 250 Dependant variable: Gap between Perception and Victimization (GPV)
Y= 0.104x + 47.82
Y= 1.92x – 0.02x² + 8.92
Figure a. Functional form investigation: GPV and Press freedom (Pooled dataset)
Qatar Saudi Arabia
Bahrain
Sweden
Syria
Denmark
Finland
Trinidad & Tobago
Panama
Japan
WORKING PAPER N° 167 22
Table b. Functional form investigation: corruption experience versus corruption perception
Linear adjustment Coefficients
Variables Population declaring victim of bribery 0.632***
t (6.056)
R² 0.128
adjusted R² 0.124 Sample size (N) 252
Logarithmic adjustment
Variable Log Population declaring victim of bribery 11.240***
t (8.410)
R² 0.221 adjusted R² 0.217
Sample size (N) 252 Dependant variable: Population Perception of Corruption
Table c. Aggregation confidence data: PCA significance test
KMO and Bartlett's Test
Kaiser-Meyer-Olkin Measure of Sampling Adequacy 0.822
Bartlett's Test of Sphericity
Approx. Chi-Square 834.777
df 6
Sig. .000
Table d. Aggregation confidence data: PCA summary
Total Variance Explained
Component Initial Eigenvalues Extraction Sums of Squared Loadings
Total % of Variance Cumulative % Total % of Variance Cumulative %
1 2.908 72.710 72.710 2.908 72.710 72.710
2 .482 12.060 84.770
3 .321 8.027 92.797
4 .288 7.203 100.000
Extraction Method: Principal Component Analysis
MEASURING CORRUPTION: PERCEPTION SURVEYS OR VICTIMIZATION SURVEYS? 23
Table f. Generalized Least Square estimation of GPV determinants: Introducing new controls
Parameter Coefficient Standard error Z P>|Z| Confidence Interval 95%
lower bound upper bound
Press freedom 1.587*** 0.061 25.89 0.000 1.467 1.707
Press freedom² -0.013*** 0.001 -23.79 0.000 -0.015 -0.012
Confidence Index -3.938*** 0.253 -15.56 0.000 -4.434 -3.442
Log GNI -7.803*** 0.329 -23.74 0.000 -8.447 -7.159
Constant 43.820*** 2.044 21.44 0.000 39.814 47.826
Wald chi2(4) = 5887.85 Prob > chi2 = 0.000 N=249
Dependent variable: Gap between Populations’ Perception of Corruption and victimization surveys (GPV)
Table g. Generalized Least Square estimation of GPV determinants: Introducing new controls
Parameter Coefficient Standard error Z P>|Z| Confidence Interval 95%
lower bound upper bound
Press freedom 1.456*** 0.075 19.49 0.000 1.309 1.602
Press freedom² -0.012*** 0.001 -16.55 0.000 -0.014 -0.011
Confidence Index -4.414*** 0.246 -17.94 0.000 -4.896 -3.932
Log GNI -7.790*** 0.548 -14.22 0.000 -8.864 -6.716
Log Population 2.009*** 0.175 11.45 0.000 1.665 2.353
Constant 12.937*** 3.853 3.36 0.001 5.385 20.489
Wald chi2(5) = 2837.79 Prob > chi2 = 0.000 N=249
Dependent variable: Gap between Populations’ Perception of Corruption and victimization surveys (GPV)
Table h. Generalized Least Square estimation of GPV determinants: Introducing new controls
Parameter Coefficient Standard error Z P>|Z| Confidence Interval 95%
lower bound upper bound
Press freedom 1.384*** 0.070 19.920 0.000 1.248 1.521
Press freedom² -0.011*** 0.001 -17.26 0.000 -0.013 -0.010
Confidence Index -4.526*** 0.232 -19.49 0.000 -4.981 -4.071
Log GNI -8.010*** 0.300 -26.69 0.000 -8.598 -7.422
Log Population 2.329*** 0.229 10.19 0.000 1.881 2.777
Election-year 2.876*** 0.735 3.91 0.000 1.436 4.316
Constant 9.652*** 3.983 2.42 0.015 1.846 17.459
Wald chi2(6) = 7077.92 Prob > chi2 = 0.000 N=249
Dependent variable: Gap between Populations’ Perception of Corruption and victimization surveys (GPV)
WORKING PAPER N° 167 24
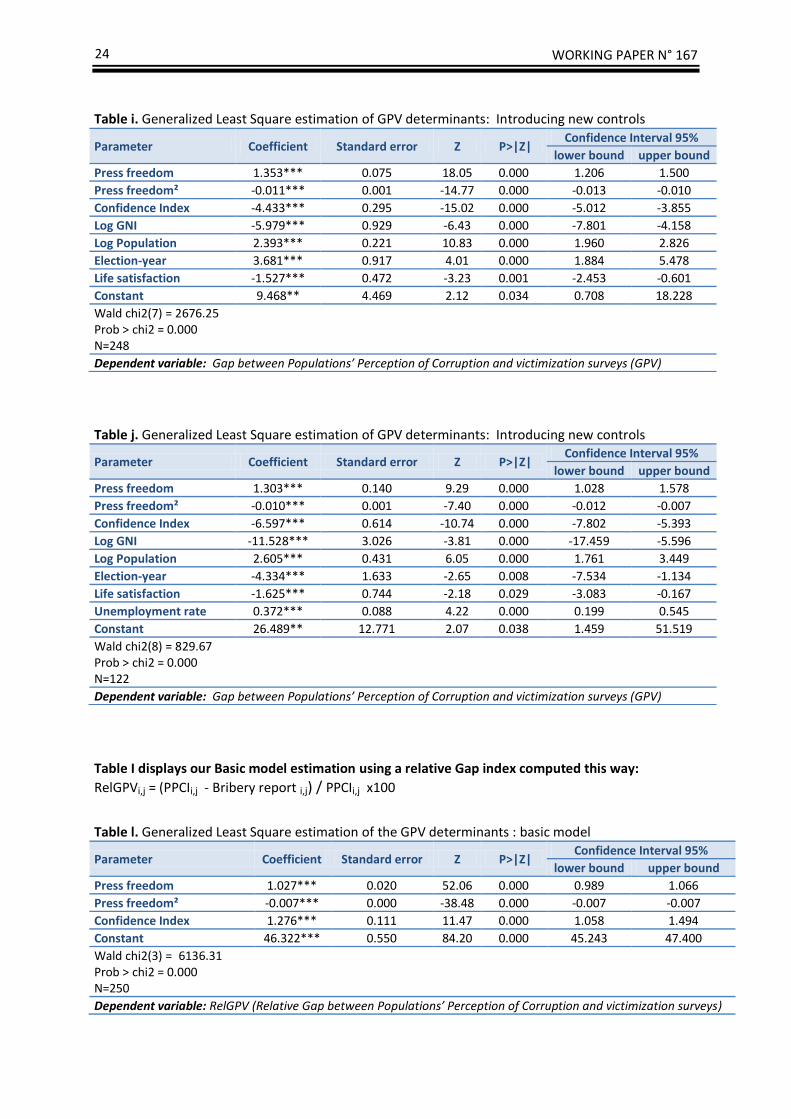
Table I displays our Basic model estimation using a relative Gap index computed this way:
RelGPVi,j = (PPCIi,j - Bribery report i,j) / PPCIi,j x100
Table i. Generalized Least Square estimation of GPV determinants: Introducing new controls
Parameter Coefficient Standard error Z P>|Z| Confidence Interval 95%
lower bound upper bound
Press freedom 1.353*** 0.075 18.05 0.000 1.206 1.500
Press freedom² -0.011*** 0.001 -14.77 0.000 -0.013 -0.010
Confidence Index -4.433*** 0.295 -15.02 0.000 -5.012 -3.855
Log GNI -5.979*** 0.929 -6.43 0.000 -7.801 -4.158
Log Population 2.393*** 0.221 10.83 0.000 1.960 2.826
Election-year 3.681*** 0.917 4.01 0.000 1.884 5.478
Life satisfaction -1.527*** 0.472 -3.23 0.001 -2.453 -0.601
Constant 9.468** 4.469 2.12 0.034 0.708 18.228
Wald chi2(7) = 2676.25 Prob > chi2 = 0.000 N=248
Dependent variable: Gap between Populations’ Perception of Corruption and victimization surveys (GPV)
Table j. Generalized Least Square estimation of GPV determinants: Introducing new controls
Parameter Coefficient Standard error Z P>|Z| Confidence Interval 95%
lower bound upper bound
Press freedom 1.303*** 0.140 9.29 0.000 1.028 1.578
Press freedom² -0.010*** 0.001 -7.40 0.000 -0.012 -0.007
Confidence Index -6.597*** 0.614 -10.74 0.000 -7.802 -5.393
Log GNI -11.528*** 3.026 -3.81 0.000 -17.459 -5.596
Log Population 2.605*** 0.431 6.05 0.000 1.761 3.449
Election-year -4.334*** 1.633 -2.65 0.008 -7.534 -1.134
Life satisfaction -1.625*** 0.744 -2.18 0.029 -3.083 -0.167
Unemployment rate 0.372*** 0.088 4.22 0.000 0.199 0.545
Constant 26.489** 12.771 2.07 0.038 1.459 51.519
Wald chi2(8) = 829.67 Prob > chi2 = 0.000 N=122
Dependent variable: Gap between Populations’ Perception of Corruption and victimization surveys (GPV)
Table l. Generalized Least Square estimation of the GPV determinants : basic model
Parameter Coefficient Standard error Z P>|Z| Confidence Interval 95%
lower bound upper bound
Press freedom 1.027*** 0.020 52.06 0.000 0.989 1.066
Press freedom² -0.007*** 0.000 -38.48 0.000 -0.007 -0.007
Confidence Index 1.276*** 0.111 11.47 0.000 1.058 1.494
Constant 46.322*** 0.550 84.20 0.000 45.243 47.400
Wald chi2(3) = 6136.31 Prob > chi2 = 0.000 N=250
Dependent variable: RelGPV (Relative Gap between Populations’ Perception of Corruption and victimization surveys)
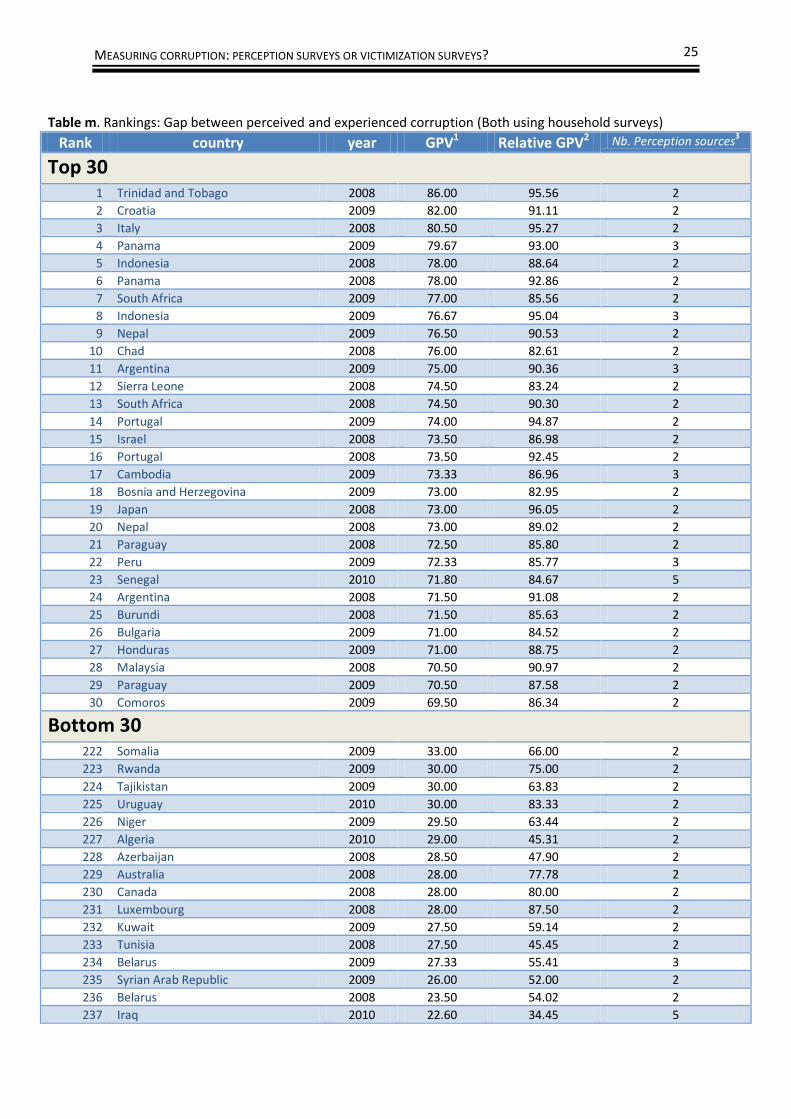
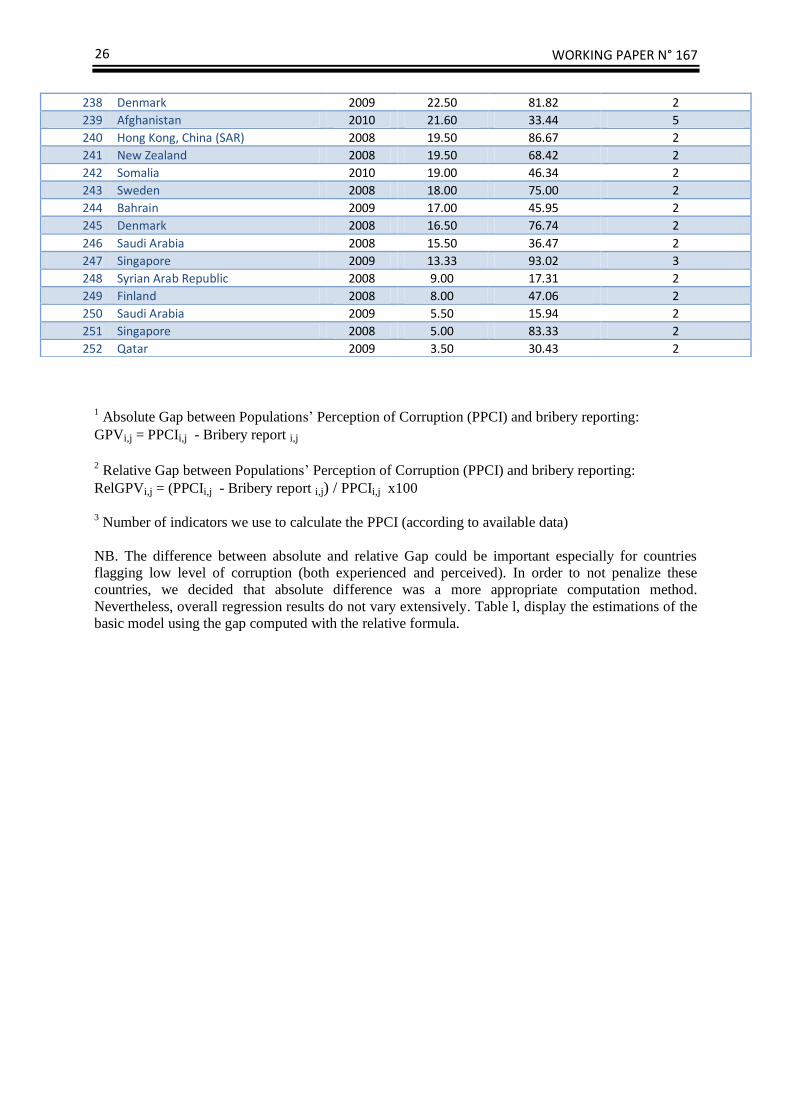
MEASURING CORRUPTION: PERCEPTION SURVEYS OR VICTIMIZATION SURVEYS? 25
Table m. Rankings: Gap between perceived and experienced corruption (Both using household surveys)
Rank country year GPV1 Relative GPV2 Nb. Perception sources3
Top 30
1 Trinidad and Tobago 2008 86.00 95.56 2
2 Croatia 2009 82.00 91.11 2
3 Italy 2008 80.50 95.27 2
4 Panama 2009 79.67 93.00 3
5 Indonesia 2008 78.00 88.64 2
6 Panama 2008 78.00 92.86 2
7 South Africa 2009 77.00 85.56 2
8 Indonesia 2009 76.67 95.04 3
9 Nepal 2009 76.50 90.53 2
10 Chad 2008 76.00 82.61 2
11 Argentina 2009 75.00 90.36 3
12 Sierra Leone 2008 74.50 83.24 2
13 South Africa 2008 74.50 90.30 2
14 Portugal 2009 74.00 94.87 2
15 Israel 2008 73.50 86.98 2
16 Portugal 2008 73.50 92.45 2
17 Cambodia 2009 73.33 86.96 3
18 Bosnia and Herzegovina 2009 73.00 82.95 2
19 Japan 2008 73.00 96.05 2
20 Nepal 2008 73.00 89.02 2
21 Paraguay 2008 72.50 85.80 2
22 Peru 2009 72.33 85.77 3
23 Senegal 2010 71.80 84.67 5
24 Argentina 2008 71.50 91.08 2
25 Burundi 2008 71.50 85.63 2
26 Bulgaria 2009 71.00 84.52 2
27 Honduras 2009 71.00 88.75 2
28 Malaysia 2008 70.50 90.97 2
29 Paraguay 2009 70.50 87.58 2
30 Comoros 2009 69.50 86.34 2
Bottom 30 222 Somalia 2009 33.00 66.00 2
223 Rwanda 2009 30.00 75.00 2
224 Tajikistan 2009 30.00 63.83 2
225 Uruguay 2010 30.00 83.33 2
226 Niger 2009 29.50 63.44 2
227 Algeria 2010 29.00 45.31 2
228 Azerbaijan 2008 28.50 47.90 2
229 Australia 2008 28.00 77.78 2
230 Canada 2008 28.00 80.00 2
231 Luxembourg 2008 28.00 87.50 2
232 Kuwait 2009 27.50 59.14 2
233 Tunisia 2008 27.50 45.45 2
234 Belarus 2009 27.33 55.41 3
235 Syrian Arab Republic 2009 26.00 52.00 2
236 Belarus 2008 23.50 54.02 2
237 Iraq 2010 22.60 34.45 5
WORKING PAPER N° 167 26
1 Absolute Gap between Populations’ Perception of Corruption (PPCI) and bribery reporting:
GPVi,j = PPCIi,j - Bribery report i,j
2 Relative Gap between Populations’ Perception of Corruption (PPCI) and bribery reporting:
RelGPVi,j = (PPCIi,j - Bribery report i,j) / PPCIi,j x100 3 Number of indicators we use to calculate the PPCI (according to available data)
NB. The difference between absolute and relative Gap could be important especially for countries
flagging low level of corruption (both experienced and perceived). In order to not penalize these
countries, we decided that absolute difference was a more appropriate computation method.
Nevertheless, overall regression results do not vary extensively. Table l, display the estimations of the
basic model using the gap computed with the relative formula.
238 Denmark 2009 22.50 81.82 2
239 Afghanistan 2010 21.60 33.44 5
240 Hong Kong, China (SAR) 2008 19.50 86.67 2
241 New Zealand 2008 19.50 68.42 2
242 Somalia 2010 19.00 46.34 2
243 Sweden 2008 18.00 75.00 2
244 Bahrain 2009 17.00 45.95 2
245 Denmark 2008 16.50 76.74 2
246 Saudi Arabia 2008 15.50 36.47 2
247 Singapore 2009 13.33 93.02 3
248 Syrian Arab Republic 2008 9.00 17.31 2
249 Finland 2008 8.00 47.06 2
250 Saudi Arabia 2009 5.50 15.94 2
251 Singapore 2008 5.00 83.33 2
252 Qatar 2009 3.50 30.43 2