mecanismos de regulaciÓn de la glucolisis en neuronas...
TRANSCRIPT

MECANISMOS DE REGULACIÓN
DE LA GLUCOLISIS EN NEURONAS Y SU FUNCIÓN EN
SUPERVIVENCIA CELULAR
PATRICIA RODRÍGUEZ RODRÍGUEZ Salamanca, 2013
Directores: Prof. Dr. D. Juan Pedro Bolaños Hernández
Profª. Dra. Dª. Ángeles Almeida Parra


Juan Pedro Bolaños Hernández, Catedrático de Bioquímica y
Biología Molecular de la Universidad de Salamanca, y Ángeles
Almeida Parra, Investigadora del Instituto de Investigación
Biomédica de Salamanca y Profesora Asociada del Departamento de
Bioquímica y Biología Molecular de la Universidad de Salamanca.
AUTORIZAN:
La presentación de la Tesis Doctoral titulada “Mecanismos de
regulación de la glucolisis en neuronas y su función en
supervivencia celular”, que ha sido realizada bajo su dirección por
la Licenciada en Farmacia y Bioquímica Dña. Patricia Rodríguez
Rodríguez, en el Departamento de Bioquímica y Biología Molecular
y en el Instituto de Biología Funcional y Genómica, de la Universidad
de Salamanca. En nuestra opinión, reúne todos los requisitos
científicos y formales para ser defendida y optar al Título de Doctor
Europaeus.
Salamanca, a 17 de Junio de 2013
Fdo.: Juan Pedro Bolaños Hernández Fdo.: Ángeles Almeida Parra


INDEX
INDEX
1. INTRODUCTION ....................................................................................................... 1
1. GLUCOSE METABOLISM IN THE CENTRAL NERVOUS SYSTEM ..................................... 3
1.1. GLUCOSE TRANSPORTERS ......................................................................................................... 4
1.2. GLUCOSE METABOLIC PATHWAYS ............................................................................................. 5
1.3. LACTATE CONSUMPTION IN NEURONS AND THE ASTROCYTE-NEURON LACTATE
SHUTTLE HYPOTHESIS. ..................................................................................................................... 15
1.4. REACTIVE OXYGEN SPECIES (ROS) GENERATION AND DETOXIFICATION ......................... 17
2. GLUTAMATERGIC NEUROTRANSMISSION ...................................................................... 20
2.1. GLUTAMATE ................................................................................................................................. 20
2.2. GLUTAMATE RECEPTORS .......................................................................................................... 20
2.3. GLUTAMATE TRANSPORTERS ................................................................................................... 23
2.4. GLUCOSE METABOLISM IN GLUTAMATERGIC NEUROTRANSMISSION ................................ 24
2.5. EXCITOTOXICITY ......................................................................................................................... 26
2. HYPOTHESIS AND OBJECTIVES ......................................................................... 31
3. MATERIALS AND METHODS ................................................................................ 35
1. PLASMID CONSTRUCTIONS, AMPLIFICATION AND PURIFICATION ............................. 37
1.1. pEGFP-C1-TIGAR PLASMID CONSTRUCTION ........................................................................... 37
1.2. G6PD, PFKFB3 and mutPFKFB3 PLASMID CONSTRUCTIONS .................................................. 38
1.3. BACTERIAL TRANSFORMATION AND PLASMIDS PURIFICATION ........................................... 39
2. “SMALL INTERFERING RNA” (SIRNA) DESIGN ................................................................ 39
3. ANIMALS. .............................................................................................................................. 40
4. CELL CULTURE .................................................................................................................... 41
4.1. CORTICAL NEURONS IN PRIMARY CULTURE........................................................................... 41
4.2. ASTROCYTES IN PRIMARY CULTURE ....................................................................................... 42
4.3. HEK-293T ...................................................................................................................................... 42
5. CELL TREATMENTS ............................................................................................................. 43
5.1 CELL TRANSFECTIONS ................................................................................................................ 43
5.2 NMDA RECEPTORS STIMULATION ............................................................................................. 43
5.3 INHIBITION OF PPP ACTIVITY AND MITOCHONDRIAL PYRUVATE UPTAKE. .......................... 44
6. DETERMINATION OF Ca2+ UPTAKE ................................................................................... 44
7. ELECTROPHORESIS AND PROTEIN IMMUNODETECTION (WESTERN BLOT) ............ 45

INDEX
8. PROTEIN IMMUNOPRECIPITATION. .................................................................................. 46
9. REVERSE TRANSCRIPTION-PCR (RT-PCR). .................................................................... 47
10. FLOW CYTOMETRIC ANALYSIS OF APOPTOTIC CELL DEATH .................................. 48
11. DETECTION OF REACTIVE OXYGEN SPECIES (ROS) ................................................... 49
12. DETERMINATION OF METABOLITES .............................................................................. 49
12.1. D-GLUCOSE ................................................................................................................................ 49
12.2. L-LACTATE .................................................................................................................................. 50
12.3. GLUCOSE-6-PHOSPHATE (G6P) ............................................................................................... 50
12.4. GLUTATHIONE ............................................................................................................................ 51
12.5. FRUCTOSE-2,6-BISPHOSPHATE............................................................................................... 52
13. PGI ACTIVITY DETERMINATION ...................................................................................... 53
14. PFK-1 ACTIVITY DETERMINATION .................................................................................. 53
15. GLYCOLYTIC FLUX ASSESMENT .................................................................................... 54
16. PENTOSE-PHOSPHATE PATHWAY (PPP) FLUX MEASUREMENTS ............................ 55
17. IMMUNOCYTOCHEMISTRY ............................................................................................... 59
18. CONFOCAL MICROSCOPY OF TRANSFECTED CELLS. ............................................... 59
19. STATISTICAL ANALYSIS................................................................................................... 59
4. RESULTS ............................................................................................................... 61
1. GLYCOLYTIC FLUX INCREASES BY INHIBITING PENTOSE-PHOSPHATE PATHWAY (PPP) OR MITOCHONDRIAL PYRUVATE UPTAKE IN NEURONS. ...................................... 63
2. THE RATE OF GLUCOSE OXIDIZED THROUGH THE PPP IS INHIBITED BY DHEA AND NOT BY HCN. ............................................................................................................................ 64
3. PHOSPHOGLUCOSE ISOMERASE (PGI) IS A HIGHLY ACTIVE ENZYME IN NEURONS. ................................................................................................................................................... 66
4. KNOCK-DOWN OF PGI INCREASES PPP ACTIVITY ........................................................ 67
5. EFFECT OF DHEA AND HCN ON GLUCOSE-6-PHOSPHATE CONCENTRATION ......... 69
6. EFFECT OF DHEA AND HCN ON EXTRACELLULAR AND INTRACELLULAR LACTATE CONCENTRATIONS ................................................................................................................. 69
7. CORTICAL PRIMARY NEURONS RESPOND TO GLUTAMATE RECEPTORS ACTIVATION BY INCREASING INTRACELLULAR Ca2+ LEVELS. ....................................... 71
8. NMDAR STIMULATION PROMOTES PROTEIN STABILIZATION OF THE GLYCOLYTIC-PROMOTING ENZYME PFKFB3 IN NEURONS. ..................................................................... 73

INDEX
9. NMDAR STIMULATION DOES NOT ALTER THE PFKFB3 mRNA LEVELS IN NEURONS. .................................................................................................................................................... 74
10. NMDAR STIMULATION TRIGGERS NUCLEUS-TO-CYTOSOL PFKFB3 TRANSLOCATION..................................................................................................................... 75
11. NMDAR STIMULATION INCREASES THE RATE OF GLYCOLYSIS AND DECREASES THE RATE OF PPP THROUGH PFKFB3. ................................................................................ 78
12. NMDAR STIMULATION LEADS TO IMPAIRMENT OF GLUTATHIONE REGENERATION THAT IS MEDIATED BY PFKFB3 STABILIZATION. ............................................................... 80
13. THE PPP TO GLYCOLYSIS SHIFT CAUSED BY NMDAR STIMULATION TRIGGERS OXIDATIVE STRESS ................................................................................................................. 81
14. NMDAR ACTIVATION TRIGGERS APOPTOTIC DEATH BY SWITCHING PPP TO GLYCOLYSIS. ............................................................................................................................ 83
15. EXPRESSION OF A MUTANT FORM OF PFKFB3 INSENSITIVE TO APC/C-Cdh1 MIMICS NMDAR AT CAUSING OXIDATIVE STRESS AND NEURONAL DEATH. ................ 84
16. THE FRUCTOSE-2,6-BISPHOSPHATASE TIGAR PROTEIN IS EXPRESSED IN NEURONS .................................................................................................................................. 85
17. ASSESSMENT OF APOPTOSIS AND SUPEROXIDE LEVELS IN PRIMARY NEURONS FROM TIGAR KNOCKOUT MICE .......................................................................... 86
18. OVER-EXPRESSION OF THE FULL-LENGTH TIGAR cDNA DECREASES FRUCTOSE-2,6-BISPHOSPHATE CONCENTRATION ........................................................... 87
19. TIGAR PREVENTS PFKFB3-INDUCED INCREASE IN MITOCHONDRIAL SUPEROXIDE AND NEURONAL DEATH ......................................................................................................... 88
20. KNOCKDOWN OF TIGAR IS NOT SUFFICIENT TO INCREASE THE RATE OF GLYCOLYSIS IN PRIMARY NEURONS ................................................................................... 89
21. KNOCKDOWN OF TIGAR INCREASES APOPTOTIC NEURONAL DEATH WITHOUT INCREASING SUPEROXIDE .................................................................................................... 90
22. CONFOCAL ANALYSIS REVEALS NUCLEAR LOCALIZATION OF TIGAR IN NEURONS, BUT NOT IN ASTROCYTES ................................................................................. 91
5. DISCUSSION .......................................................................................................... 93
1. GLYCOLYSIS AND PPP ARE DYNAMIC PROCESSES IN INTACT NEURONS ............... 95
2. GLYCOLYSIS AND PPP CAN BE MODULATED BY ENDOGENOUS STIMULI WITH PATHOPHYSIOLOGICAL CONSEQUENCES ......................................................................... 98
3. TIGAR: A NEW PLAYER IN NEURONAL GLUCOSE METABOLISM AND BEYOND ....... 99
6. CONCLUSIONS AND FUTURE PERSPECTIVES ................................................ 101

INDEX
7. RESÚMEN EN ESPAÑOL .................................................................................... 105
INTRODUCCIÓN ..................................................................................................................... 107
1. Metabolismo glucídico en el cerebro. .............................................................................................. 107
2. Neurotransmisión glutamatérgica y excitotoxicidad ......................................................................... 109
HIPÓTESIS Y OBJETIVOS ..................................................................................................... 110
RESULTADOS Y DISCUSIÓN ................................................................................................ 111
1. La actividad glucolítica en neuronas aumenta tanto al inhibir la vía de las pentosas fosfato como la
captación mitocondrial de piruvato. ..................................................................................................... 111
2. La velocidad de oxidación de glucosa por la PPP se inhibe con DHEA. ......................................... 112
3. La fosfoglucosa isomerasa (PGI) presenta una actividad elevada en neuronas. ............................ 113
4. El silenciamiento de la PGI conlleva un incremento en la actividad de la PPP. .............................. 114
5. Efecto de DHEA e HCN sobre la concentración de G6P................................................................. 115
6. Las neuronas corticales en cultivo primario responden a la activación de los receptores de glutamato
incrementando los niveles de Ca2+ intracelular. .................................................................................. 116
7. La activación de receptores NMDA promueve la estabilización de la enzima pro-glucolítica PFKFB3
en neuronas. ....................................................................................................................................... 117
8. La estimulación de receptores NMDA produce la translocación del núcleo al citosol de la PFKFB3.
............................................................................................................................................................ 119
9. La estabilización de PFKFB3 mediada por receptores NMDA aumenta la actividad glucolítica y
disminuye la de PPP ........................................................................................................................... 121
10. La estimulación de receptores NMDA produce un defecto en la regeneración de glutatión mediada
por la estabilización de PFKFB3 ......................................................................................................... 123
11. La desviación del metabolismo de la glucosa de la PPP a glucolisis como consecuencia de la
estimulación de receptores NMDA produce estrés oxidativo .............................................................. 124
12. La activación de receptores NMDA induce muerte neuronal por apoptosis como consecuencia de
la desviación del metabolismo glucídico de la PPP a glucolisis .......................................................... 126
13. La expresión de una forma mutada de PFKFB3 no detectable por APC/C-Cdh1 produce un efecto
similar a la activación de receptores NMDA ........................................................................................ 127
14. La proteína TIGAR, con función fructosa-2,6-bisfosfatasa, se encuentra expresada en neuronas
............................................................................................................................................................ 129
15. Determinación de apoptosis y niveles de superóxido en neuronas procedentes de ratones KO
de TIGAR ............................................................................................................................................ 129
16. TIGAR previene el incremento en superóxido mitocondrial y en apoptosis mediado por PFKFB3.
............................................................................................................................................................ 130
17. El silenciamiento de TIGAR no es suficiente para incrementar la velocidad glucolítica en neuronas
primarias .............................................................................................................................................. 131

INDEX
18. El silenciamiento de TIGAR en neuronas incrementa la muerte por apoptosis sin afectar a los
niveles de superóxido.......................................................................................................................... 132
19. TIGAR presenta una localización nuclear en neuronas ................................................................ 133
CONCLUSIONES ..................................................................................................................... 135
8. REFERENCES ...................................................................................................... 137


ABBREVIATIONS
ABBREVIATIONS AD: Alzheimer´s disease
ADP: Adenosine diphosphate
AMP: Adenosine monophosphate
AMPA: 2-amino-3-(3-hydroxy-5-methyl-isoxazol-4-yl)propanoic acid
APC/C: Anaphase-promoting complex/cyclosome
ATP: Adenosine triphosphate
BCA: Bicinchoninic acid (assay)
BSA: Bovine serum albumin
cDNA: Complementary DNA
Cdk 5: Cyclin-dependent kinase 5
CMV: Cytomegalovirus
DAPI: 4,6-diamidine-2-phenilindol chloridrate
DMEM: Dulbecco’s modified eagle medium
DMSO: Dimethyl sulfoxide
DNA: Deoxyribonucleic acid
dNTPs: Deoxyribonucleotides
EDTA: Ethylenediamine tetraacetic acid
eGFP: Enhanced green fluorescent protein
EGTA: Ethylene glycol tetraacetic acid
E4P: Erythrose-4-phosphate
F2,6P2: Fructose-2,6-bisphosphate
F1,6P2: Fructose-1,6-bisphosphate
G6P: Glucose-6-phosphate
G6PD: Glucose-6-phosphate dehydrogenase
GAP: Glyceraldehyde-3-phosphate
GAPDH: Glyceraldehyde-3-phosphate dehydrogenase
GPx: Glutathione peroxidase
GRx: Glutahione reductase
GSH: Reduced glutathione, γ-L-glutamyl-L-cysteinyl-glycine
GSR: Glutathione reductase GSSG: Glutathione disulfide, oxidized glutathione
GSx: Total glutathione
HEPES: 4-(2-hydroxyethyl)-1-piperazineethanesulfonic acid

ABBREVIATIONS
H2O2: Hydrogen peroxide
HK: Hexokinase
HIF1: Hypoxia inducible factor 1
Km: Michaelis-Menten constant
LDH: Lactate dehydrogenase
MPEP: 2-methyl-6-(phenylethynyl)pyridine
MPTP: 1-methyl-4-phenyl-1,2,3,6-tetrahydropyridine
mRNA: Messenger RNA
NAD+: Nicotinamide adenine dinucleotide (oxidized). NADH(H+): reduced form
NADP+: Nicotinamide adenine dinucleotide phosphate (oxidized). NADPH(H+): reduced
form
NO: Nitric oxide
NOS: Nitric oxide synthase
NMDA: N-methyl-D-aspartate
O2-: Superoxide anion
OH-: Hydroxyl radical
ONOO-: Peroxynitrite
PB: Phosphate buffer
PBS: Phosphate buffered saline
PCR: Polymerase chain reaction
PD: Parkinson´s disease
PEP: Phosphoenol pyruvate
PFK-1: 6-Phosphofructo-1-kinase
PFK-2: Phosphofructo kinase 2
PFKFB: 6-phosphofructo-2-kinase/fructose-2,6-bisphosphatase
PFKFB3: 6-phosphofructo-2-kinase/fructose-2,6-bisphosphatase-3
PGI: Phosphoglucose isomerase
PKA: Protein kinase A
PKC: Protein Kinase C
PPP: Pentose-phosphate-pathway
ROS: Reactive oxygen species
R5P: Ribose-5-phosphate
Ru5P: Ribulose-5-phosphate
S.E.M.: Standard error of the mean
SDS: Sodium dodecyl sulfate
SDS-PAGE: Sodium dodecyl sulfate-polyacrylamide gel electrophoresis
siRNA: Small interfering RNA

ABBREVIATIONS
SOD: Superoxide dismutase
S7P: Sedoheptulose-7-phosphate
TIGAR: TP53-induced glycolysis and apoptosis regulator
TCA: Tricarboxylic acid cycle
X5P: Xilulose-5-phosphate
6-NBDG: 6-(N-(7-nitrobenz-2-oxa-1,3-diazol-4-yl) amino)-2-deoxyglucose
1,3-bPG: 1,3-Bisphosphoglycerate
3-PG: 3-Phosphoglycerate
2-PG: 2-Phosphoglycerate


1. INTRODUCTION


INTRODUCTION
3
1. GLUCOSE METABOLISM IN THE CENTRAL NERVOUS SYSTEM
The brain only represents ~2% of the total body weight but it accounts for more
than a 20% of the body consumption of O2 and glucose (Sokoloff et al. 1950).
Whilst the adult brain in mammals is highly dependent on glucose as an energetic
substrate, ketone bodies (3-hydroxybutyrate and acetoacetate) can be considered
an alternative brain fuel during early postnatal life. Thus, ketone bodies synthesis
by astrocytes plays an essential role in neuronal survival in pathological conditions
where glucose delivery to the brain is decreased, (Guzman & Blazquez 2004,
Blazquez et al. 1999). Despite glucose may be used for oxidative metabolism to
produce ATP, it is also important as a source of carbons for fatty acid, cholesterol,
neurotransmitters, aminoacids, glycerol-3-phosphate and, in astrocytes, glycogen
synthesis (Cataldo & Broadwell 1986). Most part of the energy generated by
glucose metabolism is thought to be used to fulfill the energetic needs for
neurotransmission (Attwell & Laughlin 2001, Ames 2000).
A correct glucose brain metabolism is essential for survival, and there have been a
large number of reports documenting alterations in glucose metabolism in patients
with neurodegenerative diseases. Decreased cerebral glucose metabolism
ascribed to diminished glucose transport and reduced glucose phosphorylation has
been described in patients with Alzheimer’s disease (AD) (Piert et al. 1996). In
addition, several studies have documented “diabetes like” alterations in AD
patients, including metabolic alterations associated to insulin resistance that can
contribute to the development of AD (Mosconi et al. 2008, Cunnane et al. 2011,
Carvalho et al. 2012, Schioth et al. 2012). Brain hypometabolism has also been
suggested in the etiology of Huntington´s disease, as glucose consumption is
reduced in the presymptomatic stages of the disease (Ciarmiello et al. 2006).
Studies of Parkinson’s disease (PD) patients have also provided evidence for
alterations similar to those in AD that include abnormal glucose tolerance and
increased insulin resistance (Aviles-Olmos et al. 2013).

INTRODUCTION
4
1.1. GLUCOSE TRANSPORTERS
Cells take up glucose by transporters located in the plasma membrane. There are
two different classes of glucose transporters with different kinetic properties: GLUT
(GLUT1-GLUT12) that are sodium-independent, and SGLT (SGLT1-SGLT6) that
are sodium-dependent (see Table 1). Cells express different transporters
depending on their specific metabolic requirements (Shah et al. 2012). The main
isoforms expressed in brain cells are GLUT1, GLUT3 and GLUT5 (See table 1).
GLUT3 is present predominantly in neurons and GLUT5 is specific of microglia.
GLUT1, which is detected in the blood-brain barrier and astrocytes, is the only
vehicle responsible for the transport of glucose into the brain. A defect in glucose
transport into the brain, known as GLUT1 deficiency syndrome, leads to
neurological disorders associated with epilepsy and delays in mental and motor
development in children (Klepper & Voit 2002).
TRANSPORTER EXPRESSION IN BRAIN SUBSTRATES/TRANSPORTS
GLUT 1 Brain endothelial and epithelial-like
brain barriers, glial cells.
Glucose, galactose, mannose,
glucosamine, ascorbic acid
GLUT 2 Astrocytes Mannose, galactose, fructose,
glucose, glucosamine
GLUT 3 Neurons, brain endothelial cells Glucose, galactose, mannose,
xylose, dehydroascorbic acid
GLUT 4 Hippocampal and cerebellar
neurons
Glucose, dehydroascorbic acid,
glucosamine
GLUT 5 Brain microglia Fructose, Glucose
GLUT 6 Brain Glucose
GLUT 8 Neurons Glucose
SGLT 1 Cortical, pyramidal and purkinje
neuronal cells >Glucose, ≥ galactose
SGLT2 Brain Glucose, galactose
SGLT3 Brain Glucose, Na+ (H+)
SGLT4 Brain Glucose, mannose, fructose
SGLT6 Neurons Myo-inositol, glucose
Table 1: Glucose transporters in brain. Adapted from Shah et al 2012.

INTRODUCTION
5
When glucose enters the cell it is phosphorylated by hexokinase; the resulting
product, glucose-6-phosphate (G6P), is retained in the cytoplasm to be
metabolized by the pentose phosphate pathway (PPP), glycolysis (Wamelink et al.
2008), or be stored as glycogen.
1.2. GLUCOSE METABOLIC PATHWAYS
1.2.1. GLYCOGEN IN THE BRAIN
Astrocytes are the only cells in the nervous system able to storage glycogen under
non-pathologic conditions (Wiesinger et al. 1997), where it functions as a transient
glucose reservoir under resting conditions (Watanabe & Passonneau 1973).
Neurons express the enzyme responsible for glycogen synthesis, glycogen
synthase, but under normal conditions they keep the machinery for glycogen
synthesis inactive by maintaining glycogen synthase phosphorylated (inactive). In
addition, neurons degrade both glycogen synthase and protein targeting glycogen
(PTG), a regulatory subunit of protein phosphatase 1 that activates, through
dephosphorylation, glycogen synthase (Vilchez et al. 2007). When glycogen
synthase is dephosphorylated (thus activated), it leads to glycogen accumulation
and triggers apoptotic neuronal death, a phenomenon that is characteristic of a
form of progressive myoclonus epilepsy, Lafora disease (Vilchez et al. 2007,
Collins et al. 1968).
Glycogenolysis is induced when there is a deficit of glucose supply to the brain
(Choi et al. 2003). Actually, astrocyte glycogen is critical for maintaining synaptic
activity and for neuronal survival during hypoglycemia (Swanson & Choi 1993, Suh
et al. 2007). Neuronal synaptic activity in normal condition also stimulates glycogen
degradation by astrocytes (Swanson et al. 1992) and its glycolytically conversion in
lactate (Dringen et al. 1993). Lactate is then released and transported to neurons
that can use it as an energetic substrate.

INTRODUCTION
6
1.2.2. GLYCOLYSIS
Glycolysis transforms glucose into pyruvate in 10 enzymatic reactions. Besides 2
mols of pyruvate, 2 mols of ATP, 2 mols of NADH(H+), 2 H+ and 2 of H2O are
produced per mol of glucose (Nelson & Cox 2001). Three enzymes are key
regulatory points in this pathway as they catalyze irreversible reactions that
generate intermediates arriving from other metabolic pathways (Nelson & Cox
2001). These three enzymes are hexokinase, 6-phosphofructo-1-kinase (PFK-1)
and pyruvate kinase (see figure 1).
Hexokinase is expressed under four different isoenzymes (HKI-IV) (Wilson 2003).
The most abundant isoenzyme in brain is HKI and is physically associated (70-
90%) with the outer mitochondrial membrane. Release of HKI from mitochondria
causes a severe decrease in its activity (Rose & Warms 1967) that, in neurons,
triggers oxidative damage (Saraiva et al. 2010). Besides preventing neuronal
oxidative damage, mitochondrial-bound HKI is neuroprotective, maintains
adequate glutathione levels and induces neurite outgrowth (Wang et al. 2008).
HKII also associates with mitochondria, where it promotes neuronal survival; its
overexpression is sufficient to protect against rotenone (a mitochondrial complex I
inhibitor)-induced cell death (Gimenez-Cassina et al. 2009). In astrocytes HKI is
also associated with mitochondria but inhibition of gap junctions upregulates and
stimulates the translocation of HKI from mitochondria to microtubules at the same
time that promotes GLUT1 translocation to the plasma membrane, inducing a
significant expression of HKII and GLUT3, which are normally not present in
astrocytes (Sanchez-Alvarez et al. 2004).
Glycolytic rate in neurons is much lower than in astrocytes (Herrero-Mendez et al.
2009), an observation that is accompanied by a lower rate of the oxidation of
glucose through the tricarboxylic acid cycle (TCA) in neurons (Garcia-Nogales et
al. 2003). However glycolytic activity in neurons is essential for fast axonal
transport of vesicles to nerve terminals, as it provides the ATP necessary for this
process (Zala et al. 2013). Glucose in astrocytes is predominantly used in the
glycolytic pathway, which appears to be predominantly “anaerobic” (Leo et al.
1993) i.e., that converts glucose into lactate, which can be used as a fuel by
neurons.

INTRODUCTION
7

INTRODUCTION
8
Figure 1: Schematic representation of the glycolytic pathway. Abbreviations used: G6P:
Glucose 6 phosphate; PGI: Phosphoglucose isomerase; F6P: Fructose-6-phosphate;
F1,6P2: Fructose-1,6-bisphosphate; TIM: Triose-phosphate isomerase; DHAP:
Dihydroxyacetone phosphate; GAP: Glyceraldehyde-3-phosphate; GAPDH:
Glyceraldehyde-3-phosphate dehydrogenase; F2,6P2: Fructose-2,6-bisphosphate; 1,3-
bPG:1,3-Bisphosphoglycerate; 3-PG: 3-Phosphoglycerate; 2-PG: 2-Phosphoglycerate;
LDH: Lactate dehydrogenase; PEP: Phosphoenolpyruvate; PFK-1: 6-Phosphofructo-1-
kinase;. Alosteric inhibitors of the enzymes are indicated in red, and alosteric activators in
green. Stoichiometry has been omitted for clarity.
PFK-1 regulation by fructose-2,6-bisphosphate
6-Phosphofructo-1-kinase (PFK-1) is a master regulator of glycolysis (Hue & Rider
1987, Van Schaftingen et al. 1982, Uyeda 1979). It is a tetramer that is composed
of different combinations of 3 different subunits: L-type (liver), M-type (muscle) and
P-type (platelets), each with different kinetic properties although all of them
requiring the presence of fructose-2,6-bisphosphate (F2,6P2) for full activity. In the
brain, the three subunits are expressed, although M-type is the most abundant
(Dunaway et al. 1988, Almeida et al. 2004).
PFK-1 catalyzes the phosphorylation of fructose-6-phosphate (F6P) into fructose-
1,6-bisphoshate (F1,6P2). PFK-1 is regulated by different negative (ATP and
citrate) and positive (AMP, ADP and F2,6P2) allosteric effectors; its main positive
allosteric effector is F2,6P2.
Two enzymes are responsible for the synthesis and degradation of F2,6P2, namely
6-phosphofructo-2-kinase/fructose-2,6-bisphosphatase (PFKFB) and TP53-
induced glycolysis and apoptosis regulator (TIGAR). In view of the relevance of
these enzymes in the context of this thesis, we will describe them in separate
sections.

INTRODUCTION
9
PFKFB
PFKFB is a bifunctional enzyme that presents a kinase domain which synthetizes
F2,6P2 and a bisphosphatase domain, which dephosphorylates it to obtain
fructose-6-phosphate (see Figure 2).
PFKFB activity is regulated by citrate and phosphoenol pyruvate (PEP), that are
potent allosteric inhibitors of the enzyme (Van Schaftingen et al. 1982).Glucagon
inhibits the kinase activity of the hepatic (PFKFB1) enzyme by activating protein
kinase A (Payne et al. 2005). On the other hand, phosphate is a cofactor for
PFKFB and its presence increases the Vmax of the enzyme and decreases the Km
for F6P (Laloux et al. 1985).
Figure 2: PFKFB is a bifunctional enzyme. PFKFB kinase domain (red) synthetizes
fructose-2,6-bisphosphate from fructose-6-phosphate at the expense of 1 ATP molecule.
PFKFB bisphosphatase domain (blue) dephosphorylates fructose-2,6-bisphosphate and
produces fructose-6-phosphate.
PFKFB is expressed by 4 different genes yielding 4 different isoforms (PFKFB1-4),
which have different kinetic properties and tissue-expression pattern according to
the specific needs. PFKFB1 is expressed in liver and muscle, PFKFB2 in heart,
kidney and pancreatic islets, PFKFB3 in placenta, cancer cell lines, monocytes
and Kupffer cells and PFKFB4 in testicles (Bartrons & Caro 2007). PFKFB3 is the

INTRODUCTION
10
most abundant PFKFB isoform in brain (Okar et al. 2001, Herrero-Mendez et al.
2009).
There are different alternative splicing variants of PFKFB3 depending on the
species. In humans, ubiquitous PFK-2 (uPFK-2) is the most abundant isoform in
the brain, placenta and breast cancer cells, and its ortholog in the rat is the RB2K6
alternative variant (Watanabe & Furuya 1999).
PFKFB3 presents the highest kinase-to-bisphosphatase activity (~700:1) (Ventura
et al. 1991). Thus, expression of its full-length cDNA yields a protein that is almost
a kinase, i.e. F2,6P2-synthetizing, hence glycolytic-promoting enzyme.
PFKFB3 is phosphorylated by PKA and PKC on Ser461 without affecting Km for F6P
or ATP and neither its bisphosphatase activity (Tominaga et al. 1997). When,
under hypoxic conditions, the ratio AMP:ATP increases, AMP-activated protein
kinase (AMPK) is activated and phosphorylates PFKFB3 on Ser461, activating it and
causing an increase in F2,6P2 levels that stimulates glycolysis and cytosolic ATP
production (Marsin et al. 2002). PFKFB3 can also be phosphorylated at Ser461 by
MK2 (MAPK-activated protein Kinase-2), leading to an increase in its activity
(Novellasdemunt et al. 2013, Bolanos 2013).
PFKFB3 promoter has elements that can be activated upon binding of the hypoxia
inducible factor 1 (HIF-1). Thus, under hypoxic conditions, PFKFB3 is
transcriptionally upregulated and this is accompanied by an increase in glycolytic
flux and ATP levels (Minchenko et al. 2002, Obach et al. 2004). PFKFB3 promoter
also presents a serum response element that is activated upon serum response
factor binding in a p38αMAPK-MK2 pathway-dependent process (Novellasdemunt
et al. 2013, Bolanos 2013). PFKFB3 expression can also be induced in response
to progestins (Novellasdemunt et al. 2012) or insulin (Riera et al. 2002) in cancer
cells and pro-inflammatory molecules such as interleukine-6 (Ando et al. 2010) and
adenosine (Ruiz-Garcia et al. 2011).
PFKFB3 shows another regulatory mechanism that accounts for the low levels of
this protein in neurons. PFKFB3 is the only PFKFB isoform that presents a Lys-
Glu-Asn (KEN) box in its sequence. This motif is a recognition site for Cdh1, an
adaptor protein for the E3 ubiquitin ligase anaphase-promoting complex/cyclosome

INTRODUCTION
11
Figure 3: Superposition of TIGAR
(yellow) and FBPase-2 (green)
structures. Obtained from Li et al,
2009.
(APC/C) that ubiquitinates target proteins to be degraded by the proteasome (see
section 2.5.4). Unlike astrocytes, APC/C-Cdh1 is very active in neurons and
maintains PFKFB3 protein levels very low; this accounts for the differential
regulation of glycolysis in neurons and astrocytes. Thus, during inhibition of
mitochondrial respiration, astrocytes maintain their ATP levels, while in neurons
ATP concentration decreases progressively and is accompanied by a decrease in
the mitochondrial membrane potential (∆ψm ) that finally triggers apoptotic cell
death (Bolanos et al. 1994, Almeida et al. 2001). The study of the mechanism
revealed that inhibition of respiration caused an increase in AMP levels in
astrocytes that lead to AMPK phosphorylation that, in turn, activated PFKFB
(Almeida et al. 2004). The low levels of PFKFB3 in neurons explains why these
cells are unable to upregulate glycolysis upon mitochondrial damage (Herrero-
Mendez et al. 2009). In fact, overexpression of PFKFB3 in neurons is sufficient to
stimulate glycolysis and maintain Δψm during inhibition of mitochondrial respiration
(Herrero-Mendez et al. 2009). However, this effect is transient, because the
increase in glycolysis triggered by PFKFB3 overexpression is accompanied by a
decrease in the utilization of glucose through the PPP. Consequently, decrease in
the regeneration of reduced glutathione triggers oxidative stress leading to
neuronal death (Herrero-Mendez et al. 2009) (see Figure 7).
TIGAR
The protein structure of TIGAR (TP53-induced
glycolysis and apoptosis regulator) is very
similar to the fructose-2,6-bisphosphatase
domain of PFKFB (see Figure 3) and, like
PFKFB, it regulates F2,6P2 levels (Li & Jogl
2009) by degrading it, thus, inhibiting
glycolysis and promoting PPP. This causes a
decrease in intracellular reactive oxygen
species (ROS) and limits apoptosis and
autophagy in cancer cells (Bensaad et al.
2006, 2009).
Besides its function as a bisphosphatase
TIGAR translocates to the mitochondria

INTRODUCTION
12
under hypoxic conditions by forming a complex with hexokinase-II. This triggers an
increase in hexokinase activity that leads to increased glycolysis, helping to
maintain the mitochondrial membrane potential and limiting mitochondrial ROS
(Cheung et al. 2012). TIGAR also plays a role in regulating cell cycle by mediating
de-phosphorylation of retinoblastoma and stabilization of RB-E2F1 complex thus
delaying the entry of cells in S phase of the cell cycle (Madan et al. 2012).
Despite its intriguing and effects over cell cycle and metabolism in cancer cells, to
our knowledge, nothing is known about TIGAR expression and function in brain.
Metabolism of pyruvate
Pyruvate, the pyruvate kinase (PK) product, is the last metabolite of glycolysis.
Neurons can obtain most of it from lactate, which, according to the astrocyte-
neuron lactate shuttle hypothesis, would be provided by astrocytes (Pellerin et al.
2007). There are three PK isoenzymes, namely class L (liver), class A (adipose
tissue, kidney) and class M, that is present in muscle and brain (Carbonell et al.
1973, Farrar & Farrar 1995). In the cytosol, pyruvate can be reduced to lactate by
a reaction catalyzed by lactate dehydrogenase (LDH), or transformed into alanine
in a transamination reaction catalyzed by alanine aminotransferase. In the
mitochondrial matrix, pyruvate can also be converted into acetyl-CoA or
oxaloacetate in the reactions catalyzed by the pyruvate dehydrogenase complex or
pyruvate carboxylase, respectively (see figure 4).
Within the brain, pyruvate carboxylase is exclusively present in astrocytes (Yu et
al. 1983). Neurons, however, show a pyruvate dehydrogenase (PDH) complex
activity higher than astrocytes (Halim et al. 2010). This high PDH activity is
important in cholinergic neurons, which require additional amounts of acetyl-CoA
for acetylcholine synthesis (Szutowicz et al. 2013).

INTRODUCTION
13
Figure 4: Schematic representation of pyruvate fates in the cell.
1.2.3. PENTOSE-PHOSPHATE PATHWAY
Besides glycolysis, PPP is the main glucose utilization pathway. PPP can be
divided into an oxidative phase and a non-oxidative phase. In the oxidative phase,
G6P is oxidized into ribulose-5-phosphate (Ru5P), a process that generates 2 mols
of NADPH(H+) per mol of G6P (Wamelink et al. 2008). In the non-oxidative phase,
Ru5P produces ribose-5-phosphate and xylulose-5-phosphate, that can later be
transformed in the glycolytic intermediates glyceraldehyde-3-phosphate and
fructose-6-phosphate (Baquer et al. 1988).

INTRODUCTION
14
Figure 5: Pentose-phosphate pathway. Abbreviations used: G6P: Glucose-6- phosphate;
G6PD: Glucose- 6- phosphate dehydrogenase; E4P: Erythrose-4-phosphate; F6P:
Fructose-6-phosphate; GAP: Glyceraldehyde-3-phosphate; PGI: Phosphoglucose
isomerase; R5P: Ribose-5- phosphate; S7P: Sedoheptulose-7-phosphate; X5P: Xilulose-5-
phosphate. The rate-limiting enzyme of PPP is glucose-6-phosphate dehydrogenase (G6PD).
G6PD activity is different between neuronal types, and is essential for generating
NADPH(H+) (Biagiotti et al. 2003). PPP activity in resting conditions, as well as the
increase in its activity that takes place during activation, is higher in astrocytes than

INTRODUCTION
15
in neurons. However, neurons actively metabolize glucose by the PPP, and has
been shown to be essential for neuronal survival (Delgado-Esteban et al. 2000,
Herrero-Mendez et al. 2009). Moreover, H2O2 increases PPP activity (Ben-Yoseph
et al. 1994), and peroxynitrite (ONOO−), a strong oxidant derived from nitric oxide,
triggers an increase in PPP activity and NADPH(H+) levels in neurons by activating
G6PD and thus protecting these cells against nitrosative stress (Garcia-Nogales et
al. 2003).
1.3. LACTATE CONSUMPTION IN NEURONS AND THE ASTROCYTE-NEURON LACTATE SHUTTLE HYPOTHESIS.
Glucose has been largely recognized as an essential substrate for brain cells
(Sokoloff 1992) but, besides the classical view of glucose as the only substrate for
oxidative metabolism in neurons, in the last few years several evidences have
shown that lactate can also be oxidized by these cells (Bouzier-Sore et al. 2003,
Zielke et al. 2007). Indeed, several works have reported that in resting conditions
lactate is the preferential substrate for neurons (Bouzier-Sore et al. 2003,
Boumezbeur et al. 2010). This is consistent with the astrocyte-neuron lactate
shuttle hypothesis (ANLSH). According to this hypothesis, astrocytes would take
up glucose from the blood circulation, transform it into lactate, and supply the latter
to neurons through the monocarboxilate transporters (MCTs), thus providing
neurons a substrate for energy production (Pellerin et al. 2007).
The use of lactate by neurons is supported by the fact that neurons and astrocytes
express different isoforms of lactate dehydrogenase (LDH), the enzyme
responsible for the conversion of lactate into pyruvate. Neurons express
preferentially LDH1, which is associated with a higher pyruvate-producing capacity,
while astrocytes express the LDH5 isoform, which is associated with tissues that
do not consume, but produce, high amounts of lactate (Pellerin et al. 1998).
Moreover, under resting conditions, astrocytes release ~85% of the glucose they
consume as lactate. In addition, astrocytes and neurons also differ in the
expression of monocarboxylate transporters (MCTs): astrocytes predominantly
express MCT1 and MCT4, which are responsible for lactate efflux, whereas
neurons express MCT2, specialized in lactate influx (Pierre & Pellerin 2005) (see
figure 6). All these data support the ANLSH, at least in resting conditions; however,

INTRODUCTION
16
how neuronal metabolism is modified during neurotransmission, as well as the
preferred substrate in these conditions, still remains elusive.
Figure 6: Astrocyte-neuron interaction in energy metabolism. Under resting conditions,
glucose can be actively used through the PPP in neurons due to the low activity of
PFKFB3, which is continuously degraded by APC/C-Cdh1. Neurons can thus efficiently
produce NADPH(H+), necessary for antioxidant glutathione regeneration from its disulfide
form (GSSG). Astrocytes take up glucose, a part of which is transformed into pyruvate and
used to fuel the TCA cycle, whereas the rest is transformed into lactate, exported to the
synaptic cleft, and used as an energy fuel by neurons; in this process, the cellular
distribution of the monocarboxylate carriers (MCT1/MCT4 and MCT2) and lactate
dehydrogenase (LDH1 and LDH5) isoforms is critical. Accordingly, neurons can meet their
energy requirements without compromising the redox detoxification system.

INTRODUCTION
17
1.4. REACTIVE OXYGEN SPECIES (ROS) GENERATION AND DETOXIFICATION
1.4.1 ROS GENERATION
Reactive oxygen species (ROS) are produced physiologically. The main source of
ROS is the mitochondrial electron transport chain. The leading ROS are
superoxide anion (O2.-), hydrogen peroxide (H2O2) and hydroxyl radical (.OH). ROS
can physiologically regulate protein function and gene expression, as well as cell
proliferation and differentiation (Halliwell 2011, Rebrin & Sohal 2008).
O2.- is generated by the donation of a single electron to O2 (Murphy 2009), largely
at complexes I and III of the mitochondrial respiratory chain. However, it can also
be generated by the action of enzymes such as xanthine oxidase, NADPH(H+)
oxidase, cyclooxygenase or lipoxigenase. O2.- can be transformed into H2O2 in a
reaction catalyzed by superoxide dismutase (SOD), or reduce Fe3+ to Fe2+ by the
Haber-Weis reaction. Fe2+ can be re-oxidized to Fe3+ by the Fenton reaction,
leading to the formation of O2- from H2O2 (Temple et al. 2005). Apart from the
reaction catalyzed by SOD, H2O2 can be generated by the action of other
enzymes, such as monoamine oxidase (MAO) in the catabolism of dopamine.
Besides ROS, nitrogen oxidative species, such as peroxynitrite (ONOO−), can be
spontaneously formed by the reaction of O2.- with nitric oxide (see figure 7).

INTRODUCTION
18
Figure 7: ROS generation and detoxification systems in the cell. Abbreviations used: SOD:
superoxide dismutase; GPx: Glutathione peroxidase; GRx: glutathione reductase; GSH:
Glutathione; GSSG: oxidized glutathione; O2.-: superoxide anion; ONOO−: peroxynitrite;
.OH: hydroxyl radical; H2O2: hydrogen peroxide; .NO: nitric oxide. ROS generation systems
are indicated in red, and ROS detoxification systems in green.
1.4.2 ROS DETOXIFICATION SYSTEMS
Cells have many antioxidant systems to counteract the actions of ROS. These
systems include compounds such as ascorbate or vitamin E, which directly trap
radicals acting as scavengers, and enzymatic systems (see below). Ascorbate is
especially abundant in the central nervous system (CNS). Its concentration is
regulated homeostatically between the intracellular and extracellular
compartments, and is especially abundant in neurons (Shimizu et al. 1960).
Vitamin E is present in two-fold higher levels in astrocytes when compared with
neurons, and protects astrocytes against mitochondrial oxidative damage (Heales

INTRODUCTION
19
et al. 1994). SOD converts O2.- into H2O2 and is expressed under two different
intracellular isoforms: manganese superoxide dismutase (MnSOD), that detoxifies
cells from superoxide released into the mitochondrial matrix, and copper/zinc
superoxide dismutase (Cu/ZnSOD), that detoxifies cytosolic superoxide. There is
also an extracellular form of SOD (SOD3) that detoxifies extracellular O2.-. Another
form of H2O2-detoxifying system is catalase, which is placed in peroxisomes.
Besides these, there are additional ROS detoxifying systems using thiols as
cofactors. Glutathione (γ-L-glutamyl-L-cysteinyl-glycine, GSH) is the most
abundant small thiol (0.5-10 nmol/l) in animal cells and tissues, and plays an
essential role in protecting against oxidative and nitrosative stress. It is synthetized
de novo in the cytosol by two ATP-dependent consecutive reactions, catalyzed by
glutamate-cysteine ligase and glutathione sinthetase. Most part of GSH synthesis
in the brain takes place in astrocytes that liberate it to the extracellular space
(Hirrlinger et al. 2002). GSH is then transformed into cysteinyl-glycine (Cys-gly),
that is hydrolyzed by aminopeptidase, generating cysteine and glycine that are
taken up by neurons, which use them as precursors for GSH biosynthesis (Dringen
et al. 2001). Despite GSH biosynthesis is exclusively cytosolic, GSH enters
mitochondria through carriers located in the inner mitochondrial membrane, and
accounts for a 10-15% of the total cellular GSH (Mari et al. 2009).
Glutathione exerts its antioxidant function as an electron donor for peroxides
detoxification in reactions catalyzed by glutathione peroxidases (GPxs1-4), which
reduce H2O2 to H2O, hence oxidizing reduced glutathione (GSH) to its disulfide
(oxidized) form (GSSG). GPx4 is exclusively located in the mitochondria and has
an importat role in reducing lipid peroxides (Flohe et al. 1971). An important
system for H2O2 detoxification are peroxiredoxins (Prxs), that are located both in
mitochondria and cytosol and require reduced thioredoxin to be re-generated.
Glutatione can also spontaneously react with different free radicals, such as
superoxide, hydroxyl radical and nitric oxide, also generating GSSG (Dringen
2000). GSH can be regenerated from GSSG by reducing GSSG in a NADPH(H+)-
dependent reaction catalyzed by glutathione reductases (GRxs), that are present in
cytosol and mitochondria (Flohe et al. 2011). Thus, as we will discuss below,
NADPH(H+) generated in the PPP is essential for glutathione regeneration, an
essential system for neuronal survival (Herrero-Mendez et al. 2009).

INTRODUCTION
20
2. GLUTAMATERGIC NEUROTRANSMISSION 2.1. GLUTAMATE
Glutamate is the major excitatory neurotransmitter in the mammalian brain and is
implied in information processing and synaptic plasticity. Compared to other
neurotransmitters, the levels of glutamate are extremely high in the mammalian
central nervous system, approaching 5–10 mmol/kg (Butcher & Hamberger 1987);
these levels are ~1000-fold higher than those of many other important
neurotransmitters, such as dopamine, norepinephrine, and serotonin. Its
concentration in the synaptic cleft in resting conditions remains low (~0.6 µM).
However, during synaptic transmission glutamate is released from the presynaptic
neuron in a short period of time (1-2 ms), reaching concentrations higher than 100
μM. These concentrations are restored back to normal levels by the high affinity
glutamate transporters located in pre and post-synaptic neurons, as well as in the
adjacent glial cells.
2.2. GLUTAMATE RECEPTORS
The excitatory effects of glutamate are exerted via the activation of three major
types of ionotropic receptors (AMPA, KAINATE and NMDA) and several classes of
metabotropic receptors linked to G-proteins (Dong et al. 2009).
2.2.1. METABOTROPIC GLUTAMATE RECEPTORS
Metabotropic glutamate receptors are G-protein-coupled receptors. They are
classified into 8 subtypes (mGLU1 to mGLU8) that are divided into three groups
based on their G-protein coupling, molecular structure, amino acid sequence
homology and pharmacological profile.
Group-I includes mGlu1 and mGlu5; they are coupled to phospholipase C (Tanabe
et al. 1992, Joly et al. 1995). Activation of these receptors generates inositol-1,4,5-
trisphoshate (InsP3) and diacylglycerol (DAG); InsP3 releases Ca2+ from the
endoplasmic reticulum and together with DAG activates protein kinase C (PKC)
respectively. In general, mGlu1 and mGlu5 receptors increase neuronal excitability,

INTRODUCTION
21
so they have been studied as targets to prevent glutamate-mediated
neurodegeneration. (+)-2-Methyl-4-carboxyphenylglycine, a potent and selective
antagonist of mGlu1, is neuroprotective in models of excitotoxic death (Bruno et al.
1999). 2-Methyl-6-(phenylethynyl)-pyridine (MPEP), an inhibitor of mGluR5
receptors, also prevents degeneration in the 1-methyl-4-phenyl-1,2,3,6-
tetrahydropyridine (MPTP) mouse model of PD, as it prevents the function of these
receptors in facilitating NMDA receptors activation (Hsieh et al. 2012).
Group-II and Group-III are preferentially localized in the preterminal region of
axons; they are negatively coupled to adenylate cyclase. Group-II includes mGlu2
and mGlu3 (Emile et al. 1996); their activation attenuates glutamate release
(Mateo & Porter 2007, Grueter & Winder 2005). Group III mGluRs (GluR4, GluR6,
GluR7, GluR8) also function to restrain glutamate or GABA release form axon
terminals, preventing over activation of postsynaptic NMDA receptors (Vera &
Tapia 2012). Actually, endogenous glutamate activates these receptors and
protects against excitotoxicity (Vera & Tapia 2012). Moreover, a specific agonist of
mGLUR8 has been shown to reverse motor deficits in prolonged models of PD
(Johnson et al. 2013).
2.2.2. IONOTROPIC GLUTAMATE RECEPTORS
Ionotropic receptors activated by glutamate are the N-methyl-D-aspartic acid
(NMDA), α-amino-3-hydroxy-5-methylisoxazole-4-propionate (AMPA) and kainic
acid (KA) receptors.
-AMPA and kainate receptors
AMPA receptors (AMPARs) and kainate receptors are tetrameric cationic channels
permeable to Na+ and Ca2+. AMPARS are composed by GluA1-A4 subunits that
mediate fast excitatory synaptic transmission in the mammalian central nervous
system (Heine et al. 2008). Kainate receptors are composed by five different
subunits GLUK1, GLUK2, GLUK5, GLUK6 and GLUK7, and they can be
presynaptically placed, where they modulate glutamate release (Chittajallu et al.
1996) or postsynaptically, where they can mediate excitatory neurotransmission
(Vignes & Collingridge 1997).
-NMDA receptors

INTRODUCTION
22
NMDA receptors (NMDAR) are cationic channels permeable to Na+, K+, and Ca2+
that mediate many neuronal functions including plasticity, synapsis consolidation
during neuronal differentiation, long term potentiation (LTP), regeneration and
survival (McDonald & Johnston 1990, Castellano et al. 2001, Cheng & Ip 2003).
NMDARs need two different agonists bound simultaneously to open the channel
pore: glutamate and glycine (Paoletti & Neyton 2007). The NMDAR channel pore is
blocked in a voltage dependent manner by Mg2+.
NMDARs work as a heterotetramer that contains two NR1 subunits that are
essential for the functionality of the receptor. They contain a glycine-binding site
and two NR2 (NR2A-NR2D) subunits that contain the glutamate-binding site. The
most widely expressed NMDARs contain the obligate subunit NR1 plus either
NR2B or NR2A or a mixture of the two, but NR3 subunits can also substitute NR2
in the receptors, making Ca2+ permeability to decrease (Matsuda et al. 2003).
Figure 8. Schematic representation of NMDAR structure. NR1 and NR1 subunits are
represented, as well as MAGUKs proteins to which NR2 subunit binds in its intracellular
domain (PSD-95, SAP-102, PSD-93). NMDAR present a glycine binding site in its NR1
subunit and a glutamate binding site in NR2. The channel pore is blocked by Mg2+

INTRODUCTION
23
In synapses, NMDAR is bound to a multiproteic complex with the carboxyl end of
NR1 and NR2 subunits (Collins et al. 2006). This complex facilitates localization of
the receptor in specific areas, such as the postsynaptic density, where it allows the
coupling with a wide variety of signal transduction cytosolic molecules (Waxman &
Lynch 2005). Carboxyl end of NR2 binds MAGUKs proteins (membrane associated
guanylate cyclases), such as PSD-95, SAP-102 and PSD-93. These proteins allow
others to be located nearby the receptors in such a way that they can be more
efficiently activated by Ca2+, that is the case of nNOS (neuronal nitric oxide
synthase) (Aarts et al. 2002).
There is a large body of evidence supporting the hypothesis that synaptic NMDARs
activate neuroprotecive and trophic pathways, whereas the extrasynaptic ones are
responsible for excitotoxicity (Kaufman et al. 2012, Hardingham et al. 2002,
Hardingham & Bading 2010, Puddifoot et al. 2012). Synaptic NMDAR activation
induces CREB (cAMP response element binding protein) activity and BDNF (brain
derived neurotrophic factor), triggering anti-apoptotic signals, while activating the
extrasynaptic ones has the opposite effects (Hardingham et al. 2002). However,
recent publications have questioned this statement by demonstrating that
prolonged synaptic NMDAR activation triggers excitotoxic cell death (Wroge et al.
2012).
Regardless their location, there is much evidence of a differential function of
NMDAR depending on their subunit composition, as they have different effects on
cytosolic calcium accumulation, mitochondrial morphology and MAPK signaling, in
which NR2B would preferentially trigger neuronal death signals (Choo et al. 2012,
Paul & Connor 2010).
2.3. GLUTAMATE TRANSPORTERS
There is no evidence for extracellular metabolism of glutamate. This excitatory
amino acid is cleared from the extracellular space by a family of Na+-dependent
‘high-affinity’ transporters. Glutamate transporters are termed GLAST (EAAT1),
GLT I (EAAT2), EAAC (EAAT3), EAAT4, and EAAT5 (Kanai & Hediger 1992,
Pines et al. 1992). EAAC and EAAT5 are found exclusively in neurons, whereas
GLAST and GLTI, the major contributors to glutamate uptake, are glia-specific

INTRODUCTION
24
transporters, posing astrocytes responsible for a major part of glutamate uptake
and metabolism in the brain (Rothstein et al. 1996).
2.4. GLUCOSE METABOLISM IN GLUTAMATERGIC NEUROTRANSMISSION
There is increasing evidence pointing out that glutamatergic stimulation has critical
consequences on neuronal metabolism. As mentioned before, metabolic
homeostasis is essential for the maintenance of neuronal redox status and
survival. Thus, metabolic modifications may have great implications in the
pathophysiology of neurodegenerative diseases, in which excitotoxic mechanisms
have been described.
2.4.1. GLUTAMATERGIC NEUROTRANSMISSION STIMULATES LACTATE RELEASE BY ASTROCYTES
During glutamatergic neurotransmission, astrocytes remove excess glutamate from
the synaptic cleft (Rothstein et al. 1996). Glutamate is taken up by astrocytes
through glutamate transporters, which are Na+-dependent. The subsequent
increase in intracellular Na+ activates the Na+/K+ ATPase activity, hence
decreasing the ATP:ADP ratio, which promotes astrocytic glycolysis (Pellerin &
Magistretti 1994). At the same time, glucose transport in astrocytes is enhanced by
stimulating GLUT1 transporter in a Na+-Ca2+ dependent manner (Loaiza et al.
2003, Chuquet et al. 2010, Porras et al. 2008). This up regulation of glycolysis is
traduced in an increase of lactate production by astrocytes and, according to the
ANLSH, neurons would take it up and transform it into pyruvate for use as an
energy source (Pellerin & Magistretti 1994).
2.4.2. GLUCOSE UPTAKE BY NEURONS DURING NMDAR ACTIVATION
How glucose uptake by neurons is affected by neurotransmission is yet a
controversial issue. Real-time confocal microscopy studies tracing 6-[N-(7-
nitrobenz-2-oxa-1,3-diazol-4-yl)amino]-6-deoxyglucose (6-NBDG), a non
metabolizable glucose analog fluorescence probe, indicated that glutamate inhibits
glucose transport in cultured hipoccampal neurons (Porras et al. 2004). In contrast,
an increased glucose uptake has been observed by tracing 2-deoxy- [1-

INTRODUCTION
25
3H]glucose-6-phosphate accumulation in cerebellar neurons in culture subjected to
NMDAR stimulation (Bak et al. 2009). These results have been reproduced in
cortical neurons tracing 6-NBDG (Ferreira et al. 2011). Moreover, the increase in
nitric oxide levels that occur after stimulation of NMDAR in primary cultured cortical
and hippocampal neurons triggers an increase in GLUT3 surface expression that is
accompanied by an increase in glucose uptake (Ferreira et al. 2011), confirming
the importance of rapid GLUT3 externalization in energy metabolism and
cytoprotection (Cidad et al. 2004). Although it is important to notice that all these
studies are performed in neurons in culture, where the possible influence of
astrocytes is neglected, there is in vivo evidence also supporting these findings.
Thus, by rat whisker stimulation and imaging of 6-NBDG trafficking by two-photon
microscopy, during activation of the somatosensory cortex there is an increase in
glucose uptake both in neurons and astrocytes, although the increase observed in
astrocytes is much higher (Chuquet et al. 2010). Accordingly, despite there is still
some controversy, it seems clear that glutamatergic neurotransmission is
accompanied by an increase in glucose uptake by both neurons and astrocytes;
however, the metabolic fate of glucose in each cell type, which does not have to be
necessarily identical remains unclear.
2.4.3. NMDAR STIMULATION ALTERS ENERGY METABOLISM IN NEURONS
Another question that still remains elusive is how neuronal metabolism is modified
during neurotransmission and the preferential substrate used for meeting the ATP
needs during this process. Two-photon fluorescence imaging of NADH(H+) on
hippocampal slides showed evidence of a two-phase metabolic response in which
neurons exert an early increase in oxidative metabolism followed by activation of
astrocytic glycolysis (Kasischke et al. 2004). Intererstingly, it is known that
extracellular lactate levels modulate astrocytic glycolysis (Sotelo-Hitschfeld et al.
2012), suggesting the existence of a negative feedback regulatory mechanism of
glucose consumption by astrocytes that may be important for glucose re-
distribution to brain areas or cells where it is needed.
Tracing the fate of [1-13C] or [3-13C]glucose and lactate in astrocytic and neuronal
cultures showed that, in resting conditions, neurons use lactate preferentially over
glucose for oxidative metabolism, while astrocytes prefer glucose (Bouzier-Sore et

INTRODUCTION
26
al. 2006, Bak et al. 2006). Interestingly, stimulation of NMDAR in glutamatergic
neurons in primary culture increases glucose oxidative metabolism, as assessed
by registering the fate of [1,2-13C]acetyl-CoA derived from either [U-13C]glucose or
[U-13C] lactate, a measure of the TCA cycle activity (Bak et al. 2006, 2009).
Furthermore, glucose resulted to be necessary for maintaining neurotransmitter
homeostasis (Bak et al. 2006). This increase in glucose oxidative metabolism by
the TCA in neurons was dependent on the increase in intracellular Ca2+ levels that
takes place after NMDARs stimulation (Bak et al. 2009, 2012), but the molecular
mechanisms underlying this process still remain elusive.
2.5. EXCITOTOXICITY
Excitotoxicity is a pathologic process that triggers cell death and occurs when
NMDAR are over activated. It is related with the pathogenesis of many
neurodegenerative diseases, like Huntington, AD, PD or Amyotrophic Lateral
Sclerosis. The mechanisms downstream NMDAR over activation are multiple and
complex and, despite they have been widely investigated, they are not yet fully
understood.
2.5.1. EXCITOTOXICITY TRIGGERS Ca2+ OVERLOAD AND CALPAINS ACTIVATION
The Ca2+ overload that takes place after NMDARs stimulation plays a critical role in
the excitotoxic process. Choi, by changing the extracellular ionic environment of
cortical neurons in primary culture and exposing them to glutamate, described a
Ca2+-dependent component in excitotoxicity, and concluded that at low glutamate
exposures, Ca2+ plays a critical role in neuronal death (Choi 1987). He also
suggested the influence of NMDAR over-activation in this process (Choi 1987).
Apart from the initial increase in cytosolic Ca2+ after NMDAR stimulation, there is a
so called delayed calcium deregulation that persists after glutamate removal, which
triggers other effects, such as activation of calpains, a family of Ca2+-dependent
cysteine proteases (Brustovetsky et al. 2010). Calpains process the full-length
isoform of tropomyosin-related kinase B (TrkB-FL), a receptor for neurotrophins
like brain-derived neurotrophic factor (BDNF). This leads to the formation of a
truncated protein that lacks the tyrosine-kinase domain (TrkB-T1) (Vidaurre et al.

INTRODUCTION
27
2012). This TrkB-FL / TrkB-T1 imbalance is associated with a rat model of focal
cerebral ischemia, which presents high TrkB-T1 levels and reduction of TrkB-FL
upon NMDARs overstimulation (Vidaurre et al. 2012). Calpains also trigger the
proteolytic cleavage of the Na+/Ca2+ exchanger (NCX), the major plasma
membrane Ca2+ extruding system; this impairs calcium homeostasis and leads to
neuronal death (Bano et al. 2005, Brustovetsky et al. 2010). This effect can be
enhanced by a reversal of the NCX that takes place during stimulation of AMPAR
and that leads to an increase in intracellular Ca2+ and activation of calpains (Araujo
et al. 2007).
2.5.2. MITOCHONDRIAL DYSFUNCTION AND EXCITOTOXICITY
Mitochondria contribute to prevent excessive cytosolic Ca2+ levels by taking up
cytosolic Ca2+ through uniporters located in their inner membrane (Gunter &
Gunter 1994, White & Reynolds 1997, Gunter & Gunter 2001). However, during the
excitotoxic process, the increase in Ca2+ cause mitochondrial overload and triggers
an activation of the permeability transition pore (PTP), that leads to inner
mitochondrial membrane depolarization and inhibition of ATP synthesis (Wang et
al. 1994, Khodorov et al. 1996). Inhibition of the oxidative phosphorylation and loss
of the mitochondrial membrane potential finally lead to increased ROS and
cytochrome c release, playing a key role in glutamatergic excitotoxicity (Urushitani
et al. 2001, Luetjens et al. 2000).
Excitotoxicity and oxidative stress also alter mitochondrial fission and fusion,
leading to fragmented mitochondria, an effect that has been observed in many
neurodegenerative diseases (Knott et al. 2008, Nguyen et al. 2011). Moreover,
mutations in optic atrophy type 1 (OPA1), a dynamin-related GTPase that is
essential for mitochondrial fusion, also trigger NMDAR upregulation, leading to the
excitotoxic process (Nguyen et al. 2011).

INTRODUCTION
28
2.5.3. OXIDATIVE AND NITROSATIVE STRESS
Oxidative and nitrosative stress takes place when ROS and NOS overload the
antioxidant defenses of the cell. In excitotoxic processes, when increased
mitochondrial Ca2+ uncouples the mitochondrial electron transport chain and
collapses the mitochondrial membrane potential, free electrons are accumulated in
the mitochondria, and can react with molecular oxygen, producing superoxide
anion (O2•-). Besides this, nNOS is localized close to NMDAR by an interaction with
PSD95. Thus, nNOS is more easily activated by Ca2+ entry through NMDAR.
Excessive production of nitric oxide (•NO) when NMDAR are over-activated is toxic
and can react with other ROS, such as O2•- to produce ONOO-.
All these processes lead to oxidative stress that triggers oxidation of proteins
(particularly aromatic or cysteine residues), nucleic acids and lipids (Poyton et al. ,
Temple et al. 2005), leading to protein malfunction. Mitochondria are the main
source of ROS in the cell and thus are more sensitive to oxidative damage, such
as oxidation of Fe-S clusters of proteins, including some respiratory chain
complexes and aconitase, mitochondrial DNA mutations (Fukui & Moraes 2008,
Hekimi et al. 2011) or lipid peroxidation. All these modifications and alterations can
finally trigger a massive damage that activates macro-autophagy and cell death
processes (Brand 2011). Specifically, peroxidation of cardiolipin, a mitochondria-
specific phospholipid, leads to mitochondrial membrane permeabilization, release
of pro-apoptotic factors, finally leading to cell death (Samhan-Arias et al. 2011).
2.5.4. EXCITOTOXIC ACTIVATION OF NMDAR TRIGGERS Cdh1 HYPERPHOSPHORILATION AND APC/C INACTIVATION
The anaphase-promoting complex/cyclosome (APC/C) is an E3 ubiquitin ligase
that regulates cell cycle progression (Thornton & Toczyski 2006) by targeting cell
cycle proteins for degradation by the proteasome. To be active, APC/C needs to
be bound to the co-activator proteins, Cdc20 or Cdh1, which participate in
substrate recognition (Visintin et al. 1997) by detecting degradation motifs in the
target proteins, predominantly the destruction (D) box (RxxLxxxxN) and the KEN
box (KENxxxN) (Barford 2011). During early mitosis APC/C is activated by Cdc20,
whereas in late mitosis it binds Cdh1 and controls mitotic exit and G1 maintenance.
Besides cell cycle progression regulation, it has been shown that glutamate over-

INTRODUCTION
29
activation of NMDAR triggers Cdh1 phosphorylation leading to its inactivation, by
Cdk5. Cdk5 is activated when it binds p25, the proteolytic product of p35 (Lee et
al. 2000). Upon glutamate NMDAR stimulation, as we have mentioned before,
there is a Ca2+ overload that leads to calpain activation (Brustovetsky et al. 2010).
Calpains transform p35 in p25, thus activating Cdk5 (Lee et al. 2000). Cdk5
phosphorylates Cdh1 and sequesters it in the cytosol, thus inhibiting APC-Cdh1
activity leading to the accumulation of its substrates (Jaquenoud et al. 2002,
Maestre et al. 2008)
Inactivation of the APC/C-Cdh1 complex leads to cyclin B1, a well-known substrate
of this complex, accumulation, which triggers neuronal apoptotic death (Maestre et
al. 2008). Interestingly, cyclin B1 accumulates in degenerating brain areas in AD
disease and stroke, that are pathologic conditions that have been widely
associated with an excitotoxic neuronal death (Vincent et al. 1997, Wen et al.
2004)
2.5.5. OVERVIEW ON THE RELATIONSHIP BETWEEN EXCITOTOXICITY AND NEURODEGENERATIVE DISEASES
Many evidences in animal models and humans suggest the implication of
excitotoxicity in the development of neurodegenerative diseases. Early alterations
in the glutamatergic system have been described in Huntington’s disease,
including decreased glutamate uptake by astrocytes due to decreased levels of
GLAST and GLT-1 glutamate transporters (Lievens et al. 2001, Estrada-Sanchez
et al. 2009), increased responses to NMDA and decreased Mg2+ sensitivity
(Starling et al. 2005), as well as changes in NMDAR subunits composition. The
dopaminergic neurons that degenerate in PD are also vulnerable to excitotoxicity,
and group III metabotropic glutamate receptors agonists have been proved to
improve akinesia in mice models of the disease (Broadstock et al. 2012).
Amiothropic lateral sclerosis (ALS) is characterized by the degeneration of motor
neurons; several data from ALS patients and Cu/Zn-SOD mutant mice, that are a
well-known animal model of the disease, have associated the development of this
disease with impaired Ca2+ homeostasis, oxidative stress and mitochondrial
dysfunction (Kruman et al. 1999) as well as defects in glutamate transport due to
loss in glutamate transporter GLT-1 (Rothstein et al. 1995, Howland et al. 2002).
AD is characterized by the presence of amyloid β deposits that can enhance

INTRODUCTION
30
NMDA excitotoxicity by impairing glutamate transporters and calcium regulation
(Mattson et al. 1992). There are several reports indicating that targets against
different aspects related to the excitotoxic process could be effective in AD
treatment, like Ca2+ blocking agents (Weiss et al. 1994, Le et al. 1995) and
glutamate receptors antagonist. Actually, memantine is the only drug proved to be
effective for clinical treatment of AD so far. It blocks opened channels associated
with ionotropic glutamate receptors and its off-rate is fast so it does not accumulate
and interfere with normal glutamatergic transmission (Lipton 2004, Glodzik et al.
2008).

31
2. HYPOTHESIS
AND OBJECTIVES

32

HYPOTHESIS AND OBJECTIVE
33
HYPOTHESIS AND OBJECTIVES
1. Hypothesis
In view of the previously described premises, we hypothesize that glucose should be
preferentially metabolized through the PPP in neurons in order to generate NADPH(H+)
for regenerating glutathione. However, to date no unambiguous method to address this
issue is available. Moreover, NMDAR activation leads to APC/C-Cdh1 complex
inactivation, and we believe that this should trigger stabilization of PFKFB3. Under these
circumstances, there would be a metabolic change leading to decreased glucose
oxidation trough the PPP thus contributing to the oxidative stress and neuronal death
observed in excitotoxicity. Finally, the fructose-2,6-bisphosphatase novel protein TIGAR
occurrence in neurons –and possible function therein– is unknown, but it might play key
role(s) in neuronal metabolism and/or survival yet to be characterized.
2. Objectives
With the aim to address the above-mentioned hypotheses, we planned to elucidate the
following objectives:
1- To design and establish a suitable method to accurately determine the glycolytic and
PPP fluxes in attached intact neurons in primary culture.
2- To attempt to quantify the relative contributions of glycolysis and PPP to the overall
glucose metabolism of neurons.
3- To ascertain whether excess neurotransmission, as induced by over-activation of
glutamate receptors, triggers PFKFB3 stabilization and changes in glucose metabolism,
redox status or survival in neurons.
4- To investigate whether TIGAR is expressed in brain cells and, and in such a case,
whether it plays any role in the regulation of neuronal glucose metabolism and/or
survival.

34

35
3. MATERIALS
AND METHODS

36

MATERIALS AND METHODS
37
1. PLASMID CONSTRUCTIONS, AMPLIFICATION AND PURIFICATION
1.1. pEGFP-C1-TIGAR PLASMID CONSTRUCTION
Human TIGAR full length cDNA (812 bp, NM_020375) was obtained by PCR using, as
template, a pcDNA 3.1+ plasmid where it was initially cloned (generous gift from Prof. R.
Bartrons, University of Barcelona) using the oligonucleotides detailed in table 1; these
were designed targeting the 5’ and 3’ extremes of TIGAR cDNA flanked by the restriction
sequences of HindIII in 5’-end and of EcoRI in 3’-end.
OLIGONUCLEOTIDE SEQUENCE 5’ 3’ Tm
Forward + HindIII
restriction site 5´-CCCAAGTTGGGCCGCTCGCTTCGCTCTGACTGTTGTC-3´
81.9ºC
Reverse + EcoRI
restriction site 5´-GGAATTCCCTTAGCGAGTTTCAGTCAGTCCATT-3´ 67.2ºC
Table 1: Oligonucleotides employed in the PCR to obtain TIGAR cDNA. An additional sequence
for HindIII and EcoRI was added in 5’ and 3’ oligonucleotides respectively (blue).
PCR conditions were 10 min at 95 ºC, 35 cycles of 30 seconds at 95 ºC, 30 seconds at
60 ºC and 1.5 minutes at 72 ºC. Final extension was carried out for 10 min at 72 ºC.
The PCR product and the pEGFP-C1 plasmid (4.7 kb, Clontech) were then digested for
1 hour with EcoRI and HindIII enzymes in order to generate cohesive extremes that
would further facilitate ligation and insertion. Digestion products were finally incubated
with T4 ligase for 30-45 minutes at room temperature, obtaining the vector named
pEGFP C1-TIGAR shown in figure 1. The success of the ligation was checked by
restriction analysis and western blot (obtaining a band at 57 KDa, corresponding to GFP
(25 KDa) plus TIGAR (32 KDa) molecular weights).

MATERIALS AND METHODS
38
Figure 1: pEGFP-C1 vector with human TIGAR cDNA (blue) inserted between HindII and EcoRI
restriction sites in the MCS.
pEGFPC1-TIGAR vector expresses green fluorescent protein (GFP) fused at TIGAR C-
terminus. This allows the identification of transfected cells and subcellular localization by
fluorescence microscopy and flow cytometry.
1.2. G6PD, PFKFB3 and mutPFKFB3 PLASMID CONSTRUCTIONS
The complete cDNA that codifies for rat G6PD was inserted in the EcoRI site of the
expression vector peGFP (Clontech) and sequenced (Sequencing service, University of
Salamanca) to confirm the correct insertion in reading phase with GFP (Garcia-Nogales
et al. 2003).
Rat PFKFB3 full-length cDNA (splice variant K6; 1563 bp; accession number BAA21754)
was obtained, by reverse-transcriptase polymerase chain reaction (RT-PCR), previously
at our laboratory. PFKFB3 cDNA was fused, at its 5’’-terminus, with the full-length cDNA
encoding GFP in the pEGFPC1 vector. In order to obtain the mutPFKFB3 construction,
GFP-PFKFB3 cDNA fusion construct was subjected to site-directed mutagenesis of its

MATERIALS AND METHODS
39
KEN-box to AAA using the QuikChange XL site-directed mutagenesis kit (Stratagene, La
Jolla, CA, USA) (Herrero-Mendez et al. 2009).
1.3. BACTERIAL TRANSFORMATION AND PLASMIDS PURIFICATION
E. coli competent cells, strain DH-5α, were used for all bacterial transformations.
Bacteria culture mediums (LB, LB-agar and 2 x YT) were prepared with bactotriptone,
yeast extract and agar from DIFCO Laboratories (Detroit, Michigan, USA).
Extraction and purification of the plasmids after the amplification in bacteria was
performed using the Wizard plus Midipreps system (Promega, Madison, Wisconsin,
USA). To isolate and purify the cDNA from agarose gels, a commercial kit from Gibco
BRL (Life Technologies Inc., Barcelona, Spain) was used. UV light is mutagenic, thus, to
avoid UV light exposure of the gel bands, each sample was loaded in duplicate. Only
one of the bands was exposed to UV in order to detect it and cDNA was purified from the
other band.
2. “SMALL INTERFERING RNA” (SIRNA) DESIGN
siRNA against PGI was obtained from Dharmacon Research Inc. (Lafayette, Colorado,
USA). The oligonucleotides employed were designed according to the rational design
criteria of Reynolds (2004) and Ui-Tei (2004), with the software available at
Dharmacon’s webpage.
Specificity of these sequences was confirmed by BLAST against the complete genome
of Rattus norvegicus, Mus musculus and Homo sapiens. siRNA sequences used for
knockdown experiments are detailed in table 2 (only forward oligonucleotides are
shown).

MATERIALS AND METHODS
40
PROTEIN ACCESSION
NUMBER SEQUENCE POSITION
PFKFB3 NM_057135 5’-AAAGCCTCGCATCAACAGC-3’ 1908-1926
TIGAR NM_177003 5’-GCGCGGAAAGGATTTCTTT-3’ 475-493
PGI NM_207192 5’-CCTTACCAGACGTAGTGTT-3’ 1248-1266
Luciferase 5’- CTGACGCGGAATACTTCGA-3’
Table 2. Sequences used for the siRNA knockdown experiments.
Cells were transfected at 3 days in culture and all siRNA were used at 100 nM, with the
exception of TIGAR siRNA that resulted to be effective at 20 nM. Experiments were
performed at day 6, i.e. 72 hours post transfection, as this is was the incubation period at
which the highest knock down efficiency was obtained.
3. ANIMALS.
Albine Wistar rats and C57BL/6J mice were bred and provided by the Animal
Experimentation Service of the University of Salamanca. We also performed primary
cultures from TIGAR KO mice (Cheung et al. 2013) from the animal facility of “The
Beatson Institue for Cancer Research” (Glasgow, UK). The animals were bred in cages
and a light-dark cycle was maintained for 12 hours. Humidity was between 45% and 65%
and temperature between 20ºC and 25ºC. Animals were fed ad libitum with a standard
solid diet (17 % proteins, 3 % lipids, 58.7 % glucidic component, 4.3 % cellulose, 5 %
minerals and 12 % humidity) and they had free access to the water all the time.
Gestational stage was controlled by limiting the cohabitation of virgin rats with males to
one night. At 9:00 hours of the following day, rats that had the presence of
spermatozoids in the vaginal smear accompanied by epithelial cells from the vagina (that
are characteristic of a fertile day of the estrus) were isolated. Under these conditions,
gestational period of the rat is assumed to be 21.7 days.
All animal handlings and procedures are in agreement with the current regulation from
the European commission 18.06.2007 (2007/526/CE) and Spanish legislation (RD
1201/2005) related to accommodation and experimental animals care. All the protocols
performed in this Thesis were approved by Bioethics Committee of the University of
Salamanca.

MATERIALS AND METHODS
41
4. CELL CULTURE
4.1. CORTICAL NEURONS IN PRIMARY CULTURE
Cortical neurons in primary culture were prepared from fetal embryos of 16 days (E16)
rats or mice according to standard procedure (Almeida et al. 1998). In brief, pregnant
rats or mice were sacrificed in a CO2 atmosphere and the embryos were removed by
hysterectomy. Embryos were transferred to a laminar flux cabin (TC48, Gelaire Flow
Laboratories, McLean, Virginia, USA) in order to maintain the sterile conditions of the
culture. Cranium and cerebral hemispheres were removed using scissors, forceps and
70% ethanol-impregnates handkerchiefs. The brain tissue was then placed in a
polystyrene Petri plate containing the disintegration solution (116 mM NaCl, 5.4 mM KCl,
1.01 mM NaH2PO4, 1.5 mM MgSO4, 26 mM NaHCO3, 4 mM glucose, 10 mg/ml phenol
red, 0,3 % w/v albumin and 20 µg/ml DNAse type I pH 7.2) and very smoothly chopped
with a scalpel. After this, it was placed in a 50 ml tube (BD, Falcon, Bedford,
Massachussets, USA) and left for 4 minutes for decantation. The pellet was re-
suspended in trypsinization solution (disintegration solution supplemented with 0.025 %,
w/v, trypsin) and incubated at 37 ºC for 15 minutes in a thermostatic bath. Trypsinization
was stopped by adding fetal calf serum (FCS; Roche Diagnostics, Heidelberg, Germany)
at a final concentration of 10 %, v/v, and the tissue was centrifuged at 500 x g during 5
minutes (Beckman Instruments, Palo Alto, California, USA).
The pellet was re-suspended in 12 ml of disintegration solution and triturated with a
silicon-coated Pasteur pipette for 9 strokes. After letting the cellular solution stand for 4
minutes, the supernatant containing the dissociated cells was carefully removed and
placed in a fresh 50 ml tube. This process was repeated once more in order to increase
yield. The supernatants were then centrifuged at 500 x g for 5 minutes. The cellular
sediment was re-suspended, first, in 1ml DMEM (Dulbecco’s Modified Eagle Medium;
Sigma-Aldrich Chemical Co., Barcelona, Spain), followed by another 19 ml DMEM. 10 μl
of the cellular suspension was diluted four times and mixed with an equal volume of
trypan blue 0.4 % (Sigma-Aldrich) for alive cellular counting using a Neubauer chamber
(Zeiss, Oberkochen, Germany) and a phase contrast microscope (CK30 model,
Olympus, Japan).
The cell suspension was diluted in culture medium (DMEM supplemented with 10% v/v
FCS plus penicillin (100 U/ml), streptomycin (100 µg/ml) and amphotericin B (0.25 µg/ml,

MATERIALS AND METHODS
42
from Sigma- Aldrich) at a final density of 106 cells/ml and seeded at 250.000 cells/cm2 in
plastic culture plates (Nunc; Roskilde, Denmark), previously coated with poly-D-lysine
(10 µg/ml; Sigma-Aldrich). Plates were placed in a thermostatized cell-culture incubator
at 37ºC (Thermo Forma 310, Thermo-Fisher Scientific, Ohio, USA) and 5% CO2
atmosphere.
After 2 days in culture, medium was removed and replaced by DMEM supplemented with
5% v/v horse serum (Sigma-Aldrich) and 20 mM glucose (Sigma-Aldrich). At 4 days in
culture 10 µM cytosine arabinoside (Sigma-Aldrich) was added to prevent non neuronal
cells proliferation. Cells were used for the experiments at 6-7 days in culture. Under
these conditions, neuronal cultures showed 97-99 % purity as assessed by
immunoreaction with the neuronal marker Map-2 (Almeida et al. 2005).
4.2. ASTROCYTES IN PRIMARY CULTURE
Astrocytes in primary culture were obtained from rat pups from 0 to 24 hours of age
(Almeida et al. 1998). Animals were cleaned with 70% ethanol, decapitated and the
whole brain was removed under a laminar flux cabin. Cerebellum and olfactory bulb were
removed using forceps and cerebral hemispheres were cleaned from meninges and
blood vessels. The tissue was then placed in a Petri dish with the disintegration solution.
Cellular suspension was obtained as previously described for neurons.
Cellular suspension was seeded at 250,000 cells/cm2 in DMEM supplemented with 10%,
v/v, FCS in 175 cm2 culture flasks (BD, Falcon). Cells were incubated in a thermostatic
cell-culture incubator at 37 ºC and 5% CO2 atmosphere. Culture medium was renewed
twice per week. After 2 weeks, the culture had an approximate purity of 90-95%, as
assessed by immunoreaction with the antibody against GFAP (Glial Fibrilliary Acidic
Protein; Sigma-Aldrich).
4.3. HEK-293T
The cell line obtained from human embryo kidney 293T (HEK293T) was maintained in
DMEM supplemented with 10% v/v FCS. 24 hours before the experiment cells were
seeded, at 100,000 cells/cm2, in plates previously coated with 10 µg/ml of Poly-D-Lysine
(Sigma-Aldrich).

MATERIALS AND METHODS
43
5. CELL TREATMENTS
5.1 CELL TRANSFECTIONS
Cell transfections were performed at day 3 in culture with the cationic reagent
Lipofectamine 2000TM or Lipofectamine LTX with Plus ReagentTM (Invitrogen, Madrid),
following manufacturer´s instructions. The conditions for transfection optimal efficiency
were assessed by quantifying the number of GFP+ cells by fluorescence microscopy.
Lipofectamine LTX with Plus ReagentTM resulted to be more effective than Lipofectamine
2000; thus, we decided to use the former for transfections.
Transfection of cells with plasmid vectors was carried out using a final concentration of
1.6 μg/ml of DNA. In some experiments, we used 0.16 μg/ml of DNA to reduce the
amount of protein synthetized (Almeida et al. 2010). In these cases, the final DNA
concentration was also 1.6 μg/ml, which was achieved with the empty DNA vector. The
correct translation of the DNA plasmids was assessed by western blot, 24 hours after
transfection.
5.2 NMDA RECEPTORS STIMULATION
Neurons at 6 days in vitro were incubated with 100 μM glutamate (plus 10 μM glycine) or
100 μM NMDA (plus 10 μM glycine) in buffered Hanks’ solution (134.2 mM NaCl, 5.26
mM KCl, 0.43 mM KH2PO4, 4 mM NaHCO3, 0.33 mM Na2HPO4 2H2O, 20 mM HEPES, 4
mM CaCl2 2H2O, 5.5 mM glucose, pH 7.4), for 15 min. Where indicated, incubations
were performed in the presence of 10 μM MK-801 (Sigma), a highly selective non-
competitive NMDA receptor antagonist, which was added 5 minutes before incubation
with glutamate or NMDA. After 15 minutes, Hank´s media was removed and replaced by
culture medium (DMEM; 5% v/v HS, 20 mM glucose), and neurons were further
incubated for the indicated time periods.

MATERIALS AND METHODS
44
5.3 INHIBITION OF PPP ACTIVITY AND MITOCHONDRIAL PYRUVATE UPTAKE. To inhibit PPP activity, we used dehydroepiandrosterone (DHEA), a potent
noncompetitive inhibitor of glucose-6-phosphate dehydrogenase (G6PD), the rate
limiting enzyme of the PPP. DHEA (Sigma D-5297) was dissolved in ethanol at 1 mM
and used at a final concentration of 1 μM (Filomeni et al. 2011, Frolova et al. 2011).
Controls received the same volume of the vehicle.
To inhibit mitochondrial pyruvate uptake, we used α-ciano-3-hydroxycinnamate (HCN)
(Sigma C-2020), which was dissolved in H2O at 50 mM and used at a final concentration
of 0.1 mM, a concentration that specifically inhibits mitochondrial -not plasma
membrane- pyruvate transport (Alvarez et al. 2003).
6. DETERMINATION OF Ca2+ UPTAKE
To estimate the intracellular Ca2+ dependent changes by NMDAR stimulation in cortical
neurons in primary culture, we used the fluorescent probe Fura-2 (acetoxymethyl-
derivative; Life Technologies, Eugene, OR, USA). Fura-2 is a UV-excitable fluorescent
calcium indicator. Upon calcium binding with Fura-2, the maximum fluorescence
excitation shifts from 363 nm (Ca2+-free) to 335 nm (Ca2+-saturated), while the maximum
fluorescence emission remains unchanged at ~510 nm.
Neurons seeded in 96-well plates (Nunc) were, at 6 days, incubated with Fura-2 (2 mM;
dissolved in dimethyl sulphoxide (DMSO)) for 40 min in DMEM at 37 ºC. Cells were then
washed and further incubated with standard buffer (140 mM NaCl, 2.5 mM KCl, 15 mM
Tris-HCl, 5 mM D-glucose, 1.2 mM Na2HPO4, 1 mM MgSO4 and 1 mM CaCl2, pH 7.4) for
30 min at 37 ºC. Finally, the standard buffer was removed and experimental buffer (140
mM NaCl, 2.5 mM KCl, 15 mM Tris-HCl, 5 mM D-glucose, 1.2 mM Na2HPO4 and 2 mM
CaCl2, pH 7.4), either in the absence or in the presence of MK801 (10 μM), was added.
Fluorescence emissions at 510 nm, after excitations at 335 and 363 nm, respectively,
were recorded at 1 second intervals in a Varioskan Flash (Thermo Fischer, Vantaa,
Finland) spectrofluorometer at 32 ºC. After approximately 10 seconds, glutamate (100
μM) or NMDA (100 μM) (plus 10 μM glycine) was injected, and emissions were further
recorded for 50 more seconds. Ca2+-dependent fluorescence changes were estimated by

MATERIALS AND METHODS
45
representing the ratio of fluorescence emitted at 510 nm obtained after excitation at 335
nm divided by that at 363 nm (F335/F363). Background subtraction was accomplished
from emission values obtained in Fura-2-lacking (DMSO-containing) neurons. In
preliminary experiments, the Ca2+ specificity of the measurements was tested in Ca2+-
free experimental buffer containing 1 mM ethylene glycol tetraacetic acid (EGTA), which
fully prevented the changes in 510 nm emissions.
7. ELECTROPHORESIS AND PROTEIN IMMUNODETECTION (WESTERN BLOT)
To obtain total cell protein extracts, cells were washed with PBS and lysed in RIPA buffer
(1% sodium dodecylsulphate, 10 mM ethylene diamine tetraacetic acid (EDTA), 1 % v/v
Triton Tx-100, 150 mM NaCl, 10 mM Na2HPO4, pH 7.0), supplemented with phosphatase
(1 mM Na3VO4, 50 mM NaF) and protease (100 μM phenylmethylsulfonyl fluoride
(PMSF), 50 µg/ml aprotinine, 50 µg/ml leupeptine, 50 μg/ml pepstatin, 50 μg/ml anti-
papain, 50 μg/ml amastatin, 50 μg/ml bestatin and 50 μg/ml soybean trypsin inhibitor)
cocktail inhibitors, and boiled for 5 min. Extracts were then centrifuged at 13,000 x g for
10 minutes and the supernatant transferred to a new tube. Protein concentration was
determined using the commercially available BCA protein assay kit (Pierce, Rockwell,
Illinois, USA).
Aliquots of the cell extracts and a molecular weight marker (PageRuler TM Plus
Prestained Proein Ladder, Thermo Scientific) were loaded in a sodium dodecyl sulfate
(SDS) polyacrylamide gel (acrilamide/bisacrilamide 29/1; BioRad Labortories S.A.,
Alcobendas, Madrid) and subjected to vertical electrophoresis (MiniProtean, Bio-Rad,
Hercules, CA, USA). Proteins were transferred to nitrocellulose membranes (Hybond®,
Amersham Biosciences), blocked with 5% w/v low-fat milk in TTBS (20 mM Tris, 500 mM
NaCl and 0,1 % v/v Tween 20, pH 7.5) for 1 hour at room temperature, and incubated
with the desired primary antibody (see table 3) over night at 4 ºC. GAPDH was used as
loading control.
The following day, membranes were washed 3 times with TTBS and incubated with the
secondary antibody, conjugated with the horseradish peroxidase (HRP), in 2% w/v
bobine serum albumin (BSA) in TTBS for 1 hour at room temperature.

MATERIALS AND METHODS
46
Signal was detected with the enhanced chemiluminescence kit (Pierce, Thermo
Scientific, Waltham, MA, USA) by exposing membranes on a Kodak XAR-5 film (Sigma-
Aldrich). For quantification, auto radiographies were scanned and the bands were
analyzed using image treatment software (NIH Image, Wayne Rasband, National
Institutes of Health, Bethesda, Maryland, USA). Values were expressed as the target
protein/ GAPDH band intensities ratio.
PROTEIN PRIMARY ANTIBODY DILUTION SECONDARY
ANTIBODY DILUTION
PFKFB3 Novus Biologicals
(H00005209-M08) 1/1000
Mouse Anti-IgG Bio-
Rad 1/10000
TIGAR Lifespan Biosciences
(LB-B462) 1/1000
Rabbit Anti-IgG Bio-
Rad 1/10000
PGI
PGI Santa Cruz
Biotechnology (sc-
30392)
1/500 Goat Anti- IgG Santa
Cruz Biotechnology 1/10000
GAPDH Life technologies (Cat#
4300) 1/40000
Mouse Anti-IgG Bio-
Rad 1/10000
G6PD Sigma (A9521) 1/500 Rabbit Anti-IgG Bio-
Rad 1/10000
GFP Abcam (ab290) 1/2000 Rabbit Anti-IgG Bio-
Rad 1/10000
Cdh1 Dr. J. Gannon 1/20 Mouse Anti-IgG Bio-
Rad 1/10000
Phospho
serine Invitrogen (61-8100) 1/500
Rabbit Anti-IgG Bio-
Rad 1/10000
Table 3. Antibodies used for western blot immunodetection.
8. PROTEIN IMMUNOPRECIPITATION.
To obtain total cell protein extracts, cells were washed with PBS and lysed in RIPA buffer
(1% sodium dodecylsulphate, 10 mM ethylene diamine tetraacetic acid (EDTA), 1 % v/v
Triton Tx-100, 150 mM NaCl, 10 mM Na2HPO4, pH 7.0), supplemented with phosphatase

MATERIALS AND METHODS
47
(1 mM Na3VO4, 50 mM NaF) and protease (100 μM phenylmethylsulfonyl fluoride
(PMSF), 50 µg/ml aprotinine, 50 µg/ml leupeptine, 50 μg/ml pepstatin, 50 μg/ml anti-
papain, 50 μg/ml amastatin, 50 μg/ml bestatin and 50 μg/ml soybean trypsin inhibitor)
cocktail inhibitors, and boiled for 5 min. Extracts were then centrifuged at 13,000 x g for
10 minutes and the supernatant transferred to a new tube. Protein concentration was
determined using the commercially available BCA protein assay kit (Pierce, Rockwell,
Illinois, USA).
50 μg of proteins were diluted in a final volume of 200 μl RIPA and incubated with anti-
Cdh1 antibody at 1/10 dilution over night at 4 ºC. The following day, 15 μl of sepharose A
(0.12 g/ml; GE Healthcare) were added to each sample, and incubated for 1 hour at 4
ºC. The samples were then centrifuged (1 min, 4000 rpm) and washed 3 times with
RIPA. Pellet was re-suspended in loading buffer and subjected to the same protocol as a
normal western blot.
9. REVERSE TRANSCRIPTION-PCR (RT-PCR).
Total RNA was purified from neurons using a commercially available kit (Sigma, Saint
Louis, MO, USA). PFKFB3 mRNA expression was analyzed in a 4.5% agarose
(Nusieve) gel electrophoresis after RT-PCR using the oligonucleotides detailed in table
4.
OLIGONUCLEOTIDE SEQUENCE 5’ 3’ Tm
PFKFB3 forward 5’-CCAGCCTCTTGACCCTGATAAATG-3’ 57.8ºC
PFKFB3 reverse 5’-TCCACACGCGGAGGTCCTTCAGAT-3’ 64.6ºC
GAPDH forward 5’-CTGGCGTCTTCACCACCAT-3’ 53.0ºC
GAPDH reverse 5’-AGGGGCCATCCACAGTCTT-3’ 53.1ºC
Table 4. Oligonucleotides employed in PFKFB3 RT-PCR.
Reverse transcription was performed at 48 ºC for 50 min, and PCR conditions were 10
min at 95 ºC, 35 cycles of 1 min at 95 ºC, 1 min at 58 ºC and 30 s at 68 ºC. Final
extension was carried out for 10 min at 72 ºC. In no case was a band detected by PCR
without reverse transcriptase.

MATERIALS AND METHODS
48
10. FLOW CYTOMETRIC ANALYSIS OF APOPTOTIC CELL DEATH
Allophycocyanin (APC Ex/Em 650/660 nm) conjugated annexin-V and 7-
aminoactinomycin D (7-AAD) (Becton Dickinson Biosciences, San Jose, CA, USA) were
used to quantitatively determine the percentage of apoptotic neurons by flow cytometry.
In apoptotic cells, the membrane phospholipid phosphatidylserine (PS) is translocated
from the inner to the outer leaflet of the plasma membrane. Annexin V is a protein that
has a high affinity for PS and binds cells with exposed PS. 7-AAD is a nucleic acid dye
that is used as an indicator of necrotic cells.
After transfection, cells were carefully detached from the plate with EDTA tetrasodium 1
mM and incubated with annexin V- APC and 7-AAD in binding buffer (0.1 M Hepes, 1.4
M NaCl, 25 mM CaCl2) following the manufacturer´s instructions. After 15 minutes of
incubation, GFP, annexin V-APC and 7-AAD signals were detected in channels FL1, FL4
and FL3 respectively in a FACScalibur (BD, Bioscences) flux cytometer and analyzed
using CellQuestTM PRO and Paint-A-Gate TM PRO (BD Bioscences) software. Only
annexin V-APC-stained cells that were 7-AAD-negative were considered apoptotic.
Figure 2: Total cell population
stained with 7AAD and APC-
annexine acquired in the
cytometer. Only annexin V-APC-
stained cells that were 7-AAD-
negative were considered apoptotic
(green).

MATERIALS AND METHODS
49
11. DETECTION OF REACTIVE OXYGEN SPECIES (ROS)
ROS detection was performed using MitoSox-RedTM (Invitrogen), a fluorogenic marker
that selectively binds superoxide anion in live cells mitochondria, exhibiting red
fluorescence when oxidized.
Neurons were incubated with 2 μM MitoSox-RedTM in DMEM for 30 min, washed with
PBS and carefully detached from the plate with 1 mM EDTA tetrasodium. MitoSox-RedTM
fluorescence was then assessed by flow cytometry in a FACScalibur flux cytometer and
analyzed using CellQuestTM PRO and Paint-A-Gate TM PRO (BD Bioscences) software.
12. DETERMINATION OF METABOLITES 12.1. D-GLUCOSE
D-Glucose in the buffer used for PPP and glycolytic flux determination was measured
spectrophotometrically reading the increase in NADPH(H+) absorbance at 340 nm
produced in two consecutive reactions, catalyzed by hexokinase and glucose-6-
phosphate dehydrogenase (G6PD) (Roche diagnostics Corporation, Mannheim,
Germany) after 10 minutes incubation (Bergmeyer et al. 1974).
Reaction buffer was: 2 U/ml Hexokinase, 1 U/ml G6PD, 0.38 mM ATP, 0.38 mM NADP+,
3.8 mM MgCl2 and 38.5 mM Tris-HCl pH 8

MATERIALS AND METHODS
50
12.2. L-LACTATE
L-Lactate was measured spectrophotometrically according to the method of Gutmann
and Wahlefeld (1974). The increase in the absorbance of NADH(H+) produced in the
reaction catalyzed by lactate dehydrogenase (LDH, Roche) was measured in a
Varioskan Flash (Thermo Fischer, Vantaa, Finland) spectrofluorometer at 340 nm after
1 hour incubation.
To assess extracellular lactate concentration, an aliquot of the cell culture or
experimental buffer was obtained after 1.5 h of incubation with the cells. To assess
intracellular lactate concentration, neurons were lysed in 0.6 M NaOH and the resulting
extract de-proteinized with the same volume of 1% w/v ZnSO4.
The reaction buffer was 250 mM glycine, 500 mM hydrazine, 1 mM EDTA, 1 mM NAD+,
22.5 U/ml LDH (pH 9.5).
12.3. GLUCOSE-6-PHOSPHATE (G6P)
G6P was measured spectrophotometrically by determining the increase in NADPH(H+)
absorbance at 340 nm produced in the reaction catalyzed by G6PD. Neurons were
lysed in 0.6 M NaOH and the resulting extract de-proteinized with the same volume of
1% w/v ZnSO4
The reaction buffer consisted of 0.2 M triethanolamine, 5 mM MgCl2, 0.2 mM NADP+,
0.17 U/ml G6PD, pH 7.6.

MATERIALS AND METHODS
51
12.4. GLUTATHIONE
The method is based on GSH oxidation at the expense of DTNB (5,5’-ditio-bis-acid 2-
nitrobenzoic) (Sigma-Aldrich), that is reduced to TNB (λmax= 405 nm). The just-formed
GSSG is then re-generated to GSH at the expenses of NADPH(H+) and glutathione
reductase. This is, therefore, a cyclic reaction which speed is directly dependent on the
amount of total glutathione (GSx).
Cells were washed with ice-cold PBS, lysed in 1 ml of 1% (w/v) sulfosalicilic acid (SSA,
Sigma) per 106 cells and centrifuged at 13,000 x g for 5 minutes. The supernatants were
then placed in a fresh tube in order to determine total glutathione content. An equal
volume of 0.1 M NaOH was added to the same amount of cells to assess protein
concentration. The quantification of GSx was made by extrapolating the sample slope
values to the standard curve (0-50 μM GSSG in 1% w/v SSA). Samples were registered
for a 10 minutes (20 iterations) period at 405 nm.
To determine oxidized glutathione (GSSG), samples or GSSG standards were incubated
with 2-vinylpiridine plus 0.2 mM Tris for 1h at 4 ºC. This reaction protects the sulfhydryl
group of GSH by forming a thioether. Thus, GSH does not react in the determination
assay, and only GSSG is measured in these samples. Absorbance was recorded at 405
nm for a 10 minutes (20 iterations) period in a Varioskan Flash (Thermo Fischer, Vantaa,
Finland) spectrofluorometer. The sample slope values were extrapolated to the standard
curve (0-5 μM GSSG in 1% w/v SSA). Finally, reduced glutathione concentration (GSH)
was calculated from the formula GSx=GSH+2GSSG, according to Tietze (1969).

MATERIALS AND METHODS
52
The reaction buffer consisted of 0.4 mM NADPH(H+) (Sigma-Aldrich), 1 mM EDTA, 0.3
mM DTNB, 0.1 M sodium phosphate buffer pH 7.5 and 1U/ml glutathione reductase
(Sigma-Aldrich).
12.5. FRUCTOSE-2,6-BISPHOSPHATE
F2,6P2 concentration was determined spectrophotometrically according to the method
described by Van Schaftingen (1982). The method consists of measuring the decrease
of NAD+ absorbance at 340 nm every 10 minutes in four consecutive reactions, the first
catalyzed by the phosphofructokinase-pyrophosphate (PPi-PFK; Sigma-Aldrich), the
second catalyzed by aldolase, the third by TIM and the last one catalyzed by glicerol-3-
phosphate dehydrogenase.
Cells were smoothly detached from the plates with 1 mM EDTA tetra-Na+ and
centrifuged at 500 x g for 5 minutes. The pellet was then lysate with 0.1 N and
centrifuged at 4 ºC (20,000 x g, 20 minutes). An aliquot of the homogenate was used for
protein determination; the rest was heated at 80 ºC during 5 minutes and centrifuged
again (20,000 x g, 20 minutes). The supernatant was then used for F2,6P2
determination.
The reaction buffer consisted of: 0.1 M Tris-HCl, 5 mM MgCl2, 2 mM F6P, 0.3 mM
NADH(H+), 0.45 U/ml aldolase, 5 U/ml TIM, 1.7 U/ml glycerol-3-phosphate
dehydrogenase, 0.01 U/ml PPi-PFK (pH 8).
Glycerol-3-phosphate Glycerol-3P-dehydrogenase
TIM
Aldolase

MATERIALS AND METHODS
53
13. PGI ACTIVITY DETERMINATION
PGI activity was determined spectrophotometrically by determining the increase in
NADPH(H+) absorbance at 340 nm every 30 seconds for 5 minutes in total. Cells were
detached with PBS and centrifuged at 500 x g 5min. They were then re-suspended in
lysis buffer (100 mM Tris-HCl, 7 mM MgCl2; pH 7.6), lysated with 3 cycles of
freeze/thawing, centrifuged at 12,000 x g for 5 minutes more and the supernatant stored
at -80 ºC for PGI determination.
The reaction buffer consisted of 100 mM Tris-HCl, 7 mM MgCl2, 0.8 mM NADP+, 0.5 U
G6PD, 4 mM F6P.
Before adding F6P, the samples and the rest of the components of the buffer were
incubated in order to let the G6P present in the sample consume.
14. PFK-1 ACTIVITY DETERMINATION
PFK-1 activity was determined spectrophotometrically by determining the decrease of
NADH(H+) absorbance at 340 nm every 10 seconds for at least 3 minutes in four
consecutive reactions, the first catalyzed by the phosphofructokinase present in the
sample, the second catalyzed by aldolase, the third by TIM and the last one catalyzed by
the glicerol-3-phosphate dehydrogenase.
Cells were detached from the plate with PBS and centrifuged at 500 x g 5min. They were
then re-suspended in storage buffer (20 mM KHPO4, 0.1 mM EDTA 20% glycerol; 10
mM DTT, 0.1 mM PMSF, pH 7.4), lysed with 3 cycles of freeze/thawing, centrifuged at
12,000 x g for 5 minutes more and the supernatant stored at -80 ºC for PFK-1
determination.

MATERIALS AND METHODS
54
The reaction buffer consisted of: 0.1 mM fructose-6-phosphate, 50 mM imidazole, 1 mM
MgCl2, 0.1 mM NADH(H+), 1 mM ATP, 1 μM fructose-2,6-bisphosphate, 0.45 U/ml
aldolase, 5 U/ml TIM, 1.7 U/ml glycerol-3-phosphate dehydrogenase (pH 7.4).
15. GLYCOLYTIC FLUX ASSESMENT
The glycolytic flux was determined in attached cells by determining the production of 3H2O from D-[3-3H]glucose in the reaction catalyzed by aldolase. To do so, cells were
seeded at 250,000 cells/cm2 in the bottom of 25 cm2 flasks. At day 6 in culture, medium
was replaced by a Krebs-Elliott buffer(11 mM Na2HPO4, 122 mM NaCl, 3.1 mM KCl, 0.4
mM KH2PO4, 1. 2 mM MgSO4, 1.3 mM CaCl2; pH 7.4) supplemented with 5 mM D-
glucose and in the presence of 5 μCi/ml of D-[3-3H]glucose. Before sealing the flask with
a rubber cap, a 1.5-ml Eppendorf tube containing 1 ml of water (for 3H2O trapping) was
fixed inside the flask by holding it from the flask tab using a rib (see figure 3). In order to
ensure an adequate O2 supply throughout incubation period, the atmosphere of the
flasks was gassed with an O2:CO2 (95:1) mixture for 20 seconds, before the flasks were
sealed. In preliminary experiments (not shown), we observed that 3H2O release was
linear with time up to 90 minutes, thus, flasks were incubated in a thermostatic orbital
shaker for 90 minutes. After the incubation period, reaction was stopped by adding 0.2
ml of 20% w/v perchloric acid and flasks were incubated for another 96 hours to allow
equilibration of 3H2O. Results were expressed as nmol of D-[3-3H]glucose turned into 3H2O per minute and per mg protein.
Glycerol-3-phosphate Glycerol-3P-dehydrogenase
TIM
Aldolase

MATERIALS AND METHODS
55
The efficiency of 3H2O trapping in the eppendorf tube was determined to be a 28%. To
do so, known μCi of 3H2O were added to the experimental buffer in the bottom of the
flask. Samples were then incubated for 90 minutes and further left stabilizing for 96
hours after perchloric acid addition. Total μCi in the eppendorf tube where then
measured for calculating the percentage of 3H2O trapped, which was taken in account for
the calculations.
Figure3. Schematic representation of the method for PPP and glycolytic flux determination in
attached cells. Cells were seeded at 250,000/ cm2 on the bottom of the flask. At day 6 in culture
the medium was removed and replaced by experimental buffer plus D-[3-3H]glucose for glycolytic
measurements or D-[1-14C]glucose or D-[6-14C] for PPP measurements. Hiamine (PPP) or H2O
(glycolysis) was added in the central well. The flask was then supplied with a O2:CO2 (95:1)
mixture and sealed with a rubber stopper. After 90 minutes the reaction was stopped by injecting
0.2 ml of 20% w/v perchloric acid.
16. PENTOSE-PHOSPHATE PATHWAY (PPP) FLUX MEASUREMENTS
The PPP was measured in attached cells by determining the difference of 14 CO2
produced from D-[1-14C]glucose, metabolized both in the tricarboxylic acid cycle and 6-
phosphogluconate dehydrogenase reaction in the PPP and the 14CO2 produced from D-
[6-14C]glucose, metabolized only in the tricarboxylic acid cycle, in the reactions catalyzed

MATERIALS AND METHODS
56
by isocitrate dehydrogenase and α-ketoglutarate dehydrogenase (see figure 4). To do
so, cells were seeded at 250,000 cells/cm2 in the bottom of 25 cm2 flasks. At day 6 in
culture, medium was replaced by a Krebs–Elliott buffer(11 mM Na2HPO4, 122 mM NaCl,
3.1 mM KCl, 0.4 mM KH2PO4, 1. 2 mM MgSO4, 1.3 mM CaCl2; pH 7.4) supplemented
with 5 mM D-glucose and in the presence of 0.5 μCi/ml of either D-[1-14C]glucose or D-
[6-14C]glucose. Before sealing the flask with a rubber cap, a 1.5-ml Eppendorf tube
containing 0.8 ml of benzetonium hidroxyde (Sigma-Aldrich) for 14 CO2 trappping was
fixed inside the flask by holding it from the flask tab using a rib (see figure 3). In order to
ensure an adequate O2 supply throughout incubation period, the atmosphere of the
flasks was gassed with an O2:CO2 (95:1) mixture for 20 seconds, before the flasks were
sealed. In preliminary experiments (not shown), we observed that 14CO2 release was
linear with time up to 90 minutes, thus, flasks were incubated in a thermostatic orbital
shaker for 90 minutes. After the incubation period, reaction was stopped by adding 0.2
ml of 20% w/v perchloric acid and flasks were incubated for another 90 minutes to allow 14CO2 trapping by the benzetonium hydroxide. Results were expressed as nmol of
glucose turned into 14CO2 per minute and per mg protein.
The efficiency of 14CO2 trapping by the benzetonium hydroxide was determined to be a
75%. To do so, known μCi of NaH14CO3 were added to the experimental buffer in the
bottom of the flask. Samples were then incubated for 90 minutes and further left
stabilizing for 90 minutes more after perchloric acid addition. Total μCi in the eppendorf
tube where then measured for calculating the percentage of 14 CO2 trapped, which was
taken in account for the calculations.

MATERIALS AND METHODS
57

MATERIALS AND METHODS
58
Figure 4. Schematic representations of the fate of the radiolabeled carbons used for the PPP flux
assessment. D-[1-14C] glucose is decarboxylated in the reaction catalyzed by 6-
phosphogluconate dehydrogenase. D-[6-14C] glucose that enters PPP is transformed back into
GAP or F6P in the non-oxidative branch of PPP. D-[6-14C] glucose and D-[1-14C] glucose can also
enter glycolysis. After their transformation in DHAP and GAP they are indistinguishable and will
be further decarboxylated in the different turns of the TCA in the reactions catalyzed by isocitrate
dehydrogenase and α-ketoglutarate dehydrogenase.

MATERIALS AND METHODS
59
17. IMMUNOCYTOCHEMISTRY Neurons were grown on glass coverslips. At day 6 in culture they were fixed with 4%
paraformaldehyde (v/v) in PBS for 20 min and washed with phosphate buffered saline
(PBS, 136 mM NaCl, 2.7 mM KCl, 7.8 mM Na2HPO4 2H2O, 1.7 mM KH2PO4 pH 7.4).
They were then incubated in 5% goat serum, 1% BSA PBS-Tx 0.2% for 1h at room
temperature. Afterwards they were incubated with the TIGAR primary antibody in 2%
goat serum, 1% BSA, PBS-Tx 0.2% overnight at 4ºC. They following day they were
washed with PBS-Tx 0.2% and incubated with the secondary antibody (rabbit anti IgG
(H+L) conjugated with Alexa 488, Molecular Probes, Invitrogen, Ref A11008 at 1/500
dilution) and the nuclear marker either DAPI (Sigma, Ref D9542, 1/1000) or TOPRO-3
(Invitrogen, Ref T3605, 1/1000) in 2% goat serum, 1% BSA, PBS-Tx 0.2% for 1 hour at
room temperature. Glass coverslips were then placed on a glass slide using SlowFade®
(Molecular Probes, Oregón, USA) in order to avoid fluorescence loss. Confocal
microscopy images were obtained using a Leica SP5 microscope (DMI-6000B model;
Leica Microsystems GmbH, Wetzlar, Germany) and processed with photoshop cs5
software.
18. CONFOCAL MICROSCOPY OF TRANSFECTED CELLS.
Neurons were grown on glass coverslips. After transfections and treatments they were
fixed with 4% paraformaldehyde (v/v) in PBS for 20 min and incubated with DAPI (30
μM; Sigma) for 10 minutes at room temperature. Glass coverslips were then placed on a
glass slide using SlowFade® (Molecular Probes, Oregón, USA) in order to avoid
fluorescence loss. Confocal microscopy images were obtained using a Leica SP5
microscope (DMI-6000B model; Leica Microsystems GmbH, Wetzlar, Germany) and
processed with photoshop cs5 software.
19. STATISTICAL ANALYSIS.
Measurements from individual cultures were always carried out in triplicate. The results
are expressed as mean ± S.E.M. (standard error of the mean) values for three different
culture preparations. Statistical analysis of the results was performed by one-way

MATERIALS AND METHODS
60
analysis of variance (ANOVA), followed by the least significant difference multiple range
test. In all cases, P<0.05 was considered significant.

61
4. RESULTS

62

RESULTS
63
1. GLYCOLYTIC FLUX INCREASES BY INHIBITING PENTOSE-PHOSPHATE PATHWAY (PPP) OR MITOCHONDRIAL PYRUVATE UPTAKE IN NEURONS.
In order to ascertain whether glucose metabolism is dynamic in neurons, we first set up a
new protocol aimed to investigate glucose metabolizing pathways in intact, cultured
primary neurons. The rate of glucose metabolized through glycolysis was measured by
determining the rate of 3H2O production from [3-3H]glucose, a process that occurs at
aldolase, i.e. the glycolytic step that immediately follows the rate-limiting, PFK1-
catalyzed reaction. Using this approach, we estimated that neurons, under resting
conditions, metabolized glucose through glycolysis at a rate of ~1.2 nmol/min x mg
protein (Fig. 1). Incubation of neurons with dehydroepiandrosterone (DHEA; 1 μM), a
well-known inhibitor of G6PD –the rate-limiting step of PPP–, acutely increased ~100%
the rate of glycolysis (Fig. 1). Incubation of neurons with 4-hydroxy-α-cyanocinnamate
(HCN; 0.1 mM), a compound that, at the concentration used selectively inhibits
mitochondrial uptake of pyruvate, also acutely increased ~150% the rate of glycolysis
(Fig. 1). Thus, the flux of glucose metabolism through glycolysis in neurons is a process
amenable to regulation. Moreover, these results suggest that a considerable proportion
(~50%) of glucose entering neurons is metabolized through the PPP.
Figure 1. Glycolytic rate is significantly
increased upon DHEA and HCN treatments.
Neurons at day 6 in culture were incubated
in experimental buffer containing 5 μCi/ml of
D-[3-3H] glucose plus either 1 μM DHEA or
0.1 mM HCN. Glycolytic rate was assessed
by the determination of [3-3H] glucose
incorporation into 3H2O during the 90
minutes incubation of the experiment.
*P<0.05 (ANOVA)(n=3).

RESULTS
64
2. THE RATE OF GLUCOSE OXIDIZED THROUGH THE PPP IS INHIBITED BY DHEA AND NOT BY HCN.
At the light of the previous results, we next aimed to directly determine the rate of
glucose oxidized through the PPP in neurons. To do so, intact primary neurons in culture
were incubated either in the presence of [1-14C]glucose or [6-14C]glucose, and the 14CO2
released was quantitatively trapped and measured. 14CO2 released from [1-14C]glucose
reflects 6PG decarboxylation at 6-phosphogluconate dehydrogenase (6PGD) plus
acetyl-CoA decarboxylation at isocitrate dehydrogenase and α-ketogluratae
dehydrogenase of the TCA. However, 14CO2 released from [6-14C] glucose exclusively
reflects acetyl-CoA decarboxylation at isocitrate dehydrogenase and α-ketogluratae
dehydrogenase of the TCA. Thus, the difference between 14CO2 released from [1-14C]glucose and that of [6-14C]glucose is often used as an estimation of glucose oxidized
through the PPP. As shown in Fig. 2a, the rate of glucose oxidized through the PPP was
estimated to be ~0.2 nmol/min x mg protein; furthermore, incubation of neurons with
DHEA inhibited by 50% the estimated rate of PPP (Fig. 2a). As expected, the rate of
PPP was unaffected by HCN (Fig. 2a). When examined 14CO2 collected from [1-14C]glucose and [6-14C]glucose independently we observed that 14CO2 collected from [1-14C]glucose was unchanged by either treatment (Fig. 2b), whereas 14CO2 collected from
[6-14C]glucose dramatically decreased by HCN but was unchanged by DHEA (Fig. 2c).
These results indicate that 14CO2 collection from [6-14C]glucose is an excellent estimation
of glucose that, being converted into acetyl-CoA, is oxidized at the TCA. Furthermore,
the lack of effect of DHEA on 14CO2 released from [1-14C]glucose (Figs. 2b,c) suggests
that this value may be underestimated. Indeed, according to the results shown in Fig. 1,
DHEA increased glycolysis by ~1.2 nmol/min x mg protein, whereas it decreased PPP by
only ~0.1 nm/min x mg protein (Fig. 2a). These results indicate that the extent of PPP
activity determined in neurons using this approach appears to be largely underestimated.

RESULTS
65
Figure 2. a) PPP rate is significantly decreased upon DHEA treatment. Neurons at day 6
in culture were incubated in experimental buffer containing 0.5 μCi/ml of either D-[1-14C]glucose or D-[6-14C] for 90 minutes and PPP rate was assessed by the determination
of the difference between 14CO2 produced by [1-14C]glucose and that of [6-14C]glucose.
b) 14CO2 produced by [1-14C]glucose remains unchanged. c) 14CO2 produced by [6-14C]glucose is almost absent in HCN treated neurons, which accounts for the

RESULTS
66
effectiveness of HCN in pyruvate transport to the mitochondria blockade. *P<0.05 (ANOVA)(n=3).
3. PHOSPHOGLUCOSE ISOMERASE (PGI) IS A HIGHLY ACTIVE ENZYME IN NEURONS.
As an attempt to understand the low 14CO2 collection from [1-14C] glucose in neurons, we
reasoned that, after decarboxylation of the only radiolabelled carbon of G6P (C1) at
6PGD, F6P regenerated from the non-oxidative branch of the PPP is non-radioactive.
Thus, provided that F6P is converted back into G6P at the expense of PGI, the
radioactive G6P pool would be dramatically reduced. In view that ascertaining the
specific radioactivity of intracellular G6P in neurons incubated with [1-14C] glucose is,
technically, rather difficult, we measured the specific activity of PGI. As shown in Fig. 3,
PGI specific activity was as high as that of PFK-1. However, the flux of F6P through
PFK-1 is limited in neurons by the synthesis of its positive effector, fructose-2,6-
bisphosphate (F2,6P2), whereas PGI is a near-equilibrium enzyme. Thus, the direction of
PGI activity exclusively relies on the relative concentrations of G6P and F6P.
Accordingly, it is feasible that a large proportion of F6P returning from the PPP would be
converted back into G6P, thus contributing to G6P isotopic dilution resulting in an
apparently low 14CO2 released from [1-14C] glucose.
Figure3. PGI presents a similar activity to
that observed for PFK-1 in neurons.
Neurons at 6 days in culture were re-
suspended and lysated with 3 cycles of
freezing/thawing. The extract was then
used for PGI and PFK-1 activities
determination.

RESULTS
67
4. KNOCK-DOWN OF PGI INCREASES PPP ACTIVITY
We next aimed to more directly test whether PGI activity, acting on its reversal mode
(i..e, F6P to G6P), would maintain a high PPP activity in neurons despite not being
accounted for the low 14CO2 released from [1-14C]glucose. To do so, and in view that
there is no known selective inhibitor of PGI activity, we implemented a RNA interfering
(RNAi) strategy to knock-down PGI in primary neurons. At day 3 in vitro, cells were
transfected with a small interfering RNA (siRNA) targeted against PGI (siPGI), which was
previously validated as shown in Fig. 4a. Three days later, when PGI protein abundance
decreased by ~70%, neurons were used to assess the rate of 14CO2 release from either
[1-14C]glucose and [6-14C]glucose. As observed in Fig. 4b, the rate of PPP, as assessed
by the difference between the rates of 14CO2 collected from both radiolabelled glucoses,
increased significantly by siPGI. This result is compatible with the notion that [1-14C]G6P
specific radioactivity is considerably diluted by the return of “cold” (i.e., non-radioactive)
F6P into the G6P pool, thus explaining the underestimation of the actual rate of PPP
activity. Furthermore, it indicates that the PPP in neurons actively uses PGI activity to re-
cycle G6P. It should be mentioned that siPGI caused no net increase in the rate of 14CO2
released from [1-14C]glucose by siPGI (Fig. 4c) while 14CO2 released from [6-14C]glucose
significantly decreased (Fig. 4d) indicating inhibition of G6P flux through glycolysis. In
fact, due to the near-equilibrium nature of PGI, inhibition of PGI activity by siPGI would
not only affect F6P conversion into G6P, but also vice-versa. Together, these data
strongly, suggest that glucose entering neurons is actively oxidized through the PPP at
the expense of G6P re-cycled from PPP-derived F6P. However, due to isotopic dilution
of G6P, the actual value of the glucose proportion entering the PPP is, so far, impossible
to be directly determined, at least using this approach.
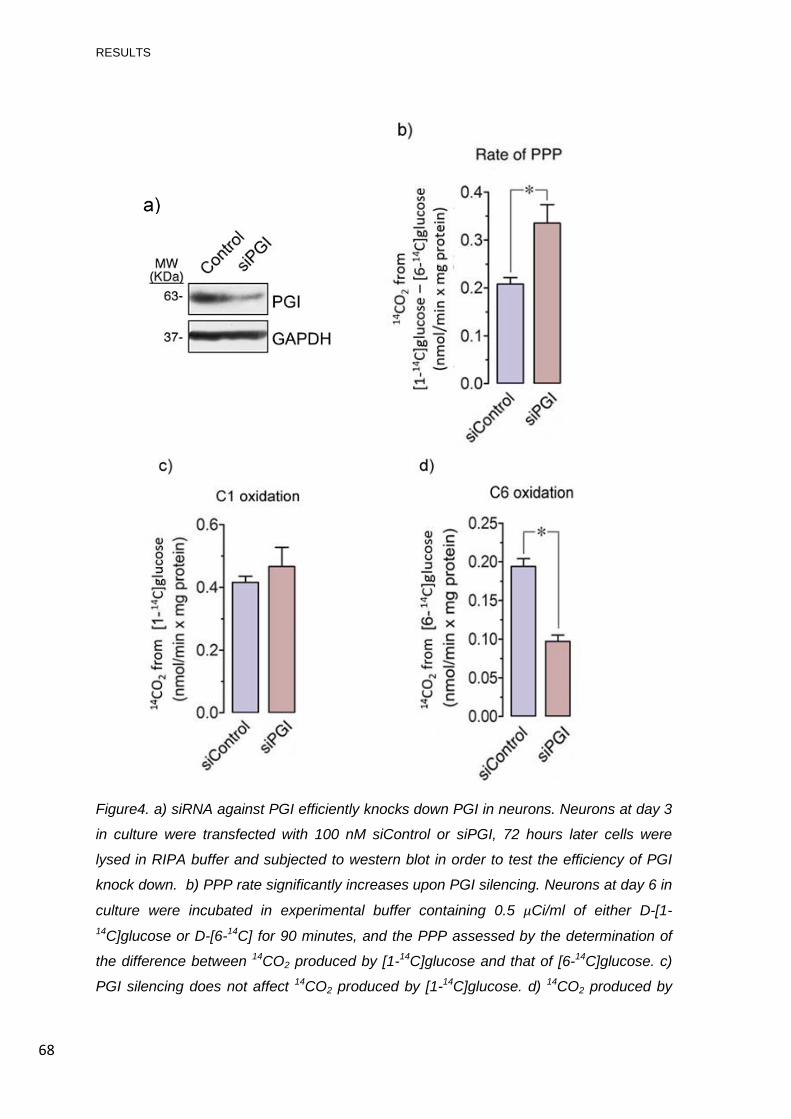
RESULTS
68
Figure4. a) siRNA against PGI efficiently knocks down PGI in neurons. Neurons at day 3
in culture were transfected with 100 nM siControl or siPGI, 72 hours later cells were
lysed in RIPA buffer and subjected to western blot in order to test the efficiency of PGI
knock down. b) PPP rate significantly increases upon PGI silencing. Neurons at day 6 in
culture were incubated in experimental buffer containing 0.5 μCi/ml of either D-[1-14C]glucose or D-[6-14C] for 90 minutes, and the PPP assessed by the determination of
the difference between 14CO2 produced by [1-14C]glucose and that of [6-14C]glucose. c)
PGI silencing does not affect 14CO2 produced by [1-14C]glucose. d) 14CO2 produced by

RESULTS
69
[6-14C]glucose C6 oxidation is significantly decreased upon PGI silencing *P<0.05 (ANOVA)(n=3).
5. EFFECT OF DHEA AND HCN ON GLUCOSE-6-PHOSPHATE CONCENTRATION
To further understand how the PPP is dynamically coupled with glycolysis in neurons, we
next investigated the effects of inhibition of PPP and mitochondrial pyruvate uptake on
the concentrations of G6P. As shown in Fig. 5, G6P accumulated by ~3.5-fold upon
DHEA-mediated inhibition of the PPP rate-limiting enzyme, G6PD. This result strongly
suggests a highly active flux of G6P into the PPP in neurons. In contrast, HCN-mediated
inhibition of glucose-derived pyruvate oxidation at the TCA by HCN did not affect G6P
concentrations (Fig. 5).
6. EFFECT OF DHEA AND HCN ON EXTRACELLULAR AND INTRACELLULAR LACTATE CONCENTRATIONS
To further understand the impact of PPP inhibition on the intermediary metabolism of
neurons, we investigated both intracellular and extracellular lactate concentrations.
Inhibition of PPP activity by the G6PD inhibitor DHEA did not affect lactate
concentrations, either extracellular (Fig. 6a) or intracellular (Fig. 6b); however, as shown
Figure 5. G6P is highly accumulated upon
DHEA-mediated inhibition of G6PD, but is
unaffected by HCN. Neurons at 6 days in
culture were incubated with 1 μM DHEA or 0.1
mM HCN for 90 minutes. Cells were then lysed
in 0.6M NaOH and the resulting extract de-
proteinized with the same volume of 1% w/v
ZnSO4 and used for G6P quantification.
*P<0.05 (ANOVA)(n=3).

RESULTS
70
above, DHEA significantly increased the rate of glycolysis (Fig. 1a) and the rate of [6-14C]glucose oxidation at the TCA (Fig. 2b), thus indicating that the putative increase in
pyruvate by PPP inhibition does not accumulate, but is consumed through the TCA
activity (Fig. 2b) and, possibly, converted into alanine. In fact, inhibition of pyruvate
uptake into mitochondria by HCN increased the release of lactate (Fig. 6a), thus resulting
in unchanged intracellular lactate (Fig. 6b).
Figure 6. a) Lactate released to the medium is increased upon HCN treatment, indicating
that part of the pyruvate that cannot enter the mitochondria is being derived to lactate.
Neurons at 6 days in culture were incubated with 1 μM DHEA or 0.1 mM HCN for 90
minutes after which an aliquot of the experimental buffer was obtained for extracellular
lactate measurement. b) Intracellular lactate levels remain constant, what suggests that
most part of the excess lactate generated upon HCN treatment is being released to the
medium. Neurons at 6 days in culture were incubated with 1 μM DHEA or 0.1 mM HCN
for 90 minutes. Neurons were then lysed in 0.6M NaOH and the resulting extract de-
proteinized with the same volume of 1% w/v ZnSO4 for intracellular lactate measurment.
*P<0.05 (ANOVA)(n=3).

RESULTS
71
7. CORTICAL PRIMARY NEURONS RESPOND TO GLUTAMATE RECEPTORS ACTIVATION BY INCREASING INTRACELLULAR Ca2+ LEVELS.
Altogether, our results therefore indicate that glucose metabolism in neurons is a highly
dynamic process that can be easily manipulated and detected in cultured intact primary
neurons. Moreover, our data also indicate that, besides glycolysis, a considerable
proportion of glucose entering neurons is oxidized through the PPP. However, the
current method to directly assess the PPP activity is intrinsically misleading, which leads
to a strong underestimation of the actual values of the rate of PPP in neurons.
Nevertheless, in view that at the light of our data glycolysis and PPP are highly dynamic
in neurons, we next aimed to investigate whether these glucose-metabolizing pathways
can be endogenously modulated by physiological neurotransmitter-mediated stimuli.
To do so, we focused on glutamate receptor-mediated stimuli, since rat cortical neurons
in culture are known to be predominantly glutamatergic. To ascertain whether neurons at
6 days in vitro expressed functional glutamate receptors, the changes in intracellular
Ca2+ levels using the fluorescent Ca2+-probe, Fura-2, were registered. This method
determines Fura-2-dependent fluorescence emitted at 510 nm obtained after excitation
at 335/363 nm (F335/F363 ratio), a signal that is directly proportional to intracellular Ca2+
levels. As shown in Fig. 7a, incubation of neurons with glutamate (100 µM) immediately
increased Fura-2 fluorescence, suggesting Ca2+ entry into neurons through the
ionotropic glutamate receptors; this effect was maintained for at least 1 minute, although
we observed that the increased Fura-2 fluorescence was maintained for several hours
(not shown). The increase in Fura-2 fluorescence was partially prevented by the well-
known N-methyl-D-aspartate (NMDA) receptor (NMDAR) antagonist, MK-801 (1 µM).
This indicates that a considerable proportion (~60%) of glutamate-mediated Ca2+ entry
was due to NMDA receptor activation. As expected, incubation of neurons with
glutamate in the presence of the Ca2+-free experimental buffer, which contains the Ca2+
quelator ethylene glycol tetraacetic acid (1 mM EGTA), abolished the changes in 510 nm
emissions (Fig. 7a). To further test that these neurons expressed functional NMDAR,
Fura-2 fluorescence was also registered in the presence of NMDA. As shown in Fig. 7b,
NMDA triggered an increase in the intracellular Ca2+-mediated signal to a similar level of
that observed with glutamate. Moreover, this effect was prevented by ~90% with MK-801
(Fig. 7b), and fully abolished by EGTA (Fig. 7b). Thus, the rat cortical neurons used in

RESULTS
72
this study express functional NMDA subtype of glutamate receptors, therefore being
suitable to investigate the metabolic effects of this neurotransmitter.
Figure7. Incubation of rat primary cortical neurons at day 6 in culture with glutamate (a)
or NMDA (b) increased the ratio of Fura-2-dependent fluorescence (at 510 nm) obtained
after excitation at 335/363 nm (F335/F363), indicating an increase in intracellular Ca2+.
MK801 (10 μM) partially prevented glutamate-induced changes in F335/F363 ratio and
most of NMDA-dependent F335/F363 ratio changes. Ca2+-free experimental buffer
containing 1 mM EGTA, fully prevented the changes in 510 nm emissions both in NMDA
and glutamate-treated neurons.

RESULTS
73
8. NMDAR STIMULATION PROMOTES PROTEIN STABILIZATION OF THE GLYCOLYTIC-PROMOTING ENZYME PFKFB3 IN NEURONS.
Previous results from our laboratories demonstrated that NMDAR stimulation activates
cyclin-dependent kinase 5 (Cdk5) through a Ca2+-calpain-p25-mediated mechanism. In
turn, Cdk5 hyperphosphorylates Cdh1, the anaphase-promoting complex/cyclosome
(APC/C) co-activator causing the release of Cdh1 from the complex, thus inhibiting its E3
ubiquitylating activity. In view that we had also shown that the key glycolytic-promoting
enzyme, PFKFB3, is an APC/C-Cdh1 substrate, we reasoned that NMDAR stimulation,
through inhibition of APC/C-Cdh1, should stabilize PFKFB3. To test this hypothesis, we
incubated neurons with glutamate (100 μM) to stimulate NMDAR for 15 minutes, cells
were washed and further incubated in culture medium; in these, we analyzed Cdh1
phosphorylated status and protein levels of PFKFB3 were analyzed at different time
points by western blotting. To test Cdh1 phosphorylation, Cdh1 was immunoprecipitated
from neuronal protein lysates 6 h after glutamate treatment, and the immunoprecipitate
subjected to western blotting against an anti-phosphoserine antibody. As shown in Fig.
8a, glutamate treatment triggered, as expected, an increase in phosphorylated Cdh1, an
effect that was fully prevented by MK801. This indicates that under these conditions,
NMDAR stimulation inhibits APC/C-Cdh1 activity according to our previous observations.
Analysis of PFKFB3 protein by western blotting revealed that glutamate treatment
triggered a time-dependent increase in PFKFB3, an effect that was maximal (~2.1-fold
higher) after 6 h (Fig. 8b). To test whether this effect was mediated by NMDAR, neurons
were incubated with NMDA (100 μM for 15 min), and PFKFB3 protein levels analyzed 6
h later. As depicted in Figure 8c, NMDA mimicked glutamate at increasing PFKFB3;
moreover, incubation of neurons with MK801 prevented glutamate-mediated increase in
PFKFB3 after 6 hours (Figure 8d). Together, these data indicate that NMDAR stimulation
inhibits APC/C-Cdh1 activity leading to PFKFB3 protein stabilization in primary neurons.

RESULTS
74
Figure 8. a) Cdh1 is phosphorylated 6 h after glutamate treatment (100 μM/15 min), an
effect that was prevented by MK801 (10 μM). b) Incubation of neurons with glutamate
(100 μM/15 min) triggered time-dependent increase in PFKFB3 protein, which was
maximal after 6 h. c) NMDA (100 μM/15 min) mimicked glutamate at increasing PFKFB3.
d) NMDA receptor antagonist, MK801 (10 μM), prevented glutamate-mediated increase
in PFKFB3.
9. NMDAR STIMULATION DOES NOT ALTER THE PFKFB3 mRNA LEVELS IN NEURONS.
To elucidate whether the increase in PFKFB3 protein abundance could be due to any
transcriptional effect, the PFKFB3 mRNA levels were analyzed by reverse transcription-
PCR after 2 and 6 hours of glutamate (100 μM/15 min) treatment of neurons at 6 days in
culture. As shown in Fig. 9, the PFKFB3 mRNA levels remained unchanged after
NMDAR stimulation, suggesting that PFKFB3 protein accumulation was not a
consequence of increased PFKFB3 gene transcription or PFKFB3 mRNA stabilization.
Rather, our data strongly suggest that the increase in PFKFB protein abundance by
NMDAR stimulation was due to protein stabilization.

RESULTS
75
Figure 9. Glutamate (100 μM/15 min) did not change PFKFB3 mRNA levels, as revealed
by the unaltered intensity of the predicted 300 bp band after reverse-transcription of total
RNA samples, followed by polymerase chain reaction (RT-PCR) using specific
oligonucleotides for PFKFB3; GAPDH (279 bp band) was used as loading control; the
black/white inverted images of the agarose gels are shown; w/o RT, RT-PCR for
PFKFB3 without reverse transcriptase.
10. NMDAR STIMULATION TRIGGERS NUCLEUS-TO-CYTOSOL PFKFB3 TRANSLOCATION
In view that our data indicate that PFKFB3 protein is continuously degraded by APC/C-
Cdh1 activity, and that active APC/C-Cdh1 is thought to be confined in the nucleus, we
next aimed to investigate the intracellular localization of PFKFB3 protein. We first tried to
ascertain this issue using the endogenous accumulation of PFKFB3 after NMDAR
stimulation. Unfortunately, the results were not conclusive in view that i) the antibody
against PFKFB3 is not useful for immunocytochemistry, and ii) the low abundance of
endogenous PFKFB3 in neurons makes it to be hardly detectable (not shown). To
circumvent this drawback, we decided to register changes in PFKFB3 localization using
expressed green fluorescent protein (GFP)-PFKFB3 fusion protein. To do so, we
designed and constructed two versions of GFP-PFKFB3 fusion cDNAs, namely i) the
wild type one (PFKFB3), and ii) a mutant form in which the motif responsible for PFKFB3
destabilization (142Lys-Glu-Asn or KEN box), was replaced by 142Ala-Ala-Ala (AAA)
(mutPFKFB3). Thus, the mutant form of PFKFB3 would not be expected to be
recognized by Cdh1 for APC/C-Cdh1 ubiquitylation, hence being constitutively stable.
Neurons were, thus, transfected with low amounts (0.16 μg per well) of either GFP-fusion
plasmid DNA vectors (PFKFB3 or mutPFKFB3), and the intracellular localization of the

RESULTS
76
expressed proteins analyzed by confocal microscopy. As shown in Fig. 10a, expression
of wild type PFKFB3 cDNA confined PFKFB3 protein to the nucleus, as judged by the
co-localization of GFP fluorescence with nuclear staining with DAPI. However,
expression of the mutant form of PFKFB3 insensitive to APC/C-Cdh1 yielded a spread
PFKFB3 protein localization, indicating the presence of PFKFB3 protein outside the
nucleus (Fig. 10a). Quantification of these observations revealed the preferential nuclear
localization of wild type PFKFB3 protein, and the preferential cytoplasmic expression of
mutPFKFB3 (Fig, 10b). Treatment of neurons with glutamate (100 µM / 15 min) led
PFKFB3, after 6 h, to spread throughout the cytoplasm (Fig. 10a, b); interestingly, this
spread localization of PFKFB3 was prevented by Cdh1 over-expression (Fig. 10a,b),
confining PFKFB3 to the nucleus. Together, these results indicate that PFKFB3 protein
is localized in the nucleus, where is it targeted for degradation by APC/C-Cdh1; however,
glutamate treatment, by inhibiting APC/C-Cdh1 activity, stabilizes PFKFB3, which leaves
the nucleus. Whether these changes in PFKFB3 stability and subcellular localization are
able to alter the flux of glucose through glycolysis, were our next objective.

RESULTS
77

RESULTS
78
Figure 10. a) Confocal microscopy images of neurons transfected with GFP-PFKFB3
reveals its nuclear localization. Glutamate promotes PFKFB3 accumulation, as revealed
by its spread (nuclear plus cytosolic) localization; Cdh1 overexpression prevented this
effect. GFP-PFKFB3, mutated on its KEN box (KEN-AAA; mut-PFKFB3) showed the
spread-like localization, regardless of glutamate treatment. b) Percentage of neurons
showing nuclear or spread GFP-PFKFB3 localization; these data were obtained by
analyzing ~30 neurons per condition per neuronal preparation (n=4). *P<0.05 versus the
corresponding (nuclear or cytoplasmic) PFKFB3-none condition (ANOVA).
11. NMDAR STIMULATION INCREASES THE RATE OF GLYCOLYSIS AND DECREASES THE RATE OF PPP THROUGH PFKFB3.
PFKFB3 activity, by synthesizing F26BP, is known to promote glycolysis in neurons. In
view that NMDAR triggered PFKFB3 protein stabilization, we next aimed to elucidate
whether this effect exerted functional consequences. To do so, the rate of glycolysis was
determined in neurons 6 h after NMDAR stimulation using the conversion of [3-3H]glucose into 3H2O. As shown in Fig. 11a, NMDAR stimulation led neurons to an
increase in the rate of glycolysis; furthermore, to ensure that this effect was due to
PFKFB3 stabilization, we designed a siRNA targeted against PFKFB3 (siPFKFB3),
which efficiency was first tested by western blotting. To do so, the GFP-PFKFB3
construct was expressed in neurons, which resulted in PFKFB3 accumulation as judged
by the band intensity using an anti-GFP antibody (Fig 11b); however, transfection of
neurons with the siPFKFB3 decreased PFKFB3 abundance (Fig. 11b). Furthermore,
glutamate treatment triggered an increase in the GFP-PFKFB3 band intensity,
suggesting PFKFB3 stabilization, an effect that was also prevented by siPFKFB3 (Fig
11b). These results indicate the efficacy of the siPFKFB3 strategy. As shown in Fig. 11a,
the increase in the rate of glycolysis triggered by glutamate was prevented in neurons
previously transfected with the siPFKFB3, indicating that PFKFB3 stabilization was
responsible for the increase in the rate of glycolysis. Furthermore, in view that our
previous results showed that glycolysis and PPP are dynamically coupled in neurons
(see Figs. 1 and 2), we also investigated whether NMDAR-mediated increase in the rate
of glycolysis affected the rate of PPP. As shown in Fig. 11c, neurons treated with
glutamate (100 µM / 15 min) showed, 6 h later, a significant reduction in the rate of
glucose oxidation through the PPP, an effect that was wholly prevented by siPFKFB3.

RESULTS
79
Thus, our results indicate that NMDAR stimulation in neurons triggers a Ca2+-mediated
inhibition of APC/C-Cdh1 activity leading to PFKFB3 stabilization in the cytosol leading to
a shift of glucose metabolism consisting of glycolysis activation and PPP inhibition.
Figure 11. a) Incubation of neurons with glutamate (100 μM/15 min) increased, after 6 h,
the rate of glycolysis, as assessed by the determination of [3-3H]glucose incorporation
into 3H2O; this effect was abolished by preventing PFKFB3 accumulation in neurons

RESULTS
80
previously transfected with siPFKFB3. b) Incubation of GFP-PFKFB3-expressing
neurons with glutamate (100 μM/15 min) induced, 6 h after treatment, PFKFB3
accumulation in siRNAControl (100nM) treated neurons, as revealed by an anti-GFP
(Flag) antibody; transfection of neurons with an siPFKFB3 (100nM) efficiently reduced
PFKFB3 protein and prevented glutamate-induced PFKFB3 accumulation. c) Glutamate
treatment decreased, after 6 h, the rate of the PPP, as assessed by the determination of
the difference between 14CO2 produced by [1-14C]glucose and that of [6-14C]glucose; this
effect was abolished by siPFKFB3. *P<0.05 (ANOVA)(n=3).
12. NMDAR STIMULATION LEADS TO IMPAIRMENT OF GLUTATHIONE REGENERATION THAT IS MEDIATED BY PFKFB3 STABILIZATION.
Glucose oxidation through the PPP regenerates NADPH(H+), a cofactor of several
important enzymes including glutathione reductase. Glutathione reductase requires
continuous supply of NADPH(H+) to regenerate glutathione (GSH) from its oxidized form,
glutathione disulfide (GSSG). Accordingly, in view that NMDAR stimulation led to an
increase in glycolysis leading to reduced PPP activity, we reasoned whether the
decreased PPP activity would result in the impairment in the ability of neurons to
regenerate GSG from GSSG. To do so, we analyzed total (GSx) and oxidized (GSSG)
glutathione in neurons 6 h after NMDAR stimulation. As shown in Fig. 12, glutamate
treatment did not alter total glutathione concentration, but significantly increased its
oxidized form; this caused an increase in the oxidized versus total oxidized glutathione
(GSSG/GSx) ratio, a well-known index of the oxidized glutathione redox status. All these
changes were partially prevented by siPFKFB3, indicating that they were, at least in part,
caused by PFKFB3 stabilization after NMDAR stimulation.

RESULTS
81
Figure 12. Glutamate treatment did not change GSx (left panel), but it increased GSSG
(middle panel) and the oxidized glutathione redox status (GSSG/GSx; right panel); these
effects were partially prevented by siPFKFB3.Neurons at day 3 in culture were
transfected either with siControl or siPFKFB3 (100 nM). At day 6 they were treated with
glutamate (100 μM/15 min) and the cell extracts used for glutathione determination.
*P<0.05 (ANOVA)(n=3).
13. THE PPP TO GLYCOLYSIS SHIFT CAUSED BY NMDAR STIMULATION TRIGGERS OXIDATIVE STRESS
In view that reduced glutathione is known to be essential in the detoxification of
mitochondrial reactive oxygen species (ROS), we reasoned that the NMDAR-mediated
increase in oxidized glutathione would result in oxidative stress. To assess this issue, we
analyzed the abundance of mitochondrial ROS using the specific probe, MitoSox, which
determines mitochondrial superoxide anion abundance (O2•–). As shown in Fig. 13a,
treatment of neurons with glutamate (100 µM / 15 min) triggered, after 16 h, a significant
increase in mitochondrial superoxide, suggesting oxidative stress. Furthermore, this
effect was mostly prevented by knocking down PGI with siPGI (Fig. 13a), a treatment
that, on our hands, was able to increase the rate of PPP as shown in Fig. 4b.
Furthermore, to test if this effect was a consequence of increased glycolysis, we knocked
down PFKFB3 and, thereafter, treated neurons with glutamate. As shown in Fig, 13a,

RESULTS
82
siPFKFB3 mostly prevented the increase in mitochondrial superoxide. To further support
the notion that NMDAR-mediated oxidative stress was, at least in part, a consequence of
the inhibition of PPP activity, we next aimed to investigate if this effect was counteracted
by overexpressing G6PD, i.e. the rate-limiting enzyme of the PPP. As shown in Fig. 13b,
expression of the full-length cDNA coding G6PD led to a significant increase in G6PD
protein, and this effect was sufficient to fully rescue the increase in mitochondrial
superoxide caused by NMDAR (Fig. 13a). Finally, we tested that the observed effect on
mitochondrial superoxide was a wholly consequence of NMDAR stimulation, as judged
by the full protection triggered by the NMDA antagonist, MK801 (Fig. 13b).
Figure 13. (a Glutamate treatment (100 μM/15 min) increased mitochondrial superoxide
levels in neurons, as assessed by flow cytometry measurement of MitoSox fluorescence;
this effect was prevented by knocking down PGI (siPGI) or PFKFB3 (siPFKFB3),

RESULTS
83
overexpressing G6PD, or blocking NMDAR with MK801 (10 μM). b) Transfection of
neurons with the full-length DNA encoding G6PD (1.6 μg/ml) efficiently increased G6PD
protein abundance. *P<0.05. (ANOVA)(n=3).
14. NMDAR ACTIVATION TRIGGERS APOPTOTIC DEATH BY SWITCHING PPP TO GLYCOLYSIS.
Given that NMDAR stimulation led to oxidative stress as a consequence of PPP shift to
glycolysis, and that oxidative stress is known to cause neuronal death, we next aimed to
investigate if the metabolic switch by NMDAR targeted neurons to apoptotic death. To do
so, neurons treated with glutamate (100 µM / 15 min) were incubated, 16 h later, with
anti-annexin V and 7AAD, to assess neurons targeted to apoptosis by flow cytometry. As
shown in Fig. 14, the proportion of annexin V+/7AAD- neurons increased significantly by
glutamate treatment, an effect that was partially prevented by PGI or PFKFB3 knock
down, as well as by overexpressing G6PD or blocking NMDAR with MK801. Thus,
NMDAR stimulation promotes apoptotic death of neurons as a consequence of the shift
of PPP to glycolysis.
Figure 14. Glutamate treatment
increased apoptotic neuronal
death, as assessed by
determining annexin V+/7AAD-
neurons fluorescence by flow
cytometry; this effect was
prevented by silencing PGI
(siPGI, 100nM) or PFKFB3
(siPFKFB3, 100nM),
overexpressing G6PD (1.6
μg/ml) or blocking NMDAR with
MK801 (10 μM). *P<0.05.
(ANOVA)(n=3).

RESULTS
84
15. EXPRESSION OF A MUTANT FORM OF PFKFB3 INSENSITIVE TO APC/C-Cdh1 MIMICS NMDAR AT CAUSING OXIDATIVE STRESS AND NEURONAL DEATH.
To further support the notion that PFKFB3 stabilization after APC/C-Cdh1 inhibition is
responsible for the metabolic shift, oxidative stress and apoptosis, we next aimed to
investigate whether this phenotype could be mimicked by expressing the mutant form of
PFKFB3 insensitive to APC/C-Cdh1. As shown in Fig. 15a, incubation of PFKFB3-
expressing neurons with glutamate (100 µM / 15 min) increased mitochondrial
superoxide abundance. Interestingly, expression of the APC/C-Cdh1-insensitive form of
PFKFB3 (mutPFKFB3) yielded neurons with a similar level of mitochondrial superoxide,
an effect that was not further increased by glutamate (Fig, 15a). Analysis of apoptotic
neurons under these conditions yielded identical results (Fig. 15b). Together, these
results indicate that, after NMDAR stimulation leading to APC/C-Cdh1 inhibition,
PFKFB3 is stabilized causing increased glycolysis and reduced PPP activity, which
triggers glutathione oxidation and apoptotic death. Thus, PFKFB3 should be considered
as an interesting therapeutic target in the treatment of disorders of the central nervous
system in which excessive glutamatergic neurotransmission (excitotoxicity) has been
documented, such as stroke.

RESULTS
85
Figure 15. a) Glutamate treatment (100 μM/15 min) increased mitochondrial superoxide
levels in neurons transfected with low levels of wild-type PFKFB3 cDNA (0.16 μg/ml);
transfection of neurons with identical cDNA amounts of the KEN box-mut-PFKFB3
increased superoxide to similar levels to those triggered by glutamate; glutamate did not
further enhance superoxide in neurons expressing mut-PFKFB3. b) Glutamate increased
apoptotic death of neurons transfected with low levels of PFKFB3 cDNA; transfection of
neurons with identical cDNA amounts of mut-PFKFB3 increased apoptotic death to
similar levels to those triggered by glutamate; glutamate did not further enhance
apoptotic death in neurons expressing mut-PFKFB3. *P<0.05 (ANOVA)(n=3).
16. THE FRUCTOSE-2,6-BISPHOSPHATASE TIGAR PROTEIN IS EXPRESSED IN NEURONS
Recently, it was discovered a Tp53-inducible glycolysis and apoptotic regulator (TIGAR)
that has fructose-2,6-bisphosphatase activity. In view that TIGAR would exert the
opposite metabolic effect to PFKFB3, we wondered whether the regulation of glycolysis
in neurons would be a function of both TIGAR and PFKFB3. To the best of our
knowledge, the expression of TIGAR in brain cells has not been reported. Accordingly,
we first aimed to investigate its protein expression in rat cortical neurons and astrocytes
in primary culture, by western blotting. As observed in Fig. 16, TIGAR protein is
expressed in both cell types, being slightly higher in neurons.
Figure 16. TIGAR is present in both
neurons and astrocytes and neurons
express higher levels of the protein.
Neurons at 6 days in culture and
astrocytes at day 15 were lysed in RIPA
buffer and subjected to western blot
analysis of the levels of TIGAR.

RESULTS
86
17. ASSESSMENT OF APOPTOSIS AND SUPEROXIDE LEVELS IN PRIMARY NEURONS FROM TIGAR KNOCKOUT MICE
Since TIGAR exerts the opposite metabolic effect of PFKFB3, and we previously
observed that PFKFB3 over-expression triggers oxidative stress and apoptotic death, we
next aimed to investigate whether the lack of TIGAR mimicked PFKFB3 over-expression.
To do so, we first used the knockout approach in view that TIGAR knockout mice were
available at the Dr. Karen Vousden´s group (Beatson Institute for Cancer Research,
Glasgow, UK). Thus, cortical primary neurons from TIGAR knockout mice were
performed and superoxide and apoptotic death were investigated. As observed in Fig.
17a and b, neither mitochondrial superoxide abundance nor apoptotic death was
significantly increased in TIGAR knockout neurons. However, we reasoned the
possibility that glucose metabolism in the TIGAR knockout mice might be compensated
thus avoiding the observation of a strong phenotype. Accordingly, we next aimed to
modulate TIGAR expression acutely using both over-expression and a knockdown
approaches.
Figure 17. Mitochondrial superoxide levels detection and apoptotic neuronal death in
TIGAR WT vs KO mice neurons at 6 days in culture. a) TIGAR KO mice exhibit
superoxide levels similar to the WT, as assessed by flow cytometric analysis of MitoSox-
RedTM fluorescence. b) TIGAR KO neurons don´t show significant increase in apoptosis
levels, as assessed by annexin V+/7AAD- fluorescence by flow cytometry. (ANOVA).

RESULTS
87
18. OVER-EXPRESSION OF THE FULL-LENGTH TIGAR cDNA DECREASES FRUCTOSE-2,6-BISPHOSPHATE CONCENTRATION
We first obtained the full-length cDNA coding for TIGAR, which was generously donated
by Prof. R. Bartrons (University of Barcelona) and inserted it into peGFP-C1 plasmid
vector, which express the GFP-TIGAR fusion protein under the control of the
cytomegalovirus promoter. Expression of this plasmid in human embryonic kidney cells
(HEK293T) caused a significant decrease in the concentrations of fructose-2,6-
bisphosphate when compared with cells transfected with the empty vector (control) (Fig
18). Thus, the peGFP-C1 TIGAR construct is functional.
Figure 18. peGFP-C1 TIGAR
expression in HEK293T successfully
decreases fructose-2,6-bisphosphate
levels. HEK293T cells were
transfected with either peGFP-C1
TIGAR plasmid construction or
empty vector (1.6 μg/ml) and
fructose 2,6 bisphosphate
concentrations were measured 24
hours post-transfection. *P<0.05
(ANOVA)(n=3).

RESULTS
88
19. TIGAR PREVENTS PFKFB3-INDUCED INCREASE IN MITOCHONDRIAL SUPEROXIDE AND NEURONAL DEATH
We next decided to investigate whether the TIGAR-PFKFB3 axis, by their ability to
inversely regulate glycolysis, controls superoxide abundance and neuronal survival. To
do so, the APC/C-Cdh1-insensitive form of PFKFB3 (mutPFKFB3) was expressed, at a
very low concentrations (0.16 µg/ml) in rat cortical primary neurons, which –as previously
shown– triggered significant increases in mitochondrial superoxide and apoptotic
neuronal death (Figs. 19a,b), as assessed by flow cytometry. Interestingly, co-
expression of TIGAR at high concentration (1.6 µg/ml) fully rescued these effects (Figs.
19a,b). Thus, oxidative stress and apoptotic neuronal death appears to be controlled by
the TIGAR-PFKFB3 axis, at least at the light of over-expression experiments.
Figure 19 a) Transfection of neurons with low levels of mutPFKFB3 (0.16 μg/ml)
increases mitochondrial superoxide when compared with the same levels of PFKFB3, as
assessed by flow cytometric analysis of MitoSox-RedTM fluorescence. The increase in
mitochondrial superoxide is prevented by overexpressing TIGAR (1.6 μg/ml). b)
Transfection of neurons with low levels of mutPFKFB3 leads to apoptotic cell death that
is prevented by overexpressing TIGAR, as assessed by annexin V+/7AAD- fluorescence
by flow cytometry. *P<0.05 (ANOVA)(n=3).

RESULTS
89
20. KNOCKDOWN OF TIGAR IS NOT SUFFICIENT TO INCREASE THE RATE OF GLYCOLYSIS IN PRIMARY NEURONS
In view that we were unable to show more vulnerable neurons to oxidative stress and
apoptotic death in TIGAR knockout mice, we decided to acutely knockdown it in mice
primary neurons. To do so, we designed a small interfering RNA (siRNA) sequence
targeted against Mus musculus TIGAR (siTIGAR). Transfection of primary neurons with
siTIGAR resulted in a considerable –albeit not full– decrease in TIGAR protein after 3
days (Fig. 20a). However, we were unable to detect any statistically significant increase
in the rate of glycolysis in siTIGAR-transfected neurons when compared with siControl-
transfected cells (Fig. 20b).
Figure 20. a) TIGAR siRNA efficiently knocks down protein levels in neurons 3 days after
transfection. Neurons at day 3 in culture were transfected either with siControl or
siTIGAR (20 nM). At day 6 in culture cells were lysed and the protein levels analyzed by
western blot.. b) Glycolytic rate does not significantly increase upon TIGAR silencing in
neurons. Neurons at day 3 in culture were transfected either with siControl or siTIGAR
(20 nM) at day 6 in culture glycolytic rate was assessed by by the determination of [3-3H]glucose incorporation into 3H2O.(ANOVA)(n=3).

RESULTS
90
21. KNOCKDOWN OF TIGAR INCREASES APOPTOTIC NEURONAL DEATH WITHOUT INCREASING SUPEROXIDE
In view that the results on superoxide and survival obtained by over-expressing TIGAR
(Fig. 19) were apparently inconsistent with those on glycolysis obtained by knocking
down TIGAR (Fig. 20), we decided to investigate superoxide and neuronal survival in
TIGAR knockdown neurons. Thus, mice primary neurons were transfected with siTIGAR
to knockdown it, followed by incubation in the absence or presence of glutamate (100 µM
/ 15 min) to stimulate the NMDAR. As shown in Fig. 21a, siTIGAR did not increase
mitochondrial superoxide abundance. However, glutamate treatment did increase
superoxide, although this was not potentiated by siTIGAR (Fig. 21a). Interestingly,
siTIGAR, as did glutamate, increased apoptotic neuronal death (Fig. 21b); furthermore,
siTIGAR potentiated glutamate-induced neuronal death (Fig. 21b). Altogether, our data
suggest that, besides its possible control on fructose-2,6-bisphosphate concentrations
and glycolysis, TIGAR may play a yet not deciphered role on neuronal survival that is
independent on the glycolytic-PPP shift that PFKFB3 exerts.

RESULTS
91
Figure 21. a) Mitochondrial superoxide detection increases by glutamate treatment, but
not by siRNA TIGAR, as assessed by flow cytometric analysis of MitoSox-RedTM
fluorescence. b) Apoptotic neuronal death increases by siTIGAR in neurons, as
assessed by annexin V+/7AAD- fluorescence by flow cytometry. *P<0.05 (ANOVA)(n=3).
22. CONFOCAL ANALYSIS REVEALS NUCLEAR LOCALIZATION OF TIGAR IN NEURONS, BUT NOT IN ASTROCYTES
As an attempt to obtain any clue to explain the metabolic-independent control of
neuronal survival by TIGAR, we decided to investigate its subcellular localization. To do
so, we performed primary cultures of neurons and mixed neurons-astrocytes from the
E16 mice brain cortex. Endogenous TIGAR was then analyzed by immunofluorescence
is a confocal microscope. As shown in Fig. 22, endogenous TIGAR expression was
spread in neurons, including in the nucleus as judged by its co-localization with the
nuclear-specific marker TOPRO-3. In contrast, we observed that TIGAR was exclusively
present in the cytosol, not in the nucleus, of astrocytes (Fig. 22). These results suggest
that, at least in neurons, TIGAR might exert a yet unknown cytoprotective function in the
nucleus that remains to be elucidated.

RESULTS
92
Figure 22. Immunofluorescense analysis of endogenous TIGAR shows a nuclear plus
cytoplasmic localization of the protein in neurons, but an exclusive cytoplasmic
localization in astrocytes. Cells were grown on glass coverslips and after the
immunostaining, images were obtained in a confocal Leica SP5 microscope. Scale bar:
20 μm.

93
5. DISCUSSION

94

DISCUSSION
95
1. GLYCOLYSIS AND PPP ARE DYNAMIC PROCESSES IN INTACT NEURONS
The differential regulation of the activity of enzymes of glucose metabolism, as well as
the complex interplay between cellular metabolic pathways, makes difficult the issue of
accurately determining specific glucose-metabolizing fluxes. A common methodology to
address this issue consists of determining the metabolites enrichments in 13C, 14C, 1H or 3H after incubating cells with appropriately labeled glucoses. The use of 1H- and 13C-
glucose reveals the labeling pattern of intermediary metabolites after magnetic
resonance spectroscopy (MRS) or mass spectrometry (MS) analyses, which provides
indexes of cellular metabolic activity (Bouzier-Sore et al. 2006, Bak et al. 2006, Brekke et
al. 2012). However, due to rapid equilibration of substrates through the different
pathways, it is hard to discriminate the origin of the metabolic route and its flux.
We have previously used a method suitable to determine the glycolytic and PPP fluxes in
detached neurons (Herrero-Mendez et al. 2009). To determine the glycolytic flux, we
measured the rate of [3-3H]glucose incorporation into 3H2O, that is produced in the
reaction catalyzed by aldolase, thus specifically assessing the flux of glucose through
PFK1-catalyzed reaction. [3-3H]Glucose conversion into 3H2O gives a more accurate
index of the glycolytic flux than that of [5-3H]glucose, a method chosen for other authors,
since in the latter, 3H2O is produced at enolase, i.e. a reaction that operates after
glyceraldehyde-3-phosphate that can be generated through the PPP; this would easily
lead to an overestimation of the glycolytic flux, as has been previously described
(Goodwin et al. 2001). We therefore used, in this work, the rate of conversion of [3-3H]glucose into 3H2O. Moreover, to overcome the possible drawback of using detached
cells, we developed a technique to determine the rate of glycolysis in intact, attached
neurons, thus maintaining the integrity of axons and dendrites. Using this method, we
report that the rate of the glycolytic flux in rat cortical neurons is ~1.2 nmol/min x mg
protein; this value is slightly lower than that previously reported by our group in detached
neurons (~2 nmol/min x mg protein). Possibly, detaching neurons from the plate might
have caused some undetermined type of stress that affected glucose metabolism.
In view that glycolysis and PPP are interconnected pathways, we aimed to measure the
rate of glucose oxidation through the PPP. We decided to use the method that calculates
the difference of 14CO2 produced from [1-14C]glucose and that produced from [6-14C]glucose. The former is produced at 6-phosphogluconate dehydrogenase (6PGD)-

DISCUSSION
96
catalyzed reaction in the PPP and at the tricarboxylic acid (TCA) cycle; however, the
latter is produced only at the TCA cycle. Using this approach, we report that attached,
intact cortical primary neurons oxidize glucose through the PPP at a rate of ~0.2
nmol/min x mg protein, a value that is lower than that obtained in our own previous
determinations in detached neurons (~0.7 nmol/min x mg protein). As for glycolysis, we
therefore admit that detaching neurons might induce stress affecting glucose
metabolism. Accordingly, the attached intact system that we herein set up is
advantageous.
Assuming that most glucose consumption in neurons takes place through glycolysis and
PPP, we therefore estimate that approximately 14% of glucose consumption in neurons
is oxidized at the PPP. This value contrasts with the reported by other groups who
estimated PPP values of ~6% of glucose consumption (Brekke et al. 2012). However,
activation of glycolysis by over-expressing PFKFB3 dramatically reduces the rate of PPP
(Herrero-Mendez et al. 2009) leading to oxidative stress and neuronal death, as did
specific inhibition of G6PD with DHEA (Vaughn & Deshmukh 2008). Thus, the fraction of
glucose entering the PPP appears to be highly relevant for neuronal survival, which
questions that it would be wholly accounted by such a low proportion (6-14%) of glucose
metabolized. We therefore hypothesized that the actual rate values of PPP obtained are
underestimated.
To indirectly assess the fraction of glucose entering PPP, we first incubated neurons with
DHEA to inhibit G6PD, the rate-limiting enzyme of the PPP, and measured the rate of
glycolysis. We observed that the rate of glucose oxidized trough the glycolytic flux
increased by ~100% in the presence of DHEA; this result suggests that at least ~50% of
glucose entering neurons is metabolized through the PPP. As expected, DHEA triggered
a large increase in G6P concentrations; however, the flux through PPP was only
inhibited by ~50%. Thus, the increase of glycolysis caused by DHEA (from 1.2 to 2.4
nmol/min x mg) was produced at the expense of a reduction in PPP from 0.2 to 0.1
nmol/min x mg. Together, these results indicate that the flux of glucose through PPP is
largely underestimated in neurons. Furthermore, according to the extent in the increase
in glycolysis, and the degree of inhibition in PPP caused by DHEA (approximately a
50%), we estimate that the actual rate of PPP in neurons is around 2.4 nmol/min x mg,
i.e. about double than the rate of glycolysis. Unfortunately, this value could not be
directly demonstrated.

DISCUSSION
97
Since the rates of PPP are underestimated, we sought to find an explanation. We
noticed that F6P derived from the non-oxidative branch of the PPP can be converted
back to G6P, a fact that is usually ignored when estimating metabolic fluxes (Brekke et
al. 2012). This reaction is catalyzed by phosphoglucose isomerase (PGI), which is a
near-equilibrium enzyme therefore allowing the F6P-to-G6P reaction. This issue is
critically important in the context of PPP activity determinations, because the
decarboxylation of C-1 of [1-14C]glucose yields unlabeled PPP end-point intermediates,
F6P and GAP. Unlabeled F6P, by converting back into G6P, would reduce the specific
radioactivity of intracellular [1-14C]G6P that would result in an underestimation of 14CO2
collected. To assess this possibility, we measured PGI activity in primary neurons, which
was as high as PFK1. Since PGI is a near-equilibrium enzyme and, therefore, its activity
depends on the relative concentrations of F6P and G6P, whereas PFK1 activity in
neurons is highly dependent on F2,6P2 levels that are very low in neurons (Herrero-
Mendez et al. 2009), it is not unlikely that a large fraction of F6P would indeed be
converted into G6P. To test this hypothesis more directly, we next knocked-down PGI in
neurons, and determined the rate of PPP. We found that PGI knockdown had a ~90%
higher flux through PPP, which strongly supports the notion of the [1-14C]G6P isotopic
dilution as a determinant factor in the underestimation of the actual value of the rate of
PPP in these cells.
Besides the above-mentioned methodological limitation, both approaches to assess the
glycolytic and PPP fluxes appear to be specific, as demonstrated by the consistent
results obtained by, not only DHEA, but also HCN. Thus, HCN treatment triggered a
~150% increase in glycolytic rate, indicating that metabolism of glucose through
glycolysis is tightly controlled in neurons. The increase of glycolytic rate observed by
HCN is possibly due to an attempt to compensate for the lack of pyruvate oxidation for
TCA cycle and oxidative phosphorylation. It should be mentioned that the inhibition of
ATP synthesis would increase the AMP:ATP ratio that, in turn, activates AMPK to
phosphorylate –and activate– PFKFB3 (Almeida et al. 2004, Marsin et al. 2002), as well
as to promote GLUT3 translocation to the plasma membrane (Cidad et al. 2004,
Weisova et al. 2009). In view that the observed increase in glycolysis is not accompanied
by a concomitant decrease in PPP, our results also suggest that HCN triggered an
increase in glucose uptake in neurons.
Altogether, our results therefore indicate that glucose metabolism in neurons is a highly
dynamic process that can be easily manipulated and detected in cultured intact primary
neurons. Moreover, our data also indicate that, besides glycolysis, a considerable

DISCUSSION
98
proportion of glucose entering neurons is oxidized through the PPP. In view that
glycolysis and PPP are highly dynamic in neurons, we next aimed to investigate whether
these glucose-metabolizing pathways can be endogenously modulated by physiological
neurotransmitter-mediated stimuli.
2. GLYCOLYSIS AND PPP CAN BE MODULATED BY ENDOGENOUS STIMULI WITH PATHOPHYSIOLOGICAL CONSEQUENCES
We have previously shown that, in contrast to astrocytes, neurons continuously degrade
the glycolytic-promoting enzyme PFKFB3 (Herrero-Mendez et al. 2009). This occurs by
APCCdh1-mediated PFKFB3 ubiquitylation followed by proteasomal degradation, and is
responsible for keeping glucose oxidized through the PPP (Herrero-Mendez et al. 2009).
Here, now we show that short-term activation of glutamate receptors triggers a delayed,
time-dependent accumulation of PFKFB3 protein. This effect depends on NMDAR, which
are known to promote a cascade of events leading to APCCdh1 inhibition (Maestre et al.
2008). Thus, through a Ca2+-calpain dependent mechanism, NMDAR promotes p35
cleavage to p25 leading to cyclin-dependent kinase 5 (Cdk5) activation; in turn, active
Cdk5 phosphorylates Cdh1, which is released from the APC complex leading to APCCdh1
inhibition (Maestre et al. 2008). Accordingly, we hypothesized that the stabilization of
PFKFB3 that we observed could be a consequence of the known NMDAR-mediated
APCCdh1 inhibition. As expected, Cdh1 was phosphorylated by glutamate treatment, thus
under our conditions, APCCdh1 resulted inhibited. Furthermore, in agreement with the
presence of a nuclear-targeting motif in PFKFB3 (Yalcin et al. 2009), we found that
PFKFB3 was localized in the nucleus, where neurons actively degraded it. Thus, we
hypothesized that, upon glutamate stimulation, PFKFB3 would spread from the nucleus
to the cytosol. In fact, we found that such a spread took place in a Cdh1-inhibitable
process, since the PFKFB3 mutant form lacking the Cdh1-recognizing KEN motif
spontaneously accumulated in the cytosol. Together, these results indicate that PFKFB3
nuclear stabilization followed by cytosolic spread is the consequence of APCCdh1
inhibition. The mechanism whereby PFKFB3 is released from the nucleus remains
unclear, although it seems to be specifically dependent on Cdh1. These results are likely
of physiological significance in view of the cytoplasmic localization of the PFKFB3 target,
PFK1. In fact, we found that NMDAR-mediated PFKFB3 protein stabilization and
translocation to the cytosol led to increased glycolytic rate in neurons.

DISCUSSION
99
It should be noted that PFKFB3 stabilization takes place several hours (~6 h) after
glutamate treatment, thus explaining the absence of measurable short-term glycolytic
stimulation in cortical neurons in a previous study (Almeida & Bolanos 2001).
Accordingly, the delayed increase in glycolysis that we observe does not appear to be a
neuronal attempt to rapidly compensate for the mitochondrial energy dysfunction, which
occurs immediately after NMDAR stimulation (Dugan et al. 1995). Instead, the delayed
glycolysis activation reflects a long-term metabolic adaptation of neurons by an
excitotoxic insult, which is in agreement with previous findings indicating that, to be fully
active, calpains must be activated by relatively high cytosolic Ca2+ concentrations (Baki
et al. 1996, Tompa et al. 1996, Brustovetsky et al. 2010). Such an adaptation concurs
with concomitant decrease in the rate of glucose oxidation through the PPP. Importantly,
this shift (the increase in glycolysis and the decrease in PPP) could be fully abolished by
siPFKFB3, indicating that both metabolic pathways are highly dependent on PFKFB3
activity.
Furthermore, the metabolic PPP to glycolysis shift triggered by NMDAR stimulation was
accompanied by oxidative stress, as revealed both by an increase in the oxidized
glutathione redox status and the increased mitochondrial superoxide detection, as well
as apoptotic neuronal death. Either silencing PFKFB3 or G6PD overexpression
prevented such a metabolic shift and the concomitant ROS production by NMDAR
stimulation. Moreover, silencing PGI, which is able to both inhibit glycolysis (Herrero-
Mendez et al. 2009) and stimulate PPP (this work), was also sufficient to prevent
NMDAR-mediated increase in ROS production. In conclusion, our results show that
following PFKFB3 stabilization by NMDAR stimulation, neurons undergo oxidative stress
and apoptotic cell death, highlighting the essential role of PPP at regulating neuronal
apoptosis (Vaughn & Deshmukh 2008). Furthermore, we show that the loss of PPP
activity by APCCdh1 inhibition should be considered a novel and important player in
excitotoxicity, hence suggesting that selective inhibition of PFKFB3 in neurons might be
considered as a novel therapeutic target against neurodegeneration.
3. TIGAR: A NEW PLAYER IN NEURONAL GLUCOSE METABOLISM AND BEYOND
In view that, at the light of our results, the levels of the PFKFB3 product, F2,6P2, control
glucose metabolism and survival of neurons, we next aimed to elucidate whether TIGAR,
a recently uncovered fructose-2,6-bisphosphatase enzyme (Bensaad et al. 2006), takes

DISCUSSION
100
a role in this function. First, we identified TIGAR protein in neurons and in astrocytes in
primary culture, which has not been reported so far. Since TIGAR exerts the opposite
metabolic effect of PFKFB3 (Bensaad et al. 2006, 2009), we next aimed to elucidate
whether the lack of TIGAR mimicked PFKFB3 over-expression at modulating ROS and
apoptosis. To do so, we first used TIGAR knockout mice, available at Prof. Karen
Vousden´s group (Beatson Institute for Cancer Research, Glasgow, UK). Surprisingly,
neither mitochondrial superoxide abundance nor apoptotic death was significantly
increased in TIGAR knockout neurons. This is not unexpected in view that this knockout
mice is not inducible, which might have up-regulated compensatory mechanisms.
Accordingly, we next aimed to investigate the role of TIGAR by either over-expressing it,
or knocking it down, both in rat and in mice neurons in primary culture.
Interestingly, co-expression of TIGAR with the mutant form of PFKFB3 that is insensitive
to APCCdh1 –hence stable in neurons– (mutPFKFB3), fully rescued the mutPFKFB3-
mediated increase in mitochondrial superoxide and apoptotic death. Next, we designed a
siRNA against mouse TIGAR; knocking TIGAR down (siTIGAR) did not induce an
increase in the glycolytic rate in neurons, which is not unexpected in view that neurons
already express very low F2,6P2 levels (Almeida et al. 2004). However, siTIGAR was
accompanied by an increase in apoptotic cell death that was independent of increased
superoxide anion. In this context, it should be noticed that, besides its function as a
bisphosphatase, very recently it has been reported that TIGAR can be present in
mitochondria, where it links hexokinase-II to the outer membrane (Cheung et al. 2012).
Moreover, it has also been shown that TIGAR can be present in the nucleus, where it
may control cell cycle progression (Madan et al. 2012). We therefore hypothesized that
the increase in apoptosis by siTIGAR under our conditions may be due to an alternative
function of TIGAR besides its glycolysis regulatory ability. In fact, the
immunofluorescence images of endogenous TIGAR in neurons and in astrocytes reveal
its presence both in the nucleus and cytosol in neurons, but not in astrocytes where
TIGAR could only be found in cytosol. Together, these results suggest that TIGAR may
play a yet unknown function that requires its presence in the nucleus of neurons.
Whether this is linked to neuronal differentiation and survival remains to be elucidated.

101
6. CONCLUSIONS
AND FUTURE
PERSPECTIVES

102

CONCLUSIONS AND FUTURE PERSPECTIVES
103
1. CONCLUSIONS
At the light of the results presented in this work, we have obtained the following
conclusions:
1- The radiometric assays based on [3-3H]glucose incorporation into 3H2O, and on the
difference in [1-14C] glucose and [6-14C ]glucose incorporations into 14CO2, are specific
for determining the rates of glycolysis and PPP, respectively, in attached, intact primary
neurons. However, phosphoglucose isomerase in neurons works at near-equilibrium,
causing [14C] glucose isotopic dilution due to the return of [14C]-free fructose-6-phosphate
into glucose-6-phosphate. Thus, the rates of PPP activity reported values are largely
underestimated.
2- Neurons metabolize, approximately, double of glucose-6-phosphate through the PPP
and the rest trough glycolysis in resting conditions; however, this ratio is amenable to
regulation to adapt neurons to a wild range of different stress conditions.
3- Over-stimulation of glutamate receptors, mainly of the NMDA-subtypes, is sufficient to
cause PFKFB3 protein stabilization leading to a PPP to glycolysis metabolic shift.
Consequently, the redox status of glutathione changes leading to oxidative stress and
apoptotic neuronal death. These results identify PFKFB3 as a novel therapeutic target
against excitotoxicity.
4- The recently discovered fructose-2,6-bisphosphatase enzyme, TIGAR, is expressed in
neurons, where it contributes to the regulation of neuronal glycolysis. Thus,
overexpression of TIGAR prevents PFKFB3-induced, superoxide-dependent apoptotic
neuronal death. In contrast, TIGAR knockdown increases apoptotic neuronal death
through a superoxide-independent manner. This, together with the intriguing nuclear
localization of TIGAR in neurons, suggests a distinct, yet to be defined, function of this
protein.

CONCLUSIONS AND FUTURE PERSPECTIVES
104
2. FUTURE PRESPECTIVES
Here, we developed a sensitive and specific method for the determination of glucose
metabolizing fluxes through pentose-phosphate pathway and glycolysis in neurons. A
key feature of this novel method is that glucose metabolism can be studied in the
attached neurons, i.e. still maintaining intact their axons and dendrites. This differs with
previous protocols in which these studies were performed in detached, suspended
neurons hence lacking these important processes. Accordingly, this method will be
useful to assess how these metabolic pathways are finely tuned during
neurotransmission upon different kinds of physiological stimuli.
Our results also highlight that the unbalance in glucose metabolism has profound
implications in neuronal redox status and survival. Thus, here we identified a novel
molecular mechanism that can account for neuronal death during excitotoxicity, i.e.
during excessive and long term activation of glutamate receptors. Excitotoxicity is a well-
known phenomenon associated with several neurodegenerative diseases and stroke.
Accordingly, our work will open a new research opportunity to investigate different
therapeutic approaches to those already in use. For instance, the development of potent
specific inhibitors of PFKFB3 –which is responsible for the metabolic shift leading to
neuronal death in excitotoxicity– is an interesting idea worth to pursue in the future.
Finally, we have shown that the recently discovered protein TIGAR is expressed in
neurons and in astrocytes. Furthermore, according to our data, in neurons TIGAR plays
a key role in neuronal survival, although this might be associated to its nuclear
localization, rather than to its metabolic effect at degrading fructose-2,6-bisphosphate
and, hence, glycolysis. Studying the yet unknown regulatory mechanisms of TIGAR in
neuronal survival and/or differentiation appears to be an attractive field worth to
investigate in the near future.

105
7. RESÚMEN EN
ESPAÑOL


RESÚMEN EN ESPAÑOL
107
INTRODUCCIÓN
1. Metabolismo glucídico en el cerebro.
A pesar de que el cerebro únicamente representa un 2% del peso total corporal, es
responsable de más del 20% del consumo total de O2 y glucosa (Sokoloff 1992).
Defectos en el metabolismo cerebral de glucosa se han relacionado con la aparición de
enfermedades neurodegenerativas, como la enfermedad de Alzheimer (Piert et al.
1996), PD (Aviles-Olmos et al. 2013) o Huntington (Ciarmiello et al. 2006).
Las principales vías de metabolización de glucosa son la glucolisis y la vía de las
pentosas fosfato, a pesar de que los astrocitos también son capaces de almacenar
glucógeno (Wiesinger et al. 1997) y constituyen un reservorio importante de glucosa en
condiciones en las que existe un déficit en el aporte de glucosa al cerebro (Choi et al.
2003). De hecho, el glucógeno almacenado por los astrocitos es fundamental para
mantener la actividad sináptica y para la supervivencia neuronal en hipoglucemia
(Swanson & Choi 1993, Suh et al. 2007). La actividad glucolítica es mucho más baja
(aproximadamente 4 veces menor) en neuronas que en astrocitos (Herrero-Mendez et
al. 2009), una observación que va acompañada por una menor oxidación de la glucosa
en el ciclo de los ácidos tricarboxílicos en neuronas (Garcia-Nogales et al. 2003). En
astrocitos, en cambio, la glucosa se utiliza predominantemente por vía glucolítica y en
concreto, transforman una gran parte de la glucosa en lactato (Leo et al. 1993). De
acuerdo con la hipótesis de la lanzadera de lactato astrocitos-neuronas, el lactato
producido por los astrocitos se utiliza como fuente de energía por las neuronas (Bouzier-
Sore et al. 2003, Zielke et al. 2007, Boumezbeur et al. 2010, Pellerin et al. 2007).
La causa de la baja actividad glucolítica en neuronas es que presentan, a diferencia de
los astrocitos, niveles muy bajos de fosfofructo-2-kinasa/fructosa-2,6-bisfosfatasa
(PFKFB), en concreto, de la isoforma 3 (PFKFB3), que es la más abundante en cerebro
(Herrero-Mendez et al. 2009). La PFKFB3 es una enzima bifuncional que presenta un
dominio kinasa, que sintetiza fructosa-2,6-bisfosfato (F2,6P2), y un dominio bisfosfatasa,
que desfosforila F2,6P2 para obtener fructosa-6-fosfato.
PFKFB3 en concreto, es la isoforma que presenta la relación kinasa/bisfosfatasa más
alta (~700:1) (Ventura et al. 1991), de manera que su función es prácticamente kinasa,
por tanto sintetiza F2,6P2. La F2,6P2 es el principal efector alostérico positivo de la 6-

RESÚMEN EN ESPAÑOL
108
fosfofructo-1-kinasa (PFK1), una enzima clave en la regulación de la glucolisis, de modo
que PFKFB3 se puede considerar una enzima pro-glucolítica.
Los bajos niveles de PFKFB3 en neuronas se deben a que esta isoforma es la única
que presenta una secuencia Lys-Glu-Asn (KEN), que es un motivo de reconocimiento
por Cdh1, una proteína adaptadora de la E3 ubiquitina ligasa APC/C (anaphase-
promoting complex/cyclosome), que ubiquitina proteínas diana, marcándolas para su
degradación por el proteasoma. A diferencia de los actrocitos, APC/C-Cdh1 es muy
activo en neuronas y es el responsable de los bajos niveles de PFKFB3 en estas
células. Este estricto control de los niveles de PFKFB3 es esencial para la supervivencia
neuronal, puesto que de este modo las neuronas metabolizan parte de la glucosa por la
vía de las pentosas-fosfato, que es esencial para generar NADPH(H+) y por tanto para la
regeneración de glutatión, su principal sistema antioxidante (Herrero-Mendez et al.
2009).
Recientemente, se ha descubierto otra proteína que regula los niveles de F2,6P2 en la
célula. TIGAR (TP53-induced glycolysis and apoptosis regulator), es una fructosa-2,6-
bisfosfatasa que en células tumorales promueve la defensa frente a estrés oxidativo
promoviendo la actividad de la vía de las pentosas-fosfato (Bensaad et al. 2006, 2009).
Además de sus funciones como bisfosfatasa, TIGAR puede translocarse a la
mitocondria formando un complejo con la hexokinasa II, aumentando su actividad
(Cheung et al. 2012) y también tiene efectos en regulación del ciclo celular en el núcleo
(Madan et al. 2012). Hasta el momento no se conoce nada relacionado con la expresión
o funciones de TIGAR en cerebro.

RESÚMEN EN ESPAÑOL
109
2. Neurotransmisión glutamatérgica y excitotoxicidad
El glutamato es el principal neurotransmisor excitador en el sistema nervioso central
(Butcher & Hamberger 1987), y está relacionado con el procesamiento de información y
la plasticidad sináptica. Este neurotransmisor activa tres tipos principales de receptores
ionotrópicos, acoplados a canales iónicos (AMPA, KAINATO y NMDA), y varios tipos de
receptores metabotropicos, que están acoplados a proteínas-G (mGLU1 - mGLU8)
(Dong et al. 2009).
En concreto, los receptores NMDA (N-metil-D-Aspartato), son canales permeables a
Na+, K+, y Ca2+. Cuando estos receptores son sobre-activados, tiene lugar un proceso
patológico conocido como excitotoxicidad que está relacionado con el desarrollo de
múltiples enfermedades neurodegenerativas, como la de Huntington (Lievens et al.
2001, Estrada-Sanchez et al. 2009), PD (Broadstock et al. 2012), Esclerosis Lateral
Amiotrófica (Kruman et al. 1999, Rothstein et al. 1995, Howland et al. 2002) o
Alzheimer (Mattson et al. 1992).
La sobre-estimulación de receptores NMDA provoca una entrada masiva de Ca2+ en la
célula que produce, entre otros efectos, disfunción mitocondrial que conlleva una bajada
en los niveles de ATP, estrés oxidativo (Wang et al. 1994, Khodorov et al. 1996),
liberación de citocromo c (Urushitani et al. 2001, Luetjens et al. 2000) o activación de
calpaínas, una familia de cisteína proteasas dependientes de Ca2+ (Brustovetsky et al.
2010). Entre otros efectos, las calpaínas transforman p35 en p25. Cuando Cdk5 se une
a p25 se activa (Lee et al. 2000) y a su vez fosforila Cdh1, inactivándolo y por tanto
inhibiendo la actividad de APC/C-Cdh1, promoviendo la acumulación de sus sustratos
(Jaquenoud et al. 2002, Maestre et al. 2008).

RESÚMEN EN ESPAÑOL
110
HIPÓTESIS Y OBJETIVOS
1. Hipótesis
En vista de los antecedentes descritos, nuestra hipótesis es que el metabolismo
glucídico en neuronas en condiciones normales está dirigido principalmente hacia la
PPP con el fin de generar poder reductor en forma de NADPH(H+). Cuando se produce
un exceso de activación de receptores NMDA, la inactivación del complejo APC/C-Cdh1
podría conllevar una estabilización de PFKFB3. En estas circunstancias podría tener
lugar una modificación en el metabolismo neuronal que disminuyera la utilización de
glucosa por la PPP y que por tanto pudiera contribuir al estrés oxidativo y a la muerte
neuronal en excitotoxicidad. Además, TIGAR, cuya expresión y función en neuronas se
desconoce, podría jugar un papel importante en este eje de regulación del metabolismo
y la supervivencia neuronal debido a su actividad como fructosa-2,6-bisfosfatasa.
2. Objetivos
Con el fin de demostrar si estas hipótesis son ciertas, nos planteamos los siguientes
objetivos:
1- Establecer un método sensible y específico para la determinación del flujo glucolítico
y de la actividad de la PPP en neuronas en cultivo adheridas a la placa.
2- Cuantificar la actividad glucolítica y de PPP que presentan las neuronas en cultivo en
condiciones basales.
3- Determinar si la activación de receptores NMDA por glutamato conlleva una
estabilización de PFKFB3 en neuronas, así como sus posibles consecuencias sobre el
estado redox y la supervivencia neuronal.
4- Analizar si TIGAR está presente en neuronas y, en ese caso, su implicación en la
regulación del metabolismo y sus efectos sobre la supervivencia neuronal.

RESÚMEN EN ESPAÑOL
111
RESULTADOS Y DISCUSIÓN
1. La actividad glucolítica en neuronas aumenta tanto al inhibir la vía de las pentosas fosfato como la captación mitocondrial de piruvato.
Con el fin de estudiar el metabolismo glucídico en neuronas, pusimos a punto un nuevo
protocolo para determinar la actividad glucolítica y de la vía de las pentosas fosfato en
neuronas adheridas a la placa. El flujo de glucosa metabolizada por vía glucolítica se
determinó como la velocidad de producción de 3H2O a partir de [3-3H] glucosa, un
proceso que tiene lugar en la reacción catalizada por la aldolasa. De este modo,
pudimos determinar que las neuronas en condiciones basales tienen una actividad
glucolítica aproximada de 1.2 nmol/min x mg de proteína (Fig. 1). Las neuronas
incubadas con dehidroepiandrosterona (DHEA; 1 μM), un inhibidor de la G6PD, la
enzima limitante del flujo a través de la PPP, incrementaron su actividad glucolítica al
doble de su actividad basal (Fig. 1), lo que nos sugiere que una proporción considerable
de glucosa (aproximadamente el 50%) se está metabolizando en la PPP. El tratamiento
con 4-hidroxi-α-cianocinamato (HCN), un compuesto que a la concentración utilizada
inhibe selectivamente la captación de piruvato por la mitocondria, incrementó ~125% la
actividad glucolítica, lo que podría deberse a un intento por parte de las neuronas de
compensar la falta de piruvato que entra en la mitocondria y por tanto la posible bajada
en los niveles de ATP.
Figura 1. La actividad glucolítica se
incrementa significativamente con DHEA e
HCN. Neuronas a 6 días de cultivo fueron
incubadas en el medio de experimentación
que contenía 5 μCi/ml de D-[3-3H] glucosa
más DHEA 1μM o HCN 0.1mM. La
velocidad glucolítica fue determinada
mediante la medida de la incorporación de
[3-3H] glucosa en 3H2O durante los 90
minutos de incubación del experimento.
*P<0.05 (ANOVA)(n=3).

RESÚMEN EN ESPAÑOL
112
2. La velocidad de oxidación de glucosa por la PPP se inhibe con DHEA.
En vista de los resultados obtenidos previamente, decidimos determinar la actividad de
la PPP en neuronas. Para ello, las neuronas se incubaron en presencia de [1-14C]
glucosa o de [6-14C]glucosa y se midió el 14CO2 liberado. La [1-14C]glucosa se
descarboxila en la reacción catalizada por la 6-fosfogluconato deshidrogenasa y en la
descarboxilación de la acetil-CoA en las reacciones catalizadas por la isocitrato
deshidrogenasa y la α-cetoglutarato deshidrogenasa en el ciclo de los ácidos
tricarboxílicos. En cambio, la [6-14C]glucosa únicamente se descarboxila en el TCA. De
este modo, la diferencia entre el 14CO2 liberado a partir de la [1-14C]glucosa y el liberado
a partir de la [6-14C]glucosa se utiliza como una estimación de la glucosa metabolizada
por la PPP. Como se muestra en la figura 2, la velocidad de oxidación de la glucosa en
la PPP fue de aproximadamente 0.2 nmol/min x mg proteína y la incubación con DHEA
disminuyó un 50% la actividad de la vía. De acuerdo con estos resultados, el
tratamiento con DHEA incrementó la actividad glucolítica 1.2 nmol/min x mg proteína
pero únicamente disminuyo la de la PPP 0.1 nmol/min x mg proteína, lo que nos indica
que la determinación de la actividad de la PPP utilizando esta metodología podría estar
altamente infraestimada.
Figura 2. La velocidad de la PPP disminuye
significativamente en las neuronas tratadas
con DHEA. Neuronas a 6 días de cultivo
fueron incubadas en medio de
experimentación que contenía 0.5 μCi/ml de
D-[1-14C]glucosa o D-[6-14C]glucosa durante
90 minutos y la velocidad de la PPP fue
determinada como la diferencia entre el 14CO2 proveniente de la descarboxilación de
[1-14C]glucosa y el proveniente de la
descarboxilación de [6-14C]glucosa. *P<0.05 (ANOVA)(n=3).

RESÚMEN EN ESPAÑOL
113
3. La fosfoglucosa isomerasa (PGI) presenta una actividad elevada en neuronas.
En vista de los bajos niveles de 14CO2 provenientes de la [1-14C] glucosa detectados,
nos planteamos la posibilidad de que la F6P regenerada a partir de la fase no oxidativa
de la PPP, que ya no es radiactiva, pudiera estar siendo convertida de nuevo en G6P
por la PGI. En este caso, la radiactividad de la reserva de G6P podría verse altamente
disminuida, pudiendo ser la causa de la infraestimación de la actividad de la PPP
observada. Con el objeto de esclarecer si esta podría ser la causa, medimos la actividad
específica de la PGI. Como se muestra en la figura 3, la actividad de la PGI resultó ser
tan alta como la de la PFK1. Sin embargo, el flujo de F6P a través de la PFK1 está
limitado en neuronas como consecuencia de la baja síntesis de su efector alostérico
positivo, la fructosa-2,6-bisfosfato, mientras que la PGI es una enzima cercana al
equilibrio y la dirección de la actividad de esta enzima depende exclusivamente de las
concentraciones relativas de F6P y G6P. Debido a esto, es posible que una gran
proporción de F6P proveniente de la PPP se esté reconvirtiendo en G6P y por tanto
contribuyendo a la dilución isotópica de la G6P, resultando en una aparentemente baja
liberación de 14CO2 a partir de [1-14C] glucosa.
Figura3. La PGI presenta una actividad
similar a la PFK-1 en neuronas. Neuronas a
6 días de cultivo fueron lisadas con 3 ciclos
de congelación/descongelación. El extracto
así obtenido se utilizó para medir la
actividad de la PGI y PFK-1.

RESÚMEN EN ESPAÑOL
114
4. El silenciamiento de la PGI conlleva un incremento en la actividad de la PPP.
Seguidamente, nos propusimos comprobar de manera más directa nuestra hipótesis.
Para ello, diseñamos un siRNA dirigido contra la PGI (siPGI). A los 3 días de cultivo, las
neuronas primarias se transfectaron con siPGI, que como se muestra en la figura 4a
disminuyó con éxito los niveles de proteína (~70%) después de 72 horas, y se utilizaron
para determinar la actividad de la PPP. Como se observa en la figura 4b, la actividad de
la PPP detectada se incrementó significativamente en las neuronas transfectadas con
siPGI. Este resultado es compatible con que la radiactividad específica de la [1-14C] G6P
se vea diluida por la entrada de G6P no radiactiva proveniente de F6P, es más, indica
que la PGI en neuronas recicla G6P activamente.
En conjunto, estos datos sugieren que la glucosa que entra en las neuronas se oxida
activamente por la PPP junto con G6P reciclada a partir de F6P proveniente de la fase
no oxidativa de la PPP. Sin embargo, debido a la dilución isotópica de la G6P, el valor
real de la proporción de glucosa que se incorpora a la PPP no se puede determinar, al
menos utilizando esta metodología.

RESÚMEN EN ESPAÑOL
115
Figura 4. a) El siRNA dirigido contra la PGI silencia eficazmente la proteína en
neuronas. Neuronas a 3 días de cultivo se transfectaron con siControl o siPGI 100 nM.
72 horas después las células se lisaron en RIPA y se sometieron a una transferencia de
western blot para comprobar el silenciamiento de la PGI. b) La velocidad de la PPP se
incrementa significativamente al silenciar la PGI. Neuronas a 6 días de cultivo se
incubaron en tampón de experimentación que contenía 0.5 μCi/ml de D-[1-14C] glucosa
o D-[6-14C] glucosa durante 90 minutos y la velocidad de la vía se determinó calculando
la diferencia entre el 14CO2 producido por [1-14C] glucosa y el producido por [6-14C]
glucosa. *P<0.05 (ANOVA)(n=3).
5. Efecto de DHEA e HCN sobre la concentración de G6P
Finalmente, para ver cómo la PPP está dinámicamente acoplada con la glucolisis en
neuronas, investigamos los efectos de la inhibición de la PPP y de la capación de
piruvato por la mitocondria sobre las concentraciones de G6P. Como se muestra en la
figura 5, la G6P se acumuló en las neuronas tratadas con DHEA. Este resultado sugiere
de manera convincente que existe un alto flujo de G6P hacia la PPP en neuronas. En
cambio, el tratamiento con HCN no afectó a la concentración de G6P.
Figura 5. La G6P se acumula en las neuronas
tratadas con DHEA, pero no se ve afectada por
HCN. Neuronas a 6 días de cultivo se incubaron
con DHEA 1 μM DHEA o HCN 0.1 mM durante 90
minutos. Posteriormente las células se lisaron en
NaOH 0.6 M. El extracto resultante se
desproteinizó con el mismo volumen de ZnSO4 al
1% w/v y se utilizó para determinar la
concentración de G6P. *P<0.05 (ANOVA)(n=3).

RESÚMEN EN ESPAÑOL
116
6. Las neuronas corticales en cultivo primario responden a la activación de los receptores de glutamato incrementando los niveles de Ca2+ intracelular.
Seguidamente, en vista de que nuestros datos indican que tanto la glucolisis como la
PPP son procesos altamente dinámicos en neuronas, nos propusimos investigar si estas
vías de metabolización de glucosa se pueden modular de manera endógena por
estímulos fisiológicos de neurotransmisión. En primer lugar quisimos determinar si las
neuronas a 6 días de cultivos expresan receptores funcionales de glutamato. Para ello,
medimos los cambios en los niveles de Ca2+ intracelular utilizando Fura-2, una sonda
que emite fluorescencia a 510 nm, pero cuya longitud de onda de excitación varía de
363 nm (libre) a 335 nm (unida a Ca2+). De este modo, la relación F335/F363 es
directamente proporcional a los niveles de Ca2+ intracelular. Como se muestra en la
figura 6a, la incubación de neuronas con glutamato (100 μM, 15 min) incrementó
inmediatamente la fluorescencia de Fura-2, lo que sugiere una entrada de Ca2+ en las
neuronas por medio de receptores ionotrópicos de glutamato. Este incremento en la
entrada de Ca2+ se previno parcialmente con MK801 (1 µM), un inhibidor selectivo de los
receptores NMDA, indicando que una proporción elevada (~60%) del Ca2+ que entraba
en la célula estaba mediada por la activación de estos receptores. Es más, la incubación
de neuronas con NMDA incrementó los niveles de Ca2+ intracelular de manera similar al
glutamato y una vez más este efecto se previno con MK801 (~90%). Como era de
esperar, la incubación de neuronas con NMDA o glutamato en la presencia de un
tampón al que se le añadió EGTA, un quelante de calcio, no produjo ningún cambio en
la emisión a 510 nm.
En conclusión, las neuronas corticales de rata a 6 días de cultivo expresan receptores
NMDA funcionales, lo que nos permite investigar los efectos metabólicos de este
neurotransmisor.

RESÚMEN EN ESPAÑOL
117
Figura 6. La incubación de neuronas corticales de rata a 6 días de cultivo con glutamato
(panel izquierdo) o NMDA (panel derecho), incrementaron la relación F335/F363 de
Fura-2, indicando un incremento en los niveles intracelulares de Ca2+. La incubación con
MK801 (10 μM) previno parcialmente tanto el efecto del glutamato como el del NMDA.
La utilización de un tampón libre de Ca2+, conteniendo EGTA 1 mM, previno
completamente los cambios de emisión a 510 nm en ambas condiciones.
7. La activación de receptores NMDA promueve la estabilización de la enzima pro-glucolítica PFKFB3 en neuronas.
Resultados previos en nuestro laboratorio demostraron que la estimulación de
receptores NMDA activa la ciclina dependiente de kinasa 5 (Cdk5) por un mecanismo
dependiente de Ca2+ y calpaina (Herrero-Mendez et al. 2009). A su vez, Cdk5
hiperfosforila Cdh1, que es un co-activador del complejo promotor de la
anafase/ciclosoma (APC/C). Cdh1 hiperfosforilado, se separa del complejo, por tanto
inhibiendo su actividad como E3 ubiquitina-ligasa (Maestre et al. 2008).
En vista de que también hemos demostrado que la PFKFB3 es un sustrato de APC/C-
Cdh1 (Herrero-Mendez et al. 2009), razonamos que la estimulación de receptores
NMDA, mediante la inactivación de APC/C-Cdh1 podría conllevar una estabilización de
PFKFB3. Con el fin de comprobar esta hipótesis, incubamos neuronas con glutamato

RESÚMEN EN ESPAÑOL
118
(100 μM, 15 min) y analizamos tanto los niveles de PFKFB3 como el estado de
fosforilación de Cdh1 a distintos tiempos mediante western blot. Para determinar el
estado de fosforilación de Cdh1, la proteína se inmunoprecipitó a partir de lisados
obtenidos a las 6 horas post-tratamiento, se sometió a una transferencia de western blot
y se incubó con un anticuerpo anti fosfo serina. Como se muestra en la figura 7a, el
tratamiento con glutamato ocasionó un aumento en la fosforialación de Cdh1, efecto que
se previno por completo con la utilización de MK801. Esto indica que en estas
condiciones, la estimulación de receptores NMDA inhibe el complejo APC/C-Cdh1, de
acuerdo con nuestras observaciones previas. El análisis de los niveles de PFKFB3
mediante western mostró que el tratamiento con glutamato producía una acumulación
tiempo dependiente de la proteína, efecto que fue máximo a las 6 horas (Figura 7b).
Este efecto fue mimetizado por neuronas estimuladas con NMDA (Figura 7c), lo que
demuestra la implicación de estos receptores. Es más, como se muestra en la figura 7d,
la incubación de las neuronas con MK801 previno la acumulación de PFKFB3. En
conjunto estos datos indican que la estimulación de los receptores NMDA inhibe la
actividad del complejo APC/C-Cdh1, lo que conlleva la acumulación de PFKFB3 en
neuronas primarias.

RESÚMEN EN ESPAÑOL
119
Figura 7. a) Cdh1 se encuentra fosforilado 6 horas después del tratamiento con
glutamato (100 μM/15 min), un efecto que se previene con MK801 (10 μM). b) La
incubación de neuronas con glutamato (100 μM/15 min) produce una acumulación de
PFKFB3 tiempo-dependiente, cuyo máximo efecto se observa a las 6 horas de
tratamiento. c) NMDA (100 μM/15 min) produce el mismo efecto de acumulación de
PFKFB3 que le glutamato. d) El antagonista de los receptores NMDA MK801 (10 μM),
previene el incremento de PFKFB3 mediado por glutamato.
8. La estimulación de receptores NMDA produce la translocación del núcleo al citosol de la PFKFB3.
En vista que nuestros resultados indican que la proteína PFKFB3 está siendo
continuamente degradada por APC/C-Cdh1 y que APC/C-Cdh1 es activa en el núcleo,
nos propusimos investigar la localización subcelular de PFKFB3. Para ello expresamos
tanto PFKFB3 silvestre como una construcción constitutivamente estable en la que la
KEN box, responsable de su degradación, fue mutada a AAA (denominada
mutPFKFB3), ambas fusionadas con GFP, y analizamos los cambios en su localización
subcelular. Las neuronas se transfectaron con cantidades pequeñas (0.16 μg/ml) de
cada uno de estos plásmidos y su localización se analizó por microscopía confocal.
Como se muestra en la figura 8, PFKFB3 silvestre está localizada en el núcleo, mientras
que la mutante mostraba también una localización citosólica. El tratamiento de las
neuronas con glutamato (100 µM / 15 min) produjo un cambio de PFKFB3 hacia el
citoplasma, efecto que se previno al sobreexpresar Cdh1. En conjunto, estos resultados
indican que la proteína PFKFB3 está localizada en el núcleo, donde es marcada para su
degradación por APC/C-Cdh1; sin embargo, el tratamiento con glutamato, al inhibir la
actividad del complejo, estabiliza PFKFB3, que a su vez sale del núcleo. Nuestro
siguiente objetivo fue ver si los cambios en la estabilidad de PFKFB3, así como sus
cambios en localización subcelular, tenían algún efecto sobre el flujo de la glucosa a
través de la vía glucolítica.

RESÚMEN EN ESPAÑOL
120
Figura 8. Imágenes de microscopía confocal de neuronas transfectadas con GFP-
PFKFB3. El tratamiento con glutamato promueve la acumulación y localización de
PFKFB3 tanto en el núcleo como el en citosol celular, efecto que se previene con la
sobreexpresión de Cdh1. GFP-PFKFB3, mutado en su caja KEN (KEN-AAA; mut-
PFKFB3) muestra esa misma localización independientemente del tratamiento con
glutamato.

RESÚMEN EN ESPAÑOL
121
9. La estabilización de PFKFB3 mediada por receptores NMDA aumenta la actividad glucolítica y disminuye la de PPP
Es sabido que la PFKFB3, mediante la síntesis de F2,6P2, promueve la glucolisis en
neuronas. En vista que la estimulación de receptores NMDA produce una estabilización
de PFKFB3, nos propusimos investigar sus posibles consecuencias funcionales. Para
ello, después de 6 horas post estimulación de los receptores NMDA, se midió la
actividad glucolítica en neuronas determinando la producción de 3H2O a partir de [3-3H]
glucosa. Como se muestra en la figura 9a, la estimulación de los receptores NMDA
produjo un incremento en la velocidad glucolítica en neuronas. Con el fin de comprobar
que ese efecto era debido a una acumulación de PFKFB3, diseñamos un siRNA contra
la proteína, cuya eficiencia fue comprobada por western blot. Para ello, la construcción
GFP-PFKFB3 se expresó en neuronas, lo que produjo una acumulación de la PFKFB3 a
juzgar por la intensidad de la banda obtenida con un anticuerpo anti-GFP (Figura 9b),
sin embargo, la transfección de las neuronas con siPFKFB3, disminuyó la abundancia
de la proteína, es más, el tratamiento con glutamato produjo un incremento en la
intensidad de la banda GFP-PFKFB3, sugiriendo una estabilización de la PFKFB3,
efecto que también se previno con siPFKFB3. Como se muestra en la figura 9a, el
incremento en la velocidad glucolítica producido por glutamato se previno en neuronas
previamente transfectadas con siPFKFB3, lo que indica que la estabilización de esta
proteína era la responsable del incremento en velocidad glucolítica observado. Es más,
en vista de que nuestros resultados previos muestran que la glucolisis y PPP son vías
dinámicamente relacionadas en neuronas, también investigamos si el incremento en
glucolisis afectaba a la actividad de la PPP. Como se muestra en la figura 9c, las
neuronas tratadas con glutamato también mostraron, a las 6 horas, una reducción de la
velocidad de oxidación de la glucosa por la PPP, un efecto que se previno
completamente en las neuronas previamente transfectadas con siPFKFB3. Por tanto,
nuestros resultados indican que la estimulación de receptores NMDA en neuronas
produce una inhibición, mediada por Ca2+ de la actividad de APC/C-Cdh1, que a su vez
origina una estabilización de PFKFB3 en el citosol, produciendo una desviación del
metabolismo de la glucosa hacia glucolisis, disminuyendo la PPP.

RESÚMEN EN ESPAÑOL
122
Figura 9. a) La incubación de neuronas con glutamato (100 μM/15 min) produjo un
incremento a las 6 horas de la velocidad glucolítica, determinada mediante la producción
de 3H2O a partir de [3-3H] glucosa; este efecto se previno evitando la acumulación de
PFKFB3 mediante una transfección previa de las neuronas con siPFKFB3. b) La
incubación de neuronas expresando GFP-PFKFB3 con glutamato(100 μM/15 min),
indujo, a las 6 horas post tratamiento, la acumulación de la proteína, efecto que se

RESÚMEN EN ESPAÑOL
123
previno en las neuronas previamente transfectadas con siPFKFB3 (100 nM). c) El
tratamiento con glutamato disminuyó, a las 6 horas post tratamiento, la velocidad de la
PPP, determinada mediante el cálculo de la diferencia entre el 14CO2 producido a partir
de [1-14C] glucosa y el producido a partir de [6-14C] glucosa; este efecto se previno en
las neuronas previamente transfectadas con siPFKFB3. *P<0.05 (ANOVA)(n=3).
10. La estimulación de receptores NMDA produce un defecto en la regeneración de glutatión mediada por la estabilización de PFKFB3
La oxidación de glucosa en la PPP genera NADPH(H+), un cofactor de múltiples
enzimas entre las que se encuentra la glutatión reductasa. La glutatión reductasa
necesita un aporte continuo de NADPH(H+) para regenerar glutatión (GSH) a partir de su
forma oxidada, GSSG. En vista de que la estimulación de receptores NMDA conlleva un
incremento en glucolisis y una disminución en la actividad de la PPP, quisimos saber si
esa disminución en la actividad de la PPP produce un desbalance en la capacidad de
las neuronas de regenerar glutatión. Para ello analizamos los niveles de glutatión total
(GSx) y oxidado (GSSG) en neuronas a las 6 horas de estimulación de los receptores
NMDA. Como se muestra en la figura 10, el tratamiento con glutamato no modificó la
concentración total de glutatión, pero incrementó significativamente su forma oxidada.
Todos estos efectos se previnieron parcialmente con siPFKFB3, indicando que fueron,
al menos en parte, mediados por la estabilización de PFKFB3 producida por la
estimulación de los receptores NMDA.

RESÚMEN EN ESPAÑOL
124
Figura 10. El tratamiento con glutamato no modificó la concentración de GSx (panel
izquierdo), pero incrementó la de GSSG (panel intermedio) y por tanto el estado redox
general del glutatión (GSSG/GSx; panel derecho); estos efectos se previnieron
parcialmente con siPFKFB3. Neuronas a 3 días de cultivo fueron transfectadas con
siControl o siPFKFB3 (100 nM). Al sexto día se trataron con glutamato (100 μM/15 min)
y los extractos celulares obtenidos a las 6 horas post tratamiento se utilizaron para la
determinación de glutatión. *P<0.05 (ANOVA)(n=3).
11. La desviación del metabolismo de la glucosa de la PPP a glucolisis como consecuencia de la estimulación de receptores NMDA produce estrés oxidativo
En vista de que el glutatión reducido es esencial para la detoxificación de las especies
reactivas de oxígeno mitocondriales, nos planteamos que el incremento en glutatión
oxidado mediado por NMDAR podría originar estrés oxidativo. Para comprobar esta
hipótesis, analizamos la abundancia de anión superóxido en la mitocondria, utilizando la
sonda MitoSox-Red. Como se muestra en la figura 11a, el tratamiento de las neuronas
con glutamato produjo, a las 16 horas, un incremento significativo en los niveles
mitocondriales de anión superóxido, sugiriendo estrés oxidativo. Este efecto se previno
silenciando la PGI, un tratamiento que, según nuestros resultados previos, es capaz de

RESÚMEN EN ESPAÑOL
125
incrementar la actividad de la PPP (figura 4b). Para comprobar si este efecto era
consecuencia de un incremento en la glucolisis, silenciamos PFKFB3 previamente al
tratamiento con glutamato. Como se muestra en la figura 11a, siPFKFB3 previno casi
totalmente el incremento en superóxido. Para apoyar la hipótesis de que el estrés
oxidativo mediado por la activación de receptores NMDA es debido, al menos en parte,
a una inhibición de la actividad de la PPP, nos propusimos investigar si este efecto se
prevenía al sobreexpresar la G6PD, la enzima limitante de la PPP. Como se muestra en
la figura 11b, la expresión del cDNA codificante para la proteína conllevó un aumento
significativo de los niveles de G6PD y este efecto fue suficiente para rescatar
completamente el incremento en superóxido mitocondrial causado por NMDA (Figura
11a). Finalmente, comprobamos que el efecto observado sobre los niveles
mitocondriales de superóxido era exclusivamente dependiente de la activación de
NMDA, a juzgar por la completa protección brindada por su antagonista, MK801 (figura
11b).

RESÚMEN EN ESPAÑOL
126
Figura 11. a) El tratamiento con glutamato (100 μM/15 min) incrementó los niveles de
anión superóxido en neuronas, medido mediante la detección de fluorescencia de
MitoSox-Red por citometría de flujo; este efecto se previno silenciando PGI (siPGI) o
PFKFB3 (siPFKFB3), sobreexpresando G6PD o bloqueando los receptores NMDA con
MK801 (10 μM). b) la transfección de neuronas con el cDNA completo codificante para
G6PD (1.6 μg/m) incrementó eficientemente la abundancia de la proteína. *P<0.05.
(ANOVA)(n=3).
12. La activación de receptores NMDA induce muerte neuronal por apoptosis como consecuencia de la desviación del metabolismo glucídico de la PPP a glucolisis
Como la estimulación de receptores NMDA produce estrés oxidativo como
consecuencia de la desviación del metabolismo de la glucosa hacia glucolisis, y dado
que el estrés oxidativo puede desencadenar la muerte neuronal, a continuación
quisimos investigar si esta modificación en el metabolismo producía muerte neuronal por
apoptosis. Para ello, las neuronas se trataron con glutamato (100 µM / 15 min) y 16
horas después se incubaron con anti anexina V y 7AAD con el fin de determinar
mediante citometría de flujo las neuronas que estaban sufriendo apoptosis. Como se
muestra en la figura 12, la proporción de neuronas anexina V+/7AAD- se incrementó
significativamente en las neuronas tratadas con glutamato. Este efecto se previno
parcialmente silenciando la PGI o la PFKFB3, sobre expresando la G6PD o bloqueando
los receptores NMDA con MK801. Por tanto, la estimulación de receptores NMDA
induce la muestre neuronal por apoptosis como consecuencia del cambio en el
metabolismo de la glucosa de PPP a glucolisis.

RESÚMEN EN ESPAÑOL
127
Figura 12. El tratamiento con glutamato incrementó la muerte neuronal por apoptosis,
como se pudo observar mediante el análisis por citometría de flujo de la relación de
células anexina V+/7AAD-; este efecto se previno silenciando PGI (siPGI, 100 nM) o
PFKFB3 (siPFKFB3, 100 nM), sobre expresando G6PD (1.6 μg/ml) o bloqueando los
receptores NMDA con MK801 (10 μM). *P<0.05.(ANOVA)(n=3).
13. La expresión de una forma mutada de PFKFB3 no detectable por APC/C-Cdh1 produce un efecto similar a la activación de receptores NMDA
Para apoyar los resultados que indican que la estabilización de PFKFB3 producida por
la inhibición de APC/C-Cdh1 es la responsable del estrés oxidativo y apoptosis, nos
propusimos investigar si este fenotipo podría ser reproducido mediante la expresión de
una forma mutada de la PFKFB3 que no puede ser reconocida por APC/C-Cdh1. Como
se muestra en la figura 13a, la incubación de neuronas expresando PFKFB3 silvestre
con glutamato, incrementó los niveles de superóxido en la mitocondria de forma similar
a las neuronas que expresaban la forma mutada (mutPFKFB3). La determinación de las
neuronas que estaban sufriendo un proceso de apoptosis produjo resultados idénticos
(figura 13b). En conjunto, estos resultados indican que la inhibición de APC/C-Cdh1
mediada por la estimulación de receptores NMDA produce una estabilización de
PFKFB3 que hace que aumenten los niveles de glutatión oxidado y finalmente origina la

RESÚMEN EN ESPAÑOL
128
muerte neuronal por apoptosis. Por tanto, PFKFB3 podría ser considerada una diana
terapéutica interesante en el tratamiento de desórdenes en el sistema nervioso central
en los que se haya descrito un exceso de neurotransmisión glutamatérgica
(excitotoxicicidad).
Figura 13. a) El tratamiento con glutamato (100 μM/15 min) incrementó los niveles de
superóxido en neuronas transfectadas con concentraciones pequeñas de PFKFB3
silvestre (0.16 μg/ml); la transfección de neuronas con las mismas cantidades de cDNA
de mutPFKFB3 incrementó los niveles de superóxido de manera similar al tratamiento
con glutamato; sin embargo, el glutamato no incrementó más los niveles de superóxido
en neuronas expresando mutPFKFB3. b) El tratamiento con glutamato incrementó la
muerte por apoptosis en neuronas transfectadas con niveles bajos de cDNA de PFKFB3
silvestre; la transfección con cantidades idénticas de cDNA de mutPFKFB3 incrementó
la muerte por apoptosis de forma similar al glutamato; sin embargo, el glutamato no
incrementó aún más la apoptosis en las neuronas expresando mutPFKFB3. *P<0.05
(ANOVA)(n=3).

RESÚMEN EN ESPAÑOL
129
14. La proteína TIGAR, con función fructosa-2,6-bisfosfatasa, se encuentra expresada en neuronas
TIGAR (Tp53-inducible glycolysis and apoptotic regulator) es una proteína con actividad
fructosa-2,6-bisfosfatasa que ha sido recientemente descubierta. En vista de que
TIGAR podría tener efectos metabólicos opuestos a PFKFB3, nos preguntamos si la
regulación de la actividad glucolítica en neuronas podría estar regulada tanto por TIGAR
como por PFKFB3. Para ello, en primer lugar quisimos investigar si esta proteína está
expresada en neuronas corticales de rata y en astrocitos en cultivo primario, mediante
western blot. Como se muestra en la figura 14, TIGAR está expresada en ambos tipos
celulares, siendo su expresión algo mayor en neuronas.
15. Determinación de apoptosis y niveles de superóxido en neuronas procedentes de ratones KO de TIGAR
Dado que TIGAR presenta una actividad opuesta a la PFKFB3 y que previamente
hemos observado que la acumulación de PFKFB3 produce estrés oxidativo y muerte
neuronal por apoptosis, nos propusimos investigar si la deficiencia de TIGAR producía
efectos similares a la sobreexpresión de PFKFB3. Para ello en primer lugar utilizamos
ratones KO para TIGAR disponibles en el grupo de la doctora Karen Vousden (Beatson
Institute for Cancer Research, Glasgow, Reino Unido) y realizamos cultivos primarios de
neuronas corticales para medir los niveles de superóxido y la muerte por apoptosis.
Como se observa en las figuras 15a y 15b, ni los niveles mitocondriales de superóxido ni
la muerte por apoptosis se vieron incrementados en las neuronas procedentes de estos
animales. Sin embargo, razonamos que puesto que estos ratones no son inducibles, el
Figura 14. TIGAR está presente tanto en
neuronas como astrocitos y las neuronas
presentan niveles ligeramente mayores
de la proteína. Neuronas a 6 días de
cultivo y astrocitos a día 15 se lisaron en
tampón RIPA y se sometieron a una
transferencia de western blot con el fin
de analizar los niveles de TIGAR en
ambos tipos celulares.

RESÚMEN EN ESPAÑOL
130
metabolismo glucolítico podría estar sufriendo algún proceso de compensación que
impidiera observar un fenotipo claro. Por ello decidimos realizar nuevos experimentos
modulando los niveles de TIGAR tanto por sobreexpresión como por silenciamiento.
Figura 15. Detección de los niveles de anión superóxido mitocondriales y la muerte
neuronal por apoptosis en neuronas de ratones silvestres y KO para TIGAR a 6 días de
cultivo. a) Las neuronas procedentes del ratón KO para TIGAR presentan niveles de
superóxido similares a los del silvestre, determinados mediante el análisis de
fluorescencia de MitoSox-Red por citometría de flujo. b) Las neuronas procedentes del
ratón KO para TIGAR no muestran un incremento significativo en los niveles de
apoptosis respecto al control, determinados mediante la relación de neuronas anexina
V+/7AAD- por citometría de flujo. (ANOVA).
16. TIGAR previene el incremento en superóxido mitocondrial y en apoptosis mediado por PFKFB3.
Seguidamente, decidimos investigar si el eje TIGAR-PFKFB3, mediante su capacidad
para regular la glucolisis, podría regular los niveles de superóxido y la supervivencia
neuronal. Para ello se expresó la forma mutPFKFB3 en concentraciones muy bajas
(0.16 μg/ml) en neuronas corticales de rata en cultivo primario que, como se ha
mostrado previamente, produce incrementos significativos en los niveles de superóxido
mitocondriales y en la muerte por apoptosis. La co-expresión de TIGAR a altas
concentraciones (1.6 μg/ml) previno completamente estos efectos (figuras 16a y 16b).

RESÚMEN EN ESPAÑOL
131
En conclusión, tanto el estrés oxidativo como la muerte neuronal por apoptosis parecen
estar regulados por el eje TIGAR-PFKFB3.
Figura 16 a) La neuronas que expresan mutPFKFB3 (0.16 μg/ml) presentan un
incremento en los niveles de anión superóxido mitocondrial, determinado mediante el
análisis, por citometría de flujo, de la fluorescencia de MitoSox-Red, en comparación
con las neuronas que expresan niveles idénticos de PFKFB3 silvestre. El incremento en
superóxido se previene sobreexpresando TIGAR (1.6 μg/ml). b) Las neuronas que
expresan niveles bajos de mutPFKFB3 presentan un incremento en la muerte por
apoptosis, determinada mediante la medida por citometría de flujo de la proporción de
células anexina V+/7AAD-, que también se previene sobreexpresando TIGAR. *P<0.05
(ANOVA)(n=3).
17. El silenciamiento de TIGAR no es suficiente para incrementar la velocidad glucolítica en neuronas primarias
Seguidamente, silenciamos TIGAR en neuronas primarias de ratón. Para ello,
diseñamos un siRNA contra TIGAR de Mus musculus. La transfección de neuronas con
siTIGAR produjo un considerable (aunque no completo) descenso en los niveles de
TIGAR después de 3 días (figura 17a). Sin embargo, no detectamos ningún incremento

RESÚMEN EN ESPAÑOL
132
significativo en la actividad glucolítica en neuronas transfectadas con siTIGAR respecto
a las transfectadas con siControl (figura 17b).
Figura 17. a) El siRNA de TIGAR silencia eficientemente los niveles de proteína en
neuronas a los 3 días de transfección. Neuronas a 3 días de cultivo fueron transfectadas
con siControl o siTIGAR (20 nM) a los 6 días de cultivo, las células se lisaron y se
analizaron los niveles de proteína mediante western blot. b) La velocidad glucolítica,
determinada mediante la producción de 3H2O a partir de [3-3H] glucosa no aumenta
significativamente en las neuronas transfectadas con siTIGAR.(ANOVA).
18. El silenciamiento de TIGAR en neuronas incrementa la muerte por apoptosis sin afectar a los niveles de superóxido
En vista que los resultados obtenidos sobre los niveles de superóxido y apoptosis
mediante la sobreexpressión de TIGAR eran aparentemente inconsistentes con los
obtenidos con el ratón KO, decidimos investigar esos efectos en neuronas en las que
previamente silenciamos TIGAR. Para ello las neuronas corticales primarias de ratón se
transfectaron con siTIGAR y posteriormente se trataron con glutamato, con el fin de
estimular los receptores NMDA. Como se muestra en la figura 18a, siTIGAR no
incrementó los niveles de superóxido, sin embargo, sí incrementó la muerte neuronal
por apoptosis, es más, las neuronas transfectadas con siTIGAR vieron potenciado el
efecto del glutamato sobre la muerte neuronal (figura 18b). En conjunto, nuestros
resultados sugieren que, independientemente de un posible control de la concentración

RESÚMEN EN ESPAÑOL
133
de fructosa-2,6-bisfosfato y de la glucolisis, TIGAR podría presentar otras funciones
sobre la supervivencia neuronal.
Figura 18. a) Los niveles de superóxido mitocondrial aumentan en las células tratadas
con glutamato, pero no en las que han sido transfectadas con siTIGAR. b) La muerte
neuronal por apoptosis se ve incrementada en neuronas transfectadas con siTIGAR y
potencia el efecto del glutamato. *P<0.05 (ANOVA)(n=3).
19. TIGAR presenta una localización nuclear en neuronas
Con el objetivo de intentar esclarecer el control sobre supervivencia neuronal
(independiente de la regulación metabólica) de TIGAR, decidimos investigar su
localización subcelular. Para ello, llevamos a cabo cultivos primarios de neuronas y
mixtos de neuronas y astrocitos a partir de embriones de ratón de 16 días de gestación.
La localización endógena de TIGAR se analizó por inmunofluorescencia en un
microscopio confocal. Como se muestra en la figura 19, TIGAR presenta una
localización tanto citosólica como nuclear en neuronas, a juzgar por su co-localización
con el marcador nuclear TOPRO-3. Sin embargo, TIGAR no está presente en el núcleo
en astrocitos. Estos resultados sugieren que, al menos en neuronas, TIGAR podría
presentar una función citoprotectora, aún desconocida, en el núcleo.

RESÚMEN EN ESPAÑOL
134
Figura 19. El análisis por inmunofluorescencia de la localización endógena de TIGAR
muestra una localización citoplasmática y nuclear en neuronas. En astrocitos, sin
embargo, la localización es únicamente citoplasmática Barra de escala: 20 μm.

RESÚMEN EN ESPAÑOL
135
CONCLUSIONES
A la vista de los resultados presentados en este trabajo, hemos obtenido las siguientes
conclusiones:
1- Los ensayos radiométricos basados en la medida de la incorporación de [3-3H]
glucosa en 3H2O, y en la diferencia de la incorporación de [1-14C] glucosa y [6-14C]
glucosa en 14CO2, son específicos para determinar las velocidades glucolítica y de la
PPP, respectivamente, en neuronas en placa. Sin embargo, la fosfoglucosa isomerasa
en neuronas funciona cercana al equilibrio, lo que origina la dilución isotópica de [14C]
glucosa debido al reciclaje de fructosa-6-fosfato no marcada en glucosa-6-fosfato.
Debido a esto, la velocidad de la PPP medida está ampliamente infraestimada.
2- Las neuronas metabolizan, aproximadamente, el doble de la glucosa-6-fosfato por la
vía de las pentosas-fosfato y el resto por glucolisis en condiciones de reposo; sin
embargo, esta relación está sujeta a regulación para adaptarse a diferentes condiciones
de estrés.
3- La sobre estimulación de los receptores de glutamato, en concreto el subtipo NMDA,
es suficiente para producir la estabilización de PFKFB3, ocasionando una modificación
del metabolismo de la glucosa de PPP a glucolisis. En consecuencia, el estado redox
del glutatión cambia, produciendo estrés oxidativo y muerte neuronal por apoptosis.
Estos resultados identifican PFKFB3 como una nueva diana terapéutica contra la
excitotoxicidad.
4- La reciente descubierta fructose-2.6-bisfosfatasa TIGAR está expresada en neuronas,
donde contribuye a la regulación de la glucolisis neuronal. De este modo, la sobre
expresión de TIGAR previene de la muerte neuronal por apoptosis producida por
PFKFB3. En cambio, el silenciamiento de TIGAR produce un incremento en la muerte
neuronal por apoptosis que es independiente de los niveles de superóxido. Estos
resultados, junto con la presencia de TIGAR en el núcleo, sugieren una función, aún por
determinar de esta proteína en neuronas.

136

137
8. REFERENCES


REFERENCES
139
REFERENCES
Aarts, M., Liu, Y., Liu, L., Besshoh, S., Arundine, M., Gurd, J. W., Wang, Y. T., Salter, M. W. and Tymianski, M. (2002) Treatment of ischemic brain damage by perturbing NMDA receptor- PSD-95 protein interactions. Science, 298, 846-850. Almeida, A., Almeida, J., Bolanos, J. P. and Moncada, S. (2001) Different responses of astrocytes and neurons to nitric oxide: the role of glycolytically generated ATP in astrocyte protection. Proc Natl Acad Sci U S A, 98, 15294-15299. Almeida, A. and Bolanos, J. P. (2001) A transient inhibition of mitochondrial ATP synthesis by nitric oxide synthase activation triggered apoptosis in primary cortical neurons. J Neurochem, 77, 676-690. Almeida, A., Bolanos, J. P. and Moncada, S. (2010) E3 ubiquitin ligase APC/C-Cdh1 accounts for the Warburg effect by linking glycolysis to cell proliferation. Proc Natl Acad Sci U S A, 107, 738-741. Almeida, A., Bolanos, J. P. and Moreno, S. (2005) Cdh1/Hct1-APC is essential for the survival of postmitotic neurons. J Neurosci, 25, 8115-8121. Almeida, A., Heales, S. J., Bolanos, J. P. and Medina, J. M. (1998) Glutamate neurotoxicity is associated with nitric oxide-mediated mitochondrial dysfunction and glutathione depletion. Brain Res, 790, 209-216. Almeida, A., Moncada, S. and Bolanos, J. P. (2004) Nitric oxide switches on glycolysis through the AMP protein kinase and 6-phosphofructo-2-kinase pathway. Nat Cell Biol, 6, 45-51. Alvarez, G., Ramos, M., Ruiz, F., Satrustegui, J. and Bogonez, E. (2003) Pyruvate protection against beta-amyloid-induced neuronal death: role of mitochondrial redox state. J Neurosci Res, 73, 260-269. Ames, A., 3rd (2000) CNS energy metabolism as related to function. Brain Res Brain Res Rev, 34, 42-68. Ando, M., Uehara, I., Kogure, K., Asano, Y., Nakajima, W., Abe, Y., Kawauchi, K. and Tanaka, N. (2010) Interleukin 6 enhances glycolysis through expression of the glycolytic enzymes hexokinase 2 and 6-phosphofructo-2-kinase/fructose-2,6-bisphosphatase-3. J Nippon Med Sch, 77, 97-105. Araujo, I. M., Carreira, B. P., Pereira, T. et al. (2007) Changes in calcium dynamics following the reversal of the sodium-calcium exchanger have a key role in AMPA receptor-mediated neurodegeneration via calpain activation in hippocampal neurons. Cell Death Differ, 14, 1635-1646. Attwell, D. and Laughlin, S. B. (2001) An energy budget for signaling in the grey matter of the brain. J Cereb Blood Flow Metab, 21, 1133-1145. Aviles-Olmos, I., Limousin, P., Lees, A. and Foltynie, T. (2013) Parkinson's disease, insulin resistance and novel agents of neuroprotection. Brain, 136, 374-384.

REFERENCES
140
Bak, L. K., Obel, L. F., Walls, A. B., Schousboe, A., Faek, S. A., Jajo, F. S. and Waagepetersen, H. S. (2012) Novel model of neuronal bioenergetics: postsynaptic utilization of glucose but not lactate correlates positively with Ca2+ signalling in cultured mouse glutamatergic neurons. ASN Neuro, 4. Bak, L. K., Schousboe, A., Sonnewald, U. and Waagepetersen, H. S. (2006) Glucose is necessary to maintain neurotransmitter homeostasis during synaptic activity in cultured glutamatergic neurons. J Cereb Blood Flow Metab, 26, 1285-1297. Bak, L. K., Walls, A. B., Schousboe, A., Ring, A., Sonnewald, U. and Waagepetersen, H. S. (2009) Neuronal glucose but not lactate utilization is positively correlated with NMDA-induced neurotransmission and fluctuations in cytosolic Ca2+ levels. J Neurochem, 109 Suppl 1, 87-93. Baki, A., Tompa, P., Alexa, A., Molnar, O. and Friedrich, P. (1996) Autolysis parallels activation of mu-calpain. Biochem J, 318 ( Pt 3), 897-901. Bano, D., Young, K. W., Guerin, C. J., Lefeuvre, R., Rothwell, N. J., Naldini, L., Rizzuto, R., Carafoli, E. and Nicotera, P. (2005) Cleavage of the plasma membrane Na+/Ca2+ exchanger in excitotoxicity. Cell, 120, 275-285. Baquer, N. Z., Hothersall, J. S. and McLean, P. (1988) Function and regulation of the pentose phosphate pathway in brain. Curr Top Cell Regul, 29, 265-289. Barford, D. (2011) Structural insights into anaphase-promoting complex function and mechanism. Philos Trans R Soc Lond B Biol Sci, 366, 3605-3624. Bartrons, R. and Caro, J. (2007) Hypoxia, glucose metabolism and the Warburg's effect. J Bioenerg Biomembr, 39, 223-229. Ben-Yoseph, O., Boxer, P. A. and Ross, B. D. (1994) Oxidative stress in the central nervous system: monitoring the metabolic response using the pentose phosphate pathway. Dev Neurosci, 16, 328-336. Bensaad, K., Cheung, E. C. and Vousden, K. H. (2009) Modulation of intracellular ROS levels by TIGAR controls autophagy. EMBO J, 28, 3015-3026. Bensaad, K., Tsuruta, A., Selak, M. A., Vidal, M. N., Nakano, K., Bartrons, R., Gottlieb, E. and Vousden, K. H. (2006) TIGAR, a p53-inducible regulator of glycolysis and apoptosis. Cell, 126, 107-120. Bergmeyer, H. U., Bernt, E., Schmidt, F. and Stork, H. (1974) Determination with hexokinase and glucoses-phosphate dehydrogenase. In: Methods of Enzymatic Analysis pp. 1196-1201. Verlag Chemie GmbH, Weinheim. Biagiotti, E., Guidi, L., Del Grande, P. and Ninfali, P. (2003) Glucose-6-phosphate dehydrogenase expression associated with NADPH-dependent reactions in cerebellar neurons. Cerebellum, 2, 178-183. Blazquez, C., Woods, A., de Ceballos, M. L., Carling, D. and Guzman, M. (1999) The AMP-activated protein kinase is involved in the regulation of ketone body production by astrocytes. J Neurochem, 73, 1674-1682. Bolanos, J. P. (2013) Adapting glycolysis to cancer cell proliferation: the MAPK pathway focuses on PFKFB3. Biochem J, 452, e7-9.

REFERENCES
141
Bolanos, J. P., Peuchen, S., Heales, S. J., Land, J. M. and Clark, J. B. (1994) Nitric oxide-mediated inhibition of the mitochondrial respiratory chain in cultured astrocytes. J Neurochem, 63, 910-916. Boumezbeur, F., Petersen, K. F., Cline, G. W., Mason, G. F., Behar, K. L., Shulman, G. I. and Rothman, D. L. (2010) The contribution of blood lactate to brain energy metabolism in humans measured by dynamic 13C nuclear magnetic resonance spectroscopy. J Neurosci, 30, 13983-13991. Bouzier-Sore, A. K., Voisin, P., Bouchaud, V., Bezancon, E., Franconi, J. M. and Pellerin, L. (2006) Competition between glucose and lactate as oxidative energy substrates in both neurons and astrocytes: a comparative NMR study. Eur J Neurosci, 24, 1687-1694. Bouzier-Sore, A. K., Voisin, P., Canioni, P., Magistretti, P. J. and Pellerin, L. (2003) Lactate is a preferential oxidative energy substrate over glucose for neurons in culture. J Cereb Blood Flow Metab, 23, 1298-1306. Brand, M. D. (2011) The sites and topology of mitochondrial superoxide production. Exp Gerontol, 45, 466-472. Brekke, E. M., Walls, A. B., Schousboe, A., Waagepetersen, H. S. and Sonnewald, U. (2012) Quantitative importance of the pentose phosphate pathway determined by incorporation of 13C from [2-13C]- and [3-13C]glucose into TCA cycle intermediates and neurotransmitter amino acids in functionally intact neurons. J Cereb Blood Flow Metab, 32, 1788-1799. Broadstock, M., Austin, P. J., Betts, M. J. and Duty, S. (2012) Antiparkinsonian potential of targeting group III metabotropic glutamate receptor subtypes in the rodent substantia nigra pars reticulata. Br J Pharmacol, 165, 1034-1045. Bruno, V., Battaglia, G., Kingston, A., O'Neill, M. J., Catania, M. V., Di Grezia, R. and Nicoletti, F. (1999) Neuroprotective activity of the potent and selective mGlu1a metabotropic glutamate receptor antagonist, (+)-2-methyl-4 carboxyphenylglycine (LY367385): comparison with LY357366, a broader spectrum antagonist with equal affinity for mGlu1a and mGlu5 receptors. Neuropharmacology, 38, 199-207. Brustovetsky, T., Bolshakov, A. and Brustovetsky, N. (2010) Calpain activation and Na+/Ca2+ exchanger degradation occur downstream of calcium deregulation in hippocampal neurons exposed to excitotoxic glutamate. J Neurosci Res, 88, 1317-1328. Butcher, S. P. and Hamberger, A. (1987) In vivo studies on the extracellular, and veratrine-releasable, pools of endogenous amino acids in the rat striatum: effects of corticostriatal deafferentation and kainic acid lesion. J Neurochem, 48, 713-721. Carbonell, J., Feliu, J. E., Marco, R. and Sols, A. (1973) Pyruvate kinase. Classes of regulatory isoenzymes in mammalian tissues. Eur J Biochem, 37, 148-156. Carvalho, C., Cardoso, S., Correia, S. C., Santos, R. X., Santos, M. S., Baldeiras, I., Oliveira, C. R. and Moreira, P. I. (2012) Metabolic alterations induced by sucrose intake and Alzheimer's disease promote similar brain mitochondrial abnormalities. Diabetes, 61, 1234-1242. Castellano, C., Cestari, V. and Ciamei, A. (2001) NMDA receptors and learning and memory processes. Curr Drug Targets, 2, 273-283.

REFERENCES
142
Cataldo, A. M. and Broadwell, R. D. (1986) Cytochemical identification of cerebral glycogen and glucose-6-phosphatase activity under normal and experimental conditions. II. Choroid plexus and ependymal epithelia, endothelia and pericytes. J Neurocytol, 15, 511-524. Ciarmiello, A., Cannella, M., Lastoria, S., Simonelli, M., Frati, L., Rubinsztein, D. C. and Squitieri, F. (2006) Brain white-matter volume loss and glucose hypometabolism precede the clinical symptoms of Huntington's disease. J Nucl Med, 47, 215-222. Cidad, P., Almeida, A. and Bolanos, J. P. (2004) Inhibition of mitochondrial respiration by nitric oxide rapidly stimulates cytoprotective GLUT3-mediated glucose uptake through 5'-AMP-activated protein kinase. Biochem J, 384, 629-636. Collins, G. H., Cowden, R. R. and Nevis, A. H. (1968) Myoclonus epilepsy with Lafora bodies. An ultrastruc- tural and cytochemical study. Arch Pathol, 86, 239-254. Collins, M. O., Husi, H., Yu, L., Brandon, J. M., Anderson, C. N., Blackstock, W. P., Choudhary, J. S. and Grant, S. G. (2006) Molecular characterization and comparison of the components and multiprotein complexes in the postsynaptic proteome. J Neurochem, 97 Suppl 1, 16-23. Cunnane, S., Nugent, S., Roy, M. et al. (2011) Brain fuel metabolism, aging, and Alzheimer's disease. Nutrition, 27, 3-20. Cheng, K. and Ip, N. Y. (2003) Cdk5: a new player at synapses. Neurosignals, 12, 180-190. Cheung, E. C., Athineos, D., Lee, P. et al. (2013) TIGAR Is Required for Efficient Intestinal Regeneration and Tumorigenesis. Dev Cell. Cheung, E. C., Ludwig, R. L. and Vousden, K. H. (2012) Mitochondrial localization of TIGAR under hypoxia stimulates HK2 and lowers ROS and cell death. Proc Natl Acad Sci U S A, 109, 20491-20496. Chittajallu, R., Vignes, M., Dev, K. K., Barnes, J. M., Collingridge, G. L. and Henley, J. M. (1996) Regulation of glutamate release by presynaptic kainate receptors in the hippocampus. Nature, 379, 78-81. Choi, D. W. (1987) Ionic dependence of glutamate neurotoxicity. J Neurosci, 7, 369-379. Choi, I. Y., Seaquist, E. R. and Gruetter, R. (2003) Effect of hypoglycemia on brain glycogen metabolism in vivo. J Neurosci Res, 72, 25-32. Choo, A. M., Geddes-Klein, D. M., Hockenberry, A., Scarsella, D., Mesfin, M. N., Singh, P., Patel, T. P. and Meaney, D. F. (2012) NR2A and NR2B subunits differentially mediate MAP kinase signaling and mitochondrial morphology following excitotoxic insult. Neurochem Int, 60, 506-516. Chuquet, J., Quilichini, P., Nimchinsky, E. A. and Buzsaki, G. (2010) Predominant enhancement of glucose uptake in astrocytes versus neurons during activation of the somatosensory cortex. J Neurosci, 30, 15298-15303. Delgado-Esteban, M., Almeida, A. and Bolanos, J. P. (2000) D-Glucose prevents glutathione oxidation and mitochondrial damage after glutamate receptor stimulation in rat cortical primary neurons. J Neurochem, 75, 1618-1624.

REFERENCES
143
Dong, X. X., Wang, Y. and Qin, Z. H. (2009) Molecular mechanisms of excitotoxicity and their relevance to pathogenesis of neurodegenerative diseases. Acta Pharmacol Sin, 30, 379-387. Dringen, R. (2000) Metabolism and functions of glutathione in brain. Prog Neurobiol, 62, 649-671. Dringen, R., Gebhardt, R. and Hamprecht, B. (1993) Glycogen in astrocytes: possible function as lactate supply for neighboring cells. Brain Res, 623, 208-214. Dringen, R., Gutterer, J. M., Gros, C. and Hirrlinger, J. (2001) Aminopeptidase N mediates the utilization of the GSH precursor CysGly by cultured neurons. J Neurosci Res, 66, 1003-1008. Dugan, L. L., Sensi, S. L., Canzoniero, L. M., Handran, S. D., Rothman, S. M., Lin, T. S., Goldberg, M. P. and Choi, D. W. (1995) Mitochondrial production of reactive oxygen species in cortical neurons following exposure to N-methyl-D-aspartate. J Neurosci, 15, 6377-6388. Dunaway, G. A., Kasten, T. P., Sebo, T. and Trapp, R. (1988) Analysis of the phosphofructokinase subunits and isoenzymes in human tissues. Biochem J, 251, 677-683. Emile, L., Mercken, L., Apiou, F., Pradier, L., Bock, M. D., Menager, J., Clot, J., Doble, A. and Blanchard, J. C. (1996) Molecular cloning, functional expression, pharmacological characterization and chromosomal localization of the human metabotropic glutamate receptor type 3. Neuropharmacology, 35, 523-530. Estrada-Sanchez, A. M., Montiel, T., Segovia, J. and Massieu, L. (2009) Glutamate toxicity in the striatum of the R6/2 Huntington's disease transgenic mice is age-dependent and correlates with decreased levels of glutamate transporters. Neurobiol Dis, 34, 78-86. Farrar, G. and Farrar, W. W. (1995) Purification and properties of the pyruvate kinase isozyme M1 from the pig brain. Int J Biochem Cell Biol, 27, 1145-1151. Ferreira, J. M., Burnett, A. L. and Rameau, G. A. (2011) Activity-dependent regulation of surface glucose transporter-3. J Neurosci, 31, 1991-1999. Filomeni, G., Cardaci, S., Da Costa Ferreira, A. M., Rotilio, G. and Ciriolo, M. R. (2011) Metabolic oxidative stress elicited by the copper(II) complex [Cu(isaepy)2] triggers apoptosis in SH-SY5Y cells through the induction of the AMP-activated protein kinase/p38MAPK/p53 signalling axis: evidence for a combined use with 3-bromopyruvate in neuroblastoma treatment. Biochem J, 437, 443-453. Flohe, L., Gunzler, W., Jung, G., Schaich, E. and Schneider, F. (1971) [Glutathione peroxidase. II. Substrate specificity and inhibitory effects of substrate analogues]. Hoppe Seylers Z Physiol Chem, 352, 159-169. Flohe, L., Toppo, S., Cozza, G. and Ursini, F. (2011) A comparison of thiol peroxidase mechanisms. Antioxid Redox Signal, 15, 763-780.

REFERENCES
144
Frolova, A. I., O'Neill, K. and Moley, K. H. (2011) Dehydroepiandrosterone inhibits glucose flux through the pentose phosphate pathway in human and mouse endometrial stromal cells, preventing decidualization and implantation. Mol Endocrinol, 25, 1444-1455. Fukui, H. and Moraes, C. T. (2008) The mitochondrial impairment, oxidative stress and neurodegeneration connection: reality or just an attractive hypothesis? Trends Neurosci, 31, 251-256. Garcia-Nogales, P., Almeida, A. and Bolanos, J. P. (2003) Peroxynitrite protects neurons against nitric oxide-mediated apoptosis. A key role for glucose-6-phosphate dehydrogenase activity in neuroprotection. The Journal of biological chemistry, 278, 864-874. Gimenez-Cassina, A., Lim, F., Cerrato, T., Palomo, G. M. and Diaz-Nido, J. (2009) Mitochondrial hexokinase II promotes neuronal survival and acts downstream of glycogen synthase kinase-3. J Biol Chem, 284, 3001-3011. Glodzik, L., King, K. G., Gonen, O., Liu, S., De Santi, S. and de Leon, M. J. (2008) Memantine decreases hippocampal glutamate levels: a magnetic resonance spectroscopy study. Prog Neuropsychopharmacol Biol Psychiatry, 32, 1005-1012. Goodwin, G. W., Cohen, D. M. and Taegtmeyer, H. (2001) [5-3H]glucose overestimates glycolytic flux in isolated working rat heart: role of the pentose phosphate pathway. Am J Physiol Endocrinol Metab, 280, E502-508. Grueter, B. A. and Winder, D. G. (2005) Group II and III metabotropic glutamate receptors suppress excitatory synaptic transmission in the dorsolateral bed nucleus of the stria terminalis. Neuropsychopharmacology, 30, 1302-1311. Gunter, K. K. and Gunter, T. E. (1994) Transport of calcium by mitochondria. J Bioenerg Biomembr, 26, 471-485. Gunter, T. E. and Gunter, K. K. (2001) Uptake of calcium by mitochondria: transport and possible function. IUBMB Life, 52, 197-204. Gutmann, I. and Wahlefeld, A. W. (1974) Methods of Enzymatic Analysis (ed. Bergmeyer, H. U.) pp. 1464-1468. Weinheim. Guzman, M. and Blazquez, C. (2004) Ketone body synthesis in the brain: possible neuroprotective effects. Prostaglandins Leukot Essent Fatty Acids, 70, 287-292. Halim, N. D., McFate, T., Mohyeldin, A. et al. (2010) Phosphorylation status of pyruvate dehydrogenase distinguishes metabolic phenotypes of cultured rat brain astrocytes and neurons. Glia, 58, 1168-1176. Halliwell, B. (2011) Free radicals and antioxidants - quo vadis? Trends Pharmacol Sci, 32, 125-130. Hardingham, G. E. and Bading, H. (2010) Synaptic versus extrasynaptic NMDA receptor signalling: implications for neurodegenerative disorders. Nat Rev Neurosci, 11, 682-696.

REFERENCES
145
Hardingham, G. E., Fukunaga, Y. and Bading, H. (2002) Extrasynaptic NMDARs oppose synaptic NMDARs by triggering CREB shut-off and cell death pathways. Nat Neurosci, 5, 405-414. Heales, S. J., Bolanos, J. P., Land, J. M. and Clark, J. B. (1994) Trolox protects mitochondrial complex IV from nitric oxide-mediated damage in astrocytes. Brain Res, 668, 243-245. Heine, M., Thoumine, O., Mondin, M., Tessier, B., Giannone, G. and Choquet, D. (2008) Activity-independent and subunit-specific recruitment of functional AMPA receptors at neurexin/neuroligin contacts. Proc Natl Acad Sci U S A, 105, 20947-20952. Hekimi, S., Lapointe, J. and Wen, Y. (2011) Taking a "good" look at free radicals in the aging process. Trends Cell Biol, 21, 569-576. Herrero-Mendez, A., Almeida, A., Fernandez, E., Maestre, C., Moncada, S. and Bolanos, J. P. (2009) The bioenergetic and antioxidant status of neurons is controlled by continuous degradation of a key glycolytic enzyme by APC/C-Cdh1. Nat Cell Biol, 11, 747-752. Hirrlinger, J., Schulz, J. B. and Dringen, R. (2002) Glutathione release from cultured brain cells: multidrug resistance protein 1 mediates the release of GSH from rat astroglial cells. J Neurosci Res, 69, 318-326. Howland, D. S., Liu, J., She, Y. et al. (2002) Focal loss of the glutamate transporter EAAT2 in a transgenic rat model of SOD1 mutant-mediated amyotrophic lateral sclerosis (ALS). Proc Natl Acad Sci U S A, 99, 1604-1609. Hsieh, M. H., Ho, S. C., Yeh, K. Y., Pawlak, C. R., Chang, H. M., Ho, Y. J., Lai, T. J. and Wu, F. Y. (2012) Blockade of metabotropic glutamate receptors inhibits cognition and neurodegeneration in an MPTP-induced Parkinson's disease rat model. Pharmacol Biochem Behav, 102, 64-71. Hue, L. and Rider, M. H. (1987) Role of fructose 2,6-bisphosphate in the control of glycolysis in mammalian tissues. Biochem J, 245, 313-324. Jaquenoud, M., van Drogen, F. and Peter, M. (2002) Cell cycle-dependent nuclear export of Cdh1p may contribute to the inactivation of APC/C(Cdh1). EMBO J, 21, 6515-6526. Johnson, K. A., Jones, C. K., Tantawy, M. N., Bubser, M., Marvanova, M., Ansari, M. S., Baldwin, R. M., Conn, P. J. and Niswender, C. M. (2013) The metabotropic glutamate receptor 8 agonist (S)-3,4-DCPG reverses motor deficits in prolonged but not acute models of Parkinson's disease. Neuropharmacology, 66, 187-195. Joly, C., Gomeza, J., Brabet, I., Curry, K., Bockaert, J. and Pin, J. P. (1995) Molecular, functional, and pharmacological characterization of the metabotropic glutamate receptor type 5 splice variants: comparison with mGluR1. J Neurosci, 15, 3970-3981. Kanai, Y. and Hediger, M. A. (1992) Primary structure and functional characterization of a high-affinity glutamate transporter. Nature, 360, 467-471. Kasischke, K. A., Vishwasrao, H. D., Fisher, P. J., Zipfel, W. R. and Webb, W. W. (2004) Neural activity triggers neuronal oxidative metabolism followed by astrocytic glycolysis. Science, 305, 99-103.

REFERENCES
146
Kaufman, A. M., Milnerwood, A. J., Sepers, M. D. et al. (2012) Opposing roles of synaptic and extrasynaptic NMDA receptor signaling in cocultured striatal and cortical neurons. J Neurosci, 32, 3992-4003. Khodorov, B., Pinelis, V., Vergun, O., Storozhevykh, T. and Vinskaya, N. (1996) Mitochondrial deenergization underlies neuronal calcium overload following a prolonged glutamate challenge. FEBS Lett, 397, 230-234. Klepper, J. and Voit, T. (2002) Facilitated glucose transporter protein type 1 (GLUT1) deficiency syndrome: impaired glucose transport into brain-- a review. Eur J Pediatr, 161, 295-304. Knott, A. B., Perkins, G., Schwarzenbacher, R. and Bossy-Wetzel, E. (2008) Mitochondrial fragmentation in neurodegeneration. Nat Rev Neurosci, 9, 505-518. Kruman, II, Pedersen, W. A., Springer, J. E. and Mattson, M. P. (1999) ALS-linked Cu/Zn-SOD mutation increases vulnerability of motor neurons to excitotoxicity by a mechanism involving increased oxidative stress and perturbed calcium homeostasis. Exp Neurol, 160, 28-39. Laloux, M., Van Schaftingen, E., Francois, J. and Hers, H. G. (1985) Phosphate dependency of phosphofructokinase 2. Eur J Biochem, 148, 155-159. Le, W. D., Colom, L. V., Xie, W. J., Smith, R. G., Alexianu, M. and Appel, S. H. (1995) Cell death induced by beta-amyloid 1-40 in MES 23.5 hybrid clone: the role of nitric oxide and NMDA-gated channel activation leading to apoptosis. Brain Res, 686, 49-60. Lee, M. S., Kwon, Y. T., Li, M., Peng, J., Friedlander, R. M. and Tsai, L. H. (2000) Neurotoxicity induces cleavage of p35 to p25 by calpain. Nature, 405, 360-364. Leo, G. C., Driscoll, B. F., Shank, R. P. and Kaufman, E. (1993) Analysis of [1-13C]D-glucose metabolism in cultured astrocytes and neurons using nuclear magnetic resonance spectroscopy. Dev Neurosci, 15, 282-288. Li, H. and Jogl, G. (2009) Structural and biochemical studies of TIGAR (TP53-induced glycolysis and apoptosis regulator). J Biol Chem, 284, 1748-1754. Lievens, J. C., Woodman, B., Mahal, A., Spasic-Boscovic, O., Samuel, D., Kerkerian-Le Goff, L. and Bates, G. P. (2001) Impaired glutamate uptake in the R6 Huntington's disease transgenic mice. Neurobiol Dis, 8, 807-821. Lipton, S. A. (2004) Failures and successes of NMDA receptor antagonists: molecular basis for the use of open-channel blockers like memantine in the treatment of acute and chronic neurologic insults. NeuroRx, 1, 101-110. Loaiza, A., Porras, O. H. and Barros, L. F. (2003) Glutamate triggers rapid glucose transport stimulation in astrocytes as evidenced by real-time confocal microscopy. J Neurosci, 23, 7337-7342. Luetjens, C. M., Bui, N. T., Sengpiel, B., Munstermann, G., Poppe, M., Krohn, A. J., Bauerbach, E., Krieglstein, J. and Prehn, J. H. (2000) Delayed mitochondrial dysfunction in excitotoxic neuron death: cytochrome c release and a secondary increase in superoxide production. J Neurosci, 20, 5715-5723.

REFERENCES
147
Madan, E., Gogna, R., Kuppusamy, P., Bhatt, M., Pati, U. and Mahdi, A. A. (2012) TIGAR induces p53-mediated cell-cycle arrest by regulation of RB-E2F1 complex. Br J Cancer, 107, 516-526. Maestre, C., Delgado-Esteban, M., Gomez-Sanchez, J. C., Bolanos, J. P. and Almeida, A. (2008) Cdk5 phosphorylates Cdh1 and modulates cyclin B1 stability in excitotoxicity. EMBO J, 27, 2736-2745. Mari, M., Morales, A., Colell, A., Garcia-Ruiz, C. and Fernandez-Checa, J. C. (2009) Mitochondrial glutathione, a key survival antioxidant. Antioxid Redox Signal, 11, 2685-2700. Marsin, A. S., Bouzin, C., Bertrand, L. and Hue, L. (2002) The stimulation of glycolysis by hypoxia in activated monocytes is mediated by AMP-activated protein kinase and inducible 6-phosphofructo-2-kinase. J Biol Chem, 277, 30778-30783. Mateo, Z. and Porter, J. T. (2007) Group II metabotropic glutamate receptors inhibit glutamate release at thalamocortical synapses in the developing somatosensory cortex. Neuroscience, 146, 1062-1072. Matsuda, K., Fletcher, M., Kamiya, Y. and Yuzaki, M. (2003) Specific assembly with the NMDA receptor 3B subunit controls surface expression and calcium permeability of NMDA receptors. J Neurosci, 23, 10064-10073. Mattson, M. P., Cheng, B., Davis, D., Bryant, K., Lieberburg, I. and Rydel, R. E. (1992) beta-Amyloid peptides destabilize calcium homeostasis and render human cortical neurons vulnerable to excitotoxicity. J Neurosci, 12, 376-389. McDonald, J. W. and Johnston, M. V. (1990) Physiological and pathophysiological roles of excitatory amino acids during central nervous system development. Brain Res Brain Res Rev, 15, 41-70. Minchenko, A., Leshchinsky, I., Opentanova, I., Sang, N., Srinivas, V., Armstead, V. and Caro, J. (2002) Hypoxia-inducible factor-1-mediated expression of the 6-phosphofructo-2-kinase/fructose-2,6-bisphosphatase-3 (PFKFB3) gene. Its possible role in the Warburg effect. J Biol Chem, 277, 6183-6187. Mosconi, L., Pupi, A. and De Leon, M. J. (2008) Brain glucose hypometabolism and oxidative stress in preclinical Alzheimer's disease. Ann N Y Acad Sci, 1147, 180-195. Murphy, M. P. (2009) How mitochondria produce reactive oxygen species. Biochem J, 417, 1-13. Nelson, D. L. and Cox, M. M. (2001) Lehninger, principles of biochemistry third edition. Nguyen, D., Alavi, M. V., Kim, K. Y. et al. (2011) A new vicious cycle involving glutamate excitotoxicity, oxidative stress and mitochondrial dynamics. Cell Death Dis, 2, e240. Novellasdemunt, L., Bultot, L., Manzano, A., Ventura, F., Rosa, J. L., Vertommen, D., Rider, M. H., Navarro-Sabate, A. and Bartrons, R. (2013) PFKFB3 activation in cancer cells by the p38/MK2 pathway in response to stress stimuli. Biochem J, 452, 531-543.

REFERENCES
148
Novellasdemunt, L., Obach, M., Millan-Arino, L., Manzano, A., Ventura, F., Rosa, J. L., Jordan, A., Navarro-Sabate, A. and Bartrons, R. (2012) Progestins activate 6-phosphofructo-2-kinase/fructose-2,6-bisphosphatase 3 (PFKFB3) in breast cancer cells. Biochem J, 442, 345-356. Obach, M., Navarro-Sabate, A., Caro, J. et al. (2004) 6-Phosphofructo-2-kinase (pfkfb3) gene promoter contains hypoxia-inducible factor-1 binding sites necessary for transactivation in response to hypoxia. J Biol Chem, 279, 53562-53570. Okar, D. A., Manzano, A., Navarro-Sabate, A., Riera, L., Bartrons, R. and Lange, A. J. (2001) PFK-2/FBPase-2: maker and breaker of the essential biofactor fructose-2,6-bisphosphate. Trends in biochemical sciences, 26, 30-35. Paoletti, P. and Neyton, J. (2007) NMDA receptor subunits: function and pharmacology. Curr Opin Pharmacol, 7, 39-47. Paul, S. and Connor, J. A. (2010) NR2B-NMDA receptor-mediated increases in intracellular Ca2+ concentration regulate the tyrosine phosphatase, STEP, and ERK MAP kinase signaling. J Neurochem, 114, 1107-1118. Payne, V. A., Arden, C., Wu, C., Lange, A. J. and Agius, L. (2005) Dual role of phosphofructokinase-2/fructose bisphosphatase-2 in regulating the compartmentation and expression of glucokinase in hepatocytes. Diabetes, 54, 1949-1957. Pellerin, L., Bouzier-Sore, A. K., Aubert, A., Serres, S., Merle, M., Costalat, R. and Magistretti, P. J. (2007) Activity-dependent regulation of energy metabolism by astrocytes: an update. Glia, 55, 1251-1262. Pellerin, L. and Magistretti, P. J. (1994) Glutamate uptake into astrocytes stimulates aerobic glycolysis: a mechanism coupling neuronal activity to glucose utilization. Proc Natl Acad Sci U S A, 91, 10625-10629. Pellerin, L., Pellegri, G., Bittar, P. G., Charnay, Y., Bouras, C., Martin, J. L., Stella, N. and Magistretti, P. J. (1998) Evidence supporting the existence of an activity-dependent astrocyte-neuron lactate shuttle. Dev Neurosci, 20, 291-299. Pierre, K. and Pellerin, L. (2005) Monocarboxylate transporters in the central nervous system: distribution, regulation and function. J Neurochem, 94, 1-14. Piert, M., Koeppe, R. A., Giordani, B., Berent, S. and Kuhl, D. E. (1996) Diminished glucose transport and phosphorylation in Alzheimer's disease determined by dynamic FDG-PET. J Nucl Med, 37, 201-208. Pines, G., Danbolt, N. C., Bjoras, M. et al. (1992) Cloning and expression of a rat brain L-glutamate transporter. Nature, 360, 464-467. Porras, O. H., Loaiza, A. and Barros, L. F. (2004) Glutamate mediates acute glucose transport inhibition in hippocampal neurons. J Neurosci, 24, 9669-9673. Porras, O. H., Ruminot, I., Loaiza, A. and Barros, L. F. (2008) Na(+)-Ca(2+) cosignaling in the stimulation of the glucose transporter GLUT1 in cultured astrocytes. Glia, 56, 59-68. Poyton, R. O., Ball, K. A. and Castello, P. R. (2009) Mitochondrial generation of free radicals and hypoxic signaling. Trends Endocrinol Metab, 20, 332-340.

REFERENCES
149
Puddifoot, C., Martel, M. A., Soriano, F. X., Camacho, A., Vidal-Puig, A., Wyllie, D. J. and Hardingham, G. E. (2012) PGC-1alpha negatively regulates extrasynaptic NMDAR activity and excitotoxicity. J Neurosci, 32, 6995-7000. Rebrin, I. and Sohal, R. S. (2008) Pro-oxidant shift in glutathione redox state during aging. Adv Drug Deliv Rev, 60, 1545-1552. Reynolds, A., Leake, D., Boese, Q., Scaringe, S., Marshall, W. S. and Khvorova, A. (2004) Rational siRNA design for RNA interference. Nat Biotechnol, 22, 326-330. Riera, L., Manzano, A., Navarro-Sabate, A., Perales, J. C. and Bartrons, R. (2002) Insulin induces PFKFB3 gene expression in HT29 human colon adenocarcinoma cells. Biochim Biophys Acta, 1589, 89-92. Rose, I. A. and Warms, J. V. (1967) Mitochondrial hexokinase. Release, rebinding, and location. J Biol Chem, 242, 1635-1645. Rothstein, J. D., Dykes-Hoberg, M., Pardo, C. A. et al. (1996) Knockout of glutamate transporters reveals a major role for astroglial transport in excitotoxicity and clearance of glutamate. Neuron, 16, 675-686. Rothstein, J. D., Van Kammen, M., Levey, A. I., Martin, L. J. and Kuncl, R. W. (1995) Selective loss of glial glutamate transporter GLT-1 in amyotrophic lateral sclerosis. Ann Neurol, 38, 73-84. Ruiz-Garcia, A., Monsalve, E., Novellasdemunt, L. et al. (2011) Cooperation of adenosine with macrophage Toll-4 receptor agonists leads to increased glycolytic flux through the enhanced expression of PFKFB3 gene. J Biol Chem, 286, 19247-19258. Samhan-Arias, A. K., Tyurina, Y. Y. and Kagan, V. E. (2011) Lipid antioxidants: free radical scavenging versus regulation of enzymatic lipid peroxidation. J Clin Biochem Nutr, 48, 91-95. Sanchez-Alvarez, R., Tabernero, A. and Medina, J. M. (2004) Endothelin-1 stimulates the translocation and upregulation of both glucose transporter and hexokinase in astrocytes: relationship with gap junctional communication. J Neurochem, 89, 703-714. Saraiva, L. M., Seixas da Silva, G. S., Galina, A., da-Silva, W. S., Klein, W. L., Ferreira, S. T. and De Felice, F. G. (2010) Amyloid-beta triggers the release of neuronal hexokinase 1 from mitochondria. PLoS One, 5, e15230. Schioth, H. B., Craft, S., Brooks, S. J., Frey, W. H., 2nd and Benedict, C. (2012) Brain insulin signaling and Alzheimer's disease: current evidence and future directions. Mol Neurobiol, 46, 4-10. Shah, K., Desilva, S. and Abbruscato, T. (2012) The Role of Glucose Transporters in Brain Disease: Diabetes and Alzheimer’s Disease. Int J Mol Sci, 13, 12629-12655. Shimizu, N., Matsunami, T. and Onishi, S. (1960) Histochemical demonstration of ascorbic acid in the locus coeruleus of the mammalian brain. Nature, 186, 479-480. Sokoloff, L. (1992) The brain as a chemical machine. Prog Brain Res, 94, 19-33.

REFERENCES
150
Sokoloff, L., Wechsler, R. L., Balls, K. and Kety, S. (1950) The relation of the cerebral O2 consumption to the total body metabolism in hyperthyroidism. J Clin Invest, 29, 847. Sotelo-Hitschfeld, T., Fernandez-Moncada, I. and Barros, L. F. (2012) Acute feedback control of astrocytic glycolysis by lactate. Glia, 60, 674-680. Starling, A. J., Andre, V. M., Cepeda, C., de Lima, M., Chandler, S. H. and Levine, M. S. (2005) Alterations in N-methyl-D-aspartate receptor sensitivity and magnesium blockade occur early in development in the R6/2 mouse model of Huntington's disease. J Neurosci Res, 82, 377-386. Suh, S. W., Bergher, J. P., Anderson, C. M., Treadway, J. L., Fosgerau, K. and Swanson, R. A. (2007) Astrocyte glycogen sustains neuronal activity during hypoglycemia: studies with the glycogen phosphorylase inhibitor CP-316,819 ([R-R*,S*]-5-chloro-N-[2-hydroxy-3-(methoxymethylamino)-3-oxo-1-(phenylmethyl)pro pyl]-1H-indole-2-carboxamide). J Pharmacol Exp Ther, 321, 45-50. Swanson, R. A. and Choi, D. W. (1993) Glial glycogen stores affect neuronal survival during glucose deprivation in vitro. J Cereb Blood Flow Metab, 13, 162-169. Swanson, R. A., Morton, M. M., Sagar, S. M. and Sharp, F. R. (1992) Sensory stimulation induces local cerebral glycogenolysis: demonstration by autoradiography. Neuroscience, 51, 451-461. Szutowicz, A., Bielarczyk, H., Jankowska-Kulawy, A., Pawelczyk, T. and Ronowska, A. (2013) Acetyl-CoA the Key Factor for Survival or Death of Cholinergic Neurons in Course of Neurodegenerative Diseases. Neurochem Res. Tanabe, Y., Masu, M., Ishii, T., Shigemoto, R. and Nakanishi, S. (1992) A family of metabotropic glutamate receptors. Neuron, 8, 169-179. Temple, M. D., Perrone, G. G. and Dawes, I. W. (2005) Complex cellular responses to reactive oxygen species. Trends Cell Biol, 15, 319-326. Thornton, B. R. and Toczyski, D. P. (2006) Precise destruction: an emerging picture of the APC. Genes Dev, 20, 3069-3078. Tietze, F. (1969) Enzymic method for quantitative determination of nanogram amounts of total and oxidized glutathione: applications to mammalian blood and other tissues. Anal Biochem, 27, 502-522. Tominaga, N., Tsujikawa, T., Minami, Y., Wu, R. F., Watanabe, F., Sakakibara, R. and Uyeda, K. (1997) Effect of replacement of the amino and the carboxyl termini of rat testis fructose 6-phosphate, 2-kinase:fructose 2,6-bisphosphatase with those of the liver and heart isozymes. Arch Biochem Biophys, 347, 275-281. Tompa, P., Baki, A., Schad, E. and Friedrich, P. (1996) The calpain cascade. Mu-calpain activates m-calpain. J Biol Chem, 271, 33161-33164. Ui-Tei, K., Naito, Y., Takahashi, F., Haraguchi, T., Ohki-Hamazaki, H., Juni, A., Ueda, R. and Saigo, K. (2004) Guidelines for the selection of highly effective siRNA sequences for mammalian and chick RNA interference. Nucleic Acids Res, 32, 936-948.

REFERENCES
151
Urushitani, M., Nakamizo, T., Inoue, R., Sawada, H., Kihara, T., Honda, K., Akaike, A. and Shimohama, S. (2001) N-methyl-D-aspartate receptor-mediated mitochondrial Ca(2+) overload in acute excitotoxic motor neuron death: a mechanism distinct from chronic neurotoxicity after Ca(2+) influx. J Neurosci Res, 63, 377-387. Uyeda, K. (1979) Phosphofructokinase. Adv Enzymol Relat Areas Mol Biol, 48, 193-244. Van Schaftingen, E., Lederer, B., Bartrons, R. and Hers, H. G. (1982) A kinetic study of pyrophosphate: fructose-6-phosphate phosphotransferase from potato tubers. Application to a microassay of fructose 2,6-bisphosphate. Eur J Biochem, 129, 191-195. Vaughn, A. E. and Deshmukh, M. (2008) Glucose metabolism inhibits apoptosis in neurons and cancer cells by redox inactivation of cytochrome c. Nat Cell Biol, 10, 1477-1483. Ventura, F., Rosa, J. L., Ambrosio, S., Gil, J. and Bartrons, R. (1991) 6-phosphofructo-2-kinase/fructose-2,6-bisphosphatase in rat brain. Biochem J, 276 ( Pt 2), 455-460. Vera, G. and Tapia, R. (2012) Activation of group III metabotropic glutamate receptors by endogenous glutamate protects against glutamate-mediated excitotoxicity in the hippocampus in vivo. J Neurosci Res, 90, 1055-1066. Vidaurre, O. G., Gascon, S., Deogracias, R., Sobrado, M., Cuadrado, E., Montaner, J., Rodriguez-Pena, A. and Diaz-Guerra, M. (2012) Imbalance of neurotrophin receptor isoforms TrkB-FL/TrkB-T1 induces neuronal death in excitotoxicity. Cell Death Dis, 3, e256. Vignes, M. and Collingridge, G. L. (1997) The synaptic activation of kainate receptors. Nature, 388, 179-182. Vilchez, D., Ros, S., Cifuentes, D. et al. (2007) Mechanism suppressing glycogen synthesis in neurons and its demise in progressive myoclonus epilepsy. Nat Neurosci, 10, 1407-1413. Vincent, I., Jicha, G., Rosado, M. and Dickson, D. W. (1997) Aberrant expression of mitotic cdc2/cyclin B1 kinase in degenerating neurons of Alzheimer's disease brain. J Neurosci, 17, 3588-3598. Visintin, R., Prinz, S. and Amon, A. (1997) CDC20 and CDH1: a family of substrate-specific activators of APC-dependent proteolysis. Science, 278, 460-463. Wamelink, M. M., Struys, E. A. and Jakobs, C. (2008) The biochemistry, metabolism and inherited defects of the pentose phosphate pathway: a review. J Inherit Metab Dis, 31, 703-717. Wang, G. J., Randall, R. D. and Thayer, S. A. (1994) Glutamate-induced intracellular acidification of cultured hippocampal neurons demonstrates altered energy metabolism resulting from Ca2+ loads. J Neurophysiol, 72, 2563-2569. Wang, Z., Gardiner, N. J. and Fernyhough, P. (2008) Blockade of hexokinase activity and binding to mitochondria inhibits neurite outgrowth in cultured adult rat sensory neurons. Neurosci Lett, 434, 6-11.

REFERENCES
152
Watanabe, F. and Furuya, E. (1999) Tissue-specific alternative splicing of rat brain fructose 6-phosphate 2-kinase/fructose 2,6-bisphosphatase. FEBS Lett, 458, 304-308. Watanabe, H. and Passonneau, J. V. (1973) Factors affecting the turnover of cerebral glycogen and limit dextrin in vivo. J Neurochem, 20, 1543-1554. Waxman, E. A. and Lynch, D. R. (2005) N-methyl-D-aspartate receptor subtypes: multiple roles in excitotoxicity and neurological disease. Neuroscientist, 11, 37-49. Weisova, P., Concannon, C. G., Devocelle, M., Prehn, J. H. and Ward, M. W. (2009) Regulation of glucose transporter 3 surface expression by the AMP-activated protein kinase mediates tolerance to glutamate excitation in neurons. J Neurosci, 29, 2997-3008. Weiss, J. H., Pike, C. J. and Cotman, C. W. (1994) Ca2+ channel blockers attenuate beta-amyloid peptide toxicity to cortical neurons in culture. J Neurochem, 62, 372-375. Wen, Y., Yang, S., Liu, R., Brun-Zinkernagel, A. M., Koulen, P. and Simpkins, J. W. (2004) Transient cerebral ischemia induces aberrant neuronal cell cycle re-entry and Alzheimer's disease-like tauopathy in female rats. J Biol Chem, 279, 22684-22692. White, R. J. and Reynolds, I. J. (1997) Mitochondria accumulate Ca2+ following intense glutamate stimulation of cultured rat forebrain neurones. J Physiol, 498 ( Pt 1), 31-47. Wiesinger, H., Hamprecht, B. and Dringen, R. (1997) Metabolic pathways for glucose in astrocytes. Glia, 21, 22-34. Wilson, J. E. (2003) Isozymes of mammalian hexokinase: structure, subcellular localization and metabolic function. J Exp Biol, 206, 2049-2057. Wroge, C. M., Hogins, J., Eisenman, L. and Mennerick, S. (2012) Synaptic NMDA receptors mediate hypoxic excitotoxic death. J Neurosci, 32, 6732-6742. Yalcin, A., Clem, B. F., Simmons, A. et al. (2009) Nuclear targeting of 6-phosphofructo-2-kinase (PFKFB3) increases proliferation via cyclin-dependent kinases. J Biol Chem, 284, 24223-24232. Yu, A. C., Drejer, J., Hertz, L. and Schousboe, A. (1983) Pyruvate carboxylase activity in primary cultures of astrocytes and neurons. J Neurochem, 41, 1484-1487. Zala, D., Hinckelmann, M. V., Yu, H., Lyra da Cunha, M. M., Liot, G., Cordelieres, F. P., Marco, S. and Saudou, F. (2013) Vesicular glycolysis provides on-board energy for fast axonal transport. Cell, 152, 479-491. Zielke, H. R., Zielke, C. L. and Baab, P. J. (2007) Oxidation of (14)C-labeled compounds perfused by microdialysis in the brains of free-moving rats. J Neurosci Res, 85, 3145-3149.

Excitotoxic stimulus stabilizes PFKFB3 causingpentose-phosphate pathway to glycolysis switchand neurodegeneration
P Rodriguez-Rodriguez1, E Fernandez1, A Almeida1,2 and JP Bolanos*,1
6-Phosphofructo-2-kinase/fructose-2,6-bisphosphatase-3 (PFKFB3) is a master regulator of glycolysis by its ability to synthesizefructose-2,6-bisphosphate, a potent allosteric activator of 6-phosphofructo-1-kinase. Being a substrate of the E3 ubiquitin ligaseanaphase-promoting complex-Cdh1 (APCCdh1), PFKFB3 is targeted to proteasomal degradation in neurons. Here, we show thatactivation of N-methyl-D-aspartate subtype of glutamate receptors (NMDAR) stabilized PFKFB3 protein in cortical neurons.Expressed PFKFB3 was found to be mainly localized in the nucleus, where it is subjected to degradation; however, expression ofPFKFB3 lacking the APCCdh1-targeting KEN motif, or following NMDAR stimulation, promoted accumulation of PFKFB3 and itsrelease from the nucleus to the cytosol through an excess Cdh1-inhibitable process. NMDAR-mediated increase in PFKFB3yielded neurons having a higher glycolysis and lower pentose-phosphate pathway (PPP); this led to oxidative stress andapoptotic neuronal death that was counteracted by overexpressing glucose-6-phosphate dehydrogenase, the rate-limitingenzyme of the PPP. Furthermore, expression of the mutant form of PFKFB3 lacking the KEN motif was sufficient to triggeroxidative stress and apoptotic death of neurons. These results reveal that, by inhibition of APCCdh1, glutamate receptorsactivation stabilizes PFKFB3 thus switching neuronal metabolism leading to oxidative damage and neurodegeneration.Cell Death and Differentiation (2012) 19, 1582–1589; doi:10.1038/cdd.2012.33; published online 16 March 2012
In contrast to the neuroprotective actions of mild glutamatergicsynaptic activity,1 persistent activation of the N-methyl-D-aspartate subtype of glutamate receptors (NMDAR) – includingthe extra-synaptic ones2 – is known to underlie the patho-genesis of a number of neurological disorders, includingAlzheimer’s disease, amyotrophic lateral sclerosis or stroke.3
This phenomenon, known as excitotoxicity, causes neuronalapoptotic death through a not yet fully understood mechanism,but it is thought to involve an increase in intracellular Ca2þ
through NMDAR, followed by plasma membrane depolari-zation and, hence, opening of voltage-gated Ca2þ channels,release from intracellular stores and reversal of the plasmamembrane Naþ /Ca2þ exchanger.4 This process eventuallytriggers the accumulation of mitochondrial Ca2þ , leadingto increased reactive oxygen species (ROS) formation,mitochondrial energy dysfunction, permeability transition poreopening and cytochrome c release.5 Besides mitochondria,it has also been recently shown that cytoplasmic NADPHoxidase has a key role in ROS production upon NMDARstimulation.6 Thus, Ca2þ influx activates protein kinase C,which in turn phosphorylates and activates p47phox; p47phox
coordinates NAPDH oxidase subunit organization, leading
to enzyme activation.6 Regardless the origin of ROS, it isthought that neurons are highly vulnerable to mitochondrialstress, likely because of their inability to sufficiently activateglycolysis and, hence, to transiently compensate energydeficiency.7,8 In contrast to neurons, astrocytes and otherproliferative cells readily invoke glycolysis as a cytoprotectivemechanism.8–11
Glycolysis is controlled by the activity of 6-phosphofructo-1-kinase, the activity of which is highly dependent on itspotent allosteric activator, fructose-2,6-bisphosphate (F2,6P2);in the brain, F2,6P2 biosynthesis almost exclusively relieson 6-phosphofructo-2-kinase/fructose-2,6-bisphosphatase-3(PFKFB3) activity.12,13 Previously, we reported that theinability of neurons to promote cytoprotective glycolysis isbecause of the virtual absence of PFKFB3.14 Furthermore,we recently found that PFKFB3, through its KEN motif, is asubstrate of the E3 ubiquitin ligase, anaphase-promotingcomplex (APC)-Cdh1 (APCCdh1),15 which accounts for thehigh instability of PFKFB3 and low glycolytic rate in neurons.15
Inhibition of APCCdh1 in postmitotic neurons triggers anaccumulation of its substrate, cyclin B1, which mediatesapoptotic death.16 Moreover, cyclin B1 accumulation can also
Received 07.10.11; revised 08.2.12; accepted 21.2.12; Edited by M Deshmukh; published online 16.3.12
1Departamento de Bioquimica y Biologia Molecular, Instituto de Neurociencias de Castilla y Leon, Universidad de Salamanca, Edificio Departamental, Salamanca,Spain and 2Unidad de Investigacion, Instituto de Estudios de Ciencias de la Salud de Castilla y Leon, Hospital Universitario de Salamanca, Salamanca, Spain*Corresponding author: JP Bolanos, Department of Biochemistry and Molecular Biology, University of Salamanca, Edificio Departamental, Lab. 122, Salamanca 37007,Spain. Tel: þ 34 923 294 781; Fax: þ 34 923 294 579; E-mail: [email protected]: oxidative stress; neurons; Cdh1; APC; glutamateAbbreviations: ANOVA, analysis of variance; APC, anaphase-promoting complex; Cdk5, cyclin-dependent kinase-5; cDNA, complementary DNA; DMSO, dimethylsulphoxide; EDTA, ethylene diamine tetraacetic acid; EGTA, ethylene glycol tetraacetic acid; G6PD, glucose-6-phosphate dehydrogenase; GFP, green fluorescentprotein; GSH, reduced glutathione; GSSG, oxidized glutathione; GSx, total glutathione; NMDA, N-methyl-D-aspartic acid; NMDAR, N-methyl-D-aspartic acid receptor;PFKFB3, 6-phosphofructo-2-kinase/fructose-2,6-bisphosphatase-3; PGI, phosphoglucose isomerase; PPP, pentose-phosphate pathway; ROS, reactive oxygenspecies; SDS, sodium dodecyl sulfate; siRNA, small interfering RNA; TIGAR, Tp53-inducible glycolysis and apoptosis factor
Cell Death and Differentiation (2012) 19, 1582–1589& 2012 Macmillan Publishers Limited All rights reserved 1350-9047/12
www.nature.com/cdd

be recapitulated by NMDAR stimulation, which activatescyclin-dependent kinase 5 (Cdk5)-mediated Cdh1 phosphor-ylation, leading to APCCdh1 inhibition.17 In view of the controlthat APCCdh1 exerts over PFKFB3 stability,15 here we hypo-thesized whether NMDAR stimulation, via APCCdh1 inhibition,17
regulates PFKFB3 protein levels in neurons. We show thatNMDAR activation, through inhibition of APCCdh1 causedPFKFB3 stabilization leading to increased glycolysis andreduced activity of the pentose-phosphate pathway (PPP). Thismetabolic alteration triggered oxidative damage and excitotoxicneuronal death, thus suggesting that modulators of neuronalenergy metabolism should be considered as targets intherapeutic strategies against neurodegenerative diseases.
Results
In order to test whether rat primary cortical neurons in cultureresponded to glutamate receptor activation, we first monitor-ized the changes in Fura-2 fluorescence. As shown inFigure 1a, Fura-2 F335/F363 ratio – an index of intracellularCa2þ levels – increased by B1.3-fold immediately after theaddition of glutamate (100 mM) or N-methyl-D-aspartate(NMDA; 100mM). Furthermore, pre-incubation of neurons
with the NMDAR antagonist, MK801 (10mM), prevented byB60% glutamate-mediated increase in F335/F363 ratio(Figure 1a, left panel); MK801 almost abolished (by B90%)NMDA-mediated increase in F335/F363 ratio (Figure 1a, rightpanel). These results suggest that, under our experimentalconditions – cells grown in serum-based medium – corticalneurons express functional NMDAR and, hence, are useful forthe study of excitotoxic-mediated metabolic changes. Toinvestigate whether glutamate receptor activation controlsPFKFB3 stability, we then incubated neurons with glutamate(100 mM/15 min), and the levels of PFKFB3 protein wereanalyzed by western blotting. As shown in Figure 1b,glutamate triggered a time-dependent increase in PFKFB3,an effect that was maximal (by B2.1-fold) after 6 h. To seewhether this effect was mediated by NMDAR, neurons wereincubated with NMDA (100 mM/15 min), and PFKFB3 proteinlevels analyzed 6 h later. As depicted in Figure 1c, NMDAmimicked glutamate at increasing PFKFB3. Moreover, incu-bation of neurons with MK801 prevented glutamate-mediatedincrease in PFKFB3 (Figure 1d). Glutamate did not alterPFKFB3 mRNA levels (Figure 1e). These results suggest thatactivation of NMDAR stabilizes PFKFB3 protein in neurons.
Next, we investigated the involvement of APCCdh1 activity indetermining PFKFB3 stabilization by NMDAR. In view thatNMDAR activation promotes APCCdh1 inhibition by Cdk5-mediated phosphorylation of Cdh1,17 we tested whether thisobservation could be confirmed in our conditions. As shown inFigure 2a, glutamate (100 mM/15 min) promoted, after 4 h, H1phosphorylation in neuronal samples immunoprecipitatedwith anti-Cdk5; furthermore, this effect was prevented byMK801, suggesting NMDAR-mediated activation of Cdk5activity. In addition, Cdh1 was phosphorylated – suggestingAPCCdh1 inhibition – 6 h after glutamate treatment, an effectthat was also prevented by MK801 (Figure 2b). To furtherinvestigate if APCCdh1 activity regulated PFKFB3 stabilityupon glutamate receptor stimulation, neurons were trans-fected with a green fluorescent protein (GFP)-PFKFB3construct to visualize PFKFB3 subcellular localization byconfocal microscopy. PFKFB3 was mainly localized in thenucleus of neurons, but glutamate treatment promoted itsaccumulation, as revealed by the spread (nuclear pluscytosolic) localization (Figures 2c and d). Interestingly, Cdh1overexpression prevented this effect, suggesting that defi-ciency in active Cdh1 was responsible for glutamate-mediatedPFKFB3 spreading (Figures 2c and d). Furthermore, expres-sion of a GFP-PFKFB3 form with its KEN box mutated toAAA (mut-PFKFB3), hence, insensitive to APCCdh1 activity,15
showed the spread-like localization, regardless of glutamatetreatment (Figures 2c and d). Thus, glutamate-mediatedPFKFB3 stabilization occurs via APCCdh1 inhibition.
To elucidate whether NMDAR-mediated PFKFB3 proteinstabilization had functional consequences for neuronalmetabolism, we assessed the rates of glycolysis and PPP,as well as the glutathione redox status. The efficacy of a smallinterfering RNA against PFKFB3 (siPFKFB3) to preventPFKFB3 protein accumulation was first tested. To do so,primary neurons were transfected with the GFP-PFKFB3complementary DNA (cDNA) construct, and PFKFB3 proteinwas determined using an anti-flag (anti-GFP) antibody. Asshown in Figure 3a, PFKFB3 was accumulated 6 h after
Figure 1 Activation of NMDAR stabilizes PFKFB3 protein in neurons.(a) Incubation of rat primary cortical neurons with glutamate (left panel) or NMDA(right panel) increased the ratio of Fura-2-dependent fluorescence (at 510 nm) obtainedafter excitation at 335/363 nm (F335/F363), indicating an increase in intracellularCa2þ . MK801 (10 mM) partially prevented glutamate-induced changes in F335/F363 ratio and most of NMDA-dependent F335/F363 ratio changes. (b) Incubationof neurons with glutamate (100mM/15 min) triggered time-dependent increase inPFKFB3 protein, which was maximal after 6 h. (c) NMDA (100mM/15 min) mimickedglutamate at increasing PFKFB3. (d) NMDA receptor antagonist, MK801 (10 mM),prevented glutamate-mediated increase in PFKFB3. (e) Glutamate (100mM/15 min)did not change PFKFB3 mRNA levels, as revealed by the unaltered intensity of thepredicted 300 bp band after reverse-transcription of total RNA samples, followed bypolymerase chain reaction (RT-PCR) using specific oligonucleotides for PFKFB3;GAPDH (279 bp band) was used as loading control; the black/white inverted imagesof the agarose gels are shown; w/o RT, RT-PCR for PFKFB3 without reversetranscriptase
PFKFB3 stability in excitotoxicityP Rodriguez-Rodriguez et al
1583
Cell Death and Differentiation

Figure 2 Glutamate-mediated PFKFB3 stabilization occurs via Cdk5-mediated inhibition of APCCdh1 activity. (a) Glutamate treatment (100mM/15 min) increased, after1 h, Cdk5-mediated H1 phosphorylation in rat primary cortical neurons; this effect was fully abolished by MK801 (10 mM). (b) Cdh1 is phosphorylated 6 h after glutamatetreatment (100mM/15 min), an effect that was prevented by MK801 (10 mM). (c) Confocal microscopy images of neurons transfected with GFP-PFKFB3 reveals its nuclearlocalization. Glutamate promotes PFKFB3 accumulation, as revealed by its spread (nuclear plus cytosolic) localization; Cdh1 overexpression prevented this effect.GFP-PFKFB3 mutated on its KEN box (KEN-AAA; mut-PFKFB3) showed the spread-like localization, regardless of glutamate treatment. (d) Percentage of neurons showingnuclear or spread GFP-PFKFB3 localization in the experiments shown in c; these data were obtained by analyzing B30 neurons per condition per neuronal preparation(n¼ 4). *Po0.05 versus the corresponding (nuclear or cytoplasmic) PFKFB3-none condition (ANOVA)
Figure 3 Glutamate stimulates PFKFB3-dependent increase in glycolysis, a decrease in PPP and promotes glutathione oxidation in neurons. (a) Incubation ofGFP-PFKFB3-expressing neurons with glutamate (100 mM/15 min) induced, 6 h after treatment, PFKFB3 accumulation in control, siRNA-treated neurons (siControl),as revealed by an anti-GFP (Flag) antibody; transfection of neurons with an siPFKFB3 efficiently reduced PFKFB3 protein and prevented glutamate-induced PFKFB3accumulation. (b) Incubation of neurons with glutamate (100mM/15 min) increased, after 6 h, the rate of glycolysis, as assessed by the determination of [3-3H]glucoseincorporation into 3H2O; this effect was abolished by preventing PFKFB3 accumulation in neurons previously transfected with siPFKFB3. (c) Glutamate treatment decreased,after 6 h, the rate of the PPP, as assessed by the determination of the difference between 14CO2 produced by [1-14C]glucose and that of [6-14C]glucose; this effect wasabolished by siPFKFB3. (d) Glutamate treatment did not change GSx (left panel), but it increased GSSG (middle panel) and the oxidized glutathione redox status (GSSG/GSx;right panel); these effects were partially prevented by siPFKFB3. *Po0.05 versus none; #Po0.05 versus the corresponding siControl (ANOVA)
PFKFB3 stability in excitotoxicityP Rodriguez-Rodriguez et al
1584
Cell Death and Differentiation

glutamate (100 mM/15 min) incubation in control neurons(siControl); however, transfection of neurons with ansiPFKFB3 decreased PFKFB3 protein abundance in controlneurons and prevented glutamate-mediated PFKFB3 accu-mulation. We then assessed the rate of glycolysis, and wefound it to be significantly enhanced, after 6 h, by glutamatetreatment (Figure 3b); moreover, this was abolished bypreventing PFKFB3 accumulation using the siPFKFB3(Figure 3b). In view that glycolysis and PPP are twointerconnected metabolic pathways, we then assessedwhether the increase in glycolysis altered glucose utilizationthrough the PPP. We found that glutamate treatmentdecreased, after 6 h, the rate of PPP, an effect that wasabolished by siPFKFB3 (Figure 3c). Thus, glutamate triggersa PFKFB3-dependent increase in glycolysis and decrease inthe PPP.
It has been previously shown that glucose metabolismthrough the PPP is neuroprotective15,18,19 because of itsNADPH-regenerating function. Thus, NADPH is an essentialcofactor for glutathione regeneration, hence, the PPPbecomes necessary to prevent neuronal death by oxidativestress.18 Thus, we next aimed to elucidate whether themetabolic PPP/glycolytic shift triggered by glutamate treat-ment induced oxidative stress. As shown in Figure 3d, totalglutathione (GSx) was unaltered, but its oxidized form(GSSG) and the glutathione oxidized status (GSSG/GSxratio) significantly increased 6 h after glutamate treatment,and these effects were prevented by siPFKFB3. To furthersupport evidence for oxidative stress, we next evaluatedwhether a putative increased ROS production by glutamatecould be rescued by either knocking down a key glycolyticenzyme, phosphoglucose isomerase (PGI), or by overexpres-sing glucose-6-phosphate dehydrogenase (G6PD), the rate-limiting enzyme of the PPP that we have previously shown tobe efficient in neurons.15,18 The efficacy of these tools werefirst tested by western blotting (Figure 4a); thus, transfectionof neurons with the siRNA against PGI efficiently knockeddown PGI protein, whereas overexpression of the cDNAencoding G6PD increased neuronal G6PD abundance.Glutamate treatment (100 mM/15 min) increased, after 6 h,neuronal ROS, an effect that was prevented by knockingdown PGI or PFKFB3, as it was by overexpressing G6PD, orby blocking NMDAR with MK801 (Figure 4b). To assessneuronal vulnerability to oxidative stress in this paradigm, wethen analyzed the proportion of annexin Vþ /7AAD� neurons(indicating neurons that had been targeted to apoptosis) afterglutamate treatment. We found that glutamate increased,though modestly, apoptotic neuronal death via a mechanismthat could be prevented by silencing PGI or PFKFB3, as wellas by overexpressing G6PD or blocking NMDAR (Figure 4c).Together, these results indicate that NMDAR activationtriggers oxidative stress and targets neurons for apoptoticdeath by shifting PPP to glycolysis.
Finally, we sought to elucidate whether APCCdh1 activitywas responsible for PFKFB3-mediated oxidative stress andneurodegeneration in excitotoxicity. As shown in Figure 5a,glutamate increased ROS in neurons transfected with lowlevels of wild-type PFKFB3 cDNA. However, transfection ofneurons with identical cDNA amounts of the KEN box-mutantform of PFKFB3 (mut-PFKFB3) increased ROS to levels
similar to those triggered by glutamate; moreover, glutamatedid not further enhance ROS in neurons expressing mut-PFKFB3 (Figure 5a). Interestingly, apoptotic death triggeredby glutamate in neurons transfected with PFKFB3 wasmimicked by mut-PFKFB3 (Figure 5b). Thus, expression ofAPCCdh1-insensitive PFKFB3 mimics glutamate at causingoxidative stress and neuronal death.
Figure 4 NMDAR activation triggers oxidative stress and apoptotic death byswitching PPP to glycolysis. (a) Transfection of neurons with an siRNA against PGI(siPGI), efficiently knocked down PGI protein abundance (left panel). Transfection ofneurons with the full-length DNA encoding G6PD efficiently increased G6PD proteinabundance (right panel). (b) Glutamate treatment (100mM/15 min) increased ROSin neurons, as assessed by MitoSox fluorescence by flow cytometry; this effect wasprevented by knocking down PGI (siPGI) or PFKFB3 (siPFKFB3), overexpressingG6PD, or blocking NMDAR with MK801 (10mM). (c) Glutamate treatment increasedapoptotic neuronal death, as assessed by annexin Vþ /7-AAD� fluorescence byflow cytometry; this effect was prevented by silencing PGI (siPGI) or PFKFB3(siPFKFB3), overexpressing G6PD or blocking NMDAR with MK801. *Po0.05versus none; #Po0.05 versus siControl (glutamate; 5� 104 events were acquiredin triplicate; results mean±S.E.M. from three independent neuronal preparations,n¼ 3; ANOVA)
PFKFB3 stability in excitotoxicityP Rodriguez-Rodriguez et al
1585
Cell Death and Differentiation

Discussion
Neurons continuously degrade the glycolytic-promotingenzyme PFKFB3 by APCCdh1 activity, and this allows aconsiderable proportion of glucose to be oxidized via thePPP, which functions as an antioxidant and survival metabolicpathway.15 Here, we show that a short-term activation ofglutamate receptors in cortical neurons triggers delayed, time-dependent PFKFB3 protein accumulation; the lack of changein the PFKFB3 mRNA abundance ruled out a transcriptionaleffect. Moreover, NMDA mimicked glutamate, and NMDARantagonist MK801 prevented PFKFB3 accumulation, indicat-ing the direct involvement of NMDAR stimulation in PFKFB3stabilization. Previously, it was reported that NMDAR stimula-tion in cortical neurons promotes, in a Ca2þ -dependentmanner, p35 cleavage to p25 by calpain leading to Cdk5activation.20 Here, we show that, under our experimentalculture conditions, rat primary cortical neurons efficientlyresponded to NMDAR stimulation, as judged by the MK801-inhibitable increased intracellular Ca2þ levels. Moreover, weshow that glutamate induced Cdk5 activation in a process thatwas antagonized by MK801, indicating the involvement ofNMDAR. Given that NMDAR-mediated activation of Cdk5phosphorylates Cdh1 leading to APCCdh1 inhibition,17 wehypothesized that the stabilization of PFKFB3 could beconsequence of NMDAR-mediated APCCdh1 inhibition. Ingood agreement with the presence of a nuclear-targetingmotif in PFKFB3,21 we found that expressed PFKFB3 waslocalized in the nucleus, where neurons actively degraded it.In addition, we show that Cdh1 was phosphorylated byglutamate treatment, and that this was accompanied bycellular spread of PFKFB3 from the nucleus to cytosol in aCdh1-inhibitable process; interestingly, the PFKFB3 mutantform lacking the Cdh1-recognizing KEN motif spontaneously
accumulated. Together, these results indicate that PFKFB3nuclear stabilization followed by cytosolic spread is theconsequence of APCCdh1 inhibition. The mechanism wherebyPFKFB3 is released from the nucleus remains unclear,although the physiological significance is likely in view of thecytoplasmic localization of the PFKFB3 target, 6-phospho-fructo-1-kinase.
NMDAR-mediated PFKFB3 protein stabilization led toincreased PFKFB3 activity and efficiently upregulated therate of glycolysis in neurons. In previous studies, neuronsfailed to upregulate glycolysis immediately after the bioener-getic stress caused by mitochondrial inhibitors8,22 or NMDARactivation.14 However, it should be noted that PFKFB3stabilization takes place several hours after glutamatetreatment, thus explaining the absence of measurable short-term glycolytic stimulation in cortical neurons in the previousstudies.8,14,22 Accordingly, the delayed increase in glycolysisthat we observe does not appear to be a neuronal attempt torapidly compensate for the mitochondrial energy dysfunction,which occurs immediately after NMDAR stimulation.7 Instead,the delayed glycolysis activation reflects a long-term meta-bolic adaptation of neurons by excitotoxic insult; however,such an adaptation concurs with concomitant decrease in therate of glucose oxidation through the PPP, hence, triggeringoxidative stress and neurotoxicity. Intriguingly, although thestimulation of glycolysis is cytotoxic in neurons, it iscytoprotective in astrocytes.8 This different outcome shownby neurons and astrocytes is consistent with the expression ofa robust antioxidant system in astrocytes that is not present inneurons.23 Upon inhibition of mitochondrial respiration,astrocytes switch on glycolysis, via the 50-AMP-activatedprotein kinase-PFKFB3 pathway,14 to compensate for theATP deficiency without affecting their antioxidant status.24
However, shifting glucose utilization from PPP to glycolysis inneurons compromises the efficacy of the critical antioxidantNADPH-glutathione regenerating system, hence causingdelayed neurotoxicity. Importantly, both the increase inglycolysis and the decrease in PPP could be fully abolishedby siPFKFB3, indicating that both metabolic pathways arewholly controlled by PFKFB3. In this context, it should bementioned that Tp53-inducible glycolysis and apoptosisregulator (TIGAR), by catalyzing F2,6P2 degradation inhibitsglycolysis and stimulates PPP.25 Thus, the control overF2,6P2 concentrations by either PFKFB3 – with a mainfructose-6-phosphate-2-kinase activity12,13 – or TIGAR – withfructose-2,6-bisphosphatase activity25 – appears to deter-mine the fate of glucose metabolism. However, no evidencefor NMDAR-mediated p53 upregulation is currently available,hence, remaining elusive whether TIGAR induction has adeterminant role in neuronal metabolic change upon NMDARstimulation.
The metabolic PPP to glycolysis shift triggered by NMDARstimulation was accompanied by oxidative stress, as revealedboth by an increase in the oxidized glutathione redox statusand by the increased mitochondrial ROS, as well as apoptoticneuronal death. These data contrast with those reporting thatNMDAR-mediated increase in neuronal ROS could beblocked with 6-aminonicotinamide, an inhibitor of PPP thatproduces NADPH required for NADPH oxidase activity.6
Whether the different neuronal settings (defined versus
Figure 5 Expression of APCCdh1-insensitive PFKFB3 mimics glutamate atcausing oxidative stress and neuronal death. (a) Glutamate treatment (100mM/15 min) increased ROS in neurons transfected with low levels of wild-type PFKFB3cDNA; transfection of neurons with identical cDNA amounts of the KEN box-mut-PFKFB3 increased ROS to similar levels to those triggered by glutamate; glutamatedid not further enhance ROS in neurons expressing mut-PFKFB3. (b) Glutamateincreased apoptotic death of neurons transfected with low levels of PFKFB3 cDNA;transfection of neurons with identical cDNA amounts of mut-PFKFB3 increasedapoptotic death to similar levels to those triggered by glutamate; glutamate did notfurther enhance apoptotic death in neurons expressing mut-PFKFB3. *Po0.05versus none (PFKFB3; 3� 104 events were acquired in triplicate; resultsmean±S.E.M. from three independent neuronal preparations, n¼ 3; ANOVA)
PFKFB3 stability in excitotoxicityP Rodriguez-Rodriguez et al
1586
Cell Death and Differentiation

serum-based media) or the types of tools used (pharmaco-logical versus genetic approaches to modulate glycolysis andPPP) are responsible for this apparent controversy remainselusive. However, in our hands, silencing PFKFB3 or PGI,which effectively inhibited glycolysis,15 or G6PD overexpres-sion, a potent activator of the PPP,18 prevented such ametabolic switch and the concomitant ROS production byNMDAR stimulation. In fact, PPP activity produces reducedequivalents in the form of NADPH,26 which is also a necessarycofactor for antioxidant glutathione regeneration.18 Thus,PFKFB3 silencing significantly prevented the increase inoxidized glutathione status caused by NMDAR stimulationand this was critical at determining neuronal survival.Interestingly, it has been shown that, when oxidized,cytochrome c is released from mitochondria, hence promotingapoptotic neuronal death, and that PPP activity is essential atmaintaining cytochrome c reduced.27 Our results, showingoxidative stress and neurodegeneration following PFKFB3stabilization by NMDAR stimulation, confirm the critical role ofPPP at regulating neuronal apoptosis. Furthermore, theyshow that the loss of PPP activity by APCCdh1 inhibition is anovel and important player in excitotoxicity. Together, thesefindings highlight the importance of metabolic modulation inexcitotoxicity and neurodegeneration and emphasize thatmetabolic targets should be considered when designingtherapeutic strategies.
Materials and MethodsPlasmid constructions and site-directed mutagenesis. The ratPFKFB3 full-length cDNA (splice variant K6; 1563 bp; accession numberBAA21754) was obtained, by reverse-transcriptase polymerase chain reaction(RT-PCR), at our laboratory.15 PFKFB3 cDNA was fused, at its 50-terminus, withthe full-length cDNA encoding the GFP and subcloned in pCDNA3.0 vector.This GFP-PFKFB3 cDNA fusion construct was then subjected to site-directedmutagenesis of its KEN-box to AAA using the QuikChange XL site-directedmutagenesis kit (Stratagene, La Jolla, CA, USA) using the following forward andreverse primers, respectively: 50-ATCCTTCATTTTGCCGCAGCAGCTGACTTCAAGGC-30 and 50-ATGCCTTGAAGTCAGCTGCTGCGGCAAAATGAAGG-30 (mutatednucleotides underlined). Human full-length Cdh1 cDNA (accession numberNM_016263) was a generous gift of Dr. J Pines (Gurdon Institute, University ofCambridge, UK).
RNA interference. To knockdown PGI (accession number NM_207192),we used the following sequence for siRNA: 50-CCTTACCAGACGTAGTGTT-30
(nt 1248–1266). To knockdown PFKFB3 we used the sequence 50-AAAGCCTCGCATCAACAGC-30 (nt 1908–1926). Both siRNAs were previously validated at ourlaboratory for efficacy.14,15 An siRNA against luciferase (50-CTGACGCGGAATACTTCGATT-30) was used as control.
RT-PCR analysis. Total RNA was purified from neurons using a commerciallyavailable kit (Sigma, Saint Louis, MO, USA). PFKFB3 mRNA expression wasanalyzed by 4.5% agarose electrophoresis after RT-PCR using the followingforward and reverse oligonucleotides, respectively: 50-CCAGCCTCTTGACCCTGATAAATG-30 and 50-TCCACACGCGGAGGTCCTTCAGAT-30 for PFKFB3, and50-CTGGCGTCTTCACCACCAT-30 and 50-AGGGGCCATCCACAGTCTT-30 forGAPDH. Reverse transcription was performed at 48 1C for 50 min, and PCRconditions were 10 min at 95 1C, 35 cycles of 1 min at 95 1C, 1 min at 58 1C and30 s at 68 1C. Final extension was carried out for 10 min at 72 1C. In no case wasa band detected by PCR without reverse transcription.
Antibodies. An anti-PFKFB3 (K3-K6 splice variants) antibody was generated,by rabbit immunization with the synthetic peptide 508MRSPRSGAESSQKH521-C, atour laboratory as previously described.15 A commercial anti-PFKFB3 antibodyraised against a C-terminal region of the human PFKFB3 (protein accession
Q16875; catalog number H00005209-M08, Novus Biologicals, Cambridge, UK)was also used; this antibody cross-reacts with human and rat PFKFB3, thusrecognizing a region that is shared by all translational products of the rat K1 toK8 PFKFB3 mRNA splice variants. Anti-Cdh1 (AR38) was a generous gift fromJ Gannon (Clare Hall Laboratories, Cancer Research, UK). Anti-Cdk5 (C-8) andanti-PGI (K-16) were from Santa Cruz Biotechnology (Heidelberg, Germany).Anti-GFP was purchased from Abcam (Cambridge Science Park, Cambridge, UK).Anti-G6PD and anti-GAPDH were purchased from Sigma, and anti-phosphoserinefrom Zymed (Invitrogen, Groningen, The Netherlands).
Cell cultures. Cortical neurons in primary culture were prepared from fetal(E16) Wistar rats. Cells were seeded (2.5� 105 cells/cm2) in DMEM (Sigma)supplemented with 10% (v/v) fetal calf serum (Roche Diagnostics, Heidelberg,Germany) and incubated at 37 1C in a humidified 5% CO2-containing atmosphere.After 48 h of plating, the medium was replaced with DMEM supplemented with 5%horse serum (Sigma) and with 20 mM D-glucose. On day 4, cytosine arabinoside(10mM) was added in order to prevent non-neuronal proliferation. Cells were usedby day 6, when enrichment was B99% (neurofilament; data not shown).
Cell treatments. Transfection of cells with plasmid vectors was carried outusing 0.16–1.6mg/ml of the plasmids, as indicated in the figure legends. Alltransfections were performed using lipofectamine 2000 (Invitrogen) following themanufacturer’s instructions, at day 5 in vitro. After 6 h, the medium was removedand cells were further incubated overnight in the presence of culture medium. ForRNA interference experiments, siRNAs (purchased from Thermo Fisher Scientific,Lafayette, CO, USA; sequences described above) were used. In dose-responsepreliminary settings, primary neurons were transfected, using Lipofectamine 2000with 20–100 nM of the siRNAs, which showed a dose-dependent effect; only theresults using 100 nM are shown. siRNA transfections were performed at day 3 in vitroand experiments were performed at day 6, when an efficient knockdown of the targetproteins was obtained. For NMDAR activation, neurons at 6 days in vitro wereincubated with 100mM glutamate (plus 10mM glycine) or 100mM NMDA (plus 10mMglycine) in buffered Hanks’ solution (pH 7.4) for 15 min.7 When indicated, incubationswere performed in the presence of MK-801 (10mM; Sigma). Neurons were thenwashed and further incubated in culture medium for the indicated time period.
Flow cytometric analysis of apoptotic cell death. APC/C-conjugatedannexin-V and 7-aminoactinomycin D (7-AAD) (Becton Dickinson Biosciences,San Jose, CA, USA) were used to determine quantitatively the percentage ofapoptotic neurons by flow cytometry. Cells were stained with annexin V-APCand 7-AAD, following the manufacturer’s instructions, and were analyzed on aFACScalibur flow cytometer (15 mW argon ion laser tuned at 488 nm) using theCellQuest software software (BDB). Both GFPþ and GFP� cells were analyzedseparately and the annexin V-APC-stained cells that were 7-AAD-negative wereconsidered to be apoptotic.15
Detection of ROS. This was carried out using MitoSox-Red (Invitrogen).Neurons were incubated with 2 mM MitoSox-Red for 30 min, washed with PBS andthe fluorescence assessed by flow cytometry.15
Measurement of the glycolytic and PPP fluxes. Suspensions ofknown amounts of cells (4–5� 105 cells) obtained by smooth detaching from thecultures 6 h after glutamate treatments, were incubated in sealed vials containing acentral well, which was used for 14CO2 or 3H2O trapping. Cells were incubated in thepresence of 1mCi of either D-[1-14C] glucose or D-[6-14C] glucose for PPPdeterminations, whereas 5mCi of D-[3-3H] glucose were used for glycolytic fluxdeterminations, both in a Krebs–Henseleit buffer (11 mM Na2HPO4, 122 mM NaCl,3.1 mM KCl, 0.4 mM KH2PO4, 1.2 mM MgSO4, 1.3 mM CaCl2; pH 7.4) containing5 mM D-glucose at 37 1C. In order to ensure an adequate O2 supply for oxidativemetabolism by the cells throughout the 90 min incubation period, the gas phase inthe vials containing the cells was supplied with extra O2 before the vials weresealed. The glycolytic flux was measured by assaying the rate of 3H2O productionfrom [3-3H]glucose, as detailed previously.15 The PPP flux was measured byassessing the difference between 14CO2 production from [1-14C]glucose – whichdecarboxylates via the 6-phosphogluconate dehydrogenase-catalyzed reaction –and that of [6-14C]glucose – which decarboxylates via the tricarboxylic acid cycle.18,28
Glutathione measurements. For glutathione determinations, neurons weretreated with 1% (w/v) sulfosalicylic acid and centrifuged at 13 000� g for 5 min
PFKFB3 stability in excitotoxicityP Rodriguez-Rodriguez et al
1587
Cell Death and Differentiation

at 4 1C. GSx (the amount of reduced glutathione (GSH), plus two times the amountof oxidized glutathione (GSSG)) and GSSG concentrations were measured in thesupernatants using the enzymatic method of Tietze.29 GSSG was quantified afterderivatization of GSH in the samples with 2-vinylpyridine. Data were extrapolated tothose obtained with GSSG standards (0–5mM for GSSG; 0–50mM for GSx). Theglutathione redox status was expressed as the GSSG/GSx ratio, as previouslydescribed.18,30
Fura-2 fluorescence measurements. To estimate the intracellular Ca2þ -dependent changes by NMDAR stimulation in cortical neurons we used thefluorescent probe Fura-2 (acetoxymethyl-derivative; Life Technologies, Eugene,OR, USA), as previously described.31 Essentially, neurons at 6 days in vitro, seededin 96-well plates (Nunc), were incubated with Fura-2 (2 mM; dissolved in dimethylsulphoxide (DMSO)) for 40 min in DMEM at 37 1C. Then, cells were washed andfurther incubated with standard buffer (140 mM NaCl, 2.5 mM KCl, 15 mM Tris-HCl,5 mM D-glucose, 1.2 mM Na2HPO4, 1 mM MgSO4 and 1 mM CaCl2, pH 7.4) for30 min and 37 1C. Finally, the standard buffer was removed and experimentalbuffer (140 mM NaCl, 2.5 mM KCl, 15 mM Tris-HCl, D-glucose, 1.2 mM Na2HPO4,and 2 mM CaCl2, pH 7.4), either in the absence or in the presence of MK801(10mM), was added. Emissions at 510 nm, after excitations at 335 and 363 nm,respectively, were recorded at 1 s intervals in a Varioskan Flash (Thermo Fischer,Vantaa, Finland) spectrofluorometer at 32 1C. After B10 s, glutamate (100mM) orNMDA (100mM) (plus 10mM glycine) was injected and emissions were furtherrecorded for 50 s. Ca2þ -dependent fluorescence changes were estimated byrepresenting the ratio of fluorescence emitted at 510 nm obtained after excitationat 335 nm divided by that at 363 nm (F335/F363). Background subtraction wasaccomplished from emission values obtained in Fura-2-lacking (DMSO-containing)neurons. In preliminary experiments, the Ca2þ specificity of the measurementswas tested in Ca2þ -free experimental buffer containing 1 mM ethylene glycoltetraacetic acid (EGTA), which fully prevented the changes in 510 nm emissions(data not shown). At least, six wells were recorded per condition in each experiment(n¼ 4 experiments) and the averaged values are shown.
Western blot analysis. After transfections and treatments, neurons werelysed in RIPA buffer (2% sodium dodecylsulphate, 2 mM ethylene diamine tetraaceticacid (EDTA), 2 mM EGTA, 50 mM Tris; pH 7.5), supplemented with phosphataseinhibitors (1 mM Na3VO4, 50 mM NaF) and protease inhibitors (100mM phenyl-methylsulfonyl fluoride, 50mg/ml anti-papain, 50mg/ml pepstatin, 50mg/ml amastatin,50mg/ml leupeptin, 50mg/ml bestatin and 50mg/ml soybean trypsin inhibitor) andboiled for 5 min. Aliquots of cell extracts were subjected to sodium dodecyl sulfate(SDS) polyacrylamide gel (MiniProtean, Bio-Rad, Hercules, CA, USA) and blotted withantibodies overnight at 4 1C. Signal detection was performed with an enhancedchemiluminescence kit (Pierce, Thermo Scientific, Waltham, MA, USA).
Immunoprecipitation and Cdk5 kinase activity. Neurons were lysedin ice-cold buffer containing 50 mM Tris-HCl (pH 7.5), 150 mM NaCl, 10 mM EDTA,2 mM EGTA, 1% NP-40, supplemented with the phosphatase and proteaseinhibitors cited above. Cell extracts were clarified by centrifugation and supernatants(50mg of protein for immunoprecipitation experiments, 500mg for Cdk5 kinaseassays) were incubated with anti-Cdh1 or anti-Cdk5, overnight at 4 1C, followed bythe addition of 15–30ml of protein A-sepharose (GE Healthcare Life Sciences,Uppsala, Sweden) for 1–2 h at 4 1C. Immunoprecipitates were extensively washedwith lysis buffer and either detected by western blot analysis against anti-phosphoserine or resuspended in kinase buffer (20 mM Tris-HCl pH 7.6,20 mM MgCl2, 2 mM MnCl2, 1 mM EDTA, 1 mM EGTA, 0.1 mM dithiothreitol)containing 20mM ATP, 10mCi of [g-32P]ATP and histone-H1 (50mg/ml; Sigma)for SDS-polyacrylamide gel (12%) electrophoresis; transferred proteins werevisualized by autoradiography and anti-Cdk5 blotting.32
Protein determinations. Protein concentrations were determined in the cellsuspensions, lysates or in parallel cell culture incubations after solubilization with0.1 M NaOH. Protein concentrations were determined as described33 using bovineserum albumin as a standard.
Confocal microscopy. Neurons were grown on glass coverslips. Aftertransfections and treatments they were fixed with 4% (v/v in PBS) paraformaldehydefor 20 min and incubated with DAPI (30mM; Sigma). Confocal microscopy imageswere obtained with a Leica SP5 microscope (DMI-6000B model; Leica MicrosystemsGmbH, Wetzlar, Germany).
Statistical analysis. Measurements from individual cultures were alwayscarried out in triplicate. The results are expressed as mean±S.E.M. values forthree different culture preparations. Statistical analysis of the results was performedby one-way analysis of variance (ANOVA), followed by the least significantdifference multiple range test. In all cases, Po0.05 was considered significant.
Conflict of Interest
The authors declare no conflict of interest.
Acknowledgements. The technical assistance of Monica Resch is gratefullyacknowledged. This work was funded by the Spanish Ministerio de Ciencia eInnovacion (Consolider-Ingenio CSD2007-00020; SAF2010-20008), Instituto deSalud Carlos III (PS09/0366), FEDER (European regional development fund) andthe Junta de Castilla y Leon (GREX206). PR-R is a recipient of a predoctoral FPUfellowship from the Ministerio de Ciencia e Innovacion.
1. Papadia S, Soriano FX, Leveille F, Martel MA, Dakin KA, Hansen HH et al. SynapticNMDA receptor activity boosts intrinsic antioxidant defenses. Nat Neurosci 2008; 11:476–487.
2. Hardingham GE, Bading H. Synaptic versus extrasynaptic NMDA receptor signalling:implications for neurodegenerative disorders. Nat Rev Neurosci 2010; 11: 682–696.
3. Bossy-Wetzel E, Schwarzenbacher R, Lipton SA. Molecular pathways toneurodegeneration. Nat Med 2004; 10: S2–S9.
4. Bano D, Young KW, Guerin CJ, Lefeuvre R, Rothwell NJ, Naldini L et al. Cleavage of theplasma membrane Na+/Ca2+ exchanger in excitotoxicity. Cell 2005; 120: 275–285.
5. Celsi F, Pizzo P, Brini M, Leo S, Fotino C, Pinton P et al. Mitochondria, calcium andcell death: a deadly triad in neurodegeneration. Biochim Biophys Acta 2009; 1787:335–344.
6. Brennan AM, Suh SW, Won SJ, Narasimhan P, Kauppinen TM, Lee H et al. NADPHoxidase is the primary source of superoxide induced by NMDA receptor activation. NatNeurosci 2009; 12: 857–863.
7. Almeida A, Bolanos JP. A transient inhibition of mitochondrial ATP synthesis by nitric oxidesynthase activation triggered apoptosis in primary cortical neurons. J Neurochem 2001; 77:676–690.
8. Almeida A, Almeida J, Bolanos JP, Moncada S. Different responses of astrocytes andneurons to nitric oxide: the role of glycolytically-generated ATP in astrocyte protection. ProcNatl Acad Sci USA 2001; 98: 15294–15299.
9. Bolanos JP, Almeida A, Moncada S. Glycolysis: a bioenergetic or a survival pathway?Trends Biochem Sci 2010; 35: 145–149.
10. Allaman I, Belanger M, Magistretti PJ. Astrocyte-neuron metabolic relationships: for betterand for worse. Trends Neurosci 2011; 34: 76–87.
11. Pellerin L. Food for thought: the importance of glucose and other energy substratesfor sustaining brain function under varying levels of activity. Diabetes Metab 2010;36 (Suppl 3): S59–S63.
12. Manzano A, Rosa JL, Ventura F, Perez JX, Nadal M, Estivill X et al. Molecular cloning,expression, and chromosomal localization of a ubiquitously expressed human6-phosphofructo-2-kinase/ fructose-2, 6-bisphosphatase gene (PFKFB3). Cytogenet CellGenet 1998; 83: 214–217.
13. Hirata T, Kato M, Okamura N, Fukasawa M, Sakakibara R. Expression of human placental-type 6-phosphofructo-2-kinase/fructose 2,6-bisphosphatase in various cells and cell lines.Biochem Biophys Res Commun 1998; 242: 680–684.
14. Almeida A, Moncada S, Bolanos JP. Nitric oxide switches on glycolysis through theAMP protein kinase and 6-phosphofructo-2-kinase pathway. Nat Cell Biol 2004; 6:45–51.
15. Herrero-Mendez A, Almeida A, Fernandez E, Maestre C, Moncada S, Bolanos JP. Thebioenergetic and antioxidant status of neurons is controlled by continuous degradation of akey glycolytic enzyme by APC/C-Cdh1. Nat Cell Biol 2009; 11: 747–752.
16. Almeida A, Bolanos JP, Moreno S. Cdh1/Hct1-APC is essential for the survival ofpostmitotic neurons. J Neurosci 2005; 25: 8115–8121.
17. Maestre C, Delgado-Esteban M, Gomez-Sanchez JC, Bolanos JP, Almeida A. Cdk5 phospho-rylates Cdh1 and modulates cyclin B1 stability in excitotoxicity. Embo J 2008; 27: 2736–2745.
18. Garcia-Nogales P, Almeida A, Bolanos JP. Peroxynitrite protects neurons against nitricoxide-mediated apoptosis. A key role for glucose-6-phosphate dehydrogenase activity inneuroprotection. J Biol Chem 2003; 278: 864–874.
19. Delgado-Esteban M, Almeida A, Bolanos JP. D-Glucose prevents glutathione oxidationand mitochondrial damage after glutamate receptor stimulation in rat cortical primaryneurons. J Neurochem 2000; 75: 1618–1624.
20. Lee MS, Kwon YT, Li M, Peng J, Friedlander RM, Tsai LH. Neurotoxicity induces cleavageof p35 to p25 by calpain. Nature 2000; 405: 360–364.
21. Yalcin A, Clem BF, Simmons A, Lane A, Nelson K, Clem AL et al. Nuclear targeting of6-phosphofructo-2-kinase (PFKFB3) increases proliferation via cyclin-dependent kinases.J Biol Chem 2009; 284: 24223–24232.
PFKFB3 stability in excitotoxicityP Rodriguez-Rodriguez et al
1588
Cell Death and Differentiation