mechanical properties of smartphone glass -...
TRANSCRIPT

MECHANICAL PROPERTIES OF SMARTPHONE GLASS
Prepared by Duanjie Li, PhD
6 Morgan, Ste156, Irvine CA 92618 · P: 949.461.9292 · F: 949.461.9232 · nanovea.com Today's standard for tomorrow's materials. © 2014 NANOVEA
2
INTRO Due to the property of being optically transparent, glass is widely used in a variety of products, such as windows, containers, optical lenses, mirrors and countless others. During the manufacturing process, glass can be formed into different shapes, ranging from flat sheets to highly intricate shapes, including fine glassware and optical fibers. Glass is very durable under most conditions; however, its brittle nature limits its application in certain applications. In the last decade, the upsurge of smartphones has been tremendously propelling the development of novel glass lenses which possess superior mechanical properties, such as high hardness, great fracture toughness, and excellent scratch and wear resistance. A versatile instrument with the capacity of providing comprehensive testing on the above mechanical properties in an accurate and repeatable manner becomes vital for evaluation and comparison of the glass in Quality Control and Research and Development.
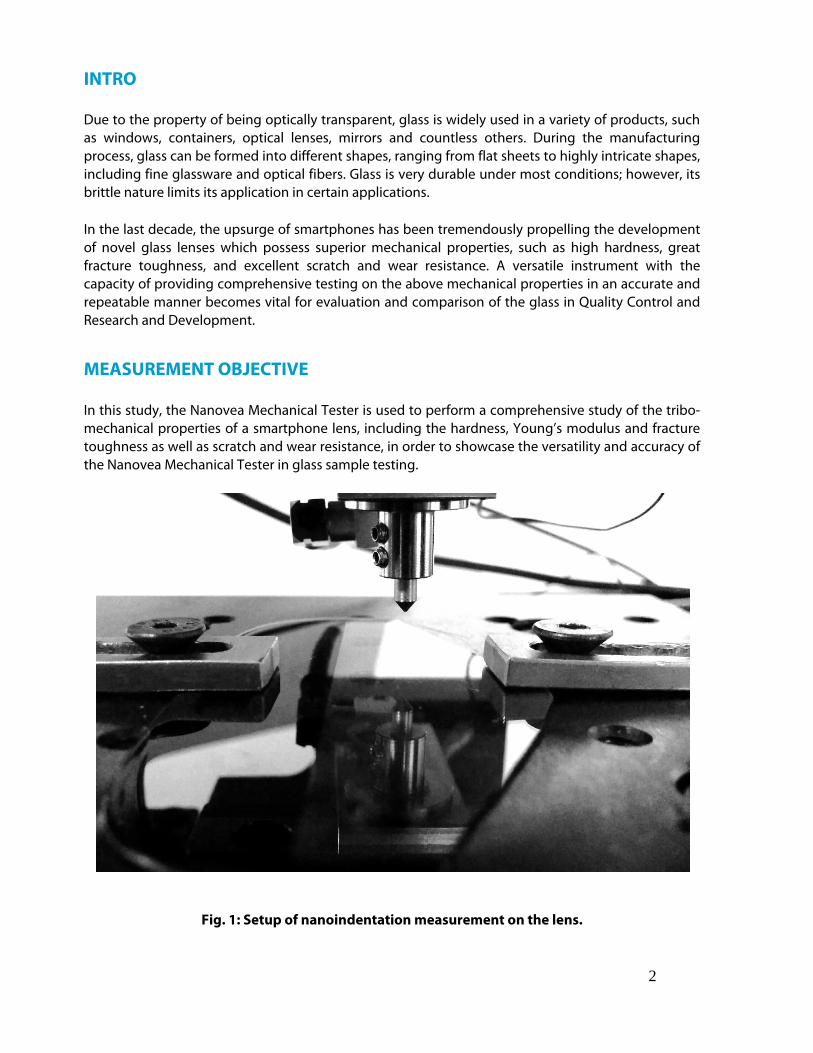
MEASUREMENT OBJECTIVE In this study, the Nanovea Mechanical Tester is used to perform a comprehensive study of the tribo-mechanical properties of a smartphone lens, including the hardness, Young’s modulus and fracture toughness as well as scratch and wear resistance, in order to showcase the versatility and accuracy of the Nanovea Mechanical Tester in glass sample testing.
Fig. 1: Setup of nanoindentation measurement on the lens.
3
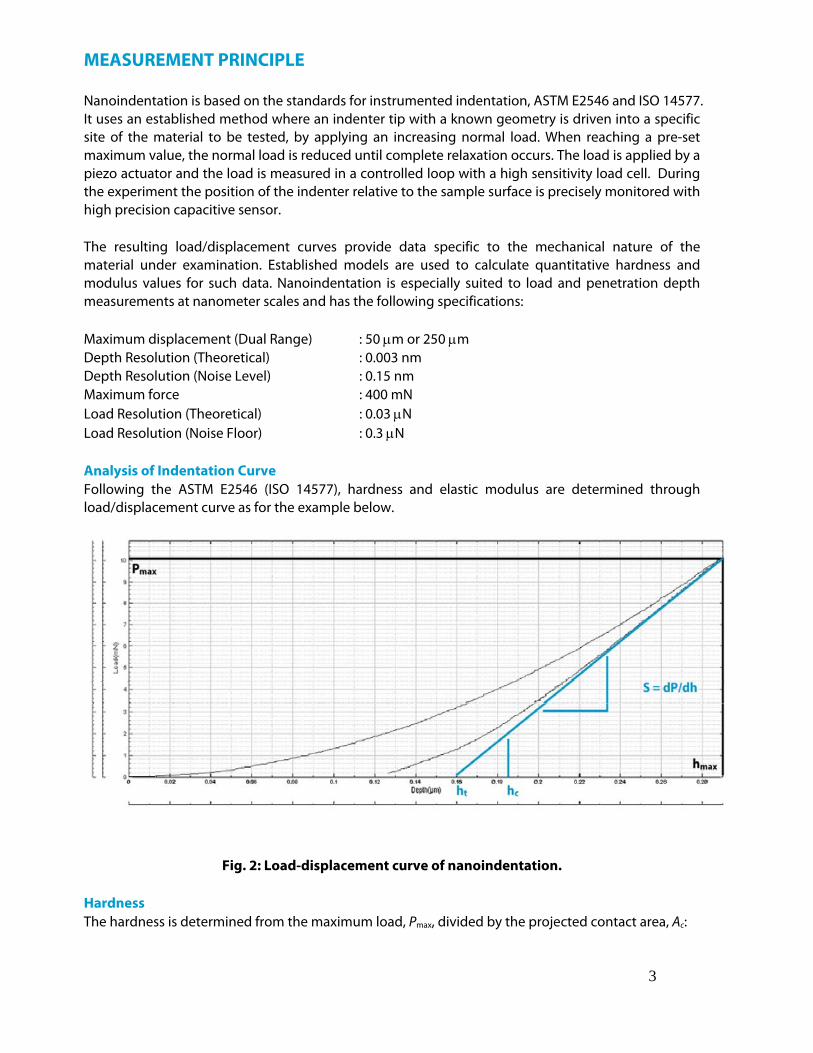
MEASUREMENT PRINCIPLE Nanoindentation is based on the standards for instrumented indentation, ASTM E2546 and ISO 14577. It uses an established method where an indenter tip with a known geometry is driven into a specific site of the material to be tested, by applying an increasing normal load. When reaching a pre-set maximum value, the normal load is reduced until complete relaxation occurs. The load is applied by a piezo actuator and the load is measured in a controlled loop with a high sensitivity load cell. During the experiment the position of the indenter relative to the sample surface is precisely monitored with high precision capacitive sensor. The resulting load/displacement curves provide data specific to the mechanical nature of the material under examination. Established models are used to calculate quantitative hardness and modulus values for such data. Nanoindentation is especially suited to load and penetration depth measurements at nanometer scales and has the following specifications: Maximum displacement (Dual Range) : 50 m or 250 m Depth Resolution (Theoretical) : 0.003 nm Depth Resolution (Noise Level) : 0.15 nm Maximum force : 400 mN Load Resolution (Theoretical) : 0.03 N Load Resolution (Noise Floor) : 0.3 N Analysis of Indentation Curve Following the ASTM E2546 (ISO 14577), hardness and elastic modulus are determined through load/displacement curve as for the example below.
Fig. 2: Load-displacement curve of nanoindentation. Hardness The hardness is determined from the maximum load, Pmax, divided by the projected contact area, Ac:
4
cA
PH max
Young’s Modulus The reduced modulus, Er, is given by:
c
rA
SE
2
Which can be calculated having derived S and AC from the indentation curve using the area function, AC being the projected contact area. The Young’s modulus, E, can then be obtained from:
i
i
r EEE
22 111
Where Ei and i are the Young’s modulus and Poisson’s ratio of the indenter and the Poisson’s ratio of the tested sample. How are these calculated? A power-law fit through the upper 1/3 to1/2 of the unloading data intersects the depth axis at ht. The stiffness, S, is given by the slope of this line. The contact depth, hc, is then calculated as:
SPhhc 4
3 maxmax
The contact Area Ac is calculated by evaluating the indenter area function. This function will depend on the diamond geometry and at low loads by an area correction. For a perfect Berkovich and Vickers indenters, the area function is Ac=24.5hc
2. For Cube Corner indenter, the area function is Ac=2.60hc
2. For Spherical indenter, the area function is Ac=2πRhc , where R is the radius of the indenter. The elastic components, as previously mentioned, can be modeled as springs of elastic constant E, given the formula: where σ is the stress, E is the elastic modulus of the material, and ε is the strain that occurs under the given stress, similar to Hooke's Law. The viscous components can be modeled as dashpots such that the stress-strain rate relationship can
be given as , where σ is the stress, η is the viscosity of the material, and dε/dt is the time derivative of strain. Since the analysis is very dependent on the model that is chosen, Nanovea provides the tool to gather the data of displacement versus depth during the creep time. The maximum creep displacement versus the maximum depth of indent and the average speed of creep in nm/s is given by the software. Creep may be best studied when loading is quicker. Spherical tip is a better choice. Principle of fracture toughness evaluation Fracture toughness evaluates the ability of a material containing a crack to resist brittle fracture. It can be assessed using indentation technique by making direct measurements of cracks created with
5
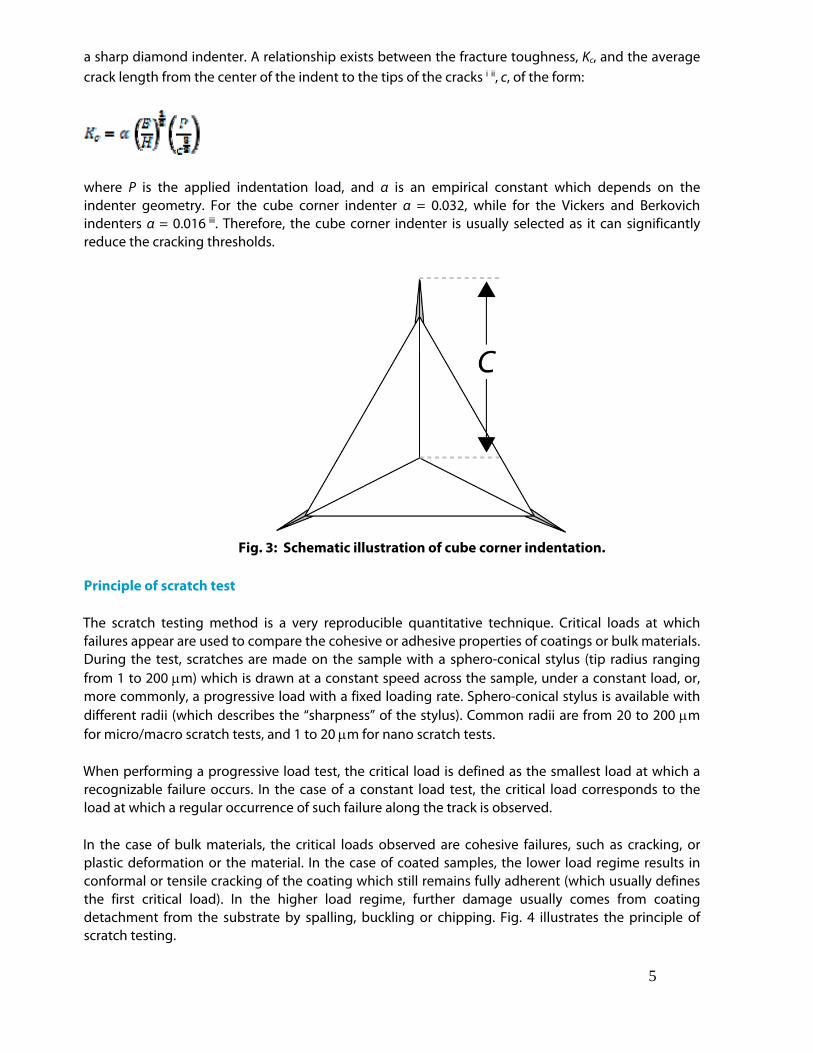
a sharp diamond indenter. A relationship exists between the fracture toughness, Kc, and the average crack length from the center of the indent to the tips of the cracks i ii, c, of the form:
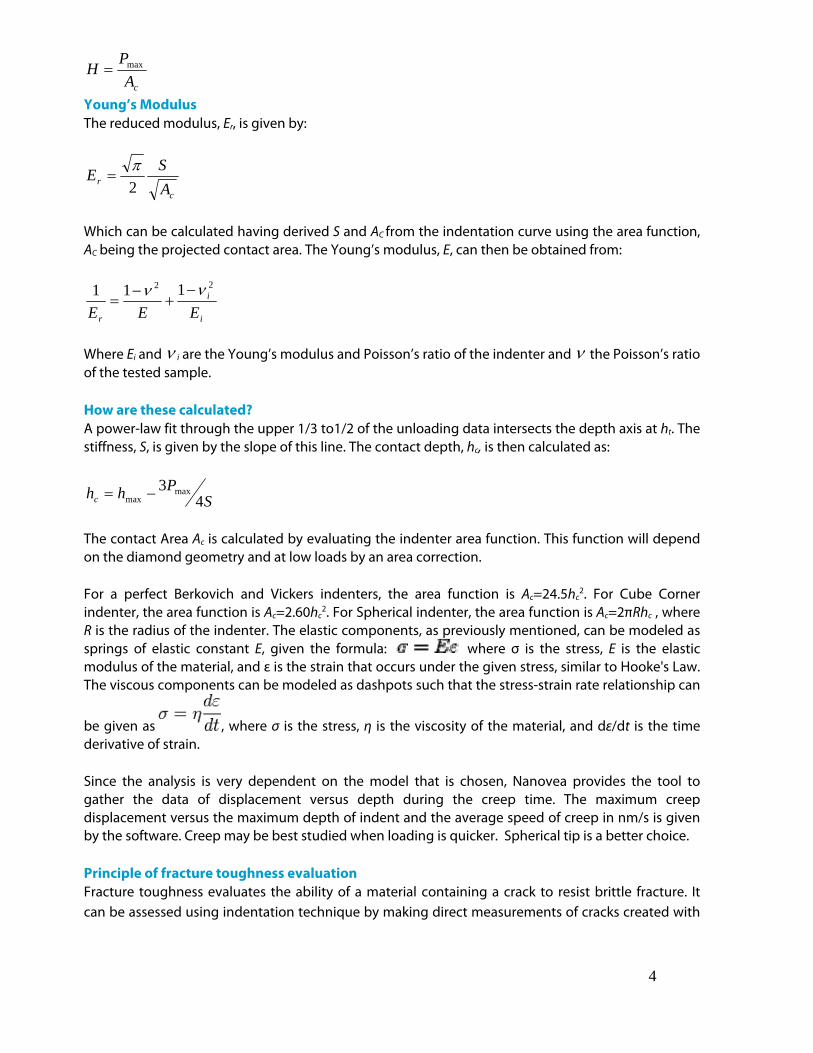
where P is the applied indentation load, and α is an empirical constant which depends on the indenter geometry. For the cube corner indenter α = 0.032, while for the Vickers and Berkovich indenters α = 0.016 iii. Therefore, the cube corner indenter is usually selected as it can significantly reduce the cracking thresholds.
Fig. 3: Schematic illustration of cube corner indentation.
Principle of scratch test The scratch testing method is a very reproducible quantitative technique. Critical loads at which failures appear are used to compare the cohesive or adhesive properties of coatings or bulk materials. During the test, scratches are made on the sample with a sphero-conical stylus (tip radius ranging from 1 to 200 m) which is drawn at a constant speed across the sample, under a constant load, or, more commonly, a progressive load with a fixed loading rate. Sphero-conical stylus is available with different radii (which describes the “sharpness” of the stylus). Common radii are from 20 to 200 m for micro/macro scratch tests, and 1 to 20 m for nano scratch tests. When performing a progressive load test, the critical load is defined as the smallest load at which a recognizable failure occurs. In the case of a constant load test, the critical load corresponds to the load at which a regular occurrence of such failure along the track is observed. In the case of bulk materials, the critical loads observed are cohesive failures, such as cracking, or plastic deformation or the material. In the case of coated samples, the lower load regime results in conformal or tensile cracking of the coating which still remains fully adherent (which usually defines the first critical load). In the higher load regime, further damage usually comes from coating detachment from the substrate by spalling, buckling or chipping. Fig. 4 illustrates the principle of scratch testing.

6
Fig. 4: Principle of scratch testing.
Principle of linear wear test The sample is mounted on a moving stage, while a known force is applied on a pin, or ball, in contact with the sample surface to create the wear. As the sample moves in a linear reciprocating (see Fig. 5) motion, the resulting frictional forces between the pin and the sample are measured using a strain gage sensor on the arm. The wear test is generally used as a comparative test to study the tribological properties of the materials. The, coefficient of friction, COF, is recorded in situ. The volume loss allows calculating the wear rate of the material. Since the action performed on all samples is identical, the wear rate can be used as a quantitative comparative value for wear resistance. This simple method facilitates the determination and study of friction and wear behavior of almost every solid state material combination, with varying time, contact pressure, velocity, temperature, humidity, lubrication, etc.
Fig. 5: Schematics of linear reciprocating wear test.
7
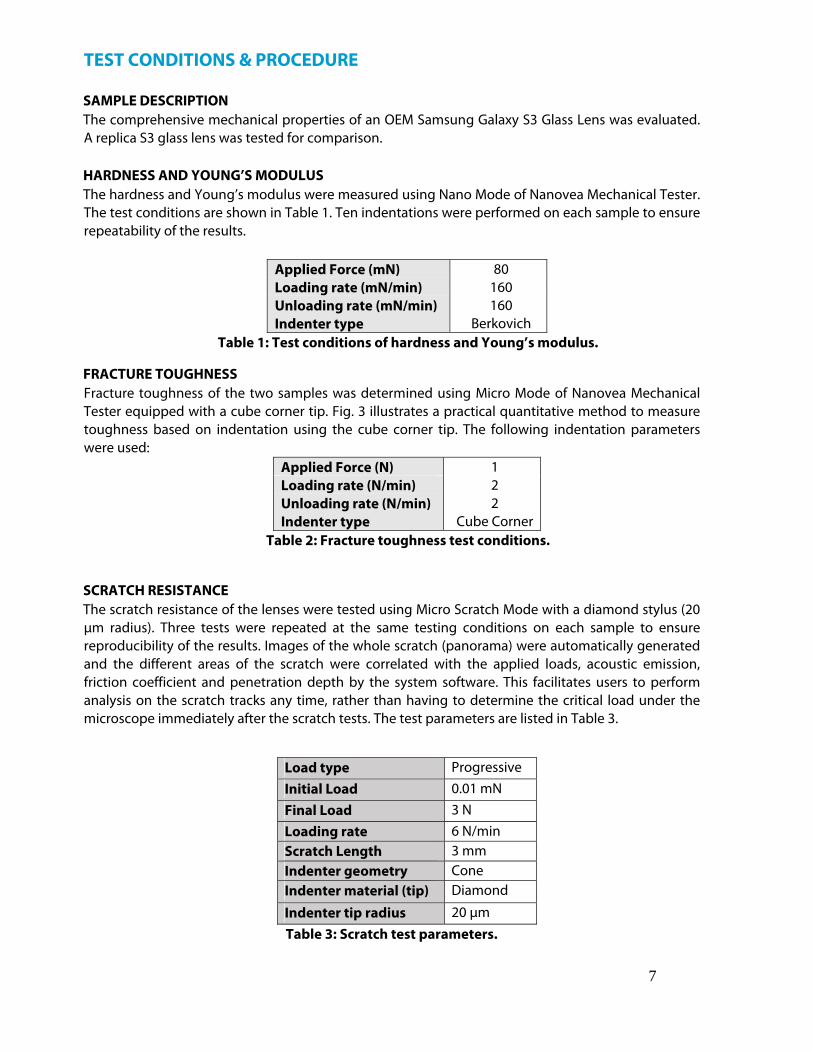
TEST CONDITIONS & PROCEDURE
SAMPLE DESCRIPTION The comprehensive mechanical properties of an OEM Samsung Galaxy S3 Glass Lens was evaluated. A replica S3 glass lens was tested for comparison. HARDNESS AND YOUNG’S MODULUS The hardness and Young’s modulus were measured using Nano Mode of Nanovea Mechanical Tester. The test conditions are shown in Table 1. Ten indentations were performed on each sample to ensure repeatability of the results.
Applied Force (mN) 80 Loading rate (mN/min) 160 Unloading rate (mN/min) 160 Indenter type Berkovich
Table 1: Test conditions of hardness and Young’s modulus.
FRACTURE TOUGHNESS Fracture toughness of the two samples was determined using Micro Mode of Nanovea Mechanical Tester equipped with a cube corner tip. Fig. 3 illustrates a practical quantitative method to measure toughness based on indentation using the cube corner tip. The following indentation parameters were used:
Applied Force (N) 1 Loading rate (N/min) 2 Unloading rate (N/min) 2 Indenter type Cube Corner
Table 2: Fracture toughness test conditions.
SCRATCH RESISTANCE The scratch resistance of the lenses were tested using Micro Scratch Mode with a diamond stylus (20 μm radius). Three tests were repeated at the same testing conditions on each sample to ensure reproducibility of the results. Images of the whole scratch (panorama) were automatically generated and the different areas of the scratch were correlated with the applied loads, acoustic emission, friction coefficient and penetration depth by the system software. This facilitates users to perform analysis on the scratch tracks any time, rather than having to determine the critical load under the microscope immediately after the scratch tests. The test parameters are listed in Table 3.
Load type Progressive Initial Load 0.01 mN Final Load 3 N Loading rate 6 N/min Scratch Length 3 mm Indenter geometry Cone Indenter material (tip) Diamond
Indenter tip radius 20 μm Table 3: Scratch test parameters.
8
WEAR RESISTANCE The wear behavior of the test lens was evaluated using linear reciprocating setup of Micro Mode in Nanovea Mechanical Tester equipped with a Rockwell C diamond stylus (200 μm radius). The test conditions are listed in Table 4.
Test parameters Value Normal force 5 N
Wear track length 5 mm
Speed 100 mm/min
Passes 1200
Indenter geometry Spherical Indenter material (tip) Diamond
Indenter tip radius 200 μm Table 4: Test conditions of the linear reciprocating wear measurement.
RESULTS AND DISCUSSION
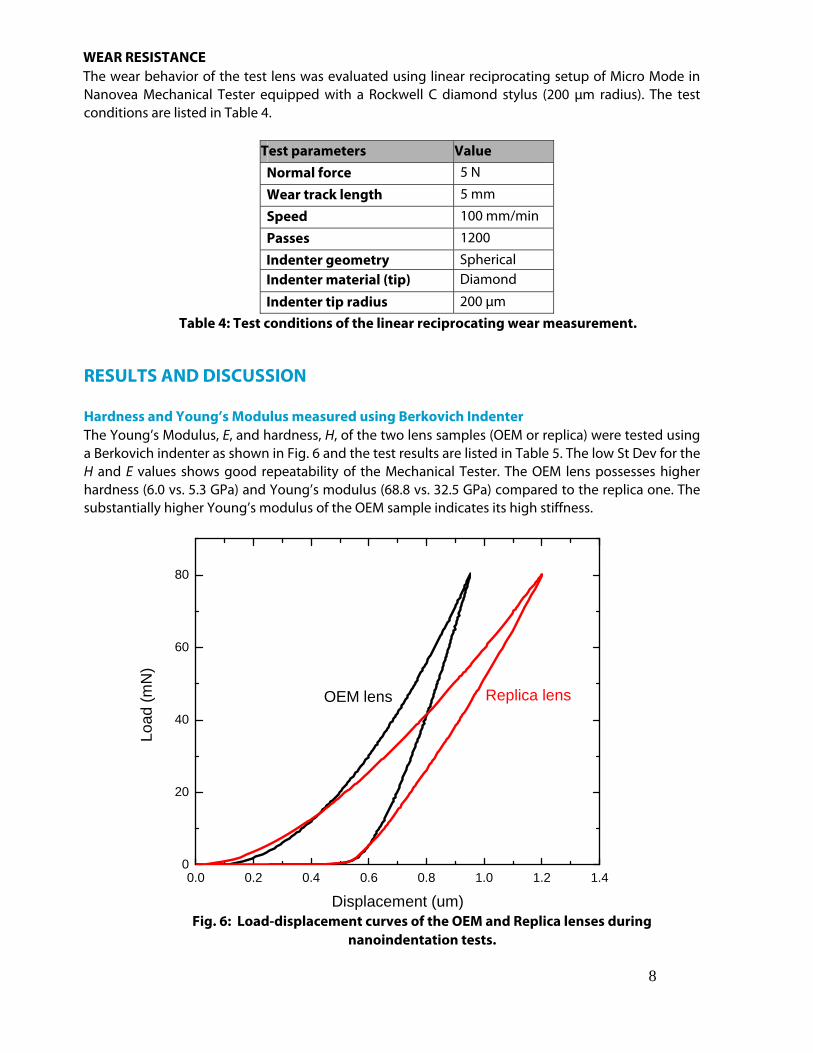
Hardness and Young’s Modulus measured using Berkovich Indenter The Young’s Modulus, E, and hardness, H, of the two lens samples (OEM or replica) were tested using a Berkovich indenter as shown in Fig. 6 and the test results are listed in Table 5. The low St Dev for the H and E values shows good repeatability of the Mechanical Tester. The OEM lens possesses higher hardness (6.0 vs. 5.3 GPa) and Young’s modulus (68.8 vs. 32.5 GPa) compared to the replica one. The substantially higher Young’s modulus of the OEM sample indicates its high stiffness.
Fig. 6: Load-displacement curves of the OEM and Replica lenses during nanoindentation tests.
0.0 0.2 0.4 0.6 0.8 1.0 1.2 1.40
20
40
60
80
Load
(m
N)
Displacement (um)
OEM lens Replica lens
9
Hardness
(GPa) Hardness (HV)
Young’s Modulus (GPa)
OEM 6.0±0.2 569.4±15.2 68.8±1.4 Replica 5.3±0.3 503.8±27.5 32.5±1.0
Table 5: Measured Young’s Modulus, E, and hardness, H, of tested lenses.
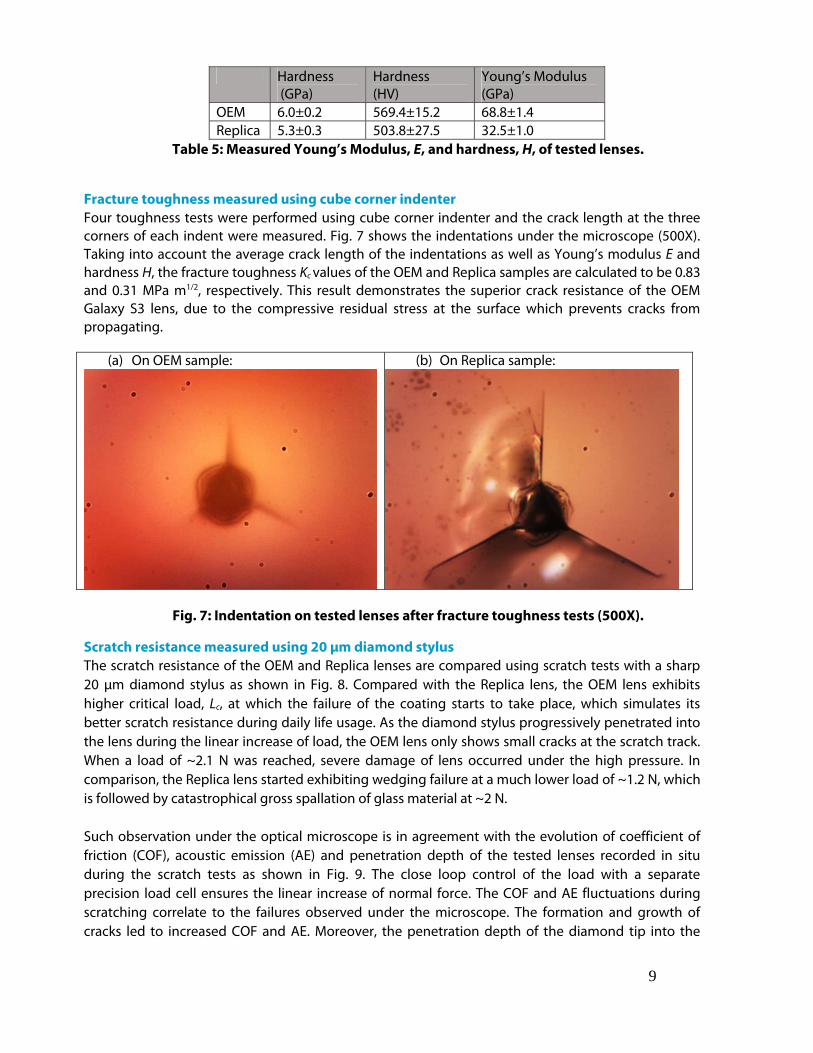
Fracture toughness measured using cube corner indenter Four toughness tests were performed using cube corner indenter and the crack length at the three corners of each indent were measured. Fig. 7 shows the indentations under the microscope (500X). Taking into account the average crack length of the indentations as well as Young’s modulus E and hardness H, the fracture toughness Kc values of the OEM and Replica samples are calculated to be 0.83 and 0.31 MPa m1/2, respectively. This result demonstrates the superior crack resistance of the OEM Galaxy S3 lens, due to the compressive residual stress at the surface which prevents cracks from propagating.
(a) On OEM sample: (b) On Replica sample:
Fig. 7: Indentation on tested lenses after fracture toughness tests (500X).
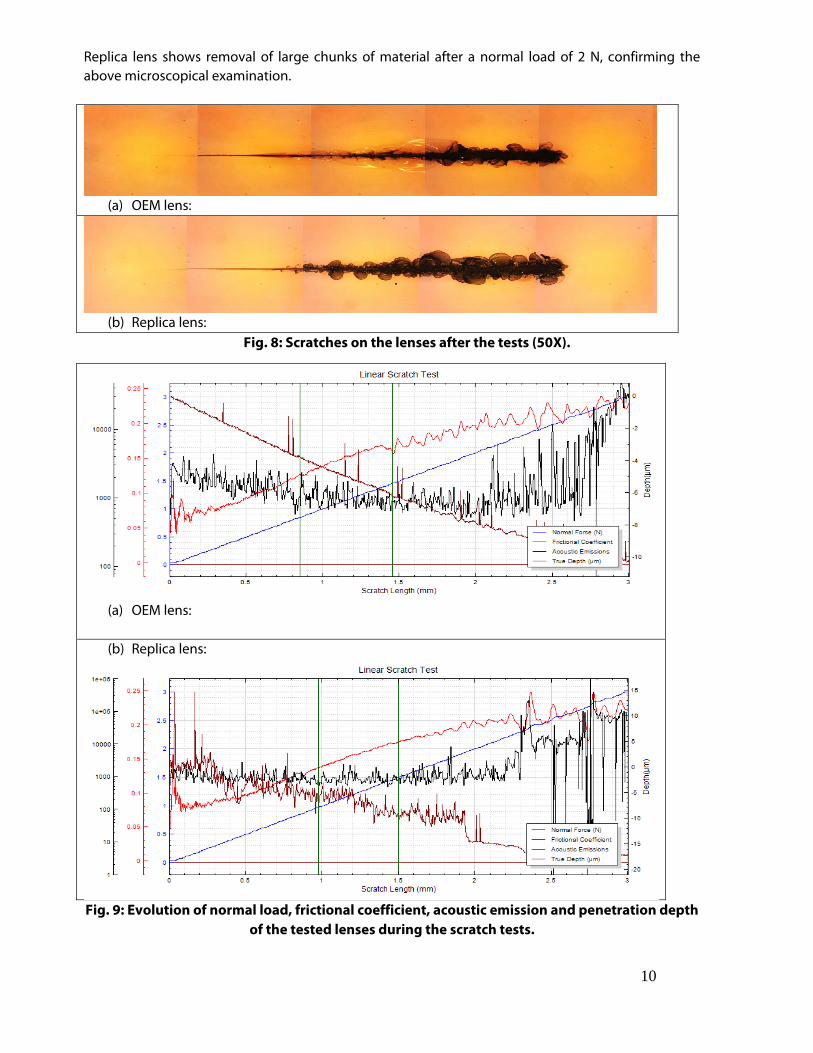
Scratch resistance measured using 20 μm diamond stylus The scratch resistance of the OEM and Replica lenses are compared using scratch tests with a sharp 20 μm diamond stylus as shown in Fig. 8. Compared with the Replica lens, the OEM lens exhibits higher critical load, Lc, at which the failure of the coating starts to take place, which simulates its better scratch resistance during daily life usage. As the diamond stylus progressively penetrated into the lens during the linear increase of load, the OEM lens only shows small cracks at the scratch track. When a load of ~2.1 N was reached, severe damage of lens occurred under the high pressure. In comparison, the Replica lens started exhibiting wedging failure at a much lower load of ~1.2 N, which is followed by catastrophical gross spallation of glass material at ~2 N. Such observation under the optical microscope is in agreement with the evolution of coefficient of friction (COF), acoustic emission (AE) and penetration depth of the tested lenses recorded in situ during the scratch tests as shown in Fig. 9. The close loop control of the load with a separate precision load cell ensures the linear increase of normal force. The COF and AE fluctuations during scratching correlate to the failures observed under the microscope. The formation and growth of cracks led to increased COF and AE. Moreover, the penetration depth of the diamond tip into the
c
10
Replica lens shows removal of large chunks of material after a normal load of 2 N, confirming the above microscopical examination.
(a) OEM lens:
(b) Replica lens: Fig. 8: Scratches on the lenses after the tests (50X).
(a) OEM lens: (b) Replica lens:
Fig. 9: Evolution of normal load, frictional coefficient, acoustic emission and penetration depth of the tested lenses during the scratch tests.
11
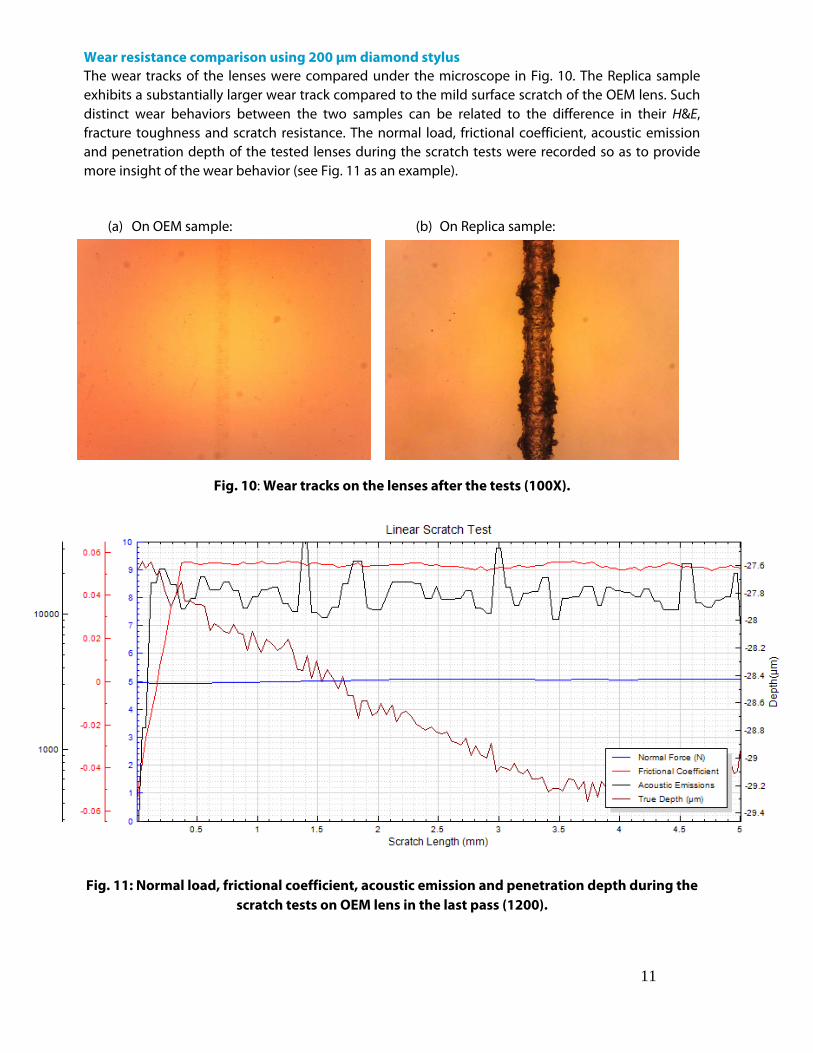
Wear resistance comparison using 200 μm diamond stylus The wear tracks of the lenses were compared under the microscope in Fig. 10. The Replica sample exhibits a substantially larger wear track compared to the mild surface scratch of the OEM lens. Such distinct wear behaviors between the two samples can be related to the difference in their H&E, fracture toughness and scratch resistance. The normal load, frictional coefficient, acoustic emission and penetration depth of the tested lenses during the scratch tests were recorded so as to provide more insight of the wear behavior (see Fig. 11 as an example).
(a) On OEM sample:
(b) On Replica sample:
Fig. 10: Wear tracks on the lenses after the tests (100X).
Fig. 11: Normal load, frictional coefficient, acoustic emission and penetration depth during the
scratch tests on OEM lens in the last pass (1200).
12
CONCLUSION In this study, we show that the Nanovea Mechanical Tester performs accurate and repeatable measurements of complete tribo-mechanical properties of glass samples. The OEM lens possesses higher hardness, Young’s modulus and fracture toughness as well as scratch and wear resistance compared with the Replica one, demonstrating the superior mechanical strength of the OEM lens for phone screen protection. The Nano, Micro or Macro modules of the Nanovea Mechanical Tester all include ISO and ASTM compliant indentation, scratch and wear tester modes, providing the widest and most user friendly range of testing available in a single system. Nanovea's unmatched range is an ideal solution for determining the full range of mechanical properties of thin or thick, soft or hard coatings, films and substrates, including hardness, Young’s modulus, fracture toughness, adhesion, wear resistance and many others. In addition, optional 3D non-contact profiler and AFM Module are available for high resolution 3D imaging of indentation, scratch and wear track in addition to other surface measurements such as roughness. To learn more about Nanovea Mechanical Tester or Lab Services.
REFERENCES
i Anstis, G. R., Chantikul, P., Lawn, B. R., & Marshall, D. B. (1981). A critical evaluation of indentation techniques for measuring fracture toughness: I, direct crack measurements. Journal of the American Ceramic Society, 64(9), 533-538. ii Anstis, G. R., Chantikul, P., Lawn, B. R., & Marshall, D. B. (1981). A critical evaluation of indentation techniques for measuring fracture toughness: I, direct crack measurements. Journal of the American Ceramic Society, 64(9), 533-538. iii Bhushan, B., & Li, X. (2003). Nanomechanical characterisation of solid surfaces and thin films. International Materials Reviews, 48(3), 125-164.