mechanical properties of the aortic arterial wall during - iopscience
TRANSCRIPT

Journal of Physics Conference Series
OPEN ACCESS
Mechanical properties of the aortic arterial wallduring 24 hours a preliminary study in conscioussheepTo cite this article S Graf et al 2011 J Phys Conf Ser 332 012008
View the article online for updates and enhancements
You may also likePhotoplethysmography and its applicationin clinical physiological measurementJohn Allen
-
Arterial wall mechanical inhomogeneitydetection and atherosclerotic plaquecharacterization using high frame ratepulse wave imaging in carotid arterydisease patients in vivoGrigorios M Karageorgos Iason ZApostolakis Pierre Nauleau et al
-
Arterial stiffness as a vascular contributionto cognitive impairment a fluid dynamicsperspectiveTrevor Tucker
-
This content was downloaded from IP address 183101228122 on 01122021 at 0522
Mechanical properties of the aortic arterial wall during 24
hours a preliminary study in conscious sheep
S Graf13 D Craiem
13 M Valero
1 M Alfonso
1 J G Barra
12 RL
Armentano1
1 Fac de Ingenieriacutea y Ciencias Exactas y NaturalesUniversidad Favaloro 2 Dto de Ciencias Fisioloacutegicas Universidad Favaloro 3 CONICET Buenos Aires Argentina
E-mail graffavaloroeduar
Abstract Previous experiences in animals showed a different behavior between the
variability of pressure arterial diameter and elasticity when they were registered for a couple
of hours To better understand arterial mechanics variability we propose to measure
simultaneously aortic pressure and diameter during 24 hours in a sheep For that purpose we
developed a portable prototype device It allows continuously recording physiological signals
throughout the day and storing them in a solid state memory for later analysis Pulse wave
velocity and Peterson modulus were assessed beat-to-beat as arterial stiffness indexes We
identified 53762 heart beats during 24 hours that were separated into 2 groups below or
above median mean pressure (71 mmHg) Mean diameter pulse wave velocity and Peterson
modulus increased for higher pressure values (plt005) whereas heart rate slowed down
(plt005) Pressure-diameter loops were successfully recreated all along the experience This
new methodology sets the basis for further experiences involving the estimation of 24 hours
arterial mechanics variability
1 Introduction
The alterations of the arterial system can be evaluated from a biomechanical perspective analyzing the function and structure of the arteries Previous studies from our group applied mathematical models to assess the geometric elastic and viscous properties of the arteries They were carried out starting from pressure-diameter loops in chronically instrumented conscious animals [1 2] Although the heart rate variability was extensively studied insufficient information is available about the variability of the arterial mechanical properties during the day and night We showed that pressure diameter and elasticity variability were dissimilar during short term (one hour) experiences performed in sheep [3 4] Particularly elasticity did not followed pressure variations during all the time On the basis of these observations we propose to extend the analysis to 24 hours measuring simultaneously arterial pressure and diameter and pulse wave velocity (PWV) The online assessment of these properties could help to better understand the different regulatory mechanisms that control blood flow and pressure during day and night Recently we developed an autonomous and portable prototype device which allows continuous recording and digital storage of physiological signals for analysis The device was validated in vitro and contrasted against synthesized (simulated) signals [5] Using this device the aortic blood pressure diameter and consequently arterial stiffness evolution can be estimated beat to beat To validate arterial stiffness
SABI 2011 IOP PublishingJournal of Physics Conference Series 332 (2011) 012008 doi1010881742-65963321012008
Published under licence by IOP Publishing Ltd 1
measurements PWV was also calculated using two arterial diameter sensors [6] This work presents the methodology the system implementation and the preliminary results from an animal experience
2 Materials and methods
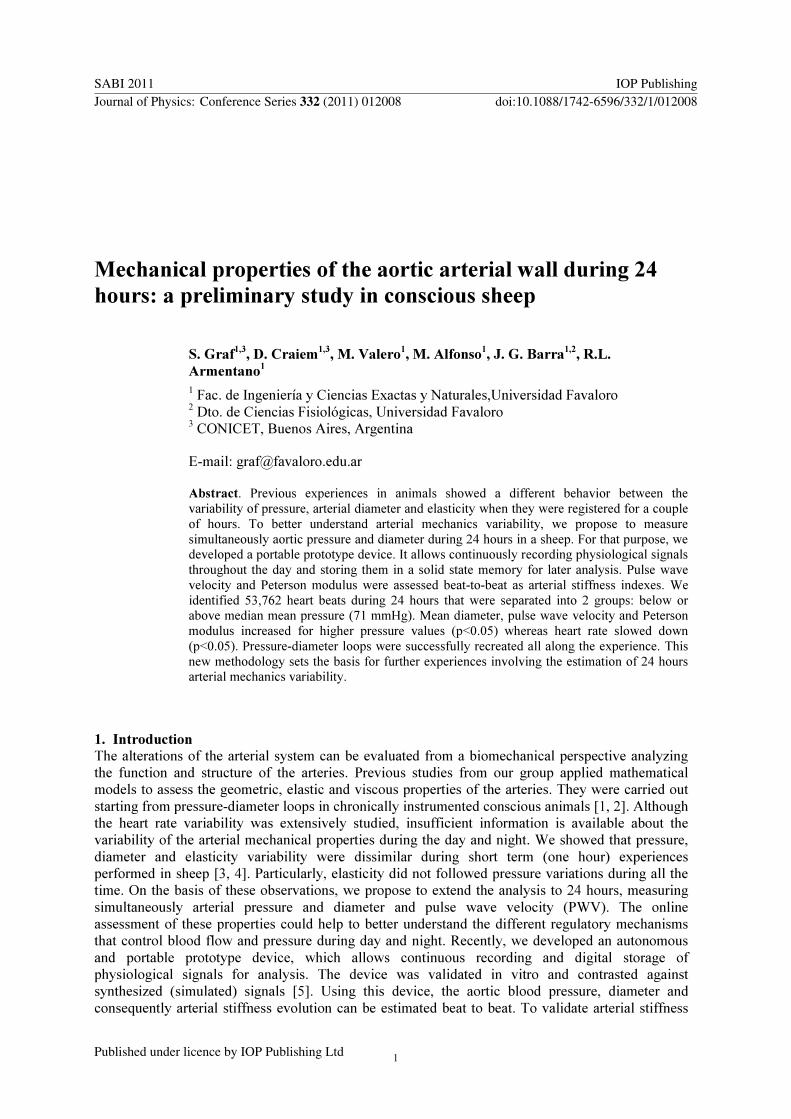
21 Prototype description The portable prototype device is based on a dsPIC30F6014A (Microchip USA) microcontroller (figure 1) Basically it includes a signal conditioning stage (filtering and amplification) a 12-bit A-D converter stage and a data storage stage (4GB SD type flash memory card) The signals can be monitored in real time by a liquid crystal display or via serial communication using a computer
Figure 1 (a) Block diagram and (b) picture of the implemented prototype
The equipment allows acquiring and storing up to 4 channels simultaneously at a configurable sampling frequency of 05 1 2 and 4 KHz and at configurable time intervals In order to verify the proper operation several tests were conducted for at least 24 hours The memory storage capability was tested using synthetic signals resulting in no loss of data Keeping a constant signal on each input channel it was demonstrated that the variation throughout a day was less than 1 Settling time of the device was less than 5 minutes [5]
22 Animal instrumentation A healthy Corrediale crossbreed sheep of 47 kg and 15 year-old was used for the experiment Surgery was performed under general anesthesia premedicated with acepromazine (02 mgkg) induced with thiopental sodium (20 mgkg) and maintained with isoflurane (25 in pure oxygen at 2 Lmin) with assisted mechanical ventilation (Neumovent 910 Coacuterdoba Argentina) During surgery blood pressure electrocardiogram capnography and heart rate were monitored (Siemens Sirecust 404-1) Two thoracotomies in the fourth and seventh left intercostal spaces were performed The proximal and distal thirds of the aorta were exposed to implant pressure and diameter sensors The solid-state pressure microtransducer of 25 mm (Konigsberg Instruments Inc Pasadena CA) was implanted in the proximal third The pressure microtransducer has been previously calibrated in vitro in saline at 37degC against a pressure caliper (Xcaliber Viggo-Spectramed Oxnard CA) Both in proximal and distal regions of the aorta ultrasonic crystals (5 MHz 4 mm) were sutured with 6-0 silk on the adventitia in two places diametrically opposed to measure outer diameter by sonomicrometry (Triton Technology Inc San Diego CA) The first pair was sutured to the proximal third of the vessel at 5 mm of the pressure sensor to avoid interference and the second pair was
SABI 2011 IOP PublishingJournal of Physics Conference Series 332 (2011) 012008 doi1010881742-65963321012008
2
sutured in the distal third (the distance between the two sensors were 147 cm) The optimal placement of the crystals was verified by the digital oscilloscope screen (Tektronix TOS 220 Tektronix Inc Beaverton USA) The correct recording of the sensors was verified during operation by monitoring the signals in real time with the prototype connected to a PC before and after closure of thorax After sensors implantation cables were tunneled to emerge through the skin on the back of the sheep which was then sutured Finally the incisions were closed by layers
23 Experimental protocol The experiment was carried out after 7 days of the surgical instrumentation to ensure proper postoperative recovery The first channel of the prototype was adjusted to work with the pressure microtransducer while the two following channels were conditioned to receive the sonomicrometer diameter signals The prototype device was configured to acquire and store in memory three signals over 24 hours continuously for 5 minutes separated by an interval of 5 minutes Sampling frequency was set to 1 KHz The activity of the sheep was monitored using digital images of 512times512 pixels taken with a digital camera (Logitech USA) connected to a PC The day after the study data from the memory card was downloaded and signals were processed using proper software developed in our laboratory For each cardiac cycle systolic diastolic and mean values from pressure and diameter signals were automatically obtained PWV was assessed as the ratio of the distance between the two diameter sensors and the resulting temporal delay between the onsets of the two diameter waveforms identified by the tangent method [7] At a sampling frequency of 1 KHz and considering a distance of 147 cm between sensors the estimated error in PWV was ~34 Heart rate was calculated from the pressure signal The pressure-strain elastic (Peterson) modulus (Ep) was calculated as defined in equation (1)
Dp DD
PE sdot
∆∆= (1)
where P∆ is the difference between systolic and diastolic pressure and D∆ is the difference between systolic and diastolic diameter (DD)
24 Statistical analysis Data are expressed as mean plusmn standard deviation In order to characterize the mechanical behavior of the arterial wall the total amount of identified beats along 24 hours were separated into 2 groups below or above the median mean pressure Differences were compared using Student t test A value of plt005 was considered significant
3 Results
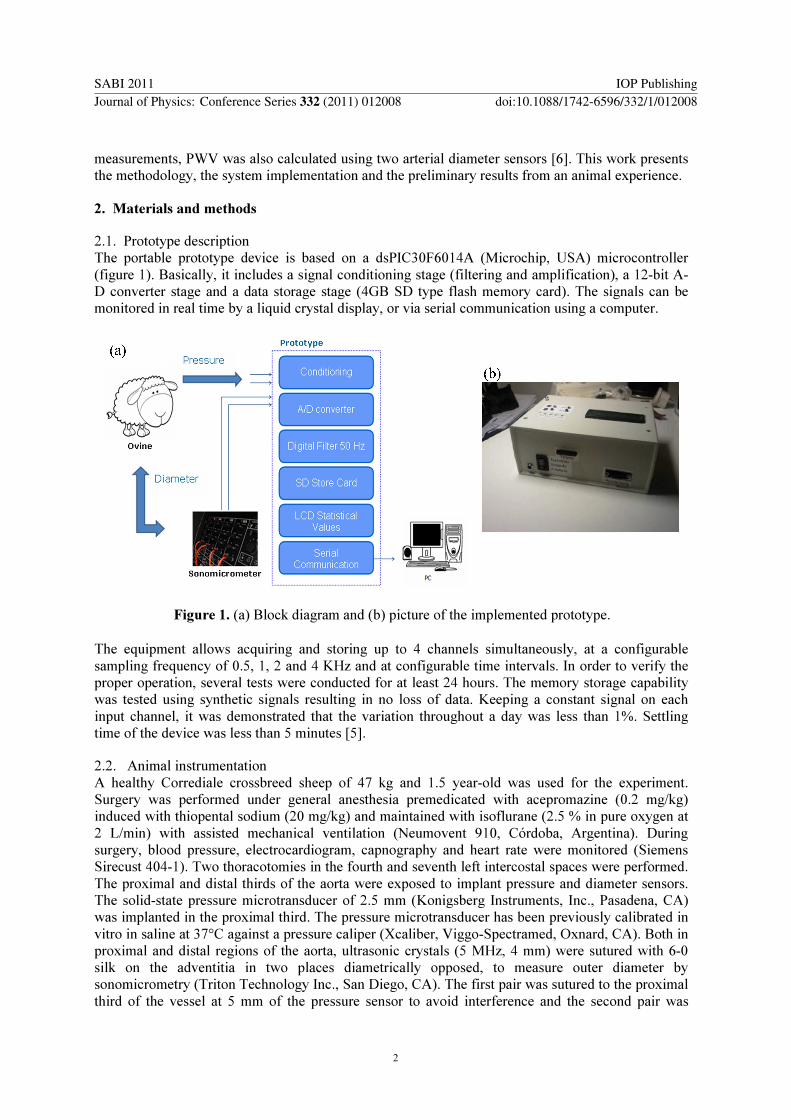
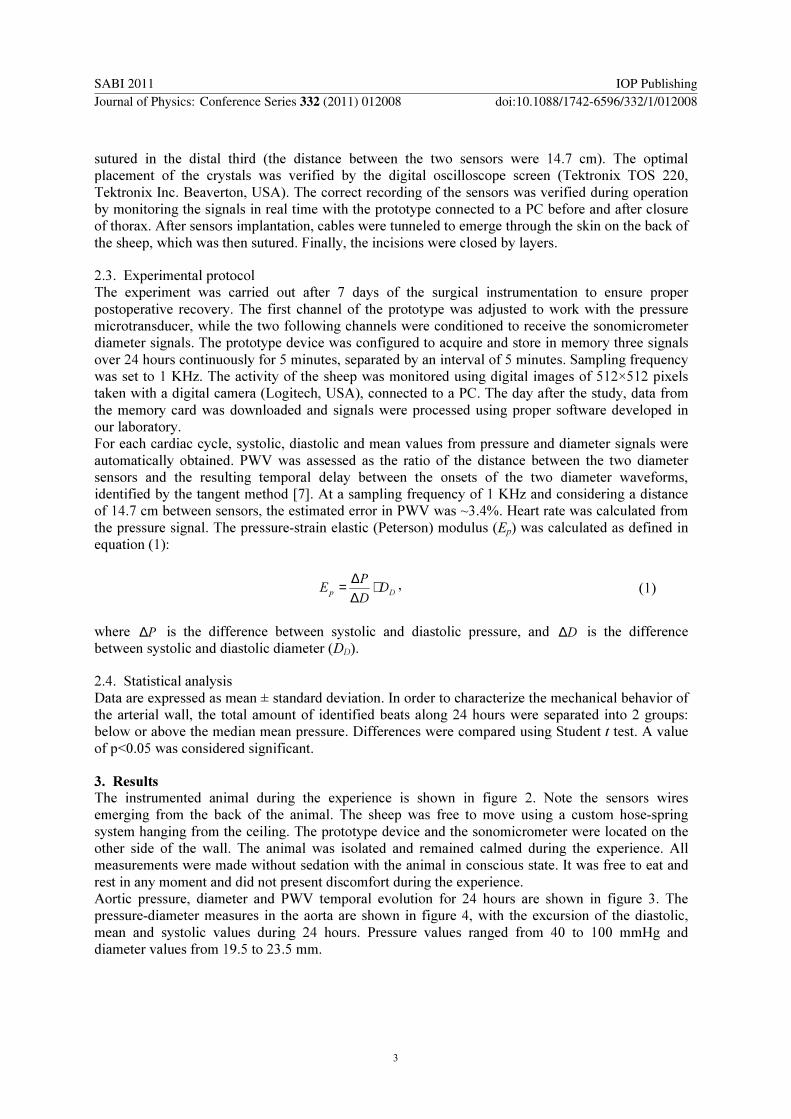
The instrumented animal during the experience is shown in figure 2 Note the sensors wires emerging from the back of the animal The sheep was free to move using a custom hose-spring system hanging from the ceiling The prototype device and the sonomicrometer were located on the other side of the wall The animal was isolated and remained calmed during the experience All measurements were made without sedation with the animal in conscious state It was free to eat and rest in any moment and did not present discomfort during the experience Aortic pressure diameter and PWV temporal evolution for 24 hours are shown in figure 3 The pressure-diameter measures in the aorta are shown in figure 4 with the excursion of the diastolic mean and systolic values during 24 hours Pressure values ranged from 40 to 100 mmHg and diameter values from 195 to 235 mm
SABI 2011 IOP PublishingJournal of Physics Conference Series 332 (2011) 012008 doi1010881742-65963321012008
3
Figure 2 Conscious instrumented sheep and associated equipment used for signals recordings during 24 hours
We identified 53762 heart beats during 24 hours that were separated into 2 groups according to the median pressure value which resulted in 71 mmHg The hemodynamic parameters of each group are detailed in table 1 Mean diameter PWV and Ep increased during high pressure group (plt005) whereas heart rate slowed down (plt005)
Figure 3 Temporal evolution of pressure diameter and PWV every 10 minutes during 24 hours The plotted values represent the median from 5-minutes continuous recordings For pressure and diameter the systolic mean and diastolic values are shown For the PWV an additional trend line is shown
SABI 2011 IOP PublishingJournal of Physics Conference Series 332 (2011) 012008 doi1010881742-65963321012008
4
Figure 4 Diastolic mean and systolic median values of pressure and proximal diameter registered during 24 hours every 5 minutes with their respective mean and standard deviation
Table 1 Hemodynamic parameters during 24 hours separated by groups
Low pressure group
n=26881 beats High pressure group
n=26881 beats
Mean pressure (mmHg) 66 plusmn 4 75 plusmn 4
Mean diameter (mm) 2156 plusmn 051 2167 plusmn 055
PWV (cms) 461 plusmn 34 478 plusmn 37
Heart rate (bpm) 98 plusmn 18 93 plusmn 15
Ep (mmHg) 285 plusmn 64 299 plusmn 70
plt005 (Student t test) between low and high pressure group
4 Discussion
In this work we show for the first time the continuous assessment of aortic elastic properties in a sheep during 24 hours Aortic pressure and diameter were recorded using a custom portable prototype especially designed in our laboratory The device successfully acquired and stored more than 50000 heart beats throughout one day In this particular experience pressure varied ~30 and diameter only ~10 with respect to 24 hours mean values Aortic stiffness was independently estimated using two indexes the Peterson modulus Ep calculated from pressure-diameter loops and the PWV estimated using 2 diameter sensors separated with a known distance Although the animal was calm during the experiment the arterial pressure showed an important variation (figure 3) As expected aortic wall stiffness was positively associated to pressure changes To study the association between pressure values and arterial mechanics we divided all the measured beats in 2 groups using the median mean pressure as a threshold Arterial stiffness was higher for pressure beats above the threshold for a 15 of pressure change PWV and Ep increased ~5 However pressure and stiffness were not permanently correlated during the experience In fact we found that the relationship between arterial pressure and diameter was not systematic evidencing the complexity of the arterial system As shown in figure 4 pressure-diameter values do not lie on the same unique elasticity curve during 24 hours This reflects the natural biological variability of the arterial wall properties where the active components of the wall (vascular smooth muscle) continuously regulate the vessel size In previous works of our group different beat-to beat elastic models were tested in vivo [8 9] So we are encouraged to initiate a new set of experiments aimed to analyzing the variability of the mechanical properties in aorta Analyzing the animal activity along the 24 hours
SABI 2011 IOP PublishingJournal of Physics Conference Series 332 (2011) 012008 doi1010881742-65963321012008
5
we concluded that could not follow a circadian behavior As can be seen from the figure 3 there is not any comprehensible daynight pattern That might be related to the permanent availability of food The digestive system of ruminants might generate recurrent pressure maneuvers that could modulate the arterial pressure Also the activity of the animal could be altered by the hose-spring system Further experiments are necessary to explore these suggestions Some issues remain to be solved to ensure the full portability of the prototype First although the system supports the direct connection of the pressure microtransducer it requires an external sonomicrometer to generate the diameter signals A new portable sonomicrometry system is being designed in our laboratory and will be incorporated in the near future Secondly we are reducing the size of the prototype using surface mount components and small batteries that will allow a better portability Then the device will become completely autonomous without requiring any external connection allowing the animal to carry the whole system on his back
5 Conclusions
Through a beat to beat 24 hours analysis we studied the influence of pressure on the aortic mechanical properties of a sheep In general when pressure increased diameter PWV and EP concomitantly increased whereas heart rate decreased Pressure-diameter loops were successfully recreated all along the experience confirming the capability of assessing true arterial wall behavior during 24 hours These findings encourage us to program new experiments aimed to analyze the arterial mechanical properties throughout the day
6 Acknowledgments
This work was in part subsidized by the project PIP number 112-200901-00734 (CONICET) and project PICTO 31355 (ANPCyT)
References
[1] Armentano R L Barra J G Levenson J Simon A and Pichel R 1995 Arterial wall mechanics in conscious dogs Assesment of viscous inertial and elastic moduli to characterize aortic wall behaviour Circ Res 76(3) 468-78
[2] Barra J G Armentano R L Levenson J Cabrera-Fisher E I Pichel R H and Simon A 1993 Assesment of smooth muscle contribution to descending thoracic elastic mechanics in conscious dogs Circ Res 73 1040-50
[3] Gamero L G Armentano R L and Levenson J 2002 Arterial wall diameter and viscoelasticity variability Compu in Card 29 513-6
[4] Craiem D Graf S Salvucci F Chironi G Megnien J L Simon A Armentano R L 2010 Physiological principles of the ambulatory arterial stiffness index explained by the non-linearity of arterial elasticity Physiol Meas 31(7) 1037-46
[5] Alfonso M 2009 Sistema portable para el caacutelculo y registro de paraacutemetros fisioloacutegicos Thesis FICEN Universidad Favaloro
[6] Laurent S et al 2006 Expert consensus document on arterial stiffness methodological issues and clinical applications Eur Heart J 27 2588 ndash 605
[7] Chiu C Y Arand P W Schroff A Feldman T and Carroll J 1991 Determination of pulse wave velocities with computarized algorithms Am Heart J 121 126
[8] Armentano R L Barra J G Pessana F M Craiem D Graf S Santana D B and Sanchez R A 2007 Smart smooth muscle spring-dampers Smooth muscle smart filtering helps to more efficiently protect the arterial wall IEEE Eng Med Biol Mag 26 62-70
[9] Gamero L G Armentano R L Barra J G Simon A and Levenson J 2001 Identification of arterial wall dynamics in conscious dogs Exp Physiol 86 519-28
SABI 2011 IOP PublishingJournal of Physics Conference Series 332 (2011) 012008 doi1010881742-65963321012008
6
Mechanical properties of the aortic arterial wall during 24
hours a preliminary study in conscious sheep
S Graf13 D Craiem
13 M Valero
1 M Alfonso
1 J G Barra
12 RL
Armentano1
1 Fac de Ingenieriacutea y Ciencias Exactas y NaturalesUniversidad Favaloro 2 Dto de Ciencias Fisioloacutegicas Universidad Favaloro 3 CONICET Buenos Aires Argentina
E-mail graffavaloroeduar
Abstract Previous experiences in animals showed a different behavior between the
variability of pressure arterial diameter and elasticity when they were registered for a couple
of hours To better understand arterial mechanics variability we propose to measure
simultaneously aortic pressure and diameter during 24 hours in a sheep For that purpose we
developed a portable prototype device It allows continuously recording physiological signals
throughout the day and storing them in a solid state memory for later analysis Pulse wave
velocity and Peterson modulus were assessed beat-to-beat as arterial stiffness indexes We
identified 53762 heart beats during 24 hours that were separated into 2 groups below or
above median mean pressure (71 mmHg) Mean diameter pulse wave velocity and Peterson
modulus increased for higher pressure values (plt005) whereas heart rate slowed down
(plt005) Pressure-diameter loops were successfully recreated all along the experience This
new methodology sets the basis for further experiences involving the estimation of 24 hours
arterial mechanics variability
1 Introduction
The alterations of the arterial system can be evaluated from a biomechanical perspective analyzing the function and structure of the arteries Previous studies from our group applied mathematical models to assess the geometric elastic and viscous properties of the arteries They were carried out starting from pressure-diameter loops in chronically instrumented conscious animals [1 2] Although the heart rate variability was extensively studied insufficient information is available about the variability of the arterial mechanical properties during the day and night We showed that pressure diameter and elasticity variability were dissimilar during short term (one hour) experiences performed in sheep [3 4] Particularly elasticity did not followed pressure variations during all the time On the basis of these observations we propose to extend the analysis to 24 hours measuring simultaneously arterial pressure and diameter and pulse wave velocity (PWV) The online assessment of these properties could help to better understand the different regulatory mechanisms that control blood flow and pressure during day and night Recently we developed an autonomous and portable prototype device which allows continuous recording and digital storage of physiological signals for analysis The device was validated in vitro and contrasted against synthesized (simulated) signals [5] Using this device the aortic blood pressure diameter and consequently arterial stiffness evolution can be estimated beat to beat To validate arterial stiffness
SABI 2011 IOP PublishingJournal of Physics Conference Series 332 (2011) 012008 doi1010881742-65963321012008
Published under licence by IOP Publishing Ltd 1
measurements PWV was also calculated using two arterial diameter sensors [6] This work presents the methodology the system implementation and the preliminary results from an animal experience
2 Materials and methods
21 Prototype description The portable prototype device is based on a dsPIC30F6014A (Microchip USA) microcontroller (figure 1) Basically it includes a signal conditioning stage (filtering and amplification) a 12-bit A-D converter stage and a data storage stage (4GB SD type flash memory card) The signals can be monitored in real time by a liquid crystal display or via serial communication using a computer
Figure 1 (a) Block diagram and (b) picture of the implemented prototype
The equipment allows acquiring and storing up to 4 channels simultaneously at a configurable sampling frequency of 05 1 2 and 4 KHz and at configurable time intervals In order to verify the proper operation several tests were conducted for at least 24 hours The memory storage capability was tested using synthetic signals resulting in no loss of data Keeping a constant signal on each input channel it was demonstrated that the variation throughout a day was less than 1 Settling time of the device was less than 5 minutes [5]
22 Animal instrumentation A healthy Corrediale crossbreed sheep of 47 kg and 15 year-old was used for the experiment Surgery was performed under general anesthesia premedicated with acepromazine (02 mgkg) induced with thiopental sodium (20 mgkg) and maintained with isoflurane (25 in pure oxygen at 2 Lmin) with assisted mechanical ventilation (Neumovent 910 Coacuterdoba Argentina) During surgery blood pressure electrocardiogram capnography and heart rate were monitored (Siemens Sirecust 404-1) Two thoracotomies in the fourth and seventh left intercostal spaces were performed The proximal and distal thirds of the aorta were exposed to implant pressure and diameter sensors The solid-state pressure microtransducer of 25 mm (Konigsberg Instruments Inc Pasadena CA) was implanted in the proximal third The pressure microtransducer has been previously calibrated in vitro in saline at 37degC against a pressure caliper (Xcaliber Viggo-Spectramed Oxnard CA) Both in proximal and distal regions of the aorta ultrasonic crystals (5 MHz 4 mm) were sutured with 6-0 silk on the adventitia in two places diametrically opposed to measure outer diameter by sonomicrometry (Triton Technology Inc San Diego CA) The first pair was sutured to the proximal third of the vessel at 5 mm of the pressure sensor to avoid interference and the second pair was
SABI 2011 IOP PublishingJournal of Physics Conference Series 332 (2011) 012008 doi1010881742-65963321012008
2
sutured in the distal third (the distance between the two sensors were 147 cm) The optimal placement of the crystals was verified by the digital oscilloscope screen (Tektronix TOS 220 Tektronix Inc Beaverton USA) The correct recording of the sensors was verified during operation by monitoring the signals in real time with the prototype connected to a PC before and after closure of thorax After sensors implantation cables were tunneled to emerge through the skin on the back of the sheep which was then sutured Finally the incisions were closed by layers
23 Experimental protocol The experiment was carried out after 7 days of the surgical instrumentation to ensure proper postoperative recovery The first channel of the prototype was adjusted to work with the pressure microtransducer while the two following channels were conditioned to receive the sonomicrometer diameter signals The prototype device was configured to acquire and store in memory three signals over 24 hours continuously for 5 minutes separated by an interval of 5 minutes Sampling frequency was set to 1 KHz The activity of the sheep was monitored using digital images of 512times512 pixels taken with a digital camera (Logitech USA) connected to a PC The day after the study data from the memory card was downloaded and signals were processed using proper software developed in our laboratory For each cardiac cycle systolic diastolic and mean values from pressure and diameter signals were automatically obtained PWV was assessed as the ratio of the distance between the two diameter sensors and the resulting temporal delay between the onsets of the two diameter waveforms identified by the tangent method [7] At a sampling frequency of 1 KHz and considering a distance of 147 cm between sensors the estimated error in PWV was ~34 Heart rate was calculated from the pressure signal The pressure-strain elastic (Peterson) modulus (Ep) was calculated as defined in equation (1)
Dp DD
PE sdot
∆∆= (1)
where P∆ is the difference between systolic and diastolic pressure and D∆ is the difference between systolic and diastolic diameter (DD)
24 Statistical analysis Data are expressed as mean plusmn standard deviation In order to characterize the mechanical behavior of the arterial wall the total amount of identified beats along 24 hours were separated into 2 groups below or above the median mean pressure Differences were compared using Student t test A value of plt005 was considered significant
3 Results
The instrumented animal during the experience is shown in figure 2 Note the sensors wires emerging from the back of the animal The sheep was free to move using a custom hose-spring system hanging from the ceiling The prototype device and the sonomicrometer were located on the other side of the wall The animal was isolated and remained calmed during the experience All measurements were made without sedation with the animal in conscious state It was free to eat and rest in any moment and did not present discomfort during the experience Aortic pressure diameter and PWV temporal evolution for 24 hours are shown in figure 3 The pressure-diameter measures in the aorta are shown in figure 4 with the excursion of the diastolic mean and systolic values during 24 hours Pressure values ranged from 40 to 100 mmHg and diameter values from 195 to 235 mm
SABI 2011 IOP PublishingJournal of Physics Conference Series 332 (2011) 012008 doi1010881742-65963321012008
3
Figure 2 Conscious instrumented sheep and associated equipment used for signals recordings during 24 hours
We identified 53762 heart beats during 24 hours that were separated into 2 groups according to the median pressure value which resulted in 71 mmHg The hemodynamic parameters of each group are detailed in table 1 Mean diameter PWV and Ep increased during high pressure group (plt005) whereas heart rate slowed down (plt005)
Figure 3 Temporal evolution of pressure diameter and PWV every 10 minutes during 24 hours The plotted values represent the median from 5-minutes continuous recordings For pressure and diameter the systolic mean and diastolic values are shown For the PWV an additional trend line is shown
SABI 2011 IOP PublishingJournal of Physics Conference Series 332 (2011) 012008 doi1010881742-65963321012008
4
Figure 4 Diastolic mean and systolic median values of pressure and proximal diameter registered during 24 hours every 5 minutes with their respective mean and standard deviation
Table 1 Hemodynamic parameters during 24 hours separated by groups
Low pressure group
n=26881 beats High pressure group
n=26881 beats
Mean pressure (mmHg) 66 plusmn 4 75 plusmn 4
Mean diameter (mm) 2156 plusmn 051 2167 plusmn 055
PWV (cms) 461 plusmn 34 478 plusmn 37
Heart rate (bpm) 98 plusmn 18 93 plusmn 15
Ep (mmHg) 285 plusmn 64 299 plusmn 70
plt005 (Student t test) between low and high pressure group
4 Discussion
In this work we show for the first time the continuous assessment of aortic elastic properties in a sheep during 24 hours Aortic pressure and diameter were recorded using a custom portable prototype especially designed in our laboratory The device successfully acquired and stored more than 50000 heart beats throughout one day In this particular experience pressure varied ~30 and diameter only ~10 with respect to 24 hours mean values Aortic stiffness was independently estimated using two indexes the Peterson modulus Ep calculated from pressure-diameter loops and the PWV estimated using 2 diameter sensors separated with a known distance Although the animal was calm during the experiment the arterial pressure showed an important variation (figure 3) As expected aortic wall stiffness was positively associated to pressure changes To study the association between pressure values and arterial mechanics we divided all the measured beats in 2 groups using the median mean pressure as a threshold Arterial stiffness was higher for pressure beats above the threshold for a 15 of pressure change PWV and Ep increased ~5 However pressure and stiffness were not permanently correlated during the experience In fact we found that the relationship between arterial pressure and diameter was not systematic evidencing the complexity of the arterial system As shown in figure 4 pressure-diameter values do not lie on the same unique elasticity curve during 24 hours This reflects the natural biological variability of the arterial wall properties where the active components of the wall (vascular smooth muscle) continuously regulate the vessel size In previous works of our group different beat-to beat elastic models were tested in vivo [8 9] So we are encouraged to initiate a new set of experiments aimed to analyzing the variability of the mechanical properties in aorta Analyzing the animal activity along the 24 hours
SABI 2011 IOP PublishingJournal of Physics Conference Series 332 (2011) 012008 doi1010881742-65963321012008
5
we concluded that could not follow a circadian behavior As can be seen from the figure 3 there is not any comprehensible daynight pattern That might be related to the permanent availability of food The digestive system of ruminants might generate recurrent pressure maneuvers that could modulate the arterial pressure Also the activity of the animal could be altered by the hose-spring system Further experiments are necessary to explore these suggestions Some issues remain to be solved to ensure the full portability of the prototype First although the system supports the direct connection of the pressure microtransducer it requires an external sonomicrometer to generate the diameter signals A new portable sonomicrometry system is being designed in our laboratory and will be incorporated in the near future Secondly we are reducing the size of the prototype using surface mount components and small batteries that will allow a better portability Then the device will become completely autonomous without requiring any external connection allowing the animal to carry the whole system on his back
5 Conclusions
Through a beat to beat 24 hours analysis we studied the influence of pressure on the aortic mechanical properties of a sheep In general when pressure increased diameter PWV and EP concomitantly increased whereas heart rate decreased Pressure-diameter loops were successfully recreated all along the experience confirming the capability of assessing true arterial wall behavior during 24 hours These findings encourage us to program new experiments aimed to analyze the arterial mechanical properties throughout the day
6 Acknowledgments
This work was in part subsidized by the project PIP number 112-200901-00734 (CONICET) and project PICTO 31355 (ANPCyT)
References
[1] Armentano R L Barra J G Levenson J Simon A and Pichel R 1995 Arterial wall mechanics in conscious dogs Assesment of viscous inertial and elastic moduli to characterize aortic wall behaviour Circ Res 76(3) 468-78
[2] Barra J G Armentano R L Levenson J Cabrera-Fisher E I Pichel R H and Simon A 1993 Assesment of smooth muscle contribution to descending thoracic elastic mechanics in conscious dogs Circ Res 73 1040-50
[3] Gamero L G Armentano R L and Levenson J 2002 Arterial wall diameter and viscoelasticity variability Compu in Card 29 513-6
[4] Craiem D Graf S Salvucci F Chironi G Megnien J L Simon A Armentano R L 2010 Physiological principles of the ambulatory arterial stiffness index explained by the non-linearity of arterial elasticity Physiol Meas 31(7) 1037-46
[5] Alfonso M 2009 Sistema portable para el caacutelculo y registro de paraacutemetros fisioloacutegicos Thesis FICEN Universidad Favaloro
[6] Laurent S et al 2006 Expert consensus document on arterial stiffness methodological issues and clinical applications Eur Heart J 27 2588 ndash 605
[7] Chiu C Y Arand P W Schroff A Feldman T and Carroll J 1991 Determination of pulse wave velocities with computarized algorithms Am Heart J 121 126
[8] Armentano R L Barra J G Pessana F M Craiem D Graf S Santana D B and Sanchez R A 2007 Smart smooth muscle spring-dampers Smooth muscle smart filtering helps to more efficiently protect the arterial wall IEEE Eng Med Biol Mag 26 62-70
[9] Gamero L G Armentano R L Barra J G Simon A and Levenson J 2001 Identification of arterial wall dynamics in conscious dogs Exp Physiol 86 519-28
SABI 2011 IOP PublishingJournal of Physics Conference Series 332 (2011) 012008 doi1010881742-65963321012008
6
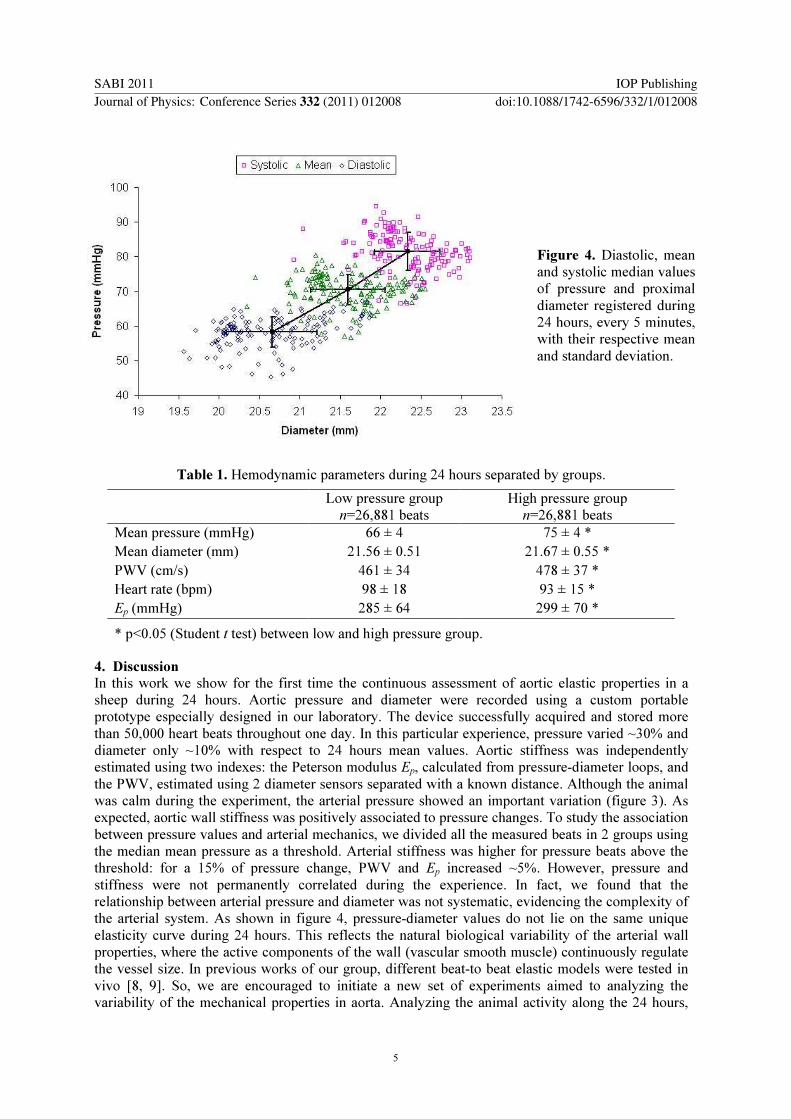