mechanical properties of thin wall ductile iron-influence
TRANSCRIPT
1. Introduction
Design engineers, vehicle makers and foundrymen areamong those members of the engineering community thatare more strongly pressed to produce lighter, stronger andstiffer metallic parts. Ductile iron can be a material ofchoice to produce such parts, since it is suited to producecast parts of complex shape, it can reach very high strengththrough heat treatment, and it is relatively inexpensive.Compared to cast aluminium alloys, ductile iron showsmuch higher elastic modulus, a comparable strength to den-sity ratio, better fatigue strength, and lower production cost.Nevertheless, to make full use of its relative advantages toproduce light parts, ductile iron must be cast with thinwalls. Conventional technology limits the minimum thick-ness of DI parts to about 5 mm. Nevertheless, the study ofthe production of thinner parts is receiving increasing atten-tion. Reducing the minimum production thickness of DI allows to design and cast hollow parts of high stiffness.1)
Nevertheless, as the thickness of the parts diminishes, themetallurgical quality of the DI becomes increasingly criti-cal. Microstructural anomalies and structural defects, suchas microshrinkage or defective skin, graphite alignment,oriented dendrites, inverse chill, oxide films and particlesand flake graphite rim, decrease mechanical properties.2)
Some of the first issues to be dealt with in order to makeit possible the production of thin wall ductile iron (TWDI)are i) Proper mould design to allow for the production ofsound parts in spite of the rapid cooling rate and the conse-quently reduced fluidity. Software for numerical simulationof mould filling and solidification has proven to be an ex-cellent tool to assist in this task. ii) Proper conditioning of
the melt before pouring, so as to obtain homogeneous andcarbide free microstructures. This is the subject that has re-ceived more attention in the literature.2–5) Most studies con-cluded that high carbon equivalent (CE) irons must be usedto avoid as-cast carbide precipitation. Carbides decrease thestrength, ductility and machinability of TWDI. Early workof Loper (1969) showed that an increase in CE causes anincrease in the nodule count and a significant decrease inthe precipitation of carbides. Loper indicated that CE mustbe raised to 4.75 to 4.92% in order to obtain carbide freestructures in 3 to 5 mm thickness sand cast DI. More re-cently, studies carried out on DI containing lower levels ofMn, P and S recommended to adopt a CE�4.72% (3.7% Cand 3.4% Si) for carbide-free SG iron in castings with wallthickness 3 mm and this is consistent with the recommenda-tion of QIT, that estimates the required CE using the equa-tion CE�4.9265–0.0425 · t, where t is the thickness (sandcast).3)
Javaid4,5) reports that carbide free 3 mm thick DI plateswere obtained in sand moulds by using DI having CE rang-ing from 4.5 to 5.08%.
Laberque6) used special inoculants, having Bi and Ce, toobtain carbide free microstructures in 3 mm thick platescast of 4.6 to 4.9% CE ductile iron. O. Dógan7) used DI ofCE ranging from 4.7 to 4.8% to cast carbide free plates ofthickness ranging from 1.5 to 9 mm, using independent andconnected plates in a horizontal mould.
The review of the literature shows that the use of hyper-eutectic DI, with CE ranging from 4.45 to 4.9%, is recom-mended when plates of thickness below 5 mm are to be castfree from carbides in sand moulds.
Recent studies of the authors8) showed that ledeburitic
ISIJ International, Vol. 44 (2004), No. 7, pp. 1180–1187
© 2004 ISIJ 1180
Mechanical Properties of Thin Wall Ductile Iron-Influence ofCarbon Equivalent and Graphite Distribution
P. DAVID, J. MASSONE,1) R. BOERI1) and J. SIKORA1)
Graduate Student, Metallurgy Division, INTEMA, National University of Mar del Plata, FONCYT, Av. Juan B. Justo 4302-B7608FDQ Mar del Plata, Argentina. 1) Faculty of Engineering, Metallurgy Division INTEMA, National University of Mar delPlata, CONICET, Av. Juan B. Justo 4302-B7608FDQ Mar del Plata, Argentina. E-mail: [email protected]
(Received on January 5, 2004; accepted in final form on April 11, 2004 )
This work focuses on the study of the mechanical properties and microstructure of plates of thin wallductile iron, cast in sand moulds of vertical and horizontal configuration. All tests were carried out on ferri-tised samples. Melts of carbon equivalent values ranging from 4.06 to 4.85 were used to cast plates ofthickness ranging from 1.5 to 4 mm. The results show that irons having carbon equivalent values greaterthan 4.6 exhibit a marked tendency to develop exploded graphite shapes and agglomeration of graphitenodules. As a result, these irons show scattered values of mechanical properties. As irons are producedwith carbon equivalent values below 4.6%, the mechanical properties improve, reaching levels that satisfythe requirements of standards developed for ferritised ductile irons sand cast in Y-blocks.
KEY WORDS: ductile iron; thin wall; mechanical properties; deteriorated graphite; carbon equivalent.
carbides precipitated in TWDI in large amounts can be eas-ily dissolved by a short austenitizing heat treatment.Therefore, this investigation was not focused on the attain-ment of carbide free structures as cast.
Several studies focused on the mechanical properties ofTWDI.2,3,9–11) Most authors make use of the quality indexproposed by Loper and Kotschi,12) to assess the quality ofthe TWDI parts tested. A baseline is defined on tensilestrength vs. elongation and yield strength vs. elongationplots. The quality of a given iron is judged to be better asthe points, defined by its tensile strength, yield strength andelongation, lie more above the baseline.
Stefanescu et al.2) report that the tensile strength andelongation of TWDI vary within a large range. This vari-ability in the results of tensile testing seems to be caused bymicrostructural anomalies generated during solidification,such as micro-shrinkage, graphite and dendrite aligning, in-verse chill, oxide particles, and by some morphological fac-tors, such as the surface roughness of the samples. Whenproperties are measured on sound TWDI plates, free frominternal defects and carbides, samples of mainly ferriticmatrix show tensile strength of 413–482 MPa, yield strengthof 296–317 MPa, and 18–25% elongation, for hardnessranging between 133 and 167 HB. Samples of pearlitic–fer-ritic matrix show 606–758 MPa Tensile strength, 400–482MPa yield strength, 6–12% elongation and 210–240 HBhardness.
In other study, Stefanescu et al.3) show that the strengthand elongation of TWDI are largely influenced by the sur-face roughness and the graphite morphology. Poor proper-ties of TWDI are associated to low nodularity and coarseroughness. Testing of samples including the original castingskin shows that as roughness values exceed Ra�10 mm, apronounced decrease in strength and elongation is ob-served. Samples in which the casting skin has been re-moved by grinding show consistently higher tensile proper-ties.
Labrecque and Gagné9) measured the mechanical proper-ties of ductile irons cast in sections of 3 and 10 mm. The re-sults of tensile strength and elongation show that the sam-ples taken from the 10 mm plates satisfy the minimumquality index, while samples from the 3 mm plates showlower and more disperse values, that fail to satisfy the stan-dards in most cases.
Javaid and Davis10) also measured mechanical propertiesof TWDI, and found disperse values. Good mechanicalproperties, satisfying ASTM A 536, were obtained whenthe material showed good nodularity, high nodule countsand a matrix free from carbides and inclusions. Samplesthat failed to satisfy the standards showed microstructuralanomalies. In general, it was found that lower elongationreflects lower Si (higher pearlite contents), the presence ofcarbides, or lower nodule count or nodularity, while higherelongation is shown by irons of higher Si (higher ferritecontents), improved nodularity and higher nodule count.
In summary, the results of the literature indicate thatTWDI has the potential to satisfy the requirements of thestandards devised for regular DI, nevertheless, disperse val-ues were found in many studies, with a significant propor-tion of samples that fail to satisfy the minimum require-ments of ASTM A 536. Unsatisfactory properties were
generally linked to casting defects. In most studies, me-chanical properties have been measured on as-cast samples.Under this conditions, samples of different thickness willhave different matrix microstructure, and therefore differentmechanical properties. Then, direct comparison of the me-chanical properties of samples taken from sections of dif-ferent thickness is not possible. A systematic study of thefactors controlling the presence of defects on TWDI parts istherefore necessary to ensure that satisfactory propertiescan be consistently obtained in industrial production.
The objectives of this investigation are to study the me-chanical properties of ferritic TWDI plates cast in sandmoulds, and to identify the effect of the morphology, countand distribution of the graphite phase particles, and the car-bon equivalent on the tensile properties.
2. Experimental Methods
The melts used in this investigation were produced at thefoundry pilot plant of INTEMA, using a 50 kg medium fre-quency induction furnace. The charge was made of ductileiron grade pig iron, steel scrap, FeSi and a carburisingagent. Several melts having carbon equivalents (CE) rang-ing from 4.06 to 4.85% were poured. All melts were heatedto 1 540–1 550°C before treatment. The melt was treated intwo stages, using separate ladles. Nodularising was carriedout by applying the sandwich method in the first ladle, andusing FeSiMg (6%). Inoculation was carried out in the second ladle by using FeSi (75% Si, 1.1% Ca) in thestream.
The temperature of the melt in the ladle was measuredimmediately before pouring the moulds. Pouring tempera-ture was between 1 340 and 1 360°C in all cases.
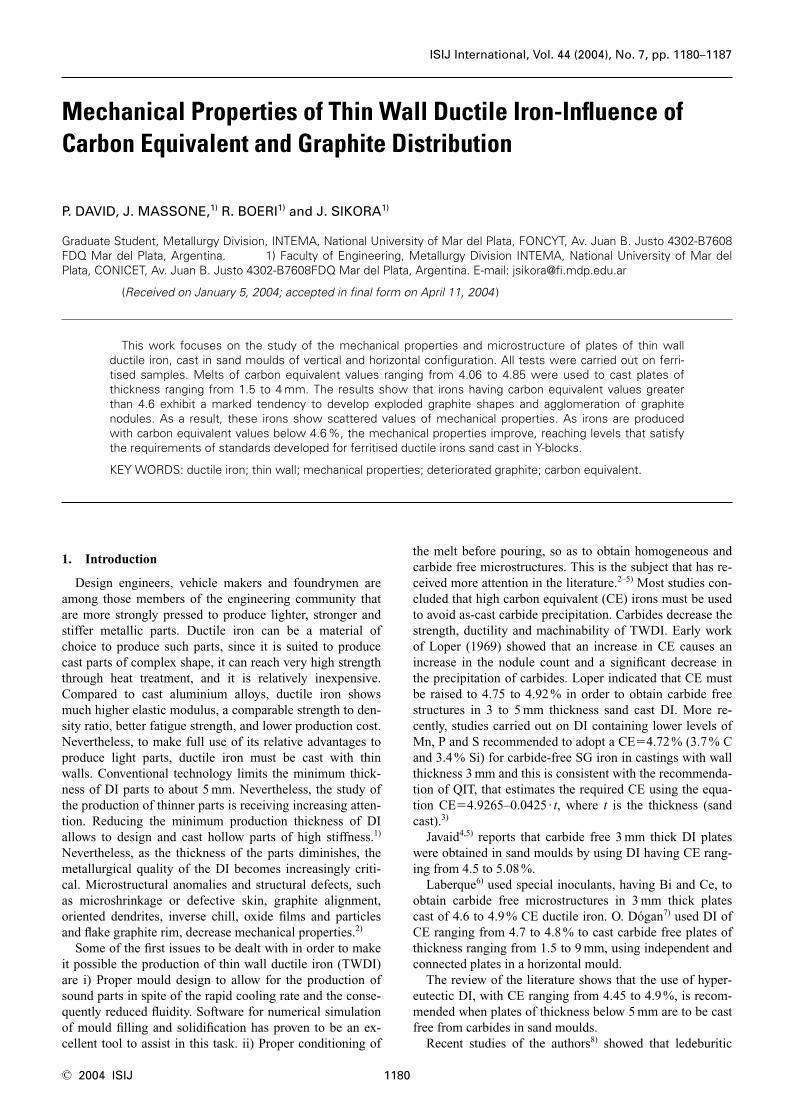
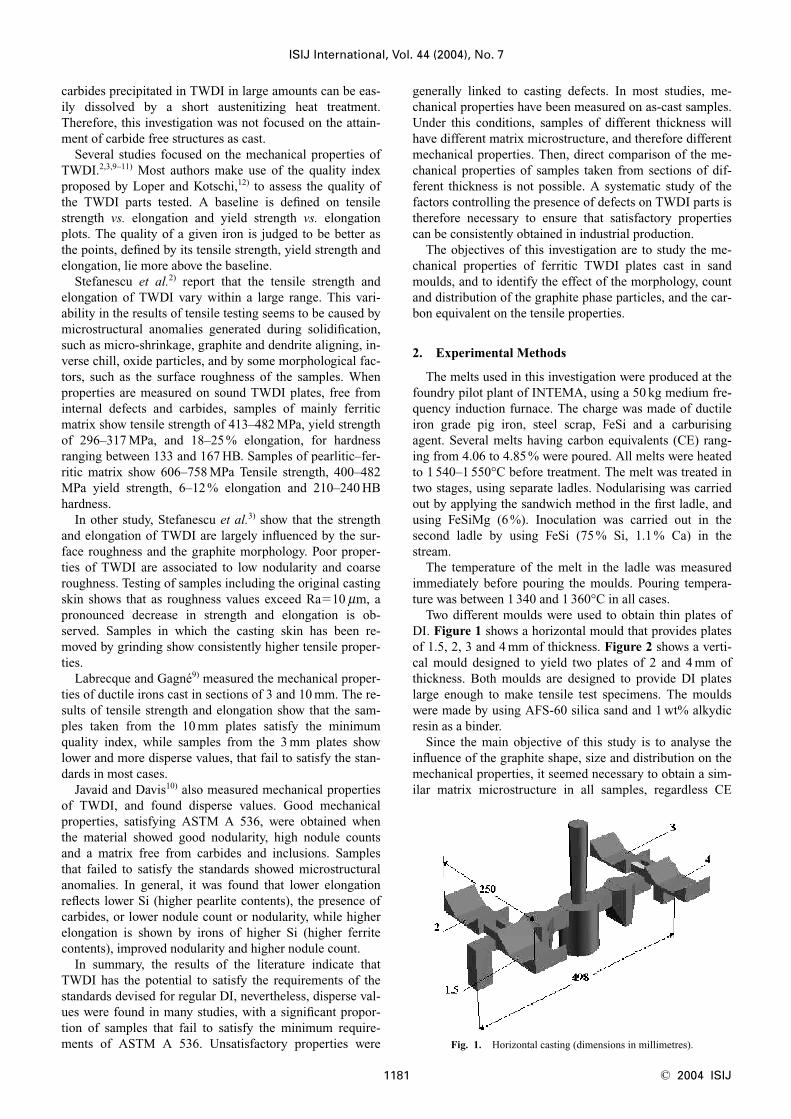
Two different moulds were used to obtain thin plates ofDI. Figure 1 shows a horizontal mould that provides platesof 1.5, 2, 3 and 4 mm of thickness. Figure 2 shows a verti-cal mould designed to yield two plates of 2 and 4 mm ofthickness. Both moulds are designed to provide DI plateslarge enough to make tensile test specimens. The mouldswere made by using AFS-60 silica sand and 1 wt% alkydicresin as a binder.
Since the main objective of this study is to analyse theinfluence of the graphite shape, size and distribution on themechanical properties, it seemed necessary to obtain a sim-ilar matrix microstructure in all samples, regardless CE
ISIJ International, Vol. 44 (2004), No. 7
1181 © 2004 ISIJ
Fig. 1. Horizontal casting (dimensions in millimetres).
and section thickness. Therefore, all parts were ferritisedafter casting, to obtain a fully ferritic matrix in all cases.This was done before machining by austenitising al 930°Cduring 2 h, followed by furnace cooling. All samples sur-faces were ground to remove the casting skin. Tensile testswere carried out using an Instron 8501. Ultimate TensileStrength (UTS), yield strength (SY0.2) and elongation (ef)were measured according to standard ASTM E 8M-95a onflat samples. Figure 3 shows the dimensions of the tensiletest samples used. Figure 4 shows the way in which tensileand metallographic samples are taken from the TWDI
plates cast using the vertical mould.The characterisation of the microstructure of the DI parts
was done after regular polishing. An Olympus PMG-3 mi-croscope was used. In order to obtain a characterisation ofthe microstructure that represents the tested material asclosely as possible, the metallographic specimens weretaken from the calibrated section of the tensile samplesafter testing. Quantitative metallography was made by usingroutines developed for the software Image Pro Plus. Digitalimages were obtained by using an STC-60 video cameraand a PV-CL544XPII video board. Nodule counts weremeasured on un-etched samples The threshold value for thesize of the particles that are counted as graphite noduleswas set to 5 mm. The content of carbides was measured onsamples taken from the location shown in Fig. 4, after etch-ing with ammonia persulfate. Values reported are the aver-age of three measurements per sample.
The graphite morphology (nodularity) was characterisedby measuring the sphericity13) on the 2 and 4 mm platesfrom the vertical mould. Sphericity (Sph) values were cal-culated from values of area and perimeter of nodules mea-sured using image analysis. A threshold value of 5 mm wasused for the diameter of the particles accounted as nodules.Sph was calculated using the following expression:
3. Results
3.1. Chemical Composition
Table 1 lists the denomination and chemical compositionof the melts used. The table also shows the symbol used toidentify data from each melt in all the plots and graphs. Thedifferent melts aimed to cover a wide range of CE values byadjusting contents of C and Si.
3.2. Nodule Counts
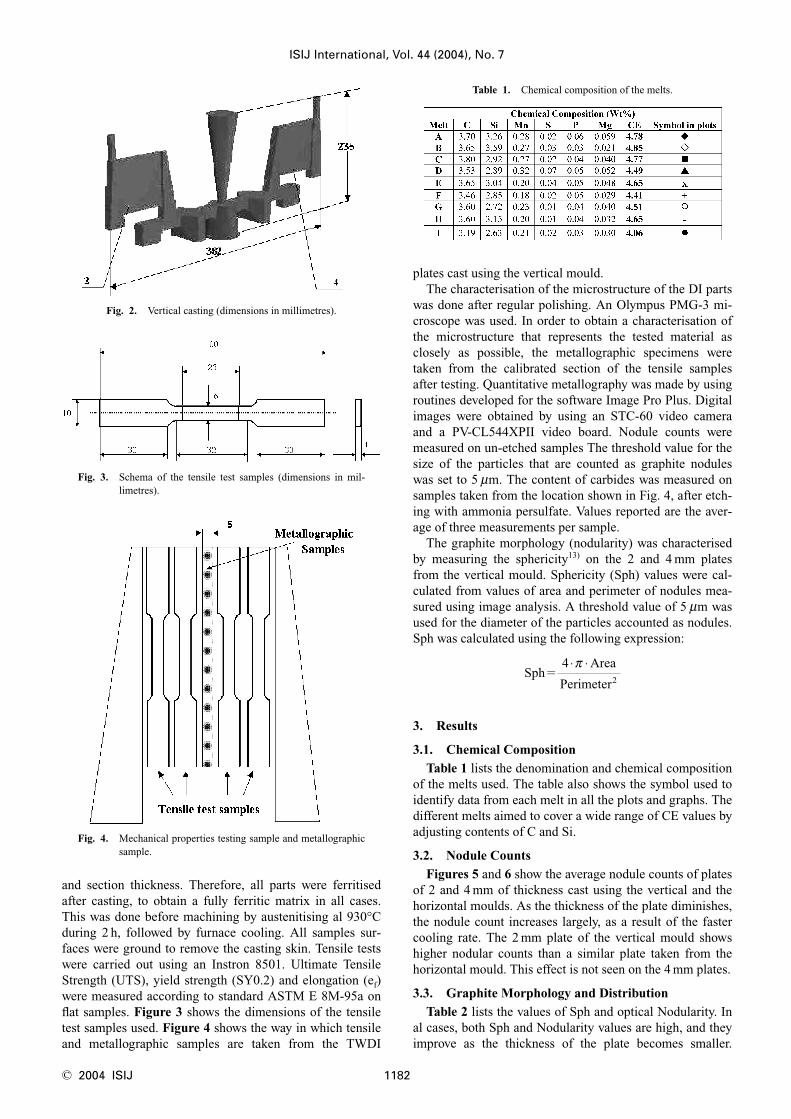
Figures 5 and 6 show the average nodule counts of platesof 2 and 4 mm of thickness cast using the vertical and thehorizontal moulds. As the thickness of the plate diminishes,the nodule count increases largely, as a result of the fastercooling rate. The 2 mm plate of the vertical mould showshigher nodular counts than a similar plate taken from thehorizontal mould. This effect is not seen on the 4 mm plates.
3.3. Graphite Morphology and Distribution
Table 2 lists the values of Sph and optical Nodularity. Inal cases, both Sph and Nodularity values are high, and theyimprove as the thickness of the plate becomes smaller.
SphArea
Perimeter2�
4 ⋅ ⋅π
ISIJ International, Vol. 44 (2004), No. 7
© 2004 ISIJ 1182
Table 1. Chemical composition of the melts.
Fig. 2. Vertical casting (dimensions in millimetres).
Fig. 3. Schema of the tensile test samples (dimensions in mil-limetres).
Fig. 4. Mechanical properties testing sample and metallographicsample.
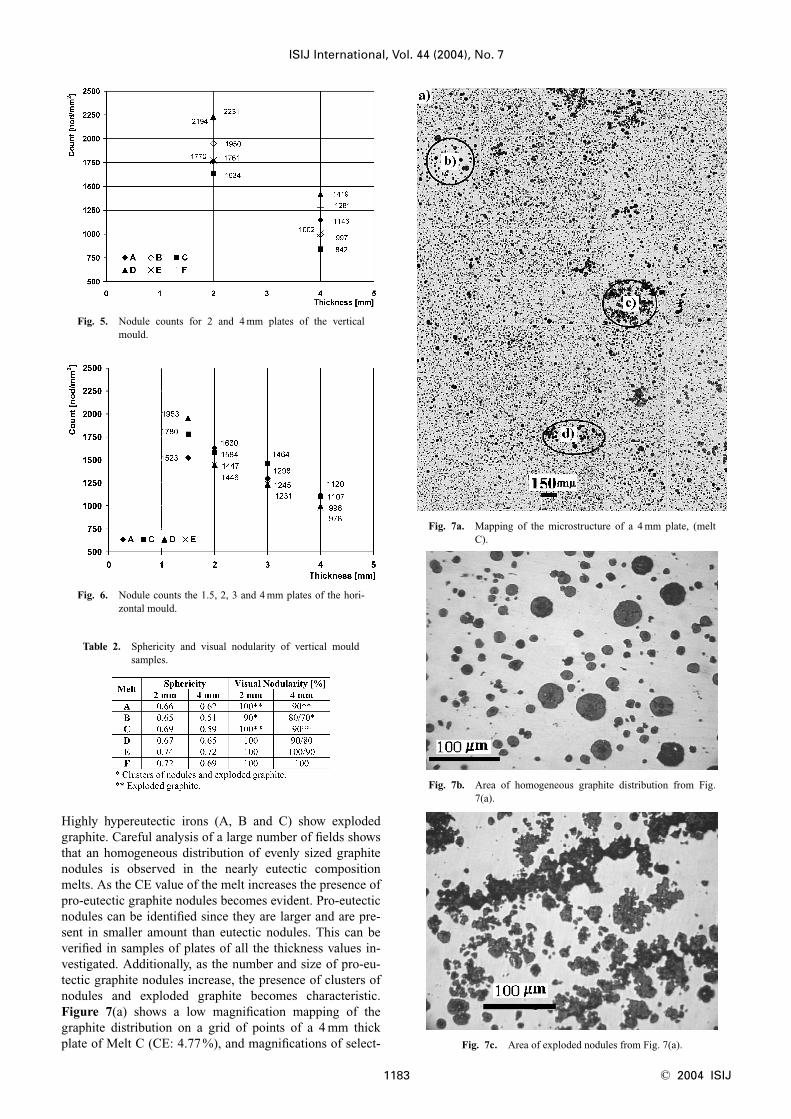
Highly hypereutectic irons (A, B and C) show explodedgraphite. Careful analysis of a large number of fields showsthat an homogeneous distribution of evenly sized graphitenodules is observed in the nearly eutectic compositionmelts. As the CE value of the melt increases the presence ofpro-eutectic graphite nodules becomes evident. Pro-eutecticnodules can be identified since they are larger and are pre-sent in smaller amount than eutectic nodules. This can beverified in samples of plates of all the thickness values in-vestigated. Additionally, as the number and size of pro-eu-tectic graphite nodules increase, the presence of clusters ofnodules and exploded graphite becomes characteristic.Figure 7(a) shows a low magnification mapping of thegraphite distribution on a grid of points of a 4 mm thickplate of Melt C (CE: 4.77%), and magnifications of select-
ISIJ International, Vol. 44 (2004), No. 7
1183 © 2004 ISIJ
Table 2. Sphericity and visual nodularity of vertical mouldsamples.
Fig. 5. Nodule counts for 2 and 4 mm plates of the verticalmould.
Fig. 6. Nodule counts the 1.5, 2, 3 and 4 mm plates of the hori-zontal mould.
Fig. 7a. Mapping of the microstructure of a 4 mm plate, (meltC).
Fig. 7b. Area of homogeneous graphite distribution from Fig.7(a).
Fig. 7c. Area of exploded nodules from Fig. 7(a).
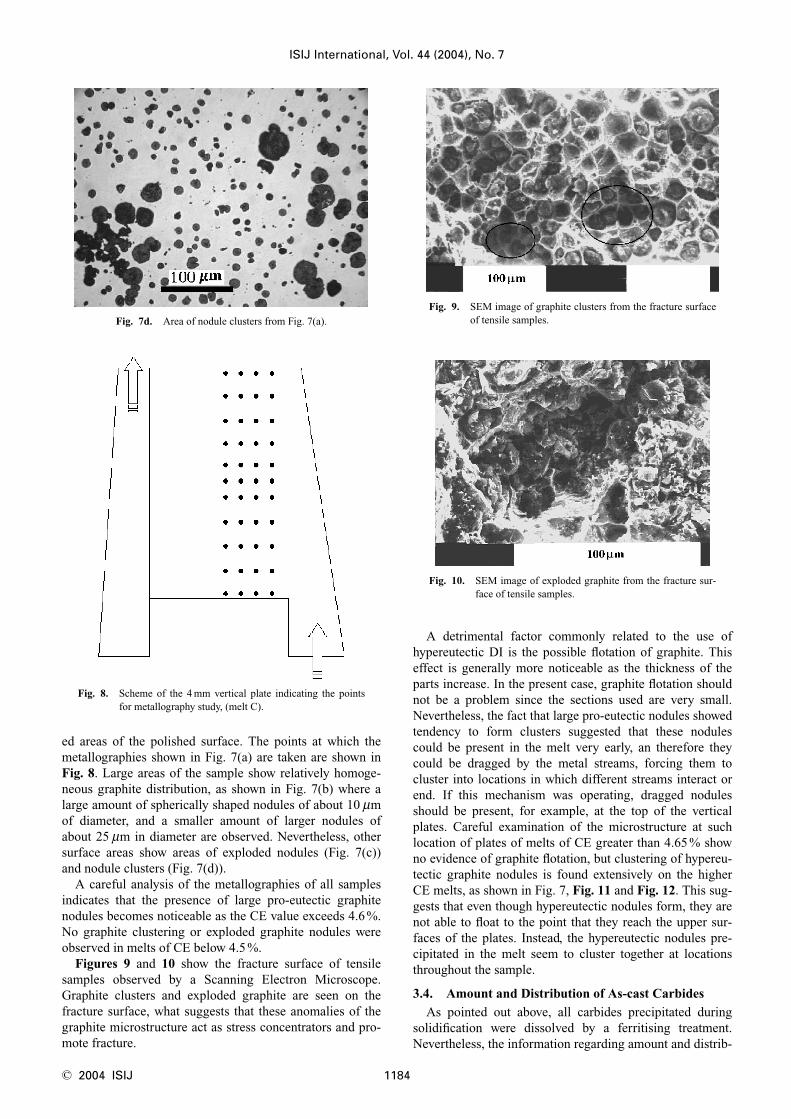
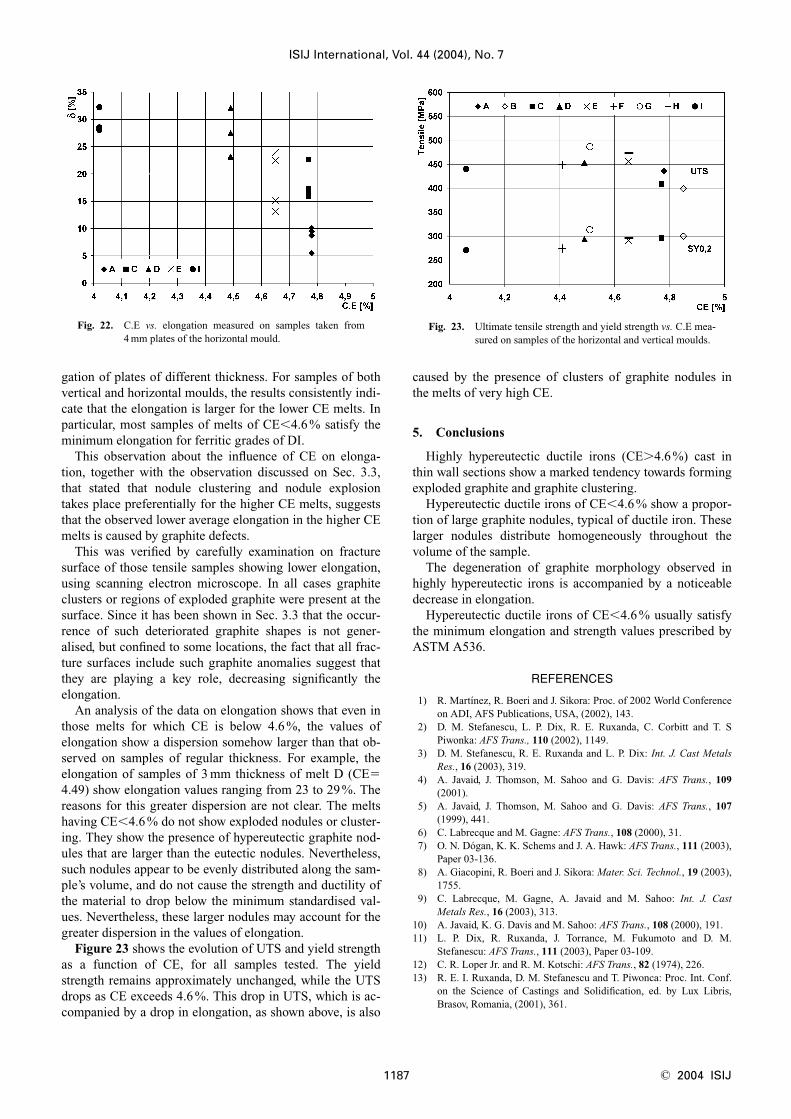
ed areas of the polished surface. The points at which themetallographies shown in Fig. 7(a) are taken are shown inFig. 8. Large areas of the sample show relatively homoge-neous graphite distribution, as shown in Fig. 7(b) where alarge amount of spherically shaped nodules of about 10 mmof diameter, and a smaller amount of larger nodules ofabout 25 mm in diameter are observed. Nevertheless, othersurface areas show areas of exploded nodules (Fig. 7(c))and nodule clusters (Fig. 7(d)).
A careful analysis of the metallographies of all samplesindicates that the presence of large pro-eutectic graphitenodules becomes noticeable as the CE value exceeds 4.6%.No graphite clustering or exploded graphite nodules wereobserved in melts of CE below 4.5%.
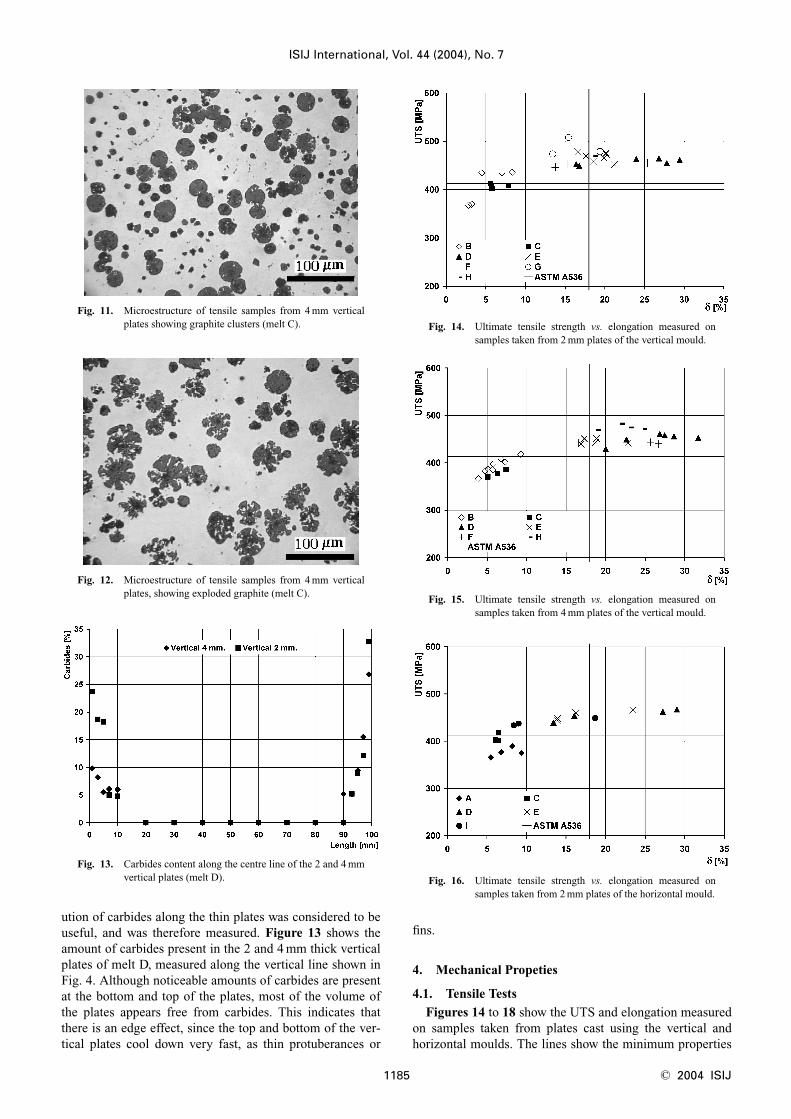
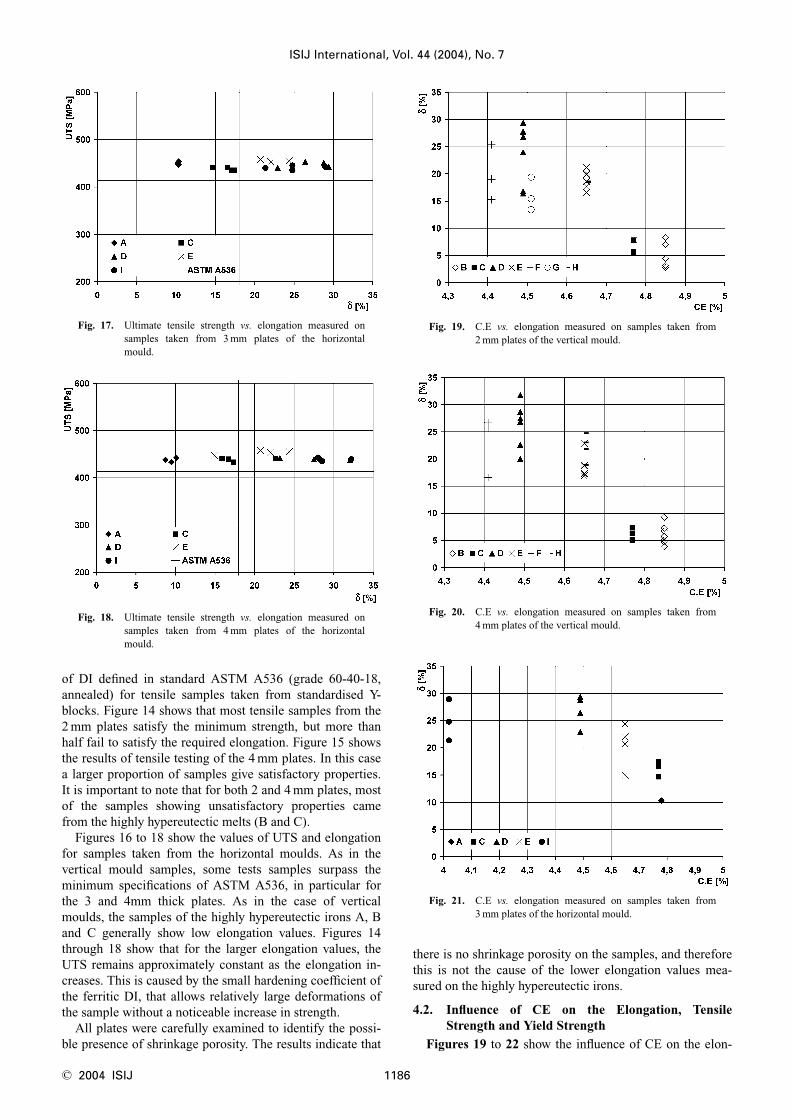
Figures 9 and 10 show the fracture surface of tensilesamples observed by a Scanning Electron Microscope.Graphite clusters and exploded graphite are seen on thefracture surface, what suggests that these anomalies of thegraphite microstructure act as stress concentrators and pro-mote fracture.
A detrimental factor commonly related to the use of hypereutectic DI is the possible flotation of graphite. Thiseffect is generally more noticeable as the thickness of theparts increase. In the present case, graphite flotation shouldnot be a problem since the sections used are very small.Nevertheless, the fact that large pro-eutectic nodules showedtendency to form clusters suggested that these nodulescould be present in the melt very early, an therefore theycould be dragged by the metal streams, forcing them tocluster into locations in which different streams interact orend. If this mechanism was operating, dragged nodulesshould be present, for example, at the top of the verticalplates. Careful examination of the microstructure at suchlocation of plates of melts of CE greater than 4.65% showno evidence of graphite flotation, but clustering of hypereu-tectic graphite nodules is found extensively on the higherCE melts, as shown in Fig. 7, Fig. 11 and Fig. 12. This sug-gests that even though hypereutectic nodules form, they arenot able to float to the point that they reach the upper sur-faces of the plates. Instead, the hypereutectic nodules pre-cipitated in the melt seem to cluster together at locationsthroughout the sample.
3.4. Amount and Distribution of As-cast Carbides
As pointed out above, all carbides precipitated during solidification were dissolved by a ferritising treatment.Nevertheless, the information regarding amount and distrib-
ISIJ International, Vol. 44 (2004), No. 7
© 2004 ISIJ 1184
Fig. 8. Scheme of the 4 mm vertical plate indicating the pointsfor metallography study, (melt C).
Fig. 7d. Area of nodule clusters from Fig. 7(a).
Fig. 9. SEM image of graphite clusters from the fracture surfaceof tensile samples.
Fig. 10. SEM image of exploded graphite from the fracture sur-face of tensile samples.
ution of carbides along the thin plates was considered to beuseful, and was therefore measured. Figure 13 shows theamount of carbides present in the 2 and 4 mm thick verticalplates of melt D, measured along the vertical line shown inFig. 4. Although noticeable amounts of carbides are presentat the bottom and top of the plates, most of the volume ofthe plates appears free from carbides. This indicates thatthere is an edge effect, since the top and bottom of the ver-tical plates cool down very fast, as thin protuberances or
fins.
4. Mechanical Propeties
4.1. Tensile Tests
Figures 14 to 18 show the UTS and elongation measuredon samples taken from plates cast using the vertical andhorizontal moulds. The lines show the minimum properties
ISIJ International, Vol. 44 (2004), No. 7
1185 © 2004 ISIJ
Fig. 11. Microestructure of tensile samples from 4 mm verticalplates showing graphite clusters (melt C).
Fig. 12. Microestructure of tensile samples from 4 mm verticalplates, showing exploded graphite (melt C).
Fig. 13. Carbides content along the centre line of the 2 and 4 mmvertical plates (melt D).
Fig. 14. Ultimate tensile strength vs. elongation measured onsamples taken from 2 mm plates of the vertical mould.
Fig. 15. Ultimate tensile strength vs. elongation measured onsamples taken from 4 mm plates of the vertical mould.
Fig. 16. Ultimate tensile strength vs. elongation measured onsamples taken from 2 mm plates of the horizontal mould.
of DI defined in standard ASTM A536 (grade 60-40-18,annealed) for tensile samples taken from standardised Y-blocks. Figure 14 shows that most tensile samples from the2 mm plates satisfy the minimum strength, but more thanhalf fail to satisfy the required elongation. Figure 15 showsthe results of tensile testing of the 4 mm plates. In this casea larger proportion of samples give satisfactory properties.It is important to note that for both 2 and 4 mm plates, mostof the samples showing unsatisfactory properties camefrom the highly hypereutectic melts (B and C).
Figures 16 to 18 show the values of UTS and elongationfor samples taken from the horizontal moulds. As in thevertical mould samples, some tests samples surpass theminimum specifications of ASTM A536, in particular forthe 3 and 4mm thick plates. As in the case of verticalmoulds, the samples of the highly hypereutectic irons A, Band C generally show low elongation values. Figures 14through 18 show that for the larger elongation values, theUTS remains approximately constant as the elongation in-creases. This is caused by the small hardening coefficient ofthe ferritic DI, that allows relatively large deformations ofthe sample without a noticeable increase in strength.
All plates were carefully examined to identify the possi-ble presence of shrinkage porosity. The results indicate that
there is no shrinkage porosity on the samples, and thereforethis is not the cause of the lower elongation values mea-sured on the highly hypereutectic irons.
4.2. Influence of CE on the Elongation, TensileStrength and Yield Strength
Figures 19 to 22 show the influence of CE on the elon-
ISIJ International, Vol. 44 (2004), No. 7
© 2004 ISIJ 1186
Fig. 17. Ultimate tensile strength vs. elongation measured onsamples taken from 3 mm plates of the horizontalmould.
Fig. 18. Ultimate tensile strength vs. elongation measured onsamples taken from 4 mm plates of the horizontalmould.
Fig. 19. C.E vs. elongation measured on samples taken from2 mm plates of the vertical mould.
Fig. 20. C.E vs. elongation measured on samples taken from4 mm plates of the vertical mould.
Fig. 21. C.E vs. elongation measured on samples taken from3 mm plates of the horizontal mould.
gation of plates of different thickness. For samples of bothvertical and horizontal moulds, the results consistently indi-cate that the elongation is larger for the lower CE melts. Inparticular, most samples of melts of CE�4.6% satisfy theminimum elongation for ferritic grades of DI.
This observation about the influence of CE on elonga-tion, together with the observation discussed on Sec. 3.3,that stated that nodule clustering and nodule explosiontakes place preferentially for the higher CE melts, suggeststhat the observed lower average elongation in the higher CEmelts is caused by graphite defects.
This was verified by carefully examination on fracturesurface of those tensile samples showing lower elongation,using scanning electron microscope. In all cases graphiteclusters or regions of exploded graphite were present at thesurface. Since it has been shown in Sec. 3.3 that the occur-rence of such deteriorated graphite shapes is not gener-alised, but confined to some locations, the fact that all frac-ture surfaces include such graphite anomalies suggest thatthey are playing a key role, decreasing significantly theelongation.
An analysis of the data on elongation shows that even inthose melts for which CE is below 4.6 %, the values ofelongation show a dispersion somehow larger than that ob-served on samples of regular thickness. For example, theelongation of samples of 3 mm thickness of melt D (CE�4.49) show elongation values ranging from 23 to 29%. Thereasons for this greater dispersion are not clear. The meltshaving CE�4.6% do not show exploded nodules or cluster-ing. They show the presence of hypereutectic graphite nod-ules that are larger than the eutectic nodules. Nevertheless,such nodules appear to be evenly distributed along the sam-ple’s volume, and do not cause the strength and ductility ofthe material to drop below the minimum standardised val-ues. Nevertheless, these larger nodules may account for thegreater dispersion in the values of elongation.
Figure 23 shows the evolution of UTS and yield strengthas a function of CE, for all samples tested. The yieldstrength remains approximately unchanged, while the UTSdrops as CE exceeds 4.6%. This drop in UTS, which is ac-companied by a drop in elongation, as shown above, is also
caused by the presence of clusters of graphite nodules inthe melts of very high CE.
5. Conclusions
Highly hypereutectic ductile irons (CE�4.6%) cast inthin wall sections show a marked tendency towards formingexploded graphite and graphite clustering.
Hypereutectic ductile irons of CE�4.6% show a propor-tion of large graphite nodules, typical of ductile iron. Theselarger nodules distribute homogeneously throughout thevolume of the sample.
The degeneration of graphite morphology observed inhighly hypereutectic irons is accompanied by a noticeabledecrease in elongation.
Hypereutectic ductile irons of CE�4.6% usually satisfythe minimum elongation and strength values prescribed byASTM A536.
REFERENCES
1) R. Martínez, R. Boeri and J. Sikora: Proc. of 2002 World Conferenceon ADI, AFS Publications, USA, (2002), 143.
2) D. M. Stefanescu, L. P. Dix, R. E. Ruxanda, C. Corbitt and T. SPiwonka: AFS Trans., 110 (2002), 1149.
3) D. M. Stefanescu, R. E. Ruxanda and L. P. Dix: Int. J. Cast MetalsRes., 16 (2003), 319.
4) A. Javaid, J. Thomson, M. Sahoo and G. Davis: AFS Trans., 109(2001).
5) A. Javaid, J. Thomson, M. Sahoo and G. Davis: AFS Trans., 107(1999), 441.
6) C. Labrecque and M. Gagne: AFS Trans., 108 (2000), 31.7) O. N. Dógan, K. K. Schems and J. A. Hawk: AFS Trans., 111 (2003),
Paper 03-136.8) A. Giacopini, R. Boeri and J. Sikora: Mater. Sci. Technol., 19 (2003),
1755.9) C. Labrecque, M. Gagne, A. Javaid and M. Sahoo: Int. J. Cast
Metals Res., 16 (2003), 313.10) A. Javaid, K. G. Davis and M. Sahoo: AFS Trans., 108 (2000), 191.11) L. P. Dix, R. Ruxanda, J. Torrance, M. Fukumoto and D. M.
Stefanescu: AFS Trans., 111 (2003), Paper 03-109.12) C. R. Loper Jr. and R. M. Kotschi: AFS Trans., 82 (1974), 226.13) R. E. I. Ruxanda, D. M. Stefanescu and T. Piwonca: Proc. Int. Conf.
on the Science of Castings and Solidification, ed. by Lux Libris,Brasov, Romania, (2001), 361.
ISIJ International, Vol. 44 (2004), No. 7
1187 © 2004 ISIJ
Fig. 22. C.E vs. elongation measured on samples taken from4 mm plates of the horizontal mould.
Fig. 23. Ultimate tensile strength and yield strength vs. C.E mea-sured on samples of the horizontal and vertical moulds.