mediaquant sector rating report reprint permission for this report or its data elements, ... 7 66 +...
TRANSCRIPT

Technology Trends
November2016
Media Cycle: Oct 1 - 31, 2016
64
© Copyright 2016 mediaQuant, Inc.
uantThe numbers behind the news
Qmedia
This free report provides
media prominence metrics for
the top 15 entities in the
sector. For full analytics on all
sector entities, subscribe to
mediaQuant dashboards via a
free trial at mediaQuant.net
© Copyright 2016 mediaQuant, Inc.The numbers behind the news
Contact mediaQuant
License our Content
For reprint permission for this report or its data elements, please contact Mary Senatori. To order full versions of this report in online or printed format,
please visit www.mediaquant.net.
Mary Senatori
www.mediaquant.net
Portland, OR 97212
About mediaQuantmediaQuant, Inc. provides businesses with analytic insight into how their brands, competitors, and
market influencers are trending in earned media. We represent earned media coverage as a simple,
comparative metric and publish it across a growing catalog of thousands of business and consumer
topics, trends, brands, and influencers discussed in traditional and social media. Using our online
dashboards, companies can benchmark the media performance of their brands alongside competitors,
track the key issues and influencers driving mindshare and market share, monitor and compare media
momentum over time, within peer groups, and across multiple traditional and social media segments,
and assign advertising value to earned media for their brand. For more information or a free 30-day trial
subscription, visit www.mediaquant.net.
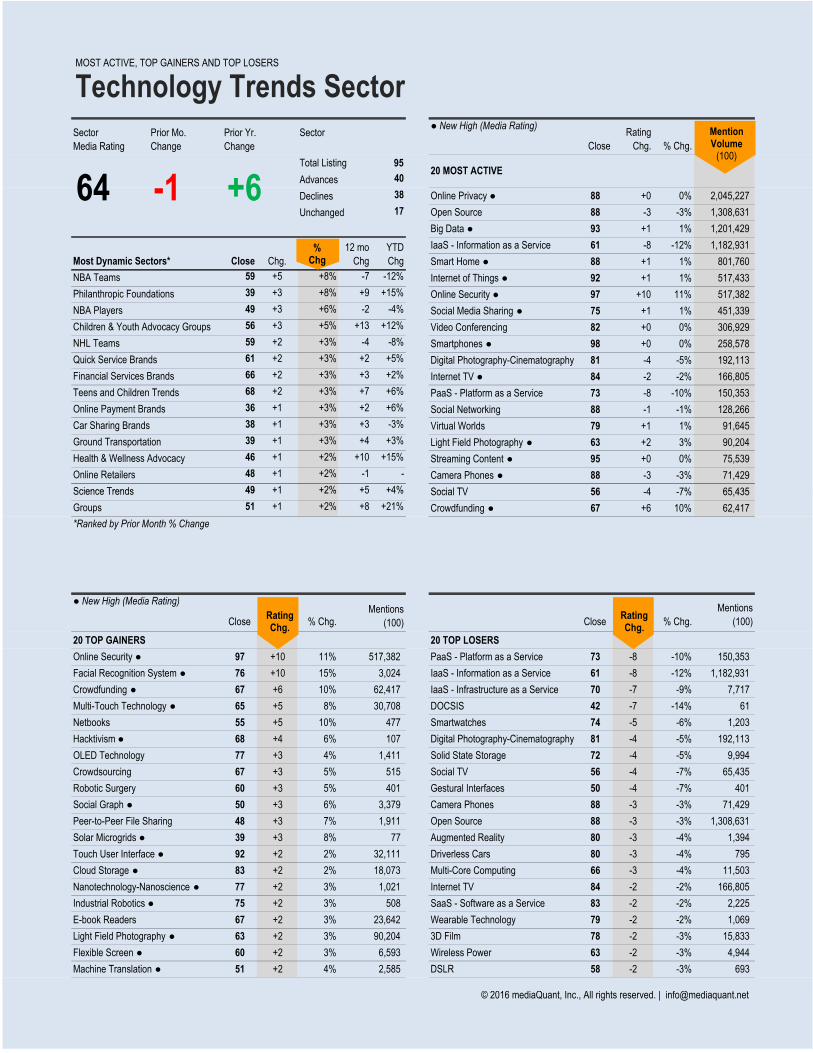
Total Listing 95
Advances 40
Declines 38 Online Privacy ● 88 +0 0% 2,045,227
Unchanged 17 Open Source 88 -3 -3% 1,308,631
Big Data ● 93 +1 1% 1,201,429
IaaS - Information as a Service 61 -8 -12% 1,182,931
Smart Home ● 88 +1 1% 801,760
59 +5 +8% -7 -12% Internet of Things ● 92 +1 1% 517,433
39 +3 +8% +9 +15% Online Security ● 97 +10 11% 517,382
49 +3 +6% -2 -4% Social Media Sharing ● 75 +1 1% 451,339
56 +3 +5% +13 +12% Video Conferencing 82 +0 0% 306,929
59 +2 +3% -4 -8% Smartphones ● 98 +0 0% 258,578
61 +2 +3% +2 +5% Digital Photography-Cinematography 81 -4 -5% 192,113
66 +2 +3% +3 +2% Internet TV ● 84 -2 -2% 166,805
68 +2 +3% +7 +6% PaaS - Platform as a Service 73 -8 -10% 150,353
36 +1 +3% +2 +6% Social Networking 88 -1 -1% 128,266
38 +1 +3% +3 -3% Virtual Worlds 79 +1 1% 91,645
39 +1 +3% +4 +3% Light Field Photography ● 63 +2 3% 90,204
46 +1 +2% +10 +15% Streaming Content ● 95 +0 0% 75,539
48 +1 +2% -1 - Camera Phones ● 88 -3 -3% 71,429
49 +1 +2% +5 +4% Social TV 56 -4 -7% 65,435
YTD
ChgMost Dynamic Sectors* Close Chg.
12 mo
Chg
Science Trends
Children & Youth Advocacy Groups
NHL Teams
Quick Service Brands
Financial Services Brands
Teens and Children Trends
Online Payment Brands
Car Sharing Brands
Ground Transportation
Health & Wellness Advocacy
Online Retailers
NBA Teams
Philanthropic Foundations
NBA Players
64 -1 +620 MOST ACTIVE
MOST ACTIVE, TOP GAINERS AND TOP LOSERS
Technology Trends Sector● New High (Media Rating)
Sector
Media Rating
Prior Mo.
Change
Prior Yr.
Change
Sector
Close
Rating
Chg. % Chg.
MentionVolume
(100)
%Chg
49 +1 +2% +5 +4% Social TV 56 -4 -7% 65,435
51 +1 +2% +8 +21% Crowdfunding ● 67 +6 10% 62,417
Close % Chg. Close % Chg.
Mentions
(100)
20 TOP GAINERS 20 TOP LOSERS
Online Security ● 97 +10 11% PaaS - Platform as a Service 73 -8 -10% 150,353
Facial Recognition System ● 76 +10 15% IaaS - Information as a Service 61 -8 -12% 1,182,931
Crowdfunding ● 67 +6 10% IaaS - Infrastructure as a Service 70 -7 -9% 7,717
Multi-Touch Technology ● 65 +5 8% DOCSIS 42 -7 -14% 61
Netbooks 55 +5 10% Smartwatches 74 -5 -6% 1,203
Hacktivism ● 68 +4 6% Digital Photography-Cinematography 81 -4 -5% 192,113
OLED Technology 77 +3 4% Solid State Storage 72 -4 -5% 9,994
Crowdsourcing 67 +3 5% Social TV 56 -4 -7% 65,435
Robotic Surgery 60 +3 5% Gestural Interfaces 50 -4 -7% 401
Social Graph ● 50 +3 6% Camera Phones 88 -3 -3% 71,429
Peer-to-Peer File Sharing 48 +3 7% Open Source 88 -3 -3% 1,308,631
Solar Microgrids ● 39 +3 8% Augmented Reality 80 -3 -4% 1,394
Touch User Interface ● 92 +2 2% Driverless Cars 80 -3 -4% 795
Cloud Storage ● 83 +2 2% Multi-Core Computing 66 -3 -4% 11,503
Nanotechnology-Nanoscience ● 77 +2 3% Internet TV 84 -2 -2% 166,805
Industrial Robotics ● 75 +2 3% SaaS - Software as a Service 83 -2 -2% 2,225
E-book Readers 67 +2 3% Wearable Technology 79 -2 -2% 1,069
Light Field Photography ● 63 +2 3% 3D Film 78 -2 -3% 15,833
Flexible Screen ● 60 +2 3% Wireless Power 63 -2 -3% 4,944
Machine Translation ● 51 +2 4% DSLR 58 -2 -3% 693
*Ranked by Prior Month % Change
Science Trends
Groups
1,021
508
23,642
90,204
6,593
2,585
401
3,379
1,911
77
32,111
18,073
515
● New High (Media Rating)Mentions
(100)
517,382
3,024
62,417
30,708
477
107
1,411
RatingChg.
RatingChg.
© 2016 mediaQuant, Inc., All rights reserved. | [email protected]

……………………………………………………
License our Content
For reprint permission for this report or its data elements, please contact Mary Senatori. To order full versions of this report in online or
printed format, please visit www.mediaquant.net.

How to Read a Report……………………………………………………i,ii
Methodology……………………………………………………
98 – – Smartphones……………………………………………………3 66 ▼ - 3 Multi-Core Computing……………………………………………………103
97 ▲ + 10 Online Security……………………………………………………5 66 ▲ + 1 Quantum Computing……………………………………………………105
95 – – Streaming Content……………………………………………………7 66 ▲ + 1 3D Display……………………………………………………107
93 ▲ + 1 Big Data……………………………………………………9 65 ▲ + 5 Multi-Touch Technology……………………………………………………109
92 ▲ + 2 Touch User Interface……………………………………………………11 64 ▼ - 1 Drones……………………………………………………111
92 ▲ + 1 Internet of Things……………………………………………………13 63 ▲ + 2 Light Field Photography……………………………………………………113
92 – – Virtual Reality……………………………………………………15 63 ▼ - 2 Wireless Power……………………………………………………115
91 ▼ - 1 Tablet Computers……………………………………………………17 61 ▼ - 8 IaaS - Information as a Service……………………………………………………117
90 – – Cloud Computing……………………………………………………19 60 ▲ + 2 Flexible Screen……………………………………………………119
88 ▼ - 3 Camera Phones……………………………………………………21 60 ▲ + 3 Robotic Surgery……………………………………………………121
88 – – Online Privacy……………………………………………………23 59 – – Net Neutrality……………………………………………………123
88 ▲ + 1 Smart Home……………………………………………………25 58 ▼ - 2 DSLR……………………………………………………125
88 ▼ - 3 Open Source……………………………………………………27 58 ▼ - 2 Natural Language Processing……………………………………………………127
88 ▼ - 1 Social Networking……………………………………………………29 56 ▼ - 4 Social TV……………………………………………………129
86 – – 3D Printing……………………………………………………31 55 – – Cloud Streaming……………………………………………………131
84 ▼ - 2 Internet TV……………………………………………………33 55 ▲ + 5 Netbooks……………………………………………………133
83 ▲ + 2 Cloud Storage……………………………………………………35 51 ▲ + 2 Machine Translation……………………………………………………135
83 ▼ - 2 SaaS - Software as a Service……………………………………………………37 50 – – IPTV……………………………………………………137
82 – – Video Conferencing……………………………………………………39 50 ▼ - 4 Gestural Interfaces……………………………………………………139
81 ▼ - 4 Digital Photography-Cinematography……………………………………………………41 50 ▲ + 3 Social Graph……………………………………………………141
81 – – Biometrics……………………………………………………43 49 ▲ + 2 Biomimicry……………………………………………………143
80 ▲ + 1 Blu-Ray……………………………………………………45 48 ▲ + 1 Data Virtualization……………………………………………………145
80 ▼ - 1 GPS……………………………………………………47 48 ▲ + 3 Peer-to-Peer File Sharing……………………………………………………147
80 ▼ - 3 Augmented Reality……………………………………………………49 47 ▼ - 2 Next-Generation Memory……………………………………………………149
80 ▼ - 3 Driverless Cars……………………………………………………51 46 ▼ - 2 WiMAX……………………………………………………151
79 ▲ + 1 Speech Recognition-Voice Command Technology……………………………………………………53 46 ▼ - 2 Agricultural Robots……………………………………………………153
79 ▼ - 2 Wearable Technology……………………………………………………55 44 ▼ - 1 Semantic Search……………………………………………………155
79 ▲ + 1 Virtual Worlds……………………………………………………57 43 – – Electronic Nose……………………………………………………157
78 ▼ - 2 3D Film……………………………………………………59 42 ▼ - 7 DOCSIS……………………………………………………159
77 ▲ + 3 OLED Technology……………………………………………………61 42 ▼ - 1 Quantified Self……………………………………………………161
77 ▲ + 2 Nanotechnology-Nanoscience……………………………………………………63 41 ▲ + 1 Smart Solid-State Transformers……………………………………………………163
76 ▲ + 10 Facial Recognition System……………………………………………………65 40 ▼ - 2 Solar Roadway……………………………………………………165
75 ▲ + 2 Industrial Robotics……………………………………………………67 40 ▼ - 1 Foldable Electronics……………………………………………………167
75 ▲ + 1 Social Media Sharing……………………………………………………69 39 ▲ + 3 Solar Microgrids……………………………………………………169
74 ▼ - 5 Smartwatches……………………………………………………71 35 – – Ultra Efficient Solar……………………………………………………171
73 ▲ + 1 Smart Grids……………………………………………………73 35 ▲ + 1 Atomic Data Storage……………………………………………………173
73 ▼ - 8 PaaS - Platform as a Service……………………………………………………75 35 ▲ + 1 Spintronics……………………………………………………175
72 ▼ - 1 RFID - Radio Frequency Identification……………………………………………………77 33 ▼ - 1 Femtocells……………………………………………………177
72 ▼ - 4 Solid State Storage……………………………………………………79 33 ▲ + 1 3D Transistor……………………………………………………179
71 ▲ + 1 Near Field Communication (NFC)……………………………………………………81 33 ▲ + 1 Nantenna (Nanoantenna)……………………………………………………181
71 – – Voice Over IP……………………………………………………83 30 – – Wireless USB……………………………………………………183
70 ▼ - 7 IaaS - Infrastructure as a Service……………………………………………………85 29 ▲ + 1 Powered Exoskeleton……………………………………………………185
69 ▼ - 1 Data Visualization……………………………………………………87 28 ▼ - 1 Faster Fourier Transform……………………………………………………187
68 ▲ + 4 Hacktivism……………………………………………………89 27 ▼ - 1 BaaS (Backend as a Service)……………………………………………………189
68 ▼ - 1 Telematics……………………………………………………91 25 – – Screenless Display……………………………………………………191
67 ▲ + 6 Crowdfunding……………………………………………………93
67 ▲ + 3 Crowdsourcing……………………………………………………95
67 ▲ + 2 E-book Readers……………………………………………………97
67 – – Identity Management……………………………………………………99
67 ▲ + 1 HTML5……………………………………………………101
64 ▼ - 1 1Technology Trends192 - 193
The Technology trends category covers technologies, services, topics, and trends in the consumer and business technology market.
PageSection and Summary Metrics* Section and Summary Metrics* Page
Table of Contents

How to Read a Report
Report Layout - Each premium report includes a 2-page summary of the trend, brand or influencer reports on each sector member (e.g., Chanel). We use the
Sector Report Two-page summary showing the topline media rating and featured segment-level ratings for the sector at large, and relative rank positions for the top-15 sector members.
Sector Report Sections
Page 2
� Peer Group Growth Comparison - Who’s leading, gainrelative to their peers? This chart shows the short(12-month) topline media rating growth for each member within the quadrant a member falls in is determined by its position against theaverage, i.e., below or above the sector average for shortand long-term (vertical axis) growth respectively.
� Geographic Performance - Shows segment-level across 3 key media regions: North America, Europe and Asia Pacific. Member reports show more granular geographic signal performance.
� Key-Segment Metrics and Rankings - Here we highlight segmentratings for the sector as well as rank positions within four key media segments: Global Print, Search Volume, Social Media and Online News
movements are highlighted in green and red.
How to Read a Report page summary of the trend, brand or influencer sector (e.g., Luxury Brands),
We use the Luxury Brands sector as an example.
media rating and featured and relative rank positions
Member Reports
Supporting two-page reports detailing topline and segmentrankings, and growth dynamics for each sector member. 60+ members, with new members added each month
� Box Scores - Here's where you get a snapshot of overall media prominence for the trend, brand or influencer sector, including: - topline media rating for the month encircled in large font, - topline media rating growth metrics: prior month and year - topline media rating average metrics: trailing 12-months and year
� Editorial Highlights - Provides commentary on noteworthy over prior periods.
�
Position - Illustrates the range of topline media ratings within the weak-to-strong 100-point scale, showing the high and low member endpoints (in gold) relative to the sector average (in black).
� Historical Performance - Shows the monthly movement and aggregate growth and decline of the sector topline media rating over the prior 4 yearsfor the time-period is denoted in green and red, respectively.
�
�
Peer Group Rankings and Highs/Lows - Our Billboard™ Magazinesector members, showing current rank and movement from the prior month/year. Any member showing a significant increase or decrease in rank position green or red respectively, where “significant” is 10% or more of the total number of sector members. Next to the ranking is a snapshot of the member’s currentmedia rating within the high-low spread for the trailing 12or low for the 12-month period is highlighted in green or red, respectively.handle ties according to the standard competition "1224" ranking method.)
Member Performance Thumbnails - A condensed toplinethe top 15 sector members, a trailing 12-month performance chart, change from prior month, year and YTD averages.
Who’s leading, gaining, falling and lagging relative to their peers? This chart shows the short-term (30-day) versus long-term
growth for each member within the sector. Which quadrant a member falls in is determined by its position against the sector
average for short-term (horizontal axis) term (vertical axis) growth respectively.
level media ratings for the sector across 3 key media regions: North America, Europe and Asia Pacific. Member reports show more granular geographic signal performance.
we highlight segment-level media as well as rank positions within four key media segments: All
Online News. Significant rank
All reports
include a 2-page
sector-level
summary plus
detailed
2-page sector
member reports.
(e.g., Luxury Brands), plus 2-page detail
topline and segment-level media ratings, member. Sectors may have
bers added each month.
Here's where you get a snapshot of overall media prominence for the
for the month encircled in large font, growth metrics: prior month and year-over-year, and
months and year-to-date.
s commentary on noteworthy media rating movement
s within the sector along a point scale, showing the high and low member endpoints (in
Shows the monthly movement and aggregate growth and over the prior 4 years. All-time high and low
period is denoted in green and red, respectively.
rd™ Magazine-like ranking of members, showing current rank and movement from the prior month/year. Any
showing a significant increase or decrease in rank position is highlighted in red respectively, where “significant” is 10% or more of the total number of
the member’s current-month low spread for the trailing 12-month period. A new high
month period is highlighted in green or red, respectively. (Note we handle ties according to the standard competition "1224" ranking method.)
topline media rating summary of month performance chart, change from prior
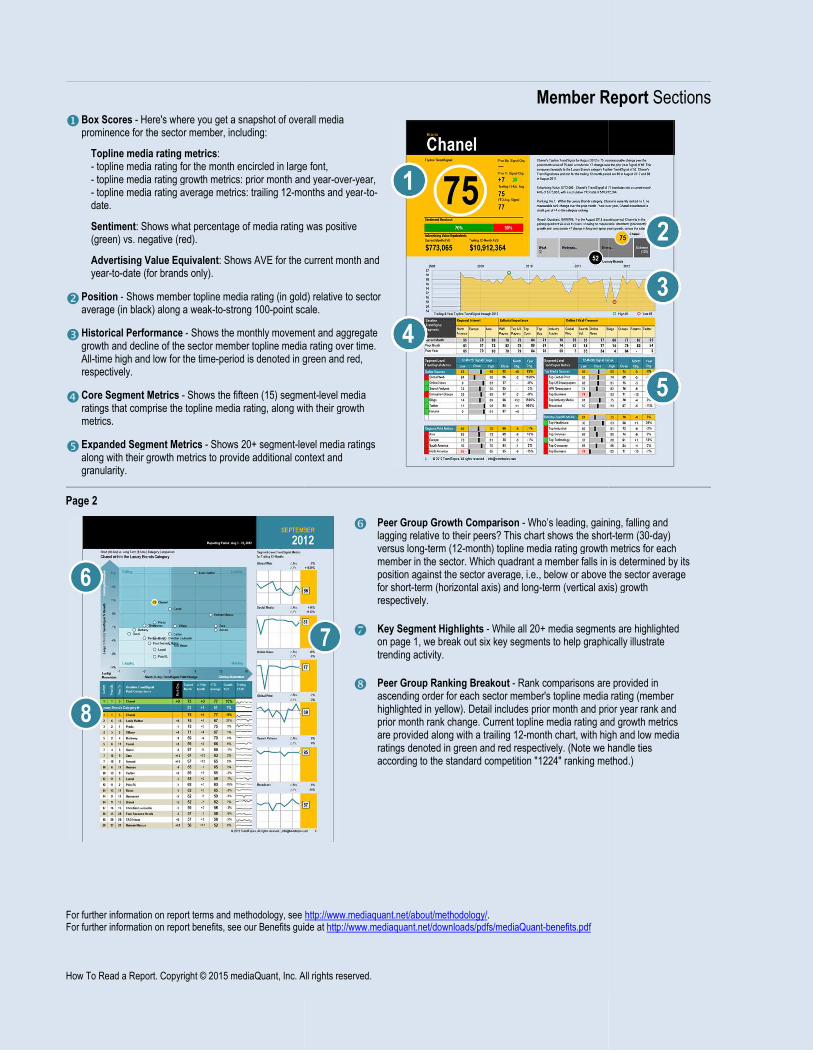
� Box Scores - Here's where you get a snapshot of overall media prominence for the sector member, including:
Topline media rating metrics: - topline media rating for the month encircled in large font,- topline media rating growth metrics: prior month and year- topline media rating average metrics: trailing 12-months and yeardate.
Sentiment: Shows what percentage of media rating (green) vs. negative (red).
Advertising Value Equivalent: Shows AVE for the current month and year-to-date (for brands only).
� Position - Shows member topline media rating (in gold) relative to average (in black) along a weak-to-strong 100-point scale.
� Historical Performance - Shows the monthly movement and aggregate growth and decline of the sector member topline media ratingAll-time high and low for the time-period is denoted in green and red, respectively.
� Core Segment Metrics - Shows the fifteen (15) segmentratings that comprise the topline media rating, along with their growth metrics.
� Expanded Segment Metrics - Shows 20+ segment-level along with their growth metrics to provide additional context and granularity.
Page 2
For further information on report terms and methodology, see For further information on report benefits, see our Benefits guide at
How To Read a Report. Copyright © 2015 mediaQuant, Inc. All rights reserved.
Member Report Here's where you get a snapshot of overall media
for the month encircled in large font, growth metrics: prior month and year-over-year,
months and year-to-
was positive
: Shows AVE for the current month and
(in gold) relative to sector point scale.
Shows the monthly movement and aggregate media rating over time.
period is denoted in green and red,
) segment-level media with their growth
level media ratings along with their growth metrics to provide additional context and
� Peer Group Growth Comparison - Who’s leading, gainlagging relative to their peers? This chart shows the shortversus long-term (12-month) topline media rating growth metrics for each member in the sector. Which quadrant a member falls in is determined by its position against the sector average, i.e., below or above the for short-term (horizontal axis) and long-term (vertical axis) growth respectively.
� Key Segment Highlights - While all 20+ media segments are highlighted on page 1, we break out six key segments to help graphically illustrate trending activity.
� Peer Group Ranking Breakout - Rank comparisons are provided in ascending order for each sector member's topline media ratinghighlighted in yellow). Detail includes prior month and prior year rank and prior month rank change. Current topline media rating and growth metrics are provided along with a trailing 12-month chart, with high and low ratings denoted in green and red respectively. (Note we handle ties according to the standard competition "1224" ranking method.)
For further information on report terms and methodology, see http://www.mediaquant.net/about/methodology/. For further information on report benefits, see our Benefits guide at http://www.mediaquant.net/downloads/pdfs/mediaQuant-benefits.pdf
. All rights reserved.
Member Report Sections
ing, falling and lagging relative to their peers? This chart shows the short-term (30-day)
growth metrics for each . Which quadrant a member falls in is determined by its
average, i.e., below or above the sector average term (vertical axis) growth
0+ media segments are highlighted segments to help graphically illustrate
Rank comparisons are provided in media rating (member
highlighted in yellow). Detail includes prior month and prior year rank and and growth metrics
month chart, with high and low media (Note we handle ties
according to the standard competition "1224" ranking method.)
Trends
Technology Trends Trends
Prior Mo. Pt. Chg.
Prior Yr. Pt. Chg.
Trailing 12-Mo Avg
YTD Avg. Rating
Technology Trends- 1
+ 6
64
6464
�
����
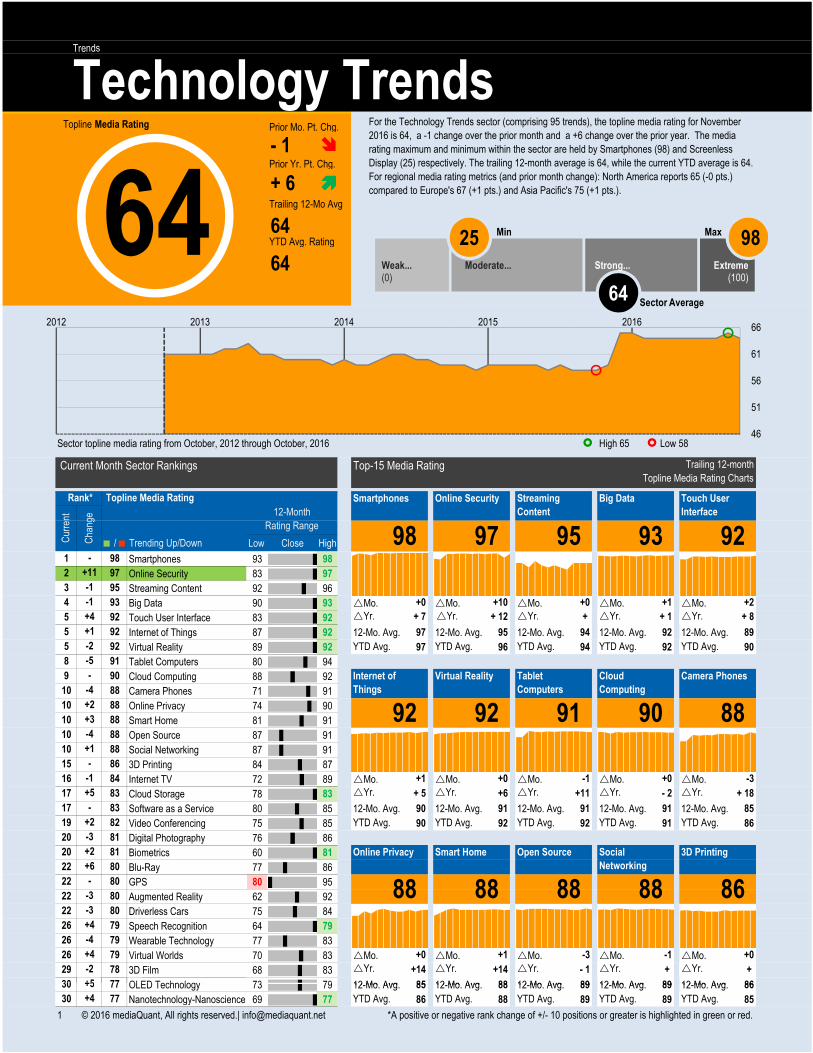
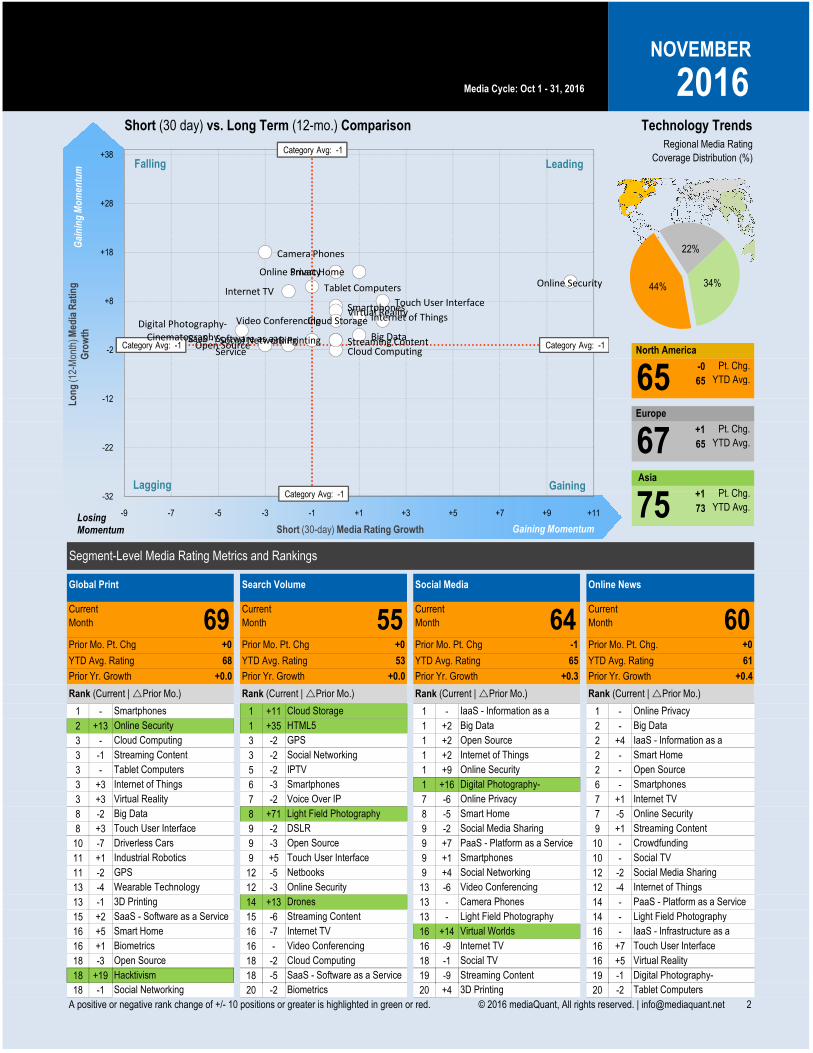
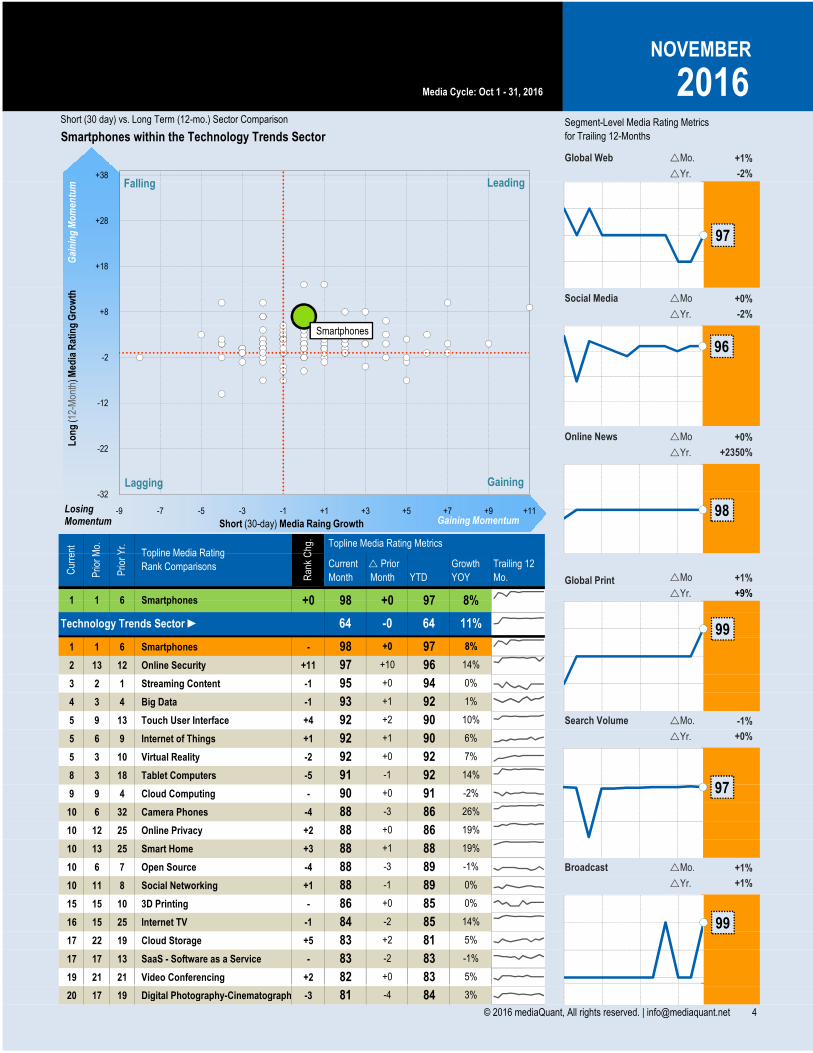
For the Technology Trends sector (comprising 95 trends), the topline media rating for November
2016 is 64, a -1 change over the prior month and a +6 change over the prior year. The media
rating maximum and minimum within the sector are held by Smartphones (98) and Screenless
Display (25) respectively. The trailing 12-month average is 64, while the current YTD average is 64.
For regional media rating metrics (and prior month change): North America reports 65 (-0 pts.)
compared to Europe's 67 (+1 pts.) and Asia Pacific's 75 (+1 pts.).
Topline Media Rating
Sector topline media rating from October, 2012 through October, 2016
Smartphones Online Security Streaming
�
Trailing 12-month
Topline Media Rating Charts
Touch User Big Data
� Low 58
Current Month Sector Rankings
Rank* Topline Media Rating
Top-15 Media Rating
High 6546
51
56
61
662012 2013 2014 2015 2016
25
Sector Average64
MaxMin 98 Extreme
(100)Weak...(0)
Moderate... Strong...
Low Close High
Smartphones 93 98
Online Security 83 97
Streaming Content 92 96
Big Data 90 93 �Mo. �Mo. �Mo. �Mo. �Mo.
Touch User Interface 83 92
Internet of Things 87 92 12-Mo. Avg. 97 12-Mo. Avg. 95 12-Mo. Avg. 94 12-Mo. Avg. 92 12-Mo. Avg. 89
Virtual Reality 89 92 97 96 94 92 90
Tablet Computers 80 94
Cloud Computing 88 92
Camera Phones 71 91
Online Privacy 74 90
Smart Home 81 91
Open Source 87 91
Social Networking 87 91
3D Printing 84 87
Internet TV 72 89 �Mo. �Mo. �Mo. �Mo. �Mo.
Cloud Storage 78 83
Software as a Service 80 85 12-Mo. Avg. 90 12-Mo. Avg. 91 12-Mo. Avg. 91 12-Mo. Avg. 91 12-Mo. Avg. 85
Video Conferencing 75 85 90 92 92 91 86
Digital Photography 76 86
Biometrics 60 81
Blu-Ray 77 86
GPS 80 95
Augmented Reality 62 92
Driverless Cars 75 84
Speech Recognition 64 79
Wearable Technology 77 83
Virtual Worlds 70 83 �Mo. �Mo. �Mo. �Mo. �Mo.
3D Film 68 83
OLED Technology 73 79 12-Mo. Avg. 85 12-Mo. Avg. 88 12-Mo. Avg. 89 12-Mo. Avg. 89 12-Mo. Avg. 86
Cur
rent
Cha
nge
Smartphones Online Security Streaming
Content
1 98
Touch User
Interface
93 92
Big Data Rank* Topline Media Rating
3
97
92
+0
91 90
+11
17
+ 18
10
YTD Avg.YTD Avg.
26 +4
30 +5 77
29
88
�Yr. �Yr. �Yr.
-3
�Yr.�Yr.
+1
-1
+6
+14
Smart Home
+ 5�Yr.
+14
+1
Open Source Social
Networking
3D Printing
88 88 86
�Yr.+ +
-3
- 1 �Yr.
+0-1
10
YTD Avg.
9 - 90 Internet of
Things
8 -5 91
82
17 +5 83
95 98
Virtual Reality
92
-4 88
5
-1 95
�Yr.
+1 92
83
19 +2
-
2
Cloud
Computing
-4 88
+3
+2 88
88 92
+0
+1 88
- 86
+2
Camera PhonesTablet
Computers
�Yr.
+1
YTD Avg.
80
+0
+2
+0
�Yr.
+ 1 + 8
YTD Avg.
�Yr.
YTD Avg. YTD Avg.
81
YTD Avg.
+ 7
+0
+ 12 �Yr. +
+11
+10
5
4
+4 92
97
-
�Yr.
-1
�Yr.
12-Month
Rating Range
93
78-2
5 -2
16
10
10
-3
84
-3 80
22
-4
20 81
22 - 80
-3
10
15
-1
■ / ■ Trending Up/Down
88
Online Privacy
22 +6 80
YTD Avg.
- 2
20
79
88
YTD Avg.
26 +4 79
26 79
22
OLED Technology 73 79 12-Mo. Avg. 85 12-Mo. Avg. 88 12-Mo. Avg. 89 12-Mo. Avg. 89 12-Mo. Avg. 86
Nanotechnology-Nanoscience 69 77 86 88 89 89 85+4 YTD Avg.30 77
30 +5 77
YTD Avg.YTD Avg. YTD Avg. YTD Avg.
1 © 2016 mediaQuant, All rights reserved.| [email protected] *A positive or negative rank change of +/- 10 positions or greater is highlighted in green or red.
North America
-0
65
+1
65
+1
Regional Media Rating
Coverage Distribution (%)
2016NOVEMBER
75
67
65 Europe
Asia
Pt. Chg.
YTD Avg.
Pt. Chg.
YTD Avg.
Pt. Chg.
Media Cycle: Oct 1 - 31, 2016
Technology Trends Short (30 day) vs. Long Term (12-mo.) Comparison
44%
22%
34%
Gai
nin
g M
om
entu
mL
on
g (1
2-M
onth
)Med
ia R
atin
g
Gro
wth
Smartphones
Online Security
Streaming ContentBig Data
Touch User Interface
Internet of ThingsVirtual Reality
Tablet Computers
Cloud Computing
Camera Phones
Category Avg: -1
Category Avg: -1
Category Avg: -1 Category Avg: -1
Online PrivacySmart Home
Open SourceSocial Networking3D Printing
Internet TV
Cloud Storage
SaaS - Software as a
Service
Video ConferencingDigital Photography-
Cinematography
-32
-22
-12
-2
+8
+18
+28
+38LeadingFalling
Lagging Gaining+1
73
1 - 1 +11 1 - 1 -
2 +13 1 +35 1 +2 2 -
3 - 3 -2 1 +2 2 +4
3 -1 3 -2 1 +2 2 -
3 - 5 -2 1 +9 2 -
3 +3 6 -3 1 +16 6 -
3 +3 7 -2 7 -6 7 +1
8 -2 8 +71 8 -5 7 -5
8 +3 9 -2 9 -2 9 +1
10 -7 9 -3 9 +7 10 -
11 +1 9 +5 9 +1 10 -
11 -2 12 -5 9 +4 12 -2
13 -4 12 -3 13 -6 12 -4
13 -1 14 +13 13 - 14 -
15 +2 15 -6 13 - 14 -
16 +5 16 -7 16 +14 16 -
16 +1 16 - 16 -9 16 +7
18 -3 18 -2 18 -1 16 +5
18 +19 18 -5 19 -9 19 -1
18 -1 20 -2 20 +4 20 -2
Streaming Content
Prior Yr. Growth
Social Networking Biometrics 3D Printing Tablet Computers
SaaS - Software as a Service Streaming Content Light Field Photography Light Field Photography
Smart Home Internet TV Virtual Worlds IaaS - Infrastructure as a
Biometrics Video Conferencing Internet TV Touch User Interface
Open Source Cloud Computing Social TV Virtual Reality
Hacktivism SaaS - Software as a Service
3D Printing
Driverless Cars
Internet TV
+0.3
Digital Photography-
+0
Tablet Computers IPTV Online Security Open Source
Internet of Things Smart Home
Rank (Current | �Prior Mo.) Rank (Current | �Prior Mo.)Rank (Current | �Prior Mo.) Rank (Current | �Prior Mo.)
YTD Avg. Rating 53
Online News
Prior Yr. Growth +0.0 Prior Yr. Growth +0.0 Prior Yr. Growth
YTD Avg. Rating
HTML5 Big Data Big Data
Smartphones Cloud Storage IaaS - Information as a
60
+0.4
Current
Month
-1 Prior Mo. Pt. Chg.
65 YTD Avg. Rating 61
Industrial Robotics
GPS
Wearable Technology
Big Data Light Field Photography Smart Home
Global Print Search Volume Social Media
Video Conferencing
Current
Month69Current
Month 55 64
YTD Avg. Rating
Current
Month
Prior Mo. Pt. Chg. +0 Prior Mo. Pt. Chg. +0 Prior Mo. Pt. Chg.
68
Camera Phones
Crowdfunding
Social TVTouch User Interface
Netbooks
Online Security
Drones
Smartphones
Social Media Sharing
Open Source PaaS - Platform as a Service
Internet of Things
PaaS - Platform as a Service
Social Networking
Touch User Interface DSLR Social Media Sharing Streaming Content
Virtual Reality Voice Over IP Online Privacy
Online Privacy
Online Security
Smartphones
Online Security
Smartphones Digital Photography-
Cloud Computing GPS Open Source
Internet of Things
Social NetworkingStreaming Content
Segment-Level Media Rating Metrics and Rankings
75Pt. Chg.
YTD Avg.
IaaS - Information as a
Gaining MomentumShort (30-day) Media Rating GrowthLosingMomentum
Category Avg: -1-32
-9 -7 -5 -3 -1 +1 +3 +5 +7 +9 +11
Gaining
18 -1 20 -2 20 +4 20 -2Social Networking Biometrics 3D Printing Tablet Computers
© 2016 mediaQuant, All rights reserved. | [email protected] 2A positive or negative rank change of +/- 10 positions or greater is highlighted in green or red.
Sentiment Breakout
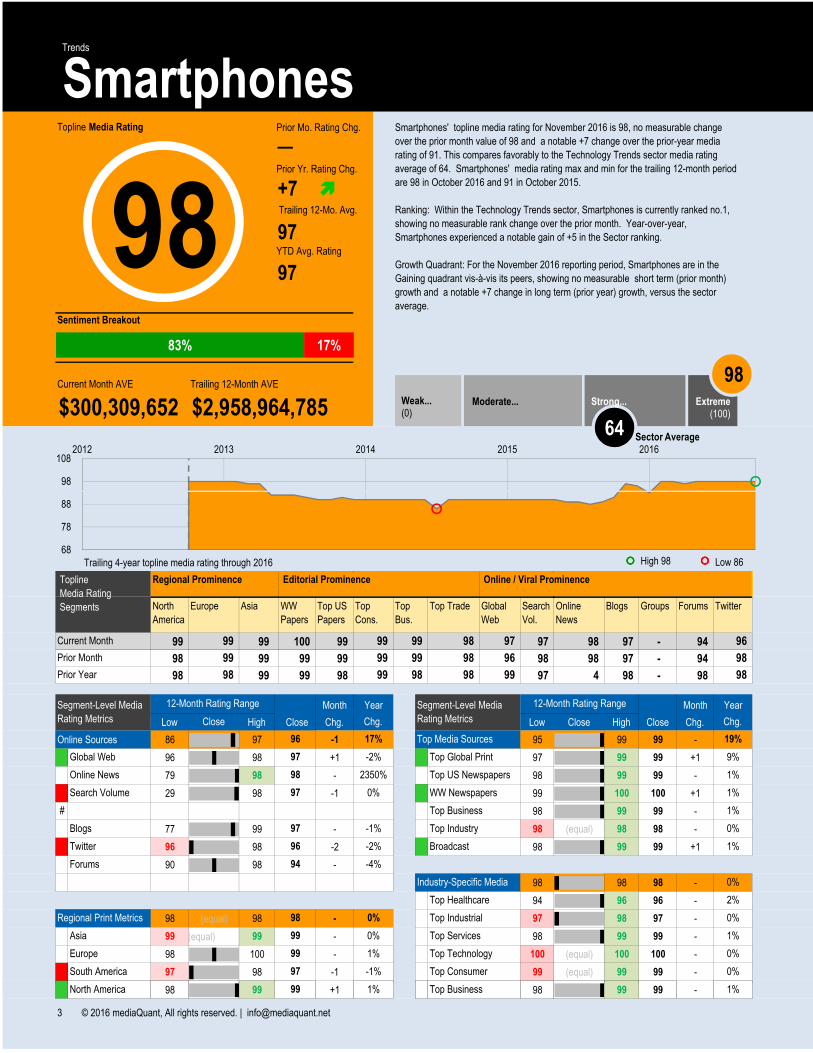
Smartphones' topline media rating for November 2016 is 98, no measurable change
over the prior month value of 98 and a notable +7 change over the prior-year media
rating of 91. This compares favorably to the Technology Trends sector media rating
average of 64. Smartphones' media rating max and min for the trailing 12-month period
are 98 in October 2016 and 91 in October 2015.
Ranking: Within the Technology Trends sector, Smartphones is currently ranked no.1,
showing no measurable rank change over the prior month. Year-over-year,
Smartphones experienced a notable gain of +5 in the Sector ranking.
Growth Quadrant: For the November 2016 reporting period, Smartphones are in the
Gaining quadrant vis-à-vis its peers, showing no measurable short term (prior month)
growth and a notable +7 change in long term (prior year) growth, versus the sector
average.
─
97
97YTD Avg. Rating
Trailing 12-Mo. Avg.
Prior Mo. Rating Chg.
Smartphones Trends
�
$300,309,652 $2,958,964,785Current Month AVE
Prior Yr. Rating Chg.
Trailing 12-Month AVE
Topline Media Rating
98+7 �
98
1082012 2013 2014 2015 2016
83% 17%
98
Sector Average64
Extreme(100)
Weak...(0)
Moderate... Strong...
Trailing 4-year topline media rating through 2016 ���� High 98 ����
99 99 100 99 97 98 97 - 94
98 99 99 99 98 98 97 - 94
98 99 99 98 97 4 98 - 98
Month Month
Low High Close Chg. Low Close High Close Chg.
Online Sources 86 97 -1 95 99 99 -
96 98 +1 # 97 99 99 +1
79 98 - - 98 99 99 -
29 98 -1 # 99 100 100 +1
- 98 99 99 -
77 99 - - 98 (equal) 98 98 -
96 98 -2 # 98 99 99 +1
90 98 -
98 (equal) 98 98 -
- 94 96 96 -
98 98 - - 97 98 97 -
99 (equal) 99 - - 98 99 99 -
98 100 - - 100 (equal) 100 100 -
97 98 -1 - 99 (equal) 99 99 -
98 99 +1 - 98 99 99 -
Low 86
99 99
98
Prior Month
Prior Year
Editorial ProminenceRegional Prominence Online / Viral Prominence
96
98
98
Top US
Papers
Search
Vol.
Top
Cons.
Topline
Media Rating
Segments
Global Web
Forums
9%
GroupsTop TradeWW
Papers
Top
Bus.
Global
Web
BlogsOnline
News
AsiaNorth
America
Europe
99 98
99 98 96
98
99 99
97
98 99
99 Current Month
#
-
#
Online News
-1%
2350%
97 0%
99-
-
#
#
99
12-Month Rating Range
Asia
Forums
Regional Print Metrics
#
-
Europe
- Blogs
Search Volume
#
1%
0%
Top Business
Top Consumer
North America 99
-1%
1%
97South America
Segment-Level Media
Rating Metrics
YearYear 12-Month Rating RangeSegment-Level Media
Rating Metrics
1%
1%98
Close Chg.
Top Business
96
Chg.
17% Top Media Sources
Top Global Print
Top US Newspapers
WW Newspapers
97 -2%
19%
0%
1%
Top Healthcare
Top Industrial
Top Services
0%
2%
Top Technology 0%
1%
(equal)
97
96
94
1%
98 0%
0%
-4%
Top Industry
-2%
0%
1%
Industry-Specific Media
Broadcast
68
78
88
98 99 +1 - 98 99 99 -# 1%Top Business
3 © 2016 mediaQuant, All rights reserved. | [email protected]
North America 99 1%
�Yr.
�Mo
-2%
+0%
Short (30 day) vs. Long Term (12-mo.) Sector Comparison
Social Media
Global Web
NOVEMBER
2016
�Yr. +2350%
�Yr. -2%
�Mo +0%
�Mo. +1%
Online News
Smartphones within the Technology Trends SectorSegment-Level Media Rating Metrics
for Trailing 12-Months
Media Cycle: Oct 1 - 31, 2016
97
96
Gai
nin
g M
om
entu
mL
on
g (1
2-M
onth
)Med
ia R
atin
g G
row
th
Smartphones
-32
-22
-12
-2
+8
+18
+28
+38LeadingFalling
Lagging Gaining
1 1 6 Smartphones -
2 13 12 Online Security +11
3 2 1 Streaming Content -1
4 3 4 Big Data -1
5 9 13 Touch User Interface +4
5 6 9 Internet of Things +1
5 3 10 Virtual Reality -2
8 3 18 Tablet Computers -5
9 9 4 Cloud Computing -
10 6 32 Camera Phones -4
10 12 25 Online Privacy +2
10 13 25 Smart Home +3
10 6 7 Open Source -4
10 11 8 Social Networking +1
15 15 10 3D Printing -
16 15 25 Internet TV -1
17 22 19 Cloud Storage +5
17 17 13 SaaS - Software as a Service -
19 21 21 Video Conferencing +2
1 98
98
11%
+0
Smartphones +01 6
Cur
rent
+0
Current
Month
� Prior
Month YTD Global Print
10%
94 0%
96 14%
97
0%
83
5%
+1%
-1%
+0%
r Yr.
8%97
Prio
r M
o.
Prio
r Y
r.
Ran
k C
hg.
Technology Trends Sector ►
Topline Media Rating
Rank Comparisons
-283
84 -2 85
�Mo.
�Yr.90
0%
26%-3 86
�Mo.
-2%
14%
-1%
92
82 +0 83 5%
+1%
�Yr.
8%
-1%
1%
6%
7%
14%
19%
19%
92
88
86 85
83 +2 81
91 -1 92
+0
89-1
-3 89
+1 88
+0 86
+0
88
91
88
�Mo +1%
�Yr. +9%
92 Search Volume
Broadcast
+2 90
90
88
+1 92
+1
92 +0
93
88
Growth
YOY
Trailing 12
Mo.
Topline Media Rating Metrics
95
64 -0 64
+0
97 +10
98
99
97
99
Gaining MomentumLosingMomentum Short (30-day) Media Raing Growth
-32
-9 -7 -5 -3 -1 +1 +3 +5 +7 +9 +11
19 21 21 Video Conferencing +2
20 17 19 Digital Photography-Cinematography -3 84 3%-481
82 83
© 2016 mediaQuant, All rights reserved. | [email protected] 4

Sentiment Breakout
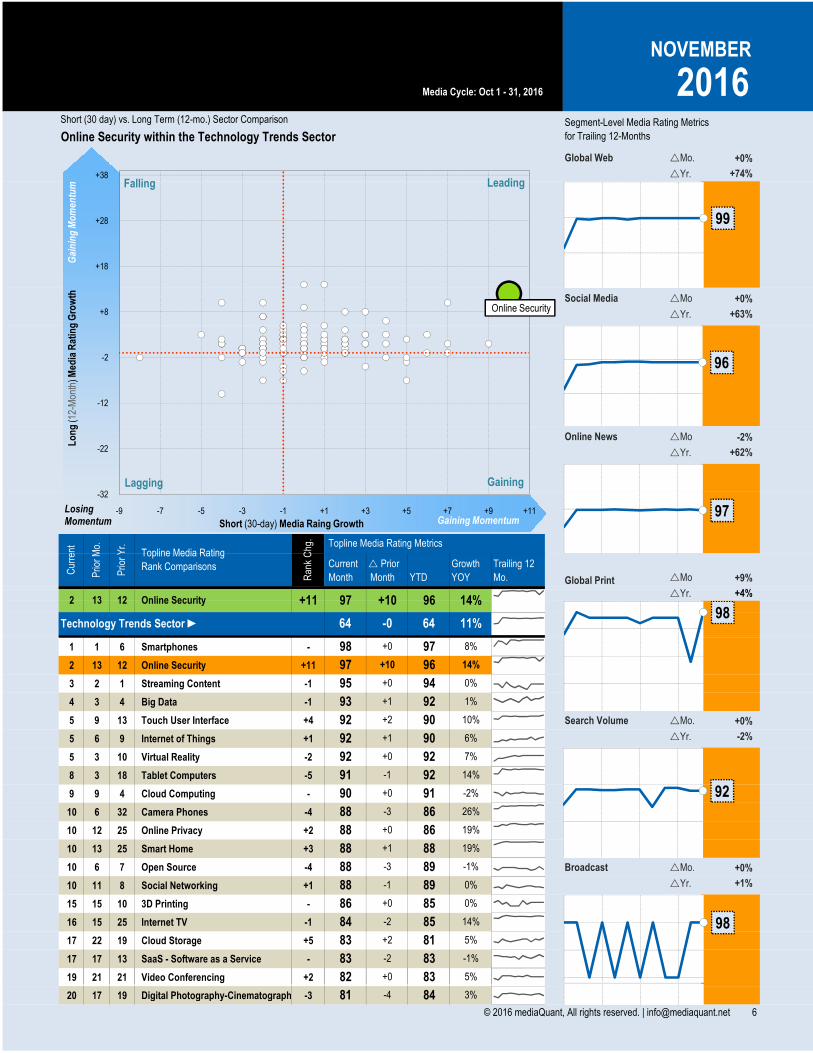
Online Security's topline media rating for November 2016 is 97, a large +10 change over
the prior month value of 87 and a large +12 change over the prior-year media rating of
85. This compares favorably to the Technology Trends sector media rating average of
64. Online Security's media rating max and min for the trailing 12-month period are 97 in
January 2016 and 83 in November 2015.
Ranking: Within the Technology Trends sector, Online Security is currently ranked no.2,
showing a large +11 rank change over the prior month. Year-over-year, Online Security
experienced a large gain of +10 in the Sector ranking.
Growth Quadrant: For the November 2016 reporting period, Online Security is in the
Leading quadrant vis-à-vis its peers, showing a large +10 change in short term (prior
month) growth and a large +12 change in long term (prior year) growth, versus the
sector average.
+10
95
96
YTD Avg. Rating
Trailing 12-Mo. Avg.
Prior Mo. Rating Chg.
Online Security Trends
�
$179,172,038 $3,863,322,159Current Month AVE
Prior Yr. Rating Chg.
Trailing 12-Month AVE
Topline Media Rating
97+12 �
93
1032012 2013 2014 2015 2016
90% 10%
97
Sector Average64
Online Security
Extreme(100)
Weak...(0)
Moderate... Strong...
Trailing 4-year topline media rating through 2016 ���� High 97 ����
98 98 98 97 92 97 99 - 98
99 31 99 97 92 99 98 - 98
98 98 97 96 94 60 63 - 55
Month Month
Low High Close Chg. Low Close High Close Chg.
Online Sources 60 97 - 88 97 97 +9
57 99 - # 89 98 98 +9
60 99 -2 - 93 97 97 -
70 96 - # 96 99 98 -1
# 36 98 98 +62
64 99 +1 # 88 98 98 +10
60 94 - - 97 98 98 -
44 99 -
88 98 98 +10
# 89 98 96 -2
82 98 +16 # 96 98 97 -1
31 98 +67 - 98 99 99 -
97 99 -1 # 99 100 99 -1
93 97 - # 95 98 96 -2
98 99 -1 # 36 98 98 +62
Low 79
98 96
97
Prior Month
Prior Year
Editorial ProminenceRegional Prominence Online / Viral Prominence
92
60
92
Top US
Papers
Search
Vol.
Top
Cons.
Topline
Media Rating
Segments
Global Web
Forums
4%
GroupsTop TradeWW
Papers
Top
Bus.
Global
Web
BlogsOnline
News
AsiaNorth
America
Europe
97 97
36 88 99
98
99 98
99
97 57
98 Current Month
#
#
-
Online News
57%
62%
92 -2%
98#
#
-
#
98
12-Month Rating Range
Asia
Forums
Regional Print Metrics
-
-
Europe
# Blogs
Search Volume
-
1%
-1%
Top Business
Top Consumer
North America 98
2%
0%
97South America
Segment-Level Media
Rating Metrics
YearYear 12-Month Rating RangeSegment-Level Media
Rating Metrics
1%
1%97
Close Chg.
Top Business
96
Chg.
48% Top Media Sources
Top Global Print
Top US Newspapers
WW Newspapers
99 74%
7%
0%
1%
Top Healthcare
Top Industrial
Top Services
0%
3%
Top Technology 0%
1%
99
92
98
1%
98 1%
1%
78%
Top Industry
53%
1%
1%
Industry-Specific Media
Broadcast
63
73
83
98 99 -1 # 36 98 98 +62# 1%Top Business
5 © 2016 mediaQuant, All rights reserved. | [email protected]
North America 98 0%
�Yr.
�Mo
+74%
+0%
Short (30 day) vs. Long Term (12-mo.) Sector Comparison
Social Media
Global Web
NOVEMBER
2016
�Yr. +62%
�Yr. +63%
�Mo -2%
�Mo. +0%
Online News
Online Security within the Technology Trends SectorSegment-Level Media Rating Metrics
for Trailing 12-Months
Media Cycle: Oct 1 - 31, 2016
99
96
Gai
nin
g M
om
entu
mL
on
g (1
2-M
onth
)Med
ia R
atin
g G
row
th
Online Security
-32
-22
-12
-2
+8
+18
+28
+38LeadingFalling
Lagging Gaining
1 1 6 Smartphones -
2 13 12 Online Security +11
3 2 1 Streaming Content -1
4 3 4 Big Data -1
5 9 13 Touch User Interface +4
5 6 9 Internet of Things +1
5 3 10 Virtual Reality -2
8 3 18 Tablet Computers -5
9 9 4 Cloud Computing -
10 6 32 Camera Phones -4
10 12 25 Online Privacy +2
10 13 25 Smart Home +3
10 6 7 Open Source -4
10 11 8 Social Networking +1
15 15 10 3D Printing -
16 15 25 Internet TV -1
17 22 19 Cloud Storage +5
17 17 13 SaaS - Software as a Service -
19 21 21 Video Conferencing +2
2 97
98
11%
+0
Online Security +1113 12
Cur
rent
+10
Current
Month
� Prior
Month YTD Global Print
10%
94 0%
96 14%
97
0%
83
5%
+1%
+0%
-2%
r Yr.
14%96
Prio
r M
o.
Prio
r Y
r.
Ran
k C
hg.
Technology Trends Sector ►
Topline Media Rating
Rank Comparisons
-283
84 -2 85
�Mo.
�Yr.90
0%
26%-3 86
�Mo.
-2%
14%
-1%
92
82 +0 83 5%
+0%
�Yr.
8%
-1%
1%
6%
7%
14%
19%
19%
92
88
86 85
83 +2 81
91 -1 92
+0
89-1
-3 89
+1 88
+0 86
+0
88
91
88
�Mo +9%
�Yr. +4%
92 Search Volume
Broadcast
+2 90
90
88
+1 92
+1
92 +0
93
88
Growth
YOY
Trailing 12
Mo.
Topline Media Rating Metrics
95
64 -0 64
+0
97 +10
97
98
92
98
Gaining MomentumLosingMomentum Short (30-day) Media Raing Growth
-32
-9 -7 -5 -3 -1 +1 +3 +5 +7 +9 +11
19 21 21 Video Conferencing +2
20 17 19 Digital Photography-Cinematography -3 84 3%-481
82 83
© 2016 mediaQuant, All rights reserved. | [email protected] 6
Sentiment Breakout
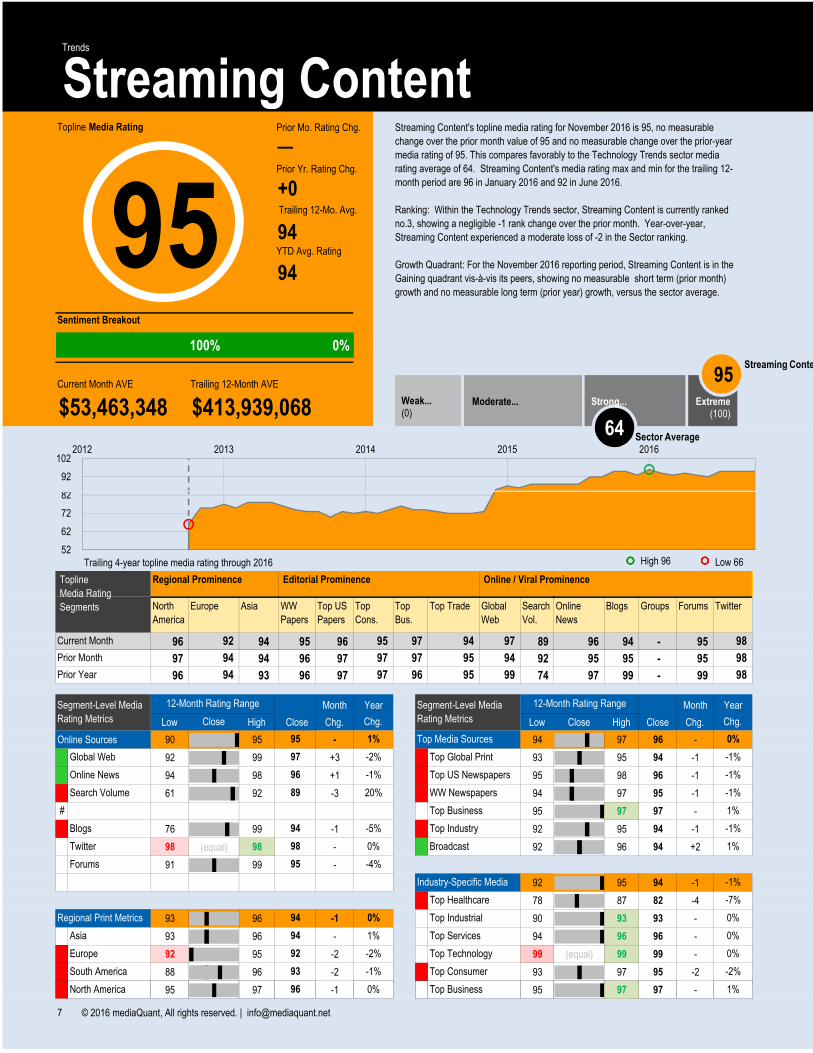
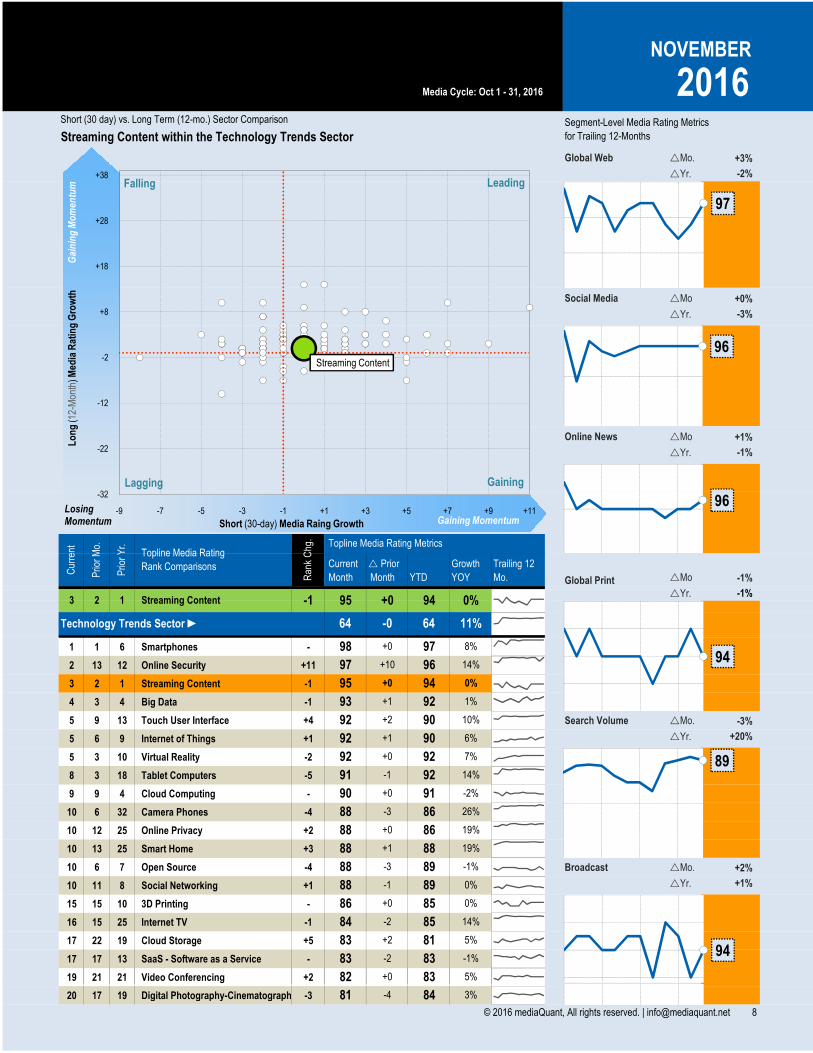
Streaming Content's topline media rating for November 2016 is 95, no measurable
change over the prior month value of 95 and no measurable change over the prior-year
media rating of 95. This compares favorably to the Technology Trends sector media
rating average of 64. Streaming Content's media rating max and min for the trailing 12-
month period are 96 in January 2016 and 92 in June 2016.
Ranking: Within the Technology Trends sector, Streaming Content is currently ranked
no.3, showing a negligible -1 rank change over the prior month. Year-over-year,
Streaming Content experienced a moderate loss of -2 in the Sector ranking.
Growth Quadrant: For the November 2016 reporting period, Streaming Content is in the
Gaining quadrant vis-à-vis its peers, showing no measurable short term (prior month)
growth and no measurable long term (prior year) growth, versus the sector average.
─
94
94YTD Avg. Rating
Trailing 12-Mo. Avg.
Prior Mo. Rating Chg.
Streaming Content Trends
�
$53,463,348 $413,939,068Current Month AVE
Prior Yr. Rating Chg.
Trailing 12-Month AVE
Topline Media Rating
95+0 �
82
92
1022012 2013 2014 2015 2016
100% 0%
95
Sector Average64
Streaming Content
Extreme(100)
Weak...(0)
Moderate... Strong...
Trailing 4-year topline media rating through 2016 ���� High 96 ����
96 94 95 96 89 96 94 - 95
97 94 96 97 92 95 95 - 95
96 93 96 97 74 97 99 - 99
Month Month
Low High Close Chg. Low Close High Close Chg.
Online Sources 90 95 - 94 97 96 -
92 99 +3 # 93 95 94 -1
94 98 +1 # 95 98 96 -1
61 92 -3 # 94 97 95 -1
- 95 97 97 -
76 99 -1 # 92 95 94 -1
98 98 - # 92 96 94 +2
91 99 -
92 95 94 -1
# 78 87 82 -4
93 96 -1 - 90 93 93 -
93 96 - - 94 96 96 -
92 95 -2 - 99 (equal) 99 99 -
88 96 -2 # 93 97 95 -2
95 97 -1 - 95 97 97 -
Low 66
92 95
94
Prior Month
Prior Year
Editorial ProminenceRegional Prominence Online / Viral Prominence
98
98
98
Top US
Papers
Search
Vol.
Top
Cons.
Topline
Media Rating
Segments
Global Web
Forums
-1%
GroupsTop TradeWW
Papers
Top
Bus.
Global
Web
BlogsOnline
News
AsiaNorth
America
Europe
97 96
97 95 94
94
94 97
97
95 99
97 Current Month
#
#
#
Online News
-5%
-1%
89 20%
94-
#
#
#
(equal)
92
12-Month Rating Range
Asia
Forums
Regional Print Metrics
-
-
Europe
# Blogs
Search Volume
#
1%
-2%
Top Business
Top Consumer
North America 96
-1%
0%
93South America
Segment-Level Media
Rating Metrics
YearYear 12-Month Rating RangeSegment-Level Media
Rating Metrics
-1%
-1%96
Close Chg.
Top Business
95
Chg.
1% Top Media Sources
Top Global Print
Top US Newspapers
WW Newspapers
97 -2%
0%
1%
-2%
Top Healthcare
Top Industrial
Top Services
0%
-7%
Top Technology 0%
0%
94
98
95
1%
94 0%
-1%
-4%
Top Industry
0%
-1%
1%
Industry-Specific Media
Broadcast
52
62
72
82
95 97 -1 - 95 97 97 -# 1%Top Business
7 © 2016 mediaQuant, All rights reserved. | [email protected]
North America 96 0%
�Yr.
�Mo
-2%
+0%
Short (30 day) vs. Long Term (12-mo.) Sector Comparison
Social Media
Global Web
NOVEMBER
2016
�Yr. -1%
�Yr. -3%
�Mo +1%
�Mo. +3%
Online News
Streaming Content within the Technology Trends SectorSegment-Level Media Rating Metrics
for Trailing 12-Months
Media Cycle: Oct 1 - 31, 2016
97
96
96
Gai
nin
g M
om
entu
mL
on
g (1
2-M
onth
)Med
ia R
atin
g G
row
th
Streaming Content
-32
-22
-12
-2
+8
+18
+28
+38LeadingFalling
Lagging Gaining
1 1 6 Smartphones -
2 13 12 Online Security +11
3 2 1 Streaming Content -1
4 3 4 Big Data -1
5 9 13 Touch User Interface +4
5 6 9 Internet of Things +1
5 3 10 Virtual Reality -2
8 3 18 Tablet Computers -5
9 9 4 Cloud Computing -
10 6 32 Camera Phones -4
10 12 25 Online Privacy +2
10 13 25 Smart Home +3
10 6 7 Open Source -4
10 11 8 Social Networking +1
15 15 10 3D Printing -
16 15 25 Internet TV -1
17 22 19 Cloud Storage +5
17 17 13 SaaS - Software as a Service -
19 21 21 Video Conferencing +2
3 95
98
11%
+0
Streaming Content -12 1
Cur
rent
+0
Current
Month
� Prior
Month YTD Global Print
10%
94 0%
96 14%
97
0%
83
5%
+1%
-3%
+20%
r Yr.
0%94
Prio
r M
o.
Prio
r Y
r.
Ran
k C
hg.
Technology Trends Sector ►
Topline Media Rating
Rank Comparisons
-283
84 -2 85
�Mo.
�Yr.90
0%
26%-3 86
�Mo.
-2%
14%
-1%
92
82 +0 83 5%
+2%
�Yr.
8%
-1%
1%
6%
7%
14%
19%
19%
92
88
86 85
83 +2 81
91 -1 92
+0
89-1
-3 89
+1 88
+0 86
+0
88
91
88
�Mo -1%
�Yr. -1%
92 Search Volume
Broadcast
+2 90
90
88
+1 92
+1
92 +0
93
88
Growth
YOY
Trailing 12
Mo.
Topline Media Rating Metrics
95
64 -0 64
+0
97 +10
96
94
89
94
Gaining MomentumLosingMomentum Short (30-day) Media Raing Growth
-32
-9 -7 -5 -3 -1 +1 +3 +5 +7 +9 +11
19 21 21 Video Conferencing +2
20 17 19 Digital Photography-Cinematography -3 84 3%-481
82 83
© 2016 mediaQuant, All rights reserved. | [email protected] 8

Sentiment Breakout
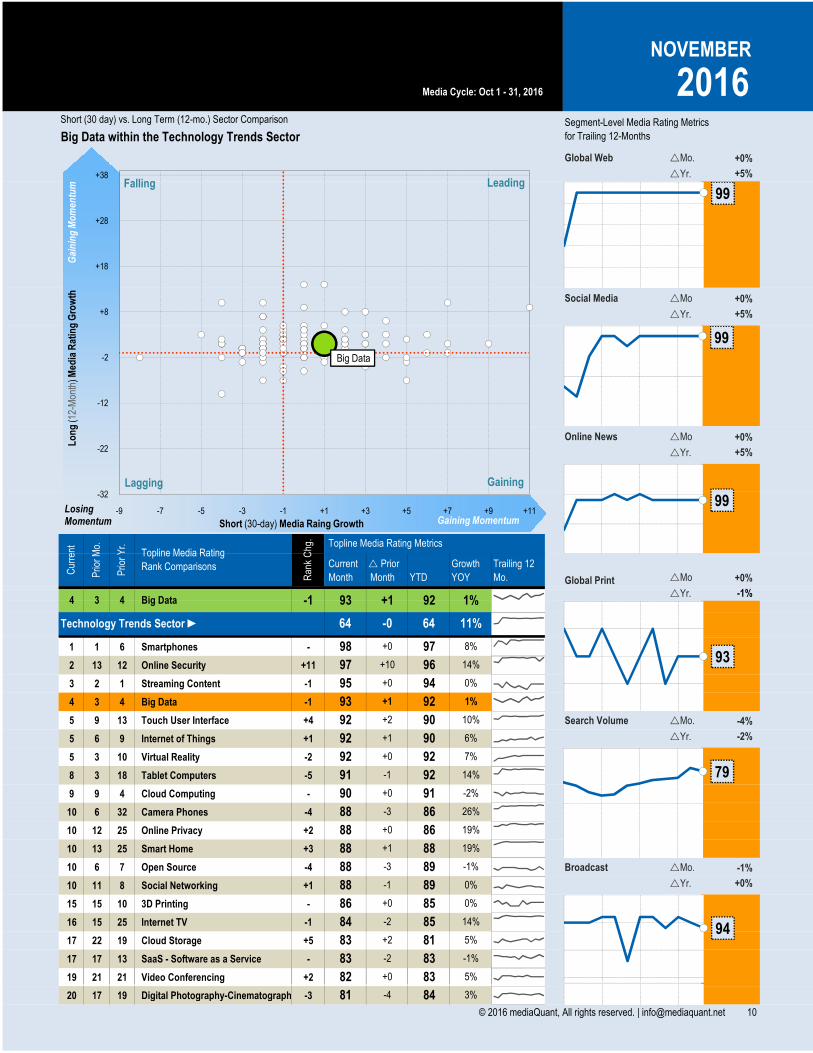
Big Data's topline media rating for November 2016 is 93, a +1 change over the prior
month value of 92 and a +1 change over the prior-year media rating of 92. This
compares favorably to the Technology Trends sector media rating average of 64. Big
Data's media rating max and min for the trailing 12-month period are 93 in September
2016 and 90 in July 2016.
Ranking: Within the Technology Trends sector, Big Data is currently ranked no.4,
showing a negligible -1 rank change over the prior month. Year-over-year, Big Data
experienced no change in the Sector ranking.
Growth Quadrant: For the November 2016 reporting period, Big Data is in the Gaining
quadrant vis-à-vis its peers, showing a +1 change in short term (prior month) growth
and a +1 change in long term (prior year) growth, versus the sector average.
+1
92
92YTD Avg. Rating
Trailing 12-Mo. Avg.
Prior Mo. Rating Chg.
Big Data Trends
�
$635,290,697 $6,075,192,406Current Month AVE
Prior Yr. Rating Chg.
Trailing 12-Month AVE
Topline Media Rating
93+1 �
87
92
972012 2013 2014 2015 2016
85% 15%
93
Sector Average64
Big Data
Extreme(100)
Weak...(0)
Moderate... Strong...
Trailing 4-year topline media rating through 2016 ���� High 93 ����
93 95 87 85 79 99 99 - 100
94 95 89 76 82 99 99 - 100
95 95 89 87 81 94 94 - 91
Month Month
Low High Close Chg. Low Close High Close Chg.
Online Sources 90 96 - 89 93 92 +1
94 99 - - 92 94 93 -
94 100 - # 76 89 85 +9
57 82 -3 # 87 90 87 -2
- 90 94 92 -
82 99 - - 94 96 95 -
97 98 - # 88 96 94 -1
92 100 -
94 96 95 -
- 92 96 95 -
92 94 - # 93 95 94 +1
94 96 - - 97 98 97 -
90 93 +2 - 98 99 98 -
85 94 -2 # 89 94 92 -1
93 95 -1 - 90 94 92 -
Low 84
93 92
93
Prior Month
Prior Year
Editorial ProminenceRegional Prominence Online / Viral Prominence
97
96
97
Top US
Papers
Search
Vol.
Top
Cons.
Topline
Media Rating
Segments
Global Web
Forums
-1%
GroupsTop TradeWW
Papers
Top
Bus.
Global
Web
BlogsOnline
News
AsiaNorth
America
Europe
94 94
92 95 99
95
91 93
99
96 94
92 Current Month
#
-
#
Online News
5%
5%
79 -2%
95-
#
#
#
93
12-Month Rating Range
Asia
Forums
Regional Print Metrics
-
-
Europe
- Blogs
Search Volume
-
-2%
-2%
Top Business
Top Consumer
North America 93
-3%
-2%
90South America
Segment-Level Media
Rating Metrics
YearYear 12-Month Rating RangeSegment-Level Media
Rating Metrics
-2%
-2%99
Close Chg.
Top Business
96
Chg.
4% Top Media Sources
Top Global Print
Top US Newspapers
WW Newspapers
99 5%
0%
0%
0%
Top Healthcare
Top Industrial
Top Services
-1%
1%
Top Technology -1%
-1%
99
97
100
-2%
93 -1%
-1%
10%
Top Industry
1%
-1%
0%
Industry-Specific Media
Broadcast
67
72
77
82
87
93 95 -1 - 90 94 92 -# -2%Top Business
9 © 2016 mediaQuant, All rights reserved. | [email protected]
North America 93 -2%
�Yr.
�Mo
+5%
+0%
Short (30 day) vs. Long Term (12-mo.) Sector Comparison
Social Media
Global Web
NOVEMBER
2016
�Yr. +5%
�Yr. +5%
�Mo +0%
�Mo. +0%
Online News
Big Data within the Technology Trends SectorSegment-Level Media Rating Metrics
for Trailing 12-Months
Media Cycle: Oct 1 - 31, 2016
99
99
99
Gai
nin
g M
om
entu
mL
on
g (1
2-M
onth
)Med
ia R
atin
g G
row
th
Big Data
-32
-22
-12
-2
+8
+18
+28
+38LeadingFalling
Lagging Gaining
1 1 6 Smartphones -
2 13 12 Online Security +11
3 2 1 Streaming Content -1
4 3 4 Big Data -1
5 9 13 Touch User Interface +4
5 6 9 Internet of Things +1
5 3 10 Virtual Reality -2
8 3 18 Tablet Computers -5
9 9 4 Cloud Computing -
10 6 32 Camera Phones -4
10 12 25 Online Privacy +2
10 13 25 Smart Home +3
10 6 7 Open Source -4
10 11 8 Social Networking +1
15 15 10 3D Printing -
16 15 25 Internet TV -1
17 22 19 Cloud Storage +5
17 17 13 SaaS - Software as a Service -
19 21 21 Video Conferencing +2
4 93
98
11%
+0
Big Data -13 4
Cur
rent
+1
Current
Month
� Prior
Month YTD Global Print
10%
94 0%
96 14%
97
0%
83
5%
+0%
-4%
-2%
r Yr.
1%92
Prio
r M
o.
Prio
r Y
r.
Ran
k C
hg.
Technology Trends Sector ►
Topline Media Rating
Rank Comparisons
-283
84 -2 85
�Mo.
�Yr.90
0%
26%-3 86
�Mo.
-2%
14%
-1%
92
82 +0 83 5%
-1%
�Yr.
8%
-1%
1%
6%
7%
14%
19%
19%
92
88
86 85
83 +2 81
91 -1 92
+0
89-1
-3 89
+1 88
+0 86
+0
88
91
88
�Mo +0%
�Yr. -1%
92 Search Volume
Broadcast
+2 90
90
88
+1 92
+1
92 +0
93
88
Growth
YOY
Trailing 12
Mo.
Topline Media Rating Metrics
95
64 -0 64
+0
97 +10
99
93
79
94
Gaining MomentumLosingMomentum Short (30-day) Media Raing Growth
-32
-9 -7 -5 -3 -1 +1 +3 +5 +7 +9 +11
19 21 21 Video Conferencing +2
20 17 19 Digital Photography-Cinematography -3 84 3%-481
82 83
© 2016 mediaQuant, All rights reserved. | [email protected] 10

Sentiment Breakout
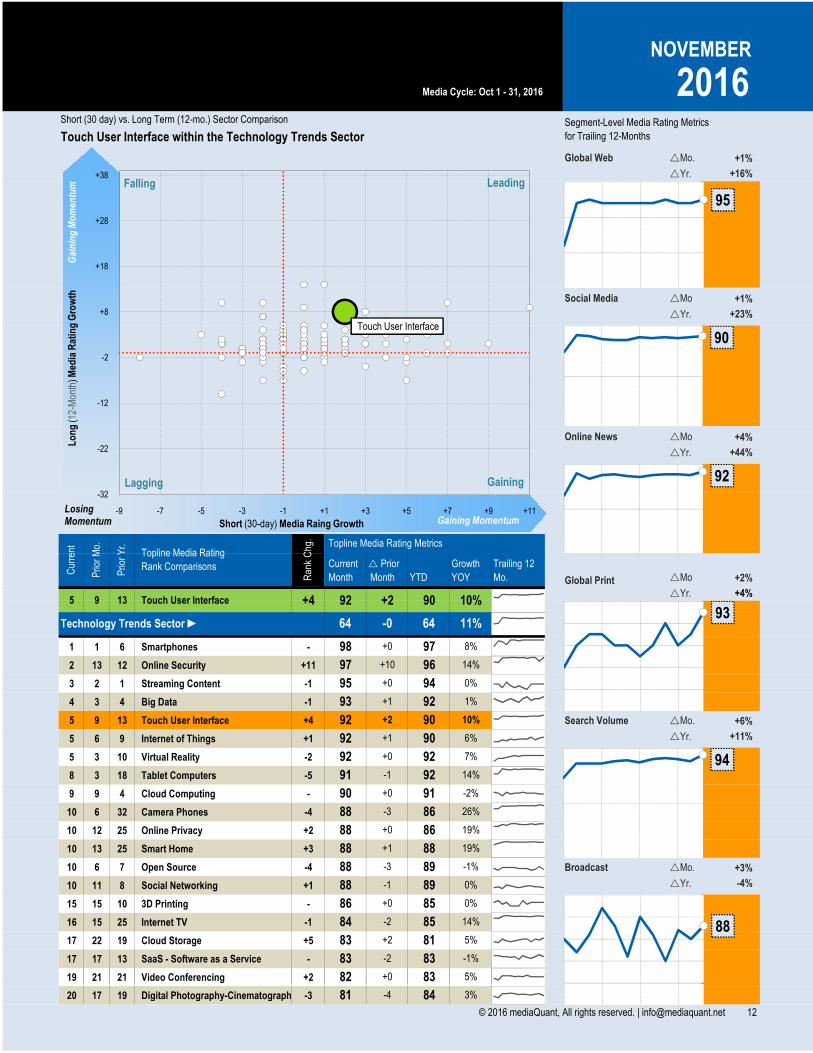
Touch User Interface's topline media rating for November 2016 is 92, a moderate +2
change over the prior month value of 90 and a notable +8 change over the prior-year
media rating of 84. This compares favorably to the Technology Trends sector media
rating average of 64. Touch User Interface's media rating max and min for the trailing 12-
month period are 92 in October 2016 and 83 in November 2015.
Ranking: Within the Technology Trends sector, Touch User Interface is currently ranked
no.5, showing a moderate +4 rank change over the prior month. Year-over-year, Touch
User Interface experienced a notable gain of +8 in the Sector ranking.
Growth Quadrant: For the November 2016 reporting period, Touch User Interface is in
the Gaining quadrant vis-à-vis its peers, showing a moderate +2 change in short term
(prior month) growth and a notable +8 change in long term (prior year) growth, versus
the sector average.
+2
89
90YTD Avg. Rating
Trailing 12-Mo. Avg.
Prior Mo. Rating Chg.
Touch User Interface Trends
�
$11,619,531 $119,493,900Current Month AVE
Prior Yr. Rating Chg.
Trailing 12-Month AVE
Topline Media Rating
92+8 �
94
1042012 2013 2014 2015 2016
93% 7%
92
Sector Average64
Touch User Interface
Extreme(100)
Weak...(0)
Moderate... Strong...
Trailing 4-year topline media rating through 2016 ���� High 94 ����
94 94 94 91 94 92 93 - 93
93 94 94 86 88 88 94 - 92
95 94 93 83 85 64 78 - 72
Month Month
Low High Close Chg. Low Close High Close Chg.
Online Sources 74 92 +2 84 92 92 +3
82 95 +1 # 88 93 93 +2
65 92 +4 # 79 91 91 +5
73 94 +6 - 92 94 94 -
# 82 93 93 +7
78 98 -1 # 90 95 95 +2
68 86 +4 # 80 92 88 +3
77 93 +1
90 95 95 +2
# 83 92 92 +3
88 93 +1 - 96 97 97 -
92 94 - # 87 93 91 +1
90 94 +1 # 98 99 99 +1
78 94 +5 # 93 97 97 +1
93 97 +1 # 82 93 93 +7
Low 80
94 97
91
Prior Month
Prior Year
Editorial ProminenceRegional Prominence Online / Viral Prominence
85
69
81
Top US
Papers
Search
Vol.
Top
Cons.
Topline
Media Rating
Segments
Global Web
Forums
4%
GroupsTop TradeWW
Papers
Top
Bus.
Global
Web
BlogsOnline
News
AsiaNorth
America
Europe
95 87
86 93 94
95
93 96
95
93 82
93 Current Month
#
#
#
Online News
19%
44%
94 11%
94-
#
#
#
94
12-Month Rating Range
Asia
Forums
Regional Print Metrics
#
#
Europe
# Blogs
Search Volume
#
7%
2%
Top Business
Top Consumer
North America 94
17%
-1%
91South America
Segment-Level Media
Rating Metrics
YearYear 12-Month Rating RangeSegment-Level Media
Rating Metrics
1%
10%92
Close Chg.
Top Business
92
Chg.
23% Top Media Sources
Top Global Print
Top US Newspapers
WW Newspapers
95 16%
7%
0%
3%
Top Healthcare
Top Industrial
Top Services
1%
3%
Top Technology 0%
1%
93
85
93
7%
93 3%
2%
29%
Top Industry
23%
2%
-4%
Industry-Specific Media
Broadcast
64
74
84
93 97 +1 # 82 93 93 +7# 7%Top Business
11 © 2016 mediaQuant, All rights reserved. | [email protected]
North America 94 -1%
�Yr.
�Mo
+16%
+1%
Short (30 day) vs. Long Term (12-mo.) Sector Comparison
Social Media
Global Web
NOVEMBER
2016
�Yr. +44%
�Yr. +23%
�Mo +4%
�Mo. +1%
Online News
Touch User Interface within the Technology Trends SectorSegment-Level Media Rating Metrics
for Trailing 12-Months
Media Cycle: Oct 1 - 31, 2016
95
90
92
Gai
nin
g M
om
entu
mL
on
g (1
2-M
onth
)Med
ia R
atin
g G
row
th
Touch User Interface
-32
-22
-12
-2
+8
+18
+28
+38LeadingFalling
Lagging Gaining
1 1 6 Smartphones -
2 13 12 Online Security +11
3 2 1 Streaming Content -1
4 3 4 Big Data -1
5 9 13 Touch User Interface +4
5 6 9 Internet of Things +1
5 3 10 Virtual Reality -2
8 3 18 Tablet Computers -5
9 9 4 Cloud Computing -
10 6 32 Camera Phones -4
10 12 25 Online Privacy +2
10 13 25 Smart Home +3
10 6 7 Open Source -4
10 11 8 Social Networking +1
15 15 10 3D Printing -
16 15 25 Internet TV -1
17 22 19 Cloud Storage +5
17 17 13 SaaS - Software as a Service -
19 21 21 Video Conferencing +2
5 92
98
11%
+0
Touch User Interface +49 13
Cur
rent
+2
Current
Month
� Prior
Month YTD Global Print
10%
94 0%
96 14%
97
0%
83
5%
-4%
+6%
+11%
r Yr.
10%90
Prio
r M
o.
Prio
r Y
r.
Ran
k C
hg.
Technology Trends Sector ►
Topline Media Rating
Rank Comparisons
-283
84 -2 85
�Mo.
�Yr.90
0%
26%-3 86
�Mo.
-2%
14%
-1%
92
82 +0 83 5%
+3%
�Yr.
8%
-1%
1%
6%
7%
14%
19%
19%
92
88
86 85
83 +2 81
91 -1 92
+0
89-1
-3 89
+1 88
+0 86
+0
88
91
88
�Mo +2%
�Yr. +4%
92 Search Volume
Broadcast
+2 90
90
88
+1 92
+1
92 +0
93
88
Growth
YOY
Trailing 12
Mo.
Topline Media Rating Metrics
95
64 -0 64
+0
97 +10
93
94
88
Gaining MomentumLosingMomentum Short (30-day) Media Raing Growth
-32
-9 -7 -5 -3 -1 +1 +3 +5 +7 +9 +11
19 21 21 Video Conferencing +2
20 17 19 Digital Photography-Cinematography -3 84 3%-481
82 83
© 2016 mediaQuant, All rights reserved. | [email protected] 12
Sentiment Breakout
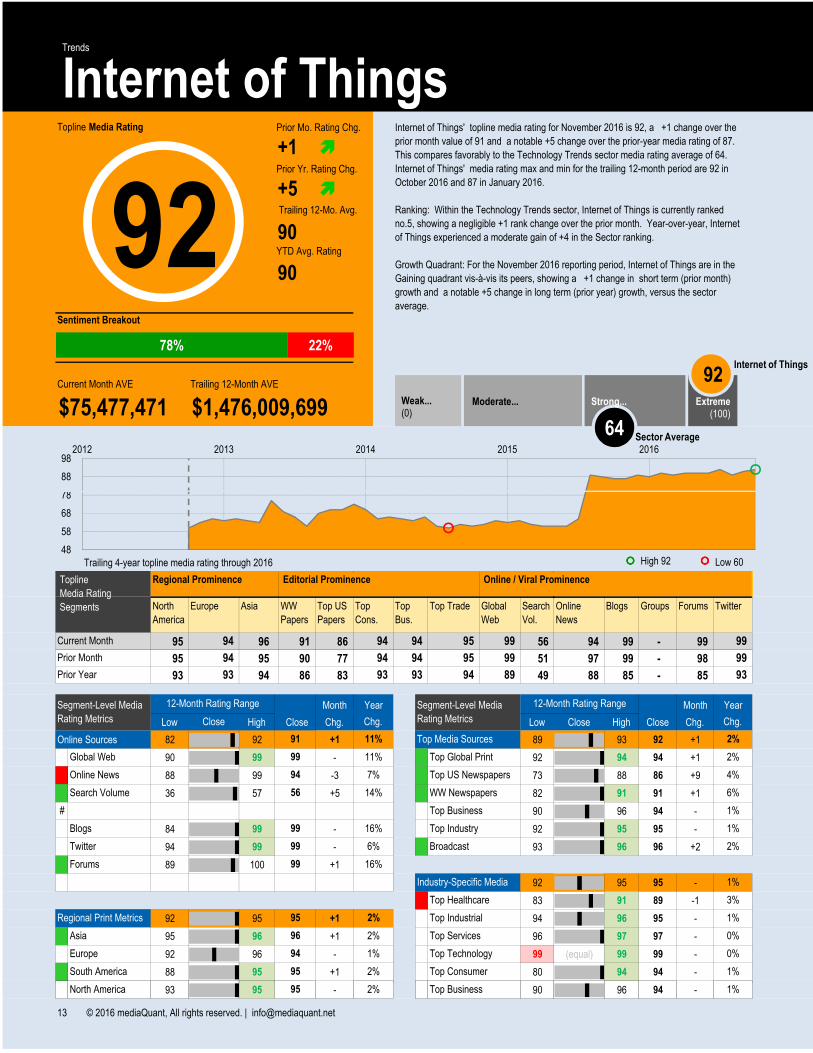
Internet of Things' topline media rating for November 2016 is 92, a +1 change over the
prior month value of 91 and a notable +5 change over the prior-year media rating of 87.
This compares favorably to the Technology Trends sector media rating average of 64.
Internet of Things' media rating max and min for the trailing 12-month period are 92 in
October 2016 and 87 in January 2016.
Ranking: Within the Technology Trends sector, Internet of Things is currently ranked
no.5, showing a negligible +1 rank change over the prior month. Year-over-year, Internet
of Things experienced a moderate gain of +4 in the Sector ranking.
Growth Quadrant: For the November 2016 reporting period, Internet of Things are in the
Gaining quadrant vis-à-vis its peers, showing a +1 change in short term (prior month)
growth and a notable +5 change in long term (prior year) growth, versus the sector
average.
+1
90
90YTD Avg. Rating
Trailing 12-Mo. Avg.
Prior Mo. Rating Chg.
Internet of Things Trends
�
$75,477,471 $1,476,009,699Current Month AVE
Prior Yr. Rating Chg.
Trailing 12-Month AVE
Topline Media Rating
92+5 �
78
88
982012 2013 2014 2015 2016
78% 22%
92
Sector Average64
Internet of Things
Extreme(100)
Weak...(0)
Moderate... Strong...
Trailing 4-year topline media rating through 2016 ���� High 92 ����
95 96 91 86 56 94 99 - 99
95 95 90 77 51 97 99 - 98
93 94 86 83 49 88 85 - 85
Month Month
Low High Close Chg. Low Close High Close Chg.
Online Sources 82 92 +1 89 93 92 +1
90 99 - # 92 94 94 +1
88 99 -3 # 73 88 86 +9
36 57 +5 # 82 91 91 +1
- 90 96 94 -
84 99 - - 92 95 95 -
94 99 - # 93 96 96 +2
89 100 +1
92 95 95 -
# 83 91 89 -1
92 95 +1 - 94 96 95 -
95 96 +1 - 96 97 97 -
92 96 - - 99 (equal) 99 99 -
88 95 +1 - 80 94 94 -
93 95 - - 90 96 94 -
Low 60
94 94
93
Prior Month
Prior Year
Editorial ProminenceRegional Prominence Online / Viral Prominence
99
93
99
Top US
Papers
Search
Vol.
Top
Cons.
Topline
Media Rating
Segments
Global Web
Forums
2%
GroupsTop TradeWW
Papers
Top
Bus.
Global
Web
BlogsOnline
News
AsiaNorth
America
Europe
93 93
94 95 99
95
94 94
99
94 89
94 Current Month
#
#
#
Online News
16%
7%
56 14%
96#
-
#
-
94
12-Month Rating Range
Asia
Forums
Regional Print Metrics
-
#
Europe
- Blogs
Search Volume
-
1%
1%
Top Business
Top Consumer
North America 95
2%
2%
95South America
Segment-Level Media
Rating Metrics
YearYear 12-Month Rating RangeSegment-Level Media
Rating Metrics
6%
4%94
Close Chg.
Top Business
91
Chg.
11% Top Media Sources
Top Global Print
Top US Newspapers
WW Newspapers
99 11%
2%
2%
1%
Top Healthcare
Top Industrial
Top Services
1%
3%
Top Technology 0%
0%
99
99
99
1%
95 2%
1%
16%
Top Industry
6%
1%
2%
Industry-Specific Media
Broadcast
48
58
68
78
93 95 - - 90 96 94 -- 1%Top Business
13 © 2016 mediaQuant, All rights reserved. | [email protected]
North America 95 2%

�Yr.
�Mo
+11%
+0%
Short (30 day) vs. Long Term (12-mo.) Sector Comparison
Social Media
Global Web
NOVEMBER
2016
�Yr. +7%
�Yr. +13%
�Mo -3%
�Mo. +0%
Online News
Internet of Things within the Technology Trends SectorSegment-Level Media Rating Metrics
for Trailing 12-Months
Media Cycle: Oct 1 - 31, 2016
99
99
94
Gai
nin
g M
om
entu
mL
on
g (1
2-M
onth
)Med
ia R
atin
g G
row
th
Internet of Things
-32
-22
-12
-2
+8
+18
+28
+38LeadingFalling
Lagging Gaining
1 1 6 Smartphones -
2 13 12 Online Security +11
3 2 1 Streaming Content -1
4 3 4 Big Data -1
5 9 13 Touch User Interface +4
5 6 9 Internet of Things +1
5 3 10 Virtual Reality -2
8 3 18 Tablet Computers -5
9 9 4 Cloud Computing -
10 6 32 Camera Phones -4
10 12 25 Online Privacy +2
10 13 25 Smart Home +3
10 6 7 Open Source -4
10 11 8 Social Networking +1
15 15 10 3D Printing -
16 15 25 Internet TV -1
17 22 19 Cloud Storage +5
17 17 13 SaaS - Software as a Service -
19 21 21 Video Conferencing +2
5 92
98
11%
+0
Internet of Things +16 9
Cur
rent
+1
Current
Month
� Prior
Month YTD Global Print
10%
94 0%
96 14%
97
0%
83
5%
+2%
+9%
+14%
r Yr.
6%90
Prio
r M
o.
Prio
r Y
r.
Ran
k C
hg.
Technology Trends Sector ►
Topline Media Rating
Rank Comparisons
-283
84 -2 85
�Mo.
�Yr.90
0%
26%-3 86
�Mo.
-2%
14%
-1%
92
82 +0 83 5%
+2%
�Yr.
8%
-1%
1%
6%
7%
14%
19%
19%
92
88
86 85
83 +2 81
91 -1 92
+0
89-1
-3 89
+1 88
+0 86
+0
88
91
88
�Mo +1%
�Yr. +2%
92 Search Volume
Broadcast
+2 90
90
88
+1 92
+1
92 +0
93
88
Growth
YOY
Trailing 12
Mo.
Topline Media Rating Metrics
95
64 -0 64
+0
97 +10
94
94
56
96
Gaining MomentumLosingMomentum Short (30-day) Media Raing Growth
-32
-9 -7 -5 -3 -1 +1 +3 +5 +7 +9 +11
19 21 21 Video Conferencing +2
20 17 19 Digital Photography-Cinematography -3 84 3%-481
82 83
© 2016 mediaQuant, All rights reserved. | [email protected] 14
Sentiment Breakout
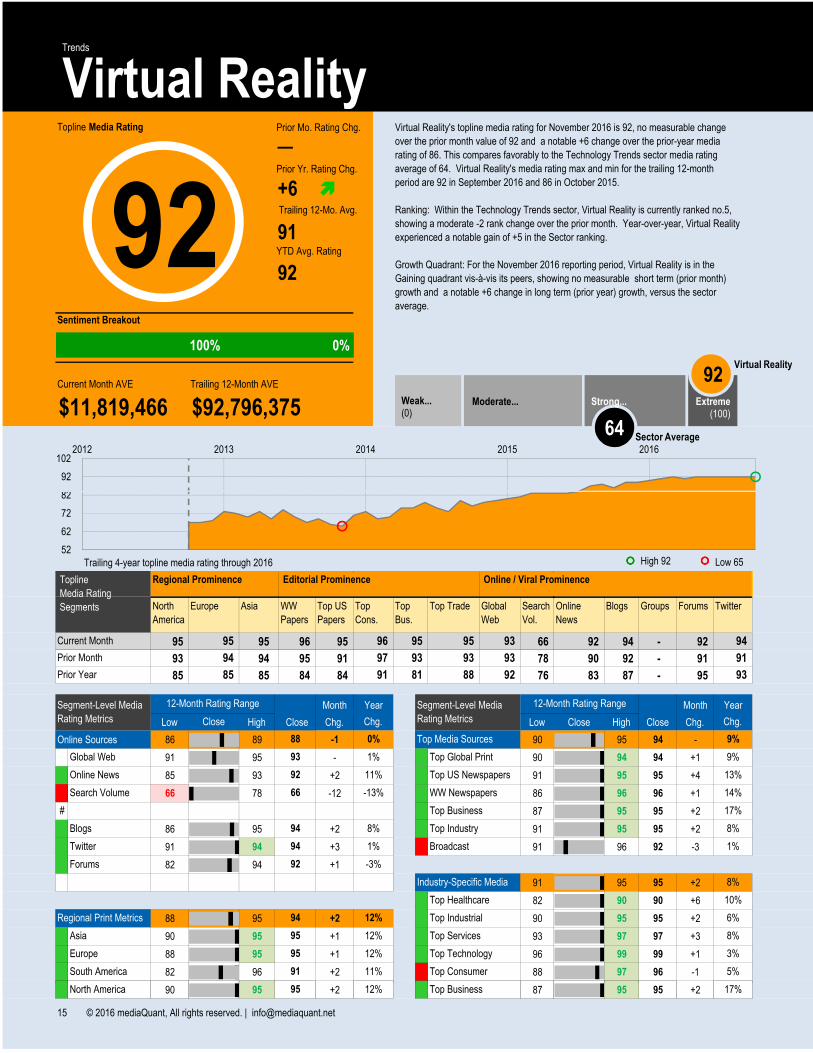
Virtual Reality's topline media rating for November 2016 is 92, no measurable change
over the prior month value of 92 and a notable +6 change over the prior-year media
rating of 86. This compares favorably to the Technology Trends sector media rating
average of 64. Virtual Reality's media rating max and min for the trailing 12-month
period are 92 in September 2016 and 86 in October 2015.
Ranking: Within the Technology Trends sector, Virtual Reality is currently ranked no.5,
showing a moderate -2 rank change over the prior month. Year-over-year, Virtual Reality
experienced a notable gain of +5 in the Sector ranking.
Growth Quadrant: For the November 2016 reporting period, Virtual Reality is in the
Gaining quadrant vis-à-vis its peers, showing no measurable short term (prior month)
growth and a notable +6 change in long term (prior year) growth, versus the sector
average.
─
91
92YTD Avg. Rating
Trailing 12-Mo. Avg.
Prior Mo. Rating Chg.
Virtual Reality Trends
�
$11,819,466 $92,796,375Current Month AVE
Prior Yr. Rating Chg.
Trailing 12-Month AVE
Topline Media Rating
92+6 �
82
92
1022012 2013 2014 2015 2016
100% 0%
92
Sector Average64
Virtual Reality
Extreme(100)
Weak...(0)
Moderate... Strong...
Trailing 4-year topline media rating through 2016 ���� High 92 ����
95 95 96 95 66 92 94 - 92
93 94 95 91 78 90 92 - 91
85 85 84 84 76 83 87 - 95
Month Month
Low High Close Chg. Low Close High Close Chg.
Online Sources 86 89 -1 90 95 94 -
91 95 - # 90 94 94 +1
85 93 +2 # 91 95 95 +4
66 78 -12 # 86 96 96 +1
# 87 95 95 +2
86 95 +2 # 91 95 95 +2
91 94 +3 # 91 96 92 -3
82 94 +1
91 95 95 +2
# 82 90 90 +6
88 95 +2 # 90 95 95 +2
90 95 +1 # 93 97 97 +3
88 95 +1 # 96 99 99 +1
82 96 +2 # 88 97 96 -1
90 95 +2 # 87 95 95 +2
Low 65
95 96
85
Prior Month
Prior Year
Editorial ProminenceRegional Prominence Online / Viral Prominence
94
93
91
Top US
Papers
Search
Vol.
Top
Cons.
Topline
Media Rating
Segments
Global Web
Forums
9%
GroupsTop TradeWW
Papers
Top
Bus.
Global
Web
BlogsOnline
News
AsiaNorth
America
Europe
91 81
93 93 93
95
94 97
93
88 92
95 Current Month
#
#
#
Online News
8%
11%
66 -13%
95#
#
#
#
95
12-Month Rating Range
Asia
Forums
Regional Print Metrics
#
#
Europe
# Blogs
Search Volume
-
17%
5%
Top Business
Top Consumer
North America 95
11%
12%
91South America
Segment-Level Media
Rating Metrics
YearYear 12-Month Rating RangeSegment-Level Media
Rating Metrics
14%
13%92
Close Chg.
Top Business
88
Chg.
0% Top Media Sources
Top Global Print
Top US Newspapers
WW Newspapers
93 1%
9%
12%
12%
Top Healthcare
Top Industrial
Top Services
6%
10%
Top Technology 3%
8%
94
94
92
17%
94 12%
8%
-3%
Top Industry
1%
8%
1%
Industry-Specific Media
Broadcast
52
62
72
82
90 95 +2 # 87 95 95 +2# 17%Top Business
15 © 2016 mediaQuant, All rights reserved. | [email protected]
North America 95 12%

�Yr.
�Mo
+1%
+2%
Short (30 day) vs. Long Term (12-mo.) Sector Comparison
Social Media
Global Web
NOVEMBER
2016
�Yr. +11%
�Yr. +1%
�Mo +2%
�Mo. +0%
Online News
Virtual Reality within the Technology Trends SectorSegment-Level Media Rating Metrics
for Trailing 12-Months
Media Cycle: Oct 1 - 31, 2016
93
93
92
Gai
nin
g M
om
entu
mL
on
g (1
2-M
onth
)Med
ia R
atin
g G
row
th
Virtual Reality
-32
-22
-12
-2
+8
+18
+28
+38LeadingFalling
Lagging Gaining
1 1 6 Smartphones -
2 13 12 Online Security +11
3 2 1 Streaming Content -1
4 3 4 Big Data -1
5 9 13 Touch User Interface +4
5 6 9 Internet of Things +1
5 3 10 Virtual Reality -2
8 3 18 Tablet Computers -5
9 9 4 Cloud Computing -
10 6 32 Camera Phones -4
10 12 25 Online Privacy +2
10 13 25 Smart Home +3
10 6 7 Open Source -4
10 11 8 Social Networking +1
15 15 10 3D Printing -
16 15 25 Internet TV -1
17 22 19 Cloud Storage +5
17 17 13 SaaS - Software as a Service -
19 21 21 Video Conferencing +2
5 92
98
11%
+0
Virtual Reality -23 10
Cur
rent
+0
Current
Month
� Prior
Month YTD Global Print
10%
94 0%
96 14%
97
0%
83
5%
+1%
-18%
-13%
r Yr.
7%92
Prio
r M
o.
Prio
r Y
r.
Ran
k C
hg.
Technology Trends Sector ►
Topline Media Rating
Rank Comparisons
-283
84 -2 85
�Mo.
�Yr.90
0%
26%-3 86
�Mo.
-2%
14%
-1%
92
82 +0 83 5%
-3%
�Yr.
8%
-1%
1%
6%
7%
14%
19%
19%
92
88
86 85
83 +2 81
91 -1 92
+0
89-1
-3 89
+1 88
+0 86
+0
88
91
88
�Mo +1%
�Yr. +9%
92 Search Volume
Broadcast
+2 90
90
88
+1 92
+1
92 +0
93
88
Growth
YOY
Trailing 12
Mo.
Topline Media Rating Metrics
95
64 -0 64
+0
97 +10
92
94
66
92
Gaining MomentumLosingMomentum Short (30-day) Media Raing Growth
-32
-9 -7 -5 -3 -1 +1 +3 +5 +7 +9 +11
19 21 21 Video Conferencing +2
20 17 19 Digital Photography-Cinematography -3 84 3%-481
82 83
© 2016 mediaQuant, All rights reserved. | [email protected] 16
Sentiment Breakout
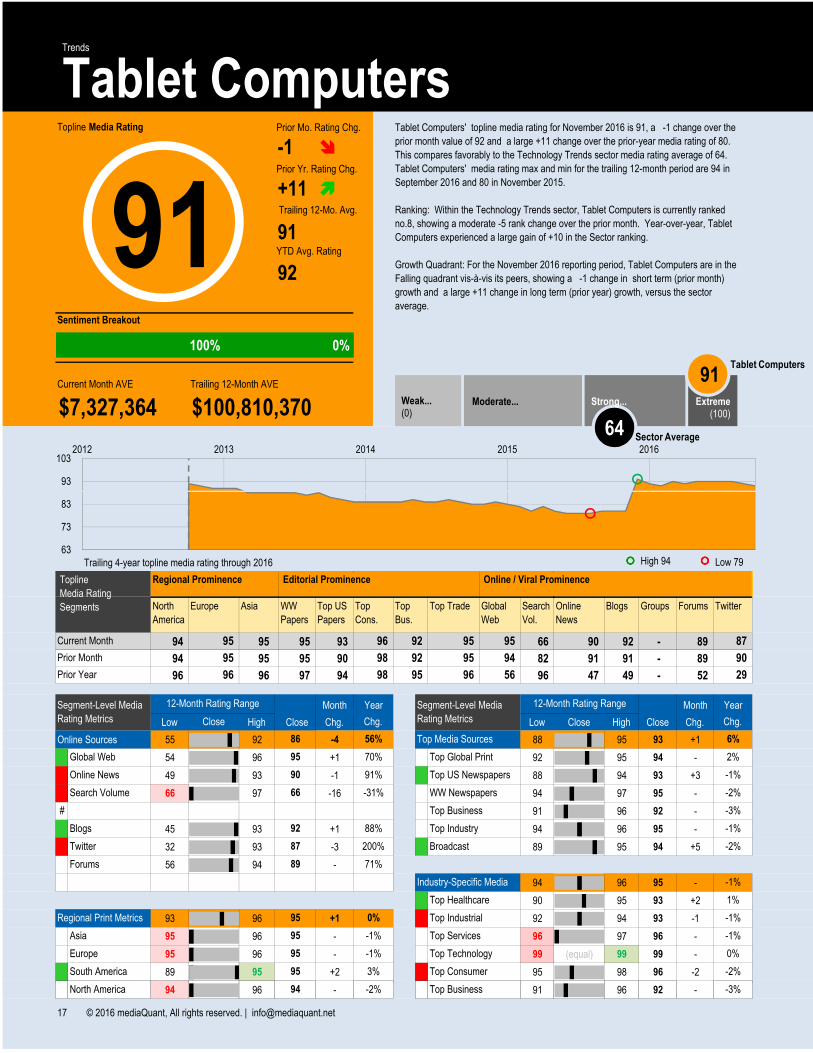
Tablet Computers' topline media rating for November 2016 is 91, a -1 change over the
prior month value of 92 and a large +11 change over the prior-year media rating of 80.
This compares favorably to the Technology Trends sector media rating average of 64.
Tablet Computers' media rating max and min for the trailing 12-month period are 94 in
September 2016 and 80 in November 2015.
Ranking: Within the Technology Trends sector, Tablet Computers is currently ranked
no.8, showing a moderate -5 rank change over the prior month. Year-over-year, Tablet
Computers experienced a large gain of +10 in the Sector ranking.
Growth Quadrant: For the November 2016 reporting period, Tablet Computers are in the
Falling quadrant vis-à-vis its peers, showing a -1 change in short term (prior month)
growth and a large +11 change in long term (prior year) growth, versus the sector
average.
-1
91
92YTD Avg. Rating
Trailing 12-Mo. Avg.
Prior Mo. Rating Chg.
Tablet Computers Trends
�
$7,327,364 $100,810,370Current Month AVE
Prior Yr. Rating Chg.
Trailing 12-Month AVE
Topline Media Rating
91+11 �
93
1032012 2013 2014 2015 2016
100% 0%
91
Sector Average64
Tablet Computers
Extreme(100)
Weak...(0)
Moderate... Strong...
Trailing 4-year topline media rating through 2016 ���� High 94 ����
94 95 95 93 66 90 92 - 89
94 95 95 90 82 91 91 - 89
96 96 97 94 96 47 49 - 52
Month Month
Low High Close Chg. Low Close High Close Chg.
Online Sources 55 92 -4 88 95 93 +1
54 96 +1 - 92 95 94 -
49 93 -1 # 88 94 93 +3
66 97 -16 - 94 97 95 -
- 91 96 92 -
45 93 +1 - 94 96 95 -
32 93 -3 # 89 95 94 +5
56 94 -
94 96 95 -
# 90 95 93 +2
93 96 +1 # 92 94 93 -1
95 96 - - 96 97 96 -
95 96 - - 99 (equal) 99 99 -
89 95 +2 # 95 98 96 -2
94 96 - - 91 96 92 -
Low 79
95 96
96
Prior Month
Prior Year
Editorial ProminenceRegional Prominence Online / Viral Prominence
87
29
90
Top US
Papers
Search
Vol.
Top
Cons.
Topline
Media Rating
Segments
Global Web
Forums
2%
GroupsTop TradeWW
Papers
Top
Bus.
Global
Web
BlogsOnline
News
AsiaNorth
America
Europe
98 95
92 95 94
95
95 98
95
96 56
92 Current Month
#
#
#
Online News
88%
91%
66 -31%
95-
-
#
-
95
12-Month Rating Range
Asia
Forums
Regional Print Metrics
#
-
Europe
# Blogs
Search Volume
#
-3%
-2%
Top Business
Top Consumer
North America 94
3%
-2%
95South America
Segment-Level Media
Rating Metrics
YearYear 12-Month Rating RangeSegment-Level Media
Rating Metrics
-2%
-1%90
Close Chg.
Top Business
86
Chg.
56% Top Media Sources
Top Global Print
Top US Newspapers
WW Newspapers
95 70%
6%
-1%
-1%
Top Healthcare
Top Industrial
Top Services
-1%
1%
Top Technology 0%
-1%
92
87
89
-3%
95 0%
-1%
71%
Top Industry
200%
-1%
-2%
Industry-Specific Media
Broadcast
63
73
83
94 96 - - 91 96 92 -- -3%Top Business
17 © 2016 mediaQuant, All rights reserved. | [email protected]
North America 94 -2%
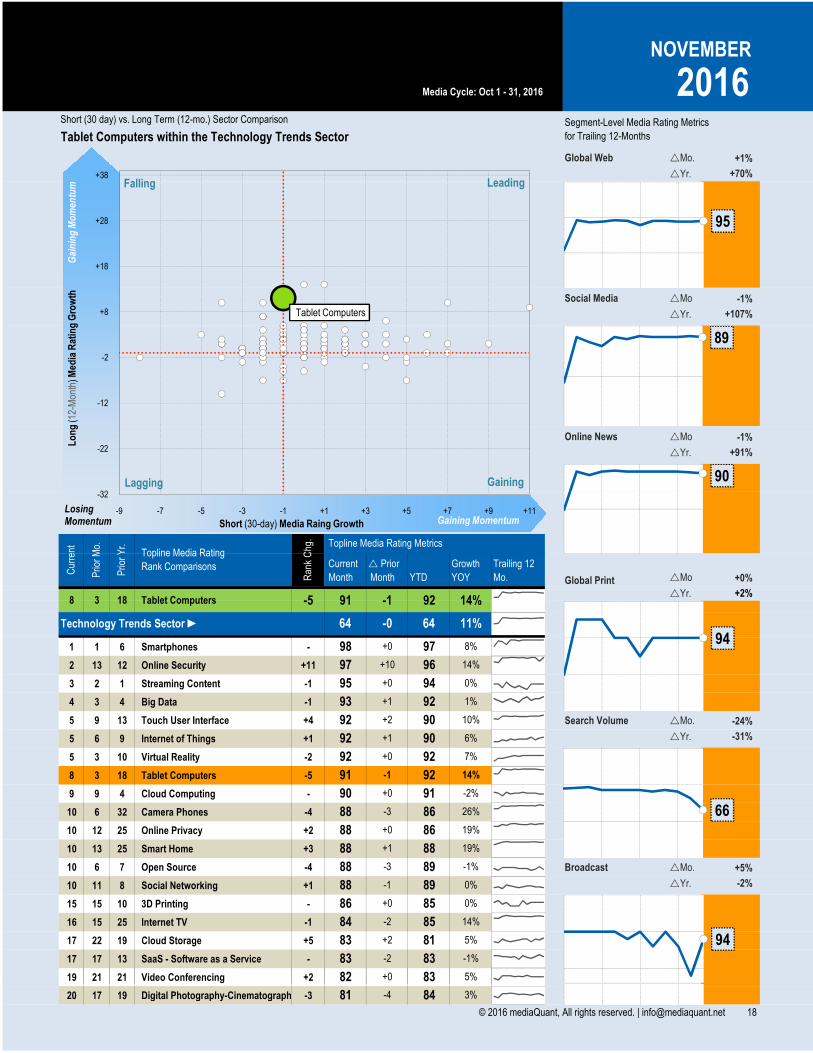
�Yr.
�Mo
+70%
-1%
Short (30 day) vs. Long Term (12-mo.) Sector Comparison
Social Media
Global Web
NOVEMBER
2016
�Yr. +91%
�Yr. +107%
�Mo -1%
�Mo. +1%
Online News
Tablet Computers within the Technology Trends SectorSegment-Level Media Rating Metrics
for Trailing 12-Months
Media Cycle: Oct 1 - 31, 2016
95
89
90
Gai
nin
g M
om
entu
mL
on
g (1
2-M
onth
)Med
ia R
atin
g G
row
th
Tablet Computers
-32
-22
-12
-2
+8
+18
+28
+38LeadingFalling
Lagging Gaining
1 1 6 Smartphones -
2 13 12 Online Security +11
3 2 1 Streaming Content -1
4 3 4 Big Data -1
5 9 13 Touch User Interface +4
5 6 9 Internet of Things +1
5 3 10 Virtual Reality -2
8 3 18 Tablet Computers -5
9 9 4 Cloud Computing -
10 6 32 Camera Phones -4
10 12 25 Online Privacy +2
10 13 25 Smart Home +3
10 6 7 Open Source -4
10 11 8 Social Networking +1
15 15 10 3D Printing -
16 15 25 Internet TV -1
17 22 19 Cloud Storage +5
17 17 13 SaaS - Software as a Service -
19 21 21 Video Conferencing +2
8 91
98
11%
+0
Tablet Computers -53 18
Cur
rent
-1
Current
Month
� Prior
Month YTD Global Print
10%
94 0%
96 14%
97
0%
83
5%
-2%
-24%
-31%
r Yr.
14%92
Prio
r M
o.
Prio
r Y
r.
Ran
k C
hg.
Technology Trends Sector ►
Topline Media Rating
Rank Comparisons
-283
84 -2 85
�Mo.
�Yr.90
0%
26%-3 86
�Mo.
-2%
14%
-1%
92
82 +0 83 5%
+5%
�Yr.
8%
-1%
1%
6%
7%
14%
19%
19%
92
88
86 85
83 +2 81
91 -1 92
+0
89-1
-3 89
+1 88
+0 86
+0
88
91
88
�Mo +0%
�Yr. +2%
92 Search Volume
Broadcast
+2 90
90
88
+1 92
+1
92 +0
93
88
Growth
YOY
Trailing 12
Mo.
Topline Media Rating Metrics
95
64 -0 64
+0
97 +10
94
66
94
Gaining MomentumLosingMomentum Short (30-day) Media Raing Growth
-32
-9 -7 -5 -3 -1 +1 +3 +5 +7 +9 +11
19 21 21 Video Conferencing +2
20 17 19 Digital Photography-Cinematography -3 84 3%-481
82 83
© 2016 mediaQuant, All rights reserved. | [email protected] 18
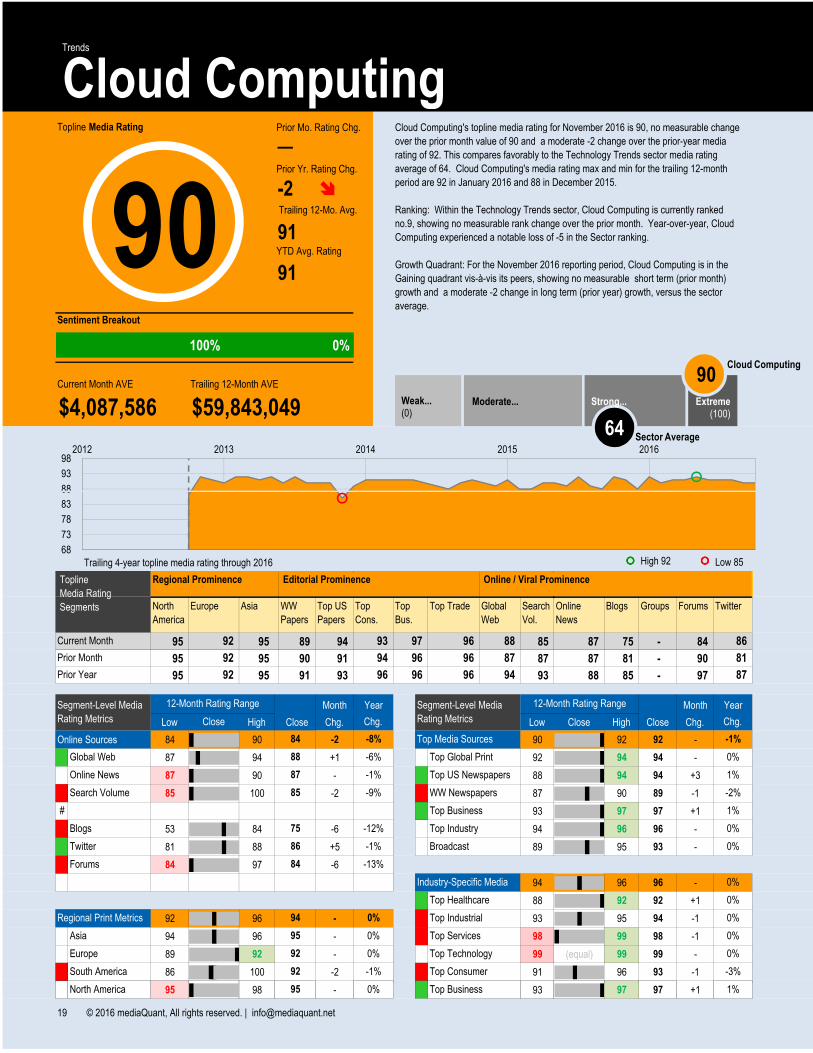
Sentiment Breakout
Cloud Computing's topline media rating for November 2016 is 90, no measurable change
over the prior month value of 90 and a moderate -2 change over the prior-year media
rating of 92. This compares favorably to the Technology Trends sector media rating
average of 64. Cloud Computing's media rating max and min for the trailing 12-month
period are 92 in January 2016 and 88 in December 2015.
Ranking: Within the Technology Trends sector, Cloud Computing is currently ranked
no.9, showing no measurable rank change over the prior month. Year-over-year, Cloud
Computing experienced a notable loss of -5 in the Sector ranking.
Growth Quadrant: For the November 2016 reporting period, Cloud Computing is in the
Gaining quadrant vis-à-vis its peers, showing no measurable short term (prior month)
growth and a moderate -2 change in long term (prior year) growth, versus the sector
average.
─
91
91YTD Avg. Rating
Trailing 12-Mo. Avg.
Prior Mo. Rating Chg.
Cloud Computing Trends
�
$4,087,586 $59,843,049Current Month AVE
Prior Yr. Rating Chg.
Trailing 12-Month AVE
Topline Media Rating
90-2 �
88
93
982012 2013 2014 2015 2016
100% 0%
90
Sector Average64
Cloud Computing
Extreme(100)
Weak...(0)
Moderate... Strong...
Trailing 4-year topline media rating through 2016 ���� High 92 ����
95 95 89 94 85 87 75 - 84
95 95 90 91 87 87 81 - 90
95 95 91 93 93 88 85 - 97
Month Month
Low High Close Chg. Low Close High Close Chg.
Online Sources 84 90 -2 90 92 92 -
87 94 +1 - 92 94 94 -
87 90 - # 88 94 94 +3
85 100 -2 # 87 90 89 -1
# 93 97 97 +1
53 84 -6 - 94 96 96 -
81 88 +5 - 89 95 93 -
84 97 -6
94 96 96 -
# 88 92 92 +1
92 96 - # 93 95 94 -1
94 96 - # 98 99 98 -1
89 92 - - 99 (equal) 99 99 -
86 100 -2 # 91 96 93 -1
95 98 - # 93 97 97 +1
Low 85
92 93
92
Prior Month
Prior Year
Editorial ProminenceRegional Prominence Online / Viral Prominence
86
87
81
Top US
Papers
Search
Vol.
Top
Cons.
Topline
Media Rating
Segments
Global Web
Forums
0%
GroupsTop TradeWW
Papers
Top
Bus.
Global
Web
BlogsOnline
News
AsiaNorth
America
Europe
96 96
96 96 87
96
92 94
88
96 94
97 Current Month
#
-
#
Online News
-12%
-1%
85 -9%
95-
-
#
-
92
12-Month Rating Range
Asia
Forums
Regional Print Metrics
#
#
Europe
# Blogs
Search Volume
#
1%
-3%
Top Business
Top Consumer
North America 95
-1%
0%
92South America
Segment-Level Media
Rating Metrics
YearYear 12-Month Rating RangeSegment-Level Media
Rating Metrics
-2%
1%87
Close Chg.
Top Business
84
Chg.
-8% Top Media Sources
Top Global Print
Top US Newspapers
WW Newspapers
88 -6%
-1%
0%
0%
Top Healthcare
Top Industrial
Top Services
0%
0%
Top Technology 0%
0%
75
86
84
1%
94 0%
0%
-13%
Top Industry
-1%
0%
0%
Industry-Specific Media
Broadcast
68
73
78
83
88
95 98 - # 93 97 97 +1- 1%Top Business
19 © 2016 mediaQuant, All rights reserved. | [email protected]
North America 95 0%

�Yr.
�Mo
-6%
-2%
Short (30 day) vs. Long Term (12-mo.) Sector Comparison
Social Media
Global Web
NOVEMBER
2016
�Yr. -1%
�Yr. -9%
�Mo +0%
�Mo. +1%
Online News
Cloud Computing within the Technology Trends SectorSegment-Level Media Rating Metrics
for Trailing 12-Months
Media Cycle: Oct 1 - 31, 2016
88
82
Gai
nin
g M
om
entu
mL
on
g (1
2-M
onth
)Med
ia R
atin
g G
row
th
Cloud Computing
-32
-22
-12
-2
+8
+18
+28
+38LeadingFalling
Lagging Gaining
1 1 6 Smartphones -
2 13 12 Online Security +11
3 2 1 Streaming Content -1
4 3 4 Big Data -1
5 9 13 Touch User Interface +4
5 6 9 Internet of Things +1
5 3 10 Virtual Reality -2
8 3 18 Tablet Computers -5
9 9 4 Cloud Computing -
10 6 32 Camera Phones -4
10 12 25 Online Privacy +2
10 13 25 Smart Home +3
10 6 7 Open Source -4
10 11 8 Social Networking +1
15 15 10 3D Printing -
16 15 25 Internet TV -1
17 22 19 Cloud Storage +5
17 17 13 SaaS - Software as a Service -
19 21 21 Video Conferencing +2
9 90
98
11%
+0
Cloud Computing +09 4
Cur
rent
+0
Current
Month
� Prior
Month YTD Global Print
10%
94 0%
96 14%
97
0%
83
5%
+0%
-2%
-9%
r Yr.
-2%91
Prio
r M
o.
Prio
r Y
r.
Ran
k C
hg.
Technology Trends Sector ►
Topline Media Rating
Rank Comparisons
-283
84 -2 85
�Mo.
�Yr.90
0%
26%-3 86
�Mo.
-2%
14%
-1%
92
82 +0 83 5%
+0%
�Yr.
8%
-1%
1%
6%
7%
14%
19%
19%
92
88
86 85
83 +2 81
91 -1 92
+0
89-1
-3 89
+1 88
+0 86
+0
88
91
88
�Mo +0%
�Yr. +0%
92 Search Volume
Broadcast
+2 90
90
88
+1 92
+1
92 +0
93
88
Growth
YOY
Trailing 12
Mo.
Topline Media Rating Metrics
95
64 -0 64
+0
97 +10
87
94
85
93
Gaining MomentumLosingMomentum Short (30-day) Media Raing Growth
-32
-9 -7 -5 -3 -1 +1 +3 +5 +7 +9 +11
19 21 21 Video Conferencing +2
20 17 19 Digital Photography-Cinematography -3 84 3%-481
82 83
© 2016 mediaQuant, All rights reserved. | [email protected] 20
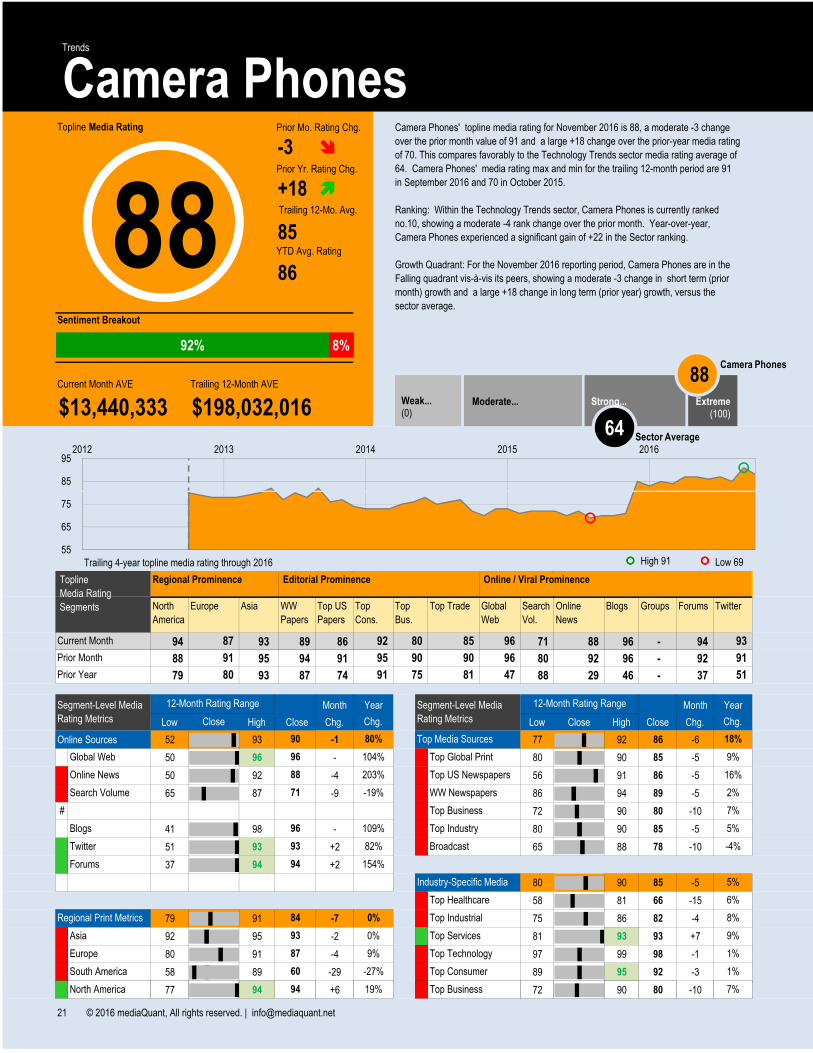
Sentiment Breakout
Camera Phones' topline media rating for November 2016 is 88, a moderate -3 change
over the prior month value of 91 and a large +18 change over the prior-year media rating
of 70. This compares favorably to the Technology Trends sector media rating average of
64. Camera Phones' media rating max and min for the trailing 12-month period are 91
in September 2016 and 70 in October 2015.
Ranking: Within the Technology Trends sector, Camera Phones is currently ranked
no.10, showing a moderate -4 rank change over the prior month. Year-over-year,
Camera Phones experienced a significant gain of +22 in the Sector ranking.
Growth Quadrant: For the November 2016 reporting period, Camera Phones are in the
Falling quadrant vis-à-vis its peers, showing a moderate -3 change in short term (prior
month) growth and a large +18 change in long term (prior year) growth, versus the
sector average.
-3
85
86YTD Avg. Rating
Trailing 12-Mo. Avg.
Prior Mo. Rating Chg.
Camera Phones Trends
�
$13,440,333 $198,032,016Current Month AVE
Prior Yr. Rating Chg.
Trailing 12-Month AVE
Topline Media Rating
88+18 �
85
952012 2013 2014 2015 2016
92% 8%
88
Sector Average64
Camera Phones
Extreme(100)
Weak...(0)
Moderate... Strong...
Trailing 4-year topline media rating through 2016 ���� High 91 ����
94 93 89 86 71 88 96 - 94
88 95 94 91 80 92 96 - 92
79 93 87 74 88 29 46 - 37
Month Month
Low High Close Chg. Low Close High Close Chg.
Online Sources 52 93 -1 77 92 86 -6
50 96 - # 80 90 85 -5
50 92 -4 # 56 91 86 -5
65 87 -9 # 86 94 89 -5
# 72 90 80 -10
41 98 - # 80 90 85 -5
51 93 +2 # 65 88 78 -10
37 94 +2
80 90 85 -5
# 58 81 66 -15
79 91 -7 # 75 86 82 -4
92 95 -2 # 81 93 93 +7
80 91 -4 # 97 99 98 -1
58 89 -29 # 89 95 92 -3
77 94 +6 # 72 90 80 -10
Low 69
87 92
80
Prior Month
Prior Year
Editorial ProminenceRegional Prominence Online / Viral Prominence
93
51
91
Top US
Papers
Search
Vol.
Top
Cons.
Topline
Media Rating
Segments
Global Web
Forums
9%
GroupsTop TradeWW
Papers
Top
Bus.
Global
Web
BlogsOnline
News
AsiaNorth
America
Europe
91 75
90 90 96
85
91 95
96
81 47
80 Current Month
#
#
#
Online News
109%
203%
71 -19%
93#
#
#
#
87
12-Month Rating Range
Asia
Forums
Regional Print Metrics
#
#
Europe
- Blogs
Search Volume
-
7%
1%
Top Business
Top Consumer
North America 94
-27%
19%
60South America
Segment-Level Media
Rating Metrics
YearYear 12-Month Rating RangeSegment-Level Media
Rating Metrics
2%
16%88
Close Chg.
Top Business
90
Chg.
80% Top Media Sources
Top Global Print
Top US Newspapers
WW Newspapers
96 104%
18%
0%
9%
Top Healthcare
Top Industrial
Top Services
8%
6%
Top Technology 1%
9%
96
93
94
7%
84 0%
5%
154%
Top Industry
82%
5%
-4%
Industry-Specific Media
Broadcast
55
65
75
77 94 +6 # 72 90 80 -10# 7%Top Business
21 © 2016 mediaQuant, All rights reserved. | [email protected]
North America 94 19%
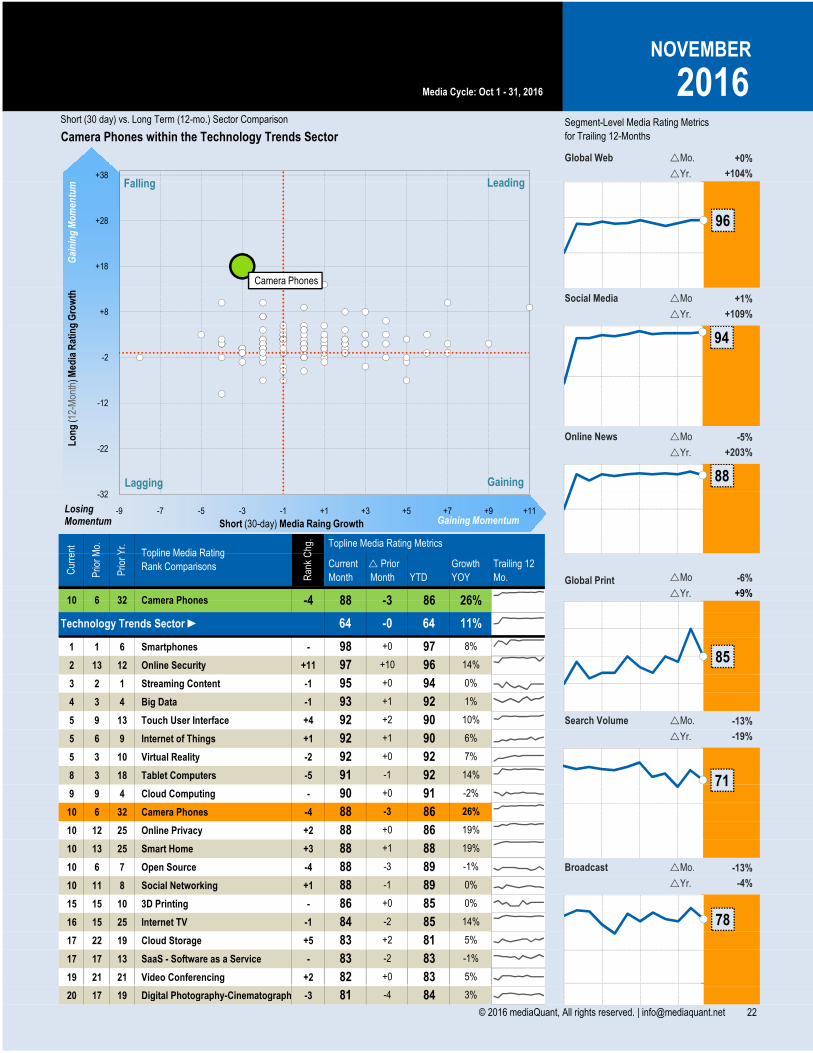
�Yr.
�Mo
+104%
+1%
Short (30 day) vs. Long Term (12-mo.) Sector Comparison
Social Media
Global Web
NOVEMBER
2016
�Yr. +203%
�Yr. +109%
�Mo -5%
�Mo. +0%
Online News
Camera Phones within the Technology Trends SectorSegment-Level Media Rating Metrics
for Trailing 12-Months
Media Cycle: Oct 1 - 31, 2016
96
94
88
Gai
nin
g M
om
entu
mL
on
g (1
2-M
onth
)Med
ia R
atin
g G
row
th
Camera Phones
-32
-22
-12
-2
+8
+18
+28
+38LeadingFalling
Lagging Gaining
1 1 6 Smartphones -
2 13 12 Online Security +11
3 2 1 Streaming Content -1
4 3 4 Big Data -1
5 9 13 Touch User Interface +4
5 6 9 Internet of Things +1
5 3 10 Virtual Reality -2
8 3 18 Tablet Computers -5
9 9 4 Cloud Computing -
10 6 32 Camera Phones -4
10 12 25 Online Privacy +2
10 13 25 Smart Home +3
10 6 7 Open Source -4
10 11 8 Social Networking +1
15 15 10 3D Printing -
16 15 25 Internet TV -1
17 22 19 Cloud Storage +5
17 17 13 SaaS - Software as a Service -
19 21 21 Video Conferencing +2
10 88
98
11%
+0
Camera Phones -46 32
Cur
rent
-3
Current
Month
� Prior
Month YTD Global Print
10%
94 0%
96 14%
97
0%
83
5%
-4%
-13%
-19%
r Yr.
26%86
Prio
r M
o.
Prio
r Y
r.
Ran
k C
hg.
Technology Trends Sector ►
Topline Media Rating
Rank Comparisons
-283
84 -2 85
�Mo.
�Yr.90
0%
26%-3 86
�Mo.
-2%
14%
-1%
92
82 +0 83 5%
-13%
�Yr.
8%
-1%
1%
6%
7%
14%
19%
19%
92
88
86 85
83 +2 81
91 -1 92
+0
89-1
-3 89
+1 88
+0 86
+0
88
91
88
�Mo -6%
�Yr. +9%
92 Search Volume
Broadcast
+2 90
90
88
+1 92
+1
92 +0
93
88
Growth
YOY
Trailing 12
Mo.
Topline Media Rating Metrics
95
64 -0 64
+0
97 +1085
71
78
Gaining MomentumLosingMomentum Short (30-day) Media Raing Growth
-32
-9 -7 -5 -3 -1 +1 +3 +5 +7 +9 +11
19 21 21 Video Conferencing +2
20 17 19 Digital Photography-Cinematography -3 84 3%-481
82 83
© 2016 mediaQuant, All rights reserved. | [email protected] 22
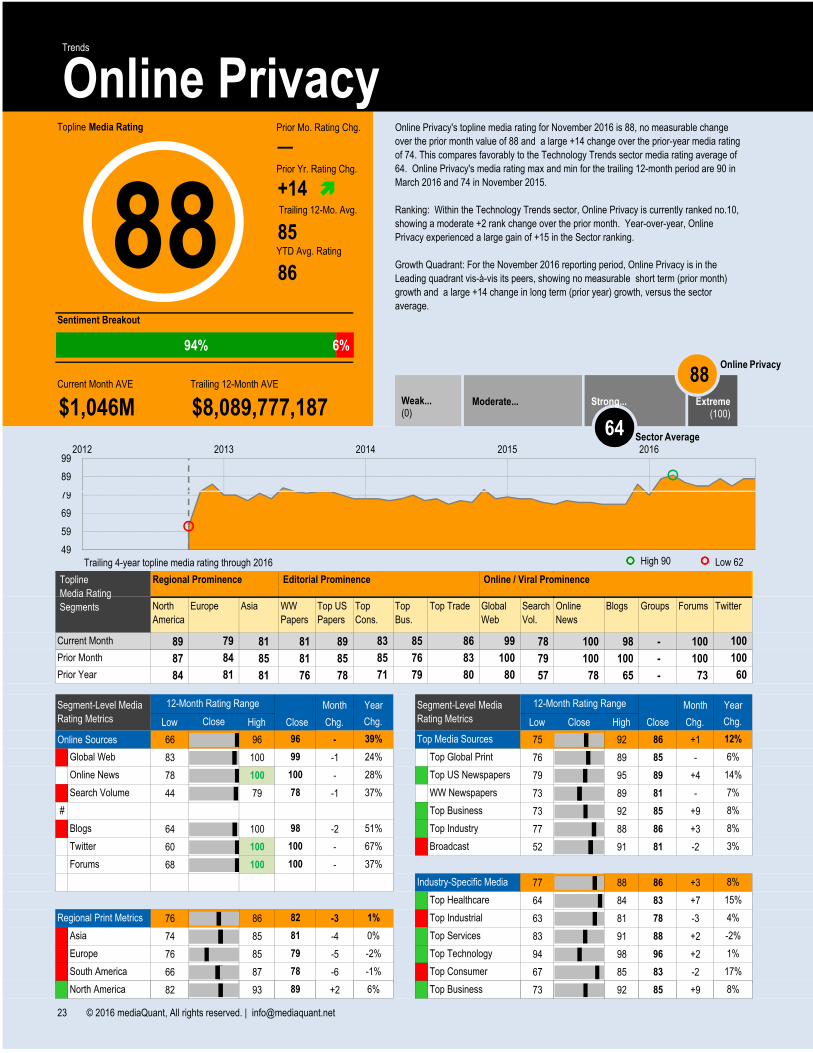
Sentiment Breakout
Online Privacy's topline media rating for November 2016 is 88, no measurable change
over the prior month value of 88 and a large +14 change over the prior-year media rating
of 74. This compares favorably to the Technology Trends sector media rating average of
64. Online Privacy's media rating max and min for the trailing 12-month period are 90 in
March 2016 and 74 in November 2015.
Ranking: Within the Technology Trends sector, Online Privacy is currently ranked no.10,
showing a moderate +2 rank change over the prior month. Year-over-year, Online
Privacy experienced a large gain of +15 in the Sector ranking.
Growth Quadrant: For the November 2016 reporting period, Online Privacy is in the
Leading quadrant vis-à-vis its peers, showing no measurable short term (prior month)
growth and a large +14 change in long term (prior year) growth, versus the sector
average.
─
85
86YTD Avg. Rating
Trailing 12-Mo. Avg.
Prior Mo. Rating Chg.
Online Privacy Trends
�
$1,046M $8,089,777,187Current Month AVE
Prior Yr. Rating Chg.
Trailing 12-Month AVE
Topline Media Rating
88+14 �
79
89
992012 2013 2014 2015 2016
94% 6%
88
Sector Average64
Online Privacy
Extreme(100)
Weak...(0)
Moderate... Strong...
Trailing 4-year topline media rating through 2016 ���� High 90 ����
89 81 81 89 78 100 98 - 100
87 85 81 85 79 100 100 - 100
84 81 76 78 57 78 65 - 73
Month Month
Low High Close Chg. Low Close High Close Chg.
Online Sources 66 96 - 75 92 86 +1
83 100 -1 - 76 89 85 -
78 100 - # 79 95 89 +4
44 79 -1 - 73 89 81 -
# 73 92 85 +9
64 100 -2 # 77 88 86 +3
60 100 - # 52 91 81 -2
68 100 -
77 88 86 +3
# 64 84 83 +7
76 86 -3 # 63 81 78 -3
74 85 -4 # 83 91 88 +2
76 85 -5 # 94 98 96 +2
66 87 -6 # 67 85 83 -2
82 93 +2 # 73 92 85 +9
Low 62
79 83
81
Prior Month
Prior Year
Editorial ProminenceRegional Prominence Online / Viral Prominence
100
60
100
Top US
Papers
Search
Vol.
Top
Cons.
Topline
Media Rating
Segments
Global Web
Forums
6%
GroupsTop TradeWW
Papers
Top
Bus.
Global
Web
BlogsOnline
News
AsiaNorth
America
Europe
71 79
76 83 100
86
84 85
99
80 80
85 Current Month
#
-
#
Online News
51%
28%
78 37%
81#
#
#
#
79
12-Month Rating Range
Asia
Forums
Regional Print Metrics
-
-
Europe
# Blogs
Search Volume
#
8%
17%
Top Business
Top Consumer
North America 89
-1%
6%
78South America
Segment-Level Media
Rating Metrics
YearYear 12-Month Rating RangeSegment-Level Media
Rating Metrics
7%
14%100
Close Chg.
Top Business
96
Chg.
39% Top Media Sources
Top Global Print
Top US Newspapers
WW Newspapers
99 24%
12%
0%
-2%
Top Healthcare
Top Industrial
Top Services
4%
15%
Top Technology 1%
-2%
98
100
100
8%
82 1%
8%
37%
Top Industry
67%
8%
3%
Industry-Specific Media
Broadcast
49
59
69
79
82 93 +2 # 73 92 85 +9# 8%Top Business
23 © 2016 mediaQuant, All rights reserved. | [email protected]
North America 89 6%
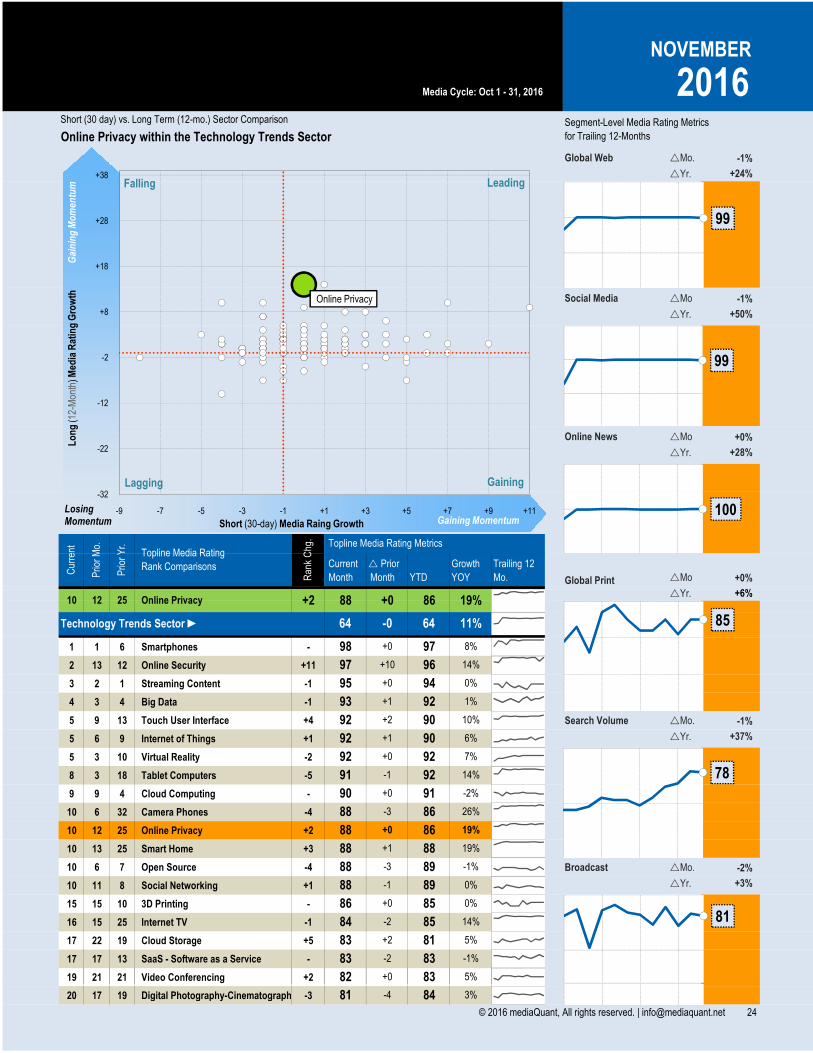
�Yr.
�Mo
+24%
-1%
Short (30 day) vs. Long Term (12-mo.) Sector Comparison
Social Media
Global Web
NOVEMBER
2016
�Yr. +28%
�Yr. +50%
�Mo +0%
�Mo. -1%
Online News
Online Privacy within the Technology Trends SectorSegment-Level Media Rating Metrics
for Trailing 12-Months
Media Cycle: Oct 1 - 31, 2016
99
99
Gai
nin
g M
om
entu
mL
on
g (1
2-M
onth
)Med
ia R
atin
g G
row
th Online Privacy
-32
-22
-12
-2
+8
+18
+28
+38LeadingFalling
Lagging Gaining
1 1 6 Smartphones -
2 13 12 Online Security +11
3 2 1 Streaming Content -1
4 3 4 Big Data -1
5 9 13 Touch User Interface +4
5 6 9 Internet of Things +1
5 3 10 Virtual Reality -2
8 3 18 Tablet Computers -5
9 9 4 Cloud Computing -
10 6 32 Camera Phones -4
10 12 25 Online Privacy +2
10 13 25 Smart Home +3
10 6 7 Open Source -4
10 11 8 Social Networking +1
15 15 10 3D Printing -
16 15 25 Internet TV -1
17 22 19 Cloud Storage +5
17 17 13 SaaS - Software as a Service -
19 21 21 Video Conferencing +2
10 88
98
11%
+0
Online Privacy +212 25
Cur
rent
+0
Current
Month
� Prior
Month YTD Global Print
10%
94 0%
96 14%
97
0%
83
5%
+3%
-1%
+37%
r Yr.
19%86
Prio
r M
o.
Prio
r Y
r.
Ran
k C
hg.
Technology Trends Sector ►
Topline Media Rating
Rank Comparisons
-283
84 -2 85
�Mo.
�Yr.90
0%
26%-3 86
�Mo.
-2%
14%
-1%
92
82 +0 83 5%
-2%
�Yr.
8%
-1%
1%
6%
7%
14%
19%
19%
92
88
86 85
83 +2 81
91 -1 92
+0
89-1
-3 89
+1 88
+0 86
+0
88
91
88
�Mo +0%
�Yr. +6%
92 Search Volume
Broadcast
+2 90
90
88
+1 92
+1
92 +0
93
88
Growth
YOY
Trailing 12
Mo.
Topline Media Rating Metrics
95
64 -0 64
+0
97 +10
100
85
78
81
Gaining MomentumLosingMomentum Short (30-day) Media Raing Growth
-32
-9 -7 -5 -3 -1 +1 +3 +5 +7 +9 +11
19 21 21 Video Conferencing +2
20 17 19 Digital Photography-Cinematography -3 84 3%-481
82 83
© 2016 mediaQuant, All rights reserved. | [email protected] 24
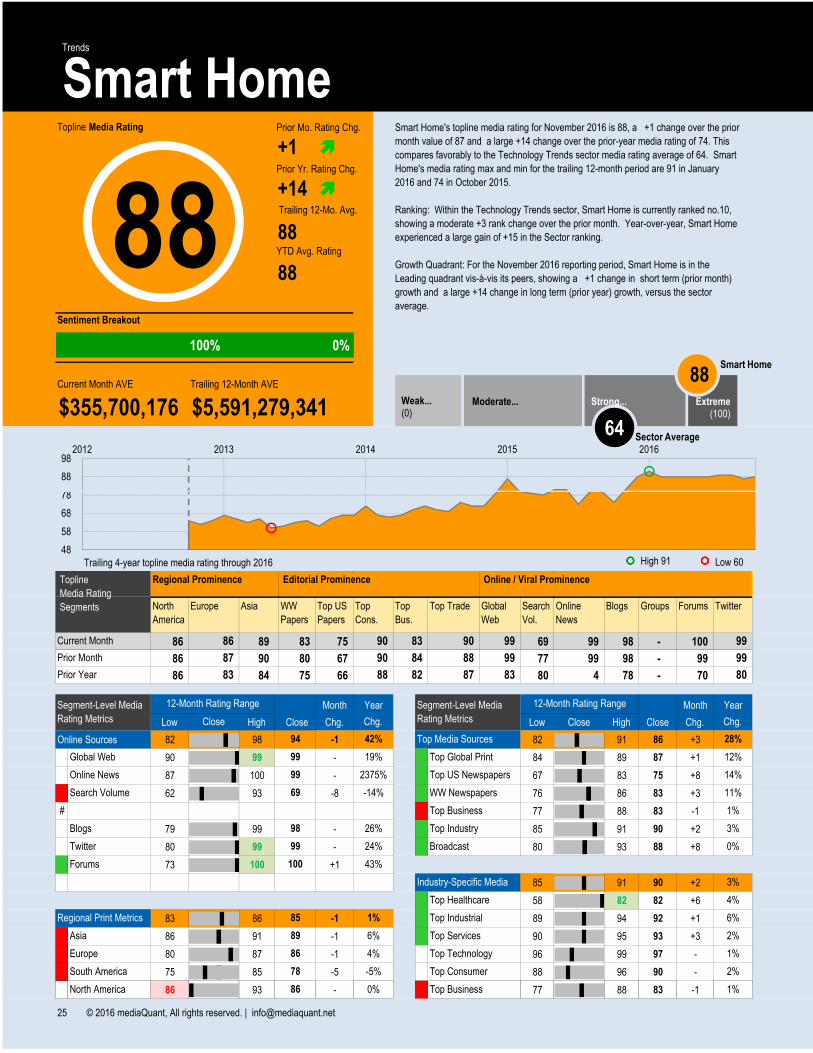
Sentiment Breakout
Smart Home's topline media rating for November 2016 is 88, a +1 change over the prior
month value of 87 and a large +14 change over the prior-year media rating of 74. This
compares favorably to the Technology Trends sector media rating average of 64. Smart
Home's media rating max and min for the trailing 12-month period are 91 in January
2016 and 74 in October 2015.
Ranking: Within the Technology Trends sector, Smart Home is currently ranked no.10,
showing a moderate +3 rank change over the prior month. Year-over-year, Smart Home
experienced a large gain of +15 in the Sector ranking.
Growth Quadrant: For the November 2016 reporting period, Smart Home is in the
Leading quadrant vis-à-vis its peers, showing a +1 change in short term (prior month)
growth and a large +14 change in long term (prior year) growth, versus the sector
average.
+1
88
88YTD Avg. Rating
Trailing 12-Mo. Avg.
Prior Mo. Rating Chg.
Smart Home Trends
�
$355,700,176 $5,591,279,341Current Month AVE
Prior Yr. Rating Chg.
Trailing 12-Month AVE
Topline Media Rating
88+14 �
78
88
982012 2013 2014 2015 2016
100% 0%
88
Sector Average64
Smart Home
Extreme(100)
Weak...(0)
Moderate... Strong...
Trailing 4-year topline media rating through 2016 ���� High 91 ����
86 89 83 75 69 99 98 - 100
86 90 80 67 77 99 98 - 99
86 84 75 66 80 4 78 - 70
Month Month
Low High Close Chg. Low Close High Close Chg.
Online Sources 82 98 -1 82 91 86 +3
90 99 - # 84 89 87 +1
87 100 - # 67 83 75 +8
62 93 -8 # 76 86 83 +3
# 77 88 83 -1
79 99 - # 85 91 90 +2
80 99 - # 80 93 88 +8
73 100 +1
85 91 90 +2
# 58 82 82 +6
83 86 -1 # 89 94 92 +1
86 91 -1 # 90 95 93 +3
80 87 -1 - 96 99 97 -
75 85 -5 - 88 96 90 -
86 93 - # 77 88 83 -1
Low 60
86 90
83
Prior Month
Prior Year
Editorial ProminenceRegional Prominence Online / Viral Prominence
99
80
99
Top US
Papers
Search
Vol.
Top
Cons.
Topline
Media Rating
Segments
Global Web
Forums
12%
GroupsTop TradeWW
Papers
Top
Bus.
Global
Web
BlogsOnline
News
AsiaNorth
America
Europe
88 82
84 88 99
90
87 90
99
87 83
83 Current Month
#
-
#
Online News
26%
2375%
69 -14%
89#
#
#
-
86
12-Month Rating Range
Asia
Forums
Regional Print Metrics
-
#
Europe
- Blogs
Search Volume
-
1%
2%
Top Business
Top Consumer
North America 86
-5%
0%
78South America
Segment-Level Media
Rating Metrics
YearYear 12-Month Rating RangeSegment-Level Media
Rating Metrics
11%
14%99
Close Chg.
Top Business
94
Chg.
42% Top Media Sources
Top Global Print
Top US Newspapers
WW Newspapers
99 19%
28%
6%
4%
Top Healthcare
Top Industrial
Top Services
6%
4%
Top Technology 1%
2%
98
99
100
1%
85 1%
3%
43%
Top Industry
24%
3%
0%
Industry-Specific Media
Broadcast
48
58
68
78
86 93 - # 77 88 83 -1- 1%Top Business
25 © 2016 mediaQuant, All rights reserved. | [email protected]
North America 86 0%
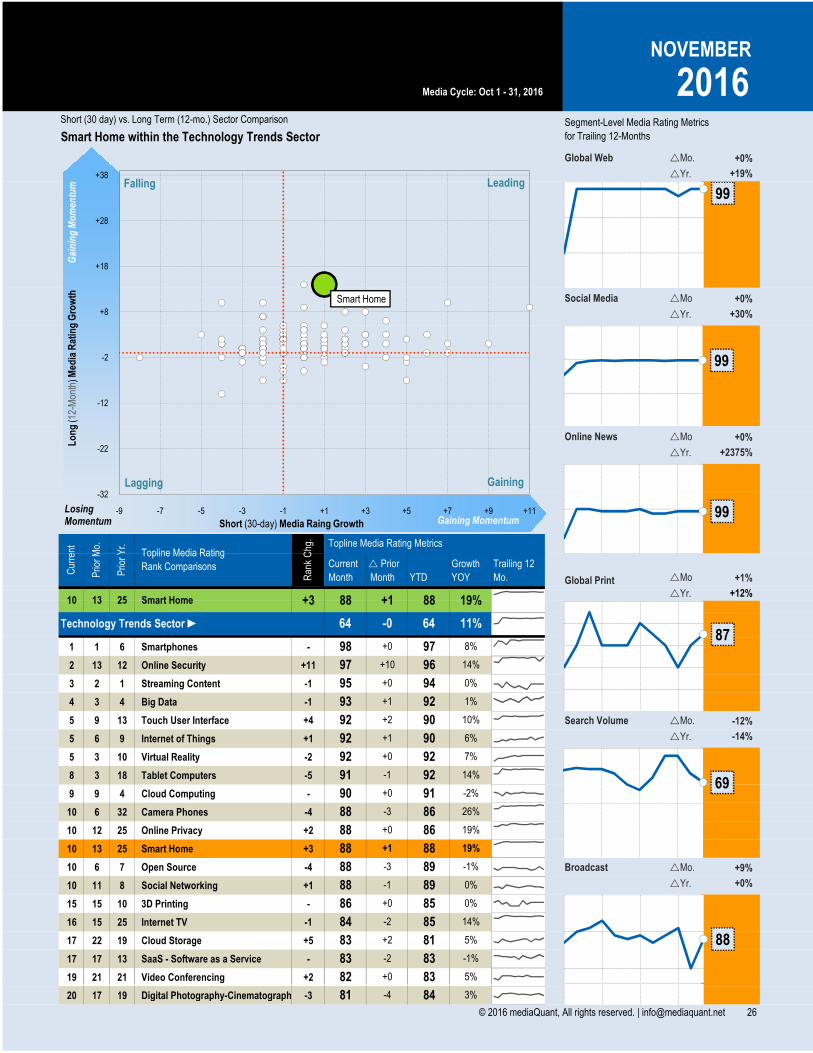
�Yr.
�Mo
+19%
+0%
Short (30 day) vs. Long Term (12-mo.) Sector Comparison
Social Media
Global Web
NOVEMBER
2016
�Yr. +2375%
�Yr. +30%
�Mo +0%
�Mo. +0%
Online News
Smart Home within the Technology Trends SectorSegment-Level Media Rating Metrics
for Trailing 12-Months
Media Cycle: Oct 1 - 31, 2016
99
99
Gai
nin
g M
om
entu
mL
on
g (1
2-M
onth
)Med
ia R
atin
g G
row
th Smart Home
-32
-22
-12
-2
+8
+18
+28
+38LeadingFalling
Lagging Gaining
1 1 6 Smartphones -
2 13 12 Online Security +11
3 2 1 Streaming Content -1
4 3 4 Big Data -1
5 9 13 Touch User Interface +4
5 6 9 Internet of Things +1
5 3 10 Virtual Reality -2
8 3 18 Tablet Computers -5
9 9 4 Cloud Computing -
10 6 32 Camera Phones -4
10 12 25 Online Privacy +2
10 13 25 Smart Home +3
10 6 7 Open Source -4
10 11 8 Social Networking +1
15 15 10 3D Printing -
16 15 25 Internet TV -1
17 22 19 Cloud Storage +5
17 17 13 SaaS - Software as a Service -
19 21 21 Video Conferencing +2
10 88
98
11%
+0
Smart Home +313 25
Cur
rent
+1
Current
Month
� Prior
Month YTD Global Print
10%
94 0%
96 14%
97
0%
83
5%
+0%
-12%
-14%
r Yr.
19%88
Prio
r M
o.
Prio
r Y
r.
Ran
k C
hg.
Technology Trends Sector ►
Topline Media Rating
Rank Comparisons
-283
84 -2 85
�Mo.
�Yr.90
0%
26%-3 86
�Mo.
-2%
14%
-1%
92
82 +0 83 5%
+9%
�Yr.
8%
-1%
1%
6%
7%
14%
19%
19%
92
88
86 85
83 +2 81
91 -1 92
+0
89-1
-3 89
+1 88
+0 86
+0
88
91
88
�Mo +1%
�Yr. +12%
92 Search Volume
Broadcast
+2 90
90
88
+1 92
+1
92 +0
93
88
Growth
YOY
Trailing 12
Mo.
Topline Media Rating Metrics
95
64 -0 64
+0
97 +10
99
87
69
88
Gaining MomentumLosingMomentum Short (30-day) Media Raing Growth
-32
-9 -7 -5 -3 -1 +1 +3 +5 +7 +9 +11
19 21 21 Video Conferencing +2
20 17 19 Digital Photography-Cinematography -3 84 3%-481
82 83
© 2016 mediaQuant, All rights reserved. | [email protected] 26

Sentiment Breakout
Open Source's topline media rating for November 2016 is 88, a moderate -3 change over
the prior month value of 91 and a -1 change over the prior-year media rating of 89. This
compares favorably to the Technology Trends sector media rating average of 64. Open
Source's media rating max and min for the trailing 12-month period are 91 in September
2016 and 87 in July 2016.
Ranking: Within the Technology Trends sector, Open Source is currently ranked no.10,
showing a moderate -4 rank change over the prior month. Year-over-year, Open Source
experienced a moderate loss of -3 in the Sector ranking.
Growth Quadrant: For the November 2016 reporting period, Open Source is in the
Lagging quadrant vis-à-vis its peers, showing a moderate -3 change in short term (prior
month) growth and a -1 change in long term (prior year) growth, versus the sector
average.
-3
89
89YTD Avg. Rating
Trailing 12-Mo. Avg.
Prior Mo. Rating Chg.
Open Source Trends
�
$646,290,147 $7,013,235,990Current Month AVE
Prior Yr. Rating Chg.
Trailing 12-Month AVE
Topline Media Rating
88-1 �
91
1012012 2013 2014 2015 2016
88% 13%
88
Sector Average64
Open Source
Extreme(100)
Weak...(0)
Moderate... Strong...
Trailing 4-year topline media rating through 2016 ���� High 91 ����
88 91 76 63 94 99 99 - 100
88 92 79 76 95 99 99 - 100
88 90 78 89 89 90 92 - 95
Month Month
Low High Close Chg. Low Close High Close Chg.
Online Sources 93 98 - 81 89 81 -6
93 99 - # 85 89 86 -3
90 100 - # 63 89 63 -13
87 96 -1 # 75 82 76 -3
# 78 90 85 -5
91 100 - # 86 92 89 -3
96 97 - # 83 91 83 -5
97 100 -
86 92 89 -3
# 79 90 84 -5
84 89 -3 - 85 94 90 -
88 92 -1 # 93 96 95 -1
82 89 -2 # 97 98 97 -1
72 89 -10 # 74 88 82 -6
87 89 - # 78 90 85 -5
Low 77
87 82
85
Prior Month
Prior Year
Editorial ProminenceRegional Prominence Online / Viral Prominence
97
96
97
Top US
Papers
Search
Vol.
Top
Cons.
Topline
Media Rating
Segments
Global Web
Forums
-2%
GroupsTop TradeWW
Papers
Top
Bus.
Global
Web
BlogsOnline
News
AsiaNorth
America
Europe
87 87
90 92 99
89
89 88
99
89 95
85 Current Month
#
-
#
Online News
8%
10%
94 6%
91#
#
#
-
87
12-Month Rating Range
Asia
Forums
Regional Print Metrics
-
-
Europe
- Blogs
Search Volume
-
-2%
-6%
Top Business
Top Consumer
North America 88
-8%
0%
78South America
Segment-Level Media
Rating Metrics
YearYear 12-Month Rating RangeSegment-Level Media
Rating Metrics
-3%
-29%99
Close Chg.
Top Business
98
Chg.
5% Top Media Sources
Top Global Print
Top US Newspapers
WW Newspapers
99 4%
-7%
1%
2%
Top Healthcare
Top Industrial
Top Services
1%
5%
Top Technology -1%
0%
99
97
100
-2%
86 -1%
0%
5%
Top Industry
1%
0%
-8%
Industry-Specific Media
Broadcast
61
71
81
87 89 - # 78 90 85 -5- -2%Top Business
27 © 2016 mediaQuant, All rights reserved. | [email protected]
North America 88 0%
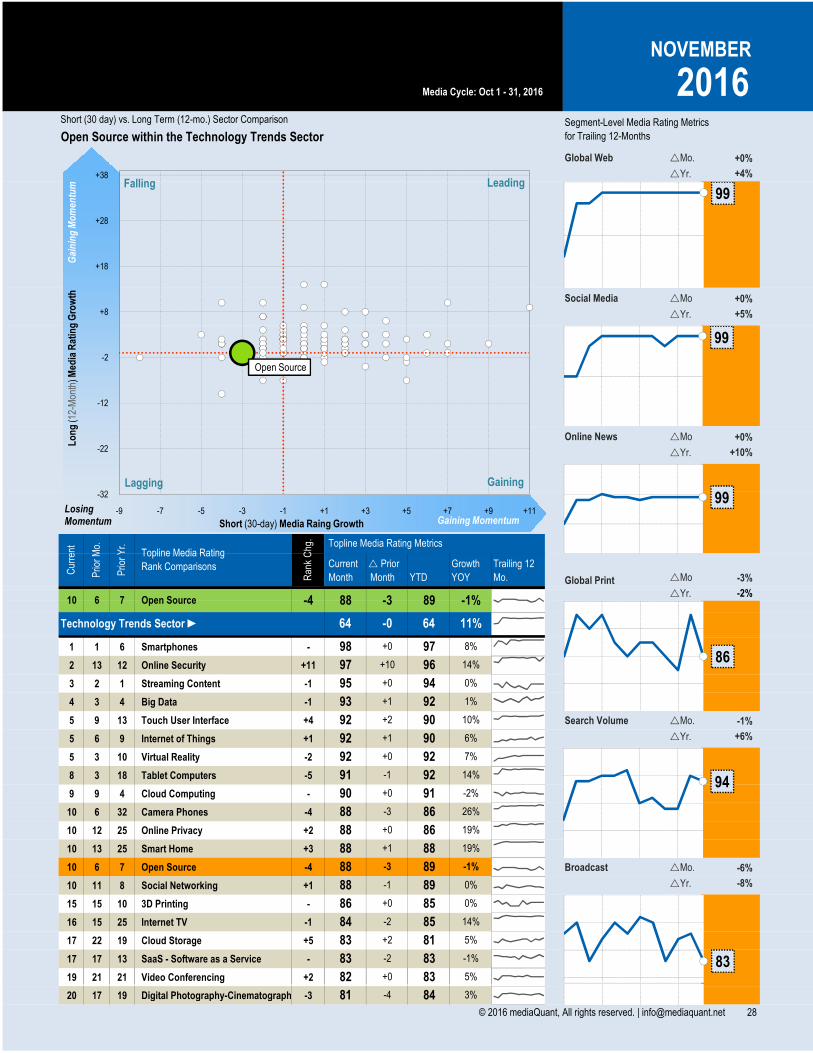
�Yr.
�Mo
+4%
+0%
Short (30 day) vs. Long Term (12-mo.) Sector Comparison
Social Media
Global Web
NOVEMBER
2016
�Yr. +10%
�Yr. +5%
�Mo +0%
�Mo. +0%
Online News
Open Source within the Technology Trends SectorSegment-Level Media Rating Metrics
for Trailing 12-Months
Media Cycle: Oct 1 - 31, 2016
99
99
99
Gai
nin
g M
om
entu
mL
on
g (1
2-M
onth
)Med
ia R
atin
g G
row
th
Open Source
-32
-22
-12
-2
+8
+18
+28
+38LeadingFalling
Lagging Gaining
1 1 6 Smartphones -
2 13 12 Online Security +11
3 2 1 Streaming Content -1
4 3 4 Big Data -1
5 9 13 Touch User Interface +4
5 6 9 Internet of Things +1
5 3 10 Virtual Reality -2
8 3 18 Tablet Computers -5
9 9 4 Cloud Computing -
10 6 32 Camera Phones -4
10 12 25 Online Privacy +2
10 13 25 Smart Home +3
10 6 7 Open Source -4
10 11 8 Social Networking +1
15 15 10 3D Printing -
16 15 25 Internet TV -1
17 22 19 Cloud Storage +5
17 17 13 SaaS - Software as a Service -
19 21 21 Video Conferencing +2
10 88
98
11%
+0
Open Source -46 7
Cur
rent
-3
Current
Month
� Prior
Month YTD Global Print
10%
94 0%
96 14%
97
0%
83
5%
-8%
-1%
+6%
r Yr.
-1%89
Prio
r M
o.
Prio
r Y
r.
Ran
k C
hg.
Technology Trends Sector ►
Topline Media Rating
Rank Comparisons
-283
84 -2 85
�Mo.
�Yr.90
0%
26%-3 86
�Mo.
-2%
14%
-1%
92
82 +0 83 5%
-6%
�Yr.
8%
-1%
1%
6%
7%
14%
19%
19%
92
88
86 85
83 +2 81
91 -1 92
+0
89-1
-3 89
+1 88
+0 86
+0
88
91
88
�Mo -3%
�Yr. -2%
92 Search Volume
Broadcast
+2 90
90
88
+1 92
+1
92 +0
93
88
Growth
YOY
Trailing 12
Mo.
Topline Media Rating Metrics
95
64 -0 64
+0
97 +10
99
86
94
83
Gaining MomentumLosingMomentum Short (30-day) Media Raing Growth
-32
-9 -7 -5 -3 -1 +1 +3 +5 +7 +9 +11
19 21 21 Video Conferencing +2
20 17 19 Digital Photography-Cinematography -3 84 3%-481
82 83
© 2016 mediaQuant, All rights reserved. | [email protected] 28

Sentiment Breakout
Social Networking's topline media rating for November 2016 is 88, a -1 change over the
prior month value of 89 and no measurable change over the prior-year media rating of
88. This compares favorably to the Technology Trends sector media rating average of
64. Social Networking's media rating max and min for the trailing 12-month period are 91
in January 2016 and 87 in December 2015.
Ranking: Within the Technology Trends sector, Social Networking is currently ranked
no.10, showing a negligible +1 rank change over the prior month. Year-over-year, Social
Networking experienced a moderate loss of -2 in the Sector ranking.
Growth Quadrant: For the November 2016 reporting period, Social Networking is in the
Lagging quadrant vis-à-vis its peers, showing a -1 change in short term (prior month)
growth and no measurable long term (prior year) growth, versus the sector average.
-1
89
89YTD Avg. Rating
Trailing 12-Mo. Avg.
Prior Mo. Rating Chg.
Social Networking Trends
�
$31,065,441 $450,328,747Current Month AVE
Prior Yr. Rating Chg.
Trailing 12-Month AVE
Topline Media Rating
88+0 �
88
93
982012 2013 2014 2015 2016
92% 8%
88
Sector Average64
Social Networking
Extreme(100)
Weak...(0)
Moderate... Strong...
Trailing 4-year topline media rating through 2016 ���� High 95 ����
85 94 90 83 99 87 97 - 93
86 94 90 81 99 90 97 - 93
87 95 93 84 100 93 91 - 86
Month Month
Low High Close Chg. Low Close High Close Chg.
Online Sources 88 95 - 84 89 84 -2
91 96 +2 # 85 89 86 -1
87 94 -3 # 74 89 83 +2
98 100 - - 90 94 90 -
# 81 91 82 -2
66 99 - # 84 89 86 -1
82 90 -1 # 72 85 74 -11
87 95 -
84 89 86 -1
# 70 85 78 -3
88 91 +1 - 78 87 84 -
94 96 - # 88 95 89 -2
86 91 -1 # 97 99 97 -1
81 94 +3 # 80 88 88 +3
85 90 -1 # 81 91 82 -2
Low 86
87 88
88
Prior Month
Prior Year
Editorial ProminenceRegional Prominence Online / Viral Prominence
87
82
88
Top US
Papers
Search
Vol.
Top
Cons.
Topline
Media Rating
Segments
Global Web
Forums
-1%
GroupsTop TradeWW
Papers
Top
Bus.
Global
Web
BlogsOnline
News
AsiaNorth
America
Europe
87 78
84 87 93
86
88 85
95
86 93
82 Current Month
#
#
-
Online News
7%
-6%
99 -1%
94-
#
#
#
87
12-Month Rating Range
Asia
Forums
Regional Print Metrics
#
-
Europe
- Blogs
Search Volume
#
5%
1%
Top Business
Top Consumer
North America 85
6%
-2%
89South America
Segment-Level Media
Rating Metrics
YearYear 12-Month Rating RangeSegment-Level Media
Rating Metrics
-3%
-1%87
Close Chg.
Top Business
93
Chg.
2% Top Media Sources
Top Global Print
Top US Newspapers
WW Newspapers
95 2%
-2%
-1%
-1%
Top Healthcare
Top Industrial
Top Services
0%
-5%
Top Technology -1%
1%
97
87
93
5%
89 1%
0%
8%
Top Industry
6%
0%
-11%
Industry-Specific Media
Broadcast
68
73
78
83
88
85 90 -1 # 81 91 82 -2# 5%Top Business
29 © 2016 mediaQuant, All rights reserved. | [email protected]
North America 85 -2%
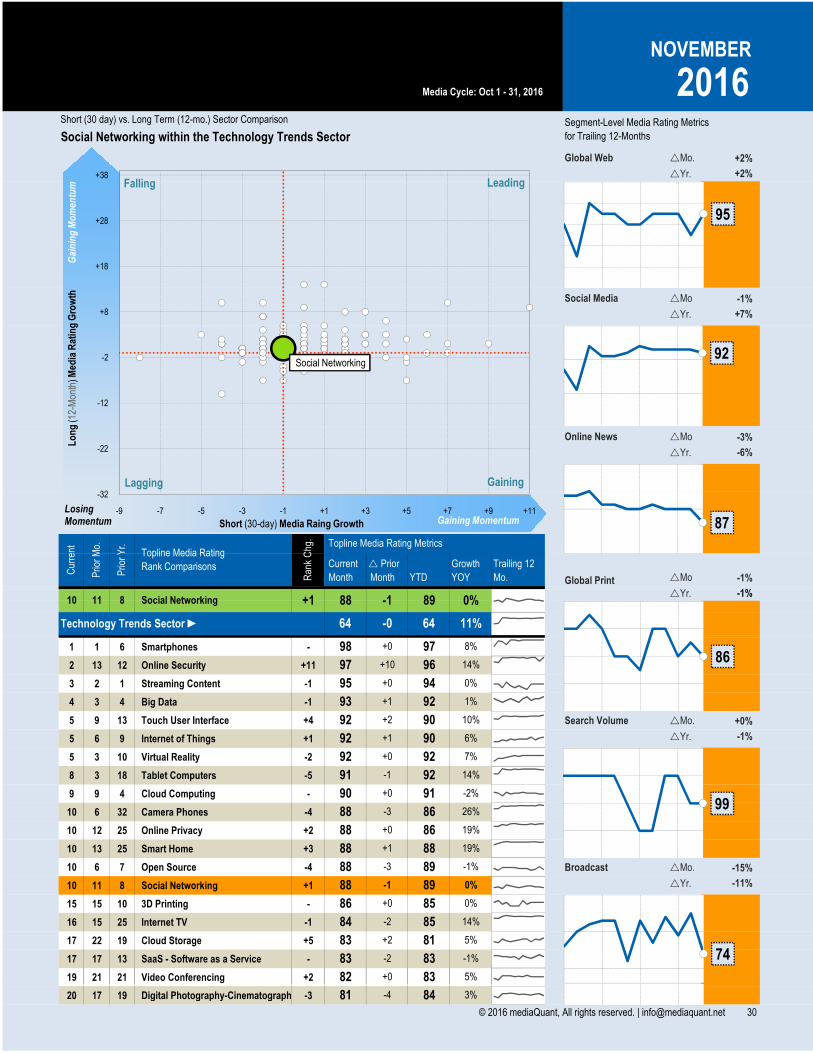
�Yr.
�Mo
+2%
-1%
Short (30 day) vs. Long Term (12-mo.) Sector Comparison
Social Media
Global Web
NOVEMBER
2016
�Yr. -6%
�Yr. +7%
�Mo -3%
�Mo. +2%
Online News
Social Networking within the Technology Trends SectorSegment-Level Media Rating Metrics
for Trailing 12-Months
Media Cycle: Oct 1 - 31, 2016
95
92
Gai
nin
g M
om
entu
mL
on
g (1
2-M
onth
)Med
ia R
atin
g G
row
th
Social Networking
-32
-22
-12
-2
+8
+18
+28
+38LeadingFalling
Lagging Gaining
1 1 6 Smartphones -
2 13 12 Online Security +11
3 2 1 Streaming Content -1
4 3 4 Big Data -1
5 9 13 Touch User Interface +4
5 6 9 Internet of Things +1
5 3 10 Virtual Reality -2
8 3 18 Tablet Computers -5
9 9 4 Cloud Computing -
10 6 32 Camera Phones -4
10 12 25 Online Privacy +2
10 13 25 Smart Home +3
10 6 7 Open Source -4
10 11 8 Social Networking +1
15 15 10 3D Printing -
16 15 25 Internet TV -1
17 22 19 Cloud Storage +5
17 17 13 SaaS - Software as a Service -
19 21 21 Video Conferencing +2
10 88
98
11%
+0
Social Networking +111 8
Cur
rent
-1
Current
Month
� Prior
Month YTD Global Print
10%
94 0%
96 14%
97
0%
83
5%
-11%
+0%
-1%
r Yr.
0%89
Prio
r M
o.
Prio
r Y
r.
Ran
k C
hg.
Technology Trends Sector ►
Topline Media Rating
Rank Comparisons
-283
84 -2 85
�Mo.
�Yr.90
0%
26%-3 86
�Mo.
-2%
14%
-1%
92
82 +0 83 5%
-15%
�Yr.
8%
-1%
1%
6%
7%
14%
19%
19%
92
88
86 85
83 +2 81
91 -1 92
+0
89-1
-3 89
+1 88
+0 86
+0
88
91
88
�Mo -1%
�Yr. -1%
92 Search Volume
Broadcast
+2 90
90
88
+1 92
+1
92 +0
93
88
Growth
YOY
Trailing 12
Mo.
Topline Media Rating Metrics
95
64 -0 64
+0
97 +10
87
86
99
74
Gaining MomentumLosingMomentum Short (30-day) Media Raing Growth
-32
-9 -7 -5 -3 -1 +1 +3 +5 +7 +9 +11
19 21 21 Video Conferencing +2
20 17 19 Digital Photography-Cinematography -3 84 3%-481
82 83
© 2016 mediaQuant, All rights reserved. | [email protected] 30
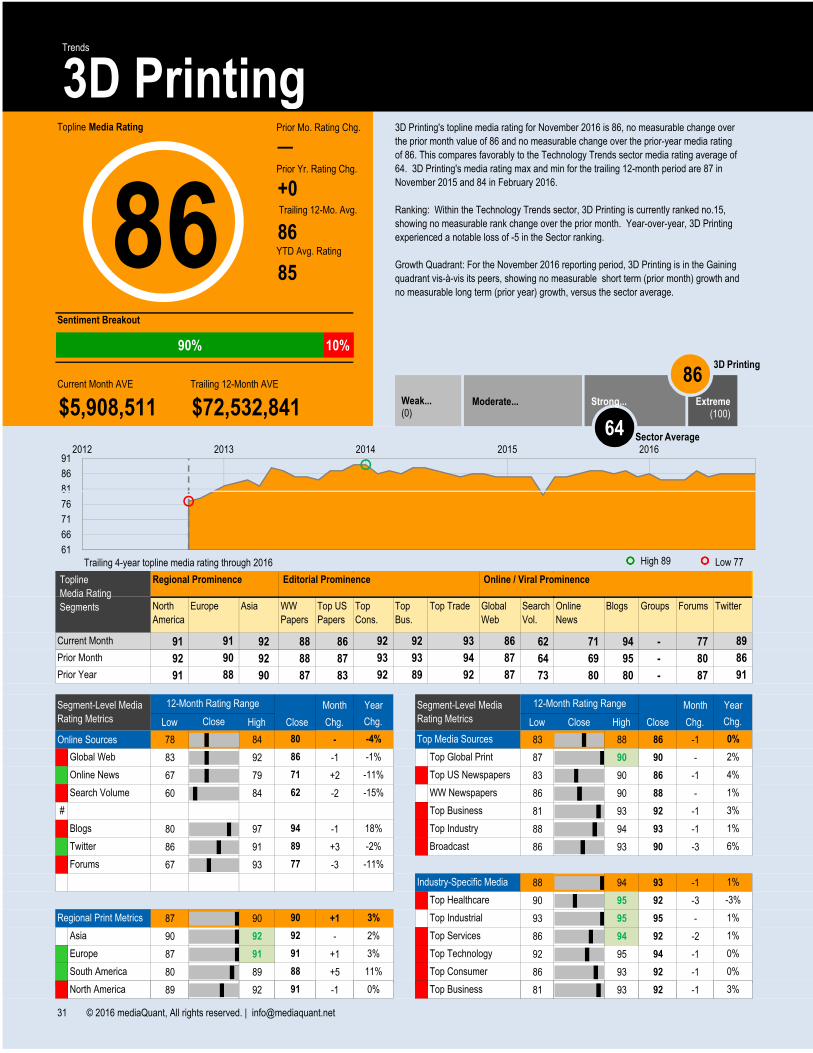
Sentiment Breakout
3D Printing's topline media rating for November 2016 is 86, no measurable change over
the prior month value of 86 and no measurable change over the prior-year media rating
of 86. This compares favorably to the Technology Trends sector media rating average of
64. 3D Printing's media rating max and min for the trailing 12-month period are 87 in
November 2015 and 84 in February 2016.
Ranking: Within the Technology Trends sector, 3D Printing is currently ranked no.15,
showing no measurable rank change over the prior month. Year-over-year, 3D Printing
experienced a notable loss of -5 in the Sector ranking.
Growth Quadrant: For the November 2016 reporting period, 3D Printing is in the Gaining
quadrant vis-à-vis its peers, showing no measurable short term (prior month) growth and
no measurable long term (prior year) growth, versus the sector average.
─
86
85YTD Avg. Rating
Trailing 12-Mo. Avg.
Prior Mo. Rating Chg.
3D Printing Trends
�
$5,908,511 $72,532,841Current Month AVE
Prior Yr. Rating Chg.
Trailing 12-Month AVE
Topline Media Rating
86+0 �
81
86
912012 2013 2014 2015 2016
90% 10%
86
Sector Average64
3D Printing
Extreme(100)
Weak...(0)
Moderate... Strong...
Trailing 4-year topline media rating through 2016 ���� High 89 ����
91 92 88 86 62 71 94 - 77
92 92 88 87 64 69 95 - 80
91 90 87 83 73 80 80 - 87
Month Month
Low High Close Chg. Low Close High Close Chg.
Online Sources 78 84 - 83 88 86 -1
83 92 -1 - 87 90 90 -
67 79 +2 # 83 90 86 -1
60 84 -2 - 86 90 88 -
# 81 93 92 -1
80 97 -1 # 88 94 93 -1
86 91 +3 # 86 93 90 -3
67 93 -3
88 94 93 -1
# 90 95 92 -3
87 90 +1 - 93 95 95 -
90 92 - # 86 94 92 -2
87 91 +1 # 92 95 94 -1
80 89 +5 # 86 93 92 -1
89 92 -1 # 81 93 92 -1
Low 77
91 92
88
Prior Month
Prior Year
Editorial ProminenceRegional Prominence Online / Viral Prominence
89
91
86
Top US
Papers
Search
Vol.
Top
Cons.
Topline
Media Rating
Segments
Global Web
Forums
2%
GroupsTop TradeWW
Papers
Top
Bus.
Global
Web
BlogsOnline
News
AsiaNorth
America
Europe
92 89
93 94 87
93
90 93
86
92 87
92 Current Month
#
#
#
Online News
18%
-11%
62 -15%
92-
#
#
#
91
12-Month Rating Range
Asia
Forums
Regional Print Metrics
#
#
Europe
# Blogs
Search Volume
#
3%
0%
Top Business
Top Consumer
North America 91
11%
0%
88South America
Segment-Level Media
Rating Metrics
YearYear 12-Month Rating RangeSegment-Level Media
Rating Metrics
1%
4%71
Close Chg.
Top Business
80
Chg.
-4% Top Media Sources
Top Global Print
Top US Newspapers
WW Newspapers
86 -1%
0%
2%
3%
Top Healthcare
Top Industrial
Top Services
1%
-3%
Top Technology 0%
1%
94
89
77
3%
90 3%
1%
-11%
Top Industry
-2%
1%
6%
Industry-Specific Media
Broadcast
61
66
71
76
81
89 92 -1 # 81 93 92 -1# 3%Top Business
31 © 2016 mediaQuant, All rights reserved. | [email protected]
North America 91 0%

�Yr.
�Mo
-1%
+0%
Short (30 day) vs. Long Term (12-mo.) Sector Comparison
Social Media
Global Web
NOVEMBER
2016
�Yr. -11%
�Yr. +1%
�Mo +3%
�Mo. -1%
Online News
3D Printing within the Technology Trends SectorSegment-Level Media Rating Metrics
for Trailing 12-Months
Media Cycle: Oct 1 - 31, 2016
86
87
Gai
nin
g M
om
entu
mL
on
g (1
2-M
onth
)Med
ia R
atin
g G
row
th
3D Printing
-32
-22
-12
-2
+8
+18
+28
+38LeadingFalling
Lagging Gaining
1 1 6 Smartphones -
2 13 12 Online Security +11
3 2 1 Streaming Content -1
4 3 4 Big Data -1
5 9 13 Touch User Interface +4
5 6 9 Internet of Things +1
5 3 10 Virtual Reality -2
8 3 18 Tablet Computers -5
9 9 4 Cloud Computing -
10 6 32 Camera Phones -4
10 12 25 Online Privacy +2
10 13 25 Smart Home +3
10 6 7 Open Source -4
10 11 8 Social Networking +1
15 15 10 3D Printing -
16 15 25 Internet TV -1
17 22 19 Cloud Storage +5
17 17 13 SaaS - Software as a Service -
19 21 21 Video Conferencing +2
15 86
98
11%
+0
3D Printing +015 10
Cur
rent
+0
Current
Month
� Prior
Month YTD Global Print
10%
94 0%
96 14%
97
0%
83
5%
+6%
-3%
-15%
r Yr.
0%85
Prio
r M
o.
Prio
r Y
r.
Ran
k C
hg.
Technology Trends Sector ►
Topline Media Rating
Rank Comparisons
-283
84 -2 85
�Mo.
�Yr.90
0%
26%-3 86
�Mo.
-2%
14%
-1%
92
82 +0 83 5%
-3%
�Yr.
8%
-1%
1%
6%
7%
14%
19%
19%
92
88
86 85
83 +2 81
91 -1 92
+0
89-1
-3 89
+1 88
+0 86
+0
88
91
88
�Mo +0%
�Yr. +2%
92 Search Volume
Broadcast
+2 90
90
88
+1 92
+1
92 +0
93
88
Growth
YOY
Trailing 12
Mo.
Topline Media Rating Metrics
95
64 -0 64
+0
97 +10
71
90
62
90
Gaining MomentumLosingMomentum Short (30-day) Media Raing Growth
-32
-9 -7 -5 -3 -1 +1 +3 +5 +7 +9 +11
19 21 21 Video Conferencing +2
20 17 19 Digital Photography-Cinematography -3 84 3%-481
82 83
© 2016 mediaQuant, All rights reserved. | [email protected] 32

The What, Why and How of mediaQuant’s Measurement Methodology
Question Answer
What are you measuring? The media prominence of a trend, brand or influencer.
Embracing the universal management adage that "you can't manage what you can't measure," the goal of
mediaQuant is to provide a simple, universal measurement of a topic's prominence in traditional, online, and social
media and provide valuable insight into the brands, trends and influencers affecting businesses and markets.
Why are you measuring? To create a universal standard or "ruler" of media prominence with which business professionals can establish
benchmarks, make comparisons, monitor change, and assign value.
Our overriding goal at mediaQuant is to deliver an expansive, consistent and comparable measure of media
prominence for a growing catalog of topics discussed in traditional, online, and social media. Why we measure in the
way we do is to address the need to simplify and standardize media measurement, making it easy to understand,
portable and affordable.
In our varied experience doing market and media research, a pervasive drawback to available media measurement
solutions has been the lack of comparative or contextual analysis capabilities. That is, the ability to assign relative
importance to a given measurement. How high is high? How significant is it? Is it weak or strong compared to its peer
group? With a plethora of media measurement solutions on the market, not to mention countless in-house solutions,
there are hundreds of incompatible ways to measure media prominence. You can’t determine "how good is good"
without a standard ruler of measurement that can be consistently applied across media sources, time periods and
intended audiences.
How are you measuring? We apply the same proven methodology to a vast catalog of current, new and emerging topics discussed in traditional,
online, and social media segments to build a multi-year analytic history and establish comparative ranks on a 100-
point scale.
Because we measure, validate, and index the broadest and most diverse collection of global content and media
sources using a consistent methodology, we are able to create an expansive and statistically representative data set
of media prominence with historical context going back four years. From this data set, we then calculate a media
prominence score between 0 and 100 using a ranking algorithm to transform a raw value into a comparative score.
When new topics or new media sources are added to the catalog, historical values are recalibrated to correctly
account for past historical impact on existing topics.
Over what timeframe is the
media prominence measured?
Calendar month. Historical data is captured back to a trailing 4-year period.
12AM U.S. Eastern time on the first day of the month to 12AM U.S. Eastern Time on the last day of the month.
How do you calculate and
represent media prominence?
We calculate media prominence by measuring the volume of media mentions of a selected topic, assessing the
relative importance of those mentions, and then ranking the weighted value relative to other values in our data set.
The resulting media rating serves as a standard and comparative benchmark of the broad discussion of and relative
interest in trends, brands and influencers discussed in print, broadcast and online media.
A topic's media prominence rating is a statistical rank relative to the other values in the data set and is represented as
a whole number between 0 and 100. This ranked score tells us what percentage of data values scored at or below the
data value under consideration. This is typically how standardized test scores are demonstrated.
For each measured topic, we calculate a topline media rating to provide the best overall measure of media
prominence, as well as individual segment-level media ratings to provide specific context and granularity. We'll
elaborate first on the segment-level media rating, since the weighted average of 15 of the 20+ segment-level ratings
are used to calculate the topline media rating.
The segment-level media rating for a topic is the rank of the topic's mention volume within a particular media
segment (e.g., blogs) relative to all the other (3,500+) measured topics' mention volumes within that same segment.
We measure and report on segment-level media ratings for more than 20 media segments culled from more than
20,000 news sources. (see next page).
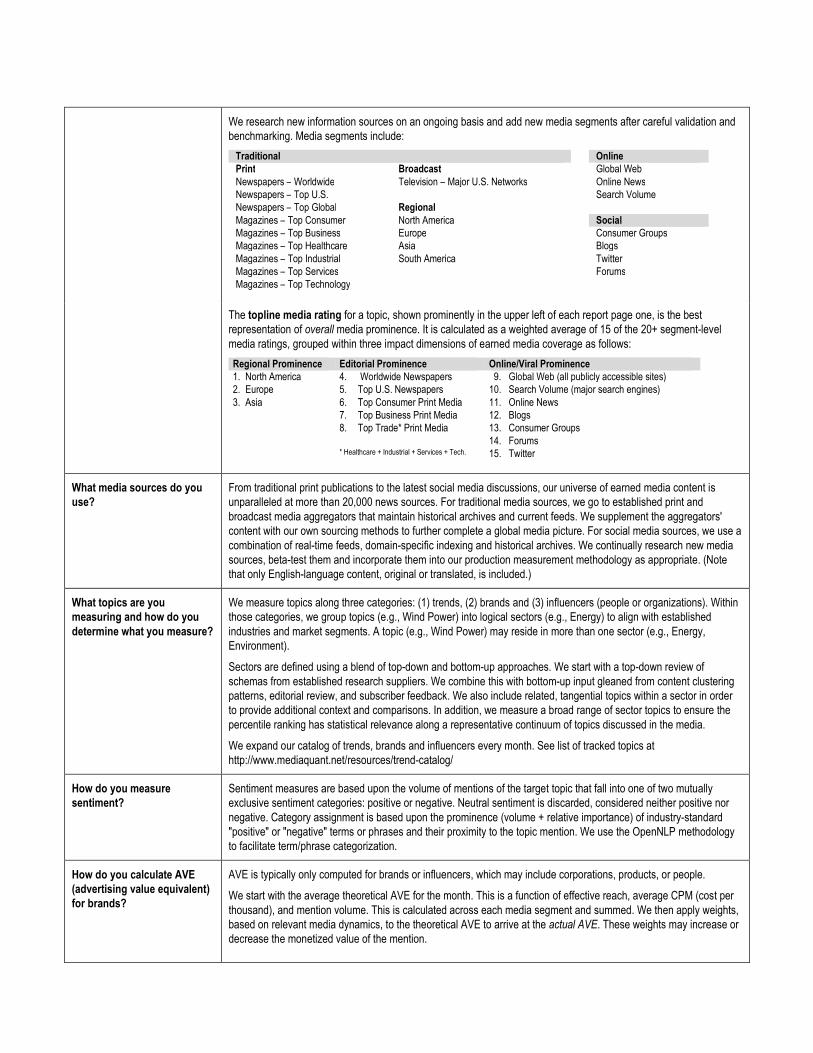
We research new information sources on an ongoing basis and add new media segments after careful validation and
benchmarking. Media segments include:
Traditional Online
Print Broadcast Global Web
Newspapers – Worldwide Television – Major U.S. Networks Online News
Newspapers – Top U.S. Search Volume
Newspapers – Top Global Regional
Magazines – Top Consumer North America Social
Magazines – Top Business Europe Consumer Groups
Magazines – Top Healthcare Asia Blogs
Magazines – Top Industrial South America Twitter
Magazines – Top Services Forums
Magazines – Top Technology
The topline media rating for a topic, shown prominently in the upper left of each report page one, is the best
representation of overall media prominence. It is calculated as a weighted average of 15 of the 20+ segment-level
media ratings, grouped within three impact dimensions of earned media coverage as follows:
Regional Prominence Editorial Prominence Online/Viral Prominence
1. North America
2. Europe
3. Asia
4. Worldwide Newspapers
5. Top U.S. Newspapers
6. Top Consumer Print Media
7. Top Business Print Media
8. Top Trade* Print Media
* Healthcare + Industrial + Services + Tech.
9. Global Web (all publicly accessible sites)
10. Search Volume (major search engines)
11. Online News
12. Blogs
13. Consumer Groups
14. Forums
15. Twitter
What media sources do you
use?
From traditional print publications to the latest social media discussions, our universe of earned media content is
unparalleled at more than 20,000 news sources. For traditional media sources, we go to established print and
broadcast media aggregators that maintain historical archives and current feeds. We supplement the aggregators'
content with our own sourcing methods to further complete a global media picture. For social media sources, we use a
combination of real-time feeds, domain-specific indexing and historical archives. We continually research new media
sources, beta-test them and incorporate them into our production measurement methodology as appropriate. (Note
that only English-language content, original or translated, is included.)
What topics are you
measuring and how do you
determine what you measure?
We measure topics along three categories: (1) trends, (2) brands and (3) influencers (people or organizations). Within
those categories, we group topics (e.g., Wind Power) into logical sectors (e.g., Energy) to align with established
industries and market segments. A topic (e.g., Wind Power) may reside in more than one sector (e.g., Energy,
Environment).
Sectors are defined using a blend of top-down and bottom-up approaches. We start with a top-down review of
schemas from established research suppliers. We combine this with bottom-up input gleaned from content clustering
patterns, editorial review, and subscriber feedback. We also include related, tangential topics within a sector in order
to provide additional context and comparisons. In addition, we measure a broad range of sector topics to ensure the
percentile ranking has statistical relevance along a representative continuum of topics discussed in the media.
We expand our catalog of trends, brands and influencers every month. See list of tracked topics at
http://www.mediaquant.net/resources/trend-catalog/
How do you measure
sentiment?
Sentiment measures are based upon the volume of mentions of the target topic that fall into one of two mutually
exclusive sentiment categories: positive or negative. Neutral sentiment is discarded, considered neither positive nor
negative. Category assignment is based upon the prominence (volume + relative importance) of industry-standard
"positive" or "negative" terms or phrases and their proximity to the topic mention. We use the OpenNLP methodology
to facilitate term/phrase categorization.
How do you calculate AVE
(advertising value equivalent)
for brands?
AVE is typically only computed for brands or influencers, which may include corporations, products, or people.
We start with the average theoretical AVE for the month. This is a function of effective reach, average CPM (cost per
thousand), and mention volume. This is calculated across each media segment and summed. We then apply weights,
based on relevant media dynamics, to the theoretical AVE to arrive at the actual AVE. These weights may increase or
decrease the monetized value of the mention.

© Copyright 2016 mediaQuant, [email protected]
uant© Copyright 2016 mediaQuant, [email protected]
Technology Trends
mediaQThe numbers behind the [email protected] numbers behind the news