mediobanca credit profile
TRANSCRIPT

MEDIOBANCA
CREDIT PROFILE
February 2022

AGENDA
1. MB Group profile
2. 1H22 Results
3. Funding & Treasury
3.1 Funding: structure & evolution
3.2 Treasury: structure & evolution
Annex
1. ESG profile
2. 12m figures as at June 21

3
CIB
42%
WM
11%
Consumer
25%
Other
22%
RWAs1
MEDIOBANCA AT A GLANCE
Revenues: €2.6bn
Net profit: €808m
ROTE adj: 9%
C/I ratio: 47%
Total assets: €83bn
Loan book: €48bn
TFA: €71bn
No. of staff: 4.9k
CETI : 16.3%, Tot. Cap: 18.9%
Moody’s rating 3 Baa1
S&P rating 3 : BBB
Fitch rating 3 : BBB
DPS21: €0.66
Payout FY22: 70%
Loan/funding ratio: 86%
Market cap.3: €9bn
Revenues (€m) Net profit (€m) ROTE adjusted2
2,525 2,513 2,628
1,459
June19 June20 June21 Dec21 (6M)
823
600
808
526
June 19 June 20 June21 Dec21 (6M)
10% 10%9%
11%
June19 June 20 June21 Dec21 (6M)
CIB
27%
WM
24%
Consumer
38%
Other
11%
Revenues1
MB Group profile Section 1
Key financial information (June21)
1) Figures referred to FY21 period (June-end 2021 annual period)
2) ROTE based on net profit adjusted calculated as GOP net of LLPs, minorities and taxes, with normalized tax rate (33% for Premier,
CIB, Consumer and HF; 25% for PB and AM; 4.16% for PI). Covid-related impact excluded for FY20
3) As at 10 February 2022

4
Capital intensive
NII driver
Anti-cyclical
Labour intensive
Fee driver
Cyclical
Capital light
Fee driver
Recurrent
EPS/DPS accretive
Revenue driver
Source of capital
AN INTEGRATED BUSINESS MODEL…
Principal Investing
HIGH SYNERGIC BUSINESS
HIGH RETURN BUSINESS
DIVERSIFICATION OPPORTUNITYREALLOCATION OPPORTUNITY
WealthManagement
Corporate & Inv.Banking
Consumer Banking
MB Group profile Section 1
5
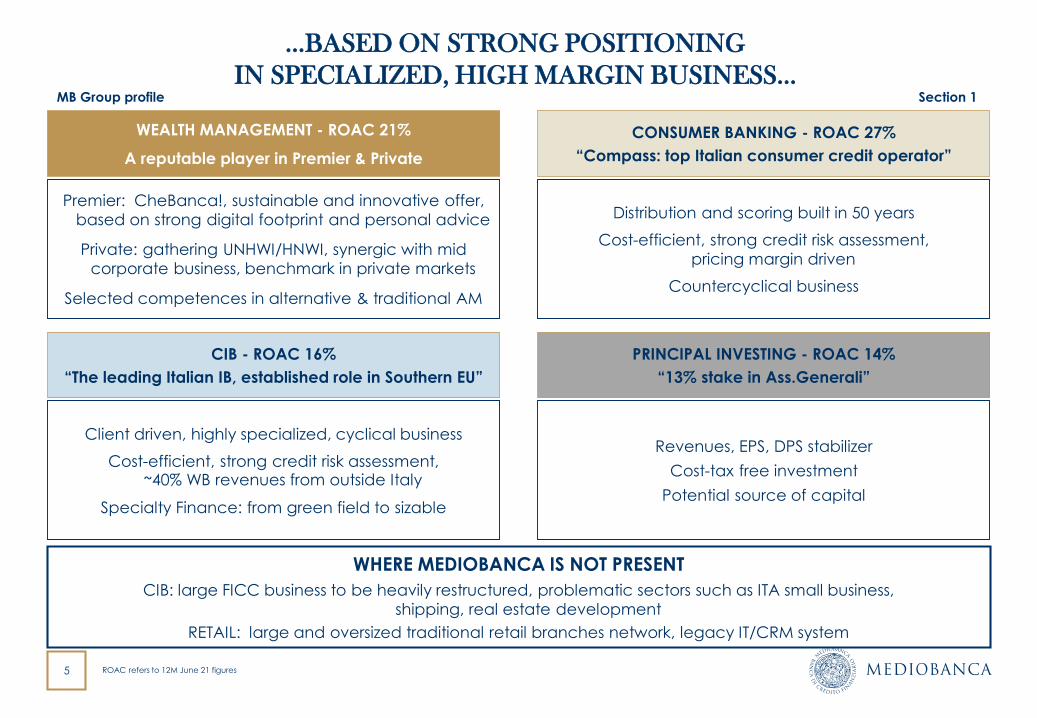
…BASED ON STRONG POSITIONING
IN SPECIALIZED, HIGH MARGIN BUSINESS…
Revenues, EPS, DPS stabilizer
Cost-tax free investment
Potential source of capital
Client driven, highly specialized, cyclical business
Cost-efficient, strong credit risk assessment, ~40% WB revenues from outside Italy
Specialty Finance: from green field to sizable
CIB - ROAC 16%
“The leading Italian IB, established role in Southern EU”
PRINCIPAL INVESTING - ROAC 14%
“13% stake in Ass.Generali”
Premier: CheBanca!, sustainable and innovative offer,
based on strong digital footprint and personal advice
Private: gathering UNHWI/HNWI, synergic with mid
corporate business, benchmark in private markets
Selected competences in alternative & traditional AM
Distribution and scoring built in 50 years
Cost-efficient, strong credit risk assessment,
pricing margin driven
Countercyclical business
CONSUMER BANKING - ROAC 27%
“Compass: top Italian consumer credit operator”
WEALTH MANAGEMENT - ROAC 21%
A reputable player in Premier & Private
WHERE MEDIOBANCA IS NOT PRESENT
CIB: large FICC business to be heavily restructured, problematic sectors such as ITA small business,
shipping, real estate development
RETAIL: large and oversized traditional retail branches network, legacy IT/CRM system
MB Group profile Section 1
ROAC refers to 12M June 21 figures

6
DIVERSIFIED AND STRONG QUALITY OF REVENUE-GENERATING ASSETS...
Fast growing TFA, with improving mix towards qualified AUM/AUA, while enlarging deposit base
Diversified loan book with very low risk profile
MB Group profile Section 1
Private
Banking
7%
Consumer
lending
26%
Leasing
3%
Large
corporate
34%
Specialty
Finance
7%Mortgages
22%
€50.8bn
6.8% 8.7%12.6%
10.1%
4.1% 3.8%
-20.0%-15.0%-10.0%-5.0%0.0%5.0%10.0%15.0%20.0%
0%
5%
10%
15%
20%
25%
MB
Sept21
EU avg.
Sept21
IT avg.
Sept21
Stage 2 loans% of loans1
2.9% 2.6%4.4%
67.1%
47.3%54.6%
20.0%
30.0%
40.0%
50.0%
60.0%
70.0%
0%
2%
4%
6%
8%
10%
MB
Sept21
EU avg.
Sept21
IT avg.
Sept21
Stage 3 loans% of loans1
coveragecoverage
1) Source: EBA Risk Dashboard – Data as of Sept 2021- %of loans (histogram) and coverage ratio (dots). EBA data may differ from MB reported ratios as the EBA includes treasury balances that are excluded from the MB classification. Purchased or originated creditimpaired (POCI) are not included
3248
56 61 64 7179
June16 June17 June18 June19 June20 June21 Dec21
TFAs evolution (€bn)
Loan book (Dec21)
Deposits
€14.1bn
AUM/AUA
55%
Deposits
€27.2bn
AUM/AUA
66%
€32bn €79bn
June16 Dec21
45% corporate
55% retail
~80% domestic
~20% non-domestic
ESG/green loans: €2.9bn
7
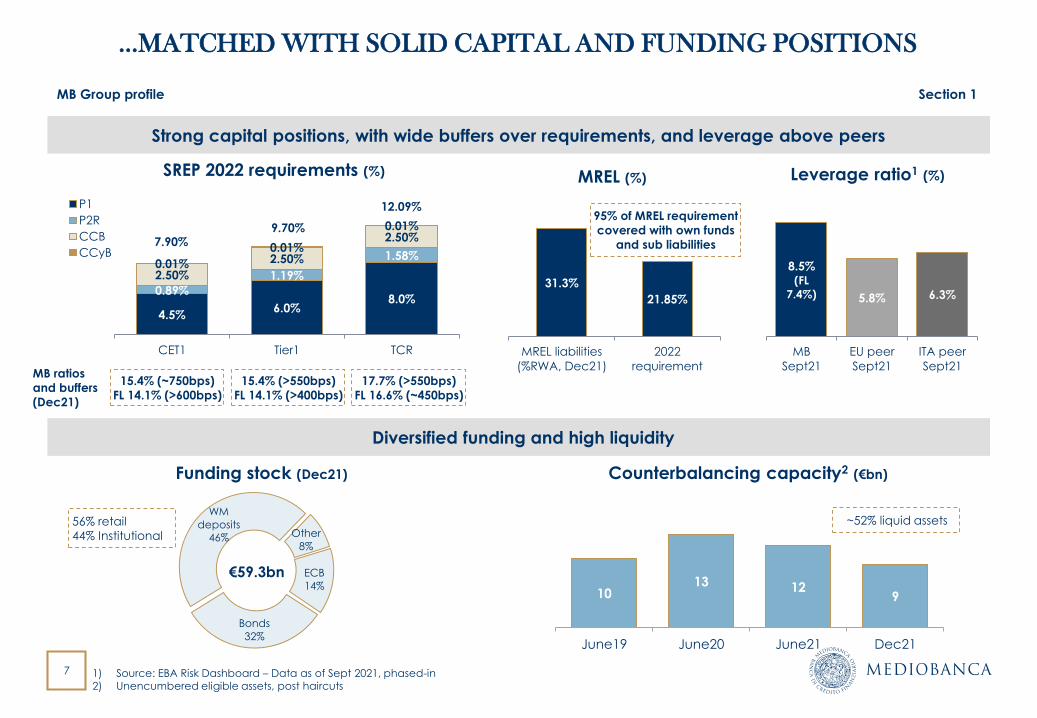
…MATCHED WITH SOLID CAPITAL AND FUNDING POSITIONS
Diversified funding and high liquidity
Strong capital positions, with wide buffers over requirements, and leverage above peers
MB Group profile Section 1
Bonds
32%
WM
deposits
46% Other
8%
ECB
14%€59.3bn
Funding stock (Dec21)
1) Source: EBA Risk Dashboard – Data as of Sept 2021, phased-in2) Unencumbered eligible assets, post haircuts
4.5%6.0%
8.0%0.89%
1.19%
1.58%
2.50%
2.50%
2.50%
0.01%
0.01%
0.01%
CET1 Tier1 TCR
P1
P2R
CCB
CCyB
15.4% (~750bps)
FL 14.1% (>600bps)
17.7% (>550bps)
FL 16.6% (~450bps)
SREP 2022 requirements (%)
7.90%
12.09%
MB ratios
and buffers
(Dec21)
95% of MREL requirement
covered with own funds
and sub liabilities
31.3%
21.85%
MREL liabilities
(%RWA, Dec21)
2022
requirement
MREL (%)
56% retail
44% Institutional
8.5%(FL
7.4%) 5.8% 6.3%
MB
Sept21
EU peer
Sept21
ITA peer
Sept21
Leverage ratio1 (%)
Counterbalancing capacity2 (€bn)
~52% liquid assets
1013 12
9
June19 June20 June21 Dec21
9.70%
15.4% (>550bps)
FL 14.1% (>400bps)
8
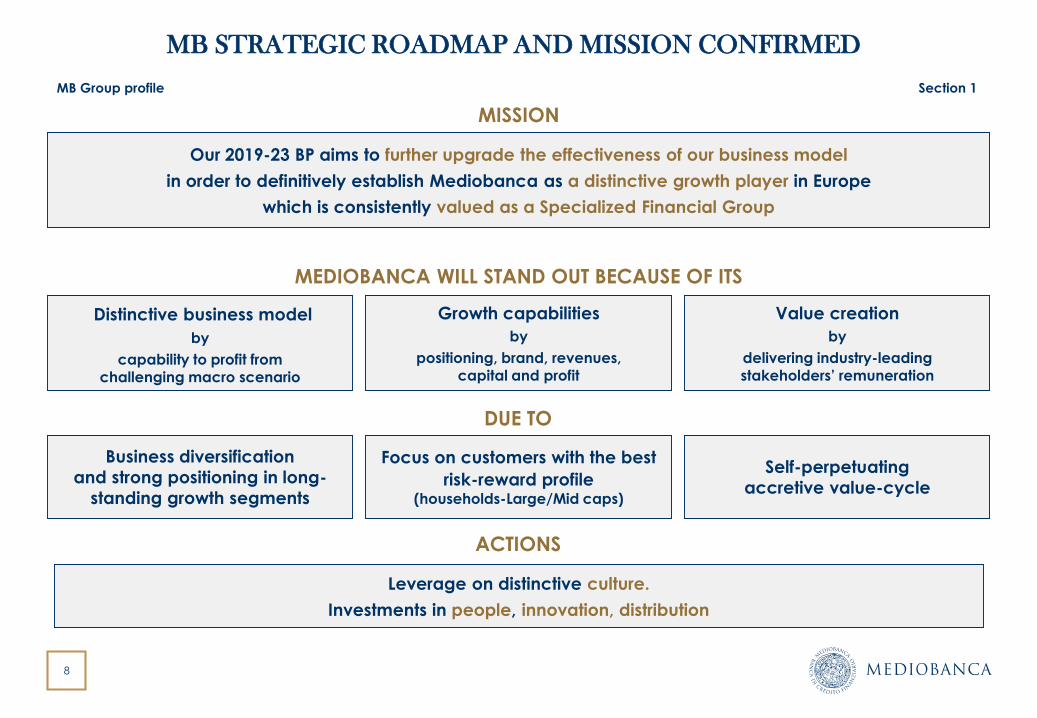
Our 2019-23 BP aims to further upgrade the effectiveness of our business model
in order to definitively establish Mediobanca as a distinctive growth player in Europe
which is consistently valued as a Specialized Financial Group
MB STRATEGIC ROADMAP AND MISSION CONFIRMED
Growth capabilities
by
positioning, brand, revenues, capital and profit
Value creation
by
delivering industry-leading stakeholders’ remuneration
Distinctive business model
by
capability to profit from challenging macro scenario
MEDIOBANCA WILL STAND OUT BECAUSE OF ITS
Focus on customers with the best
risk-reward profile(households-Large/Mid caps)
Self-perpetuating
accretive value-cycle
Business diversification
and strong positioning in long-
standing growth segments
DUE TO
ACTIONS
Leverage on distinctive culture.
Investments in people, innovation, distribution
MB Group profile Section 1
MISSION

9
WELL ON TRACK TO REACH BP23 TARGETS
TFAs up to €83bn(4YCAGR +8%)
✓
61 6471
83
FY19 FY20 FY21 FY23
BP
Ta
rge
t
(€bn)
Loans up to €51bn(4YCAGR +4%)
✓
44 47 48 51
0
10
20
30
40
50
60
FY19 FY20 FY21 FY23
BP
Ta
rge
t
(€bn)
Revenues up to €3bn(4YCAGR +4%)
✓
2.5 2.5 2.63.0
FY19 FY20 FY21 FY23
BP
Ta
rge
t
(€bn)
EPS1 up to €1.10ps(4YCAGR +4%)
(€)
0.93
0.68
0.91 0.931.10
FY19 FY20 FY21 FY21pf* FY22 FY23
ROTE adj. up to 11%(up 1pp)
10% 10%9%
11%
FY19 FY20 FY21 FY23
BP
Ta
rge
t
MB Group profile Section 1
BP
Ta
rge
t
1) FY19, FY20, FY21 calculated considering 887m shares. FY21 proforma calculated considering cancellation of up to 22.6m treasury shares approved in the 2021 AGM.
✓ ✓
AUM/AUA up to €59bn(4YCAGR +11%)
✓
39 4046
59
FY19 FY20 FY21 FY23
BP
Ta
rge
t
(€bn)

10
Targeting industry-leading performance
BP19/23 PLAN CONFIRMED, COVID IMPACT FULLY RECOVERED
Profitability growth
ROTE23 @11%
Earnings growth
+4% EPS CAGR1
Revenues growth
+4% CAGR1
Shareholders’ remuneration
70% cash payout
FY21and FY22
+
BB annually set
1) 4YCAGR 19/23, including treasury shares cancellation (subject to ECB authorization)2) Buyback purpose: cancellation, performance shares and M&A
Shift to capital-light fee business
Revenue growth in a challenging environment
Enhanced return to shareholders
CAPITAL MANAGEMENT POLICY
Capital invested in growth, organic and through M&A, cash DPS distribution, new buyback programmesset annually depending on M&A delivered and MB price
DPS21: €0.66, with 70% cash dividend payout
70% cash dividend payout confirmed also in FY22
Buybacks resumed in FY22: up to 22.6 million treasury shares cancellation + new up to 3% buyback programme2
MB Group profile Section 1

11
MB RIDING ESG MOMENTUM…
Agile and smart working platform project launched to foster work-life balance attractive to the younger generation
Employees: enhanced training programme and HR initiatives to foster engagement and satisfaction
Diversity: group self assessment project to develop new initiatives to address gender diversity and pay gap
MSCI: rating up from “BB” to “A”
CDP: rating up from “D” to “C”
S&P Global: included in the 2022 Sustainability Yearbook
BLOOMBERG: included also for 2022 in the Gender Equality Index
Employee empowerment,
diversity and inclusion
1. The S&P Europe 350 ESG Index is a broad-based, market-cap-weighted index that is designed to measure the performance of securities meeting sustainability criteria, while maintaining similar overall industry group weights as the S&P Europe 350.
2. MIB ESG index includes the top 40 Italian companies ranked according to ESG criteria in line with the UN Global Compact principles, and weighted on the basis of the free float market capitalization.
MB Group profile Section 1
RATING upgrade/confirmationNew Group investment policy
Application spectrum widened to ECM/DCM/Corporate Finance advisory to CIB clients (previously covering only lending and investing)
New Biodiversity Policy and ESG sensitive sectors Policy
MB included in ESG Market Indexes
Mediobanca included in the:
S&P Europe 350 ESG Index1 .
MIB ESG Index2.
The inclusion reflects the progression and improvement of Mediobanca’ssustainability strategy and ESG profile.
Remuneration policy: senior management STI scorecards
enhanced with quantitative ESG targets to support ESG/green product development
Governance enhanced by:
removal of requirement to have Group managers in the BoD,
increased minorities presence in the BoD with one seat reserved to Institutional Investors
Governance improvement
(2021 AGM)
In FY21 we have started several projects to respond to the new European ESG regulatory framework
Disclosure assessment to align in the near future with the requests of SASB
and TCFD
Enriched disclosure to come

12
… WITH GROWING COMMITMENT TO TACKLE CLIMATE CHANGE …
The Principles for Responsible Banking were launched at the United Nations’ General Assembly in September 2019 and have the aim of incentivizing banks to set objectives for sustainable growth and to measure the impact of their own activities on individuals and the planet.
This commitment is consistent with a
maximum temperature rise of well-below 2°C above pre-industrial levels by 2100 –equivalent to net-zero before 2065.
MB Group profile Section 1
Principles for Responsible Banking Net-Zero Banking Alliance
The Net-Zero Banking Alliance, established in April 2021, is the new climate commitment under UNEP FI.
This brings together over 80 banks, the majority of which are PRB signatories, which are committed to aligning their lending and investment portfolios with net-zero emissions by 2050, consistent with a maximum temperature rise of 1.5°C above pre-industrial levels by 2100.
The Mediobanca Group is:
signatory of the Principles for Responsible Banking (PRB) whose aim is to help steering the sector further in the direction of achieving the SDGs set by the UN,
member of the Net-Zero Banking Alliance (NZBA), initiative promoted by the United Nations with the objective of accelerating the sustainable transition of the international banking sector.
Going ahead MB will work:
to comply with the requirements of both PRB and NZBA (significative targets setting, reporting alignment etc.),
to reduce Scope 1 and Scope 2 emissions ,as well as for FY21, neutralizing “non-reducible” greenhouse gas emissions.
MB Group
commitmentNovember 2021June 2021
United Nations Environment Programme Finance Initiative (UNEP FI) is a partnership between UNEP and the global financial sector to mobilize private sector finance for sustainable development.
UNEP FI supports global finance sector principles to catalyze integration of sustainability into financial market practice. The frameworks UNEP FI has established or co-created
include: Principles for Responsible Banking (PRB), Principles for Sustainable Insurance (PSI).
Principles for Responsible Investment (PRI)

13
… DELIVERING BP ESG TARGETS
Procedure adopted to reach targets for equal opportunities, including specification in
head-hunter mandates
1) CSI: Customer Satisfaction Index; NPS: Net Promoter Score2) Premier: clients with wealth between €50k and €5m 3) Underlying 94% from renewables (BPTarget23: lifted to 94%), CO2 down 15% (BPTarget23: revised to down 27%); hybrid cars:
28% (BPTarget23: @90% of MB fleet)
Employee competences enhanced with training hours up 71% (BPTarget23: 25%).
AM: ESG criteria included in >98% of investment evaluation (BPTarget23: 100% of new
investments)
€140m investments in outstanding Italian SMEs (BPtarget23: €700m)
% of ESG qualified funds (under SFDR, Articles 8&9) out of total funds in Premier clients’
portfolio: 33%
Target review
Considering:
The new SFDR disclosure
requirement
The likely Premier target being
beaten (ESG qualified products
in clients’ portfolio: +30% by
FY23) due to increased ESG
product penetration and
significant TFA growth.
We have revised this target as
follows:
% of ESG qualified funds (ex SFDR
art. 8&9) to reach 40% of total funds
in Premier clients’ portfolio
ESG products’ (under SFDR Articles
8&9) penetration in clients’ portfolio
at @33%
ESG bond issue: target achieved (BPtarget23: €500m)
Procurement exp. assessed with CSR criteria: target achieved (BPtarget23: 40%)
Customer satisfaction: CheBanca! CSI¹ in Premier segment² @81, NPS¹ @43 ; Compass CSI¹
@88, NPS¹ @62
€7.3m in FY21 for social/environmental proj. (BPtarget: €4m per year)
MB Social Impact Fund: AUM up 43% (BPtarget23: up 20%)
Energy target: achieved with carbon neutrality (Scope 1 & 2)3
CheBanca! green mortgages up >5X vs FY20 (BPtarget: up 50%)
RAM: target achieved with the launch of Stable Climate Global Equities Fund
FY21 non-financial performanceSeveral targets already met, EU ESG regulation kicking in
SFDR driving AM world
disclosure
MB Group profile Section 1

AGENDA
1. MB Group profile
2. 1H22 Results
3. Funding & Treasury
3.1 Funding: structure & evolution
3.2 Treasury: structure & evolution
Annex
1. ESG profile
2. 12m figures as at June 21

15
RECORD HALF-YEAR RESULTS
CHARACTERIZED BY GROWTH, QUALITY AND SUSTAINABILITY
€1.5bn revenues (up 12%¹), record fees (up 16%1), NII back to growth (up 2%1)
Best-ever asset quality indicators
€526m net profit (up 28%1), 11% ROTE
Accelerating performance in 2Q despite Omicron
Robust growth and capital management² materially increased per share values
6m EPS adj. at €0.59 (up 17%1), TBVPS at €11.3 (up 7%1)
CET13 optimizing (at 15.4%), with 70% cash payout and new 3% buyback2 accrued
Revenues and profit generating capacity definitively increased
also due to digital enhancement with new state of the art investment App in Premier
and launch of Pagolight/BNPL in Consumer Finance
Significant non-financial ESG achievements
Mediobanca has joined the Net-Zero Banking Alliance
1) % changes related to YoY trend (6MDec21 vs 6MDec20)2) n. 22.6 millions of treasury shares from old buyback programme deleted in Dec21. Oct21AGM approved a new buyback
programme relative to max n. 25.9 millions shares (3% capital) to be bought within 12 months for staff performance sharesschemes, M&A and cancellation
3) CET1 Phase-in. CET1 FL @14.1% (without Danish Compromise ~120 bps and with IFRS 9 fully phased ~10 bps)
1H22/2Q22 - Group results Section 2
16
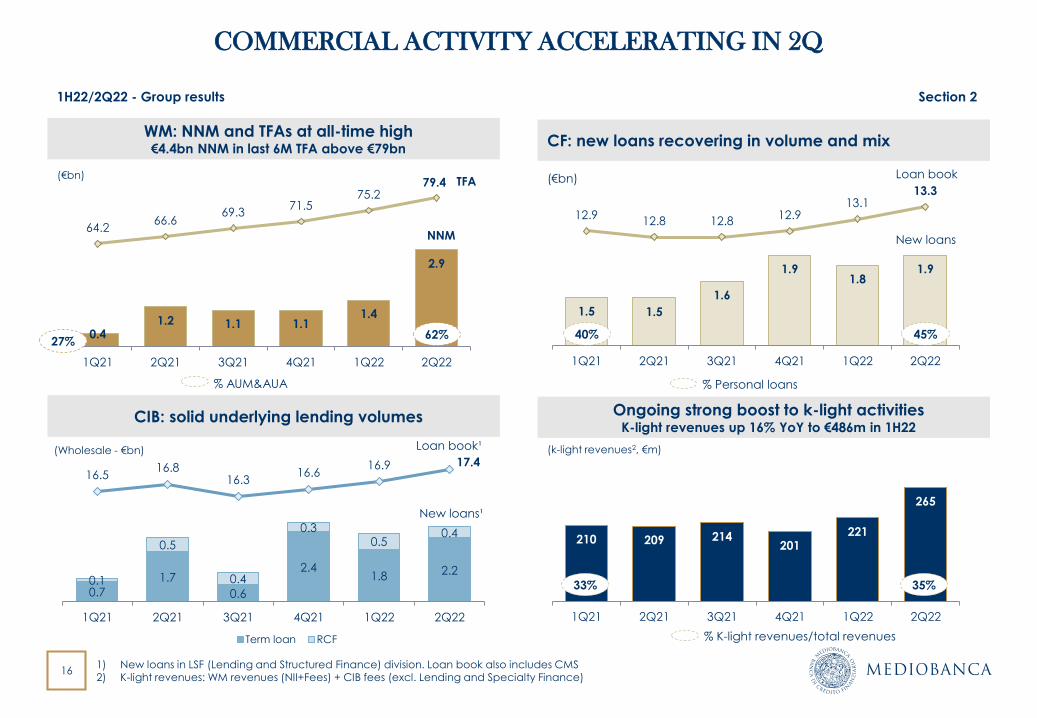
CF: new loans recovering in volume and mix
COMMERCIAL ACTIVITY ACCELERATING IN 2Q
WM: NNM and TFAs at all-time high€4.4bn NNM in last 6M TFA above €79bn
CIB: solid underlying lending volumes Ongoing strong boost to k-light activitiesK-light revenues up 16% YoY to €486m in 1H22
1) New loans in LSF (Lending and Structured Finance) division. Loan book also includes CMS2) K-light revenues: WM revenues (NII+Fees) + CIB fees (excl. Lending and Specialty Finance)
0.7
1.7
0.6
2.41.8 2.2
0.1
0.5
0.4
0.30.5
0.4
16.516.8
16.316.6
16.9 17.4
12
13
14
15
16
17
18
0.0
0.5
1.0
1.5
2.0
2.5
3.0
3.5
4.0
4.5
5.0
1Q21 2Q21 3Q21 4Q21 1Q22 2Q22
Term loan RCF
(Wholesale - €bn) Loan book¹
New loans¹
1.5 1.5
1.6
1.91.8
1.9
12.912.8 12.8
12.913.1
13.3
11
12
12
13
13
14
1
1
1
2
2
2
2
2
1Q21 2Q21 3Q21 4Q21 1Q22 2Q22
40% 45%
% Personal loans
Loan book
New loans
0.41.2 1.1 1.1
1.4
2.9
64.266.6
69.371.5
75.279.4
30
35
40
45
50
55
60
65
70
75
80
0
1
1
2
2
3
3
4
4
5
1Q21 2Q21 3Q21 4Q21 1Q22 2Q22
(€bn)
27%62%
% AUM&AUA
TFA
NNM
(€bn)
1H22/2Q22 - Group results Section 2
210 209 214201
221
265
100120140160180200220240260280
1Q21 2Q21 3Q21 4Q21 1Q22 2Q22
(k-light revenues2, €m)
33% 35%
% K-light revenues/total revenues

17
1,3251,301
1,459
62
10 26
70 (10)
Revenues
6M-Dec19
Revenues
6M-Dec20
WM CF CIB PI HF Revenues
6M-Dec21
REVENUES UP 12% YoY, ACCELERATING IN 2QBENEFITING FROM RESTORED/INCREASED REVENUE-GENERATING CAPABILITIES IN ALL SEGMENTS
Group revenues by division (YoY, €m, 6M)
+2%1
+57%1
+20%1
+12% YoY
+7%1
1) YoY % change
156 162 163 172 192
2Q21
Dec20
3Q21
Mar21
4Q21
June21
1Q22
Sept21
2Q22
Dec21
WM: +11%
256 249 238 257 268
2Q21
Dec20
3Q21
Mar21
4Q21
June21
1Q22
Sept21
2Q22
Dec21
CF : + 4%
182 173 161185
206
2Q21
Dec20
3Q21
Mar21
4Q21
June21
1Q22
Sept21
2Q22
Dec21
1H22/2Q22 - Group results Section 2
CIB: +12%
Divisional revenues by Q (€m, 3M)

18
NII BACK TO GROWTH, T-LTRO IMPACT SMOOTHED
NII at €734m in 1H22, clearly back to growth (up 2% YoY and6% HoH), with record 2Q helped by seasonality along withvolume growth and CoF reduction across all divisions; the CFcontribution was particularly positive, with loan book and NIIgrowing above expectations and up both QoQ and YoY
T-LTRO cliff smoothed and offset by ALM optimization: 50bpsremoval (from June22) spread over maturity (2.5Y); €10mimpact for 6M fully booked in 2Q
NII trend by division (€m, 3M)
Loan book by segment (€bn)
12.6 13.5 14.0 14.3 14.4 14.5 14.8
13.7 12.9 12.8 12.8 12.9 13.1 13.3
18.0 18.6 19.5 18.9 19.3 19.5 21.0
Pre-
Covid
(1)
Sept20 Dec20 Mar21 June21 Sept21 Dec21
WM CF CIB HF&Other
46.3 48.9
Quarterly NII trend (€m, 3M)
50.8
1) Pre-Covid: average between 1Q20 and 2Q20 for NII and Dec19 for loan book
48.1
358
375
+6+4
+12 (10)
+3+2
1Q22 CF Other
divisions
ALM optimiz TLTRO
smoothing
2Q22
Margin & CoF effect
Volume effect
237 226 223 216 214 226 236
69 68 69 72 72 74 73
68 72 77 70 68 68 72
Pre-
Covid (1)
1Q21 2Q21 3Q21 4Q21 1Q22 2Q22
CF WM CIB HF&Other
361 358 375363
€720m€695m
€734m+6%+2%
1H22/2Q22 - Group results Section 2

19
FEE INCOME: ROBUST HIGH-QUALITY GROWTH IN WM AND CIB
Fee income steadily on a growing path, posting new record in 2Q (€241m, up 19% QoQ), backed by WM and CIB performances:
WM: largest contributor (€117m in 2Q and €213m in 1H), impressive growth (up 33% YoY and 21% HoH), reflecting increase in management fees and in AUM/AUA, Bybrook consolidation, MB/Blackrock co-investments upfront fees (most in 1H22, €14m)
CIB: high-quality record fees (€102m in 2Q, €187m in 1H) recording material growth (up 9% YoY and 28% HoH) due to a strong performance in Advisory business
CF: broadly stable contribution
Fee income trend by division (€m, 3M)
34 33 33 24 31 32
76 85 87 8996
117
88 84 7769
85
102
1Q21 2Q21 3Q21 4Q21 1Q22 2Q22
CF WM CIB HF&Other
189 194 188173
203
CIB fees (€m, 3M)
1) Capmkt fees include ECM, DCM, CMS, Sales
(10) (12) (13) (15) (14) (15)
59 61 64 67 75 82
9 10 11 1116
1917 21 21 20
1922
1Q21 2Q21 3Q21 4Q21 1Q22 2Q22
Performance
Banking&other
Upfront/Advisory
Management
Passive
7685
8987
96
117
241
4127 35
2539
59
2629 21
17
13
1512
16 10
1317
1110 1212
14
16
17
1Q21 2Q21 3Q21 4Q21 1Q22 2Q22
Specialty fin
Lending
CapMkt¹
Advisory
88 8477
6985
102
€383m €362m
€443m
WM fees (€m, 3M)
+22%
+19%
1H22/2Q22 - Group results Section 2

20
COSTS UP 7% DRIVEN BY STRONG COMMERCIAL ACTIVITYBEST-IN-CLASS COST/INCOME RATIO CONFIRMED (@43%)
Group cost base and cost/income ratio (€m, %, 6M)
Group cost base increase by division (€m, 6M)
288 286 305
304 305 329
45% 45%
43%
20%
25%
30%
35%
40%
45%
0
100
200
300
400
500
600
700
800
900
1H20 1H21 1H22
Admin.expenses Labour cost
C/I ratio
591633+7%
+7%
+8%
Cost base up by €42m (up 7% YoY) driven by strong revenues/business activity and distribution platform enhancement while keeping
cost/income ratio under strict control @43%. Cost increase driven by:
€14m increase in revenues/business related costs including higher variable remuneration accrued (in line with positive revenues trend),
and other volume (mainly retail) related costs
€13m increase due to distribution enhancement mainly related to hiring, marketing, and branches opening
€10m related to further technology upgrades
14
13
10
5
42
Revenue/
business
related
Distribution
enhancement
Technology Other Total
32
13
42
WM CIB CF Other Total cost
increase
Group cost base increase breakdown (€m, 6M)
1H22/2Q22 - Group results Section 2

21
PRUDENT PROVISIONING FURTHER TIGHTENEDMACRO SCENARIO UNCHANGED, OVERLAYS NOT RELEASED, MORATORIA ENDED
Scenario June21 Scenario Dec21
20211 20221 20231 20211 20221 20231
IT GDP 4.5% 4.4% 1.5% +6.4% +4.7% +2.0%
EU GDP 4.0% 4.3% 2.2% +5.1% +4.4% +2.4%
IT UNEPL. Rate 9.8% 9.9% 9.5% 9.6% 9.1% 8.9%
IT 10Y yield 0.6% 1.2% 1.8% 0.7% 1.4% 2.4%
IFRS9 models did not incorporate Dec21 macro upgrade
Moratoria ended: <1% group loans, 83% expired; ~100% of residual positions classified in Stages 2-3, well covered
Extra provisioning: €10m for vintage positions in Leasing and €25m for MBCS portfolio, with a view to progressive de-risking
Overlay stock trend (€m)
1) IT and EU GDP annual % change as at end-December2) Decreased to €0.07bn at end-Jan. 2022
Granted Outstanding o/w Stage 2-3
MB Group 2.22 0.37 ~100%
Consumer 0.97 0.02 100%
Mortgages 0.63 0.10 100%
Leasing 0.62 0.242 100%
Moratoria as % of Group loans
5% <1%
Loans under moratoria (€bn, Dec21)
200 200
90 70
June21 Dec21
CF CIB Other
~€300m ~€290m
Macro scenario trend (MB internal baseline scenario)
1H22/2Q22 - Group results Section 2
Highlights

22
SOLID ASSET QUALITY TREND CONFIRMEDNPLs INCIDENCE DOWN AND COVERAGE RATIO UP
1) Figures in the graphs refer to the Customers Loan Book and may therefore differ from the EBA Dashboard. In particular, the EBA includes treasury balances in NPL and staging calculation (excluded from MB classification) and includes purchased NPLs (€0.4bn) in the NPL ratio (MB does not include gross purchased NPLs in NPL ratio, as does in stage 3 loans)
90% 89% 90%
0.68% 0.65% 0.63%
-1.5%
-1.0%
-0.5%
0.0%
0.5%
1.0%
50%
70%
90%
110%
Dec20 June21 Dec21
Gross Exposure/Loans Coverage
7.1% 7.6% 7.0%
9.4% 9.7% 10.2%
-10.0%
0.0%
10.0%
20.0%
-1%
4%
9%
14%
Dec20 June21 Dec21
Gross Exposure/Loans Coverage
Performing Loans – Stage 11
3.3% 3.2% 2.8%
63.1% 64.9% 66.9%
10.0%
20.0%
30.0%
40.0%
50.0%
60.0%
70.0%
0%
2%
4%
6%
8%
Dec20 June21 Dec21
Gross Exposure/Loans Coverage
➢ Stage 3 – Gross NPLs down to 2.8% of gross
loans (vs 3.2% in June21) as well as net NPLs.
Small ordinary NPL disposals in Consumer
Finance. Coverage ratio up to ~67%
➢ Stage 2 – Down in both absolute terms (by
3% HoH) and relative terms, mainly related
to CIB and mortgages. Coverage ratio at
~10%
➢ Performing loans – Coverage ratio 1.32% at
Group level, further strengthened in
Consumer Finance (up to 3.75%)
1.3% 1.2% 1.0%
0.00%
1.00%
2.00%
3.00%
4.00%
5.00%
Dec20 June21 Dec21
Performing Loans – Stage 21
Gross NPLs – Stage 31 Net NPLs – Stage 31
(Net exposure/Loans)
Performing Loans coverage ratio
1.31% 1.36% 1.32%
3.35%3.62% 3.75%
Dec20 June21 Dec21
Group CF
1H22/2Q22 - Group results Section 2

23
…ACROSS DIVISIONS
Net NPLs (€m)
(“deteriorate”)
Leasing
Consumer Finance
(CF)
Corporate &
Investment Banking
(CIB)
Wealth
Management
(WM)
of which bad loans (€m)
(“sofferenze”)
NPL coverage NPLs as % of loans
Mediobanca
Group 609 560 487
Dec20 June21 Dec21
104 104 103
Dec20 June21 Dec21
296235
178
Dec20 June21 Dec21
111 116 123
Dec20 June21 Dec21
99 105 83
Dec20 June21 Dec21
83 72 63Dec20 June21 Dec21
0 0 0June20 Mar21 June21
11 9 9Dec20 June21 Dec21
49 43 38Dec20 June21 Dec21
23 20 16Dec20 June21 Dec21
63% 65% 67%
Dec20 June21 Dec21
55% 54% 53%
Dec20 June21 Dec21
72%76% 79%
Dec20 June21 Dec21
49% 49% 48%
Dec20 June21 Dec21
41% 40%51%
Dec20 June21 Dec21
3.3% 3.2% 2.8%
1.3% 1.2% 1.0%
Dec20 June21 Dec21
1.2% 1.2% 1.1%
0.5% 0.5% 0.5%
Dec20 June21 Dec21
7.4% 6.9% 5.8%
2.3% 1.8% 1.3%
Dec20 June21 Dec21
1.5% 1.6% 1.6%
0.8% 0.8% 0.8%
Dec20 June21 Dec21
8.9% 9.4% 9.4%
5.5% 5.9%4.9%
Dec20 June21 Dec21
-13%
-1%
+6%
-20%-20%
Net
Gross
-24%-7%
-11%
-13%
1H22/2Q22 - Group results Section 2

24
POSITIVE COR TREND ONGOING
Prudent approach: given the macro uncertainties and the new wave of the pandemic, the new macro scenario has not beenapplied to IFRS9 models
1H22 Group CoR at 55bps, with a slight increase in 2Q to 60bps due only to extra provisions to facilitate the downsizing of smallcredit buckets (Leasing /MBCS) (~40bps underlying COR in 1H):
CF: CoR down to 133bps in 2Q22 at its lowest-ever level, on low default rates and sound asset quality
CIB: CoR at 27bps in 2Q22, reflecting €25m of extra provisioning for selected MBCS portfolios, only partly offset by writebacksrelated to repayments, upgrades and sector risk improvement
Leasing: additional €10m LLPs related to extra provisioning for residual moratoria and vintage NPLs
CoR trend (bps)
5839
85
141
6139
53 56 51 60
(15)
(52)
37
70
(38)(54)
3 58
2714
11 1327 18 17
13 6 12
11
197 185
223
361
248
196174 183
160133
1Q20 2Q20 3Q20 4Q20 1Q21 2Q21 3Q21 4Q21 1Q22 2Q22
Post-Covid
CF
Group
CIB
WM
Group 1H22
55bps
Group 2H21
54bps
Group 1H21
50bps
1H22/2Q22 - Group results Section 2

25
STRONG CAPITAL POSITION OPTIMIZINGORGANIC CAPITAL CREATION FINANCING GROWTH & SHAREHOLDER REMUNERATION
CET1 phased-in1 ratio trend (%,bps)
CET1 phased-in ratio down 90bps HoH to 15.4%, ow 70bps in 2Q, reflecting
+115bps organic capital generation (split equally between quarters) financing -30bps organic growth (loans up by €2.4bn at alower density, from 57% to 54%) and -80bps cash shareholders’ remuneration (70% cash payout)
-65bps full upfront-loading of buyback programme2 (in 2Q)
-20bps AG impact (mainly in 1Q, as in Q2 extra dividend was paid) to be reversed with AG dividend payment in May 2022
2022 SREP CET1 confirmed at 7.9%3
1) CET1 FL @14.1% (without Danish Compromise ~120 bps and with IFRS 9 fully phased ~10 bps).2) Buyback programme approved by ECB and started in Dec,21, for up to 25.9 million shares to be bought within 12 months for staff
performance shares schemes, M&A and cancellation3) SREP CET1 calculated as: 4.5% Pillar1 + 2.5% CCB + 56.25% P2R (1.58%)+ 0.01% CCyB.
16.3% 16.1% 16.1% 16.1% 16.3%
15.7%15.4% 15.4%
CET1
June21
Earnings 70% Dividend
Pay-out
AG RWA& other Bybrook CET1
Sept21
Earnings 70% Dividend
Pay-out
3% BB RWA CET1
Dec21
+55 +60-40 -20 -5 -10 -40
-65 -25
15.1% FL 15.0% FL 14.1% FL
1H22/2Q22 - Group results Section 2
RWA density
57.1%
RWA density
53.7%
RWA density
55.2%

AGENDA
1. MB Group profile
2. 1H22 Results
3. Funding & Treasury
3.1 Funding: structure & evolution
3.2 Treasury: structure & evolution
Annex
1. ESG profile
2. 12m figures as at June 21

27
FUNDING AT 59BN, HIGH LIQUIDITY
Comfortable funding & liquidity position, with CoF down 5bps vs
FY20/21 to ~60bps
Funding up 6% YoY and HoH to €59bn, with higher contribution
from WM deposits (up 11% YoY, up 8% HoH) and increased ECB
funding: TLTRO3 stock at ~€8.4bn (vs €8.8bn full capacity), after
additional €1bn drawn in 1Q22 and €2bn prolonged to Sept.24
TLTRO economic cliff smoothed: 50bps premium spread over the
residual maturity of 2.5Y
CBC at ~9bn, o/w ~52% liquid assets
NSFR: 110%; LCR:162%
Funding stock breakdown (€bn)
24.6 25.2 27.2
18.7 18.4 18.9
6.2 7.48.46.4 5.14.7
Dec20 June21 Dec21
WM deposits MB securities ECB Other
56.2 59.3+6%
HoH55.9
+6% YoY
Summary & recent trends Section 3
MB securities redemptions(€bn, CoF bps vs Euribor3M)
MB Group counterbalancing capacity (€bn)
CBC: ~€9bn
2.33.8
2.7
10.1
June22 June23 June24 > June23
90 175 165
Avg. CoF expiring bondsBps vs. Euribor3M
ABACO
2.6
HQLA -
Securities
1.5HQLA -
Cash
3.3
Non HQLA -
Securities
1.8
28
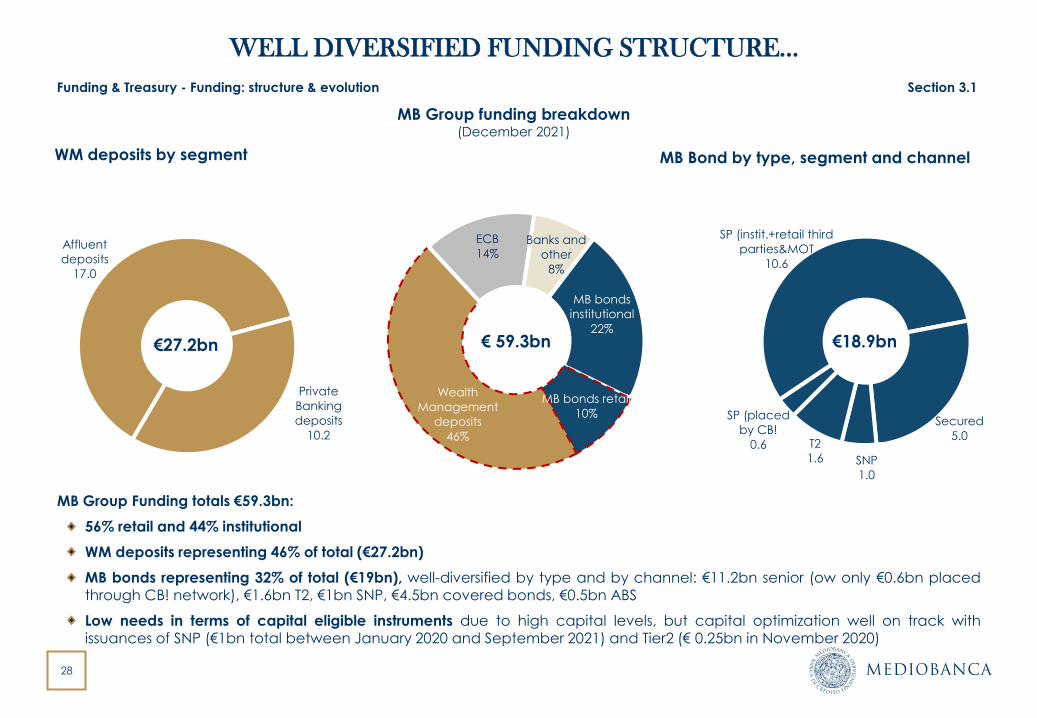
WELL DIVERSIFIED FUNDING STRUCTURE…
MB Group funding breakdown (December 2021)
MB Bond by type, segment and channel
MB Group Funding totals €59.3bn:
56% retail and 44% institutional
WM deposits representing 46% of total (€27.2bn)
MB bonds representing 32% of total (€19bn), well-diversified by type and by channel: €11.2bn senior (ow only €0.6bn placedthrough CB! network), €1.6bn T2, €1bn SNP, €4.5bn covered bonds, €0.5bn ABS
Low needs in terms of capital eligible instruments due to high capital levels, but capital optimization well on track withissuances of SNP (€1bn total between January 2020 and September 2021) and Tier2 (€ 0.25bn in November 2020)
WM deposits by segment
Funding & Treasury - Funding: structure & evolution Section 3.1
MB bonds
institutional
22%
MB bonds retail
10%
Wealth
Management
deposits
46%
ECB
14%Banks and
other
8%
Affluent
deposits
17.0
Private
Banking
deposits
10.2
SP (placed
by CB!
0.6
SP (instit.+retail third
parties&MOT
10.6
Secured
5.0
SNP
1.0
T2
1.6
€ 59.3bn €18.9bn€27.2bn

29
J-08 J-09 J-10 J-11 J-12 J-13 J-14 J-15 J-16 J-17 J-18 J-19 J-20 J-21 D-21
MB bonds Retail depositsPrivate banking deposits Banks & OtherECB
MB bond outstanding by investor
…DIVERSIFIED OVER THE LAST DECADE
MB Group funding trend (€bn)
WM deposit share increased due to CheBanca! and private banking arms’ growth
Bond funding diversified between retail and institutional investors, with institutional funding on a constant rising trend
ECB: reliance around 14% of Group Funding (~€8.4bn as of December 2021, 100% TLTRO3, with maximum drawable
amount of €8.8bn)
45
5659
55% 53%58% 60% 60% 62% 59% 56% 57%
52% 48% 47%37%
31% 30%
45% 47%42% 40% 40% 38% 41% 44% 43%
48% 52% 53%63%
69% 70%
J-08 J-09 J-10 J-11 J-12 J-13 J-14 J-15 J-16 J-17 J-18 J-19 J-20 J-21 D-21
Bonds to retail Bonds to institutionals
Funding: structure & evolution Section 3.1

30
…WITH LOW MREL NEEDS
MREL requirement for 2022 confirmed as one of thelowest in EU
21.84% RWA (19.34% + 2.5% CBR)
5.91% LRE (Leverage Ratio Exposure)
MREL own funds and eligible liabilities (~€15bn as ofDec21) @ 31.3% of RWAs with a surplus of 9.4% of RWAs
No subordination requirement for 2022: as of Dec21, CET1
and sub bonds (including SNP) totalling 21% of RWA, 95%of MREL requirement
SNP and T2 issuance of €500m in Jan 20 (SNP), €250m inNov 20 (T2) and €500m in Sept 21 to optimize capitalstructure in view of T2 expiring (€0.4bn expired in June 21and € 0.5bn due in Apr 23)
MREL liabilities vs 2022 MREL requirement
Funding & Treasury - Funding: structure & evolution Section 3.1
MREL
MREL Eligible
liabilities
31.12.2021
2022 MREL req. Subordination Stack
Own Funds
and Sub Liab
21%MREL Req
21.85% RWA
MREL Liabilities:
31.3%RWA
Sub stack
21%
MREL
Surplus
9.4%
95% of MREL Req
covered by Sub
Liab and Own
Funds
CET1:15.4%
Sub: 3.5%
Senior
bonds:
10.5%
SNP: 2.1%

31
RECENT PUBLIC OFFERS AMONG INSTITUTIONAL INVESTORS
MB public bonds placed to institutional investors since July 2019
Allocation by geography
1) Final maturity of Class A1, A2 and B Notes is October 2036. The WAL of Class A1 Notes is 2.27 years2) Referred to Class A1 Notes
Allocation by investor type
Funding & Treasury - Funding: structure & evolution Section 3.1
Italy
31%
Germany, AU
& CH
27%
France
19%BeNeLux
2%
UK & Ireland
9%
Iberia
7%
Nordics
3%
Others
2%
Banks &
Private Banks
32%
Asset
Managers
53%
CBs & OIs
11%
Insurance & PFs
3%
Others
1%
Issue date Bond type Tenor Amount (€m) Spread at issue Subscription rate
Jul-19 Covered long 7Y 750 MS+53bps ~2.3x
Jul-19 Senior Preferred 6Y 500 MS+137bps >2.7x
Nov-19 ABS n/a1 600 3mE+57bps2 >1.5x
Dec-19 Senior Preferred long 6Y 500 MS+103bps ~1.9x
Jan-20 Senior Non-Preferred long 5Y 500 MS+130bps >8.0x
Sep-20 Senior Preferred Green 7Y 500 MS+135bps >7.0x
Nov-20 Tier 2 10NC5 250 MS+280bps >9.0x
Jan-21 Covered 10Y 750 MS+13bps >2x
Sep-21 Senior Non-Preferred 7NC6 500 MS+100bps ~3x
Jan-21 Senior Preferred 7.5NC6.5 500 MS+90bps 1.8x

32
MEDIOBANCA INAUGURAL GREEN BOND
Mediobanca Inaugural Green 7-years € 500m Senior Preferred Issuance:
CSR targets are key elements of MB Strategic Business Plan 19-23 and the publication of the Green and Sustainable Bond Framework in June 2020 represents a key pillar of our ESG strategy
The inaugural green transaction has been focused towards the achievement of SDG 7 (Affordable Clean Energy), SDG 11(Sustainable Cities and Communities)and SDG 13 (Climate Action)
Total size of eligible green projects at the date of the issuance was € 528m, with residual maturity of 8.7 years
Breakdown of assets included in the green pool: 65% corporate loans, 26% retail mortgages, 9% consumer credit
Thanks to Mediobanca strategic ESG goals and ambitions, the transaction saw a meaningful participation from SRI investors, demonstrating a clear sign of appreciation for the newly established framework
In terms of pool evolution since the bond issuance (July 20 - June21): eligible assets financed increased by 38%, with Sustainable Mobility, Renewable Energy and Green Buildings as main green categories1
Transaction Highlights
Bond Type Senior Preferred Green
Pricing Date Sept 1st, 2020
Tenor 7 years
IPT Mid swap +165bps
Re-offer spread Mid swap +135bps
Amount € 500m
ISIN XS2227196404
Use of ProceedsRe-financing of eligible
Green Assets
NIP -8bps
Over-subscription ~7.0x
25%
15%
15%
14%
10%
10%
5% 6%
Allocation by Geography
France Ger&Austria
Italy UK
Nordics Iberia
Swiss Others
61%
25%
10%
3% 1%
Allocation by Investor Type
Funds Banks
CBs & OIs Insurance & PF
Others
1) Green Bond Report published in September 2021 and available here:https://www.mediobanca.com/en/investor-relations/financing-rating/green-and-sustainable-bond-framework.html
Funding & Treasury - Funding: structure & evolution Section 3.1

33
MEDIOBANCA SNP AND TIER2: RECENT ISSUANCES
Recent institutional Tier 2 and SNP issuances aimed at optimizing the capital structure, managing actively the evolution in regulatory and rating methodologies and increasing efficiency with callable structure
Market Feedback: all transactions priced inside FV. Both SNP issued with ca -5bps concession and T2 -35/40bps. Granular and well diversified order books, with significant distribution outside Italy
SNP (06/09/2021) Tier 2 (16/11/2020) SNP (16/01/2020)
ISIN XS2386287689 XS2262077675 XS2106861771
Issue Rating (M/S/F) Baa3/BBB-/BBB- Ba1/BB+/BB+ Baa3/BBB-/BBB-
Tenor (Y) 7 nc 6 10 nc 5 5
IPT Mid swap +125/130bps Mid swap +345bps Mid swap +160bps
Re-offer spread Mid swap +100bps Mid swap +280bps Mid swap +130bps
Amount € 500m € 250m € 500m
Coupon/Yield 0.75% / 0.75% 2.3% / 2.354% 1.125% / 1.157%
NIP -5bps -35/40bps -5bps
Over-subscription (final) ~3.2x ~9.0x ~8.0x
By Geography By Investor Type
23%
27%17%
14%
6%
6%5%
2% Italy
France
Germany & Austria
UK
Iberia
Swiss
Others
BeNeLux
72%
21%
3%3%
1% Fund Managers
Banks & PBs
Insurance & PFs
Central Banks & OIs
Others
Funding & Treasury - Funding: structure & evolution Section 3.1

34
MEDIOBANCA COVERED BONDS
Mediobanca €10bn Soft Bullet Covered Bond program, placed to investors:
UCITS and CRR Compliant, recently upgraded to AA Outlook Stable from Fitch;
The cover pool is composed by first lien Italian residential mortgage loans with an average size of €95k;
As of 31 December 2021, covered bonds outstanding amount is €4.5bn; 0.027% of the loans are in 90+ arrears;
In January 2021 Mediobanca issued the first Italian Covered Bond offering a negative yield.
Portfolio characteristics (31 December 2021)
Total Current Balance €6.142m
Average outstanding Balance €95k
No. of loans 64k
WA Seasoning 64.2 months
WA Remaining Term 229.8 months
No. of borrowers 64.3k
WA OLTV 65%
WA CLTV 55%
WA Margin (%) Variable loans 1.92
1) €250m tap launched in December 2015; 2) €250m tap launched in September 2018
Funding & Treasury - Funding: structure & evolution Section 3.1
ISIN Currency Outstanding amount (m) Rating (Fitch) Coupon Issue Date Maturity Date
IT0004966716 EUR 750 AA 3.625% Oct-13 Oct-23
IT0005142952 EUR 750 AA 1.375% Nov-151 Nov-25
IT0005315046 EUR 750 AA 1.25% Nov-17 Nov-29
IT0005339186 EUR 750 AA 1.125% Jul-182 Aug-24
IT0005378036 EUR 750 AA 0.50% Jul-19 Oct-26
IT0005433757 EUR 750 AA 0.01% Jan-21 Feb-31
50.3%48.0%
1.7%
Fixed rate
Floating rate
Floating rate
with Cap
4.1%
16.7%
32.1%
47.1%
0.1%
0-20
20-40
40-60
60-80
>80
CLTV distribution
Interest type

35
ABS (CONSUMER AND SALARY GUARANTEED LOANS)
Quarzo S.r.l. – Serie 2018 Quarzo CQS S.r.l. – Serie 2018
Quarzo 2018 is a securitization of consumer
loans originated to Italian borrowers by
Compass. The transaction factors in a 6-
months revolving period starting from Jan-
19. The issue was divided into three classes,
Class A1 offered to the market and Class
A2 and Class B retained by the Originator
Originator: Futuro S.p.A.
Collateral type: Italian Secured Consumer Loans
Total size of Class A: €598m
Announcement date: 20 March 2018
Settlement date: 27 March 2018
First payment date: 18 April 2018
Coupon: 1mE+37bps
Yield at issue: 1mE+37bps
Issue price: 100.00%
Listing: Irish Stock Exchange
ISIN (Class A): IT0005328312
Minimum denomination:
€100K + €1K
Mediobanca’s role:Sole Arranger & Joint Lead Manager
Quarzo CQS 2018 is a static cash
securitization of salary and pension
assignment loans originated to Italian
borrowers by Futuro S.p.a. The purchase of
the portfolio has been financed through
the issuance of a senior (Class A) and a
junior note. The Class A note has been
placed on the market
Mediobanca through its subsidiary Compass S.p.a. (Compass) has originated several structured finance transactions collateralized by consumer loans, the Quarzo S.r.l. series: the latest marketed ABS was priced in November 2019 and the current outstanding amount of the placed Class A1 notes of Quarzo series is ~€370m1
Starting from 2015, Mediobanca has placed on the market two salary guaranteed loans transactions originated by Compass’ subsidiary Futuro S.p.a. (incorporated in Compass in 2020), through the SPV Quarzo CQS S.r.l. The current Class A outstanding
amount for Serie 2018 is ~€96m1
Quarzo S.r.l. – Serie 2019
Quarzo 2019 is a securitization of consumer
loans originated to Italian borrowers by
Compass. The transaction factors in a 6-
months revolving period starting from Dec-
19. The issue was divided into three classes,
Class A1 offered to the market and Class
A2 and Class B retained by the Originator
Originator: Compass Banca S.p.A.
Collateral type: Italian Consumer Loans
Total size of Class A: €600m
Announcement date: 28 November 2018
Settlement date: 6 December 2018
First payment date: 15 January 2019
Coupon: 3mE+95bps
Yield at issue: 3mE+95bps
Issue price: 100.00%
Listing: Irish Stock Exchange
ISIN (Class A1): IT0005348989
Minimum denomination:
€100K + €1K
Mediobanca’s role:Sole Arranger & Joint Lead Manager
Originator: Compass Banca S.p.A.
Collateral type: Italian Consumer Loans
Total size of Class A: €600m
Announcement date: 7 November 2019
Settlement date: 25 November 2019
First payment date: 15 January 2020
Coupon: 3mE+70bps
Yield at issue: 3mE+57bps
Issue price: 100.30%
Listing: Irish Stock Exchange
ISIN (Class A1): IT0005389264
Minimum denomination:
€100K + €1K
Mediobanca’s role:Sole Arranger & Joint Lead Manager
Funding & Treasury - Funding: structure & evolution Section 3.1
1) As of 31 December 2021
AGENDA
1. MB Group profile
2. 1H22 Results
3. Funding & Treasury
3.1 Funding: structure & evolution
3.2 Treasury: structure & evolution
Annex
1. ESG profile
2. 12m figures as at June 21

37
Client&Other
2.5
Trading
book
0.3
Liquidity
3.4
BB govies
5.3
BB bonds
2.6
CAUTIOUS ASSET & LIABILITIES MANAGEMENT
MB Group net treasury assets* (€bn) MB Group treasury assets* breakdown (Dec21)
8.4
11.8 12.09.2 8.7 9.9
8.4 7.7 6.7 6.8 7.1 7.9
8.6
9.3 8.2
9.3
5.05.6
7.3
4.95.5 6.2 6.4
6.2
J-11 J-12 J-13 J-14 J-15 J-16 J-17 J-18 J-19 J-20 J-21 D-21
Banking book Liquidity and HFT
14.1
Total €14.1bn
Net treasury assets: €14.1bn; ~55% banking book govies and corporate bonds, ~45% liquidity/low risk client business
Fixed income banking book at €7.9bn, ~2/3 represented by Govies, 60% of which are Italian
High liquidity: €3.4bn, o/w €2.8bn cash and liquidity at ECB
* Sum of: financial asset/liabilities held for trading, treasury financial assets/liabilities, banking book securities, excluding banking book equities
Italy 60%
Germany 17%
Other 22% Corporate
15%
Financials
85%
Treasury: structure & evolution Section 3.2

38
LOW SOVEREIGN EXPOSURE AND DURATION OF IT GOVIES
Banking book government bonds…by geography
Italian govies exposure confirmed low at €3.2bn (or
43% of CET1 capital) out of €5.3bn, o/w ~40% classified
as HTC
IT govies avg duration 3Y
Low sensitivity of CET1 to rates:
+50bps rates = ~5bps neg. impact on CET1
7.1
5.6 5.44.6 4.7
5.4 5.35.1
3.32.7
2.2
3.3 3.5 3.2
June16 June17 June18 June19 June20 June21 Dec21
Total Govies IT Govies
Treasury: structure & evolution Section 3.2
€m 20222023-
2026
2027-
2030Beyond Total
Italy 533 2,036 418 200 3,186
Germany 267 655 - - 922
France 351 - - - 351
Spain 100 - - - 100
US 441 57 - - 499
Other - 214 - - 214
Total 1,691 2,963 418 200 5,273
…and maturities
Book value (€bn) % CET1
Total Govies (Dec21) 5.3 72%
Italy 3.2 43%
- HTC 1.3 18%
- HTCS 1.8 25%
Germany 0.9 13%
France 0.4 5%
US 0.5 7%
Other 0.3 4%

39
BBB
22%
BB
76%B and
below
2%
BANKING BOOK BOND PORTFOLIO
Italy
71%
Benelux
3%Fra/Ger
8% US/UK
6%
Other
11%
AAA/AA
14%
A
35%
BBB
10%BB
31%
B and
below
9%NR
0.4%
AAA
13%
AA
3% A
42%
BBB
8%BB
23%
B and
below
10%
NR
0.4%
€0.4bn €2.2bn
Non Financials (15%) Financials (85%) Total (Dec21)
€2.6bn
€0.4bn €2.2bn €2.6bnItaly
75%
Benelux
3%
Fra/Ger
6%US/UK
4%
Other
13%
BB corporate bond portfolio at €2.6bn (~85% Financials, ~15% Non Financials), well diversified in terms of geographies
Non Financials: ratings concentrated mainly in the BB/BBB areas (76%/22%)
Financials: investment grade representing 66%, 89% IG+BB rating
Treasury: structure & evolution Section 3.2
Italy
53%
Benelux
5% Fra/Ger
22%
US/UK
17%
Other
4%
AGENDA
1. MB Group profile
2. 1H22 Results
3. Funding & Treasury
3.1 Funding: structure & evolution
3.2 Treasury: structure & evolution
Annex
1. ESG profile
2. 12m figures as at June 21

41
ESG DEVELOPMENT: STRATEGY, REPORTING AND COMPLIANCE …FOUNDATION AND DEVELOPMENT OF GROUP SUSTAINABILITY
2016-2017
2017-2018
2018-2019
Group
Sustainability unit
Group
Sustainability
management
Committee
Group
Sustainability Policy
First Materiality
Matrix
First Group
sustainability
reporting
Directive on
responsible
investing
Multi-stakeholder
forum to update
materiality matrix
Signed up to UN
Global Compact
First Consolidated
Non-Financial
Statement
New Policy on
responsible
lending and
investing
Responses to
leading ESG Index
questionnaires
E-learning course
on Sustainability
and Human Rights
Second
Consolidated Non-
Financial
Statement
CSR objectives in
the 2019-23
Strategic Plan and
in the LTI for top
mngt.
BoD CSR
Committee
Revised Group
Sustainability Policy
Signed up to
Principles for
Responsible
Investing
Third Consolidated
Non-Financial
Statement
2019-2020 CSR objectives in
the STI for top
mngt.
Revised Group
ESG Policy
Assessment of
SASB1 requests
Signatory to PRB -
Principles for
Responsible
Banking
Assessment for
aligning to the
requests of TCFD2
Implementing a
plan to respond to
the new EU ESG
regulatory context
2020-2021
1) Sustainability Accounting Standards Board is a US non-profit organization whose mission is to develop and disseminate sustainability reporting standards that help
companies disclose material and useful information to investors in order to make decision
2) Task Force on Climate-related Financial Disclosures
Signatory to the
Net-Zero Banking
Alliance
2021-2022
ESG profile Annex 1

42
…RELYING ON A STRONG GOVERNANCE
BoD committees
Board of Directors
Risks Committee
Remunerations
Committee
AppointmentsCommittee
CEO
General Manager
Executive Committee
Management committees
Group Sustainabilitymanagement
Committee
MembersAlberto Nagel (CEO)Giovanna Giusti del Giardino (Head of Group Sustainability) Top management of the Group staff and business activities
CSR Committee
ChairmanAlberto Nagel (CEO)MembersVirginie BanetMaximo IbarraAngela GambaElisabetta Magistretti
Related parties Committee
CEO in charge of sustainability.
Corporate Social Responsibility
Committee (including the CEO
and 3 independent BoD
members) has responsibility for
prior analysis of sustainability
issues to be submitted to the
BoD.
The Group Sustainability
Management Committee
remains responsible for defining
policies and implement
practices within the Group
Green and Sustainable Bond
Committee is composed by
Group Treasury, ESG team, CIB
division and all relevant legal
entities that contribute to the
origination of the Eligible Assets Green and Sustainable Bond Committee
ESG profile Annex 1

43
OUR SUSTAINABLY PRIORITIES ARE REFLECTED …
ENVIRONMENT & CLIMATE CHANGE
BRIBERY & CORRUPTION
DIVERSITY & INCLUSION
HUMAN RIGHTS
The Group Policy, in line with the principal international standards and declarations, is sub-divided into four areas held to be
priorities: measures to tackle bribery and corruption, human rights, diversity and inclusion and environment and climate
change with the objective of driving improvement in the Group’s conduct and direct impact in all these areas.
We promote diversity as a value that forms the basis of personal growth and cultural and professional
enrichment
We are committed to conducting our business in accordance with the highest ethical standards and
we do not tolerate any form of corruption, whether active or passive
We believe that respect of human rights is a fundamental prerequisite to our own sustainability
We are sensitive to the need to protect the environment, and climate change, as the primary
resource of human well-being
ESG profile Annex 1

44
… IN OUR EVOLVING GROUP INVESTMENT POLICY…NEW ESG POLICY RELEASED IN JULY 2021 AND EFFECTIVE STARTING FROM OCTOBER THE 1ST
Group Policy on responsible lending and
investing
The policy applies to lending activities, investment of own funds and advisory
services on investments provided to clients by the Mediobanca Group, pursuing
an approach which is based on a combination of:
Negative screening through use of exclusion criteria, to identify companies
involved in specific activities which therefore cannot be taken into
consideration for lending, investment and advice processes
Positive screening based on precise inclusion criteria to identify companies that
are committed to ESG issues
Reviewed
in July 21
New Group ESG Policy
The new policy:
widen the application spectrum (covering ECM, DCM, Corporate finance
advisory to CIB clients)
articulate more precisely negative and positive screening for all business areas
include a policy to protect biodiversity as well as specific lists of exclusion
criteria for lending and principal investment applicable to ESG sensitive sectors
(mining, forestry and use of forested areas, production of agricultural goods,
the energy sectors, defence and arms, and infrastructure and transport,
excluded materials)
ESG profile Annex 1

45
Mediobanca SGR, RAM Active Investment and Cairn Capital are signatories to the Principles for Responsible Investment
(PRI) launched by the United Nations in 2006 set up to promote a sustainable and responsible approach to investment by
institutional investors
… AND IN OUR AM BUSINESS
Mediobanca SGR has adopted a Policy on
responsible investments, considering the
integration of environmental, social and
governance criteria within the investment
processes as a priority
RAM adopted a Policy for responsible
investing setting out the investment beliefs,
the guidelines, and the approach to
consider and incorporate ESG factors into
investment process and strategies and a
Policy on climate change, to tackle climate
change risks through investment decisions
and direct or collaborative engagements
Cairn Capital has adopted an ESG policy
based on negative, top-down screening to
exclude companies operating in certain
sectors, combined with a bottom-up
approach to evaluating investments based
on ESG criteria specific to each asset
Mediobanca Social Impact
is a fund for philanthropic purposes, which has been developed in partnership with some of the leading Italian charitable which
receive a recurring devolution
CMB - MonactionInternational ESG fund
which invests in international equities based on robust
environmental, social and governance criteria for its
sector
RAM Stable Climate Global Equities Fund
a fund set up with the aim ofaddressing the climate emergency by offering
investors an active strategy based on solid ESG
principles
Some ESG products
and services
ESG profile Annex 1

46
EU REGULATIONS PROGRESSIVELY INTEGRATED …
GOVERNANCE
Task-Force Steering Committee
DISCLOSUREPOLICIES ANDPROCEDURES
Group ESG policies and website disclosure
BUSINESS STRATEGY
ESG products and services
RISKMANAGEMENT
ESG risks integration in lending and
investment processes
IMPACT ON REAL ECONOMY
Business/impact oriented approach to the integration of ESG Regulation changes
Mediobanca has set up a dedicated task force transversal to the main Group functions and legal entities impacted by the new European regulations with the aim of complying by the required times and methods
The task force is governed by a dedicated Steering Committee whose members cover different business areas and are committed to integrate regulation evolution and translate it into a new way of making business
Regulation
Taxonomy
ECB Guide on climate
related and environmental
risks
Sustainablefinance
disclosureregulation
ESG profile Annex 1

47
… WITH STRONG COMMITMENT TO FURTHER ESG DEVELOPMENT
Starting from FY22 CEO and GM STI include quantitative ESG targets (qualitative were already present).
For FY22 such targets include metrics related to ESG corporate loan book, ESG consumer loan new production
and ESG funds within clients’ portfolio.
DISTRIBUTION
CheBanca!: as at June 2021 €2.2bn (equal to almost 34% of the assets invested by clients in funds) was invested in funds ex SFDR art.8 and art.9.
MB Private Banking: as at June 2021 €127mln (equal to more than 20% of the assets invested by clients in funds) was invested in funds ex SFDR art.8 and art.9.
Procedure started to include ESG criteria in investment evaluation
RAM – as at June 2021 80% of the AUM was ex SFDR art.8 and art.9.
MB SGR - 3 ESG funds (ESG European Equity, ESG US Equity & Social Impact totaling €354mln as at June 2021) representing 15% of managed funds ex SFDR art.8.
ASSET MANAGEMENT
CORPORATE LOANS
Mediobanca has syndacated several ESG credit lines for domestic (including Enel, Inwit, Nexi) and international corporates (including Ramsay-GDS).
As at June 2021 CIB corporate loan book with green/ESG features totaled €1.5bn (10% of the total corporate loan book).
RETAIL LOANS
Consumer: new green production doubled YoY to €71mln. The green stock totaled €87mln as at June 2021.
Mortgages: green loon book totaled €159mln as at June
2021 (5X YoY).
ESG profile Annex 1

48
Transport &
infra
29%
Industrial goods
19%
Consumer
goods
19%
Telco&media
9%
Oil & gas
8%
Financials
6%Other
10%
CIB LOAN BOOK BY INDUSTRY
20%
9% 9%8% 7%
6%5%
3% 3% 3% 3% 3% 2% 2% 2% 2%
14%
WB loan book by sector (€16.6bn as at June21)
1. “Other” includes sectors with exposure each below 2%: Building Materials, Construction, Containers&Packaging, Services , Gaming, Healthcare,
Infrastructure, IT, Lodging&Leisure, Luxury, Metal, Paper, Restaurants&Catering, Retail non-Food, Transportation and other residual sectors
2. Investment grade (IG) including rating classes from AAA to BBB-, crossover including BB+ rating bucket
WB loans : €16.6bn, 34% of MB Group loans:
High quality portfolio with large-export oriented corporate clients and well diversified among sectors
Rating distribution: 60% IG, 13% crossover2
ESG loans: ~10% of total WB portfolio (€1.5bn)
Gas
17%
Pure
renewables
16%
Integrated
utilities
(Transportation
& Distribution)
43%
Oil
23%
Energy sector exposure by power source
(~€1bn as at June21)Energy exposure:
~€1bn, 7% WB loans and 2% MB Group loans
16% pure renewables
43% energy transportation & distribution
Just one exposure with coal generation (<7%, phasing-out)
No exposure to mining and coal mining sectors
ESG loans by sector
(€1.5bn as at June21)
ESG profile Annex 1

49
ESG
POLICY
INTERNATIONAL PRINCIPLES AND STANDARDS
SUSTAINABILITY
POLICY
17 UN Sustainable Development Goals (SDGs)
UN Principles for Responsible Banking (“PRB”)
UN Global Compact principles
In recent years the Mediobanca Group has signed up to the most important international principles and standards
Net Zero Banking Alliance
UN Principles for Responsible Investment (“PRI”)
NEW
ESG profile Annex 1

50
MEDIOBANCA – ESG INDEXES AND RATING1
Corporate rating: C (2^ decile)
Governance: 2
Environment: 2Social: 1
81 2 3 4 5 6 7 9 10lower risk higher risk
A B C+ C C- Dexcellent medium low
81 2 3 4 5 6 7 9 10high relative perf. (decile) low
S EG
Rating A
Mediobanca score: 4.9
Industry-adjusted score: 7.0
AAA AA A BBB BB Bexcellent medium low
CCC
Rating: 16/100 - low riskIndustry rank: 76/920
(Diversified Financials)
Subindustry rank 1/122(Investment Banking and Brokerage)
negligible low medium high severe
0-10 10-20 20-30 30-40 >40
ESG risk exposure: 41,9
ESG risk management: 64,4
low medium high
0-35 35-55 >55
low medium strong
0-35 35-55 >55
Rating C
A A- B B- C C-Leadership management awareness disclosure
D D-
Rating EE-
Outlook: positive
EEE
EEE-
EE+
Compliant
Non compliant
Negative
EE
EE-
E+
E
E-
F-
2021
Included in the index
Included in the index
(percentile rank: 77)
Environment: 2,0 Social: 3,8
Governance: 4,6
0 1 2 3 4 5weak strong
SE G
Environment: 59Sector average performance: 42
Social: 57Sector average performance: 42
Governance: 67Sector average performance: 44
weak limited robust advanced
0-29 30-49 50-59 60-100
Rating: 60/100 Rank in sector: 6/96
Rank in region: 161/1,624
Rank in Universe: 180/4,952
Performance leve:
ESG profile Annex 1
Not included in the index1
Score Mediobanca: 64Average score: 39
S&P Europe 350 ESGIncluded starting from April 2021
1) Updated as at 9 December 2021
Included in the 2022
Sustainability Yearbook

AGENDA
1. MB Group profile
2. 1Q22 Results
3. Funding & Treasury
3.1 Funding: structure & evolution
3.2 Treasury: structure & evolution
Annex
1. ESG profile
2. 12m figures as at June 21

52
MEDIOBANCA GROUP A&L
1) YoY=June21/June20; QoQ=June21/Mar212) CET1 Phase-in. CET1 FL @15.1% (without Danish Compromise 110 bps and with IFRS 9 fully phased 13bps)
12m figures as at June 21 Annex 2
€bn June21 Mar21 Dec20 Sept20 June20∆
QoQ1∆
YoY1
Funding 56.2 56.6 55.9 56.7 54.9 -1% +2%
Bonds 18.4 19.0 18.7 19.3 18.8 -3% -2%
Direct deposits (retail&PB) 25.2 25.2 24.6 24.2 23.8 +0% +6%
ECB 7.4 7.0 6.2 6.5 5.7 +7% +32%
Others 5.1 5.4 6.4 6.7 6.7 -6% -24%
Loans to customers 48.4 47.7 48.1 46.8 46.7 +2% +4%
CIB 19.3 18.9 19.5 18.6 18.6 +2% +3%
Wholesale 16.6 16.3 16.8 16.5 16.5 +2% +0%
Specialty Finance 2.7 2.5 2.7 2.1 2.1 +7% +28%
Consumer 12.9 12.8 12.8 12.9 13.0 +1% -1%
WM 14.4 14.3 14.0 13.5 13.2 +1% +9%
Mortgage 11.1 10.9 10.7 10.4 10.2 +2% +8%
Private banking 3.3 3.4 3.3 3.1 2.9 -1% +13%
Leasing 1.8 1.8 1.8 1.8 1.8 -1% -3%
Treasury and securities at FV 14.4 15.3 13.8 15.7 13.8 -6% +5%
RWAs 47.2 47.7 48.7 47.6 48.0 -1% -2%
Loans/Funding ratio 86% 84% 86% 83% 85%
CET1 ratio (%)2 16.3 16.3 16.2 16.2 16.1
TC ratio (%) 2 18.9 19.0 19.0 18.8 18.8

53
12M RESULTS BY DIVISION AS AT 30 JUNE 21
12m- June21 (€m)Wealth
ManagementConsumerBanking
CIBPrincipal Investing
Holding Functions
Group
Net interest income 281 879 287 (7) (47) 1,415
Net treasury income 10 - 93 31 58 197
Net fee and commission income 336 123 318 - 12 745
Equity-accounted companies - - - 272 - 272
Total income 627 1,002 698 295 22 2,628
Labour costs (241) (104) (165) (4) (121) (635)
Administrative expenses (231) (210) (141) (1) (39) (603)
Operating costs (472) (314) (307) (5) (160) (1,238)
Loan loss provisions (19) (258) 40 - (13) (249)
Provisions for other financial assets 2 - 2 52 (8) 48
Other income (losses) 4 (15) 1 - (74) (86)
Profit before tax 143 415 434 343 (232) 1,104
Income tax for the period (42) (136) (147) (34) 68 (292)
Minority interest - - (3) - (2) (4)
Net profit 100 279 285 309 (166) 808
Customer loans 14,405 12,943 19,292 - 1,774 48,414
RWAs 5,217 11,779 19,925 7,246 2,992 47,159
No. of staff 2,037 1,446 635 11 792 4,921
12m figures as at June 21 Annex 2

54
INVESTOR CONTACTS
Mediobanca Group
Investor Relations
Piazzetta Cuccia 1, 20121 Milan, Italy
Jessica Spina Tel. no. (0039) 02-8829.860
Luisa Demaria Tel. no. (0039) 02-8829.647
Matteo Carotta Tel. no. (0039) 02-8829.290
Marcella Malpangotto Tel. no. (0039) 02-8829.428
Email: [email protected]
http://www.mediobanca.com