memorandum › ei360transparencyapp › files...memorandum date: july 21, 2016 to: members of the...
TRANSCRIPT

MEMORANDUM
DATE: July 21, 2016
TO: Members of the Michigan Legislature
FROM: Steve Arwood President, Michigan Strategic Fund
SUBJECT: 2015 Michigan Renaissance Zone Annual Report
Section 15 of Public Act 376 of 1996, the Michigan Renaissance Zone Act, requires an annual report be submitted to the legislature. Pursuant to this requirement, attached is the 2015 annual report.
If you have any questions regarding this report, please contact Jeremy Hendges in our Office of Legislative Affairs at 517.335.1847.
Attachment

Michigan Renaissance Zone Act2015 Legislative Report
The Michigan Renaissance Zone Act (the “Act”), PA 376 of 1996, established the Michigan Renaissance Zone initiativeto foster economic opportunities in the state; facilitate economic development; stimulate industrial, commercial andresidential improvements; prevent physical and infrastructure deterioration of defined areas; and provide for thereuse of unproductive or abandoned industrial properties.
Most state and local taxes, including both real and personal property tax, are abated within Renaissance Zones for upto a maximum of 15 years, with the exception of one Alternative Energy Zone not to exceed 20 years. MichiganBusiness Tax liability is excused for company operations within a Renaissance Zone; however, Corporate Income Taxliability is not eligible for abatement under the program. Federal government taxes, local bond obligations, schoolsinking fund, or special assessments may still be due. Additionally, companies are not exempt from paying Michigansales and use taxes. The tax benefits are phased out in 25% increments during the Zone’s final three years ofexistence. All awards that expired, were revoked or otherwise ended will be removed from future reports.
The State of Michigan reimburses intermediate school districts, local school districts, community college districts, andpublic libraries for lost revenue where taxes are abated. The State of Michigan does not replace the tax revenue lostto the local unit of government or county.
This report captures the progress and development of Renaissance Zones that were active during the 2015 calendaryear. The report is divided by the eight major types of Renaissance Zones: (1) Agricultural Processing, (2) MSF-Designated, (3) Renewable Energy Facility, (4) Forest Products Processing, (5) Border Crossing Facility, (6) NextMichigan, (7) Tool and Die Recovery, and (8) Geographic. There are subsets within each of these major types whichwill be indicated within each section.
Official actions taken by the Michigan Strategic Fund (MSF) Board include granting new designations, amendingexisting ones, and revoking Renaissance Zones that are out of compliance.
Projections of anticipated capital investment and job creation within a Renaissance Zone shown in the tables on thefollowing pages were derived from the original application or development agreement. Projected information notenforced by a development agreement is footnoted by the Zone recipient name. Renaissance Zones not governed bydevelopment agreements were designated prior to this being required by statute or by policy. Reported ActualInvestment and Reported Actual Job Creation, as reported by the Renaissance Zone recipient, is an accumulation ofinformation from the first year that benefits were received through December 31, 2015. Reported Actual Job Creationis calculated by subtracting the Reported Baseline Jobs at Zone Designation and Reported Jobs Transferred to Zonefrom Reported Current Jobs. Reported Jobs Transferred to Zone are jobs that have been transferred to the Zone fromanother facility or entity outside the Zone owned by the Renaissance Zone recipient company. Reported JobsTransferred to the Zone are not considered as net new jobs. The tables also include the percent change in TaxableValue (TV) and State Equalized Value (SEV) since the Renaissance Zone designation, as reported to the MichiganEconomic Development Corporation (MEDC).
Renaissance Zone Annual Report / CY / 2015 / 1

Municipality of Residence Percent Change in AGIBenton Charter Township* 10City of Battle Creek 22.6City of Detroit -12.8City of Flint* -42.7City of Grand Rapids 8.6City of Jackson -58.9City of Kalamazoo* 41.2City of Lansing* -35.1City of Muskegon -22.5City of Saginaw -22City of Traverse City -35.3
*Figure is affected by subzones within the municipality’s jurisdiction that expired at the conclusion of 2013, causing thefigure to be diminished by the decreased number of eligible residents in the calculation for the subsequent year as wellas the small number of returns filed which causes the percentage to be volatile.
Change in Adjusted Gross Income of Residents in Renaissance Zones (AGI)
Projects associated with Renaissance Zones are mainly focused on business development; however, some projects areaimed toward residential development, especially many older geographic Renaissance Zones. Individual residents livingwithin a Renaissance Zone are eligible for certain individual benefits, including relief from property taxes and localincome taxes. As required by statute, the percentage change of Adjusted Gross Income (AGI) of residents who claimedRenaissance Zone benefits is reported below based on records obtained from the Michigan Department of Treasury forthe most recent complete years available – 2013 and 2014. This information is available by municipality of residence,rather than by Renaissance Zone.
Change in Adjusted Gross Income (AGI) for Residents of Renaissance Zones Between
2013 and 2014
Renaissance Zone Annual Report / CY / 2015 / 2

Materials Benefits
Company Local Unit of Government County Projected Investment 1Reported Actual
Investment
Projected Job Creation/
Retention 1
Reported Current Jobs 2
Reported Jobs Transferred
to Zone 3
Reported Baseline Jobs at Designation 4
Reported Actual Job Creation/
Retention 5
Reported Avg Weekly Wage of Jobs Created
% Change in Taxable Value (TV)
% Change in SEV% Raw Materials
from MI First Year Benefits
Received
Carbon Green BioEnergy, LLC Township of Woodland Barry $55,000,000 $70,189,339 33 38 0 2 36 $850 21,956.5 19,063.5 90.0 2006
Graceland Fruit, Inc. 6 Township of Gilmore Benzie $15,000,000 $32,946,400 45 121 0 91 30 $352 466.1 472 40.0 2003
W.K. Kellogg Institute for Food and Nutrition Research 6, 7 City of Battle Creek Calhoun $54,000,000 $84,700,000 300 (ret) 541 124 300 300 (ret)117 (cre)
$1,800 52.3 51.8 95.0 2009
The Andersons Albion Ethanol, LLC Township of Sheridan Calhoun $70,000,000 $90,578,467 30 43 0 0 43 $1,007 33,667.0 34,203.0 100.0 2006
Michigan Milk Producers Village of Ovid Clinton $35,000,000 $68,622,596 10 120 0 86 34 $607 38,899.0 18,466.0 100.0 2009
Shoreline Fruit, LLC Township of Acme Grand Traverse $12,750,000 $8,500,000 33 159 0 84 75 $520 74.7 26.6 80.0 2013
Kellogg Company 6, 7 City of Grand Rapids Kent $35,000,000 $87,500,000 390 (ret)43 (cre)
551 125 300 126 $1,500 51.1 50.5 8.6 2003
Airgas Carbonic, Inc. Township of Riga Lenawee $0 $10,568,706 17 16 0 0 16 $1,034 335.0 335.0 100.0 2014
Green Plains Holdings II, LLC Township of Riga Lenawee $85,000,000 $97,621,857 44 47 0 0 47 $1,013 16,884.7 16,884.7 57.0 2006
Gerber Products Company 6 City of Fremont Newaygo $75,000,000 $279,858,537 1,100 (ret)200(cre)
1,358 49 1,1001,100 (ret)209 (cre)
$970 151.2 90 40.8 2009
Dairy Farmers of America, Inc.6 City of Cass City Tuscola $40,000,000 $50,288,587 25 31 0 0 31 $1,075 42,455.7 21021.4 50.0 2014
Arbre Farms & Willow Cold Food Storage Township of Colfax Oceana $21,000,000 $31,882,553 54 269 0 103 166 $435 947.2 935 92.0 2006
Gray & Company 7 City of Hart Oceana $22,600,000 $16,084,114 150 117 0 0 117 $700 42.5 42.5 75.0 2001
Burnette Foods, Inc. fka New Era FoodsVillage of New Era/ Township of Grant
Oceana $5,000,000 $12,193,255 40 90 0 45 45 $594 32.1 86.5 80.0 2003
Peterson Farms 6 Township of Hart Oceana $15,000,000 $106,966,479 225 625 0 246 379 $320 3,099.5 3,078.2 50.0 2001
Leprino Foods Company Township of Allendale Ottawa $85,000,000 $116,399,458 53 291 71 220 0 $1,044 120.9 122.8 98.0 2006
Zeeland Farm Services, LLC Township of Zeeland Ottawa 2003
Request Foods, Inc. 6 Township of Holland Ottawa $35,200,000 $84,147,216 155 206 101 0 105 $520 8,519.9 8,582.4 30.0 2011
$1,249,047,564 1,576 (cre)
Agricultural Processing Renaissance Zones are company-specific rather than geographically targeted, and are limited to companies in the business of agricultural processing. The Michigan Renaissance Zone Act originally allowed for the designation of five Agricultural Processing Renaissance Zones by the State Administrative Board. The Act was amended three times to increase the number of potential zone designations to a total of 30 Agricultural Processing Renaissance Zones.
As of December 31, 2015, the Michigan Strategic Fund (MSF) and the Michigan Commission of Agriculture & Rural Development (MCARD) have recommended designation of 28 of the 30 available zones to the State Administrative Board pursuant to Section 8c(1) of the Act. Of the 28 zones designated, 18 Agricultural Processing Renaissance Zones were active during 2015.
The majority of the Agricultural Processing Renaissance Zones were designated when the statute required the execution of development agreements requiring annual reporting; however, those companies without a development agreement governing their Renaissance Zone were asked to voluntarily report.
These Renaissance Zones have reported creating 1,576 jobs and leveraging approximately $1.25 billion in private investment during the active periods of the zones. The following is the information on the status of all active Agricultural Processing Renaissance Zones.
Agricultural Processing Renaissance Zone Activity
7 Metrics not enforced by a Development Agreement
4 Information derived from original application or reported by the company in annual progress report
1 Projected information is derived from original application or development agreement2 The number of jobs the company reported to have on December 31, 20153 Jobs transferred to the Zone from another facility or entity owned by the same company outside of the Zone
5 Reported Actual Job Creation/Retention is calculated by subtracting Reported Jobs Transferred to Zone and Reported Baseline Jobs at Zone Designation from Reported Current Jobs6 Company received additional state economic incentive(s)
Classification Investment Tax Information
Did Not Report - No Reporting Requirements in Agreement
Jobs
TOTALS:
Renaissance Zone Annual Report / CY / 2015 / 3

Benefits
Type CompanyLocal Unit of Government
CountyProjected
Investment 1Reported Actual
Investment
Projected Job Creation/
Retention 1
Reported Current Jobs 2
Reported Jobs Transferred
to Zone 3
Reported Baseline Jobs at
Designation 4
Reported Actual Job Creation/
Retention 5
Reported Avg Weekly Wage of
Jobs Created
% Change in Taxable Value
(TV)
% Change in SEV
First Year Benefits Received
Sakthi Auto Group USA 6,8 City of Detroit Wayne $5,000,000 $0 50 0 0 0 0 $0 0.0 0.0 2016
Dow Chemical Company 6, 7 City of Midland Midland $65,000,000 $96,271,295 65 86 0 0 86 $954 0.0 0.0 2003XALT Energy MI, LLC (formerly Dow Kokam MI, LLC) 6
City of Midland Midland $294,000,000 $372,476,177 320 162 3 17 142 $1,371 33,416.5 33,416.5 2011
La-Z-Boy, Inc. 6Township of Frenchtown
Monroe $45,000,000 $66,311,130 50 (cre)/ 450 (ret) 543 0 405 138 $1,210 100.0 100.0 2014
Michigan Motion Picture Studios, LLC 6, 7 City of Pontiac Oakland $40,000,000 $56,428,656 3,600 4 0 0 4 $1,600 56.5 51.9 2010
Marathon Petroleum Company 6 City of Detroit Wayne $200,000,000 $302,911,880 280 (ret) 413 0 330 330 (ret)83 (cre)
$2,402 3,358.3 3,358.3 2003
NextEnergy 7 City of Detroit Wayne $26,000,000 Not Reported 2003
A123 Systems, Inc. 6 City of Romulus Wayne $19,000,000 $114,236,945 46 77 9 0 68 $1,143 49.8 49.8 2011
Eaton Aeroquip LLC 6 City of Jackson Jackson None $18,421,327 348 (ret) 689 0 563 563 (ret)126 (cre)
Not Reported 70.6 72.1 2008
Alpinist Endeavors Dev. City of Walker Kent None $10,500,000 None 0 0 0 0 Not Reported Not Reported Not Reported 2007Dow Corning Corporation 6, 7 City of Midland Midland $180,000,000 $60,055,443 50 1,291 26 1,137 128 $1,100 1,039.5 1039.5 2007Greenville Industrial Park - Northland Corporation (AGA Marvel) 6
City of Greenville Montcalm None $22,858,934 None 241 0 133 108 $1,615 11,811.4 5,523.6 2007
$1,120,471,787 883(cre)
8 Approved by the MSF Board on December 15, 2015. Reporting requirements start at the end of 2016.
Michigan Strategic Fund Designated Renaissance Zones
Redevelopment Zones
Classification Investment Tax Information
Non-industry specific Zones
Jobs
TOTALS:
Did Not Report - No Reporting Requirements
The MSF Board may designate Renaissance Zones anywhere in the state as long as the city, village, or township consents to the creation of a Renaissance Zone within its boundaries. MSF-Designated Renaissance Zones are company and project-specific, with one exception of a special kind of MSF-Designated Redevelopment Renaissance Zone awarded to the City of Greenville. MSF-Designated Renaissance Zones are mostly industry-neutral and decisions on which companies’ projects shall receive the designation are made collaboratively with the local government, the company, state agencies, and approved by the MSF Board.
As of December 31, 2015, a total of 17 MSF-Designated Renaissance Zones have been awarded, 12 of which were active in 2015. There are ten zones available for designation, two of which are required to be redevelopment zones and three must be in a rural area.
The majority of the MSF-Designated Renaissance Zones were designated when the statute required the execution of development agreements requiring annual reporting; however, those companies without a development agreement governing their Renaissance Zone were asked to voluntarily report.
These Renaissance Zones have reported creating 883 jobs and leveraging more than $1.12 billion in private investment during the active periods of the zones. The following is the information on the status of all active MSF-Designated Renaissance Zones
6 Company received additional state economic incentive(s)7 Metrics not enforced by a Development Agreement
1 Projected information is derived from original application or development agreement2 The number of jobs the company reported to have on December 31, 20153 Jobs transferred to the Zone from another facility or entity owned by the same company outside of the Zone4 Information derived from original application or reported by the company in annual progress report5 Reported Actual Job Creation/Retention is calculated by subtracting Reported Jobs Transferred to Zone and Reported Baseline Jobs at Zone Designation from Reported Current Jobs
Renaissance Zone Annual Report / CY / 2015 / 4

Benefits
CompanyLocal Unit of Government
CountyProjected
Investment 1Reported Actual
InvestmentProjected Job
Creation 1Reported
Current Jobs 2
Reported Jobs Transferred
to Zone 3
Reported Baseline Jobs at
Designation 4
Reported Actual Job Creation 5
Reported Avg Weekly Wage of
Jobs Created
% Change in Taxable
Value (TV)
% Change in SEV
First Year Benefits Received
LG Chem Michigan, Inc. 6 City of Holland Allegan $302,000,000 $322,741,036 300 324 9 0 315 $1,008 12,810.3 5,167.8 2011
Alpena Prototype Biorefinery, LLC 6, 7 City of Alpena Alpena $23,500,000 2010
Heat Transfer International, LLC 6 City of Kentwood Kent $2,000,000 $2,647,587 12 4 0 10 -6 $1,698 249.7 643.8 2010
Grid Logic Incorporated 6,8 Township of Lapeer Lapeer $20,630,000 $4,808,604 161 12 0 7 5 $2,400 50.4 61.5 2012
The Dow Chemical Company 6 City of Midland Midland $167,000,000 $113,562,070 500 48 0 0 48 $1,662 3,694.8 3,683.4 2011$443,759,297 362
1 Projected information is derived from original application or development agreement2 The number of jobs the company reported to have on December 31, 20153 Jobs transferred to the Zone from another facility or entity owned by the same company outside of the Zone4 Information derived from original application or reported by the company in annual progress report5 Reported Actual Job Creation/Retention is calculated by subtracting Reported Jobs Transferred to Zone and Reported Baseline Jobs at Zone Designation from Reported Current Jobs6 Company received additional state economic incentive(s)7 Company's Renaissance Zone was Revoked on February 23, 2016.8 Company's Renaissance Zone was Revoked on June 28, 2016.
TOTALS:
Renewable Energy Renaissance Zones
Classification Tax InformationInvestment Jobs
Not Reported
Renewable Energy Renaissance Zones are company-specific rather than geographically targeted, and are limited to companies in the business of renewable energy. The Michigan Renaissance Zone Act, as amended, authorizes the State Administrative Board to designate up to 15 Renewable Energy Renaissance Zones, upon recommendation by the MSF Board. Of the 15 zone designations, five must be used for renewable energy facilities engaged in the production of cellulosic biofuels.
As of December 31, 2015, nine zones had been designated with five in effect; three of the five designations satisfy the requirement for the production of cellulosic biofuels. There are currently six zones available for designation, two of which must satisfy the requirement for the production of cellulosic biofuels.
These Renaissance Zones have reported creating 362 new jobs and leveraging approximately $443.8 million in private investment during the active periods of the zones. The following is the information on the status of all active Renewable Energy Renaissance Zones.
Renaissance Zone Annual Report / CY / 2015 / 5

Materials Benefits
CompanyLocal Unit of Government
CountyProjected
Investment 1Reported Actual
Investment
Projected Job Creation/
Retention 1
Reported Current Jobs 2
Reported Jobs Transferred
to Zone 3
Reported Baseline Jobs at
Designation4
Reported Actual Job Creation/
Retention 5
Reported Avg Weekly Wage of
Jobs Created
% Change in Taxable
Value (TV)
% Change in SEV
% Raw Materials from MI (2012)
First Year Benefits Received
Arauco North America 7 Township of Grayling Crawford $325,000,000 $0 250 0 0 0 0 $0 0 0 0 2016
Verso Quinnesec, LLC 6 Township of Breitung Dickinson $43,000,000 $50,000,000 400 (ret) 424 4 472424 (ret) -52 (cre)
$1,200 154.6 154.9 39% 2011
$50,000,000
7 Approved by the MSF Board on October 27, 2015. Reporting requirements start at the end of 2016.
Forest Products Processing Renaissance Zone
Classification Investment Tax InformationJobs
TOTALS:
Forest Products Processing Renaissance Zones are company-specific rather than geographically targeted. Section 8(f) of the Michigan Renaissance Zone Act, as amended, allows for the designation of ten Forest Products Processing Renaissance Zones by the State Administrative Board, upon recommendation of the MSF Board. As of December 31, 2015, two zones have been designated, leaving eight additional Forest Products Processing Renaissance Zones available for designation.
These Forest Products Processing Renaissance Zones reported retaining 424 jobs and leveraging $50 million in private investment during the active period of the zone.
424 (ret) -52 (cre)
6 Company received additional state economic incentive(s)
1 Projected information is derived from original application or development agreement2 The number of jobs the company reported to have on December 31, 20153 Jobs transferred to the Zone from another facility or entity owned by the same company outside of the Zone4 Information derived from original application or reported by the company in annual progress report5 Reported Actual Job Creation/Retention is calculated by subtracting Reported Jobs Transferred to Zone and Reported Baseline Jobs at Zone Designation from Reported Current Jobs
Renaissance Zone Annual Report / CY / 2015 / 6

Border Crossing Facility Renaissance Zones
The Michigan Renaissance Zone Act, as amended, allows for the designation of up to 25 BorderCrossing Facility Renaissance Zones in qualified border local governmental units, if the city or townshipor combination of cities and townships consented to the creation of a Renaissance Zone. As ofDecember 31, 2015, no Border Crossing Facility Renaissance Zones have been designated.
Renaissance Zone Annual Report / CY / 2015 / 7

Next Michigan Renaissance ZonesThe Next Michigan Development Act, P.A. 275 of 2010, as amended, authorizes the MSF to designate up toseven Next Michigan Development Corporations, comprised of local government units that enter into an inter-local agreement to form a Corporation. These Next Michigan Development Corporations are empowered torecommend certification of a Next Michigan Renaissance Zone within their Next Michigan Development District,consisting of the boundaries of the component local government units. By the close of the 2015 calendar year,the following five Next Michigan Development Corporations have been approved, with two additionaldesignations pending, one in the Upper Peninsula and one in the City of Detroit.
1. Port Lansing comprised of the City of Lansing and a portion of Dewitt Township via a P.A. 425 Agreement.2. Detroit Region Aerotropolis – VantagePort comprised of the City of Taylor, City of Romulus, City of Belleville,City of Ypsilanti, Township of Huron, Charter Township of Van Buren, and Charter Township of Ypsilanti; Countyof Washtenaw and County of Wayne.3. West Michigan Economic Partnership comprised of the City of Grand Rapids, City of Kentwood, CharterTownship of Cascade, City of Wyoming, and City of Muskegon; County of Muskegon and County of Kent.4. I-69 International Trade Corridor comprised of the Township of Grand Blanc, Township of Mount Morris,Township of Mundy, City of Burton, City of Corunna, City of Durand, City of Fenton, City of Flint, City of GrandBlanc, City of Imlay City, City of Lapeer, City of Marysville, City of Owosso, City of Perry, City of St. Clair,Township of Attica, Township of Davison, Township of Flint, Township of Kimball, Township of Lapeer, Townshipof Perry, Township of St. Clair, Township of Vernon, Village of Almont, Village of Lennon, Village of Morrice,Village of North Branch, and Village of Vernon; County of St. Clair, County of Lapeer, County of Genesee andCounty of Shiawassee.5. Grand Traverse Region – Northern Nexus comprised of the City of Traverse City, Charter Township ofGarfield, Charter Township of East Bay, and Township of Blair; County of Grand Traverse.
Next Michigan Renaissance Zones are project-specific and must be associated with one or more Eligible NextMichigan Businesses, which are those companies engaged in multi-modal product shipment, such as logistics-based businesses. Next Michigan Development Corporations may submit an application on behalf of an EligibleBusiness to the MSF for certification of a proposed Renaissance Zone designation. Up to a total of 25 eligiblebusinesses can be certified to receive benefits under the Act, but no more than ten businesses can be certifiedwithin any one Next Michigan Development Corporation district as qualified Eligible Next Michigan Businesses.Once an Eligible Next Michigan Business is certified, it may begin receiving Renaissance Zone benefits for theduration of the designation of up to 15 years. As of December 31, 2015, no Next Michigan DevelopmentCorporations have submitted applications on behalf of an Eligible Next Michigan Business to the MSF Board, andno Renaissance Zone certifications have taken place.
Renaissance Zone Annual Report / CY / 2015 / 8

Benefits
Collaborative Company 1Local Unit of Government
Projected Investment 2
Reported Actual Investment
Projected Job Creation 2
Reported Current Jobs 3
Reported Jobs Transferred
to Zone 4
Reported Baseline Jobs at
Designation 5
Reported Actual Job Creation 6
Reported Avg Weekly Wage of
Jobs Created
% Change in Taxable
Value (TV)
% Change in SEV
First Year Benefits Received
American Tooling & Manufacturing Coalition Hi-Tech Tool Industries, Inc. (aka HTI Cybernetics) 7 City of Sterling Heights $2,250,000 $1,727,969 10 74 0 43 31 $1,226 -28.8 -19.7 2009
Automation & Tooling Alliance of North America
Labor Aiding Systems, Inc. Township of Napoleon $190,000 $379,625 14 35 0 28 7 $942 -3.9 -20.6 2006
Berrien Tooling Coalition Mach Mold, Inc. 7 Township of Benton $965,809 $831,076 8 42 0 29 13 $739 -23.2 -23.2 2010
Eckhart & Associates, Inc.Township of Watertown
None $1,128,664 2 55 0 40 15 $1,200 43.8 38.8 2007
Franchino Mold & Engineering Co. 7Township of Watertown
None $8,745,610 None 88 0 69 19 $755 17.1 9.8 2008
Philips Machining Company City of Coopersville $740,000 $2,064,024 None 18 0 13 5 $1,048 -30.6 -30.8 2005SelfLube City of Coopersville $6,000,000 $1,116,147 25 28 6 22 0 $722 -27.5 -24.8 2005Centerline Die & Engineering City of Warren None $1,858,918 None 13 0 20 -7 $757 23 15.6 2013Proper Group International, Inc. City of Warren None $14,810,006 10 244 2 200 42 $640 104.9 104.5 2010The Paslin Company City of Warren None $10,242,919 None 662 272 287 103 $1,310 -27.7 -29.8 2013
First Choice Machining Solutions Precision Tool Company, Inc. City of Roosevelt Park None $1,054,927 None 17 0 22 -5 Not Reported 60.7 20 2008
Fori Automation, Inc. 9 Township of Shelby $350,000 $2,314,181 48 215 0 131 84 $1,525 -0.32 0.25 2009
Schwab Industries, Inc. 7 Township of Shelby $4,000,000 $5,420,240 12 92 0 65 27 $520 59.1 54.6 2010Great Lakes Tool & Die
CollaborativeParamount Tool & Die, Inc. Village of Wright $200,000 $986,276 10 13 0 10 3 $955 -79.8 433.1 2005
Arbor Gage & Tooling, Inc. City of Grand Rapids $1,500,000 $2,003,779 10 35 0 35 0 Not Reported 27.9 25.3 2010
KEO Cutters, LLC City of Warren $375,000 $1,955,934 5 53 0 65 -12 Not Reported -6.5 -4.8 2010
Praet Tool & Engineering, Inc. 7 Township of Macomb $800,000 $846,304 10 26 0 26 0 Not Reported -56.3 -53.6 2010
Troy Industries, Inc. Township of Shelby $90,000 $301,456 1 5 0 5 0 Not Reported 13 13 2010Michigan Tooling Group Krieger Craftsmen, Inc. City of Walker $1,000,000 $5,318,519 14 27 0 17 10 Not Reported 412.9 469.6 2005
Global Tooling Alliance
Michigan International Tooling Alliance
Eastern Michigan Tool & Die Collaborative
Tool & Die Recovery Renaissance Zones
COMPANIES WITH REPORTING REQUIREMENTSClassification Investment Tax Information
Capital Area Tooling Partnership
Coopersville Tooling Coalition
Jobs
The Michigan Renaissance Zone Act, as amended, allows the MSF Board to designate up to 35 Tool & Die Renaissance Recovery Zones (“Recovery Zones”) in the state, to be located in cities, townships, and villages that consented to the creation of a Tool & Die Recovery Zone within their boundaries. The Tool & Die Renaissance Recovery Zone Program was designed for the purpose of sustaining the tool and die industry in Michigan, not necessarily to stimulate economic growth. The structure differs from the rest of the overall Renaissance Zone Program in that each Recovery Zone is attached to a particular Collaborative of tool and die companies. Membership in one of these Collaboratives is required to become eligible to receive the benefits of that Collaborative’s Recovery Zone. Many Collaboratives represent tool and die companies in a particular geographic region of Michigan, while others have members across the state who receive Recovery Zone benefits.
Each Collaborative is governed by a qualified collaborative agreement between its members with the purpose of encouraging cooperation among tool and die companies to help strengthen them and retain existing jobs, as well as make them more competitive in the global marketplace. In addition to Collaborative membership, eligibility for a Tool & Die Recovery Zone requires that the parcel(s) of property designated must be leased or owned by a qualified tool and die business and be used primarily for tool and die business operations. Also, businesses must be classified with an appropriate North American Industrial Classification System (NAICS) code listed in the Act corresponding to the tool and die industry.
Companies with over 75 employees have the added requirement of entering into a written memorandum of understanding (MOU) with the MSF Board and local unit of government. The MOU does not impose job creation or capital investment requirements, contrasting with development agreements related to other types of Renaissance Zones. The vast majority of the tool and die companies do not have contractual reporting requirements. Most new Recovery Zone designations or amendments granted in the last several years were conditioned upon agreeing to annual reporting to the MEDC.
As of December 31, 2015, there were a total of 29 Collaboratives, each with their own Tool & Die Recovery Zone, consisting of approximately 267 companies in approximately 36 counties across the State, each receiving Renaissance Zone benefits. The Recovery Zones have reported creating 2,220 new jobs and leveraging more than $463 million in private investment during the active periods of the zones.
The following information on the status of companies within a Tool & Die Recovery Renaissance Zone is separated into two categories. The first table contains information pertaining to companies that have reporting requirements. Projected information is available for many of these companies, even when reporting is not contractually required. The second table contains the majority of Tool & Die Recovery Renaissance Zone recipients, those companies without the obligation to annually report on their status.
Renaissance Zone Annual Report / CY / 2015 / 9

Benefits
Collaborative Company 1Local Unit of Government
Projected Investment 2
Reported Actual Investment
Projected Job Creation 2
Reported Current Jobs 3
Reported Jobs Transferred
to Zone 4
Reported Baseline Jobs at
Designation 5
Reported Actual Job Creation 6
Reported Avg Weekly Wage of
Jobs Created
% Change in Taxable
Value (TV)
% Change in SEV
First Year Benefits Received
COMPANIES WITH REPORTING REQUIREMENTSClassification Investment Tax InformationJobs
Northwest Michigan Tooling Coalition United Engineered Tooling, Inc. 7,8,10 Township of Garfield $750,000 2006
Accu-Mold, Inc. 7 City of Portage $830,000 $696,094 None 17 0 12 5 $1,032 134.5 126.2 2005
Tri-Mation Industries, Inc. Village of Mattawan $50,000 $780,183 14 25 0 7 18 $1,100 -35.3 -31 2005
Advanced Integrated Tooling Solutions, LLC 7 Charter Township of Chesterfield
None $15,400,609 None 308 0 135 173 $1,713 23.3 23.4 2011
Baker Aerospace Machining & Tooling, Inc. (Combined First and Second Location) 7
Township of Macomb $8,000,000 $26,624,451 230 201 0 138 63 $1,431 676.9 681.9 2009
Ideal Technology Corporation Township of Shelby None $2,589,440 3 35 0 12 23 $1,026 18.9 19.4 2009
KBE Precision Products, LLC City of New Baltimore $1,000,000 $928,264 8 15 0 12 3 Not Reported 20.6 23.3 2013
Mistequay Group, Ltd 7 City of Standish None $1,607,164 5 62 9 34 19 $625 52.6 48.8 2010
TransNav Technologies, Inc. 7 City of New Baltimore $1,000,000 $929,566 10 35 0 21 14 $1,250 2.2 -4 2010
Tooling Advantage Group TG ManufacturingTownship of Grand Haven
None $225,945 None 39 4 35 0 $560 -35.2 -48.3 2007
3DM Source, Inc. 9 City of Grand Rapids $200,000 $364,315 5 0 0 12 -12 Not Reported -89.7 -89.7 2013
Advanced Tooling Systems, Inc. Township of Alpine None $1,328,585 5 86 0 73 13 $1,300 -12.9 -16.9 2007
Advanced Tooling Systems, Inc. City of Grand Rapids $500,000 $187,731 10 15 0 13 2 $1,300 -35.6 -35.6 2013
Concept Tooling Systems, Inc. City of Grand Rapids $50,000 $53,980 5 26 0 14 12 $1,400 -98.5 -98.5 2007
Hot Stamp Tooling System City of Grand Rapids $5,000,000 $835,804 68 13 0 0 13 $1,300 -87.8 -89.1 2013
Steel Craft Technologies, Inc. Township of Plainfield None $6,209,729 None 77 0 20 57 $900 280.1 280.1 2007
Steel Craft Technologies, Inc. City of Grand Rapids $3,100,000 $2,947,125 37 47 0 0 47 $1,100 52.1 52.1 2013
Ultimate Gaging Systems, Inc. City of Grand Rapids $800,000 $396,149 12 25 0 18 7 $1,250 -89.9 -89.9 2013
$125,211,707 792
1 Metrics for all companies are not enforced by a Development Agreement2 Projected information is derived from original application or development agreement3 The number of jobs the company reported to have on December 31, 20154 Jobs transferred to the Zone from another facility or entity owned by the same company outside of the Zone5 Information derived from original application or reported by the company in annual progress report6 Reported Actual Job Creation/Retention is calculated by subtracting Reported Jobs Transferred to Zone and Reported Baseline Jobs at Zone Designation from Reported Current Jobs7 Company received additional state economic incentive(s)8 Company issued Notice of Non-Compliance9 Company's Renaissance Zone was Revoked on April 26, 2016.10 Company's Renaissance Zone was Revoked on June 28, 2016.
Tooling Systems Group
Southwest Michigan Tooling Collaborative
TOTALS:
Third Coast Tooling Alliance
Did Not Report
Renaissance Zone Annual Report / CY / 2015 / 10

Investment Benefits
Collaborative Company 1 Local Unit of GovernmentReported Actual
InvestmentReported
Current Jobs 2
Reported Jobs Transferred
to Zone 3
Reported Baseline Jobs at Designation 4
Reported Actual Job Creation 5
Reported Avg Weekly Wage of
Jobs Created
% Change in Taxable Value
(TV)% Change in SEV
First Year Benefits Received
Accurate Injection Molds, Inc. Township of Clinton 2009American Gear & Engineering, Inc. City of Westland $372,426 47 0 47 0 Not Reported -17.9 -17.9 2009Atlantic Tool, Inc. Township of Clinton Not Reported 2 0 3 -1 Not Reported -35.5 Not Reported 2009Bradley-Thompson Tool Company City of Southfield $364,597 17 5 17 -5 $1,200 -0.24 -1 2009
Cambron Engineering, Inc. City of Bay City 2009
Deppe Mold & Tooling, Inc. City of Grandville $1,312,740 19 0 13 6 $796 7.4 5.7 2009
Die Stampco, Inc. City of Bay City 2009
Linwood Tool Company, Inc. Township of Kawkawlin $214,000 12 1 15 -4 $840 1.9 -1.1 2009
Maes Tool & Die Company Township of Blackman $71,938 14 0 14 0 $830 -34.1 -37.7 2009Modern Machine Company City of Bay City 2009MPD Welding, Inc. Township of Orion $465,075 31 0 29 2 $900 -33.8 -40.4 2009Shouse Tool Company City of Fenton $1,004,152 18 0 14 4 $840 42.9 41.4 2009B & R Gear Company Township of Blackman 2006
Diversified Precision Products Township of Spring Arbor $3,520,915 31 0 27 4 $800 25.4 27.3 2006
Hogle Sales & Manufacturing, LLC Township of Columbia 2006Lomar Machine & Tool Company Township of Hanover $5,314,696 135 0 62 73 $695 42.2 91.4 2010Marathon Weld Group, LLC Township of Napoleon $2,614,675 40 0 16 24 $749 187.4 176.1 2006NK Designs, Inc. Township of Leoni 2006Northwest Tool & Machine, Inc. Township of Blackman $2,095,371 24 0 22 2 $1,144 6.9 -1.7 2006Orbitform, LLC City of Jackson $2,309,000 82 0 47 35 $600 -0.45 -0.45 2006
Wardcraft, Div. of McLaughlin Ward & Co. Township of Spring Arbor $716,362 31 0 26 5 $678 -98.2 -9.7 2006
Accu Die & Mold, Inc. Township of Lake $462,814 42 3 39 0 $1,210 45.5 45.5 2006Custom Tool & Die Co. Township of Lincoln 2010Dane Systems, LLC Township of Lincoln 2007Eagle Technologies City of Bridgman $6,148,530 142 0 43 99 $1,442 Not Reported -24.6 2006Griffin Tool, Inc. Village of Stevensville $5,007,380 61 0 32 29 $840 746.5 479.7 2006Hanson Mold Township of St. Joseph $6,603,904 93 0 61 32 $770 30.5 30.5 2010Kelm Acubar LC 6 Township of Benton $332,073 25 0 24 1 $865 53.1 47.3 2013
Did Not Report
Did Not Report
Did Not Report
Automation & Tooling Alliance of North America (ATANA)
Did Not ReportBerrien Tooling Coalition
Did Not Report
Did Not Report
Tool & Die Renaissance Recovery Zones
COMPANIES WITHOUT REPORTING REQUIREMENTS
Tax Information
American Tooling & Manufacturing Coalition
Classification Jobs
Did Not Report
Did Not Report
Did Not Report
Renaissance Zone Annual Report / CY / 2015 / 11

Investment Benefits
Collaborative Company 1 Local Unit of GovernmentReported Actual
InvestmentReported
Current Jobs 2
Reported Jobs Transferred
to Zone 3
Reported Baseline Jobs at Designation 4
Reported Actual Job Creation 5
Reported Avg Weekly Wage of
Jobs Created
% Change in Taxable Value
(TV)% Change in SEV
First Year Benefits Received
COMPANIES WITHOUT REPORTING REQUIREMENTS
Tax Information
Classification Jobs
Liberty Steel Fabricating, Inc. Township of St. Joseph 2010Maximum Mold Township of Benton $700,000 39 0 10 29 $1,000 556.2 556.2 2007Michigan Mold, Inc. City of Coloma 2007Shoreline Mold & Engineering, LLC Township of Sodus $366,000 5 0 5 0 $920 -57.4 -44.9 2006Standard Tool & Die, Inc. Township of Lincoln $3,966,298 57 5 67 -15 $750 14.5 12.3 2007West Michigan Tool & Die, Inc. Township of Benton 2006Cameron Tool Corporation City of Lansing 2007Diamond Engineering, Inc. City of Lansing 2007Future Tool & Machine, Inc. City of Romulus $2,008,365 35 0 38 -3 Not Reported 19.9 -6 2008MC Molds, Inc. City of Williamston 2007Plasco Corporation 6 Village of Romeo 2009Tool Trend, Inc. City of Lansing 2007Aggressive Tooling, Inc. City of Greenville $2,694,723 79 0 43 36 $1,241 92.9 91.9 2006D.S. Mold, LLC City of Belding 2009Digitrace, Ltd. Township of Leighton 2010Edmore Tool & Grinding, Inc. Township of Home $183,800 19 4 18 -3 $640 -58.2 -58.9 2006
Edmore Tool & Grinding, Inc. (Second Location) 7 Township of Home 2006
LeRoy Tool & Die, Inc. Township of LeRoy $900,000 66 0 27 39 $592 304.3 217.6 2006Steeplechase Tool & Die, Inc. Township of Cato $900,503 52 0 38 14 Not Reported Not Reported Not Reported 2006Aggressive Tool & Die, Inc. City of Coopersville 2010H.S. Die & Engineering, Inc. (Combined First and Second Location)
Township of Tallmadge / City of Walker
$15,520,514 260 0 180 80 $560 -5.2 -7.8 2010
Morren Mold & Machine, Inc. Township of Allendale $175,000 1 0 2 -1 Not Reported 5.8 -0.11 2007Bawden Industries, Inc. City of Romulus 2006CDM Machine Company, Inc. Township of Redford $605,802 15 14 1 Not Reported -16.6 -9.2 2011Contour Tool & Machine, Inc. City of Jackson $1,301,830 13 0 7 6 $764 29.9 15.7 2006Euclid Machine & Manufacturing Co. City of Romulus 2006
Kimastle CorporationCharter Township of Chesterfield
$1,956,710 81 0 45 36 $842 -24.7 -26.6 2010
Lunar Industries, Inc. Township of Clinton $635,281 15 0 18 -3 Not Reported -22.4 -28.7 2006Mac-Mold Base, Inc. Village of Romeo $1,352,534 33 0 26 7 $1,450 49.8 27.7 2006Omega Plastics, Inc. Township of Clinton $4,582,767 64 0 70 -6 $708 16.2 -11.3 2008PDF Manufacturing, Inc. Township of Grass Lake $472,082 7 0 7 0 $900 21.2 -11.6 2006Precision Boring Company Township of Clinton 2008RTD Manufacturing, Inc. City of Jackson $571,902 19 0 43 -24 $860 -84.7 -99.9 2006Suburban Tool, Inc. City of Auburn Hills 2006Did Not Report
Did Not Report
Did Not Report
Did Not ReportDid Not Report
Did Not Report
Did Not Report
Did Not Report
Did Not Report
Did Not Report
Did Not Report
Coopersville Tooling Coalition
Eastern Michigan Tool & Die Collaborative
Capital Area Tooling Partnership
Central Michigan CollaborativeDid Not Report
Did Not Report
Berrien Tooling Coalition (continued)
Did Not Report
Did Not Report
Did Not Report
Renaissance Zone Annual Report / CY / 2015 / 12

Investment Benefits
Collaborative Company 1 Local Unit of GovernmentReported Actual
InvestmentReported
Current Jobs 2
Reported Jobs Transferred
to Zone 3
Reported Baseline Jobs at Designation 4
Reported Actual Job Creation 5
Reported Avg Weekly Wage of
Jobs Created
% Change in Taxable Value
(TV)% Change in SEV
First Year Benefits Received
COMPANIES WITHOUT REPORTING REQUIREMENTS
Tax Information
Classification Jobs
Talent Industries, Inc. Township of Redford $404,000 20 0 16 4 $950 5.9 6.4 2006
Tri-Way Mold & Engineering City of Roseville $3,008,000 30 0 17 13 $1,026 152.6 26.3 2010
True Industries, Inc. City of Roseville $3,201,627 48 0 47 1 $860 -36.9 -36.1 2007Automated Industrial Motion Township of Fruitport 2007
Eagle Aluminum Cast Products - Pattern Division Township of Egelston $35,609 3 0 5 -2 $859 -32.3 16.7 2007
Eagle Aluminum Cast Products - Sand Division City of Muskegon $229,868 11 4 11 -4 $444 91.4 84.8 2007
Falcon Tool & Die Township of Spring Lake $1,800,126 38 0 17 21 $900 28.6 28.6 2009ITT Gage, Inc. Township of Dalton $392,030 15 0 15 0 Not Reported -42.9 -45.3 2007Muskegon Tool Industries, Inc. 6 City of Muskegon $186,417 10 0 15 -5 $640 17.2 4.2 2008Reed City Tool, Inc. City of Reed City $2,047,418 84 0 48 36 $720 2.7 2.7 2011Westech Corp. Township of Dalton 2007ArtCraft Pattern Works, Inc. City of Westland 2008Auto Craft Tool & Die Company, Inc. Township of Clay $1,513,949 64 0 60 4 $1,552 -21.5 -22.5 2009Century Tool & Gage Company, Inc. City of Fenton $4,976,392 71 0 68 3 $1,200 -5.3 -14.6 2008Complete Surface Technologies Township of Clinton $502,405 13 Not Reported 29 -16 Not Reported -33.7 -34.4 2009Elite Mold & Engineering, Inc. 6 Township of Shelby $2,058,559 20 0 20 0 Not Reported -10.1 -9.3 2008Falcon Industry, Inc. Township of Clinton $876,831 14 0 10 4 $1,010 80.6 70.2 2008Focus Mold & Machining, Inc. City of Walker 2008Global Engineering, Inc. Township of Shelby $485,007 18 0 8 10 $1,000 -10.7 -9.1 2011JeMar Tool, Inc. Township of Shelby $12,000 10 0 10 0 $800 -36.6 -41.9 2008Maple Mold Technologies, Inc. City of Rochester Hills 2008
Plastic Engineering & Technical Services, Inc. City of Auburn Hills 2009
RCM Design and Build ServicesTownship of Bruce/ Township of Washington
$160,000 5 0 8 -3 $800 -19.1 -21.3 2008
RTS Cutting Tools, Inc.Charter Township of Clinton
2008
Saginaw Machine Systems, Inc. City of Saginaw 2010Top Craft Tool, Inc. Township of Clinton $276,578 18 0 19 -1 $700 -13.5 -7.9 2008
Vicount Industries, Inc. 6 City of Farmington Hills $5,751,270 53 0 61 -8 $1,320 -29 -29.8 2008
Wright-K Technology, Inc. City of Saginaw $521,921 17 0 48 -31 Not Reported -49.8 -49.8 2008
Did Not Report
Did Not Report
Did Not Report
Did Not Report
Did Not Report
Did Not Report
Did Not Report
Did Not Report
Global Tooling Alliance
Eastern Michigan Tool & Die Collaborative (continued)
First Choice Machining Solutions
Renaissance Zone Annual Report / CY / 2015 / 13

Investment Benefits
Collaborative Company 1 Local Unit of GovernmentReported Actual
InvestmentReported
Current Jobs 2
Reported Jobs Transferred
to Zone 3
Reported Baseline Jobs at Designation 4
Reported Actual Job Creation 5
Reported Avg Weekly Wage of
Jobs Created
% Change in Taxable Value
(TV)% Change in SEV
First Year Benefits Received
COMPANIES WITHOUT REPORTING REQUIREMENTS
Tax Information
Classification Jobs
Air-Hydraulics, Inc. City of Jackson 2005
Classic Die, Inc. City of Grand Rapids $1,076,507 21 0 27 -6 Not Reported -18.9 -23.6 2005EPIC Machine, Inc. City of Fenton $431,000 26 0 26 0 $770 34.9 6.7 2005K&W Tool & Machine, Inc. City of Greenville $2,642,218 26 0 18 8 $1,036 -0.6 -0.6 2010LS Mold, Inc. City of Holland 2005Marton Tool, Inc. City of Grand Rapids $99,876 7 0 8 -1 Not Reported -57.4 -59.3 2005Mid-America Machining, Inc. Township of Columbia $8,276,990 104 0 42 62 $975 247.2 250.6 2005MP Components, Inc. Township of Byron $609,303 36 0 36 0 $885 -19.2 -19.2 2007Pioneer Steel Corporation Township of Byron $2,944,653 30 0 52 -22 $760 197.1 197.1 2007Ravenna Pattern & Mfg., Inc. Township of Moorland $990,000 61 0 40 21 $760 15.8 2.4 2008STM Manufacturing, Inc. City of Holland $4,412,243 70 0 55 15 $940 71.8 77.2 2008Sturgis Tool & Die, Inc. City of Sturgis $372,763 26 0 30 -4 Not Reported -29.7 40.6 2005T.M. Smith Tool International Corp. Township of Macomb $1,320,041 24 0 30 -6 $900 -27.3 -38.3 2005Tower Tool & Manufacturing Company Township of Macomb 2013Precision Jig & Fixture, Inc. City of Rockford $5,520,502 48 0 44 4 Not Reported 727.2 727.2 2005Schmald Tool & Die, Inc. City of Burton $956,906 12 0 15 -3 $1,102 28.4 -4.6 2008
AccuBilt, Inc. 6 City of Jackson $881,288 37 0 18 19 $994 5.8 -1.2 2007C.H. Industries, Inc. Township of Shelby $1,187,795 6 0 8 -2 Not Reported 114.6 23.5 2011
Diamond Die & Mold Company 6 Township of Clinton $442,000 17 0 14 3 $800 -15.3 -27.0 2007
Eagle Tool CompanyCity of Iron Mountain / City of Kingsford
2007
Extreme Tool & Engineering, Inc. 6 Township of Wakefield $11,206,720 85 0 50 35 $1,250 88.2 87.7 2010Midwest Mold Services, Inc. City of Roseville $3,155,471 32 0 32 0 $1,599 34.1 37.5 2007Three M Tool & Machine, Inc. Township of Commerce $6,500,000 68 0 60 8 $720 25.1 19.6 2007Premier Industries Corporation City of Monroe $96,734 23 0 28 -5 $880 19.4 3.6 2007R & A Tool & Engineering Company 6 City of Westland 2007
Sharp Tooling SolutionsVillage of Romeo/ Township of Bruce
$5,101,489 86 0 60 26 $825 68.8 49.8 2007
Tranor Industries, L.L.C. City of Detroit $1,875,129 97 0 23 74 $740 -76.4 -76.8 2011
Wedge-Mill Tool, Inc. 6 City of Brighton $560,285 21 0 20 1 $661 -25.1 -34 2007
Did Not Report
Did Not Report
Did Not Report
Did Not Report
Did Not Report
Michigan Coast to Coast Tool & Die Collaborative
Michigan Adaptive Coalition
Great Lakes Tool & Die Collaborative
Renaissance Zone Annual Report / CY / 2015 / 14

Investment Benefits
Collaborative Company 1 Local Unit of GovernmentReported Actual
InvestmentReported
Current Jobs 2
Reported Jobs Transferred
to Zone 3
Reported Baseline Jobs at Designation 4
Reported Actual Job Creation 5
Reported Avg Weekly Wage of
Jobs Created
% Change in Taxable Value
(TV)% Change in SEV
First Year Benefits Received
COMPANIES WITHOUT REPORTING REQUIREMENTS
Tax Information
Classification Jobs
Carbide Form Master, Incorporated
Charter Township of Springfield
2011
Centerless Rebuilders, Inc. Village of New Haven 2011Cole's Machine, Inc. City of Davison $0 22 0 10 12 $750 31.7 13.9 2011Ecco Tool Co. Inc. City of Novi $246,687 6 0 6 0 Not Reported -9.2 -20.1 2011Fischer Tool & Die Corp. 6 City of Bedford 2011Fullerton Tool Company, Inc. 6 City of Saginaw $4,402,398 126 0 106 20 $700 325.2 325.2 2011
Hommel-Etamic America Corporation City of Rochester Hills $365,589 95 0 79 16 $419 -60.3 -60 2011
I & G Tool Company, Inc. City of New Baltimore $18,397 4 0 5 -1 Not Reported -58.9 -63.5 2011
Innovative Mold Inc. Township of Washington 2011
M. Curry Corporation 6 (aka Endurance Carbide) Township of Bridgeport $704,456 27 0 23 4 $600 78.8 21.3 2011
P.C.S. Company 6 City of Fraser 2011Product & Tooling Technologies, Inc. City of Fraser 2011PT Tech Stamping, Inc. City of Fraser 2011
Alto Precision, Inc. 6 Township of Byron 2006Bessey Tool & Die, Inc. 6 Township of Sparta $1,828,909 21 0 15 6 Not Reported 25.8 14.3 2006Brink's Machine Company, Inc. 6 Township of Pine River $1,749,058 16 0 14 2 $500 190.4 28.8 2006Byrne Tool & Die, Inc. 6 City of Rockford 2006CG Automation & Fixture, Inc. 6 Township of Alpine $2,869,122 50 1 30 19 $1,095 20.6 19.4 2006Custom Tool and Die Service, Inc. City of Hudsonville 2006Digital Tool & Die, Inc. 6 City of Grandville $5,510,584 65 0 18 47 $1,100 131.1 125.8 2006Legacy Precision Molds, Inc. 6 City of Grandville $913,612 13 0 8 5 $500 59.9 49.7 2006Midwest Tool & Die, Inc. Township of Plainfield $560,398 31 0 15 16 $600 93.5 93.5 2006Momentum Industries, Inc. City of St. Louis $433,056 12 0 18 -6 Not Reported 18.3 18.3 2006Precision Wire EDM Service, Inc. 6 City of Walker $1,429,037 11 0 6 5 Not Reported 100.7 90.3 2006Aero Foil International, Inc. City of Muskegon $2,528,758 15 29 11 -25 $800 33.6 33.6 2008Campbell Grinder Company City of Norton Shores 2007
Dietech City of Norton Shores 2007
Intricate Grinding & Machine Specialties 6 City of Norton Shores $244,572 Not Reported Not Reported Not Reported Not Reported Not Reported Not Reported Not Reported 2007
Did Not Report
Did Not Report
Did Not Report
Did Not ReportDid Not ReportDid Not ReportDid Not Report
Did Not Report
Did Not Report
Did Not Report
Did Not Report
Did Not Report
Muskegon Tooling Alliance
Michigan Tooling Group
Michigan International Tooling Alliance
Renaissance Zone Annual Report / CY / 2015 / 15

Investment Benefits
Collaborative Company 1 Local Unit of GovernmentReported Actual
InvestmentReported
Current Jobs 2
Reported Jobs Transferred
to Zone 3
Reported Baseline Jobs at Designation 4
Reported Actual Job Creation 5
Reported Avg Weekly Wage of
Jobs Created
% Change in Taxable Value
(TV)% Change in SEV
First Year Benefits Received
COMPANIES WITHOUT REPORTING REQUIREMENTS
Tax Information
Classification Jobs
Alltech Tool, Inc. Township of Paradise 2008
Elk Lake Tool Company 6Township of Elk Rapids/ Village of Elk Rapids
2007
Flannery Machine & Tool, Inc. 6 Township of Rapid River 2007I-del, LLC Township of Garfield 2007Jade Tool, Inc. Township of Garfield 2007Master Craft Extrusion Tools, Inc. Village of Northport $515,693 13 0 11 2 $500 1.4 0.9 2007MTD Tool & Die, LLC Village of Elk Rapids 2007Saber Tool Company, Inc. 6 Township of Haring $367,695 19 0 18 1 $600 69.2 3.3 2007Tool North, Inc. City of Traverse City 2007CNC Precision Machining, LLC Township of Alpine 2005Competition Engineering, Inc. Township of Wright $3,936,000 73 0 39 34 $750 58.4 37.2 2006Datum Industries, LLC City of Kentwood 2006Allynn Corporation Township of Cooper $20,210 9 0 6 3 $848 11.9 15.7 2006Casey Tool & Die, Inc. Township of Pokagon Not Reported Not Reported Not Reported 3 Not Reported Not Reported Not Reported Not Reported 2006Dura Mold, Inc. Township of Lake $2,374,059 66 0 34 32 $760 -32.4 -32.2 2006J.K. Machining Township of Alamo $313,544 16 0 15 1 $740 727.3 757.4 2006Jirgens Modern Tool Corp. City of Kalamazoo $331,100 3 0 5 -2 Not Reported -35.5 -35.6 2006
Johnson Precision Mold & Eng., Inc. City of Sturgis 2006LeVannes, Inc. City of Portage 2006Liberty Molds, Inc. City of Portage $914,006 29 0 23 6 $500 11.6 Not Reported 2006Maddox Industries, Inc. Township of Bronson $513,521 26 0 23 3 $902 22 30.5 2006Mayer Tool & Engineering, Inc. City of Sturgis $2,499,165 31 0 28 3 Not Reported 112 118.4 2006Plas-Tech Mold & Design, Inc. City of Otsego $150,674 4 0 7 -3 $840 -90.7 -86.8 2006S & K Tool & Die City of Kalamazoo $514,488 11 0 12 -1 Not Reported -5.3 -4.7 2006Travis Creek Tooling, Inc. City of Plainwell $135,000 4 0 5 -1 $900 175.2 -34.8 2006
Did Not Report
Did Not ReportDid Not Report
Did Not Report
Did Not Report
Did Not Report
Northwest Michigan Tooling Coalition
Did Not Report
Did Not Report
Did Not Report
Southwest Michigan Tooling Collaborative
Did Not Report
Did Not Report
Precision Tooling Coalition
Renaissance Zone Annual Report / CY / 2015 / 16

Investment Benefits
Collaborative Company 1 Local Unit of GovernmentReported Actual
InvestmentReported
Current Jobs 2
Reported Jobs Transferred
to Zone 3
Reported Baseline Jobs at Designation 4
Reported Actual Job Creation 5
Reported Avg Weekly Wage of
Jobs Created
% Change in Taxable Value
(TV)% Change in SEV
First Year Benefits Received
COMPANIES WITHOUT REPORTING REQUIREMENTS
Tax Information
Classification Jobs
A & O Mold and Engineering, Inc. Village of Vicksburg 2010BuhlerPrince, Inc. 6 City of Holland $13,437,465 124 0 69 55 $816 -14.6 -14.1 2011CAMmand Machining, LLC Village of Romeo $727,049 15 0 13 2 $575 -40.6 -39.7 2010Commercial Tool and Die, Inc. 6 Township of Alpine $17,066,951 162 0 130 32 $865 64.6 62.3 2010Concept Molds, Inc. Township of Schoolcraft $983,256 33 0 22 11 $712 -4.9 9.6 2010Delta Technologies Group City of Auburn Hills $4,272,837 127 0 145 -18 $950 -33.2 -33.9 2010International Mold Corporation Township of Clinton $8,442,286 104 0 48 56 $1,122 5.1 14.7 2011M & M Polishing, Inc. City of Coloma $135,000 42 0 16 26 $900 Not Reported Not Reported 2010Michigan Tool Works City of Sturgis 2010Pyper Tool and Engineering, Inc. City of Walker $2,025,000 62 0 37 25 $1,625 22.8 22.8 2010TK Mold and Engineering, Inc. Village of Romeo 2010Walker Tool and Die, Inc. City of Walker $5,254,895 141 4 101 36 $850 -55.4 -54.2 2010Carroll Tool and Die Co. 6 Township of Macomb $801,857 23 0 24 -1 $1,400 -34.3 -35.4 2010
Dynamic Plastics, Inc.Charter Township of Chesterfield
$3,030,022 45 15 30 0 $500 40.7 37.5 2010
Majestic Industries, Inc. Township of Macomb $4,037,686 69 0 45 24 Not Reported -6.7 -6 2010Mistequay Group, Ltd 6 City of Saginaw $1,590,168 56 0 32 24 $625 -46.8 -48.3 2010
Mistequay-ISG LLC 6Charter Township of Saginaw
$358,968 2 0 18 -16 $610 -37 -38.5 2011
PCD-Carbide Tool Company dba Precorp, Inc. City of Williamston $478,374 13 0 15 -2 Not Reported -84.6 -86.7 2010
Posa-Cut Corporation 6 City of Farmington Hills $686,859 18 0 14 4 $740 -34.4 -35.3 2010
Precision Industries, Inc. 6 City of Flint $99,193 9 0 8 1 Not Reported -27.4 -44.1 2010Apollo Tool and Engineering City of Walker 2007Evans Tool and Engineering 6 City of Walker 2007Grand Die Engravers, Inc. City of Grand Rapids 2008True Tool CNC Regrinding & Mfg., Inc. City of Warren 2007Borgia Die & Engineering, Inc. Township of Wright $20,000 4 0 7 -3 $400 110.2 145.1 2006Class-A-Tool & Machine, LLC Township of Egelston $96,852 5 0 4 1 $647 -22.9 -35.1 2006East River Machine & Tool Township of Muskegon 2006Freedom Tool & Mfg. Co. Township of Egelston $171,924 6 0 5 1 $730 141.6 42 2006Titan Tool & Die, Inc. City of Norton Shores $410,000 7 3 6 -2 $840 34.1 33.9 2006Wire EDM Technologies Township of Muskegon 2006
Did Not Report
Did Not Report
Did Not Report
Did Not Report
Did Not Report
Did Not ReportDid Not Report
Did Not Report
Strategic Tooling Solutions
Did Not Report
Third Coast Tooling Alliance
Tooling Advantage Group
Tool Makers Alliance
Renaissance Zone Annual Report / CY / 2015 / 17

Investment Benefits
Collaborative Company 1 Local Unit of GovernmentReported Actual
InvestmentReported
Current Jobs 2
Reported Jobs Transferred
to Zone 3
Reported Baseline Jobs at Designation 4
Reported Actual Job Creation 5
Reported Avg Weekly Wage of
Jobs Created
% Change in Taxable Value
(TV)% Change in SEV
First Year Benefits Received
COMPANIES WITHOUT REPORTING REQUIREMENTS
Tax Information
Classification Jobs
Engineered Tooling Systems, Inc. City of Walker $3,614,327 72 0 36 36 $1,250 33.8 24.1 2005Mold Tooling Systems, Inc. City of Walker $496,259 11 0 13 -2 $1,400 -13 -14.3 2005Specialty Tooling Systems, Inc. City of Walker $540,368 34 0 22 12 $1,400 276 276 2005Custom Design, Inc. City of Portage $2,194,872 38 0 24 14 $1,155 23.0 21 2006Enterprise Tool & Die, Inc. City of Grandville $1,863,151 49 0 69 -20 Not Reported -1.8 -5.9 2007Master Precision Mold Technology City of Greenville $1,646,599 32 0 46 -14 Not Reported Not Reported 15.6 2005Miller Tool & Die, Inc. City of Jackson $384,766 49 0 48 1 $1,034 130.3 93.7 2005Mol-Son, LLC 6 Village of Mattawan $2,111,823 91 0 80 11 $1,150 23.9 20.6 2010Richard Tool & Die, Inc. Township of Lyon $2,789,889 92 0 74 18 $1,280 -14.8 13.6 2007Riviera Tool, LLC Township of Cascade 2010Thunder Bay Pattern Works, Inc. Township of Clinton $665,530 20 0 17 3 Not Reported -13.1 -13.1 2009Accurate Regrinding Service City of Walker $1,069,200 9 0 8 1 $700 119.7 102.1 2006
Alliance CNC Cutter Grind City of Kentwood $3,218,314 22 0 12 10 $600 64.6 63.1 2006
Artiflex Manufacturing, LLC (formerly ITS Manufacturing Solutions, LLC)
City of Walker $2,334,859 39 0 12 27 $800 -78.7 -78.7 2009
Distinctive Machine Corp. City of Rockford $2,112,856 30 0 26 4 $1,050 23.8 23.8 2007Unique Model, Inc. 6 City of Walker 2007Usher Tool & Die, Inc. Township of Byron 2006West Michigan Precision Machining, Inc. City of Walker $2,027,067 23 0 9 14 $900 38.4 31.6 2006Williams Tooling & Mfg., Inc. Township of Dorr $920,000 25 0 14 11 $660 71 58.6 2006Wolverine Special Tool, Inc. City of Walker $821,027 16 0 16 0 Not Reported 148.1 38.3 2006
West Michigan Tooling Coalition Paragon Die & Engineering Company Township of Cascade $18,325,188 204 0 130 74 $681 31.4 210.1 2010
A.C.E. Tooling, Inc. 6 City of Norton Shores $0 12 0 19 -7 $960 -0.57 90 2006Action Mold & Machining, Inc. City of Grand Rapids $2,477,921 37 0 45 -8 $900 2.8 -2.8 2006CS Tool Engineering, Inc. City of Cedar Springs $4,815,654 47 0 47 0 $680 32.4 31.6 2006Erdman Machine Company 6 Township of Whitehall $6,192,833 78 0 24 54 $624 50 46.0 2006General Die & Engineering, Inc. 6 Township of Byron $5,046,590 52 0 53 -1 $1,000 1.2 1.2 2006GraphiteXpress, LLC Township of Keene 2006Northern Machine Tool Company 6 City of Muskegon $1,690,876 31 0 39 -8 Not Reported 6.6 3.9 2006
Viking Tool & Engineering Company Township of Whitehall $3,626,425 37 0 31 6 $850 72.1 72.1 2006
TOTALS: $338,427,504 1,428
1 These companies do not have contractually required reporting requirements. The MEDC requests these companies voluntarily report these metrics; those who did not are identified with the “Did Not Report” or "Not Reported" designation.2 The number of jobs the company reported to have on December 31, 20153 Jobs transferred to the Zone from another facility or entity owned by the same company outside of the Zone4 Information derived from original application or reported by the company in annual progress report5 Reported Actual Job Creation/Retention is calculated by subtracting Reported Jobs Transferred to Zone and Reported Baseline Jobs at Zone Designation from Reported Current Jobs6 Company received additional state economic incentive(s)7 Company's Renaissance Zone was Revoked on April 26, 2016.
Did Not Report
Did Not Report
Did Not Report
Tooling Systems Group
Whitehall Township Tooling Coalition
United Tooling Coalition
West Coast Tooling Coalition
Did Not Report
Renaissance Zone Annual Report / CY / 2015 / 18

Geographic Renaissance Zone Activity
In 1996, the Michigan Renaissance Zone Act, under MCL 125.2684, authorized the designation of RenaissanceZones (“Geographic Renaissance Zones”) which allow any company or individual to locate within a GeographicRenaissance Zone and to receive benefits. In 2015, 19 of these zones were still active. Most of these GeographicRenaissance Zones are made up of a combination of two types of subzones: (1) community-specific geographicsubzones and (2) company-specific geographic subzones. The first type of subzone - those enacted under theoriginal language of the Act - was awarded to communities in areas targeted for development; these types ofsubzones are referred to as “community-specific subzones.” Within the 19 Geographic Renaissance Zonescurrently active, there are 94 community-specific subzones that span approximately 50 local communities acrossthe state.
The Act was later amended to allow for creation of a second type of a subzone associated with one or morecompanies. These subzones were created either by designating new subzones within existing GeographicRenaissance Zones or by granting time extensions for portions of existing community-specific subzones toparticular companies for specified projects. These types of subzones are referred to as “company-specificsubzones.” Because these types of subzones are linked to particular companies, the benefits of the RenaissanceZone are controlled and defined. Legislative authority to designate geographic zones or subzones and allow timeextensions expired on December 31, 2011.
On the following pages are individual tables for each of the 19 active Geographic Renaissance Zones, indicatingmetrics for each of the component subzones within the Geographic Renaissance Zone. The K.I. SawyerRenaissance Zone is designated as a military sub-type of Geographic Renaissance Zone.
Most of the company-specific subzones have development agreements governing the minimum amount ofcapital investment and job creation projected and imposes reporting requirements. For the community-specificsubzones and those company-specific subzones where no development agreement exists, requests were madeto obtain development information from the applicable local government or the company, respectively.However, without an enforcement mechanism, reporting to the MEDC is voluntary and may result inunderreporting of activity within the zones. Communities report difficultly in tracking the businesses andresidents moving into and out of the community-specific subzones.
These Geographic Renaissance Zones have reported creating 1,824 new jobs and leveraging more than $1.2billion in private investment during the active periods of the Zones.
Renaissance Zone Annual Report / CY / 2015 / 19

Benefits
Subzone Community CompanyProjected
Investment 1Reported Actual
Investment
Projected Job Creation/
Retention 1
Reported Current Jobs 2
Reported Jobs Transferred
to Zone 3
Reported Baseline Jobs at
Designation 4
Reported Actual Job Creation/Retention 5
Reported Avg Weekly Wage of
Jobs Created
% Change in Taxable
Value (TV)
% Change in SEV
First Year Benefits Received
Miller's Pond City of Benton Harbor Whirlpool Corp. 6 $65,325,843 $65,216,662 868 (ret)* 762 630 0 132 $1,697 12.3 75.6 2011
Elisha Gray Charter Township of Benton Whirlpool Corp. 6 $21,538,996 $32,300,000 None 412 49 0 363 $729 -3.6 -3.6 2011
Edgewater Redevelopment Charter Township of Benton Whirlpool Corp. 6 $175,000 $79,682,116 None 797 186 0 611 $1,764 -3.8 -3.7 2011
Subzone Community Reported Companies Receiving Benefits
Projected Investment 1
Reported Actual Investment
Reported Residents Receiving Benefits in
2015
Reported Actual Job Creation/Retention 5
Reported Avg Weekly Wage of
Jobs Created
% Change in Taxable
Value (TV)
% Change in SEV
First Year Benefits Received
Meadowbrook & Yore 7 Charter Township of Benton 1 N/A $1,688,600 0 Not Reported Not Reported Not ReportedNot
Reported2000
Miller's Pond (Remainder) 7 City of Benton Harbor 0 2000
$178,887,378 1,106
1 Projected information is derived from original application or development agreement2 The number of jobs the company reported to have on December 31, 2015
JobsCompany-specific Subzones
Berrien County/City of Benton Harbor/Benton Twp. Renaissance Zone
Community-specific Subzones
Tax InformationClassification Investment
TOTALS:
Did Not Report
3 Jobs transferred to the Zone from another facility or entity owned by the same company outside of the Zone4 Information derived from original application or reported by the company in annual progress report5 Reported Actual Job Creation/Retention is calculated by subtracting Reported Jobs Transferred to Zone and Reported Baseline Jobs at Zone Designation from Reported Current Jobs6 Company received additional state economic incentive(s)7 Metrics not enforced by a Development Agreement
Renaissance Zone Annual Report / CY / 2015 / 20

Benefits
Subzone Community CompanyProjected
Investment 1Reported Actual
Investment
Projected Job Creation/
Retention 1
Reported Current Jobs 2
Reported Jobs Transferred
to Zone 3
Reported Baseline Jobs at
Designation 4
Reported Actual Job Creation/Retention 5
Reported Avg Weekly Wage of
Jobs Created
% Change in Taxable
Value (TV)
% Change in SEV
First Year Benefits Received
Village of Middleville Village of Middleville ChemQuest, Inc. 8 $250,000 $1,410,658 22 13 0 9 4 $1,527 6.3 19.9 2012
Subzone CommunityReported Companies Receiving
BenefitsProjected
Investment 1Reported Actual
Investment
Reported Residents Receiving Benefits in
2015
Reported Actual Job Creation/Retention 5
Reported Avg Weekly Wage of
Jobs Created
% Change in Taxable
Value (TV)
% Change in SEV
First Year Benefits Received
Big Rapids Twp. 7 Township of Big Rapids 2002
City of Escanaba 7 City of Escanaba 2002$1,410,658 4
8 Company's Renaissance Zone was Revoked on June 28, 2016.
6 Company received additional state economic incentive(s)7 Metrics not enforced by a Development Agreement
Community-specific Subzones
TOTALS:
1 Projected information is derived from original application or development agreement2 The number of jobs the company reported to have on December 31, 20153 Jobs transferred to the Zone from another facility or entity owned by the same company outside of the Zone4 Information derived from original application or reported by the company in annual progress report5 Reported Actual Job Creation/Retention is calculated by subtracting Reported Jobs Transferred to Zone and Reported Baseline Jobs at Zone Designation from Reported Current Jobs
Did not Report
Did not Report
Border Renaissance Zones
Tax InformationJobsInvestmentClassificationCompany-specific Subzones
Renaissance Zone Annual Report / CY / 2015 / 21

Benefits
Subzone Company Projected Investment 1Reported Actual
Investment
Projected Job Creation/
Retention 1
Reported Current Jobs 2
Reported Jobs Transferred
to Zone 3
Reported Baseline Jobs at
Designation 4
Reported Actual Job Creation/
Retention 5
Reported Avg Weekly Wage of
Jobs Created
% Change in Taxable Value
(TV)
% Change in SEV
First Year Benefits Received
Lufkin Rule/Hess Avenue/Fairgrounds Hausbeck Pickle Company 6 $1,500,000 $3,942,213 None 105 37 38 30 $600 4,806.7 4,806.7 2011
Northeast Saginaw Midwest Manufacturing $5,700,000 $7,711,675 25 36 0 0 36 $546 180.5 40.3 2011
Central Business District Gateway Financial Services, Inc. $1,800,000 $2,748,398 30 114 0 59 55 $952 -65.8 -63.8 2011
Central Business DistrictSaginaw Cooperative Hospitals, Inc.
$1,500,000 $2,255,786 10 37 0 27 10 $493 1,216.3 1,217.7 2011
Central Business DistrictHamilton Street Development, LLC (fka SSP & Associates, Inc.)(Amended)
$6,148,000 $430,997 12 0 0 0 0 N/A 0 0 2012
SubzoneReported Companies Receiving
Benefits Projected Investment 1Reported Actual
Investment
Reported Residents Receiving Benefits
in 2015
Reported Actual Job Creation/
Retention 5
Reported Avg Weekly Wage of
Jobs Created
% Change in Taxable Value
(TV)
% Change in SEV
First Year Benefits Received
Agape Child Care Center 7 0 N/A Not Reported Not Reported Not Reported Not Reported -29 -31 2003
Covenant Health Care 7 46 N/A Not Reported Not Reported Not Reported Not Reported Not Reported Not Reported 2001
Davenport Inn 7 1 N/A Not Reported Not Reported Not Reported Not Reported 113 113 2002
Former Delphi Plant 2 7 Not Reported N/A Not Reported Not Reported Not Reported Not Reported -15 -15 2003
Old Saginaw City Business District 7 4 N/A Not Reported Not Reported Not Reported Not Reported 38 39 2002$17,089,069 131
City of Saginaw Renaissance Zone
Company-specific SubzonesClassification Investment Jobs Tax Information
6 Company received additional state economic incentive(s)7 Metrics not enforced by a Development Agreement
Community-specific Subzones
TOTALS:
1 Projected information is derived from original application or development agreement2 The number of jobs the company reported to have on December 31, 20153 Jobs transferred to the Zone from another facility or entity owned by the same company outside of the Zone4 Information derived from original application or reported by the company in annual progress report5 Reported Actual Job Creation/Retention is calculated by subtracting Reported Jobs Transferred to Zone and Reported Baseline Jobs at Zone Designation from Reported Current Jobs
Renaissance Zone Annual Report / CY / 2015 / 22

Benefits
Subzone Community CompanyProjected
Investment 1Reported Actual
Investment
Projected Job Creation/
Retention 1
Reported Current Jobs 2
Reported Jobs Transferred
to Zone 3
Reported Baseline Jobs at
Designation 4
Reported Actual Job Creation/Retention 5
Reported Avg Weekly Wage of
Jobs Created
% Change in Taxable Value
(TV)
% Change in SEV
First Year Benefits Received
Production Engineering Subzone City of Jackson Alro Steel Corporation $1,800,000 $4,018,122 10 51 0 31 20 $711 1,988.9 1,994.6 2013
Production Engineering Subzone City of JacksonProduction Engineering, Inc./ Anderton Machining, LLC 8
$11,200,000 Not Reported 112(ret)68 (cre)
2009
Subzone CommunityReported Companies Receiving
BenefitsProjected
Investment 1Reported Actual
Investment
Reported Residents Receiving Benefits in
2015
Reported Actual Job Creation/Retention 5
Reported Avg Weekly Wage of
Jobs Created
% Change in Taxable Value
(TV)
% Change in SEV
First Year Benefits Received
Former Concrete Tile Mfg. Site (Lester Bros.) 7
Township of Leoni 10 N/A $2,072,540 Not Reported Not Reported Not Reported Not Reported Not Reported 2000
$6,090,662 20
8 A transfer was approved by the MSF Board on September 22, 2015 with new reporting requirements starting in 2016.
5 Reported Actual Job Creation/Retention is calculated by subtracting Reported Jobs Transferred to Zone and Reported Baseline Jobs at Zone Designation from Reported Current Jobs6 Company received additional state economic incentive(s)7 Metrics not enforced by a Development Agreement
TOTALS:
City/County of Jackson Renaissance Zone
1 Projected information is derived from original application or development agreement2 The number of jobs the company reported to have on December 31, 20153 Jobs transferred to the Zone from another facility or entity owned by the same company outside of the Zone4 Information derived from original application or reported by the company in annual progress report
Company-specific SubzonesClassification Investment Jobs Tax Information
Community-specific Subzones
Not Reported
Renaissance Zone Annual Report / CY / 2015 / 23

Benefits
Subzone Company Projected Investment 1Reported Actual
Investment
Projected Job Creation/
Retention 1
Reported Current Jobs 2
Reported Jobs Transferred
to Zone 3
Reported Baseline Jobs at
Designation 4
Reported Actual Job Creation/
Retention 5
Reported Avg Weekly Wage of
Jobs Created
% Change in Taxable Value
(TV)
% Change in SEV
First Year Benefits Received
Lynch Road Detroit Chassis, LLC 6 $2,000,000 $3,454,633 80 201 0 80 121 $593 -25.4 -25.4 2010
Livernois/Intervale Detroit Chrome, Inc. (dba DCI Aerotech)
$5,000,000 $7,714,640 20 72 0 44 28 $720 624.9 610.5 2010
Southwest/Delray Boasso America Corporation 8 $1,515,000 $1,613,110 36 27 0 24 3 $961 -7.1 43 2011
Southwest/Delray Bridgewater Interiors, LLC $2,700,000 $10,529,854 17 110 4 282 -176 $764 -70.1 -73.2 2011
Southwest/Delray The John Johnson Company $173,000 $805,795 2011
Southwest/Delray Waterfront Petroleum Terminal Co.
$2,668,500 $2,660,216 5 19 2 7 10 $1,675 -7.3 -7.3 2012
Southwest/Delray James Group International, Inc. 6 $2,000,000 $7,174,980 108 87 0 119 -32 $440 -38.2 -36.3 2012
Southwest/DelrayPeerless Metal Powders & Abrasive
$1,200,000 $1,392,579 11 35 0 32 3 $520 6.8 6.6 2012
SubzoneReported Companies Receiving
Benefits Projected Investment 1Reported Actual
Investment
Reported Residents Receiving Benefits
in 2015
Reported Actual Job Creation/
Retention 5
Reported Avg Weekly Wage of
Jobs Created
% Change in Taxable Value
(TV)
% Change in SEV
First Year Benefits Received
Campus Martius 7 15 N/A 2003
I-94 Industrial Site 7 57 N/A 1997
$35,345,807 -43
8 Company's Renaissance Zone was Revoked on June 28, 2016.
Did Not Report
City of Detroit Renaissance Zone
Company-specific SubzonesClassification Investment Jobs Tax Information
6 Company received additional state economic incentive(s)7 Metrics not enforced by a Development Agreement
Community-specific Subzones
TOTALS:
1 Projected information is derived from original application or development agreement2 The number of jobs the company reported to have on December 31, 20153 Jobs transferred to the Zone from another facility or entity owned by the same company outside of the Zone4 Information derived from original application or reported by the company in annual progress report5 Reported Actual Job Creation/Retention is calculated by subtracting Reported Jobs Transferred to Zone and Reported Baseline Jobs at Zone Designation from Reported Current Jobs
Did Not Report
Did Not Report
Renaissance Zone Annual Report / CY / 2015 / 24
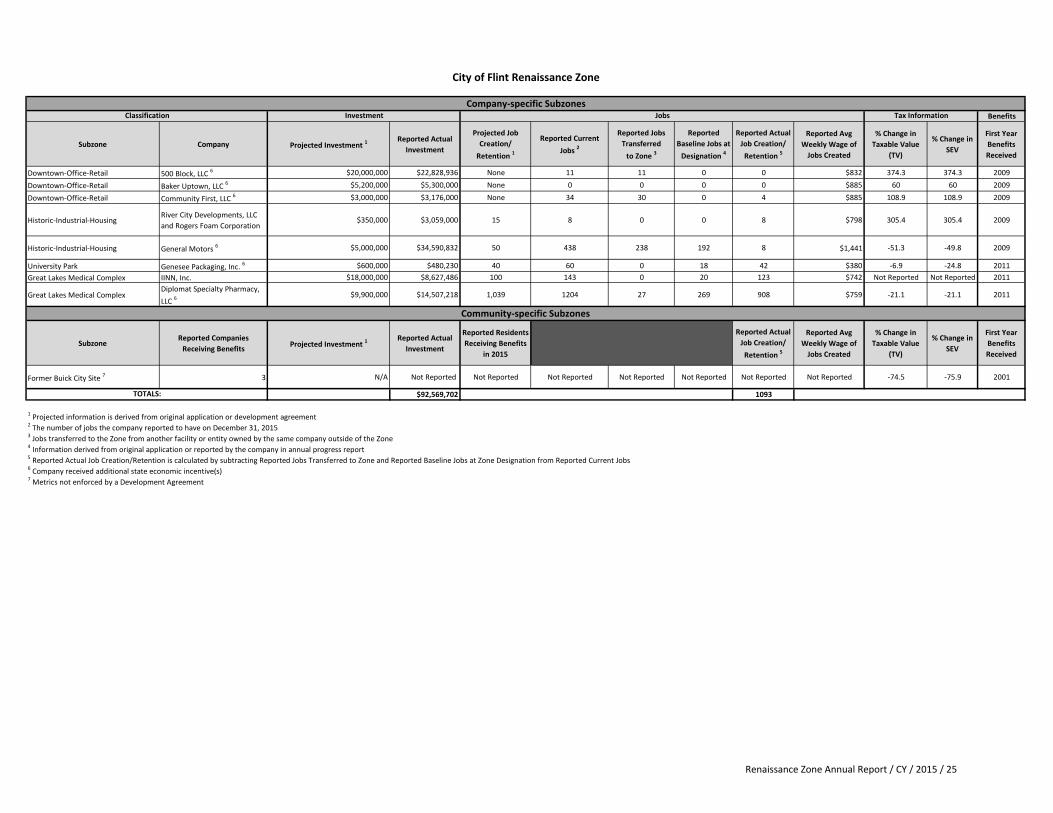
Benefits
Subzone Company Projected Investment 1Reported Actual
Investment
Projected Job Creation/
Retention 1
Reported Current Jobs 2
Reported Jobs Transferred
to Zone 3
Reported Baseline Jobs at
Designation 4
Reported Actual Job Creation/Retention 5
Reported Avg Weekly Wage of
Jobs Created
% Change in Taxable Value
(TV)
% Change in SEV
First Year Benefits Received
Downtown-Office-Retail 500 Block, LLC 6 $20,000,000 $22,828,936 None 11 11 0 0 $832 374.3 374.3 2009
Downtown-Office-Retail Baker Uptown, LLC 6 $5,200,000 $5,300,000 None 0 0 0 0 $885 60 60 2009
Downtown-Office-Retail Community First, LLC 6 $3,000,000 $3,176,000 None 34 30 0 4 $885 108.9 108.9 2009
Historic-Industrial-HousingRiver City Developments, LLC and Rogers Foam Corporation
$350,000 $3,059,000 15 8 0 0 8 $798 305.4 305.4 2009
Historic-Industrial-Housing General Motors 6 $5,000,000 $34,590,832 50 438 238 192 8 $1,441 -51.3 -49.8 2009
University Park Genesee Packaging, Inc. 6 $600,000 $480,230 40 60 0 18 42 $380 -6.9 -24.8 2011Great Lakes Medical Complex IINN, Inc. $18,000,000 $8,627,486 100 143 0 20 123 $742 Not Reported Not Reported 2011
Great Lakes Medical ComplexDiplomat Specialty Pharmacy, LLC 6
$9,900,000 $14,507,218 1,039 1204 27 269 908 $759 -21.1 -21.1 2011
SubzoneReported Companies
Receiving Benefits Projected Investment 1Reported Actual
Investment
Reported Residents Receiving Benefits
in 2015
Reported Actual Job Creation/Retention 5
Reported Avg Weekly Wage of
Jobs Created
% Change in Taxable Value
(TV)
% Change in SEV
First Year Benefits Received
Former Buick City Site 7 3 N/A Not Reported Not Reported Not Reported Not Reported Not Reported Not Reported Not Reported -74.5 -75.9 2001
$92,569,702 1093
City of Flint Renaissance Zone
Company-specific SubzonesClassification Investment Jobs Tax Information
6 Company received additional state economic incentive(s)7 Metrics not enforced by a Development Agreement
Community-specific Subzones
TOTALS:
1 Projected information is derived from original application or development agreement2 The number of jobs the company reported to have on December 31, 20153 Jobs transferred to the Zone from another facility or entity owned by the same company outside of the Zone4 Information derived from original application or reported by the company in annual progress report5 Reported Actual Job Creation/Retention is calculated by subtracting Reported Jobs Transferred to Zone and Reported Baseline Jobs at Zone Designation from Reported Current Jobs
Renaissance Zone Annual Report / CY / 2015 / 25

Benefits
Subzone Company Projected Investment 1Reported Actual
Investment
Projected Job Creation/
Retention 1
Reported Current Jobs 2
Reported Jobs Transferred
to Zone 3
Reported Baseline Jobs at
Designation 4
Reported Actual Job Creation/
Retention 5
Reported Avg Weekly Wage of
Jobs Created
% Change in Taxable Value
(TV)
% Change in SEV
First Year Benefits Received
Furniture Center American Seating 6, 7 $0 $1,913,115 0 154 23 78 53 $724 -39.6 -41.9 2009Furniture Center Hotel Holdings Monroe 6, 7 $37,200,000 $3,658,160 150 9 0 0 9 Not Reported 152.2 153.3 2009Furniture Center Seventh Street Properties, LLC 7 2009Furniture Center 607 Dewey, LLC (True North) 6 $1,900,000 $1,987,898 None 43 1 0 42 $1,150 719.2 528.5 2010
Grandville Via Design, Inc. $272,000 $277,000 1 2 0 0 2 $890 28.0 38.6 2010
Wealthy-Eastern-FranklinWealthy Street Historic Development, LLC 6
$650,000 $842,500 None 0 0 0 0 N/A 452.31 547.93 2010
SubzoneReported Companies Receiving
Benefits Projected Investment 1Reported Actual
Investment
Reported Residents Receiving Benefits
in 2015
Reported Actual Job Creation/
Retention 5
Reported Avg Weekly Wage of
Jobs Created
% Change in Taxable Value
(TV)
% Change in SEV
First Year Benefits Received
A-Tek Manufacturing 7 2 N/A $3,080,891 0 144 $622 -52.6 -54.3 2003
Metropolitan Hospital 7 1 N/A $40,174,437 138 170 $1,100 475.2 449.5 2003
Monroe Center 7 8 N/A $10,285,310 Not Reported 35 $525 309.6 306.9 2003
Terra Firma 7 4 N/A $13,192,192 0 192 $633 28.4 23.9 2003$75,411,503 647
City of Grand Rapids Renaissance Zone
Company-specific SubzonesClassification Capital Investment Jobs Tax Information
6 Company received additional state economic incentive(s)7 Metrics not enforced by a Development Agreement
Did Not Report - No Reporting Requirements
Community-specific Subzones
TOTALS:
1 Projected information is derived from original application or development agreement2 The number of jobs the company reported to have on December 31, 20153 Jobs transferred to the Zone from another facility or entity owned by the same company outside of the Zone4 Information derived from original application or reported by the company in annual progress report5 Reported Actual Job Creation/Retention is calculated by subtracting Reported Jobs Transferred to Zone and Reported Baseline Jobs at Zone Designation from Reported Current Jobs
Renaissance Zone Annual Report / CY / 2015 / 26

Benefits
Subzone Company Projected Investment 1Reported Actual
Investment
Projected Job Creation/
Retention 1
Reported Current Jobs 2
Reported Jobs Transferred
to Zone 3
Reported Baseline Jobs at
Designation 4
Reported Actual Job Creation/Retention 5
Reported Avg Weekly Wage of
Jobs Created
% Change in Taxable Value
(TV)
% Change in SEV
First Year Benefits Received
Ottawa StationPhoenix Development Partners, LLC & Accident Fund 6
$94,000,000 $151,313,399 None 598 16 490 92 $1,214 1,215.0 1,500.0 2010
Knapp's CentreEyde Knapp Development, LLC 6 $22,000,000 $29,459,544 None 0 0 0 0 N/A 488 550.4 2012
$180,772,943 92
City of Lansing Renaissance Zone
Company-specific SubzonesClassification Capital Investment Jobs Tax Information
6 Company received additional state economic incentive(s)
TOTALS:
1 Projected information is derived from original application or development agreement2 The number of jobs the company reported to have on December 31, 20153 Jobs transferred to the Zone from another facility or entity owned by the same company outside of the Zone4 Information derived from original application or reported by the company in annual progress report5 Reported Actual Job Creation/Retention is calculated by subtracting Reported Jobs Transferred to Zone and Reported Baseline Jobs at Zone Designation from Reported Current Jobs
Renaissance Zone Annual Report / CY / 2015 / 27

Benefits
Subzone Community CompanyProjected
Investment 1Reported Actual
Investment
Projected Job Creation/
Retention 1
Reported Current Jobs 2
Reported Jobs Transferred
to Zone 3
Reported Baseline Jobs at
Designation 4
Reported Actual Job Creation/Retention 5
Reported Avg Weekly Wage of
Jobs Created
% Change in Taxable
Value (TV)
% Change in SEV
First Year Benefits Received
Midlink Bus. Pk. Township of ComstockKaiser Aluminum Fabricated Products, LLC 6
$50,000,000 $182,074,120 150 194 12 14 168 $979 2,246.0 2,252.3 2010
BC Tower City of Battle Creek The Hinman Company $1,050,000 $2,246,000 None 305 0 305 0 N/A 0.71 14.1 2010
Subzone CommunityReported Companies Receiving
BenefitsProjected
Investment 1Reported Actual
Investment
Reported Residents Receiving Benefits in
2015
Reported Actual Job Creation/Retention 5
Reported Avg Weekly Wage of
Jobs Created
% Change in Taxable
Value (TV)
% Change in SEV
First Year Benefits Received
Former BCHS Community Site/Youth Bldg 7
City of Battle Creek 2001
Kraft Foods 7 City of Battle Creek 2001
Sullivan Barn/Hart Hotel/ Equipment Center 7
City of Battle Creek 2001
Transamerica Tower/BC Tower (Remainder) 7
City of Battle Creek 16 N/A Not Reported Not Reported Not Reported Not Reported 265.9 265.9 2001
Eastside Neighborhood 7 City of Kalamazoo 2001
Enterprise Center 7 City of Kalamazoo 2001
Former Consumers North/ Ampersee 7 City of Kalamazoo 2001
Northside Commercial 7 City of Kalamazoo 2001
Portage Creek Corridor 7 City of Kalamazoo 2001
Midlink Bus. Pk. (Remainder) 7 Township of Comstock 2001
$184,320,120 168
4 Information derived from original application or reported by the company in annual progress report5 Reported Actual Job Creation/Retention is calculated by subtracting Reported Jobs Transferred to Zone and Reported Baseline Jobs at Zone Designation from Reported Current Jobs
7 Metrics not enforced by a Development Agreement
Kalamazoo/Battle Creek Renaissance Zone
Company-specific Subzones
6 Company received additional state economic incentive(s)
Did Not Report
Did Not Report
TOTALS:
Classification Investment Jobs Tax Information
Community-specific Subzones
1 Projected information is derived from original application or development agreement2 The number of jobs the company reported to have on December 31, 20153 Jobs transferred to the Zone from another facility or entity owned by the same company outside of the Zone
Renaissance Zone Annual Report / CY / 2015 / 28

Benefits
Subzone Community CompanyProjected
Investment 1Reported Actual
Investment
Projected Job Creation/
Retention 1
Reported Current Jobs 2
Reported Jobs Transferred
to Zone 3
Reported Baseline Jobs at
Designation 4
Reported Actual Job Creation/Retention 5
Reported Avg Weekly Wage of
Jobs Created
% Change in Taxable
Value (TV)
% Change in SEV
First Year Benefits Received
Eastlake/ Filer/Manistee and Eastlake/Filer/ Manistee II
City of ManisteeAmerican Materials (Reith Riley) 6, 7 $19,400,000 $11,622,475
8(ret)8(cre)
11 3 8 0 $1,000 988.8 859.6 2009
Amptech Inc. City of Manistee Amptech, Inc. 6 $1,380,000 $1,853,708 40 43 0 48 -5 Not Reported 2.1 2.1 2010$13,476,183 -5
Manistee County Renaissance Zone
Company-specific SubzonesClassification Investment Jobs Tax Information
6 Company received additional state economic incentive(s)7 Metrics not enforced by a Development Agreement
TOTALS:
1 Projected information is derived from original application or development agreement2 The number of jobs the company reported to have on December 31, 20153 Jobs transferred to the Zone from another facility or entity owned by the same company outside of the Zone4 Information derived from original application or reported by the company in annual progress report5 Reported Actual Job Creation/Retention is calculated by subtracting Reported Jobs Transferred to Zone and Reported Baseline Jobs at Zone Designation from Reported Current Jobs
Renaissance Zone Annual Report / CY / 2015 / 29

Benefits
Subzone Community CompanyProjected
Investment 1Reported Actual
Investment
Projected Job Creation/
Retention 1
Reported Current Jobs 2
Reported Jobs Transferred
to Zone 3
Reported Baseline Jobs at
Designation 4
Reported Actual Job Creation/Retention 5
Reported Avg Weekly Wage of
Jobs Created
% Change in Taxable
Value (TV)
% Change in SEV
First Year Benefits Received
Township of LeRoy Township of LeRoy Acme Pallet, Inc. 6 $3,150,000 $4,940,809 10 23 0 0 23 $400 11,704.0 8,097.7 2011$4,940,809 23
Mid-Michigan Economic Growth Corridor Renaissance Zone
Company-specific SubzonesClassification Investment Jobs Tax Information
6 Company received additional state economic incentive(s)
TOTALS:
1 Projected information is derived from original application or development agreement2 The number of jobs the company reported to have on December 31, 20153 Jobs transferred to the Zone from another facility or entity owned by the same company outside of the Zone4 Information derived from original application or reported by the company in annual progress report5 Reported Actual Job Creation/Retention is calculated by subtracting Reported Jobs Transferred to Zone and Reported Baseline Jobs at Zone Designation from Reported Current Jobs
Renaissance Zone Annual Report / CY / 2015 / 30

Benefits
Subzone Community CompanyProjected
Investment 1Reported Actual
Investment
Projected Job Creation/
Retention 1
Reported Current Jobs 2
Reported Jobs Transferred
to Zone 3
Reported Baseline Jobs at
Designation 4
Reported Actual Job Creation/Retention 5
Reported Avg Weekly Wage of
Jobs Created
% Change in Taxable
Value (TV)
% Change in SEV
First Year Benefits Received
Village of Edmore Village of Edmore Specialty Lifting Equipment, Inc. (formerly Apiaries & Orchard, Inc.)
$302,000 $723,915 6 28 0 15 13 $800 3.0 3.0 2009
City of Howard/Township of Pierson/Township of Reynolds
Township of Pierson Flex-Cable $222,000 $1,568,203 26 64 0 31 33 $450 64.9 48.3 2011
City of Carson City/Township of Bloomer/ Township of North Shade
City of Carson CityDTE Electric Company (fka Renaissance Power, LLC) (Amended)
$10,000,000 $19,030,123 None 9 0 8 1 Not Reported 2.6 33.4 2012
Subzone CommunityReported Companies Receiving
BenefitsProjected
Investment 1Reported Actual
Investment
Reported Residents Receiving Benefits in
2015
Reported Actual Job Creation/Retention 5
% Change in Taxable
Value (TV)
% Change in SEV
First Year Benefits Received
City of Carson City/Township of Bloomer/ Township of North Shade 6
City of Carson City/Township of Bloomer/ Township of North Shade
2001
Township of Montcalm 6 Township of Montcalm 2001Village of Breckenridge/ Township of Wheeler 6
Village of Breckenridge/ Township of Wheeler
7 N/A $6,004,000 Not Reported 73 $650 393.7 315.0 2001
Village of Edmore (Remainder) 6 Village of Edmore 2001$27,326,241 120
Montcalm/Gratiot Counties Renaissance Zone
Company-specific SubzonesClassification Investment Jobs Tax Information
6 Metrics not enforced by a Development Agreement
Community-specific Subzones
Did Not Report
TOTALS:
1 Projected information is derived from original application or development agreement2 The number of jobs the company reported to have on December 31, 20153 Jobs transferred to the Zone from another facility or entity owned by the same company outside of the Zone4 Information derived from original application or reported by the company in annual progress report5 Reported Actual Job Creation/Retention is calculated by subtracting Reported Jobs Transferred to Zone and Reported Baseline Jobs at Zone Designation from Reported Current Jobs
Did Not Report
Did Not Report
Renaissance Zone Annual Report / CY / 2015 / 31

Benefits
Subzone Community CompanyProjected
Investment 1Reported Actual
Investment
Projected Job Creation/
Retention 1
Reported Current Jobs 2
Reported Jobs Transferred
to Zone 3
Reported Baseline Jobs at
Designation 4
Reported Actual Job Creation/Retention 5
Reported Avg Weekly Wage of
Jobs Created
% Change in Taxable
Value (TV)
% Change in SEV
First Year Benefits Received
Muskegon Mall/Rook Project City of Muskegon Parkland Muskegon, LLC 6, 7 $4,000,000 $1,307,794 12 0 0 0 0 $0 -46.0 71.2 2008
Former Muskegon Mall City of MuskegonHeritage Square Development, LLC 7 $5,000,000 $2,591,304 12 6 1 0 5 $640 524.4 641.4 2009
Subzone CommunityReported Companies Receiving
BenefitsProjected
Investment 1Reported Actual
Investment
Reported Residents Receiving Benefits in
2015
Reported Actual Job Creation/Retention 5
Reported Avg Weekly Wage of
Jobs Created
% Change in Taxable
Value (TV)
% Change in SEV
First Year Benefits Received
Intra City Dispatch 7 City of Muskegon Heights 1 N/A Not Reported Not Reported Not Reported Not Reported -0.25 -0.08 2002$3,899,098 5
Muskegon/Muskegon Heights Renaissance Zone
Company-specific SubzonesClassification Investment Jobs Tax Information
7 Metrics not enforced by a Development Agreement
6 Company received additional state economic incentive(s)
Community-specific Subzones
TOTALS:
1 Projected information is derived from original application or development agreement2 The number of jobs the company reported to have on December 31, 20153 Jobs transferred to the Zone from another facility or entity owned by the same company outside of the Zone4 Information derived from original application or reported by the company in annual progress report5 Reported Actual Job Creation/Retention is calculated by subtracting Reported Jobs Transferred to Zone and Reported Baseline Jobs at Zone Designation from Reported Current Jobs
Renaissance Zone Annual Report / CY / 2015 / 32

Businesses Individuals Benefits
Subzone CommunityReported Companies Receiving
BenefitsProjected
Investment 1Reported Actual
Investment
Reported Residents Receiving Benefits in
2014
Reported Actual Job Creation/
Retention 5
Reported Avg Weekly Wage
of Jobs Created
% Change in Taxable Value
(TV)% Change in SEV
First Year Benefits Received
City of Bessemer 6 City of Bessemer 2003
Marenisco Twp. 6 Township of Marenisco 2001
City of Wakefield City/Township of Wakefield (Remainder) 6
City of Wakefield/Township of Wakefield
2 N/A $350,000 2 7 $600 24.1 31.2 2003
$350,000 7
Businesses Individuals Benefits
Subzone CommunityReported Companies Receiving
BenefitsProjected
Investment 1Reported Actual
Investment
Reported Residents Receiving Benefits in
2015
Reported Actual Job Creation/
Retention 5
Reported Avg Weekly Wage
of Jobs Created
% Change in Taxable Value
(TV)% Change in SEV
First Year Benefits Received
National Guard Armory Site 6 City of Alpena 3 N/A $42,000 0 0 N/A 100 100 2000
Oxbow Park6 City of Alpena 9 N/A $6,968,087 57 64 $425 100 100 2000
City of Onaway 6 City of Onaway 2000
Rogers City 7 / Industrial Park 6 City of Rogers City 1 N/A $55,000 0 0 N/A 215.5 216.9 2000
Rogers City 8 / Residential 6 City of Rogers City 1 N/A $120,000 1 0 N/A Not Reported Not Reported 2000
Grand Traverse Commons 6 City of Traverse City 74 N/A $25,531,827 11 Not Reported Not Reported 521.6 340.3 2000$32,716,914 64
Did Not ReportDid Not Report
TOTALS:
North Country Renaissance Zone
5 Reported Actual Job Creation/Retention is calculated by subtracting Reported Jobs Transferred to Zone and Reported Baseline Jobs at Zone Designation from Reported Current Jobs6 Metrics not enforced by a Development Agreement
Community-specific SubzonesClassification Investment Jobs Tax Information
Community-specific SubzonesClassification Investment Jobs Tax Information
6 Metrics not enforced by a Development Agreement
1 Projected information is derived from original application or development agreement2 The number of jobs the company reported to have on December 31, 20153 Jobs transferred to the Zone from another facility or entity owned by the same company outside of the Zone4 Information derived from original application or reported by the company in annual progress report
TOTALS:
Did Not Report
Northern Tier Renaissance Zone
1 Projected information is derived from original application or development agreement2 The number of jobs the company reported to have on December 31, 20153 Jobs transferred to the Zone from another facility or entity owned by the same company outside of the Zone4 Information derived from original application or reported by the company in annual progress report5 Reported Actual Job Creation/Retention is calculated by subtracting Reported Jobs Transferred to Zone and Reported Baseline Jobs at Zone Designation from Reported Current Jobs
Renaissance Zone Annual Report / CY / 2015 / 33

Businesses Individuals Benefits
Subzone CommunityReported Companies Receiving
BenefitsProjected
Investment 1Reported Actual
Investment
Reported Residents Receiving Benefits in
2013
Reported Actual Job Creation/Retention 5
Reported Avg Weekly Wage
of Jobs Created
% Change in Taxable Value
(TV)% Change in SEV
First Year Benefits Received
Village of Caro 6 City of Caro 3 N/A Not Reported Not Reported Not Reported Not Reported Not Reported Not Reported 2000Village of Cass City / Millennium 6 Village of Cass City 2000
Benefits
Subzone Community CompanyProjected
Investment 1Reported Actual
Investment
Projected Job Creation/
Retention 1
Reported Current Jobs 2
Reported Jobs Transferred
to Zone 3
Reported Baseline Jobs at
Designation 4
Reported Actual Job Creation/Retention 5
Reported Avg Weekly Wage of
Jobs Created
% Change in Taxable
Value (TV)
% Change in SEV
First Year Benefits Received
Midtown Hospital Campus City of Detroit VHS of Michigan, Inc. (Vanguard/DMC)
$400,000,000 $327,965,339 None 5,894 774 6,758 -1,638 $1,104 100.0 100.0 2011
Woodward Avenue (Old Hudson's Bldg.)
City of Detroit 1208 Woodward, LLC (Amended) $75,000,000 $11,000,000 None 0 0 0 0 N/A 0 0 2012
Subzone CommunityReported Companies Receiving
BenefitsProjected
Investment 1Reported Actual
Investment
Reported Residents Receiving Benefits in
2015
Reported Actual Job Creation/Retention 5
Reported Avg Weekly Wage of
Jobs Created
% Change in Taxable
Value (TV)
% Change in SEV
First Year Benefits Received
Atwater Street (River East) 6 City of Detroit 2003
Jefferson Avenue - Tower 500/EDS 6 City of Detroit 2003
Michigan Avenue - Book Cadillac Hotel 6 City of Detroit 2003
East Jefferson Office Site 6 City of River Rouge 2001
Pleasant Street 6 City of River Rouge 2001
Industrial Park-East Side 6 City of Taylor 2001
Central Avenue 6 City of Wyandotte 2001$338,965,339 -1638
Did Not Report
Did Not Report
Did Not Report
Community-specific Subzones
Thumb Area Renaissance Zone
Community-specific SubzonesClassification Investment Jobs Tax Information
6 Metrics not enforced by a Development Agreement
TOTALS:
1 Projected information is derived from original application or development agreement2 The number of jobs the company reported to have on December 31, 20153 Jobs transferred to the Zone from another facility or entity owned by the same company outside of the Zone4 Information derived from original application or reported by the company in annual progress report5 Reported Actual Job Creation/Retention is calculated by subtracting Reported Jobs Transferred to Zone and Reported Baseline Jobs at Zone Designation from Reported Current Jobs
Did Not Report
Did Not ReportDid Not Report
1 Projected information is derived from original application or development agreement2 The number of jobs the company reported to have on December 31, 20133 Jobs transferred to the Zone from another facility or entity owned by the same company outside of the Zone4 Information derived from original application or reported by the company in annual progress report5 Reported Actual Job Creation/Retention is calculated by subtracting Reported Jobs Transferred to Zone and Reported Baseline Jobs at Zone Designation from Reported Current Jobs
Tax Information
6 Metrics not enforced by a Development Agreement
Wayne County Renaissance Zone
Company-specific SubzonesClassification Investment Jobs
Did Not Report
Renaissance Zone Annual Report / CY / 2015 / 34
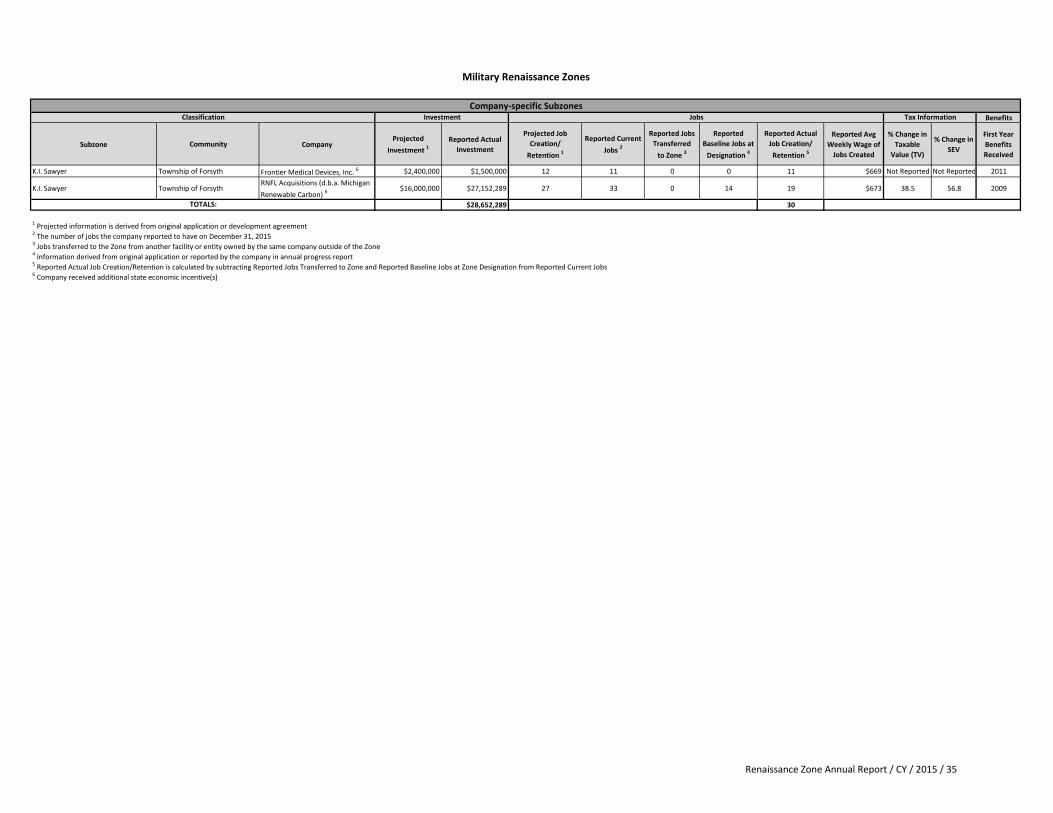
Benefits
Subzone Community CompanyProjected
Investment 1Reported Actual
Investment
Projected Job Creation/
Retention 1
Reported Current Jobs 2
Reported Jobs Transferred
to Zone 3
Reported Baseline Jobs at
Designation 4
Reported Actual Job Creation/Retention 5
Reported Avg Weekly Wage of
Jobs Created
% Change in Taxable
Value (TV)
% Change in SEV
First Year Benefits Received
K.I. Sawyer Township of Forsyth Frontier Medical Devices, Inc. 6 $2,400,000 $1,500,000 12 11 0 0 11 $669 Not Reported Not Reported 2011
K.I. Sawyer Township of ForsythRNFL Acquisitions (d.b.a. Michigan Renewable Carbon) 6
$16,000,000 $27,152,289 27 33 0 14 19 $673 38.5 56.8 2009
$28,652,289 30TOTALS:
Military Renaissance Zones
Company-specific SubzonesClassification Investment Jobs Tax Information
6 Company received additional state economic incentive(s)
1 Projected information is derived from original application or development agreement2 The number of jobs the company reported to have on December 31, 20153 Jobs transferred to the Zone from another facility or entity owned by the same company outside of the Zone4 Information derived from original application or reported by the company in annual progress report5 Reported Actual Job Creation/Retention is calculated by subtracting Reported Jobs Transferred to Zone and Reported Baseline Jobs at Zone Designation from Reported Current Jobs
Renaissance Zone Annual Report / CY / 2015 / 35