mesoscale folds and faults along a flank of a syrian arc...
TRANSCRIPT

Mesoscale folds and faults along a flank of a Syrian Arc monocline,
discordant to the monocline trend
N. JOSEPH-HAI1*, Y. EYAL1 & R. WEINBERGER2
1Department of Geology and Environmental Sciences, Ben Gurion University,
Beer Sheva 84105, Israel2Geological Survey of Israel, 30 Malkhe Yisrael Street, Jerusalem 95501, Israel
*Corresponding author (e-mail: [email protected])
Abstract: Orientations of folds and small faults were measured in Turonian and Senonian rocksalong the western limb of the Ramallah monocline in Israel, one of the structures comprisingthe Syrian Arc fold belt (SAFB). The minority of the folds, aligned NNE–SSW, are compatiblewith the WNW–ESE shortening trend of the SAFB, whereas the majority of them, alignedENE–WSW, are not compatible with this shortening trend. Kinematic analysis of faults’ attitudeindicates NNW–SSE shortening and ENE–WSW extension in accordance with the shortening ofthe majority of folds. Based on the folds trends, scale, and geometry, as well as the associated faultkinematics, we conclude that the folding mechanism is tectonic shortening and not intraformationalfolding due to landsliding or collapse owing to karst activity as previously postulated. We proposethat a minority of the folds, compatible with the major trend of the Ramallah monocline, areparasitic small folds within the SAFB. The majority of the folds, which are not compatible withthe SAFB, were formed owing to NNW–SSE shortening that has been associated with Mioceneto Recent movement along the Dead Sea Transform.
The Syrian Arc fold belt (SAFB) (Krenkel 1924)consists of three segments, which are characterizedby the distinct orientation of their axes (Fig. 1a).The fold axes in the southwestern segment in Sinai(Egypt) and northern Negev (Israel) are alignedNE–SW; the folds in the central segment, comp-rising the Judea-Samaria and Galilee mountainsin Israel and southern Lebanon, are alignedNNE–SSW to almost north–south, and the north-eastern segment, the Palmyrides (Syria), arealigned NE–SW. It is widely accepted that thesestructures formed owing to displacement alongreverse faults (e.g. Mimran 1976), that resultedfrom reactivation of older, Jurassic, normal faults(Freund et al. 1975; Bruner 1991; Walley 1998;and references therein). The central segment of theSyrian Arc comprises the NNE–SSW trendingmonoclines of Hebron, Ramallah, and Fariah,whose axes are arranged in en-echelon architecture(Shahar 1994). These monoclines are the most pro-minent structures in the central and northern parts ofIsrael and form the mountain backbone west of theJordan River (Fig. 1b). The early folding of theSyrian Arc owing to WNW–ESE shorteningstarted during the Turonian series and terminatedat the Miocene series (Letouzey & Tremolieres1980; Eyal & Reches 1983) or extended from theTuronian series to the Present (Eyal 1996). A laterregional shortening, trending NNW–SSE andrelated to the Dead Sea Transform (DST) is active
from the Miocene series to the Present (Letouzey& Tremolieres 1980; Eyal & Reches 1983; Eyal1996; Eyal et al. 2001).
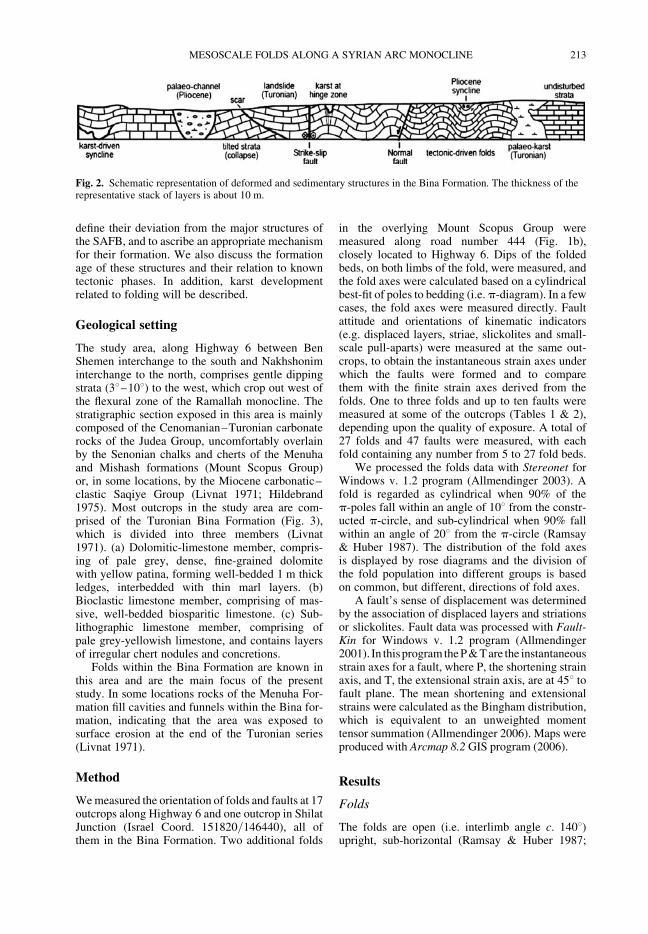
New road cuts in the Turonian Bina Formationexpose many mesoscale folds, faults, and joints inthe western margins of the Judea Mountainsduring the last decade owing to the construction ofHighway 6 (Cross Israel Highway). Previousstudies in the surrounding areas already describedfolds, whose axes are oriented perpendicular to themain NNE–SSW trending of the monocline axes(e.g. Bentor & Vroman 1954; Shomroni 1970;Dimant 1971; Livnat 1971; Ilani 1972; Hildebrand1975). However, to date, there is no coherent expla-nation to their origin and time relation with thelarge-scale monoclines. Several options have beensuggested to explain the origin of these folds. (a)They are collapse structures that formed owing tokarst activity. This karstic activity formed largesub-surface cavities in the carbonate rocks of Binaformation into which the overlying rocks weretilted and folded by collapse. (b) The folds are intra-formational structures of the Turonian age thatinitiated by landslides in the unstable shelf sedi-ments. (c) The folds have a tectonic origin owingto post-Turonian shortening.
Each of these fold mechanisms is known in thearea and displays a distinctive pattern (Fig. 2). Thegoals of the present study are to quantify the orien-tations of these folds (and associated faults) and
From: Homberg, C. & Bachmann, M. (eds) Evolution of the Levant Margin and Western Arabia Platform sincethe Mesozoic. Geological Society, London, Special Publications, 341, 211–226.DOI: 10.1144/SP341.10 0305-8719/10/$15.00 # The Geological Society of London 2010.
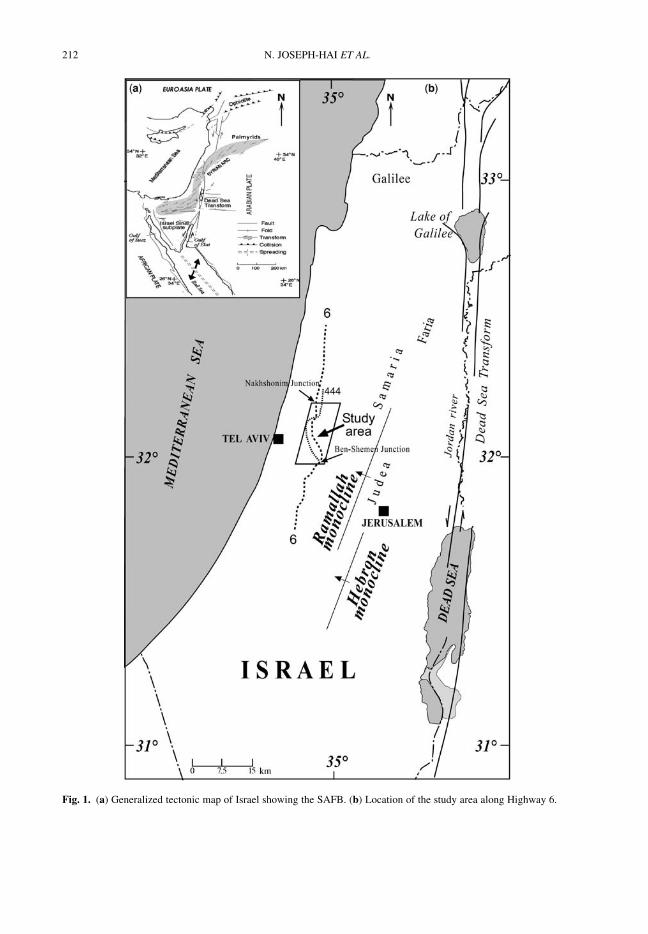
Fig. 1. (a) Generalized tectonic map of Israel showing the SAFB. (b) Location of the study area along Highway 6.
N. JOSEPH-HAI ET AL.212
define their deviation from the major structures ofthe SAFB, and to ascribe an appropriate mechanismfor their formation. We also discuss the formationage of these structures and their relation to knowntectonic phases. In addition, karst developmentrelated to folding will be described.
Geological setting
The study area, along Highway 6 between BenShemen interchange to the south and Nakhshoniminterchange to the north, comprises gentle dippingstrata (38–108) to the west, which crop out west ofthe flexural zone of the Ramallah monocline. Thestratigraphic section exposed in this area is mainlycomposed of the Cenomanian–Turonian carbonaterocks of the Judea Group, uncomfortably overlainby the Senonian chalks and cherts of the Menuhaand Mishash formations (Mount Scopus Group)or, in some locations, by the Miocene carbonatic–clastic Saqiye Group (Livnat 1971; Hildebrand1975). Most outcrops in the study area are com-prised of the Turonian Bina Formation (Fig. 3),which is divided into three members (Livnat1971). (a) Dolomitic-limestone member, compris-ing of pale grey, dense, fine-grained dolomitewith yellow patina, forming well-bedded 1 m thickledges, interbedded with thin marl layers. (b)Bioclastic limestone member, comprising of mas-sive, well-bedded biosparitic limestone. (c) Sub-lithographic limestone member, comprising ofpale grey-yellowish limestone, and contains layersof irregular chert nodules and concretions.
Folds within the Bina Formation are known inthis area and are the main focus of the presentstudy. In some locations rocks of the Menuha For-mation fill cavities and funnels within the Bina for-mation, indicating that the area was exposed tosurface erosion at the end of the Turonian series(Livnat 1971).
Method
We measured the orientation of folds and faults at 17outcrops along Highway 6 and one outcrop in ShilatJunction (Israel Coord. 151820/146440), all ofthem in the Bina Formation. Two additional folds
in the overlying Mount Scopus Group weremeasured along road number 444 (Fig. 1b),closely located to Highway 6. Dips of the foldedbeds, on both limbs of the fold, were measured, andthe fold axes were calculated based on a cylindricalbest-fit of poles to bedding (i.e. p-diagram). In a fewcases, the fold axes were measured directly. Faultattitude and orientations of kinematic indicators(e.g. displaced layers, striae, slickolites and small-scale pull-aparts) were measured at the same out-crops, to obtain the instantaneous strain axes underwhich the faults were formed and to comparethem with the finite strain axes derived from thefolds. One to three folds and up to ten faults weremeasured at some of the outcrops (Tables 1 & 2),depending upon the quality of exposure. A total of27 folds and 47 faults were measured, with eachfold containing any number from 5 to 27 fold beds.
We processed the folds data with Stereonet forWindows v. 1.2 program (Allmendinger 2003). Afold is regarded as cylindrical when 90% of thep-poles fall within an angle of 108 from the constr-ucted p-circle, and sub-cylindrical when 90% fallwithin an angle of 208 from the p-circle (Ramsay& Huber 1987). The distribution of the fold axesis displayed by rose diagrams and the division ofthe fold population into different groups is basedon common, but different, directions of fold axes.
A fault’s sense of displacement was determinedby the association of displaced layers and striationsor slickolites. Fault data was processed with Fault-Kin for Windows v. 1.2 program (Allmendinger2001). In this program the P & T are the instantaneousstrain axes for a fault, where P, the shortening strainaxis, and T, the extensional strain axis, are at 458 tofault plane. The mean shortening and extensionalstrains were calculated as the Bingham distribution,which is equivalent to an unweighted momenttensor summation (Allmendinger 2006). Maps wereproduced with Arcmap 8.2 GIS program (2006).
Results
Folds
The folds are open (i.e. interlimb angle c. 1408)upright, sub-horizontal (Ramsay & Huber 1987;
Fig. 2. Schematic representation of deformed and sedimentary structures in the Bina Formation. The thickness of therepresentative stack of layers is about 10 m.
MESOSCALE FOLDS ALONG A SYRIAN ARC MONOCLINE 213
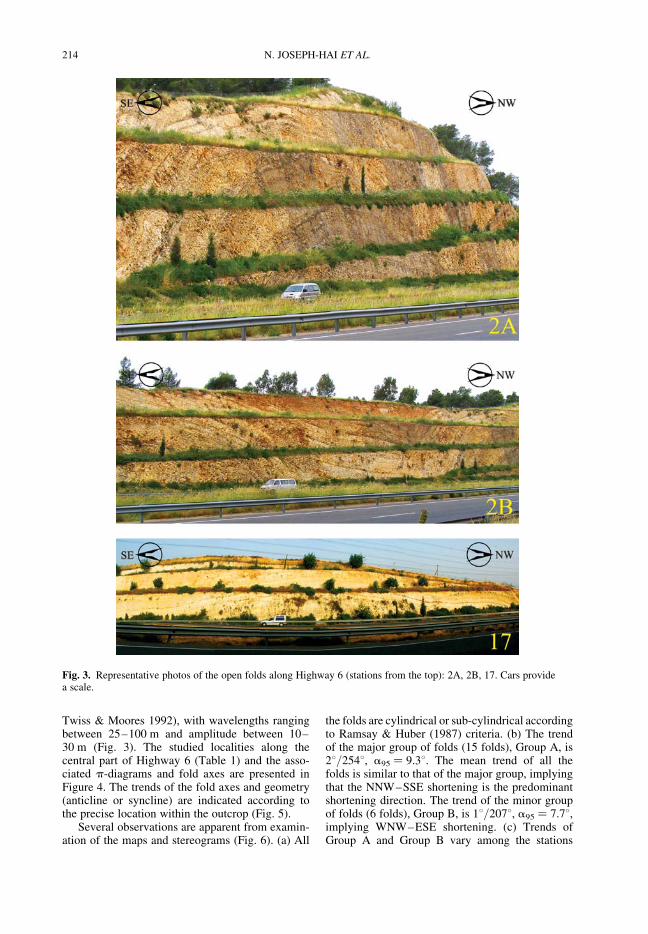
Twiss & Moores 1992), with wavelengths rangingbetween 25–100 m and amplitude between 10–30 m (Fig. 3). The studied localities along thecentral part of Highway 6 (Table 1) and the asso-ciated p-diagrams and fold axes are presented inFigure 4. The trends of the fold axes and geometry(anticline or syncline) are indicated according tothe precise location within the outcrop (Fig. 5).
Several observations are apparent from examin-ation of the maps and stereograms (Fig. 6). (a) All
the folds are cylindrical or sub-cylindrical accordingto Ramsay & Huber (1987) criteria. (b) The trendof the major group of folds (15 folds), Group A, is28/2548, a95 ¼ 9.38. The mean trend of all thefolds is similar to that of the major group, implyingthat the NNW–SSE shortening is the predominantshortening direction. The trend of the minor groupof folds (6 folds), Group B, is 18/2078, a95 ¼ 7.78,implying WNW–ESE shortening. (c) Trends ofGroup A and Group B vary among the stations
Fig. 3. Representative photos of the open folds along Highway 6 (stations from the top): 2A, 2B, 17. Cars providea scale.
N. JOSEPH-HAI ET AL.214
without consistent spatial order (e.g. compare foldaxes in the neighbouring stations 7 and 8). Thefour uncommon NW-trending folds are all closelylocated at the most southern part of the study area(Stations 3, 14B, 16–17) and maybe related tolocal disturbance at that site.
Outcrops of the Menuha Formation, composedof massive chalks, are exposed along Highway 6.However, the absence of any prominent beddingor stratigraphic markers prevent dip measurementsof these rocks. On the other hand, dip measurementof 40 cm thick folded layer of the Mishash chertexposed in two localities along road 444 (IsraelCoord. 145116/153489, 144749/152211) revealsthat the fold axes are similar to that of GroupA. In one location, near Re’ut (Israel Coord.152560/143505), we measured a fold in Pliocenerocks whose 2648 trending axis is similar to that ofGroup A (Fig. 7).
Faults
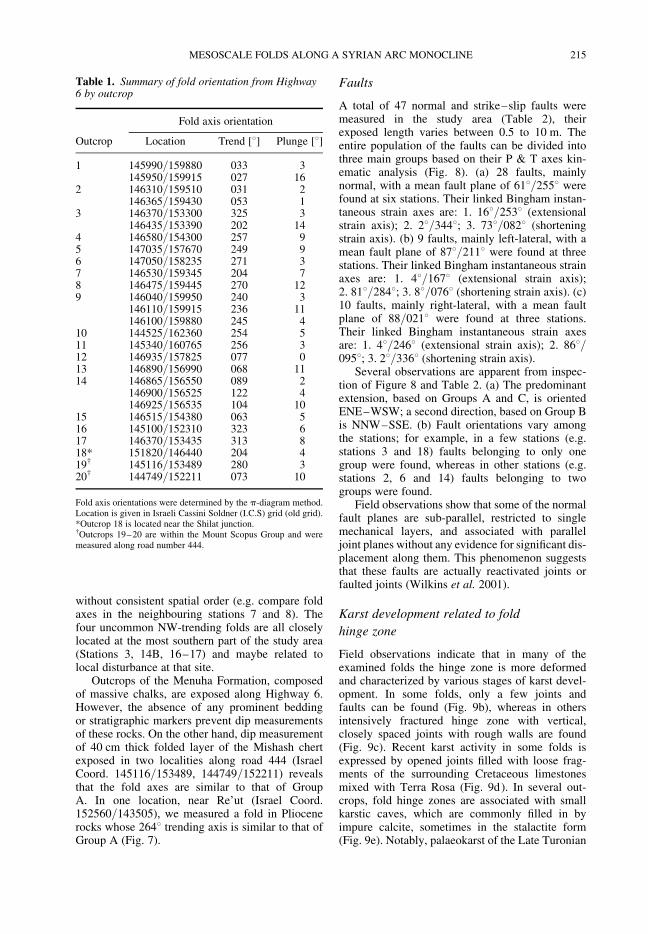
A total of 47 normal and strike–slip faults weremeasured in the study area (Table 2), theirexposed length varies between 0.5 to 10 m. Theentire population of the faults can be divided intothree main groups based on their P & T axes kin-ematic analysis (Fig. 8). (a) 28 faults, mainlynormal, with a mean fault plane of 618/2558 werefound at six stations. Their linked Bingham instan-taneous strain axes are: 1. 168/2538 (extensionalstrain axis); 2. 28/3448; 3. 738/0828 (shorteningstrain axis). (b) 9 faults, mainly left-lateral, with amean fault plane of 878/2118 were found at threestations. Their linked Bingham instantaneous strainaxes are: 1. 48/1678 (extensional strain axis);2. 818/2848; 3. 88/0768 (shortening strain axis). (c)10 faults, mainly right-lateral, with a mean faultplane of 88/0218 were found at three stations.Their linked Bingham instantaneous strain axesare: 1. 48/2468 (extensional strain axis); 2. 868/0958; 3. 28/3368 (shortening strain axis).
Several observations are apparent from inspec-tion of Figure 8 and Table 2. (a) The predominantextension, based on Groups A and C, is orientedENE–WSW; a second direction, based on Group Bis NNW–SSE. (b) Fault orientations vary amongthe stations; for example, in a few stations (e.g.stations 3 and 18) faults belonging to only onegroup were found, whereas in other stations (e.g.stations 2, 6 and 14) faults belonging to twogroups were found.
Field observations show that some of the normalfault planes are sub-parallel, restricted to singlemechanical layers, and associated with paralleljoint planes without any evidence for significant dis-placement along them. This phenomenon suggeststhat these faults are actually reactivated joints orfaulted joints (Wilkins et al. 2001).
Karst development related to fold
hinge zone
Field observations indicate that in many of theexamined folds the hinge zone is more deformedand characterized by various stages of karst devel-opment. In some folds, only a few joints andfaults can be found (Fig. 9b), whereas in othersintensively fractured hinge zone with vertical,closely spaced joints with rough walls are found(Fig. 9c). Recent karst activity in some folds isexpressed by opened joints filled with loose frag-ments of the surrounding Cretaceous limestonesmixed with Terra Rosa (Fig. 9d). In several out-crops, fold hinge zones are associated with smallkarstic caves, which are commonly filled in byimpure calcite, sometimes in the stalactite form(Fig. 9e). Notably, palaeokarst of the Late Turonian
Table 1. Summary of fold orientation from Highway6 by outcrop
Fold axis orientation
Outcrop Location Trend [8] Plunge [8]
1 145990/159880 033 3145950/159915 027 16
2 146310/159510 031 2146365/159430 053 1
3 146370/153300 325 3146435/153390 202 14
4 146580/154300 257 95 147035/157670 249 96 147050/158235 271 37 146530/159345 204 78 146475/159445 270 129 146040/159950 240 3
146110/159915 236 11146100/159880 245 4
10 144525/162360 254 511 145340/160765 256 312 146935/157825 077 013 146890/156990 068 1114 146865/156550 089 2
146900/156525 122 4146925/156535 104 10
15 146515/154380 063 516 145100/152310 323 617 146370/153435 313 818* 151820/146440 204 419† 145116/153489 280 320† 144749/152211 073 10
Fold axis orientations were determined by the p-diagram method.Location is given in Israeli Cassini Soldner (I.C.S) grid (old grid).*Outcrop 18 is located near the Shilat junction.†Outcrops 19–20 are within the Mount Scopus Group and weremeasured along road number 444.
MESOSCALE FOLDS ALONG A SYRIAN ARC MONOCLINE 215
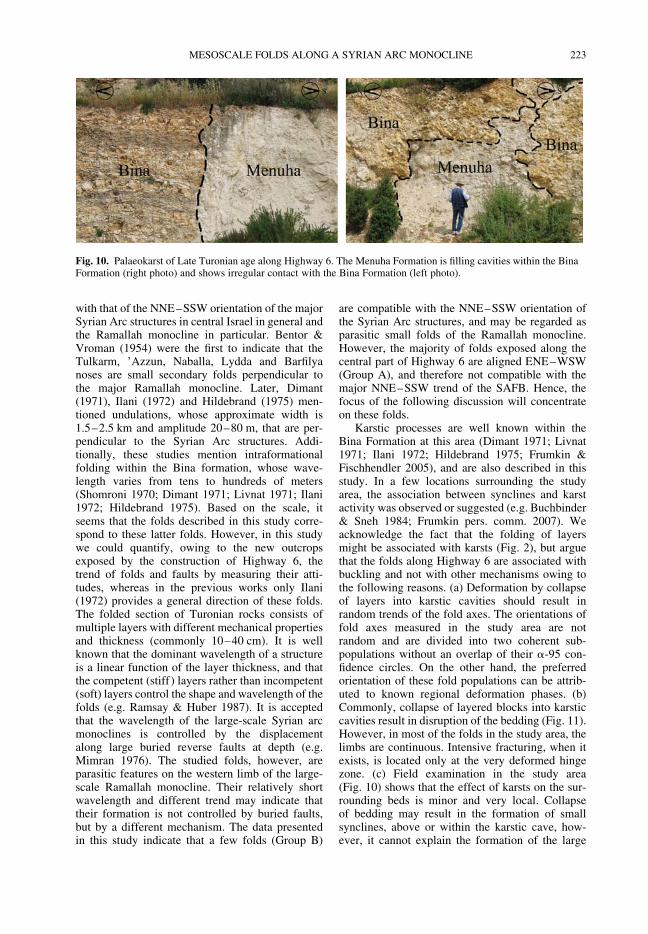
age were also found (Fig. 10) and is characterizedby cavities within the Bina Formation that arefilled by the chalks of the Menuha Formation(Mount Scopus Group).
Discussion
Previous studies in and around the study areadescribed folds, whose trend are not aligned parallel
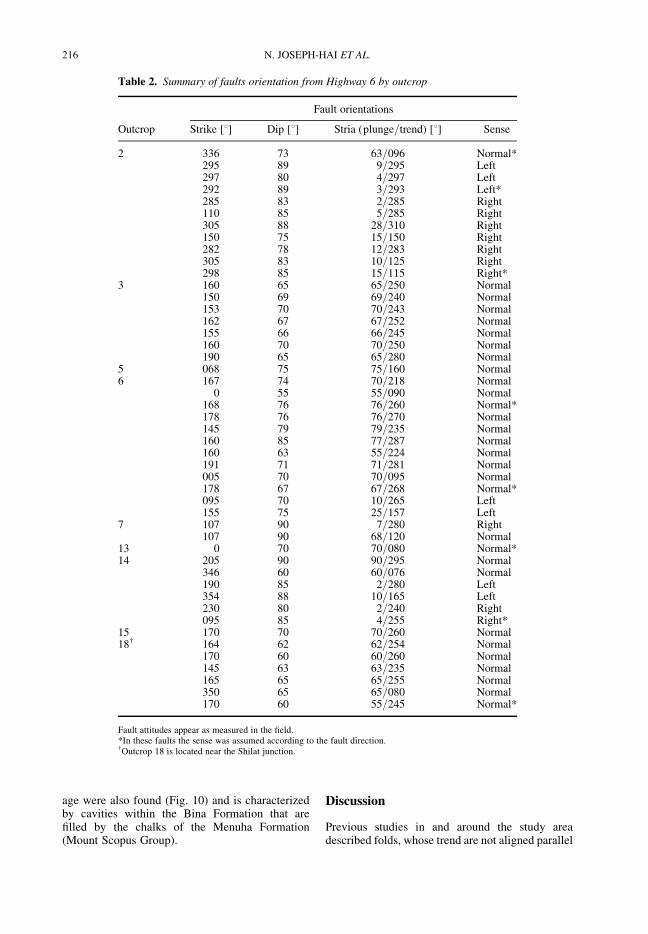
Table 2. Summary of faults orientation from Highway 6 by outcrop
Fault orientations
Outcrop Strike [8] Dip [8] Stria (plunge/trend) [8] Sense
2 336 73 63/096 Normal*295 89 9/295 Left297 80 4/297 Left292 89 3/293 Left*285 83 2/285 Right110 85 5/285 Right305 88 28/310 Right150 75 15/150 Right282 78 12/283 Right305 83 10/125 Right298 85 15/115 Right*
3 160 65 65/250 Normal150 69 69/240 Normal153 70 70/243 Normal162 67 67/252 Normal155 66 66/245 Normal160 70 70/250 Normal190 65 65/280 Normal
5 068 75 75/160 Normal6 167 74 70/218 Normal
0 55 55/090 Normal168 76 76/260 Normal*178 76 76/270 Normal145 79 79/235 Normal160 85 77/287 Normal160 63 55/224 Normal191 71 71/281 Normal005 70 70/095 Normal178 67 67/268 Normal*095 70 10/265 Left155 75 25/157 Left
7 107 90 7/280 Right107 90 68/120 Normal
13 0 70 70/080 Normal*14 205 90 90/295 Normal
346 60 60/076 Normal190 85 2/280 Left354 88 10/165 Left230 80 2/240 Right095 85 4/255 Right*
15 170 70 70/260 Normal18† 164 62 62/254 Normal
170 60 60/260 Normal145 63 63/235 Normal165 65 65/255 Normal350 65 65/080 Normal170 60 55/245 Normal*
Fault attitudes appear as measured in the field.*In these faults the sense was assumed according to the fault direction.†Outcrop 18 is located near the Shilat junction.
N. JOSEPH-HAI ET AL.216
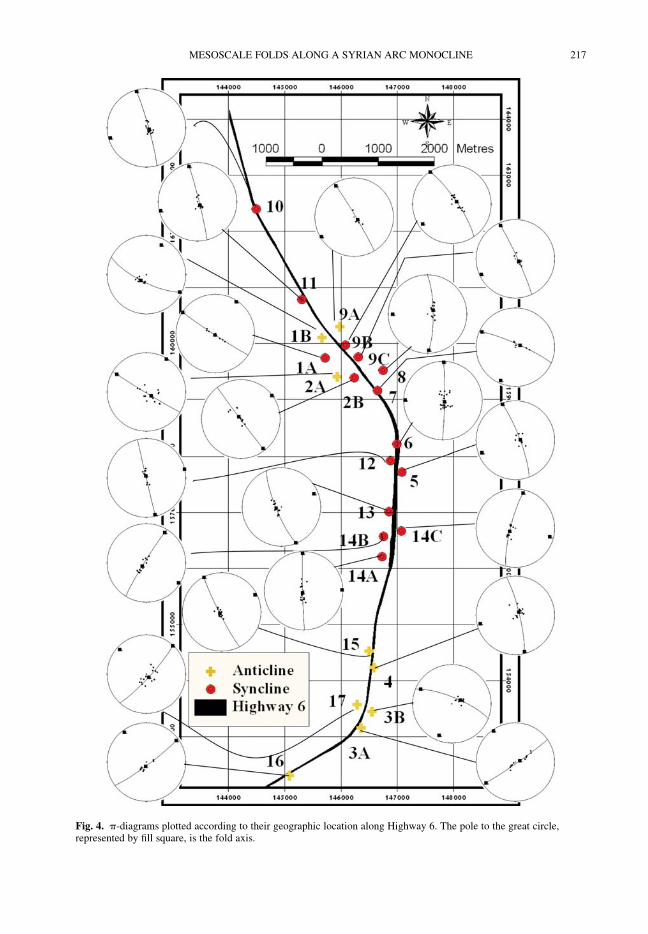
Fig. 4. p-diagrams plotted according to their geographic location along Highway 6. The pole to the great circle,represented by fill square, is the fold axis.
MESOSCALE FOLDS ALONG A SYRIAN ARC MONOCLINE 217
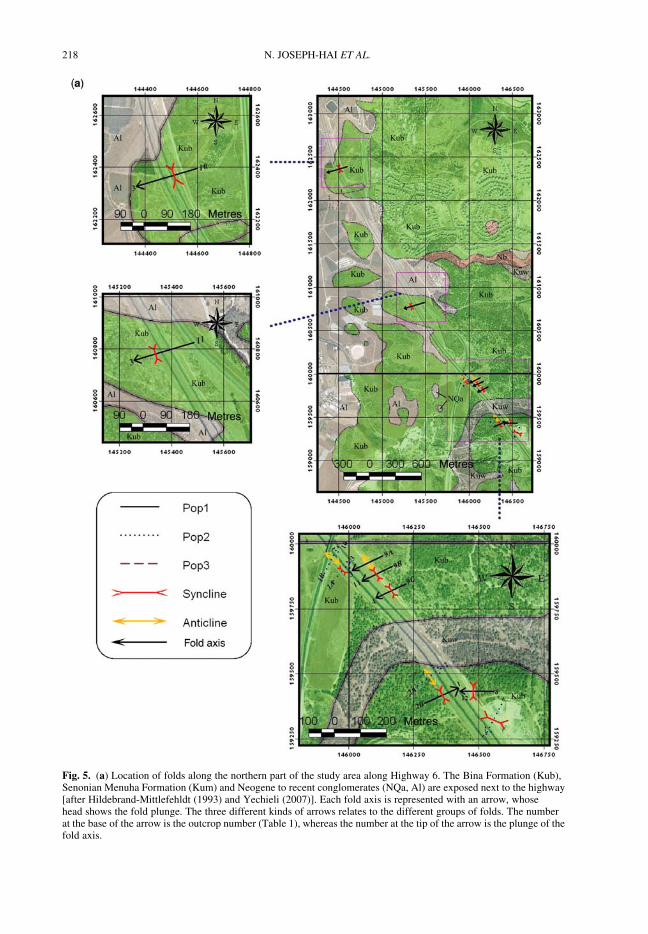
Fig. 5. (a) Location of folds along the northern part of the study area along Highway 6. The Bina Formation (Kub),Senonian Menuha Formation (Kum) and Neogene to recent conglomerates (NQa, Al) are exposed next to the highway[after Hildebrand-Mittlefehldt (1993) and Yechieli (2007)]. Each fold axis is represented with an arrow, whosehead shows the fold plunge. The three different kinds of arrows relates to the different groups of folds. The numberat the base of the arrow is the outcrop number (Table 1), whereas the number at the tip of the arrow is the plunge of thefold axis.
N. JOSEPH-HAI ET AL.218

Fig. 5. (Continued) (b) Location of folds along the southern part of Highway 6. See also caption of Figure 5a.
MESOSCALE FOLDS ALONG A SYRIAN ARC MONOCLINE 219
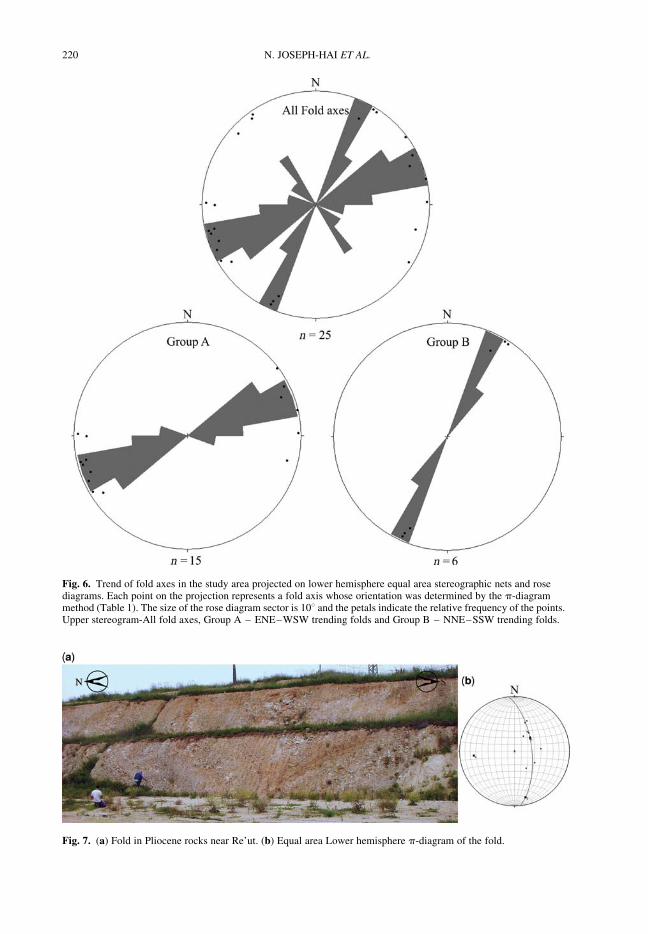
Fig. 6. Trend of fold axes in the study area projected on lower hemisphere equal area stereographic nets and rosediagrams. Each point on the projection represents a fold axis whose orientation was determined by the p-diagrammethod (Table 1). The size of the rose diagram sector is 108 and the petals indicate the relative frequency of the points.Upper stereogram-All fold axes, Group A – ENE–WSW trending folds and Group B – NNE–SSW trending folds.
Fig. 7. (a) Fold in Pliocene rocks near Re’ut. (b) Equal area Lower hemisphere p-diagram of the fold.
N. JOSEPH-HAI ET AL.220
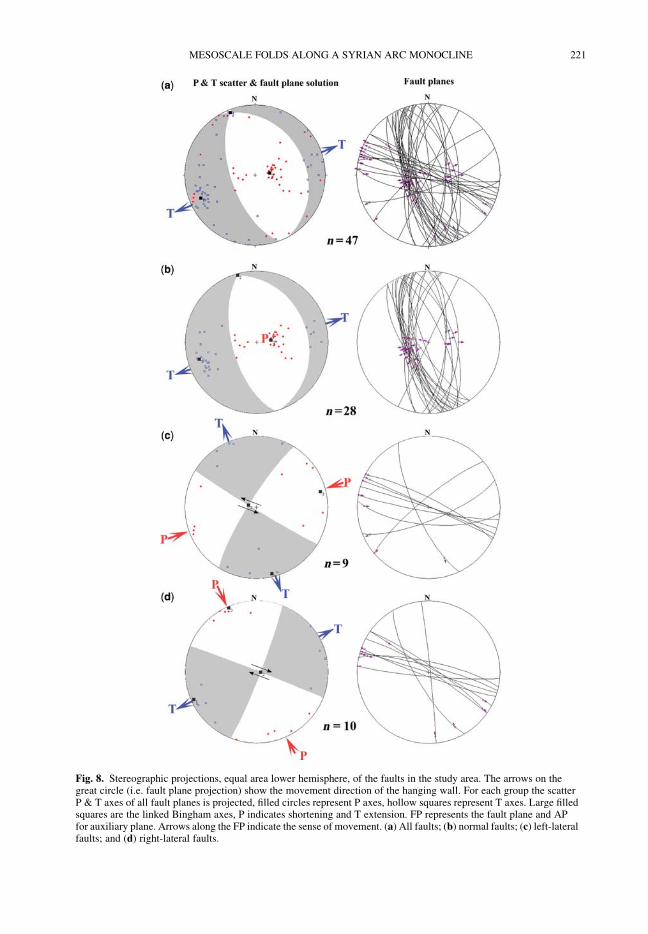
Fig. 8. Stereographic projections, equal area lower hemisphere, of the faults in the study area. The arrows on thegreat circle (i.e. fault plane projection) show the movement direction of the hanging wall. For each group the scatterP & T axes of all fault planes is projected, filled circles represent P axes, hollow squares represent T axes. Large filledsquares are the linked Bingham axes, P indicates shortening and T extension. FP represents the fault plane and APfor auxiliary plane. Arrows along the FP indicate the sense of movement. (a) All faults; (b) normal faults; (c) left-lateralfaults; and (d) right-lateral faults.
MESOSCALE FOLDS ALONG A SYRIAN ARC MONOCLINE 221
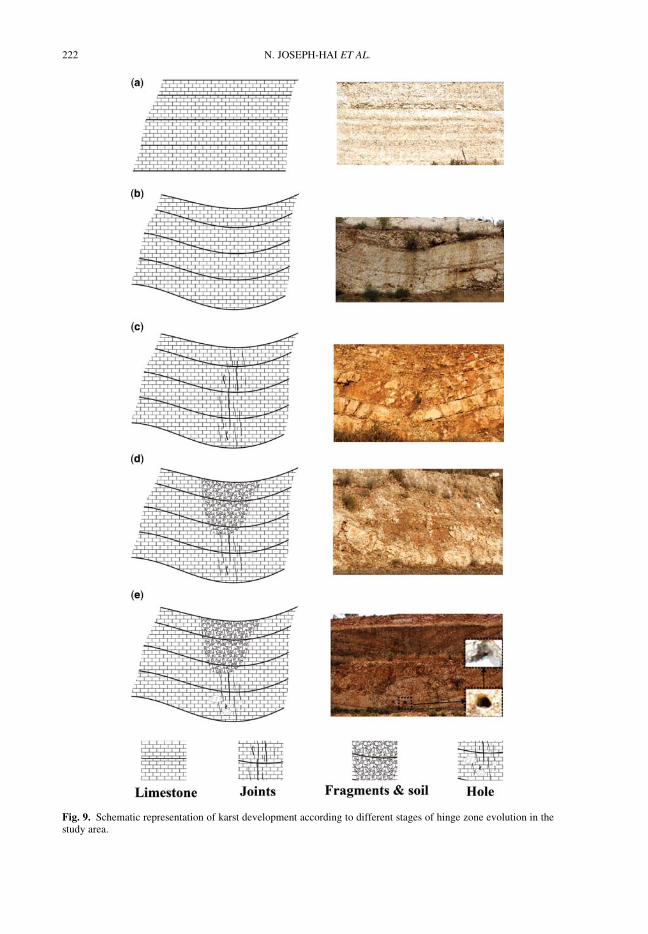
Fig. 9. Schematic representation of karst development according to different stages of hinge zone evolution in thestudy area.
N. JOSEPH-HAI ET AL.222
with that of the NNE–SSW orientation of the majorSyrian Arc structures in central Israel in general andthe Ramallah monocline in particular. Bentor &Vroman (1954) were the first to indicate that theTulkarm, ’Azzun, Naballa, Lydda and Barfilyanoses are small secondary folds perpendicular tothe major Ramallah monocline. Later, Dimant(1971), Ilani (1972) and Hildebrand (1975) men-tioned undulations, whose approximate width is1.5–2.5 km and amplitude 20–80 m, that are per-pendicular to the Syrian Arc structures. Addi-tionally, these studies mention intraformationalfolding within the Bina formation, whose wave-length varies from tens to hundreds of meters(Shomroni 1970; Dimant 1971; Livnat 1971; Ilani1972; Hildebrand 1975). Based on the scale, itseems that the folds described in this study corre-spond to these latter folds. However, in this studywe could quantify, owing to the new outcropsexposed by the construction of Highway 6, thetrend of folds and faults by measuring their atti-tudes, whereas in the previous works only Ilani(1972) provides a general direction of these folds.The folded section of Turonian rocks consists ofmultiple layers with different mechanical propertiesand thickness (commonly 10–40 cm). It is wellknown that the dominant wavelength of a structureis a linear function of the layer thickness, and thatthe competent (stiff ) layers rather than incompetent(soft) layers control the shape and wavelength of thefolds (e.g. Ramsay & Huber 1987). It is acceptedthat the wavelength of the large-scale Syrian arcmonoclines is controlled by the displacementalong large buried reverse faults at depth (e.g.Mimran 1976). The studied folds, however, areparasitic features on the western limb of the large-scale Ramallah monocline. Their relatively shortwavelength and different trend may indicate thattheir formation is not controlled by buried faults,but by a different mechanism. The data presentedin this study indicate that a few folds (Group B)
are compatible with the NNE–SSW orientation ofthe Syrian Arc structures, and may be regarded asparasitic small folds of the Ramallah monocline.However, the majority of folds exposed along thecentral part of Highway 6 are aligned ENE–WSW(Group A), and therefore not compatible with themajor NNE–SSW trend of the SAFB. Hence, thefocus of the following discussion will concentrateon these folds.
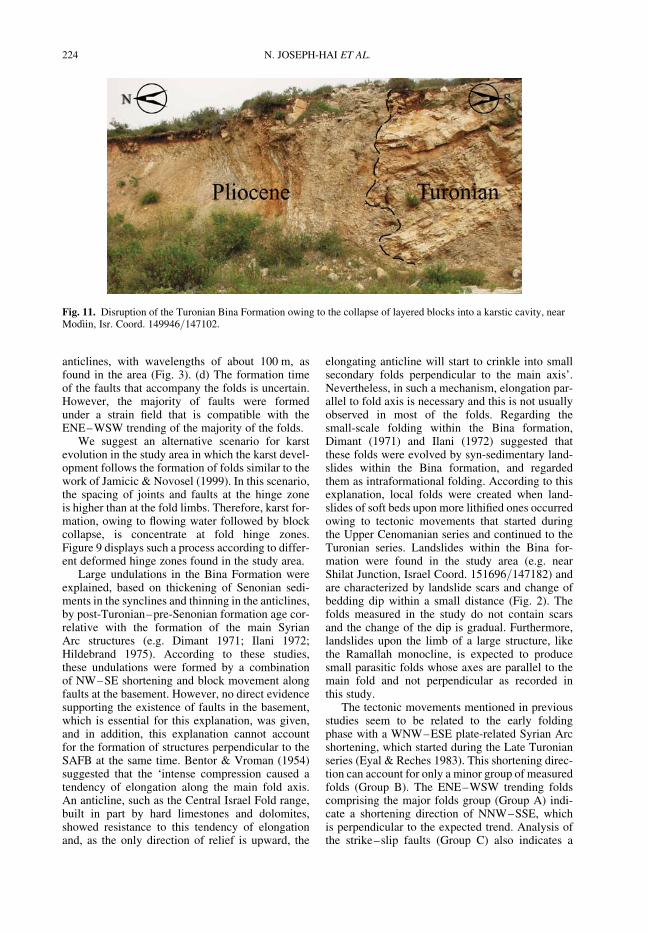
Karstic processes are well known within theBina Formation at this area (Dimant 1971; Livnat1971; Ilani 1972; Hildebrand 1975; Frumkin &Fischhendler 2005), and are also described in thisstudy. In a few locations surrounding the studyarea, the association between synclines and karstactivity was observed or suggested (e.g. Buchbinder& Sneh 1984; Frumkin pers. comm. 2007). Weacknowledge the fact that the folding of layersmight be associated with karsts (Fig. 2), but arguethat the folds along Highway 6 are associated withbuckling and not with other mechanisms owing tothe following reasons. (a) Deformation by collapseof layers into karstic cavities should result inrandom trends of the fold axes. The orientations offold axes measured in the study area are notrandom and are divided into two coherent sub-populations without an overlap of their a-95 con-fidence circles. On the other hand, the preferredorientation of these fold populations can be attrib-uted to known regional deformation phases. (b)Commonly, collapse of layered blocks into karsticcavities result in disruption of the bedding (Fig. 11).However, in most of the folds in the study area, thelimbs are continuous. Intensive fracturing, when itexists, is located only at the very deformed hingezone. (c) Field examination in the study area(Fig. 10) shows that the effect of karsts on the sur-rounding beds is minor and very local. Collapseof bedding may result in the formation of smallsynclines, above or within the karstic cave, how-ever, it cannot explain the formation of the large
Fig. 10. Palaeokarst of Late Turonian age along Highway 6. The Menuha Formation is filling cavities within the BinaFormation (right photo) and shows irregular contact with the Bina Formation (left photo).
MESOSCALE FOLDS ALONG A SYRIAN ARC MONOCLINE 223
anticlines, with wavelengths of about 100 m, asfound in the area (Fig. 3). (d) The formation timeof the faults that accompany the folds is uncertain.However, the majority of faults were formedunder a strain field that is compatible with theENE–WSW trending of the majority of the folds.
We suggest an alternative scenario for karstevolution in the study area in which the karst devel-opment follows the formation of folds similar to thework of Jamicic & Novosel (1999). In this scenario,the spacing of joints and faults at the hinge zoneis higher than at the fold limbs. Therefore, karst for-mation, owing to flowing water followed by blockcollapse, is concentrate at fold hinge zones.Figure 9 displays such a process according to differ-ent deformed hinge zones found in the study area.
Large undulations in the Bina Formation wereexplained, based on thickening of Senonian sedi-ments in the synclines and thinning in the anticlines,by post-Turonian–pre-Senonian formation age cor-relative with the formation of the main SyrianArc structures (e.g. Dimant 1971; Ilani 1972;Hildebrand 1975). According to these studies,these undulations were formed by a combinationof NW–SE shortening and block movement alongfaults at the basement. However, no direct evidencesupporting the existence of faults in the basement,which is essential for this explanation, was given,and in addition, this explanation cannot accountfor the formation of structures perpendicular to theSAFB at the same time. Bentor & Vroman (1954)suggested that the ‘intense compression caused atendency of elongation along the main fold axis.An anticline, such as the Central Israel Fold range,built in part by hard limestones and dolomites,showed resistance to this tendency of elongationand, as the only direction of relief is upward, the
elongating anticline will start to crinkle into smallsecondary folds perpendicular to the main axis’.Nevertheless, in such a mechanism, elongation par-allel to fold axis is necessary and this is not usuallyobserved in most of the folds. Regarding thesmall-scale folding within the Bina formation,Dimant (1971) and Ilani (1972) suggested thatthese folds were evolved by syn-sedimentary land-slides within the Bina formation, and regardedthem as intraformational folding. According to thisexplanation, local folds were created when land-slides of soft beds upon more lithified ones occurredowing to tectonic movements that started duringthe Upper Cenomanian series and continued to theTuronian series. Landslides within the Bina for-mation were found in the study area (e.g. nearShilat Junction, Israel Coord. 151696/147182) andare characterized by landslide scars and change ofbedding dip within a small distance (Fig. 2). Thefolds measured in the study do not contain scarsand the change of the dip is gradual. Furthermore,landslides upon the limb of a large structure, likethe Ramallah monocline, is expected to producesmall parasitic folds whose axes are parallel to themain fold and not perpendicular as recorded inthis study.
The tectonic movements mentioned in previousstudies seem to be related to the early foldingphase with a WNW–ESE plate-related Syrian Arcshortening, which started during the Late Turonianseries (Eyal & Reches 1983). This shortening direc-tion can account for only a minor group of measuredfolds (Group B). The ENE–WSW trending foldscomprising the major folds group (Group A) indi-cate a shortening direction of NNW–SSE, whichis perpendicular to the expected trend. Analysis ofthe strike–slip faults (Group C) also indicates a
Fig. 11. Disruption of the Turonian Bina Formation owing to the collapse of layered blocks into a karstic cavity, nearModı̀in, Isr. Coord. 149946/147102.
N. JOSEPH-HAI ET AL.224
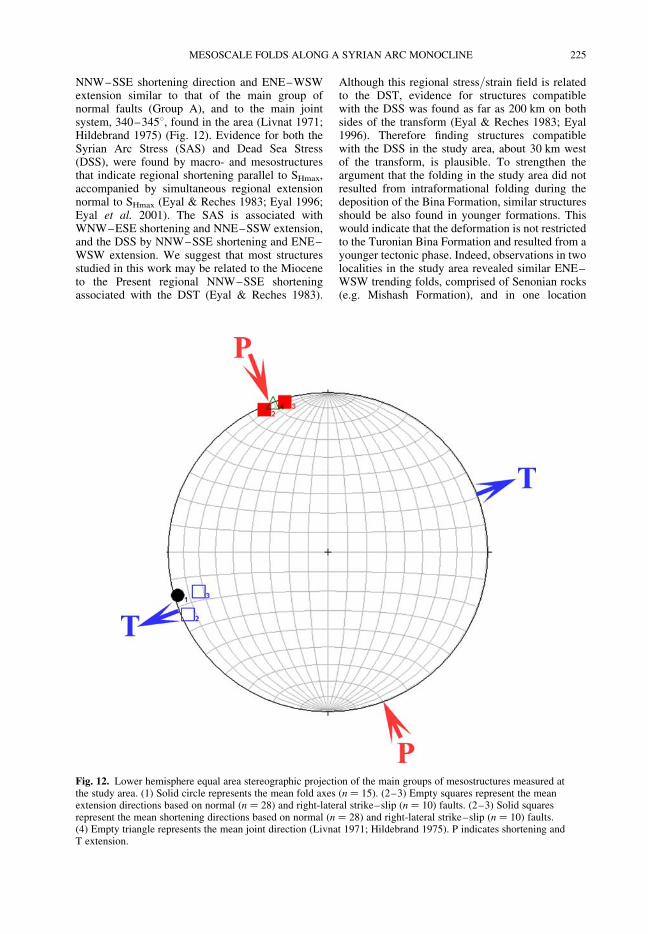
NNW–SSE shortening direction and ENE–WSWextension similar to that of the main group ofnormal faults (Group A), and to the main jointsystem, 340–3458, found in the area (Livnat 1971;Hildebrand 1975) (Fig. 12). Evidence for both theSyrian Arc Stress (SAS) and Dead Sea Stress(DSS), were found by macro- and mesostructuresthat indicate regional shortening parallel to SHmax,accompanied by simultaneous regional extensionnormal to SHmax (Eyal & Reches 1983; Eyal 1996;Eyal et al. 2001). The SAS is associated withWNW–ESE shortening and NNE–SSW extension,and the DSS by NNW–SSE shortening and ENE–WSW extension. We suggest that most structuresstudied in this work may be related to the Mioceneto the Present regional NNW–SSE shorteningassociated with the DST (Eyal & Reches 1983).
Although this regional stress/strain field is relatedto the DST, evidence for structures compatiblewith the DSS was found as far as 200 km on bothsides of the transform (Eyal & Reches 1983; Eyal1996). Therefore finding structures compatiblewith the DSS in the study area, about 30 km westof the transform, is plausible. To strengthen theargument that the folding in the study area did notresulted from intraformational folding during thedeposition of the Bina Formation, similar structuresshould be also found in younger formations. Thiswould indicate that the deformation is not restrictedto the Turonian Bina Formation and resulted from ayounger tectonic phase. Indeed, observations in twolocalities in the study area revealed similar ENE–WSW trending folds, comprised of Senonian rocks(e.g. Mishash Formation), and in one location
Fig. 12. Lower hemisphere equal area stereographic projection of the main groups of mesostructures measured atthe study area. (1) Solid circle represents the mean fold axes (n ¼ 15). (2–3) Empty squares represent the meanextension directions based on normal (n ¼ 28) and right-lateral strike–slip (n ¼ 10) faults. (2–3) Solid squaresrepresent the mean shortening directions based on normal (n ¼ 28) and right-lateral strike–slip (n ¼ 10) faults.(4) Empty triangle represents the mean joint direction (Livnat 1971; Hildebrand 1975). P indicates shortening andT extension.
MESOSCALE FOLDS ALONG A SYRIAN ARC MONOCLINE 225

(Re’ut) even Pliocene rocks seem to be folded.However, a final prove for this argument, needs anadditional study on a larger scale.
Conclusions
The most prominent fold trend observed in the car-bonatic Bina Formation along the central part ofHighway 6 in Israel is ENE–WSW. This trend isnot compatible with the NNE–SSW trend of themajor Syrian Arc structure of the Ramallah mono-cline. Field observations and kinematic analysisdiscard the possibility that these folds are intrafor-mational structures or were formed owing tokarstic activity. The well-grouped fold trends, foldsappearance and existence of similar folds in for-mation younger than Bina Formation indicate thatthe folds were formed owing to tectonic shortening.The NNW–SSE shortening and ENE–WSW exten-sion indicated by the faults found in the study areasupport the suggestion that these folds should beattributed to a younger stress field, such as thatassociated with the DST.
This research was supported by the Samuel Sebba Chairfor Structural Geology. We thank the editor, C. Hombergand the reviewers C. Druckman and P. Vergely for theirhelpful comments and suggestions. We are grateful toA. Sneh, who introduced us to the remarkable collapse ofBina layers into a karstic cavity near Modı̀in. We alsothank L. Korman, G. Tirosh, U. Makover, and D. Hadarfor their help in the field, and to Y. Asher for thefigure editing.
References
Allmendinger, R. 2001. FaultKin for Windows v. 1.2program.
Allmendinger, R. 2003. Stereonet for Windows v. 1.2program.
Allmendinger, R. 2006. Structural Geology. WorldWide Web Address: http://www.geo.cornell.edu/geology/classes/RWA/GS_326/GEOL326.
Bentor, Y. K. & Vroman, A. 1954. A structural contourmap of Israel 1:250 000, with remarks on the dynamicinterpretation. Geological Survey of Israel Bulletin, 7.
Bruner, I. 1991. Investigation of the subsurface in thenorthern Negev, Israel using seismic reflection tech-niques. PhD thesis, Tel-Aviv University, 105 (withEnglish abstract).
Buchbinder, B. & Sneh, A. 1984. Marine sandstones andterrestrial conglomerates and mudstones of Neogene–Pleistocene age in the Modi’im area: a re-evaluation.Geological Survey of Israel Current Research,1983–84, 65–69.
Dimant, E. 1971. The geology of Bet Horon regionand the western flanks of the Bet El anticline. Geol-ogical Survey of Israel Report, MM/101/71, 79 (inHebrew).
Eyal, Y. 1996. Stress field fluctuations along the Dead SeaRift since the middle Miocene. Tectonics, 15, 157–170.
Eyal, Y. & Reches, Z. 1983. Tectonic analysis of theDead Sea rift region since the Late Cretaceous basedon mesostructures. Tectonics, 2, 167–185.
Eyal, Y., Gross, M. R., Engelder, T. & Becker, A.2001. Joint development during fluctuation of regionalstress field in southern Israel. Journal of StructuralGeology, 23, 279–296.
Freund, R., Goldberg, M., Weissbrod, T., Druckman,Y. & Derin, B. 1975. The Triassic–Jurassic structureof Israel and its relation to the origin of the EasternMediterranean. Geological Survey of Israel Bulletin,65, 26.
Frumkin, A. & Fischhendler, I. 2005. Morphometry anddistribution of isolated caves as a guide for phreatic andconfined paleohydrological conditions. Geomorphol-ogy, 67, 457–471.
Hildebrand, N. 1975. The geological map of Israel, 1:50000. Sheet 8-I: Kefar Sava, explanatory note. Geologi-cal Survey of Israel, 23 (in Hebrew).
Hildebrand-Mittlefehldt, N. 1993. The geologicalmap of Israel, 1:50 000. Sheet VII-I: Kefar Sava. Geo-logical Survey of Israel.
Ilani, S. 1972. The geology of Tulkarm area. GeologicalSurvey of Israel Report, MM/105/72, 71 (in Hebrew).
Jamicic, D. & Novosel, T. 1999. The dynamics of tectonicmodeling of some caves in the karst region. GeologyCroatia, 52/2, 197–202.
Krenkel, E. 1924. Der Syrische Bogen. Zentarbladt furMineralogie, Geologie, Palaeontologie, 9, 301–313,10, 274–281.
Letouzey, J. & Tremolieres, P. 1980. Paleostress aroundthe Mediterranean since the Mesozoic from micro-tectonic: comparison with Plate tectonic data. RockMechanics, 8, 173–192.
Livnat, A. 1971. The geology of the north western slopesof the Judean hills. Geological Survey of Israel Report,MM/102/71, 60 (in Hebrew).
Mimran, Y. 1976. Deep-seated faulting and the structuresof the northern Negev (Isreal): an analysis and exper-imental study. Israel Journal of Earth Sciences, 25,111–126.
Ramsay, J. G. & Huber, M. I. 1987. The Techniques ofModern Structural Geology. V. 2: Folds and Fractures.Academic Press, London.
Shahar, J. 1994. The Syrian arc system: an overview.Palaeogeography, Palaeoclimatology, Palaeoecology,112, 125–142.
Shomroni, A. 1970. Structures in Shephelat Lod. IsraelNational Oil Company Interim G.O.N. – A.S. 51 Report.
Twiss, R. J. & Moores, E. M. 1992. Structural Geology.W. H. Freeman & Company, New York.
Walley, C. D. 1998. Some outstanding issues in thegeology of Lebanon and their importance in the tec-tonic evolution of the Levantine region. Tectonophy-sics, 298, 37–62.
Wilkins, S. J., Gross, M. R., Wacker, M., Eyal, Y. &Engelder, T. 2001. Faulted joints: kinematic,displacement-length scaling relations and criteria fortheir identification. Journal of Structural Geology,23, 315–327.
Yechieli, Y. 2007. Geological map, 1:50 000, Sheet 8-III:Lod. Geological Survey of Israel.
N. JOSEPH-HAI ET AL.226