metal-insulator transitionsbaranger/articles/strong_cor/mitransitions_rmp.pdfmott, 1990), in his...
TRANSCRIPT

Metal-insulator transitions
Masatoshi Imada
Institute for Solid State Physics, University of Tokyo, Roppongi, Minato-ku,Tokyo, 106, Japan
Atsushi Fujimori
Department of Physics, University of Tokyo, Hongo, Bunkyo-ku, Tokyo, 113, Japan
Yoshinori Tokura
Department of Applied Physics, University of Tokyo, Hongo, Bunkyo-ku,Tokyo, 113, Japan
Metal-insulator transitions are accompanied by huge resistivity changes, even over tens of orders ofmagnitude, and are widely observed in condensed-matter systems. This article presents theobservations and current understanding of the metal-insulator transition with a pedagogicalintroduction to the subject. Especially important are the transitions driven by correlation effectsassociated with the electron-electron interaction. The insulating phase caused by the correlationeffects is categorized as the Mott Insulator. Near the transition point the metallic state showsfluctuations and orderings in the spin, charge, and orbital degrees of freedom. The properties of thesemetals are frequently quite different from those of ordinary metals, as measured by transport, optical,and magnetic probes. The review first describes theoretical approaches to the unusual metallic statesand to the metal-insulator transition. The Fermi-liquid theory treats the correlations that can beadiabatically connected with the noninteracting picture. Strong-coupling models that do not requireFermi-liquid behavior have also been developed. Much work has also been done on the scaling theoryof the transition. A central issue for this review is the evaluation of these approaches in simpletheoretical systems such as the Hubbard model and t-J models. Another key issue is strongcompetition among various orderings as in the interplay of spin and orbital fluctuations.
Experimentally, the unusual properties of the metallic state near the insulating transition have beenmost extensively studied in d-electron systems. In particular, there is revived interest intransition-metal oxides, motivated by the epoch-making findings of high-temperaturesuperconductivity in cuprates and colossal magnetoresistance in manganites. The article reviews therich phenomena of anomalous metallicity, taking as examples Ti, V, Cr, Mn, Fe, Co, Ni, Cu, and Rucompounds. The diverse phenomena include strong spin and orbital fluctuations, massrenormalization effects, incoherence of charge dynamics, and phase transitions under control of keyparameters such as band filling, bandwidth, and dimensionality. These parameters are experimentallyvaried by doping, pressure, chemical composition, and magnetic fields. Much of the observed behaviorcan be described by the current theory. Open questions and future problems are also extracted fromcomparison between experimental results and theoretical achievements. [S0034-6861(98)00103-2]
CONTENTS
I. Introduction 1040A. General remarks 1040B. Remarks on theoretical descriptions
(Introduction to Sec. II) 1044C. Remarks on material systematics (Introduction
to Sec. III) 1046D. Remarks on experimental results of anomalous
metals (Introduction to Sec. IV) 1047II. Theoretical Description 1048
A. Theoretical models for correlated metals andMott insulators in d-electron systems 10481. Electronic states of d-electron systems 10482. Lattice fermion models 1050
B. Variety of metal-insulator transitions andcorrelated metals 1053
C. Field-theoretical framework for interactingfermion systems 10571. Coherent states 10582. Grassmann algebra 10583. Functional integrals, path integrals, and
statistical mechanics of many-fermionsystems 1059
Reviews of Modern Physics, Vol. 70, No. 4, October 1998 0034-6861/98/70
4. Green’s functions, self-energy, and spectralfunctions 1060
D. Fermi-liquid theory and various mean-fieldapproaches: Single-particle descriptions ofcorrelated metals and insulators 10621. Fermi-liquid description 10632. Hartree-Fock approximation and RPA for
phase transitions 10703. Local-density approximation and its
refinement 10744. Hubbard approximation 10785. Gutzwiller approximation 10796. Infinite-dimensional approach 10807. Slave-particle approximation 10848. Self-consistent renormalization
approximation and two-particle self-consistent approximation 1087
9. Renormalization-group study of magnetictransitions in metals 1089
E. Numerical studies of metal-insulator transitionsfor theoretical models 10921. Drude weight and transport properties 10932. Spectral function and density of states 10973. Charge response 10994. Magnetic correlations 1100
1039(4)/1039(225)/$60.00 © 1998 The American Physical Society

1040 Imada, Fujimori, and Tokura: Metal-insulator transitions
5. Approach from the insulator side 11036. Bosonic systems 1103
F. Scaling theory of metal-insulator transitions 11041. Hyperscaling scenario 11052. Metal-insulator transition of a noninteracting
system by disorder 11063. Drude weight and charge compressibility 11074. Scaling of physical quantities 11095. Filling-control transition 11096. Critical exponents of the filling-control
metal-insulator transition in one dimension 11107. Critical exponents of the filling-control
metal-insulator transition in two and threedimensions 1110
8. Two universality classes of the filling-controlmetal-insulator transition 1111
9. Suppression of coherence 111110. Scaling of spin correlations 111311. Possible realization of scaling 111412. Superfluid-insulator transition 1115
G. Non-fermi-liquid description of metals 11161. Tomonaga-Luttinger liquid in one dimension 11162. Marginal Fermi liquid 1118
H. Orbital degeneracy and other complexities 11191. Jahn-Teller distortion, spin, and orbital
fluctuations and orderings 11192. Ferromagnetic metal near a Mott insulator 11223. Charge ordering 1123
III. Materials Systematics 1123A. Local electronic structure of transition-metal
oxides 11231. Configuration-interaction cluster model 11232. Cluster-model analyses of photoemission
spectra 11253. Zaanen-Sawatzky-Allen classification scheme 11264. Multiplet effects 11285. Small or negative charge-transfer energies 1130
B. Systematics in model parameters and chargegaps 11311. Ionic crystal model 11312. Spectroscopic methods 11323. First-principles methods 1135
C. Control of model parameters in materials 11391. Bandwidth control 11392. Filling control 11413. Dimensionality control 1142
IV. Some Anomalous Metals 1144A. Bandwidth-control metal-insulator transition
systems 11441. V2O3 11442. NiS22xSex 11513. RNiO3 11544. NiS 11575. Ca12xSrxVO3 1163
B. Filling-control metal-insulator transition systems 11651. R12xAxTiO3 11652. R12xAxVO3 1171
C. High-Tc cuprates 11731. La22xSrxCuO4 11732. Nd22xCexCuO4 11843. YBa2Cu3O72y 11874. Bi2Sr2CaCu2O81d 1195
D. Quasi-one-dimensional systems 11991. Cu-O chain and ladder compounds 11992. BaVS3 1205
E. Charge-ordering systems 1208
Rev. Mod. Phys., Vol. 70, No. 4, October 1998
1. Fe3O4 12082. La12xSrxFeO3 12113. La22xSrxNiO4 12124. La12xSr11xMnO4 1216
F. Double exchange systems 12181. R12xAxMnO3 12182. La222xSr112xMn2O7 1225
G. Systems with transitions between metal andnonmagnetic insulators 12281. FeSi 12282. VO2 12323. Ti2O3 12334. LaCoO3 12355. La1.172xAxVS3.17 1239
H. 4d systems 12411. Sr2RuO4 12412. Ca12xSrxRuO3 1243
V. Concluding Remarks 1245Acknowledgments 1247References 1247
I. INTRODUCTION
A. General remarks
The first successful theoretical description of metals,insulators, and transitions between them is based onnoninteracting or weakly interacting electron systems.The theory makes a general distinction between metalsand insulators at zero temperature based on the filling ofthe electronic bands: For insulators the highest filledband is completely filled; for metals, it is partially filled.In other words, the Fermi level lies in a band gap ininsulators while the level is inside a band for metals. Inthe noninteracting electron theory, the formation ofband structure is totally due to the periodic lattice struc-ture of atoms in crystals. This basic distinction betweenmetals and insulators was proposed and established inthe early years of quantum mechanics (Bethe, 1928;Sommerfeld, 1928; Bloch, 1929). By the early 1930s, itwas recognized that insulators with a small energy gapbetween the highest filled band and lowest empty bandwould be semiconductors due to thermal excitation ofthe electrons (Wilson, 1931a, 1931b; Fowler, 1933a,1933b). More than fifteen years later the transistor wasinvented by Shockley, Brattain, and Bardeen.
Although this band picture was successful in many re-spects, de Boer and Verwey (1937) reported that manytransition-metal oxides with a partially filled d-electronband were nonetheless poor conductors and indeed of-ten insulators. A typical example in their report wasNiO. Concerning their report, Peierls (1937) pointed outthe importance of the electron-electron correlation:Strong Coulomb repulsion between electrons could bethe origin of the insulating behavior. According to Mott(1937), Peierls noted
‘‘it is quite possible that the electrostatic interactionbetween the electrons prevents them from moving atall. At low temperatures the majority of the electronsare in their proper places in the ions. The minoritywhich have happened to cross the potential barrier

1041Imada, Fujimori, and Tokura: Metal-insulator transitions
find therefore all the other atoms occupied, and inorder to get through the lattice have to spend a longtime in ions already occupied by other electrons.This needs a considerable addition of energy and sois extremely improbable at low temperatures.’’
These observations launched the long and continuinghistory of the field of strongly correlated electrons, par-ticularly the effort to understand how partially filledbands could be insulators and, as the history developed,how an insulator could become a metal as controllableparameters were varied. This transition illustrated inFig. 1 is called the metal-insulator transition (MIT). Theinsulating phase and its fluctuations in metals are indeedthe most outstanding and prominent features of stronglycorrelated electrons and have long been central to re-search in this field.
In the past sixty years, much progress has been madefrom both theoretical and experimental sides in under-standing strongly correlated electrons and MITs. In the-oretical approaches, Mott (1949, 1956, 1961, 1990) tookthe first important step towards understanding howelectron-electron correlations could explain the insulat-ing state, and we call this state the Mott insulator. Heconsidered a lattice model with a single electronic or-bital on each site. Without electron-electron interac-tions, a single band would be formed from the overlap ofthe atomic orbitals in this system, where the band be-comes full when two electrons, one with spin-up and theother with spin-down, occupy each site. However, twoelectrons sitting on the same site would feel a large Cou-lomb repulsion, which Mott argued would split the bandin two: The lower band is formed from electrons thatoccupied an empty site and the upper one from elec-trons that occupied a site already taken by another elec-tron. With one electron per site, the lower band wouldbe full, and the system an insulator. Although he dis-cussed the magnetic state afterwards (see, for example,
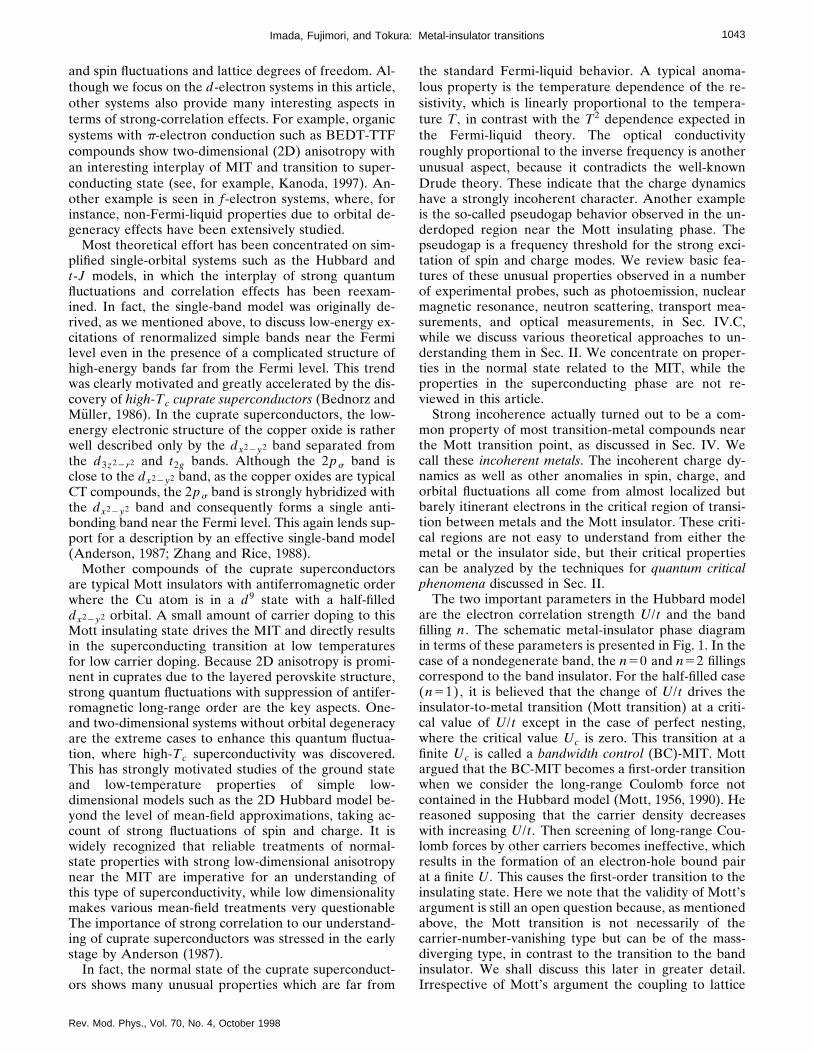
FIG. 1. Metal-insulator phase diagram based on the Hubbardmodel in the plane of U/t and filling n . The shaded area is inprinciple metallic but under the strong influence of the metal-insulator transition, in which carriers are easily localized byextrinsic forces such as randomness and electron-lattice cou-pling. Two routes for the MIT (metal-insulator transition) areshown: the FC-MIT (filling-control MIT) and the BC-MIT(bandwidth-control MIT).
Rev. Mod. Phys., Vol. 70, No. 4, October 1998
Mott, 1990), in his original formulation Mott argued thatthe existence of the insulator did not depend on whetherthe system was magnetic or not.
Slater (1951), on the other hand, ascribed the origin ofthe insulating behavior to magnetic ordering such as theantiferromagnetic long-range order. Because most Mottinsulators have magnetic ordering at least at zero tem-perature, the insulator may appear due to a band gapgenerated by a superlattice structure of the magnetic pe-riodicity. In contrast, we have several examples in whichspin excitation has a gap in the Mott insulator withoutmagnetic order. One might argue that this is not com-patible with Slater’s band picture. However, in this case,both charge and spin gaps exist similarly to the bandinsulator. This could give an adiabatic continuity be-tween the Mott insulator and the band insulator, whichwe discuss in Sec. II.B.
In addition to the Mott insulating phase itself, a moredifficult and challenging subject has been to describeand understand metallic phases near the Mott insulator.In this regime fluctuations of spin, charge, and orbitalcorrelations are strong and sometimes critically en-hanced toward the MIT, if the transition is continuousor weakly first order. The metallic phase with suchstrong fluctuations near the Mott insulator is now oftencalled the anomalous metallic phase. A typical anoma-lous fluctuation is responsible for mass enhancement inV2O3, where the specific-heat coefficient g and the Pauliparamagnetic susceptibility x near the MIT show sub-stantial enhancement from what would be expectedfrom the noninteracting band theory. To understand thismass enhancement, the earlier pioneering work on theMIT by Hubbard (1964a, 1964b) known as the Hubbardapproximation was reexamined and treated with theGutzwiller approximation by Brinkmann and Rice(1970).
Fermi-liquid theory asserts that the ground state andlow-energy excitations can be described by an adiabaticswitching on of the electron-electron interaction. Then,naively, the carrier number does not change in the adia-batic process of introducing the electron correlation, asis celebrated as the Luttinger theorem. Because theMott insulator is realized for a partially filled band, thisadiabatic continuation forces the carrier density to re-main nonzero when one approaches the MIT point inthe framework of Fermi-liquid theory. Then the onlyway to approach the MIT in a continuous fashion is thedivergence of the single-quasiparticle mass m* (or morestrictly speaking the vanishing of the renormalizationfactor Z) at the MIT point. Therefore mass enhance-ment as a typical property of metals near the Mott insu-lator is a natural consequence of Fermi-liquid theory.
If the symmetries of spin and orbital degrees of free-dom are broken (either spontaneously as in the mag-netic long-range ordered phase or externally as in thecase of crystal-field splitting), the adiabatic continuityassumed in the Fermi-liquid theory is not satisfied anymore and there may be no observable mass enhance-ment. In fact, a MIT with symmetry breaking of spin andorbital degrees of freedom is realized by the vanishing of

1042 Imada, Fujimori, and Tokura: Metal-insulator transitions
the single-particle (carrier) number, as in the transitionto a band insulator. For example, this takes place in thetransition from an antiferromagnetic metal to an antifer-romagnetic Mott insulator, where the folding of the Bril-louin zone due to the superstructure of the magneticperiodicity creates a completely filled lower band. Car-riers are doped into small pockets of Fermi surfacewhose Fermi volume vanishes at the MIT.
From this heuristic argument, one can see at least twodistinct routes to the Mott insulator when one ap-proaches the MIT point from the metallic side, namely,the mass-diverging type and carrier-number-vanishingtype. The diversity of anomalous features of metallicphases near both types of MIT is a central subject of thisreview. Mass enhancement or carrier-number reductionas well as more complicated features have indeed beenobserved experimentally. The experiments were exam-ined from various, more or less independently devel-oped theoretical approaches, as detailed in Sec. II. Inparticular, anomalous features of correlated metals nearthe Mott insulator appear more clearly when the MIT iscontinuous. Theoretically, this continuous MIT has beena subject of recent intensive studies in which unusualmetallic properties are understood from various criticalfluctuations near the quantum critical point of the MIT.
A prototype of theoretical understanding for the tran-sition between the Mott insulator and metals wasachieved by using simplified lattice fermion models, inparticular, in the celebrated Hubbard model (Anderson,1959; Hubbard, 1963, 1964a, 1964b; Kanamori, 1963).The Hubbard model considers only electrons in a singleband. Its Hamiltonian in a second-quantized form isgiven by
HH5Ht1HU2mN , (1.1a)
Ht52t(ij&
~cis† cjs1H.c.!, (1.1b)
HU5U(i
~ni↑212 !~ni↓2
12 !, (1.1c)
and
N[(is
nis , (1.1d)
where the creation (annihilation) of the single-bandelectron at site i with spin s is denoted by cis
† (cis) withnis being the number operator nis[cis
† cis . In this sim-plification, various realistic complexities are ignored, aswe shall see in Sec. II.A. However, at the same time,low-energy and low-temperature properties are oftenwell described even after this simplification since only asmall number of bands (sometimes just one band) arecrossing the Fermi level and have to do with low-energyexcitations. The parameters of the simplified models inthis case should be taken as effective values derivedfrom renormalized bands near the Fermi level.
One of the most drastic simplification in the Hubbardmodel is to consider only electrons in a single orbit, saythe s orbit. In contrast, the experimental study of the
Rev. Mod. Phys., Vol. 70, No. 4, October 1998
MIT in correlated metals has been most thorough andsystematic in d-electron systems, namely, transition-metal compounds. Many examples will be reviewed inthis article. In d-electron systems, orbital degeneracy isan important and unavoidable source of complicated be-havior. For example, under the cubic crystal-field sym-metry of the lattice, any of the threefold degenerate t2gbands, dxy , dyz , and dzx as well as twofold degenerateeg bands, dx22y2 and d3z22r2, can be located near theFermi level, depending on transition-metal ion, latticestructure, composition, dimensionality, and so on. In ad-dition to strong spin fluctuations, effects of orbital fluc-tuations and orbital symmetry breaking play importantroles in many d-electron systems, as discussed in Secs.II.H and IV. The orbital correlations are frequentlystrongly coupled with spin correlations through theusual relativistic spin-orbit coupling as well as throughorbital-dependent exchange interactions and quan-drupole interactions. An example of this orbital effectknown as the double-exchange mechanism is seen in Mnoxides (Sec. IV.F), where strong Hund’s-rule couplingbetween the eg and t2g orbitals triggers a transition be-tween the Mott insulator with antiferromagnetic orderand the ferromagnetic metal. Colossal negative magne-toresistance near the transition to this ferromagneticmetal phase has been intensively studied recently.
Another aspect of orbital degeneracy is the overlap orthe closeness of the d band and the p band of ligandatoms which bridge the elements in transition-metalcompounds. For example, as clarified in Secs. II.A andIII.A, in the transition-metal oxides, the oxygen 2ps
level becomes close to that of the partially filled 3d bandnear the Fermi level for heavier transition-metal ele-ments such as Ni and Cu. Then the charge gap of theMott insulator cannot be accounted for solely with delectrons, but p-electron degrees of freedom have alsoto be considered. In fact, when we could regard theHubbard model as a description of a d band only, thecharge excitation gap is formed between a singly occu-pied d band (the so-called lower Hubbard band) and adoubly occupied (with spin up and down) d band (theso-called upper Hubbard band). However, if the ps levelbecomes closer, the character of the minimum chargeexcitation gap changes to that of a gap between a singlyoccupied d band with fully occupied p band and a singlyoccupied d band with a ps hole. This kind of insulator,which was clarified by Zaanen, Sawatzky, and Allen(1985), is now called a charge-transfer (CT) insulator ascontrasted to the former case, the Mott-Hubbard (MH)insulator, which we discuss in detail in Secs. II.A andIII.A, and the distinction is indeed observed in high-energy spectroscopy. Correspondingly, compounds thathave the MH insulating phase are called MH com-pounds while those with the CT insulating phase arecalled CT compounds. The term ‘‘Mott insulator’’ isused in this review in a broad sense which covers bothtypes. Recent achievements in the field of strongly cor-related electrons, especially in d-electron systems, havebrought us closer to understanding more complicatedsituations in which there is an interplay between orbital
1043Imada, Fujimori, and Tokura: Metal-insulator transitions
and spin fluctuations and lattice degrees of freedom. Al-though we focus on the d-electron systems in this article,other systems also provide many interesting aspects interms of strong-correlation effects. For example, organicsystems with p-electron conduction such as BEDT-TTFcompounds show two-dimensional (2D) anisotropy withan interesting interplay of MIT and transition to super-conducting state (see, for example, Kanoda, 1997). An-other example is seen in f-electron systems, where, forinstance, non-Fermi-liquid properties due to orbital de-generacy effects have been extensively studied.
Most theoretical effort has been concentrated on sim-plified single-orbital systems such as the Hubbard andt-J models, in which the interplay of strong quantumfluctuations and correlation effects has been reexam-ined. In fact, the single-band model was originally de-rived, as we mentioned above, to discuss low-energy ex-citations of renormalized simple bands near the Fermilevel even in the presence of a complicated structure ofhigh-energy bands far from the Fermi level. This trendwas clearly motivated and greatly accelerated by the dis-covery of high-Tc cuprate superconductors (Bednorz andMuller, 1986). In the cuprate superconductors, the low-energy electronic structure of the copper oxide is ratherwell described only by the dx22y2 band separated fromthe d3z22r2 and t2g bands. Although the 2ps band isclose to the dx22y2 band, as the copper oxides are typicalCT compounds, the 2ps band is strongly hybridized withthe dx22y2 band and consequently forms a single anti-bonding band near the Fermi level. This again lends sup-port for a description by an effective single-band model(Anderson, 1987; Zhang and Rice, 1988).
Mother compounds of the cuprate superconductorsare typical Mott insulators with antiferromagnetic orderwhere the Cu atom is in a d9 state with a half-filleddx22y2 orbital. A small amount of carrier doping to thisMott insulating state drives the MIT and directly resultsin the superconducting transition at low temperaturesfor low carrier doping. Because 2D anisotropy is promi-nent in cuprates due to the layered perovskite structure,strong quantum fluctuations with suppression of antifer-romagnetic long-range order are the key aspects. One-and two-dimensional systems without orbital degeneracyare the extreme cases to enhance this quantum fluctua-tion, where high-Tc superconductivity was discovered.This has strongly motivated studies of the ground stateand low-temperature properties of simple low-dimensional models such as the 2D Hubbard model be-yond the level of mean-field approximations, taking ac-count of strong fluctuations of spin and charge. It iswidely recognized that reliable treatments of normal-state properties with strong low-dimensional anisotropynear the MIT are imperative for an understanding ofthis type of superconductivity, while low dimensionalitymakes various mean-field treatments very questionableThe importance of strong correlation to our understand-ing of cuprate superconductors was stressed in the earlystage by Anderson (1987).
In fact, the normal state of the cuprate superconduct-ors shows many unusual properties which are far from
Rev. Mod. Phys., Vol. 70, No. 4, October 1998
the standard Fermi-liquid behavior. A typical anoma-lous property is the temperature dependence of the re-sistivity, which is linearly proportional to the tempera-ture T , in contrast with the T2 dependence expected inthe Fermi-liquid theory. The optical conductivityroughly proportional to the inverse frequency is anotherunusual aspect, because it contradicts the well-knownDrude theory. These indicate that the charge dynamicshave a strongly incoherent character. Another exampleis the so-called pseudogap behavior observed in the un-derdoped region near the Mott insulating phase. Thepseudogap is a frequency threshold for the strong exci-tation of spin and charge modes. We review basic fea-tures of these unusual properties observed in a numberof experimental probes, such as photoemission, nuclearmagnetic resonance, neutron scattering, transport mea-surements, and optical measurements, in Sec. IV.C,while we discuss various theoretical approaches to un-derstanding them in Sec. II. We concentrate on proper-ties in the normal state related to the MIT, while theproperties in the superconducting phase are not re-viewed in this article.
Strong incoherence actually turned out to be a com-mon property of most transition-metal compounds nearthe Mott transition point, as discussed in Sec. IV. Wecall these incoherent metals. The incoherent charge dy-namics as well as other anomalies in spin, charge, andorbital fluctuations all come from almost localized butbarely itinerant electrons in the critical region of transi-tion between metals and the Mott insulator. These criti-cal regions are not easy to understand from either themetal or the insulator side, but their critical propertiescan be analyzed by the techniques for quantum criticalphenomena discussed in Sec. II.
The two important parameters in the Hubbard modelare the electron correlation strength U/t and the bandfilling n . The schematic metal-insulator phase diagramin terms of these parameters is presented in Fig. 1. In thecase of a nondegenerate band, the n50 and n52 fillingscorrespond to the band insulator. For the half-filled case(n51), it is believed that the change of U/t drives theinsulator-to-metal transition (Mott transition) at a criti-cal value of U/t except in the case of perfect nesting,where the critical value Uc is zero. This transition at afinite Uc is called a bandwidth control (BC)-MIT. Mottargued that the BC-MIT becomes a first-order transitionwhen we consider the long-range Coulomb force notcontained in the Hubbard model (Mott, 1956, 1990). Hereasoned supposing that the carrier density decreaseswith increasing U/t . Then screening of long-range Cou-lomb forces by other carriers becomes ineffective, whichresults in the formation of an electron-hole bound pairat a finite U . This causes the first-order transition to theinsulating state. Here we note that the validity of Mott’sargument is still an open question because, as mentionedabove, the Mott transition is not necessarily of thecarrier-number-vanishing type but can be of the mass-diverging type, in contrast to the transition to the bandinsulator. We shall discuss this later in greater detail.Irrespective of Mott’s argument the coupling to lattice
1044 Imada, Fujimori, and Tokura: Metal-insulator transitions
degrees of freedom also favors the first-order transitionby discontinuously increasing the transfer amplitude t inthe metallic phase. The coupling of spin and orbital mayalso favor the first-order transition in real materials. Inthe region adjacent to the n51 insulating line (a thickline in Fig. 1), the spin-ordered phase is frequently ob-served, that is, an antiferromagnetic insulating or metal-lic phase.
The filling at noninteger n usually leads to the metal-lic phase. The phase of particular interest is that of met-als near the n51 insulating line which is derived by fill-ing control (FC) from the parent Mott insulator (n51). Since the discovery of high-temperature supercon-ductors, the concept of ‘‘carrier doping’’ or FC in theparent Mott insulators has been widely recognized asone of the important aspects of the MIT in the 3d elec-tron systems. In contrast to the BC-MIT, the above twomechanisms for a first-order transition are not effectivefor the FC-MIT. The reason is that the electron-holebound states cannot make an insulator by themselvesdue to the absence of carrier compensation. The cou-pling to the lattice is also ineffective because usually itdoes not couple to the electron filling. Therefore thetransition can easily be continuous for an FC-MIT. In arelatively large-U/t region near the insulating phase ofn50, 1, and 2, however, the compounds occasionallysuffer from the carrier localization effect arising fromthe static random potential and/or electron-lattice inter-action. In addition, at some fractional but commensuratefillings such as n51/8, 1/3, and 1/2, the compoundssometimes undergo the charge-ordering phase transition.We shall see ample examples in Sec. IV.E, associatedwith the commensurate charge-density and spin-densitywaves. The latter phenomenon is related not only withthe short-ranged electron correlation as represented byU/t but also with the inter-site Coulomb interaction.Keeping these phenomena in mind, we shall review inSec. III these electronic control parameters and howthey are varied in actual materials.
B. Remarks on theoretical descriptions (Introductionto Sec. II)
Section II describes different theoretical approachesfor strongly correlated electron systems and their MITs.A conventional way of describing the correlation effectsis to assume the adiabatic continuity of the paramag-netic metallic phase with the noninteracting systembased on the Fermi-liquid description. The Mott insulat-ing phase is interpreted as in the pioneering work ofSlater as a consequence of a charge gap’s opening due tosymmetry breaking of spin or orbit. In the other ap-proaches, qualitatively different aspects which areclaimed to be inaccessible from the Fermi-liquid-typeapproach are stressed. Since the proposals by Mott andSlater, these two viewpoints have played complementaryroles sometimes in understanding the correlation effects,even though they provide contradicting scenarios inmany cases, as we discuss in Sec. II in detail. A typicalexample of the controversy is seen in recent debates on
Rev. Mod. Phys., Vol. 70, No. 4, October 1998
high-temperature cuprate superconductors. Several at-tempts have been made, along the lines of Slater’s ap-proach, to account for the ground state of Mott insula-tors such as La2CuO4 and other transition-metal oxidesas well as metallic phases, as we shall see in Sec. II.D.Some recent developments to treat the correlation ef-fects in the framework of Fermi-liquid theory are re-viewed in Sec. II.D.1 together with descriptions of thebasic phenomenology of this theory. Effects of fluctua-tion in spin and charge responses can be taken into ac-count on the level of the mean-field approximation bythe random-phase approximation (RPA). When thesymmetry is broken, the Hartree-Fock (HF) theory is thesimplest way to describe the ordered state as well as thephase transition. The basic content of these mean-fieldapproximations is summarized in Sec. II.D.2. Theoreti-cal description beyond the mean-field level is the subjectof later sections, Secs. II.E and II.F. To understand thecorrelation effect in d-electron systems on a more quan-titative level, one has to go beyond the tight-binding ap-proximation implicit in the Hubbard Hamiltonian.When the correlation effect is not important, the local-density approximation (LDA) is a useful tool for calcu-lating the band structure of metals in the ground state.However, it is well known that the simple LDA is poorat reproducing the Mott insulating state as well asanomalous metallic states near the Mott insulator. Re-finements of the LDA are then an important issue.These attempts include the local spin-density approxi-mation (LSDA), generalized (density) gradient approxi-mation (GGA), the GW approximation, the so-calledLDA1U approximation, and self-interaction correction(SIC), which are reviewed in Sec. II.D.3. At finite tem-peratures, a mode-mode coupling theory [the self-consistent renormalization (SCR) approximation] wasdeveloped in metals to consistently take into accountweak-amplitude spin fluctuations, which are ignored inthe Hartree-Fock calculation (Moriya, 1985). Thistheory may be viewed as a self-consistent one-loop ap-proximation in the weak-correlation approach. It isbriefly reviewed in Sec. II.D.8. The basic assumption ofthe approaches initiated by Slater is that the perturba-tion expansion or the Hartree-Fock approximation andRPA in terms of spin correlations of electron quasipar-ticles is valid at least at zero temperature and well de-scribes metals and the Mott insulator separately. On theother hand, in the approaches that go back to the origi-nal idea of Mott, several attempts have been made totake account of strong-correlation effects through strongcharge correlations in a nonperturbative way. These at-tempts include the Hubbard approximation (Hubbard,1964a, 1964b), the Gutzwiller approximation(Gutzwiller, 1965; Brinkman and Rice, 1970), variousslave-particle approximations (Barnes, 1976, 1977; Cole-man, 1984), and the infinite-dimensional approach(Kuramoto and Watanabe, 1987; Metzner and Voll-hardt, 1989, Muller-Hartmann, 1989). In general, theseapproaches do not seriously take account of the wave-number dependence (or spatial dependence) of the cor-relation. In addition, they usually neglect effects of spin

1045Imada, Fujimori, and Tokura: Metal-insulator transitions
fluctuations. One coherent-potential approximation thatdoes not assume magnetic order was developed by Hub-bard (1964a, 1964b) and is summarized in Sec. II.D.4.This approach first succeeded in substantiating the ap-pearance of the Mott insulating state along the lines ofthe original idea by Mott. Another approach on a basi-cally mean-field level is the Gutzwiller approximation.This approximation, first applied to the MIT by Brink-man and Rice (1970), is discussed in Sec. II.D.5. Thesetwo approaches, by Hubbard and by Brinkman andRice, have close connections to recently developedtreatments in infinite dimensions and the slave-particleapproximation. On the metallic side, the Gutzwiller ap-proximation, the original slave-boson approximation,and the solution in infinite dimensions give essentiallythe same results for the low-energy excitations, indicat-ing the basic equivalence of these three approximationsfor a description of the coherent part. In fact, theGutzwiller and slave-particle approximations treat onlythe coherent part and neglect the incoherent part. Onthe insulating side, the Hubbard approximation and theinfinite-dimensional approach provide similar results,because the Hubbard approximation considers only theincoherent excitations. Sections II.D.6 and II.D.7 discussthe results of the infinite-dimensional and slave-particleapproximations, respectively. The infinite-dimensionalapproach is sometimes called the dynamic mean-fieldtheory and treats the dynamic fluctuation correctly whenspatial fluctuations can be ignored.
Aside from the above more or less biased approaches,numerical methods have been developed for the pur-pose of obtaining insights without approximations. Anumber of numerical studies are discussed in Sec. II.E.
To discuss this problem further, we should keep thefollowing point in mind: When we consider the groundstate of metals and insulators separately far away fromthe transition point, each of the ground states may inmany cases be correctly expressed by adiabatic continu-ations of the fixed-point solutions obtained from rathersimple Hartree-Fock approximations or perturbative ex-pansions in terms of the correlation. However, an ex-ample is known in 1D interacting systems where theusual perturbation expansions and Hartree-Fock ap-proximations clearly break down and the correct groundstate is not reproduced from the weak-coupling ap-proach. Its correct fixed point is believed to be theTomonaga-Luttinger liquid. The analysis of 2D systemsin terms of the Fermi-liquid fixed point is still controver-sial. In any case, aside from a few exceptional cases suchas the 1D systems and systems under strong magneticfields, the single-particle description of electrons is gen-erally robust. However, even in the cases where thefixed point is more or less reproduced by the single-particle picture of electrons, weak-coupling approachesbased on the perturbation expansion and/or Hartree-Fock-type analysis have serious difficulties in describingcorrelated metals.
The first serious problem is in describing excitations.For example, if one wants to ascribe the insulating na-ture of the Mott insulator to antiferromagnetic ordering,
Rev. Mod. Phys., Vol. 70, No. 4, October 1998
this attempt is immediately faced with the difficulty ofdescribing properties above the Neel temperature TN ,because the insulating behavior is robust well above TNin many cases, such as La2CuO4 and MnO. In fact, inLa2CuO4, the charge excitation gap of the order of 2 eV,clearly observed in optical measurements above TN , istwo orders of magnitude larger than the energy scale ofTN . To understand this, a formalism to allow the forma-tion of electron-hole bound states well above TN is nec-essary. This is similar to the separation of the Bose con-densation temperature and the energy scale of boundboson formation as in 4He. An efficient way of describ-ing phenomena below the electron-hole excitation en-ergy, namely, the charge excitation gap, is to derive aneffective Hamiltonian of Heisenberg spins, as is dis-cussed in Sec. II.A. The formation of electron-holebound states well above TN is a clear indication of thebreakdown of the single-particle picture. Of course sincethe low-energy collective excitations enhance the quan-tum spin fluctuations even at the level of zero-point os-cillations, quantitatively reliable description of theground state cannot be achieved by the usual single-particle description with a Hartree-Fock-type approxi-mation.
The second serious problem is in describing the MIT.The breakdown of the single-particle description of elec-trons is most clearly observed when the MIT is continu-ous because the metallic ground state must be recon-structed from the low-energy states of the insulatorwhen the insulator undergoes a continuous transition toa metal. There, critical fluctuations can only be treatedby taking account of relevant collective excitations andgrowth of short-ranged correlations. Continuous MITsare the subject of extensive work in recent theoreticaland experimental studies.
The critical fluctuation is not observable as a true di-vergence if the MIT is of first order. Therefore, in thiscase, whether interesting anomalous fluctuations in met-als appear or not relies on whether the first-order tran-sition is weak or not. Experimental aspects of first-ordertransitions are considered in Sec. IV.
As is discussed in Sec. IV, many compounds, such assome titanium oxides and vanadium oxides with the 3Dperovskite structure, some of the sulfides and selenides,as well as 2D systems including high-Tc cuprates, appearto show a continuous MIT. To understand critical fluc-tuations near the MIT, it is crucial to extract the majordriving force of the transition. One of the driving forcesis the Anderson localization, and another is the correla-tion effect toward the Mott insulator. One may also ar-gue the role of the electron-phonon interaction. In real-istic situations, the effect of randomness, namely, theAnderson localization, must be seriously consideredwhen the system is sufficiently close to the transitionpoint. However, in many cases such as high-Tc cuprates,several other transition-metal oxides, and 2D 3He, thestrong-correlation effect appears to be the dominantdriving force of the MIT. As a prototype, the nature ofthe transition from (to) the Mott insulator in clean sys-tems, if clarified, provides a good starting point and is

1046 Imada, Fujimori, and Tokura: Metal-insulator transitions
helpful in establishing new concepts. Theoretical under-standing of the MIT caused by pure strong-correlationeffects is an important subject of this review.
To understand the continuous MIT, the idea of scalingwas first applied to the Anderson localization problemin the 1970s (Wegner, 1976; Abrahams, Anderson, Lic-ciardello, and Ramakrishnan, 1979). As we discuss inSec. II.F, it is now established that the scaling conceptand renormalization-group analysis are useful especiallyin 2D. The scaling theory was also developed for under-standing the transition between a Mott insulator and asuperfluid of single-component bosons (see Sec. II.F.12).In the case of transitions between metals and Mott insu-lators in pure systems, a scaling theory has also beenformulated recently and several new features of the MITclarified (Imada, 1994c, 1995b). We discuss this recentachievement in Sec. II.F.
The difficulty of quasiparticle descriptions and mean-field approximations of electrons appear most seriouslyin non Fermi liquids. One-dimensional interacting sys-tems showing the Tomonaga-Luttinger liquid behaviorprovide a prototype of non Fermi liquids due to strong-correlation effects. Its basic properties are summarizedin Sec. II.G.1. To explain several anomalous propertiesof high-Tc cuprates, the marginal Fermi-liquid theorywas proposed on phenomenological grounds. It is dis-cussed in Sec. II.G.2.
Section II.H is devoted to recent attempts to describemore complicated situations. Transition-metal com-pounds have rich structures of phases due to spin andorbital fluctuations. Among them, the interplay of spinand orbital ordering is the subject of Sec. II.H.1. Due tothe interplay of these two fluctuations, severald-electron systems have phases of ferromagnetic and an-tiferromagnetic metals. In particular, Mn and Co com-pounds show the MIT accompanied by the appearanceof ferromagnetic metals due to strong Hund’s-rule cou-pling. This is discussed in Sec. II.H.2. Other complexitiessuch as the effects of charge ordering are also discussedin Sec. II.H.3.
C. Remarks on material systematics (Introductionto Sec. III)
In order to study Mott transitions and associated phe-nomena in real materials, microscopic models such asthe Hubbard model [Eq. (1.1)] and its extended versionsare necessary to formulate and to solve problems. Thosemodels include parameters that are to be determined soas to reproduce experimentally measured physical prop-erties of real systems as closely as possible. For example,the Hubbard model has the parameters U and t whilethe d-p model [Eq. (2.1)] also has «d2«p[D . There aremore parameters when the degeneracy of the d orbitalshas to be taken into account. In order to check the va-lidity of theoretical ideas through comparison with ex-periment, however, it is often desirable not only to ad-just the model parameters but also to have independentestimates of those parameters a priori. Section III de-scribes such methods and the results of parameter esti-
Rev. Mod. Phys., Vol. 70, No. 4, October 1998
mates. Once we know the parameter values, especiallyhow they change when the chemical composition of ma-terials is changed, we are able to predict to some extentthe physical properties of those materials using the pa-rameter values as an input to theoretical calculations.
The current status of our understanding of the elec-tronic structures of transition-metal compounds isheavily based on spectroscopic methods that have beendeveloped in the last decade. A very useful approach forstrongly correlated transition-metal compounds hasbeen the configuration-interaction (CI) treatment ofmetal-ligand cluster models, in which correlation andhybridization effects within the local cluster are quiteaccurately taken into account. On the other hand, first-principles calculations have also greatly contributed toour understanding of electronic structures, especially toour estimates of the parameter values. In Sec. III.A, thelocal description of electronic structure based on theconfiguration-interaction picture of a metal-ligand clus-ter model is described. Basic parameters that character-ize the electronic structure, namely, the charge-transferenergy D, the Coulomb repulsion U [see Eq. (1.1)], etc.,are introduced together with the important concept ofMott-Hubbard-type versus charge-transfer-type insula-tors.
In Sec. III.B, methods used to derive those param-eters are described: They are spectroscopic methods,first-principles methods, and more classical methodsbased on the ionic point-charge model. The spectro-scopic methods are largely based on the configuration-interaction cluster model. Systematic variations of themodel parameters have been deduced and employed topredict physical properties of the transition-metal com-pounds. The first-principles methods are based on thelocal-density approximation. The LDA with certain con-straints (constrained LDA method) is used to calculateU and other parameters. Fits of first-principles bandstructures to the tight-binding model Hamiltonian givesuch parameters as the t and D.
In Sec. III.C we describe how to control the electronicparameters of the model for real materials systems. Twofundamental parameters of a strongly correlated elec-tron system are the one-electron bandwidth W (or hop-ping interaction t of the conduction particle) and theband filling n (or doping level). The conventionalmethod of bandwidth control (BC) is application of ex-ternal or internal (chemical) pressure. In Sec. III.C.1 weshow some examples of the metal-insulator phase dia-gram afforded by such bandwidth control. As a typicalexample of chemical pressure, we describe the generalrelation between the ionic radii of the composing atomicelement (or the so-called tolerance factor) and themetal-oxygen-metal bond angle in a perovskite-typestructure. The d-electron hopping interaction t is medi-ated by the oxygen 2p state (supertransfer process) andhence sensitive to the bond angle. This offers the oppor-tunity to control W by variation of the perovskite toler-ance factor. The example of RNiO3, is described in thatsection, where R is the rare-earth ion with varying ionicradius. The band filling or doping level can be controlled

1047Imada, Fujimori, and Tokura: Metal-insulator transitions
by modifying the chemical composition, as described inSec. III.C.2, such as introducing extra oxygen or its va-cancies and/or alloying the heterovalent ions other thanon the tradition metal site. The perovskites and theiranalogs are again the most typical for such filling control(FC) and the FC range in the actual pseudocubic andlayered perovskites of 3d transition-metal oxide is de-picted. The last subsection (III.C.3) is devoted to a de-scription of some homologous series compounds inwhich electronic dimensionality can be controlled tosome extent. The cuprate ladder-type compounds andthe Ruddlesden-Popper series (the so-called layeredperovskite) structures represent the dimensional cross-over from 1D to 2D and from 2D to 3D, respectively.These systematics are helpful in connecting the rathergeneral theoretical descriptions in Sec. II to specific ex-perimental examples in Sec. IV. They are also useful forclassifying experimental results.
D. Remarks on experimental results of anomalous metals(Introduction to Sec. IV)
Section IV is devoted to experimentally observed fea-tures of correlated metals and related MITs ind-electron systems (mostly oxides), which are mostly de-rived from the Mott insulators by bandwidth control(BC) or filling control (FC). As we mentioned above,other systems, including the organic and f-electron sys-tems, show similar MIT properties, but we do not coverthem in this article. Concerning the work done beforethe mid-1980s, comprehensive reviews on d-electroncompounds have been given in the literature, e.g., thebook written by Mott (1990) himself and one in honor ofthe 80th anniversary of Mott’s birth (Edwards and Rao,1985). The review given here would be biased in favor ofthe late advance on the FC-MITs.
In Sec. IV.A, we try to update the experimental un-derstanding of the BC-MIT systems, V2O3 (IV.A.1), NiS(IV.A.2), NiS22xSex (IV.A.3) and RNiO3 (IV.A.4). Thefirst two compounds have long been known as the pro-totypical systems that show the Mott insulator-to-metaltransition by application of pressure or by chemical sub-stitution. The MIT induced by some nonstoichiometryor by Ti doping should rather be considered as FC-MIT,yet all the features of the MIT in V2O3 are comprehen-sively described in this section. In the modern view ofthe Zaanen-Sawatzky-Allen scheme, the insulatingstates of NiS and NiS22xSex should be classified ascharge-transfer insulators with the charge gap betweenthe filled chalcogen 2p state and Ni 3d upper Hubbardband, in which the chalcogen 2p state bandwidth or thehybridization between the two states can be changed byapplying pressure or alloying S site with Se. A similarBC-MIT has been recently recognized in a series ofRNiO3, R being a rare-earth element from La to Lu,and the BC acting by the bond distortion of the ortho-rhombic perovskite. In this case, the nominal valence ofNi is 31 with 3d7 electron configuration, indicating theinsulating phase with S51/2 in contrast to the formerNi-based conventional Mott insulators with S51. In Sec.
Rev. Mod. Phys., Vol. 70, No. 4, October 1998
IV.A.5, we describe the electron spectroscopy ofCa12xSrxVO3, in which the bandwidth control can besimilarly achieved by perovskite distortion.
In Sec. IV.B we describe the features of the metallicstate derived from the Ti31- and V31-based Mott-Hubbard insulators by FC-MIT. R12xAxTiO3 (IV.B.1)is a relatively new but prototypical Mott-Hubbard sys-tem, in which both BC and FC have been proven to bepossible. The FC-MIT on the V31-based compound isalso observed in La12xSrxVO3 (IV.B.2) with perovskitestructure, which has long been known but is yet to beinvestigated from the modernized view.
Concerning the high-temperature superconducting cu-prates, there have been numerous publications on theiranomalous metallic properties. They are the most im-portant example of the FC-MIT. Here, we focus on thefilling dependence of the normal-state properties in pro-totypical hole-doped superconductors (IV.C.1.La22xSrxCuO4 and IV.C.3. YBa2Cu3O61y) and electron-doped ones (IVC.2 R22xCexCuO4).
In Sec. IV.D, we briefly describe the recent attemptsto derive the metallic state via carrier doping or FC inthe quasi-1D cuprate compounds as well as the ther-mally induced BC-MIT in BaVS3. In particular, thesearch for the FC-MIT in the quasi-1D cuprates haverecently been fruitful for one of the spin-ladder com-pounds, (Sr,Ca)14Cu24O41, and 10 K superconductivitywas found under pressure, a finding which is describedin a little more detail in Sec. IV.D.1.
The part of the Coulomb repulsion between electronson different sites occasionally helps the periodic real-space ordering of the charge carriers in narrow-bandsystems, although even without the intersite Coulombrepulsion, this real-space ordering may be stabilized dueto the kinetic-energy gain (see Sec. II.H.3). These phe-nomena are called charge ordering in the d-electron ox-ides and are widely observed for systems with simplefractional filling. A classic example is the Verwey tran-sition in magnetite, Fe3O4 (Sec. IV.E.1), with spinelstructure. The resistivity jump at TV'120 K was as-signed to the onset of the charge ordering, namely areal-space ordering of the Fe21 and Fe31 on the spinel Bsite in the ferrimagnetic state, where the spins on the Asites (Fe31) and on the B sites (Fe21/Fe31) direct oppo-sitely. The magnetic phase-transition temperature is 858K, much higher than TV . Thus we can only consider thecharge degree of freedom decoupled from the spin de-gree of freedom upon the charge-ordering transition. Incontrast, versatile phenomena take place in thed-electron oxides arising from simultaneous or stronglycorrelated changes of the charge ordering and spin or-dering. One such example is the case of La12xSrxFeO3(Sec. IV.E.2) with x52/3, in which the MIT at 220 K isassociated with simultaneous charge ordering and anti-ferromagnetic spin ordering. In the layered (n51) per-ovskite La22xSrxNiO4 (Sec. IV.E.3) with x51/3 or 1/2,the charge-ordered phase shows up at higher tempera-tures (220–240 K), accompanying the resistivity jump,and subsequently antiferromagnetic spin ordering takesplace. It is now believed that similar charge-ordering

1048 Imada, Fujimori, and Tokura: Metal-insulator transitions
phenomena in quasi-2D systems are present in the lay-ered perovskites of manganites (Sec. IV.E.4) and cu-prates (Sec. IV.C.1) with specific fillings. In particular,the cases of the superconducting cupratesLa22xSrxCuO4 and La22xBaxCuO4, with x51/8, areknown as ‘‘the 1/8 problem:’’ The superconductivity dis-appears singularly at this filling even though 1/8 is nearthe optimum doping level (x50.15) at which Tc is maxi-mum. The phenomenon accompanies a structuralchange, as confirmed in La22xBaxCuO4, and perhapsalso spin ordering.
Sec. IV.F is devoted to a review of double-exchangesystems, which are of revived interest due to the largemagnetoresistance and other magnetic-field-inducedphenomena. The ferromagnetic interaction between thelocal d-electron spins is mediated by the transfer of theconduction d electron (double-exchange interaction):The itinerant carriers are coupled with the local spin viathe strong on-site exchange interaction (Hund’s-rulecoupling). The metallic phase is derived by hole dopingfrom the parent insulators, e.g., LaMnO3 and LaCoO3.In the perovskite manganites (Sec. IV.F.1), the strongHund’s-rule coupling works between the eg electron andthe t2g local spin (S53/2). The eg electrons are stronglycorrelated, which gives rise to various competing inter-actions with the double-exchange interaction. In particu-lar, we shall see that competing interactions, such aselectron-lattice (Jahn-Teller), superexchange, andcharge-ordering interactions, cause a variety ofmagnetic-field-induced metal-insulator phenomena inthe manganites with controlled bandwidth and filling.The attempt at dimension control in manganites is re-viewed, taking examples of layered perovskite structures(n52; Sec IV.F.2). Hole-doped cobalt oxides with theperovskite structure (Sec. IV.G.4) are other examples ofdouble-exchange ferromagnets, although the itinerancyof the conduction electrons is considerably larger than inthe manganites.
The systems associated with gaps for both charge andspin are conceptually difficult to distinguish from theband insulators, as discussed above. However, somed-electron compounds are considered to be strongly cor-related insulators with a spin gap and undergo the tran-sition to correlated metals usually by increasing tem-perature or by applying pressure (BC-MIT). Someexamples are given in Sec. IV.G. FeSi (Sec. IV.G.1) hasbeen pointed out to show similarities to a Kondo insu-lator. The nonmagnetic ground state of VO2 (Sec.IV.G.2) arises from the dimerization of V sites. Never-theless, the Cr-doped compound takes the structure of ahomogeneous stack but remains insulating, i.e., is a Mottinsulator. Thus the spin-dimerized state in VO2 may beviewed as a spin Peierls state and the compound under-goes an insulator-metal transition with increasing tem-perature. LaCoO3 (Sec. IV.G.4) undergoes a spin-statetransition and the ground state corresponds to the low-spin (S50) state. The thermally induced MIT in thiscompound has recently been revisited and some uncon-ventional features arising from electron correlation havebeen found. We further consider the recent investigation
Rev. Mod. Phys., Vol. 70, No. 4, October 1998
of the misfit compounds, La1.172xPbxVS3.17 (Sec.IV.G.5), which are nonmagnetic in the insulating state(x50.17) where both electron doping and hole dopingare possible. Section IV.H is devoted to other interest-ing 4d transition-metal oxides, for example Sr2RuO4(Sec. IV.H.1). This transition-metal oxide, which is iso-structural with La22xSrxCuO4, was recently found to besuperconducting below 0.9 K and to show a highly an-isotropic Fermi-liquid behavior.
II. THEORETICAL DESCRIPTION
A. Theoretical models for correlated metals and Mottinsulators in d-electron systems
1. Electronic states of d-electron systems
The atomic orbitals of transition-metal elements areconstructed as eigenstates under the spherical potentialgenerated by the transition-metal ion. When the solid isformed, the atomic orbital forms bands due to the peri-odic potential of atoms. The bandwidth is basically de-termined from the overlap of two d orbitals on two ad-jacent transition metals each. The overlap comes fromthe tunneling of two adjacent so-called virtual boundstates of d orbitals. Because of the relatively small ra-dius of the wave function as compared to the lattice con-stant in crystals, d-electron systems have in generalsmaller overlap and hence smaller bandwidths than al-kaline metals. In transition-metal compounds, the over-lap is often determined by indirect transfer between dorbitals through ligand p orbitals. This means that thebandwidth is determined by the overlap (in other words,hybridization) of the d wave function at a transition-metal atom and the p wave function at the adjacentligand atom if the ligand atoms make bridges betweentwo transition-metal atoms. Because of this indirecttransfer through ligand atomic orbitals, the d bandwidthbecomes in general even narrower. Another origin ofthe relatively narrow bandwidth in transition-metalcompounds is that 4s and 4p bands are pushed wellabove the d band, where screening effects by 4s and 4pelectrons do not work well. This makes the interactionrelatively larger than the bandwidth. In any case, be-cause of the narrow bandwidth, the tight-binding modelsconstructed from atomic Wannier orbitals provide agood starting point. For historic and seminal discussionson this point, readers are referred, to the textbook ed-ited by Rado and Suhl (1963), particularly the articles byHerring (1963) and Anderson (1963a, 1963b).
The bands that are formed are under the strong influ-ence of anisotropic crystal fields in solids. Because the3d orbital has the total angular momentum L52, it hasfivefold degeneracy (Lz52,1,0,21,22) for each spinand hence a total of tenfold degeneracy including spins.This degeneracy is lifted by the anisotropic crystal field.In transition-metal compounds, a transition-metal atomis surrounded by ligand atoms to help in the formationof a solid through the increase in cohesive energy bycovalent bonds of the two species. Because the ligandatoms have a strong tendency towards negative valence,

1049Imada, Fujimori, and Tokura: Metal-insulator transitions
the crystal field of electrons in the direction of the ligandatom is higher than in other directions. Figure 2 showsan example of the crystal field splitting, where the cubiclattice symmetry leads to a higher energy level of four-fold degenerate eg (or dg) orbital and sixfold degeneratelower orbitals, t2g (or d«). When a transition-metal atomis surrounded by ligand atoms with an octahedron con-figuration, the eg orbital has anisotropy with larger am-plitude in the direction of the principle axes, namely,toward neighboring ligand atoms. The basis of these or-bitals may be expanded by dx22y2 and d3z22r2 orbitals.On the other hand, the t2g orbital has anisotropy withlarger amplitude of the wave function toward other di-rections and may be represented by dxy , dyz , and dzxorbitals. For other lattice structures with other crystalsymmetries, such as tetragonal or orthorhombic as in thecase of 2D perovskite structure, similar crystal field split-ting appears. In the case of tetrahedral surroundings ofligand ions, eg orbitals lie lower than t2g , in contrast tocubic symmetry or octahedron surroundings. Readersare referred to Sec. III for more detailed discussions ofeach compound.
In general, the relevant electronic orbitals for low-energy excitations transition-metal compounds withlight transition-metal elements are different from thosewith heavy ones. In the compounds with light transition-metal elements such as Ti, V, Cr, . . . , only a few bandsformed from 3d orbitals are occupied by electrons peratom. Therefore the t2g orbital (more precisely, the t2gband under the periodic potential) is the relevant bandfor low-energy excitations in the case of the above-mentioned octahedron structure because the Fermi levelcrosses bands mainly formed by t2g orbitals. By contrast,in transition-metal compounds with heavy transition-metal elements such as Cu and Ni, the t2g band is fullyoccupied far below the Fermi level, and low-energy ex-citations are expressed within the eg band, which isformed mainly from eg atomic orbitals. If degenerate t2gor eg orbitals are filled partially, it generally leads againto degeneracy of the ground state, which frequently in-duces the Jahn-Teller effect to lift the degeneracy.
Another important difference between light andheavy transition-metal compounds is the level of ligandp orbitals. For example, in the transition-metal oxides,the levels of the relevant 3d orbitals and oxygen 2ps
orbitals, illustrated in Fig. 3, become closer when the
FIG. 2. Crystal-field splitting of 3d orbitals under cubic, te-tragonal, and orthorhombic symmetries. The numbers citednear the levels are the degeneracy including spins.
Rev. Mod. Phys., Vol. 70, No. 4, October 1998
transition-metal element is changed from Sc to Cu. Thisis mainly because the positive nuclear charge increaseswith this change, which makes the chemical potential ofd electrons lower and closer to the p orbital. In fact, inthe high-Tc cuprates, the 2ps orbital has a level close tothe 3dx22y2 orbital of Cu. This tendency, as well as thelarger overlap of the eg wave function with the ligand ps
orbital for geometric reasons, causes a strong hybridiza-tion of the eg and ligand p bands in the late transitionmetals. Therefore, to understand low-energy excitationson a quantitative level, we have to consider these stronghybridization effects. In contrast, for light transition-metal oxides, the oxygen p level becomes far from the3d orbital and additionally the overlap of t2g and p or-bitals is weak. Then the oxygen p band is not stronglyhybridized with 3d band at the Fermi level, and the for-mal valence of oxygen is kept close to O22. (More cor-rectly speaking, the oxygen p band is nearly full. How-ever, the real valence of oxygen itself may be larger than22 because the oxygen p band is hybridized with 3d ,4s , and 4p orbitals.) Consequently the contributionfrom the oxygen p band to the wave function at theFermi level may be ignored in the first stage. When theligand atoms are replaced with S and Se, in general, thelevel of the 2p band becomes higher and can be closerto the d band. This systematic change can be seen, forexample, in NiO, NiS, and NiSe, as we shall see in Secs.III.A and IV.A.
The electronic correlation effect is in general largewhen two electrons with up and down spins each occupythe same atomic d orbital of a transition-metal atom.The Coulomb repulsion energy of two electrons at thesame atomic orbital is determined by the spatial exten-sion of the orbital. The Coulomb energy thus deter-
FIG. 3. Examples of configurations for transition-metal 3d or-bitals which are bridged by ligand p orbitals.

1050 Imada, Fujimori, and Tokura: Metal-insulator transitions
mined is relatively large for the d orbital as compared tothe small bandwidth. Of course, since the Coulomb in-teraction is long ranged, the interatomic Coulomb inter-action up to the screening radius also has to be consid-ered in realistic calculations.
2. Lattice fermion models
Much progress has been made in our theoretical un-derstanding of d-electron systems through the tight-binding Hamiltonian. In this section we introduce sev-eral lattice fermion systems derived from the tight-binding approximation, for use and further discussion inlater sections.
Considering all the above aspects of electronic wavefunctions in d-electron systems, we obtain several sim-plified tight-binding models. The most celebrated andsimplified model is the Hubbard model (Anderson,1959; Hubbard, 1963; Kanamori, 1963) defined in Eqs.(1.1a)–(1.1d). The kinetic-energy operator Ht in (1.1b)is obtained from the overlap of two atomic Wannier or-bitals, w is(r) on site i and w js(r) on site j as
t5E dr w is* ~r!1
2m¹2w js~r!, (2.1)
where m is the electron mass and the Planck constant \is set to unity. The on-site term HU in (1.1c) describesthe Coulomb repulsion of two electrons at the same site,as derived from
U5E dr dr8 w is* ~r!w is~r!e2
ur2r8uw i2s* ~r8!w i2s~r8!.
(2.2)
Cleary this Hamiltonian neglects multiband effects, asimplification that is valid in the strict sense only whenthe atom has only one s orbital, as in hydrogen atoms.When this model is used as a model of d-electron sys-tems, it implicitly assumes that orbital degeneracy islifted by the strong anisotropic crystal field so that rel-evant low-energy excitations can be described by asingle band near the Fermi level. It also assumes that theligand p band in transition-metal compounds is far fromthe relevant d band or that they are strongly hybridizedto form an effective single band. This Hamiltonian alsoneglects the intersite Coulomb force. The screening ef-fect makes the long-range part of the Coulomb forceexponentially weak, which justifies neglect of the Cou-lomb interaction far beyond the screening radius. How-ever, ignoring the intersite interaction in the short-ranged part of the Coulomb force is a simplification thatsometimes results in failure to reproduce important fea-tures, such as the charge-ordering effect, as we shall dis-cuss in Sec. II.H. In the literature, the electron hoppingterm Ht is often restricted to the sum over pairs ofnearest-neighbor sites ^ij&.
In spite of these tremendous simplifications, the Hub-bard model can reproduce the Mott insulating phasewith basically correct spin correlations and the transitionbetween Mott insulators and metals. The Mott insulat-ing phase appears at half-filling where the average elec-
Rev. Mod. Phys., Vol. 70, No. 4, October 1998
tron number ^nis& is controlled at ^nis&51/2. For thenearest-neighbor Hubbard model on a hypercubic lat-tice, the band structure of the noninteracting part is de-scribed as
Ht5(ks
«0~k !cks† cks , (2.3a)
«0~k !522t (v5x ,y ,¯
cos kv , (2.3b)
where we have taken the lattice constant to be unity.Here, the Fourier transform of the electron operator isintroduced as
cks† 5(
je ik•rjc js
† . (2.4)
The spatial coordinate of the j site is denoted by rj . Athalf-filling under electron-hole symmetry, the Fermilevel lies at m5«F50. Because the band is half-filled atm50, the appearance of the insulating phase is clearlydue to the correlation effect arising from the term HU .
Although both the Mott insulating state and the MIT(metal-insulator transition) are reproduced in the Hub-bard model, many aspects on quantitative levels withrich structure have to be discussed by introducing morecomplex and realistic factors. To discuss the charge-ordering effect, at least the near-neighbor interaction ef-fect should be considered as
H5HH1HV , (2.5a)
HV5V(ij&
ninj , (2.5b)
ni5(s
nis . (2.5c)
For light elements of transition metal, such as V andTi, the Fermi level is on the t2g bands, which are three-fold degenerate under the cubic crystal field with pos-sible weak splitting of this degeneracy under the Jahn-Teller distortion in the perovskite structure. When theFermi level is on the eg bands, as in Ni and Cu com-pounds, the degeneracy is twofold in the absence of theJahn-Teller distortion. If the Jahn-Teller splitting isweak, we have to consider explicitly three orbitals, dxy ,dyz , and dzx , for the t2g band and two orbitals, dx22y2
and d3z22r2, for the eg band in addition to the spin de-generacy. This leads to the degenerate Hubbard modeldenoted by
HDH5HDt1HDU1HDV1HDUJ , (2.6a)
HDt52 (ij&
s ,n ,n8
k~ t ijn ,n8cisn
† cjsn81H.c.!, (2.6b)
HDU5 (inn8s ,s8
~12dnn8dss8!Unn8nisnnis8n8 , (2.6c)
HDV5 (s ,s8
n ,n8^ij&
Vijnn8nisnnjs8n8 , (2.6d)

1051Imada, Fujimori, and Tokura: Metal-insulator transitions
HDUJ52 (nn8
iss8
J0nn8@~12dnn8!cins† cins8cin8s8
† cin8s
2~12dnn8!~12dss8!cin8s8† cin8s
† cinscins8#
(2.6e)
where n and n8 describe orbital degrees of freedom.HDUJ is the contribution of the intrasite exchange inter-action with
J0nn85E dr dr8 w in~r!w i
n8~r!e2
ur2r8uw i
n~r8!w in8~r8!, (2.7)
where w is taken to be real. The intersite exchange termis neglected here for simplicity. The term HDUJ gener-ates a Hund’s-rule coupling, since two electrons on dif-ferent atomic orbitals feel higher energy for oppositespins due to the first term. In this orbitally degeneratemodel, in addition to spin correlations, we have to con-sider orbital correlations that can lead to orbital long-range order. The term HDU represents the intra-orbitalCoulomb energy Un ,n as well as the interorbital oneUn ,n8 with nÞn8 for the on-site repulsion. The intersiterepulsion is given in HDV .
For the case with orbital degeneracy as in Eq. (2.6a),the effective Hamiltonian may be derived from the or-bital exchange coupling in analogy with the spin ex-change coupling Eq. (2.12) (Castellani et al., 1978a,1978b, 1978c; Kugel and Khomskii, 1982). However, theorbital exchange coupling has important differencesfrom the spin exchange. One such difference is that theorbital exchange may have large anisotropy.
As in the derivation of the usual superexchange inter-action for the single-orbital system, we can derive thestrong-coupling Hamiltonian by introducing pseudospinrepresentation by t i for the orbital degrees of freedomin addition to the S51/2 operator Si for the spins (t i hasthe same representation as the spin-1/2 operators fordoubly degenerate orbitals). More explicitly, t i
†
5cin† cin8 , t i
25cin8† cin and t i
z5 12 (cin
† cin2cin8† cin8), re-
spectively, for doubly degenerate orbits. In the simplestcase of twofold degenerate orbitals with a single elec-tron per site on average, the Hilbert space of the two-site problem is expanded by four states, as shown in Fig.4, when the doubly occupied site is excluded due to astrong intrasite Coulomb interaction. Here we considerthe transfer of two eg orbitals between two sites locatedalong the x or y directions. The transfers between twox22y2 orbitals, tx1 , between two 3z22r2 orbitals, tx2 ,and between x22y2 orbital and 3z22r2 orbital, tx12 , re-spectively, satisfy tx1.tx12.tx2 while tz2@tz1 and tz1250 are expected along the z direction. In fact, becauseof the anisotropy of the d wave function, these arescaled by a single parameter as
tx1534
t0 , tx2514
t0 , tx1252ty1252)
4t0 ,
tz15tz1250, and tz251.
Rev. Mod. Phys., Vol. 70, No. 4, October 1998
Therefore the Hamiltonian becomes highly anisotropicfor t operators. A general form of the exchange Hamil-tonian in the strong-coupling limit in this case is given by
H5(ij&
@Si•Sj$Js1Jstz t i
zt jz12Jst
12~t i1t j
21t i2t j
1!
12Jst11~t i
1t j11t i
2t j2!12Jst
zx~t j11t j
2!
22iJstzy~t j
12t j2!1Kts
z t iz1Kts
x t ix%
1Jtxt i
zt jz12Jt
12~t i1t j
21t i2t j
1!12Jtzxt i
z~t j11t j
2!
22iJtzyt i
z~t j12t j
2!12Jt11~t i
1t j11t i
2t j2!
1Ktzt i
z1Ktxt i
x# . (2.8)
Here, the parameters depend on the direction of iW2 jW . Itshould be noted that XY-type or Ising-type anisotropyfor the spin exchange easily occurs, and this anisotropydepends on the pair (i ,j). When the system is away fromthe integer filling or the on-site interaction is not largeenough to make the system Mott insulating, the transferterm has to be considered explicitly. As we saw above,the transfer itself is also highly anisotropic, dependingon the orbital. For example, the transfer for the x22y2
orbital is in general large in the x and y directions butsmall in the z direction. The opposite is true in the 3z2
2r2 orbital. This makes for complicated orbital-dependent band structure in contrast with the spin de-pendence. Another complexity is that the orbital ex-change coupling of the bonds in the x direction is largefor dxy , dzx , or dx22y2 orbitals, while it is small for theexchange including dyz or d3z22r2 orbital. For the bonds
FIG. 4. Examples of various second-order processes of two-site systems with the sites i and j . The orbitals are specified byn and n8. The upper, middle, and lower states are the initial,intermediate, and final states in the second-order perturbationexpansion in terms of t/U : (a) off-diagonal contribution to thespin-exchange process for the case without orbital degeneracy;(b) diagonal contribution for the case without orbital degen-eracy; (c) twofold orbital degeneracy yielding off-diagonal or-bital exchange process; (d) same situation as (c) yielding bothorbital and spin exchange.

1052 Imada, Fujimori, and Tokura: Metal-insulator transitions
in other directions, y and z , different combinations havelarge exchange coupling. In addition, orbital orderingstrongly couples with magnetic ordering. The couplingof orbital and spin degrees of freedom is apparently dif-ferent from the usual spin-orbit coupling because it is anonrelativistic effect. For d-electron systems, the usualspin-orbit interaction is relatively weak as compared torare-earth compounds. In general, in systems with or-bital degeneracy, we have to consider couplings of or-bital occupancy to the Jahn-Teller distortion, quadru-pole interaction, and spin-orbit interaction. Orbitaldegeneracy also yields intersite orbital exchange cou-pling as in Eq. (2.8). These will lead to a rich structure ofphysical properties, as is discussed in Sec. II.H.l.
For Mn and Co compounds, the d electrons may oc-cupy high-spin states because of Hund’s-rule coupling.In this case, the t2g bands are occupied by three spin-aligned electrons with additional electrons in the egbands ferromagnetically coupled with t2g electrons dueto Hund’s-rule coupling. This circumstance is sometimesmodeled by the double-exchange model (Zener, 1951;Anderson and Hasegawa, 1955; de Gennes, 1960):
HDE5Ht1HHund , (2.9a)
Ht52t(ij&s
~cis† cjs1H.c.!, (2.9b)
HHund52JH(i
SW i•sW i , (2.9c)
where SW i5(Six ,Si
y ,Siz) is defined from the eg-electron
operator cis as
Si15Si
x1iSiy5ci↑
† ci↓ , (2.10a)
Si25Si
x2iSiy5ci↓
† ci↑ , (2.10b)
Siz5
12
~ci↑† ci↑2ci↓
† ci↓!, (2.10c)
whereas sW i represents the localized t2g spin operators. Astrong Hund’s-rule coupling JH larger than t may lead toa wide region of ferromagnetic metal, as is observed inMn and Co compounds. In Co compounds, a subtle bal-ance of low-spin and high-spin states is realized, as weshall see later in Sec. IV.G.4. More generally, the inter-play of the Hund’s-rule coupling and exchange couplingswith strong-correlation effects as well as orbital andJahn-Teller fluctuations can lead to complicated phasediagrams with ferromagnetic and various types of anti-ferromagnetic phases in metals, as well as in the Mottinsulator, as will be discussed in Secs. II.H.2 and IV.F.1.
In the compounds with heavy transition-metal ele-ments such as Ni and Cu, t2g bands are fully occupiedwith additional eg electrons. In particular, in the high-Tccuprates, two-dimensional perovskite structure leads tohighly 2D anisotropy with crystal field splitting of dgbands to the lower orbit, d3z22r2, and the upper one,dx22y2, due to the Jahn-Teller distortion for the case ofa CuO6 octahedron. The Mott insulating phase of thehigh-Tc cuprates as in La2CuO4 is realized in the Cu d9
Rev. Mod. Phys., Vol. 70, No. 4, October 1998
configuration, where three t2g bands as well as thed3z22r2 band are fully occupied, whereas the dx22y2
band is half filled. This makes the single-band descrip-tion more or less valid because the low-energy excitationcan be described only through the isolated dx22y2 band.This is the reason why the Hubbard model can be agood starting point for discussing physics in the cupratesuperconductors. However, another feature of heavytransition-metal oxides is the strong hybridization effectof the d orbital and the oxygen p orbital. Because theconduction network is constructed from an oxygen 2ps
orbital and a 3dx22y2 orbital in this case, strong cova-lency pushes the oxygen 2ps orbital closer to the Fermilevel. The d-p model is the full description of these3dx22y2 and 2ps orbitals in the copper oxides where theHamiltonian takes the form
Hdp5Hdpt1HdpU1HdpV , (2.11a)
Hdpt52 (^ij&s
tpd~dis† pjs1H.c.!1«d(
indi
1«p(j
npj , (2.11b)
HdpU5Udd(i
ndi↑ndi↓1Upp(i
npi↑npi↓ , (2.11c)
HdpV5Vpd(ij&
npindj . (2.11d)
When the oxygen ps level, «p , is much lower than «d ,the oxygen p orbital contributes only through virtualprocesses. The second-order perturbation in terms of«d2«p generates the original Hubbard model. This typeof transition-metal oxide in which «d2«p is assumed tobe larger than Udd is called a Mott-Hubbard-type com-pound. Because of Udd,u«d2«pu, the charge gap in theMott insulating phase is mainly determined by Udd .
In contrast, if u«d2«pu is smaller than Udd , the chargeexcitation in the Mott insulating phase is mainly deter-mined by the charge transfer type where an added holein the Mott insulator mainly occupies the oxygen ps
band. The difference between these two cases is sche-matically illustrated in Fig. 5. The importance of theoxygen ps band in this class of material was first pointedout by Fujimori and Minami (1984). This type of com-pound is called a charge-transfer-type or CT compound(Zaanen, Sawatzky, and Allen, 1985).
The character of low-energy charge excitationschanges from d in the Mott-Hubbard type to stronglyhybridized p and d in the charge-transfer type. How-ever, it may be affected by an adiabatic change in theparameter space of D5«d2«p and U , as long as theinsulating phase survives at half-filling of d electrons. Atleast in the Mott insulating phase, these two types ofcompounds show similar features described by theHeisenberg model, as is discussed below. In the metallicphase, one may also expect a similarity when the stronghybridization of the d and ligand p band forms wellseparated bonding, nonbonding, and antibonding bands

1053Imada, Fujimori, and Tokura: Metal-insulator transitions
and the Fermi level lies near one of them. However, ithas been argued that some low-energy excitations dis-play differences between the Mott-Hubbard and CTtypes (Emery, 1987; Varma, Schmitt-Rink, and Abra-hams, 1987). With a decrease in D, the MIT may occureven at half-filling. This is probably the reason why Nicompounds become more metallic when one changesthe ligand atom from oxygen, sulfur to selenium.
Low-energy excitations of the Mott insulating phasein transition-metal compounds are governed by theKramers-Anderson superexchange interaction, in whichonly collective excitations of spin degrees of freedomare vital (Kramers, 1934; Anderson, 1963a, 1963b). Thesecond-order perturbation in terms of t/U in the Hub-bard model, as in Figs. 4(b) and 4(c), or the fourth-orderperturbation in terms of tpd /u«d2«pu or tpd /Udd in thed-p model yield the spin-1/2 Heisenberg model at halfband filling of d electrons:
HHeis5J(ij&
Si•Sj , (2.12)
where Si15Si
x1iSiy5ci↑
† ci↓ , Si25Si
x2iSiy5ci↓
† ci↑ andSi
z5 12 (ni↑2ni↓). Here J is given in the perturbation ex-
pansion as J5 4t2/U for the Hubbard model and
J58tpd
4
~ u«d2«pu1Vpd!2~ u«d2«pu1Upp!
14tpd
4
~ u«d2«pu1Vpd!2Udd
FIG. 5. Schematic illustration of energy levels for (a) a Mott-Hubbard insulator and (b) a charge-transfer insulator gener-ated by the d-site interaction effect.
Rev. Mod. Phys., Vol. 70, No. 4, October 1998
for the d-p model. The exchange between two d orbit-als, 1 and 2, in the presence of the ligand p orbital 3, isindeed derived from the direct exchange between the dorbital 1 and the neighboring p orbital 3, which is hy-bridized with the other d orbital 2 or vice versa. Thisgenerates a ‘‘superexchange’’ between 1 and 2 in theorder shown above (Anderson, 1959). Even for dopedsystems, a second-order perturbation in terms of t/U inthe Hubbard model leads to the so-called t-J model(Chao, Spalek, and Oles, 1977; Hirsch, 1985a; Anderson,1987),
Ht-J52 (ij&s
Pd~ t ijc is† cjs1H.c.!Pd1J(
ij&Si•Sj ,
(2.13)
where Pd is a projection operator to exclude the doubleoccupancy of particles at the same site. To derive Eq.(2.13), we neglect the so-called three-site term given by
H t2J8 }(ilj&
cis† ~Sl!ss8cjs8 (2.14)
from the assumption that the basic physics may be thesame. However, this is a controversial issue, since it ap-pears to make a substantial difference in spectral prop-erties (Eskes et al., 1994) and superconducting instability(Assaad, Imada, and Scalapino, 1997). It was stressedthat the t-J model (2.13) represents an effective Hamil-tonian of the d-p model (2.11a) by extracting the singletnature of a doped p hole and a localized d hole coupledwith it (Zhang and Rice, 1988). Of course, for highlydoped system far away from the Mott insulator, it isquestionable whether Eq. (2.13) with doping-independent J can be justified as the effective Hamil-tonian.
B. Variety of metal-insulator transitionsand correlated metals
In order to discuss various aspects of correlated met-als, insulators, and the MIT observed in d-electron sys-tems, it is important first to classify and distinguish sev-eral different types. To understand anomalous featuresin recent experiments, we must keep in mind the impor-tant parameter, dimensionality. We should also keep inmind that both spin and orbital degrees of freedom playcrucial roles in determining the character of the transi-tion. Metal-insulator transitions may be broadly classi-fied according to the presence or the absence of symme-try breaking in the component degrees of freedom onboth the insulating and the metallic side, because differ-ent types of broken-symmetry states cannot be adiabati-cally connected. Here we employ the term ‘‘component’’to represent both spin and orbital degrees of freedom ind-electron systems. Symmetry breaking in Mott insula-tors as well as in metals is due to the multiplicity of theparticle components. For example, for antiferromagneticorder, the symmetry of multiple spin degrees of freedomis broken.

1054 Imada, Fujimori, and Tokura: Metal-insulator transitions
The Mott insulator itself in the usual sense is realiz-able only in a multicomponent system. This is becausethe Mott insulating state is defined when the band is atinteger filling but only partially filled, which is possibleonly in multicomponent systems. In this context, theMott insulator, in the sense discussed in the Introduc-tion, is the insulator caused by intrasite Coulomb repul-sion, as in the Hubbard model. This definition is gener-alized in the last part of this section to allow intersiteCoulomb repulsion as the origin of generalized Mott in-sulator. For the moment, we restrict our discussion tothe usual ‘‘intrasite’’ Mott insulator, as in the Hubbardmodel. When intrasite repulsion causes the Mott insula-tor, energetically degenerate multiple states comingfrom a multiplicity of components are only partially oc-cupied by electrons because of strong mutual intrasiterepulsion of electrons. This origin of an insulator doesnot exist when the multiplicity of states on a site is lost.
Although a multiplicity of components is necessary torealize a Mott insulator, it does not uniquely fix the be-havior of the component degrees of freedom. Namely,the insulator itself may or may not be a broken-symmetry state of the component. To be more specific,consider, for example, the spin degree of freedom as thecomponent. In the antiferromagnetic or the ferromag-netic state, the spin-component symmetry is broken andhence the spin entropy is zero in the ground state, as itshould be. Because of the superexchange interaction,antiferromagnetic long-range order is the most widelyobserved symmetry-broken state in the Mott insulator;we shall see many examples in Sec. IV.
When continuous symmetry is broken, as in SU(2)symmetry breaking of the isotropic Heisenberg model,only the Goldstone mode of the component, such as thespin wave, survives at low energies accompanied by agap in the charge excitation. We show in Sec. II.E.5 thatthis low-energy excitation of the Goldstone mode is nei-ther relevant nor singular at the MIT point. Here theSU(2) symmetry is defined as the rotational symmetry ofthe Pauli matrix Sx , Sy , and Sz .
Another possible symmetry breaking may be causedby the orbital order. For example, because the t2g orbitalis threefold degenerate in the cubic symmetry, the Mottinsulator may have either staggered orbital order (simi-lar to antiferromagnetic order in the case of spins) oruniform orbital order (similar to ferromagnetic order) oreven helical (spiral) and more complicated types of or-der to lift the orbital degeneracy. In general, the orbitalorder can be accompanied by static lattice anomalies,such as staggered Jahn-Teller-type distortion as dis-cussed in Sec. II.H.1. From the experimental point ofview, detection of the orbital order is not easy when itdoes not strongly couple with the lattice anomaly. Whenorbital and magnetic order take place simultaneously ortake place only partially, interesting and rich physics isexpected, as we discuss in Secs. II.H.1 and IV.
When the component order is not broken in theground state, it implies that a highly quantum mechani-cal state like a total singlet state should be the groundstate to satisfy the third thermodynamic law, which as-
Rev. Mod. Phys., Vol. 70, No. 4, October 1998
serts zero entropy as the normal condition of the groundstate. The total singlet ground state of the Mott insulatoris observed in many spin-gapped insulators. Examplescan be seen in spin Peierls insulators such as CuGeO3,Peierls insulators with dimerization such as in TTF-TCNQ and DCNQ salts, one-dimensional spin-1 chainsas in NENP, ladder systems (for exampleSrn21CunO2n21), two-dimensional systems as in CaV4O9and the Kondo insulator. The appearance of spin gaps inthese cases may be understood in a unified way from thegeometric structure of the underlying lattice (see, forexample, Hida, 1992; Katoh and Imada, 1993, 1994).Here, the spin gap Ds is defined as the difference be-tween ground-state energies for the singlet and the trip-let state:
Ds[EgS N
211,
N
221 D2EgS N
2,N
2 D , (2.15)
where Eg(N ,M) is the total ground-state energy of Nelectrons with up spin and M electrons with down spin.The charge gap Dc for the hole doping into the singletground state is given by
Dc[12 FEgS N
2,N
2 D2EgS N
221,
N
221 D G . (2.16)
When the spin excitation has a gap and the orbital exci-tation is not considered, this Mott insulator has bothspin and charge gaps. In this it is actually similar to aband insulator, in which spin and charge have the sameelectron-hole excitation gap. Although the spin gap canbe much smaller than the charge gap due to collectivespin excitations in the above correlated insulators, in thiscategory of spin gapped insulators, it is hard to draw adefinite boundary between the band insulator and theMott insulator. Indeed, they may be adiabatically con-nected by changes in the parameters when one concen-trates only on the insulating phase apart from metals.
There is another type of Mott insulator in which nei-ther symmetry breaking of the components nor a com-ponent excitation gap exists. Two well-known examplesof this category are the 1D Hubbard model at half-fillingand the 1D Heisenberg model in which the spin excita-tion is gapless due to algebraic decay of antiferromag-netic correlation. These examples indicate the absenceof magnetic order because of large quantum fluctuationsinherent in low-dimensional systems. To realize thistype, low dimensionality appears to be necessary.
In terms of a quantum phase transition, this type ofgapless spin unbroken-symmetry insulator appears justat the lower critical dimension dil of the Mott insulatorfor component order, or, in other words, just at the mag-netic critical point. As we discuss in detail in Sec. II.F,below the lower critical dimension of the relevant com-ponent order, d,dil , insulators with a disordered com-ponent appear while order appears for d.dil . The di-mension d5dil is marginal with gapless spin and

1055Imada, Fujimori, and Tokura: Metal-insulator transitions
unbroken-symmetry behavior. The lower critical dimen-sion may depend on details of the system under consid-eration such as lattice structure and number of compo-nents. For example, if lattice dimerization increases inthe Heisenberg model, the ground state changes fromthe antiferromagnetic state to a spin-gapped singlet at acritical strength of dimerization in 2D (Katoh andImada, 1993, 1994). A strongly dimerized lattice in 2Dcorresponds to d,dil while, in the case of a uniformsquare lattice, dil is below 2.
In metals near the Mott insulator, a similar classifica-tion scheme is also useful. Here, we define two types ofcomponent order. One is diagonal, where there is a den-sity wave such as the spin density wave in antiferromag-netic and ferromagnetic phases or an orbital densitywave. The other is off-diagonal, in which superconduc-tivity is the case. Above the lower critical dimension ofmetal for diagonal component order, dml , a diagonalcomponent order exists, as in antiferromagnetic metalsand ferromagnetic metals. By contrast, for d<dml , thediagonal component order disappears due to quantumfluctuations. dml may depend on the number of compo-nents. In principle, the insulating state can be realizedthrough a diagonal component order of an arbitrarilyincommensurate periodicity at the Fermi level, if thenesting condition is satisfied. This is indeed the case withthe stripe phase in the Hartree-Fock approximation, asis discussed in Sec. II.D.2 and II.H.3. However, in theHartree-Fock approximation dynamic quantum fluctua-tions are ignored. Usually, in reality, the ordering takesplace only at some specific commensurate filling for asuch large electron density of the order realizable in sol-ids. Incommensurate order is hardly realized due toquantum fluctuations. When the quantum fluctuation islarge enough, and the impurity-localization effect andthe effect of anisotropic gap (in other words, discretesymmetry breaking as in the Ising-like anisotropic case)are not serious, usually metal appears just adjacent tothe Mott insulator.
If this metal has a diagonal component order, themost plausible case is the same order with the same pe-riodicity, like the order in the Mott insulating state. Inthis case, a small pocket of the Fermi surface is expectedif the metal is obtained by carrier doping of the Mottinsulator. This may be realized in the antiferromagneticmetallic state near the Mott insulator. Another impor-tant case of this class is that of ferromagnetic metals, asobserved in Mn and Co compounds such as(La,Sr)MnO3. Here the symmetry breaking is quite dif-ferent between the antiferromagnetic order in the Mottinsulator and the ferromagnetic order in the doped sys-tem. The appearance of ferromagnetic metals is theo-retically argued in connection with Nagaoka ferromag-netism (Nagaoka, 1966), where the ferromagnetism isproven when a hole is doped into the Hubbard model athalf filling in a special limit of infinite U . Ferromag-netism is also proven in some special band structureswith a flat dispersion at the Fermi level. In the aboveargument the orbital degrees of freedom are ignored. Insome cases, the formation of the ferromagnetic order is
Rev. Mod. Phys., Vol. 70, No. 4, October 1998
tightly connected with the double-exchange mechanism,which is made possible by the strong Hund’s-rule cou-pling. Some of theoretical and experimental aspects ofthis class are discussed in Secs. II.H.2 and IV.F, respec-tively.
For the case d<dml , order in the diagonal componentis lost. This class is further divided into three cases. Inthe first case, the component excitation has a gap due toformation of a bound state. A typical example is singletCooper pairing, where the ground state has an off-diagonal order, namely, superconducting for d>2, whilegap formation only leads to algebraic decay of the pair-ing correlation at d51 because long-range order is de-stroyed by quantum fluctuations. A known example ofthis class in 1D is the Luther-Emery-type liquid (Lutherand Emery, 1974; Emery, 1979). Although no example isknown to date, the possibility is not excluded in prin-ciple that the superconducting ground state could domi-nate or coexist with diagonal component-order in a partof the region d.dml near the Mott insulator. This classdoes not exclude the case of an anisotropic gap withnodes as in d-wave pairing, where the true excitationgap is lost.
The second case for d<dml is the formation of a largeFermi surface consistent with the Luttinger sum rule.This case is possible, for example, when the Fermi-liquidstate is retained close to the Mott insulating state. Here,the Fermi liquid is defined as an adiabatically continuedstate with the ground state of the noninteracting system,in which the interaction is gradually switched on. Thenthe Fermi surface in momentum space is retained in theFermi liquid with the same volume as in a noninteract-ing system, which is the statement of the Luttinger theo-rem (Luttinger, 1963). The formation of a large ‘‘Fermisurface’’ is not necessarily restricted to the Fermi liquid.In the case of the Tomonaga-Luttinger liquid in 1D, theFermi surface is characterized by singularity of the mo-mentum distribution function, and there is a large Fermivolume consistent with the Luttinger theorem.
The third case is the formation of small pockets ofFermi surface. This is basically the same as what hap-pens in a band insulator upon doping. Therefore noclear distinction from the doping into the band insulatoris expected.
We summarize three cases of insulators and four casesof metals near the Mott insulator:(I-1) insulator with diagonal order of components(I-2) insulator with disordered component and compo-
nent excitation gap(I-3) insulator with disordered component and gapless
component excitations(M-1) metal with diagonal order of components and
small Fermi volume(M-2) metal or superconducting state with the bound-
state formation dominated by off-diagonal com-ponent order (frequently with component excita-tion gap)
(M-3) metal with disordered component and ‘‘large’’Fermi volume consistent with the Luttinger theo-rem

1056 Imada, Fujimori, and Tokura: Metal-insulator transitions
Rev. Mod. Phys
TABLE I. Rough and simplified sketch for types of metal-insulator transitions in overall phasediagram observed in various compounds. In parentheses, section numbers where discussions may befound in Sec. IV are given.
Metal \ Insulator I-1Component order
I-2Component gap
M-1 V 22yO 3(IV.A.1) La 12xSr xCoO 3
diagonal Ni 22yS 22xSe x(IV.A.2) (IV.G.4)component-order R12xAxMnO3(IV.F.1)M-2 high-Tc cuprates (Sr,Ca) 14Cu 24O 41
bound state (IV.C) (IV.D.1)(superconductor) BEDT-TTF
compoundsM-3 La 12xSr xTiO 3
component disorder (IV.B.1)(large Fermi RNiO3 La 12xSr xVO 3
volume) (IV.A.3) (IV.B.2)M-4 Kondocomponent insulatordisorder (IV.G)(small Fermivolume)
(M-4) metal with disordered component and ‘‘small’’Fermi volume as in a doped band insulator
In d-electron systems experimentally and also in the-oretical models, a variety of MITs are observed. Herewe classify them in the form @I-i↔M-j# (i51,2,3, j51,2,3,4) where a transition from an insulator of thetype I-i to a metal of the type M-j takes place. We listbelow both cases of filling control (FC-MIT) and band-width control (BC-MIT) and summarize examples of thecompounds in Table I.
@I-1↔M-1# : A typical example is the transition be-tween an antiferromagnetic insulator and an antiferro-magnetic metal. Examples are seen in V2O32y (BC-MITor FC-MIT) and in NiS22xSex (BC-MIT). Although theHartree-Fock approximation usually gives this class ofbehavior for the MIT, it is important to note that insystems with strong 2D anisotropy, no example of thisclass is known to date. This lends support to the ideathat dml is larger than two for the antiferromagnetic or-der, at least in single orbital systems. Quantum MonteCarlo results in 2D for a single band system also supportthe absence of antiferromagnetic order in metals. Evenin 3D, all the examples of antiferromagnetic metalsknown to date are found when orbital degeneracy exists.For doped spin-1/2 Mott insulators, antiferromagneticorder quickly disappears by metallization upon dopingor bandwidth widening, and no antiferromagnetic metalsare scarcely found, as is known in La12xSrxTiO3 (FC-MIT) and RNiO3 (BC-MIT), although they have orbitaldegeneracy. Therefore dml for antiferromagnetic orderwithout orbital degeneracy can be larger than three, al-though we do not have a reliable theory. With increasingcomponent degeneracy due to orbital degrees of free-dom, dml may become smaller than three. Quite differ-
., Vol. 70, No. 4, October 1998
ent spin orderings can be realized between insulatingand metallic phases in this category. A good example isthe double-exchange system, such as La12xSrxMnO3,where the Mott insulating state at x50 has a type ofantiferromagnetic order with orbital and Jahn-Teller or-derings, whereas the metallic phase has ferromagneticorder. As for the orbital order, this compound has thecharacter of @I-1↔M-3# , because it is speculated thatthe orbital order is lost upon metallization.
@I-1↔M-2# : This is the case of high-Tc cuprates atlow temperatures. Recent studies appear to support thatthe superconducting phase directly undergoes transitionto a Mott insulator (Fukuzumi et al., 1996) by the routeof FC-MIT. No normal metallic phase is seen betweensuperconductor and insulator at zero temperature in thecuprates. Another example of this type of transition isthat of BEDT-TTF compounds (BC-MIT; for a review,see Kanoda, 1997).
@I-1↔M-3# : This class can be observed for dml.d.dil . As we have already discussed, in 3D,La12xSrxTiO3 (FC-MIT) and RNiO3 may be examples,although the possible existence of a tinyantiferromagnetic-metal region cannot be ruled out.When the effect of orbital degeneracies becomes impor-tant, even for doped spin-1/2 insulators, rather compli-cated behavior may appear, as in (Y,Ca)TiO3 (FC-MIT)where a wide region of orbital ordered insulator isspeculated. In 2D, the second layer registered phase of3He adsorbed on graphite may also be interpreted as aMott insulator (Greywall, 1990; Lusher et al., 1993;Imada, 1995b). Solidification of 3D 3He has been dis-cussed before in analogy with the Mott transition in theGutzwiller approximation (Vollhardt, 1984). However,the 3D solid of 3He should not be categorized as a Mott

1057Imada, Fujimori, and Tokura: Metal-insulator transitions
insulator, because commensurability with the underlyingperiodic potential is crucial for a Mott insulator while itis absent in 3D 3He. In contrast, the second layer ofadsorbed 3He on graphite indeed undergoes a transitionbetween a quantum liquid and a Mott insulator. In thiscase, the Mott insulator is formed on the van der Waalsperiodic potential of the triangular lattice of the 3Hesolid in the first layer. The second-layer Mott insulatorappears to be realized at a commensurate density on atriangular lattice. The anomalous quantum liquid stateof 3He observed upon doping can basically be classifiedas belonging to this class, @I-1↔M-3# , though the tran-sition is of weakly first order (Imada, 1995b). An advan-tage of the 3He system (FC-MIT) is that one can inves-tigate a prototype system without orbital degeneracies,impurity scattering, interlayer coupling, or long-rangeCoulomb interactions. Although the Anderson localiza-tion effect appears to be serious, La1.171xVS3.17 also be-longs to this class (Nishikawa, Yasui, and Sato, 1994;Takeda et al., 1994). In this compound there exists asubtlety related to dimerization and spin gap formationin the insulating phase, and hence it can also be charac-terized as @I-2↔M-4# . The 2D Hubbard model clarifiedby quantum Monte Carlo calculations appears to belongto a theoretical model of this class as we shall see in Sec.II.E. In general, a new universality class of transition isexpected in this category, as we discuss in Sec. II.F.
@I-2↔M-1# : An example is seen in La12xSrxCoO3,where the low-spin state of LaCoO3 at low temperaturesbecomes a ferromagnetic metal under doping.
@I-2↔M-2# : Extensive effort has been made to real-ize this class of transition experimentally, as in doping ofdimerized, spin-1, or ladder systems (Hiroi and Takano,1995; McCarron et al., 1988; Siegrist et al., 1988). This isbased on a proposal of the pairing mechanism for dopedspin-gapped systems and theoretical results where thespin gap remains finite and pairing correlation becomesdominant when carriers are doped into various spin-gapped 1D systems such as dimerized systems (Imada,1991, 1993c), spin-1 systems (Imada, 1993c), the frus-trated t-J model (Ogata et al., 1991), ladder systems(Dagotto, Riera, and Scalapina, 1992; Rice et al., 1993,Tsunetsugu et al., 1994; Dagotto and Rice, 1996). Theseapparently different systems are continuously connectedin the parameter space of models (Katoh and Imada,1995). Although a ladder system LaCuO2.5 was metal-lized upon doping, the metallic state appears to be real-ized from the 3D network by changing the geometry ofthe ladder network. Therefore it is questionable whetherit can be classified as a doped ladder system. One clearorigin of the difficulty in realizing superconductivity isthe localization effect, which must be serious with 1Danisotropy. Doping of a spin-gapped Mott insulator in2D would therefore be desirable. The recent discoveryof a superconducting phase in a spin ladder system(Sr,Ca)14Cu24O41 by Uehara et al. (1996) may belong tothis category. At the moment, it is not clear enoughwhether this superconductivity is realized by carrierdoping of a quasi-1D spin-gapped insulator via themechanism described above or by a mechanism like that
Rev. Mod. Phys., Vol. 70, No. 4, October 1998
for the high-Tc cuprates, ascribed to the more generalanomalous character of metals near the Mott insulator,as discussed in Secs. II.E, II.F, and II.G. We discuss ex-perimental details of this category in Sec. IV.D.1.
@I-2↔M-4# : This is basically the same as the transi-tion between a band insulator and a normal metal.Kondo insulators are also supposed to belong to thisclass. For d-electron systems, spin excitation gaps orlow-spin configurations appear in the insulating phasein, for example, FeSi, TiO2, Ti2O3, and LaCoO3. Re-cently, it was found that several other systems also showspin-gapped excitations in the insulating phase. Ex-amples are spin Peierls compounds such as CuGeO3(Hase et al., 1993), NaV2O5 (Isobe and Ueda, 1996),spin-1 chain compounds such as Y2BaNiO5 (Buttreyet al., 1990), ladder compounds as already discussedabove, CaV4O9 (Taniguchi, et al., 1995) andLa1.171xVS3.17 (Takeda et al., 1994). Carrier doping ofthese compounds has not been successful so far, exceptin the ladder compounds, and it is not clear whether spinexcitation becomes gapless or not in these cases uponmetallization.
@I-3↔M-3# : Experimentally this class has not beenobserved in the strict sense. In theoretical models, ex-amples are 1D systems such as the 1D Hubbard model.Although it is not Fermi liquid, the singularity of themomentum distribution clearly specifies the formationof ‘‘large Fermi volume’’ in the metallic region.
When the electron density is commensurate to thenumber of lattice sites, charge ordering may occur. Thisis observed in the cases of Fe3O4, Ti4O7, and severalperovskite oxides (see Sec. IV). This class of charge-ordering transition has often been called (for example,by Mott, 1990) the Wigner transition or the Verweytransition. However, this type of charge ordering usuallytakes place only at simple commensurate filling. In thecase of d-electron systems, the Wigner crystal in theusual sense of an electron gas cannot be realized be-cause the electron density is too great. The commensu-rability of the electron filling is crucial for realizingcharge ordering. Although the intersite Coulomb repul-sion helps the charge ordering, the gain in kinetic energycould be enough to stabilize the charge-ordered state. Inthis sense, a charge-ordered insulator may also beviewed as a generalized Mott insulator where the elec-tron density is kept constant at a commensurate valueand it is incompressible. The charge-ordering transitionis discussed in Sec. II.H.3. Another mechanism forcharge ordering is the Peierls transition when the nest-ing condition is well satisfied. In this case, the periodicitycan be incommensurate to the lattice periodicity.
C. Field-theoretical framework for interactingfermion systems
In this section, a basic formulation for treating inter-acting fermions based on the path-integral formalism issummarized for use in later sections. To show how theformulation is constructed, we take the Hubbard modelas an example. Since this section discusses only the basic

1058 Imada, Fujimori, and Tokura: Metal-insulator transitions
formalism needed to understand the content of later sec-tions, readers are referred to other references (for ex-ample, Negele and Orland, 1988) for a more completeand rigorous description.
1. Coherent states
Fermion Fock space can be represented by a basis ofSlater determinants. However, Fock space can alterna-tively be represented by a basis of coherent states, as weshow below. The coherent states are defined as eigen-states of the fermion annihilation operator. This is ex-pressed as
cauc&5cauc& , (2.17)
where ca is the fermion annihilation operator with thequantum number a, whereas uc& is a coherent state withthe eigenvalue ca . When one operates more than oneannihilation operator to uc&, one gets the commutationrelation for ca from that of ca :
cacg1cgca50. (2.18)
This means that ca’s are not c numbers. Actually, thiscommutation relation constitutes the Grassmann alge-bra.
In order to demonstrate that the basic Grassmann al-gebra given below is indeed useful and necessary to rep-resent the Fock space, we first introduce the explicitform of the coherent state. Because ca’s are not c num-bers, we are forced to enlarge the original Fock space byincluding Grassmann variables ca as coefficients. Anyvector uf& in the generalized Fock space is given by thelinear combination of vectors in the original Fock spacewith Grassmann variables as coefficients:
uf&5(a
cauwa&, (2.19)
where ca is a Grassmann variable with $uwa&% being thecomplete set of vectors in the original Fock space. In thegeneralized Fock space, the fermion coherent state isgiven as
uc&5expF2(a
caca† G u0&5)
a~12caca
† !u0&. (2.20)
For the coherent state uc& defined in Eq. (2.20), it isnecessary to require the commutation relations
cacb† 1cb
† ca50, (2.21a)
cacb1cbca50. (2.21b)
Since caca† and cbcb
† commute from Eqs. (2.21a) and(2.21b), we can show that
cauc&5 )bÞa
~12cbcb† !ca~12caca
† !u0&
5 )bÞa
~12cbcb† !cau0&
5 )bÞa
~12cbcb† !ca~12caca
† !u0&5cauc&,
(2.22)
Rev. Mod. Phys., Vol. 70, No. 4, October 1998
where we have used Eq. (2.18).
2. Grassmann algebra
The basic algebra of the Grassmann variable $ca% isgiven by Eq. (2.18). In addition, several other relationsare summarized here. From the adjoint state of (2.20),
^cu5^0uexpF2(a
cacaG5^0u)a
~11caca!, (2.23)
we can define the conjugation of ca as ca . From thisdefinition, it is clear that the conjugation operation fol-lows:
ca5ca , (2.24a)
lca5l* ca , (2.24b)
cacbcg¯5¯cgcbca (2.24c)
where l is a complex number with its complex conjugatel* .
The operation of ca† can be associated with the deriva-
tive of Grassmann variables as
ca† uc&5ca
† ~12caca† ! )
bÞa~12cbcb
† !u0&
5ca† )
bÞa~12cbcb
† !u0&52]
]ca~12caca
† !
3 )bÞa
~12cbcb† !u0&52
]
]cauc&, (2.25)
where the derivative of ca is defined in a natural way as
]
]ca@a01a1ca1a2ca1a3caca#5a12a3ca (2.26)
for c number constants a0 , a1 , a2 , and a3 . Note that(]/]ca) (caca)52(]/]ca) (caca)52ca . Equation(2.25) is indeed easily shown from the definitions (2.20)and (2.26). One can verify the conjugation of (2.25):
^cuca5]
]ca
^cu. (2.27)
The overlap of two coherent states is shown from Eqs.(2.20) and (2.27) as
^cuc8&5^0u)a
~11caca!~12ca8ca† !u0&
5)a
~11caca8 !5expF(a
caca8 G . (2.28)

1059Imada, Fujimori, and Tokura: Metal-insulator transitions
The matrix element of a normal-ordered operatorH(ca
† ,ca) between two coherent states immediately fol-lows from Eq. (2.28) as
^cuH~ca† ,ca!uc8&5expF(
acaca8 GH~ ca ,ca!. (2.29)
Through Eq. (2.29), operators are represented only bythe Grassmann variables.
To calculate matrix elements of operators as well astrace summations, it is useful to introduce a definite in-tegral in terms of ca . Any regular function of ca maybe expanded as
f~ca!5a01a1ca (2.30)
because of ca2 50. Therefore it is sufficient to define
*dca1 and *dcaca . When we assume the same prop-erties as those of ordinary integrals from 2` to 1`over functions which vanish at infinity, it is natural todefine the definite integral so as to satisfy vanishing in-tegral of a complete differential form:
E dca
]
]caf~ca!50. (2.31)
Then, because of 15(]/]ca) ca , we have
E dca15E dca150. (2.32a)
The definite integral of ca can be taken as a constant.Only for convenience, to avoid annoying coefficients inlater matrix elements, we take this constant to be unity:
E dcaca5E dcaca51. (2.32b)
From the definition of the integrals, we obtain theuseful closure relation
E )a
dca dcaexpF2(a
cacaG uc&^cu51. (2.33)
If we restrict the Hilbert space to single-particle stateswith particle number 0 or 1, Eq. (2.33) is proven as
~2.33 !5E dca dcaexp@2caca#
3~12caca† !u0&^0u~11caca!
5E dcadca@~11caca!u0&^0u2caca† u0&^0u
1u0&^0ucaca1cacaca† u0&^0uca#
5@ u0&^0u1ca† u0&^u0uca#51.
Rev. Mod. Phys., Vol. 70, No. 4, October 1998
The generalization of this proof to many-particle statesuc&5Pa(12caca
† )u0& is straightforward.From Eqs. (2.20), (2.23), and (2.33), the trace of an
operator A is
Tr A5(i
^w iuAuw i&
5E )a
dcadcaexpF2(a
cacaG3(
i^w iuc&^cuAuw i&
5E )a
dca dcaexpF2(a
cacaG3(
i^2cuAuw i&^w iuc&
5E )a
dca dcaexpF2(a
cacaG^2cuAuc&.
(2.34)
A Gaussian integral of a pair of conjugate Grassmannvariables is
E dca dca e2caaca5E dca dca~12caaca!5a .
(2.35)
Similarly, a Gaussian integral in matrix form is provento be
E )a51
n
dca dcaexp@2caAabcb1 zaca1zaca#
5~det A !exp@ zaAab21zb# , (2.36)
where za and za are another pair of Grassmann vari-ables. Using Eqs. (2.29), (2.34), and (2.36), we can cal-culate the partition function and other functional inte-grals in the path-integral formalism.
3. Functional integrals, path integrals, and statisticalmechanics of many-fermion systems
In the case of the Hubbard model (1.1a), the matrixelement of the Hamiltonian HH in the coherent staterepresentation reads from Eq. (2.29) as
HH@c ,c#5Ht1HU2S m1U
2 DN, (2.37a)
Ht52t(ij&
~ c isc js1c jsc is!, (2.37b)
HU5U(i
c i↑c i↓c i↓c i↑ , (2.37c)

1060 Imada, Fujimori, and Tokura: Metal-insulator transitions
N5(is
c isc is , (2.37d)
which is obtained by replacing cis† and cis with Grass-
mann variables c is and c is , respectively, after propernormal ordering. The partition function for a many-particle system is
Z5Tr e2bH
5E dca dcaexpF2(a
cacaG^2cue2bHuc&.
(2.38)
When one divides e2bH into L imaginary-time slices(Trotter slices) by keeping the inverse temperature(Dt)L5b constant and inserts the closure relation Eq.(2.33) in each interval of slices, using Eqs. (2.28) and(2.33), one obtains the standard path-integral formalismin the limit L→` in the form
Z5 limL→`
E F)l51
L
dca~ l ! dca
~ l !Gexp†2S@c ,c#‡, (2.39a)
S@c ,c#5(l51
L
(m51
L
Slm@c ,c# , (2.39b)
Slm@c ,c#5Dt(a
F ca~ l !ca
~m !Fd lm2d l21,m
Dt G1H[ca
(l) ,ca(m)]d l21,mG (2.39c)
with ca(0)52ca
(L) . By defining the functional integra-tion
D@c ,c#5 limL→`
)l51
L
)a
dca~ l !dca
~ l ! , (2.40)
one obtains the partition function
Z5E D@c ,c#e2S[c ,c], (2.41a)
with the action
S@c ,c#5E0
b
dt(a
ca~t!]
]tca~t!
1E0
b
dt H@ca~t!,ca~t!# (2.41b)
under the constraint ca(0)52ca(b).The Fourier transforms of the Grassmann variables
are
Rev. Mod. Phys., Vol. 70, No. 4, October 1998
c~k !5E drE0
b
dt e2i~k•r2vnt!c~x !, (2.42a)
c~x !51
bV (k ,vn
ei~k•r2vnt!c~k !, (2.42b)
where x and k are Euclidean four-dimensional vectorsx[(r,t) and k[(k,vn), with vn being the Matsubarafrequency vn[2pT(n1 1
2 ), n50,61,62, . . . . Hereaf-ter the volume V and the number of sites Ns will havethe same meaning for lattice systems. The Fourier-transformed form of the action is
S@c ,c#5(n
F2ivnE dk c~k !c~k !1H@c~k !,c~k !#G .(2.43)
4. Green’s functions, self-energy, and spectral functions
The t-dependent thermal Green’s function for sys-tems with translational symmetry is defined by
G~k,t!52E dr e2ik•r^Tc~r,t!c†~0,0!&, (2.44)
with the time-ordered product T and the thermody-namic average ^¯&. The spectral representation ofG(k,t) is
G~k,t
1061Imada, Fujimori, and Tokura: Metal-insulator transitions
G0~j ,t1 ;h ,t2![21
Z0
TrFT expF2E0
b
dt H0Gcj~t1!ch† ~t2!G
52djh
*D@c ,c#exp†2*dt3 dt4 St3 ,t4@c ,c#‡cj~t1!ch~t2!
*D@c ,c#expF2E dt3 dt4 St3t4@c ,c#G
52djh
]2
]J* ~t1!]J~t2!
*D@c ,c#exp@2*dt3 dt4 St3t4@c ,c#1*dtJ* ~t!c~t!1c~t!J~t!#
$*D@c ,c#exp†2*dt3 dt4 St3t4@c ,c#‡%
UJ5J* 50
52djh
]2
]J* ~t1!]J~t2!expF E dt3 dt4 J* ~t3!†S@c ,c#‡t3t4
21 J~t4!GUJ5J* 50
52djh@S21#t1t2, (2.48)
where S is the matrix whose (l ,m) component isSl ,m@c ,c# . After the Fourier transformation, the ther-mal Green’s function for the noninteracting Hamil-tonian H0 is easily obtained from Eqs. (2.43) and (2.48)as
G0~k,vn!51
ivn2«0~k!, (2.49)
where «0(k) is the dispersion of H0 as in Eq. (2.3b).The real-time-displaced retarded Green’s function is
defined by
GR~r,t !52iu~ t !^$c~r,t !,c†~0,0!%&, (2.50)
with the anticommutator $A ,B%[AB1BA , the Heavi-side step function u, and the Heisenberg representationA(t)5eiHtAe2iHt. The causal Green’s function is simi-larly defined by
GC~r,t !52i^Tc~r,t !c†~0,0!&. (2.51)
The thermal Green’s function is analytically continuedto a complex variable z ,
G~k,2iz !5E2`
` A~k,v8!
z2v8dv8, (2.52)
with the spectral function
A~k,v
1062 Imada, Fujimori, and Tokura: Metal-insulator transitions
n~k!5E2`
m
dv A~k,v!. (2.58)
If we integrate A(k,v) above and below the chemicalpotential, then
E2`
`
dv A~k,v!51, (2.59)
per energy band.In a noninteracting system, we derive
GR~k,v!51
v2«0~k!2id,
GC~k,v!51
v2«0~k!1id sgn„«0~k!2«F….
The Green’s function of an interacting electron sys-tem GR or G is related to that of the noninteractingsystem G0
R(k,v)51/@v2«0(k)2id# , or G0(k,vn)51/@ ivn2«0(k)# where «0(k) is the energy of a nonin-teracting Bloch electron, through the Dyson equation
G~k,vn!5G0~k,vn!1G0~k,vn!S~k,vn!G~k,vn!.(2.60)
Here ((k,vn) is the self-energy into which all of theinteraction effects are squeezed. The solution of theDyson equation formally reads
G~k,vn!51
ivn2«0~k!2S~k,vn!. (2.61)
After analytic continuation of the Matsubara frequencyivn to the real v, the Green’s function is
GR~k,v!51
v2«0~k!2S~k,v!. (2.62)
The pole v5«0(k) for the noninteracting system ismodified to v5«0(k)1((k,v).
For simplicity, we consider the case in which there isonly one energy band in the Brillouin zone. The self-energy S(k,v) gives the change of «0(k) caused byelectron-electron interaction, electron-phonon interac-tion, and/or any kind of interaction that cannot be incor-porated in the noninteracting energy spectrum «0(k). Inthis article, we implicitly assume that the self-energy cor-rection is due to electron-electron interaction. In a non-interacting system, the spectral function has a d-functionpeak at v5«0(k): A(k,v)5d„v2«0(k)…. With interac-tion,
A~k,v!521p
Im GR~k,v!
51p
2Im S~k,v!
@v2«0~k!2Re S~k,v!#21@2Im S~k,v!#2 .
(2.63)
Rev. Mod. Phys., Vol. 70, No. 4, October 1998
Therefore Re S(k,v) and 2Im S(k,v) give, respec-tively, the energy shift and the broadening of the one-electron eigenvalue v5«0(k) due to the interaction.
Because the Green’s function GR(k,t) is a linear re-sponse function to an external perturbation at t50, theimaginary part and the real part of its Fourier transformGR(k,v) should satisfy causality, i.e., the Kramers-Kronig relation:
Re GR~k,v!51pPE
2`
` Im GR~k,v8!
v2v8dv8, (2.64)
Im GR~k,v!521pPE
2`
` Re GR~k,v8!
v2v8dv8. (2.65)
That is, GR(k,v) has to be an analytic function of v inthe complete upper v half-plane.
Then, S(k,v) should also be analytic in the same vregion and satisfy the Kramers-Kronig relation:
Re S~k,v!51pPE
2`
` Im S~k,v8!2Im S~k,`!
v2v8dv8
(2.66)
Im S~k,v!2Im S~k,`!521pPE
2`
` Re S~k,v8!
v2v8dv8.
(2.67)
Equations (2.53) and (2.54) for v,m and v.m canbe measured by photoemission and inverse photoemis-sion spectroscopy, respectively, in the angle-resolved (k-resolved) mode using single-crystal samples. Here v isrelated to the kinetic energy «kin of the emitted (ab-sorbed) electron through v5«kin2hn , where hn is theenergy of the absorbed (emitted) photon. r(v), given byEq. (2.57), is measured by the angle-integrated mode ofphotoemission and inverse photoemission experiments.Here it should be noted that the photoemission and in-verse photoemission spectra are not identical to thespectral function A(k,v) due to several experimentalconditions, e.g., the spectral function is modulated bydipole matrix elements for the optical transitions toyield measured spectra; finite mean free paths of photo-electrons violate the conservation of momentum per-pendicular to the sample surface, K' , making it difficultto determine (K)' , etc. [see the text book on photoelec-tron spectroscopy by Hufner (1995)]. The latter problemdoes not exist for quasi-1D or 2D materials, in which thedispersions of energy bands in one or two directions isnegligibly small and hence the nonconservation of (K)'
does not cause any inconvenience.
D. Fermi-liquid theory and various mean-field approaches:Single-particle descriptions of correlated metalsand insulators
To understand the fundamental significance of strong-correlation effects, as well as the difficulties in treatingthem, it is helpful first to recollect basic and established

1063Imada, Fujimori, and Tokura: Metal-insulator transitions
single-particle theories. This section discusses severalsingle-particle theories of metals. In particular, theachievements to date of weak-correlation approachesand mean-field methods, as well as their limitations anddifficulties, are surveyed in this section in order to un-derstand the motivation for the strong-correlation ap-proaches presented in later sections.
1. Fermi-liquid description
In Fermi-liquid theory, adiabatic continuation of thecorrect ground state in the interacting system from thatin its noninteracting counterpart is assumed (Landau,1957a, 1957b, 1958; Anderson, 1984). In this subsection,we mainly discuss basic statements of the Fermi-liquidtheory. The reader is also referred to references for fur-ther detail (Pines and Nozieres, 1989). In Fermi-liquidtheory, the Green’s function G defined by Eq. (2.61) or(2.62) has basically the same structure of poles as in anoninteracting system. The interaction term of theHamiltonian may be considered in the perturbation ex-pansion. The Green’s function can be expressed in aself-consistent fashion using the self-energy introducedin Sec. II.C.4, which includes terms in the perturbationexpansion summed to infinite order. If the Fermi-liquiddescription is valid, the self-energy S remains finite andG is characterized by a pole at v5«0(k)1S(k,v). Be-cause Fermi-liquid theory is meaningful only near the
Rev. Mod. Phys., Vol. 70, No. 4, October 1998
Fermi level, we may restrict our consideration to small vand k measured from the Fermi surface. Then the realand imaginary parts of the self-energy can be expandedas
Re S~k,v!5Re S~k5kF ,v5m!2bkF~v2m!
2O„~v2m!2…1a~kF!~k2kF!
1O„~k2kF!2…, (2.68a)
Im S~k,v!52G~v2m!21O„~v2m!3…
1z~kF!~k2kF!21O„~k2kF!3….
(2.68b)
Here we have neglected possible logarithmic correc-tions. The fact that the interaction term generates onlyquadratic or higher-order terms for Im ( in terms of v isthe central assumption of Fermi-liquid theory. In theFermi liquid, the quasiparticle decays through excita-tions of electron-hole pairs across the chemical poten-tial. The lifetime of the quasiparticle is proportional tothe number of available electron-hole pairs and is there-fore proportional to (v2m)2 in the v→m limit:Im S(k,v)}2(v2m)2. Then the real part of the self-energy should be proportional to 2(v2m)1const inthe vicinity of v5m . The renormalized Green’s functionhas the form
GR~k,v!.ZkF
v2«* ~k2kF!1i„ZkFG~v2m!22ZkF
z~kF!~k2kF!2…
, (2.69)
for small v2m and k2kF where
ZkF51/~11bkF
! (2.70)
is the renormalization factor, whereas
«* ~k2kF!.ZkF@«0~k!1a~kF!~k2kF!# (2.71)
is the renormalized dispersion. Re S(k5kF ,v5m) canbe absorbed into a constant shift of «0(k), which shouldkeep the constraint of fixed density. The necessary con-dition for the validity of the Fermi-liquid description is«* 2m@Im ((k,v) for small v2m and k2kF , which isindeed satisfied in this case if ZkF
.0. The renormaliza-tion factor ZkF
scales basically all the other quantities.From this Green’s function, other physical quantities arederived. If the spectral function A(k,v) and the renor-malization factor Zk(v) [or Re S(k,v)] are known,Zk(v)21A(k,v) gives the energy distribution functionof quasiparticles with momentum k, in which each qua-siparticle carries weight 1 instead of Z of the spectralfunction. Hence the density of states of quasiparticlesN* (v) is given by
N* ~v!5(k
Zk~v!21A~k,v!. (2.72)
The renormalization of the quasiparticle density ofstates, as compared to that of the noninteracting systemat the Fermi level, is
N* ~m!
r0~m!5E
k5kF
]k]«*
dkY Ek5kF
]k]«0
dk (2.73a)
5m*
mb5
mv
mb•
mk
mb(2.73b)
where
mb5Ek5kF
]k]«0
dk, (2.73c)
mv5mb /ZkF, (2.73d)
and
mk5„vF01a~kF!…21vF0mb , (2.73e)
with the bare Fermi velocity vF05(]«0 /]k) uk5kFand
the bare band mass mb . We employ the notation mbinstead of m0 to specify the band mass of the noninter-acting Bloch electrons, although the noninteracting banddispersion is denoted by «0 . Here, mv and mk are oftencalled the v mass and the k mass, respectively, with the

1064 Imada, Fujimori, and Tokura: Metal-insulator transitions
total effective mass m* 5mkmv /mb . The ratio of thespecific-heat coefficient g to that of noninteracting sys-tem, gb , is also scaled by the effective mass enhance-ment m* /mb :
g
gb5
m*
mb. (2.74)
The charge compressibility k5(1/n2) ]n/]m is scaled as
k51n2
m*
mb
1
11F0s , (2.75)
where a Landau parameter F0s is introduced phenom-
enologically as the spin-independent and spatially iso-tropic part of the quasiparticle interaction. Similarly, theuniform magnetic susceptibility has the scaling form
xs5m*
mb
1
11F0a , (2.76)
where the spin antisymmetric and spatially isotropic partof the quasiparticle interaction is described by F0
a .The renormalization factor ZkF
can be interpreted asfollows: From Eqs. (2.54), (2.55), and (2.69), ZkF
is re-written as
ZkF5u^Fg~N11 !uckF ,s
† uFg~N !&u2, (2.77)
where ZkFis interpreted as the overlap between the true
ground state of the (N11)-particle system and the wavefunction for a bare single particle at kF is added to thetrue N-particle ground state. ZkF
is also given as thejump of the momentum distribution function ^n(k)&[^cks
† cks& at T50. The spectral representation
GC~k,v!5 limd→10
(n
u^Fg~N !uckuFn~N11 !&u2
v2En1id
1u^Fg~N !uck
†uFn~N21 !&u2
v1En2id(2.78)
leads to
^n~k!&51
2pilim
t→10E
2`
`
dv GC~k,v!eivt. (2.79)
Using the renormalized form
GC~k,v!5Zk
v2«* ~k2kF!1ig sgn~«* 2«F!, (2.80)
the jump of ^n(k)& at kF , is given by
^n~k!&k5kF2d2^n~k!&k5kF1d
52i
2plim
t→10E
2`
`
dv eivt
3S Zk
v2«* ~k2kF!2ig2
Zk
v2«* ~k2kF!1ig D5Zk . (2.81)
The spectral function defined in Eq. (2.63) becomes
Rev. Mod. Phys., Vol. 70, No. 4, October 1998
A~k,v!.2Zk„«* ~k!…
p
3Zk„«* ~k!…Im S„k,«* ~k!…
@v2«* ~k!#21@Zk„«* ~k!…Im S~k,v!#2 ,
(2.82)
where ZkFis generalized to Zk(v)[@1
2] Re S(k,v)/]v#21(,1) to allow v dependence.Equation (2.82) indicates that the quasiparticle peak atv5«* (k) has approximately a Lorentzian line shapewith a width of Zk„«* (k)…Im S„k,«* (k)…. It also indi-cates that the quasiparticle weight is Zk„«* (k)… insteadof one as in the noninteracting case.
In the transport process, it is known that the mass m ,which appears in the conductivity formula, s}ne2t/mand the Drude weight D}n/m , is not scaled by the ef-fective mass m* but by the bare mass m0 for systemswith Galilean invariance. This is because the electron-electron interaction conserves the total momentum andhence the current does not change under an adiabaticswitching of the interaction. However, the transport ofelectrons in solid is associated with Umklapp scatteringand impurity scattering. In particular, the Drude weightin perfect crystals may be strongly affected by Umklappscattering, which may be regarded as the origin of theMott transition in the perturbational framework. Thiseffect of the discrete lattice, not seen in the Galileaninvariant system, may cause a renormalization of thetransport mass from the bare value to mD* , which may ingeneral be different from m* and mb . When the elec-tron correlation is large, electron-electron scattering isthe dominant decoherence process of the electron wavefunction. This decoherence process is believed to governthe electron relaxation time t, although Umklapp scat-tering is necessary to cause inelastic relaxation. Thequasiparticle-quasiparticle scattering time is given by1/t 5Zk Im S. Then, in the usual Fermi liquid, the vdependence Zk Im S}(v2m)2 may be transformed totemperature dependence by replacing v2m with T be-cause the thermal excitation has a characteristic energyscale of T from the Fermi surface. Therefore the resis-tivity at low temperatures in strongly correlated systemsin general has the temperature dependence
r5AT21r0 , (2.83)
where r0 is the residual resistivity determined from theimpurity scattering process. The temperature depen-dence (2.83) is widely observed in many d and f electroncompounds at low temperatures. We discuss someexamples, NiS22xSex , NiS, RNiO3, Ca12xSrxVO3,R12xSxTiO3, R12xAxMnO3, etc., in Sec. IV. However,we also discuss how T2 dependence is replaced withother temperature dependences in cases such as thehigh-Tc cuprates and NiSSe. The origin of these unusualproperties is one of the important issues to be discussedin this article. On empirical grounds, it has been sug-gested that A seems to be proportional to g2 in many

1065Imada, Fujimori, and Tokura: Metal-insulator transitions
heavy-fermion compounds, that is, A/g2 seems to be auniversal constant in many cases (Kadowaki and Woods,1986). This constant is also similar in some perovskite Tiand V compounds (Ca12xSrxVO3, R12xAxTiO3 etc.; seeSecs. IV.A.5 and IV.B.1). However, this empirical rule isnot satisfied near antiferromagnetic transition, as inNiS22xSex (Sec. IV.A.2), as well as in the high-Tc cu-prates.
To derive thermodynamic as well as dynamic proper-ties based on the Fermi-liquid theory, it is necessary toinclude self-consistently the vertex correction in the self-energy. For this purpose, the Ward-Takahashi identityprovides a useful relation between the self-energy andthe vertex function under spin-rotational invariance(Koyama and Tachiki, 1986; Yamada and Yosida, 1986;Kohno and Yamada, 1991). The Ward-Takahashi iden-tity leads to
]Ss~k,iv!
]~ iv!5
]Ss~k,iv!
]m2 (
k8,s8A~k8,v5m!
3Gss8~k,k8;k8,k! (2.84)
and
]Ss~k,iv!
]~ iv!5
]Ss~k,iv!
]Hs2(
k8A~k8,v5m!
3Gss~k,k8;k8,k! (2.85)
with Hs5gmBHs/2 under a magnetic field H where thefour-point vertex function Gss8 is defined in Fig. 6 andwhere all of v are taken zero. We note the identity]Ss /]m5]Ss /]Hs1]Ss /]H2s . Below we neglect thewave-number dependence of the self-energy for the timebeing. Because
Zk5S 12]S
]v D 21
(2.86)
is satisfied from Eqs. (2.68a), (2.68b), and (2.70), we ob-tain
g
gb512(
ks
]Ss~k,v!
]v Uv5m
. (2.87)
Similarly, the enhancement of the uniform magnetic sus-ceptibility and charge susceptibility as compared to thenoninteracting band values xb and kb satisfies
FIG. 6. Diagrammatic representation of the four-point vertexfunction G(k1 ,k2 ,k3 ,k4).
Rev. Mod. Phys., Vol. 70, No. 4, October 1998
x
xb512~X↑↑2X↑↓!, (2.88)
k
kb512~X↑↑1X↑↓!, (2.89)
with
X↑↑~k!5]Ss~k,v5m!
]HsU
Hs50
, (2.90)
X↑↓~k!5]Ss~k,v5m!
]H2sU
H2s50
. (2.91)
From Eqs. (2.84) and (2.85), X↑↓ can be expressed as
X↑↓~k!5(k8
A~k8,v5m!G↑↓~k,k8;k8,k!. (2.92)
In this notation, the mass enhancement is basically as-cribed to the enhancement of (k8G↑↓(k50,k8;k8,k50).Up to the order of T2 and v2, Im ((k,v) is calculated as
Im ( ~k,v!52v21~pT !2
2p (
k8,qA~k2q,v5m!
3A~k8,v5m!A~k81q,v5m!
3FG↑↓2 ~k,k8;k81q,k2q!
112
G↑↑A2 ~k,k8;k81q,k2q!G (2.93)
with the antisymmetrized vertex function
G↑↑A~k1 ,k2 ;k3 ,k4!
5G↑↑~k1 ,k2 ;k3 ,k4!2G↑↑~k1 ,k2 ;k4 ,k3!. (2.94)
Using the damping factor
G~k!52Z~k!Im ( ~k,v!, (2.95)
we can express the coherent part of the conductivity as
scoh~v!;e2(k
A* ~k,v5m!Jkk2
S i~Ki•k!Jk
i
v1iG~k !(2.96)
with the sum ( i over the internal product of k and allthe reciprocal lattice vectors Ki coming from Umklappscattering. It should be noted that the electron-electroninteraction itself does not generate a nonzero resistivitybecause of momentum conservation, and Umklapp scat-tering is needed to yield a momentum relaxation process(Yamada and Yosida, 1986). Yamada and Yosida suc-ceeded in deriving the momentum conservation by tak-ing account of proper vertex and self-energy correctionsutilizing the Ward-Takahashi identity. This guaranteeszero resistivity in the absence of Umklapp scattering.Because the inverse of the quasiparticle spectral weightA* 21, the current Jk , and G(k) are all renormalized byZk(v), they are canceled in s(v50). Therefore s(v

1066 Imada, Fujimori, and Tokura: Metal-insulator transitions
50) is basically scaled by @Im ((k,v)#21, which may bethen related to g and x through G↑↓ .
It was argued that if the charge fluctuation could beassumed to be suppressed as k→0, as compared withspin fluctuations, we might take
X↑↑.12X↑↓ , (2.97)
which leads to
x
xb52(
kX↑↓52(
k,k8A~k8,v5m!G↑↓~k,k8;k8,k!,
(2.98)
g
gb5(
k,k8s8
A~k8,v5m!Gss8~k,k8;k8,k!
512
x
xb12(
k,k8A~k8,v5m!G↑↑~k,k8;k8,k!. (2.99)
Therefore the Wilson ratio is given by
RW5x
xb
gb
g
52
114xb
x(k,k8A~k8,v5m!G↑↑~k,k8;k8,k!
.
(2.100)
If the Wilson ratio is close to two, it gives
(kk8
A~k8,v5m!G↑↑~k,k8;k8,k!.0. (2.101)
The static susceptibility x(q) is expressed as
x~q!52(kE
2`
` dv
2piL~k,k1q;0 !G~k,iv!G~k1q,iv!
(2.102)
with the three-point vertex function L illustrated in Fig.7. The L and four-point vertex functions G are related as
L~k,k1q,0!512T(n
(k8
G↑↓~k1q,k8;k,k81q!
3G↑~k81q,ivn!G↓~k8,ivn!. (2.103)
Therefore, if x(q) is strongly peaked around k5Q due
FIG. 7. Diagrammatic representation of the three-point vertexfunction L(k1 ,k2 ,k3 ,k4).
Rev. Mod. Phys., Vol. 70, No. 4, October 1998
to spin fluctuations, this enhancement must be due to L.Thus neglecting k and v dependence of L(k,k1Q;iv),we obtain
x~q1Q!;L~q1Q!xb~q1Q!, (2.104)
where we employed simplified notation L(q);L(k,k1q;iv) and where xb is the susceptibility without thevertex correction. From Eq. (2.103), if we neglect k andk8 dependence of G↑↓(k1q,k8;k,k81q) as denoted byG↑↓(q), we obtain
x~Q1q!;xb2~Q1q!G↑↓~Q1q!. (2.105)
When the strong peak structure of x(Q1q,v) can beapproximated as
x~Q1q,v!;1
2iv1Ds~K21q2!xb~Q1q,0!, (2.106)
we have
x~Q1q,v50 !
xb~Q1q,v50 !;xb~Q1q,v50 !G↑↓~Q1q!
;1
Ds~K21q2!. (2.107)
This type of susceptibility is justified for an order param-eter that is not a conserved quantity of the Hamiltonianand that is coupled to metallic and gapless Stoner exci-tations. Because of the coupling to the Stoner excitationEq. (2.106) contains an v-linear term in the denomina-tor, which comes from the overdamped nature of thespin fluctuation. The antiferromagnetic transition at QÞ0 may indeed belong to this class, as we discuss in Sec.II.D.9. Then the NMR relaxation rate is given as
~T1T !21; limv→0
(k
f~k!Im x~k,v50 !
v;(
kf~k!G↑↓
2 ~k!,
(2.108)
while from Eqs. (2.93), (2.95), and (2.96), neglectingG↑↑ , we obtain
s~v!}1
2iv1G, (2.109)
G;Im ( }@v21~pT !2#(k
G↑↓2 ~k!. (2.110)
Therefore, when we assume weak k dependence of xb ,the basic scaling of these two quantities is determinedfrom
J[(k
@G↑↓~k!#2}E dkkd21
~K21k2!2 }Kd24. (2.111)
This leads to
~T1T !21}A}Kd24 (2.112)
for the resistivity coefficient A defined by r5AT2. Herewe have neglected q dependences of the nuclear formfactor f(q) by assuming weak q dependence. As we see

1067Imada, Fujimori, and Tokura: Metal-insulator transitions
from Eqs. (2.99) and (2.107) the specific-heat coefficientg and the local susceptibility x for the singular part fol-low the scaling
g}x}E dqqd21
K21q2 }H 1/K for 1D2ln K for 2D2AK for 3D.
(2.113)
When the susceptibility can be described by a Curie-Weiss law
x~Q!;C
T1Q(2.114)
where C is the Curie-Weiss constant and Q the Curie-Weiss temperature, then Eq. (2.107) implies K}(T1Q)1/2, leading to
~T1T !21}A}~T1Q!d/2 22. (2.115)
Similarly, we obtain for the singular part
g}x} H 2ln~T1Q! for 2D2AT1Q for 3D. (2.116)
We note that, aside from the singular part given in Eq.(2.116), the leading term is a constant for 3D. Thesecomprise the basic framework of the antiferromagneticspin-fluctuation theory based on the Fermi-liquidtheory, as we discuss in detail in Secs. II.D.8 and II.D.9.In three dimensions, at the critical point Q50 of themagnetic transition, it leads to
~T1T !21}T21/2, (2.117)
r}T3/2, (2.118)
g}x}const2AT (2.119)
while in two dimensions at Q50 it leads to
T121}const, (2.120)
r}T , (2.121)
and
g}x}2ln T , (2.122)
as is known in the self-consistent renormalization theory(Ueda, 1977; Moriya, 1985; Moriya, Takahashi, andUeda, 1990). In particular, at the antiferromagnetic tran-sition point in some 3D metals such as b-Mn,NiS22xSex , and Ni12xCoxS2 this behavior is indeed ob-served (Watanabe, Mori, and Mitsui, 1976; Katayama,Akimoto, and Asayama, 1977; Miyasaka et al., 1997). In2D, it was claimed that Eqs. (2.120) and (2.121) repro-duce the anomalous behavior in the high-Tc cuprates, aswe discuss in Sec. IV.C.1.
As is evident from the above arguments, spin-fluctuation theory alone fails to reproduce physicalproperties near the Mott transition point if the MIT is ofthe continuous type. This is because the above treatmentof spin fluctuations takes into account only the coherentpart of the charge excitations. We also discuss in Secs.II.E.3 and II.F why the neglect of charge fluctuation,
Rev. Mod. Phys., Vol. 70, No. 4, October 1998
assumed above through vanishing charge compressibilityk;0, is not justified in metals near the Mott insulator.
Let us consider the resistivity and the frequency-dependent conductivity by considering the dependenceon the renormalization factor Z explicitly. As we dis-cussed above, the optical conductivity given by Eqs.(2.109) and (2.96) can be rewritten from the fact thatA* 21, Jk , and G(k) are all scaled by the renormaliza-tion factor Z(v):
Re s~v!}G~v!nZ~v!
v21G~v!2(2.123)
with
G~v!;Z~v!Im S}E dz Z~z !Im x~q ,z !
3Im xb~Q ,v2z !@nB~z !2nB~z2v!#
}Z~v!
nDsG~v! (2.124)
in the Born approximation at T!v . Here xb is the sus-ceptibility of the noninteracting band electrons while theBose distribution nB is defined by nB(z)51/(ebz21);G(v) is proportional to v2 in a simple Fermi liquid,while it may have v dependence G(v)}vd/2 in a widerange of v if the spin-fluctuation effect is important.This dependence is easily understood when we replacethe T dependence of G discussed above with v depen-dence. Note that the temperature dependence of G isobtained from Eqs. (2.110), (2.111), (2.114), and (2.107)as G;T2Kd24;Td/2 at T.v and Q;0. Then the v-integrated conductivity, that is, the Drude weight D5*0
`scoh(v)dv , can be sensitively dependent on thedoping concentration near the Mott insulator onlythrough the renormalization factor Z in the region with-out magnetic order when a singular k-dependent massmk is absent. This is because the spin-diffusion constantDs is not critically dependent on the doping concentra-tion and n must remain finite near the Mott insulator inthe Fermi-liquid theory due to the Luttinger theorem. Infact, because the spin-diffusion constant Ds should beconnected with the overdamped mode of the spin wave,it should remain finite near the antiferromagnetic Mottinsulator. Therefore, the Drude weight decreases to van-ish toward the Mott transition only when Z21 is criti-cally enhanced at small v. In this case, the total Drudeweight derived from Eq. (2.123) depends on the dopingconcentration d mainly in the form D}Z . This necessar-ily leads to critical enhancement of g through Eqs.(2.73a)–(2.73e) and (2.74) provided that the k mass isnot critically suppressed. At least for the paramagneticmetal region, the reduction of D near the Mott insulatortransition is necessarily accompanied by enhancement ofg in the Fermi-liquid description if mk does not havesingular k dependence. As we discuss in Sec. IV, suchbehavior in D and g contrasts with that observed inhigh-Tc cuprates because D decreases while g is not en-hanced. In the region where antiferromagnetic order ex-ists, of course, D can be reduced to zero without the

1068 Imada, Fujimori, and Tokura: Metal-insulator transitions
enhancement of g because small pockets of the Fermisurface can be arbitrarily small. This, however, is not thecase in the high-Tc cuprates. In contrast to the Drudeweight, the resistivity depends mainly on d through Im Swhile the dependence on Z is canceled. Therefore criti-cal enhancement of A has to be ascribed to Im S. It wasargued that if Z were not reduced and the k dependenceof G↑↓ could be neglected, the Kadowaki-Woods rela-tion would result from g}G↑↓ and A}G↑↓
2 .Aside from all the above phenomenological and
rather sketchy arguments, as far as the authors know, notheoretical studies have been attempted in this Fermi-liquid description with a self-consistent treatment of spinand charge fluctuations to discuss the paramagnetic re-gion near the Mott insulator. This remains for furtherstudies. In particular, the k dependence of the self-energy has to be considered seriously near a Mott insu-lator with magnetic order, while all the above argumentsbasically neglect this dependence. In Sec. II.F, we dis-cuss how the singular k dependence of the self-energyshould be considered to satisfy the scaling relation of theMott transition.
The shift of the electron chemical potential m as afunction of electron concentration n defines the chargesusceptibility xc through xc
21[]m/]n , as discussedabove. This quantity can be measured by photoemissionspectroscopy as a shift of the Fermi level as a function ofband filling n . Experimentally, the energies of photo-electrons are usually referenced to the electron chemicalpotential of the spectrometer, which is in electrical con-tact with the sample. A chemical potential shift wouldtherefore cause a uniform shift of all the core-level andvalence-band spectra if there were no interaction be-tween electrons.
Now we consider the spectral weight transfer causedby the change Dn , referring to Fig. 8 (Ino et al., 1997a,1997b). As the electron concentration increases by Dn ,spectral weight Dn should be transferred from above tobelow the chemical potential, a condition imposed by
FIG. 8. Schematic representation of the chemical potentialshift Dm induced by a change Dn in the electron concentrationn and spectral weight transfer near the chemical potential inan isotropic Fermi liquid. N* (v) is the quasiparticle densityand r(v) is the (spectral) density of states. Note that r(v)5ZN* (v) near the chemical potential.
Rev. Mod. Phys., Vol. 70, No. 4, October 1998
the sum rule, Eq. (2.58). If the line shape of the spectralfunction r(v) did not change with the increase of elec-tron concentration Dn , the spectral weight that could betransferred from above to below the chemical potentialwould be r(m)Dm85ZN* (m)Dm8 [Eq. (2.126)], whichis less than Dn5N* (m)Dm8 by the renormalization fac-tor Z , and would violate the sum rule. The rest of thespectral weight (12Z)Dn is necessarily transferredfrom well above the chemical potential to well below itthrough a change in the line shape of r(v). It is there-fore concluded that, if there is electron correlation, i.e.,if Z5@12] Re S/]vuv5m#21,1, a change in the band fill-ing necessarily leads to a change in the line shape of thespectral function.
Here it should be noted that carrier doping in realcompounds such as transition-metal oxides has to becarried out under the condition of charge neutrality be-cause of the presence of the long-range Coulomb inter-action in real systems. That is, in the case of perovskite-type transition-metal oxides, in order to dope the systemwith electrons (holes), one must usually replace A-sitemetal ions by ions with higher (lower) valencies or oxy-gen vacancies (excess oxygens). Therefore the ‘‘particle’’in the definition of the chemical potential, the derivativeof the Gibbs free energy with respect to the particlenumber, is not the bare electron or hole but an electronor hole whose long-range Coulomb interaction isscreened by the positive background charges of the sub-stituted ions or oxygen defects. This implies that micro-scopic models which neglect the long-range Coulomb in-teraction, such as the Hubbard model, may be relevantfor analysis of the chemical potential shift and thecharge susceptibility, although the long-range Coulombinteraction should influence the dynamic (spectroscopic)behaviors through S(k,v).
Below we discuss in some detail a phenomenologicalway of analyzing experimentally observed line shapes ofspectral weight. We discuss the case in which the self-energy is local and hence a(k)50, and ZkF
5Z indepen-dent of the direction of kF . In this case, D* [1/ZG ,called the quasiparticle coherence energy, defines theenergy scale below which (uv2mu!D* ) the quasiparti-cle is well defined. The quasiparticle dispersion is givenby v2m5Z@«0(k)2m# : The band is uniformly nar-rowed by the renormalization factor Z(,1), meaningthat the density of states (per unit energy) of thequasiparticles, or equivalently the effective mass m* ofthe conduction electrons, is enhanced by the factor1/Z(.1) compared with the noninteracting case. Thusthe mass enhancement factor m* /mb , where mb is thenoninteracting conduction-band mass at the chemicalpotential, is equivalent to 1/Z .
The quasiparticle peak carries spectral weight Z , andthe remaining spectral weight 12Z is distributed as an‘‘incoherent’’ background mostly at higher energies, i.e.,at larger uv2mu, as schematically shown in Fig. 9. Itshould be noted that the k-integrated spectral functionr(v) at v;m is not affected by the local self-energy cor-rection, i.e., r(m)5Nb(m), where Nb(v) is the densityof states of the noninteracting band, because the mass

1069Imada, Fujimori, and Tokura: Metal-insulator transitions
enhancement factor 1/Z is canceled out by the quasipar-ticle spectral weight Z . Therefore one can claim that ifr(m) is different from Nb(m) there must be k depen-dence in the self-energy, i.e., the self-energy should benonlocal. This is the case not only for a Fermi liquid butalso for a non-Fermi liquid. Therefore, as shown in Fig.9, if Z is k independent throughout the quasiparticleband, the quasiparticle band in the spectral functionr(v) is narrowed by a factor Z with the peak heightunchanged, resulting in the loss of spectral weight 12Z from the coherent quasiparticle band region. Thelost spectral weight 12Z is distributed as incoherentweight at higher uv2mu.
Although the original Fermi-liquid theory assumes astructureless incoherent part and neglects its contribu-tion to low-energy excitations, recent studies describedbelow in Secs. II.D.4, II.D.6, II.E, II.F, and II.G haveclarified the importance of the growing weight of inco-herent contributions. Based on the Fermi-liquid descrip-tion, a phenomenological treatment of coherent and in-coherent parts on an equal footing has been given(Kawabata, 1975; Kuramoto and Miyake, 1990; Miyakeand Narikiyo, 1994a, 1994b; Narikiyo and Miyake, 1994;Narikiyo, 1996; Okuno, Narikiyo, and Miyake, 1997).This approach may be justified when the incoherent partdescribed by ‘‘upper’’ and ‘‘lower’’ Hubbard bands giveserious renormalization to the quasiparticle coherentpart.
In discussing Eq. (2.72) above, we ignored the k de-pendence of the self-energy for simplicity. However, theeffect of electron correlation is not restricted to eachatomic site but is generally extended over many atomicsites, necessitating a k-dependent self-energy. The de-gree of nonlocality of the self-energy generally increasesas the range of interaction increases. Nevertheless, eventhe on-site Coulomb interaction included in the Hub-bard model leads to some k dependence in the self-energy through the intersite hybridization term. In par-ticular, in cases where there is a nesting feature in theFermi surface, the self-energy should show an anomalyfor k around the nesting wave vector. Because of this,the k dependence of the self-energy is more pronouncedfor low (one or two) dimensions, since the nesting con-dition is more easily satisfied. The effect of antiferro-magnetic fluctuation on the spectral function arisingfrom Fermi-surface nesting was discussed for the 2DHubbard model originally by Kampf and Schrieffer
FIG. 9. Spectral function r(v) for a constant renormalizationfactor Z . Nb(v) is the band density of states, mb is the bandmass, and mk is the k mass.
Rev. Mod. Phys., Vol. 70, No. 4, October 1998
(1990) and more recently by Langer et al. (1995) andDeisz et al. (1996).
The density of states at the chemical potential r(m) ismodified from the noninteracting value Nb(m) as
r~m!/Nb~m!5mk /mb , (2.125)
which means that k dependence of the self-energy isnecessary to have r(m)ÞNb(m) (Greef, Glyde, andClements, 1992). The ratio between the density of statesr(m) and the density of states of quasiparticles N* (m)5(m* /mb) Nb(m) is given by Z (Allen et al., 1985),
r~m!5ZN* ~m!. (2.126)
That is, the density of states at the chemical potential isreduced from the quasiparticle density of states by thequasiparticle residue Z . This is a special case of the re-lationship between the spectral function and the energydistribution function of quasiparticles, Eq. (2.72).
In the limit of large dimensionality or large latticeconnectivity, the k dependence of the self-energy is lostbecause the fluctuation of the neighboring sites is aver-aged out and the central atom feels only the averagefield from the neighboring sites without fluctuation. Thisis described in greater detail in Sec. II.D.6. In that case,the spectral weight at the chemical potential, r(m), is notinfluenced by electron correlation. It is also expectedthat the k dependence of the self-energy will becomeless important for a large orbital degeneracy (Kuramotoand Watanabe, 1987).
In the definition of the k dependence of the self-energy, one must define the reference mean-field stateto which the self-energy correction is applied. Such amean-field state is either the band structure calculatedusing the local-(spin-)density approximation (LDA orLSDA) or that calculated using the Hartree-Fock ap-proximation. In the Hartree-Fock approximation, thenonlocality of the exchange interaction is properly dealtwith and the nonlocality of the electron-electron inter-action is already included on the mean-field level (andnot beyond the mean-field level) in the one-electron en-ergy «0(k), so that S(k,m);0. In the L(S)DA, on theother hand, the exchange potential is approximated by alocal potential. That is, the potential at a spatial point ris a function of the electron (and spin) densities at this r,i.e., Vs(r)5fs@n↑(r),n↓(r)# . Therefore S(k,m) may besubstantially different from zero, meaning that S(k,m)will have to be taken into account if one analyzes pho-toemission spectra starting from the LDA band struc-ture.
For the free-electron gas, the LDA gives «0(k) almostidentical to the noninteracting dispersion «0(k)5\2k2/2me , while the Hartree-Fock approximationyields
«0~k!5\2k2
2me2
2e2
pkFS 1
21
12x2
4xlnU 11x
12x U D ,
(2.127)
where x[k/kF (Ashcroft and Mermin, 1976). There-fore, if one starts from the LDA, S(kF ,m)2S(0,m)52e2kF /p , meaning that the occupied bandwidth is in-

1070 Imada, Fujimori, and Tokura: Metal-insulator transitions
creased by ;2e2kF /p compared to the LDA bandstructure due to the effect of nonlocal exchange. In fact,the screening effect, which is completely neglected in theHartree-Fock approximation and can be treated in theRPA, will reduce the S(kF ,m)2S(0,m) to some extent,but such a screening effect would be weak when theelectron density is low, as is the case in most of themetallic transition-metal oxides. Since kF5(3n/8p)1/3
;1/2r , where r is the average distance between nearestelectrons, S(kF ,m)2S(0,m);e2/p r . That is, the totalbandwidth is increased by ;S(kF ,m)2S(0,m);e2/ rdue to the exchange contribution from the long-rangeCoulomb interaction. If we consider that the long-rangeCoulomb interaction is screened by the electric polariza-tion of constituent ions, represented by the optical di-electric constant «` , which is ;3 –5 in oxides, the bandwidening becomes ;e2/«`r;0.5 eV (Morikawa et al.,1996). Equation (2.127) means that for small kF the sec-ond term (exchange energy }kF) dominates the firstterm (kinetic energy }kF
2 ), i.e., for large r . Thereforethe nonlocal exchange is important in systems with lowcarrier density. In ordinary metals and alloys, the carrierdensity is high enough (kF is large) that the kinetic en-ergy dominates Eq. (2.127) and the nonlocal exchangecontribution is negligible, explaining why the LDAworks well in ordinary metals and alloys. The increase ofthe bandwidth due to nonlocal exchange is also foundusing a tight-binding Hamiltonian if one treats the inter-site Coulomb interaction in the Hartree-Fock approxi-mation: It contributes through 2Vij^ci
†cj& to the transferintegral t ij , where Vij is the intersite Coulomb energy,thereby effectively increasing ut iju.
2. Hartree-Fock approximation and RPAfor phase transitions
The Hubbard Hamiltonian (1.1a) is rewritten as
H5HK1HU , (2.128a)
Rev. Mod. Phys., Vol. 70, No. 4, October 1998
HK5(s
(ij
c is† $Kij2@m1~22y !U/4#d ij%cjs ,
(2.128b)
HU5U
4 (i
@y~ci↑† ci↑1ci↓
† ci↓21 !2
12~22y !ci↑† ci↓
† ci↓ci↑# , (2.128c)
where Kij is 2t for the pair (i ,j) summed in Eq. (2.37b).Here y is an arbitrary constant and we have omitted aconstant term U/4. For this Hamiltonian, the partitionfunction (2.41a) can be expressed in the path integral ofa noninteracting system through the Stratonovich-Hubbard (SH) transformation. Several formally differ-ent but equivalent representations through different SHtransformations are possible. In a simple and ordinarymean-field approximation, one can introduce only Ds bytaking y50 to discuss magnetic ordering. Below weshow a general choice of SH transformations in whichboth Dc and Ds are introduced to represent possiblecharge and spin fluctuations separately. We use the iden-tity
15E DDsi*DDsi expF222y
2U (i
~2Dsi* 2Uci↑† ci↓!
3~2Dsi2Uci↓† ci↑!G , (2.129a)
and
15E dDciexpF2y
4U (i
„4Dci2iU~ci↑† ci↑1ci↓
† ci↓21 !…
3„4Dci2iU~ci↑† c↑1ci↓
† ci↓21 !…G , (2.129b)
for complex c-number Dsi and real variable Dci . Thenwe can rewrite the partition function in the coherent-state representation using the Grassmann variables,
Z5E D@c ,c#DDsi~t!DDsi* ~t!DDci~t!expS 2E0
b
dtF(i
c is
]
]tc is2(
ijc is~Kij2md ij!c js
12U
~22y !(i
Dsi* ~t!Dsi~t!14y
U (i
Dci~t!22~22y !(i
@Dsi* ~t!c i↓c i↑1Dsi~t!c i↑c i↓#
22iy(i
Dci~t!~ c i↑c i↑1c i↓c i↓21 !G D . (2.130)
The variables Ds and Dc are called Stratonovich fields orStratonovich variables. The normalization constants inEqs. (2.129a) and (2.129b) are absorbed in DDc andDDs*DDs . Although this is an identical transformation, aStratonovich transformation of this type readily takes
account of magnetic symmetry breaking, as we shall seebelow. The partition function may also be expressedonly through Dsi without introducing Dci by using Eqs.(2.129a) and (2.37a)–(2.37d). These different choicesshould give the same result if the integration over the

1071Imada, Fujimori, and Tokura: Metal-insulator transitions
SH variables D is rigorously performed. However, ap-proximations like the mean-field approximation lead ingeneral to different results.
In the Fourier-transformed form, the partition func-tion is further rewritten by using the spinor notation
C[~c↑ ,c↓!, (2.131a)
C[S c↑c↓
D , (2.131b)
in the form
Z5E D@C ,C#DDs* DDsDDc e2S, (2.132a)
S5CQC12~22y !
UDs* Ds1
4y
UDc
212iyDc ,
(2.132b)
Q5S Q↑↑1Q↑↑8 Q↑↓
Q↓↑ Q↓↓1Q↓↓8D , (2.132c)
with
Q↑↑~k ,k8!5dkk8~2ivn1«0~k!2m!, (2.133a)
Q↓↓~k ,k8!5dkk8~2ivn1«0~k!2m!, (2.133b)
Q↑↓~k ,k8!52~22y !Ds~k2k8!, (2.133c)
Q↓↑~k ,k8!52~22y !Ds* ~k2k8!, (2.133d)
Q↑↑8 ~k ,k8!5Q↓↓8 ~k ,k8!522iyDc~k2k8!, (2.133e)
where k[(k,ivn). In Eqs. (2.132a), (2.132b), and(2.132c), the products CQC and D* D are abbreviatedforms of the matrix products
CQC[1
~bV ! (k,k8
(n ,n8
C~k,vn!Q~k,vn ;k8,vn8!
3C~k8,vn8!
and
D* D[1
bV (k
(n
D* ~k,vn!D~k,vn!,
respectively. The noninteracting dispersion «0(k) is theFourier transform of K.
After Fourier transformation, Dc(k)5Dc* (2k) is sat-isfied. Therefore the functional integration over Dc(k)may be written as
DDc[)k
dDc~k !5dDc~k50,vn50 !
3)k
)vn.0
dDc* ~k,vn!dDc~k,vn!.
After integrating the Grassmann variables C and C ,we are led to
Z~D ![E DDs* DDsDDc ZQ~D !e2SD, (2.134a)
Rev. Mod. Phys., Vol. 70, No. 4, October 1998
ZQ~D ![E DCDC e2CQC
5det Q5exp@ ln det Q01ln det~11Q021Q1!#
5exp@2Tr ln~2G0!1Tr ln~12G0Q1!# ,
(2.134b)
SD[2~22y !
UDs* Ds1
4y
UDc
212iyDc , (2.134c)
where Tr ln A5ln det A is used. In Eq. (2.132c), the ma-trix Q is decomposed to
Q5Q01Q1 , (2.135a)
Q0[S Q↑↑~k ,k8!, 0
0, Q↓↓~k ,k8!D , (2.135b)
Q1[S Q↑↑8 ~k ,k8! Q↑↓~k ,k8!
Q↓↑~k ,k8! Q↓↓8 ~k ,k8!D . (2.135c)
The noninteracting Green’s function is defined as
G05S G0↑ 0
0 G0↓D , (2.136a)
G0s~k ,k8!5dkk8„ivn2j0~k!…21, (2.136b)
j0[«0~k!2m . (2.136c)
D or D* -dependent terms of S have the form
2~22y !
U (k
Ds* ~k !Ds~k !14y
U (k
vn.0
Dc* ~k !Dc~k !
14y
UDc~0 !212iyDc~0 !2Tr ln@12G0Q1# . (2.137)
The mean-field (Hartree-Fock) approximation of themagnetic ordering is based on several approximations.The first important assumption is that only static fluctua-tions of Ds or Dc are important, so that Dc ,s(k,vn) atvnÞ0 may be ignored. This static approximation dis-cards dynamic fluctuations though they are crucial in un-derstanding anomalous features of metals near the Mottinsulator. Another approximation in the Hartree-Focktheory is that it determines the static values Dc(vn50)and Ds(vn50) by the saddle-point approximation.More precisely, it is obtained by replacing the functionalintegral of e2S over D and D* with the saddle-pointestimation of e2S at D(0) and D* (0) obtained from]S/]D* 50. So far, we have discussed possible spin andcharge fluctuations by introducing Dc and Ds . Hereafter,for simplicity, we take Dc(0)[yDc(0) and Ds(0)[(22y)Ds(K) with the staggered antiferromagnetic order-ing wave vector k5K. The condition of extremum isexplicitly written as
]S
]Ds*5
2Ds
U1TrF ~12G0Q1!21G0
]Q1
]Ds* ~0 !G50
(2.138a)

1072 Imada, Fujimori, and Tokura: Metal-insulator transitions
and
]S
]Dc*5
4Dc
U1Tr~12G0Q1!21G0
]Q1
]Dc~0 !12i50. (2.138b)
Equation (2.138a) is nothing but the self-consistent equation for magnetic ordering at the wave vector K, which maybe rewritten as
Ds~0 !
U5
1bV (
k,vn
Ds~0 !
~2ivn1«02m!~2ivn2«02m!2uDs~0 !u2 (2.139)
or
Ds~0 !
U5
1bV (
k,vn
Ds~0 !
~2ivn1A«0~k!21uDs~0 !u22m!
31
~ ivn2A«0~k!21uDs~0 !u22m!. (2.140)
where we have assumed «0(k1K)52«0(k) as in thecase of the antiferromagnetic order of the nearest-neighbor Hubbard model. The extension to more gen-eral cases is straightforward. The quasiparticle excitationfrom this broken-symmetry state is given by the disper-sion
Rev. Mod. Phys., Vol. 70, No. 4, October 1998
E~k!56A«0~k!21uDs~0 !u22m . (2.141)
The saddle-point solution of Dc(0) for Eq. (2.138b)gives
Dc~0 !5Ui
4~^n&21 ! (2.142)
where ^n& is the average electron density. The single-particle Green’s function in the Hartree-Fock approxi-mation is
Gss8~k,vn ;k8,vn8
1073Imada, Fujimori, and Tokura: Metal-insulator transitions
x~q ,vm!514 ^TS1~q ,vm!S2~q ,vm!& (2.147)
51
4bVZE DDs* DDs
3e2SD]2
]Ds* ~q ,vm!]Ds~q ,vm!ZQ~D ! (2.148)
51
2bVU S 2U
^Ds* ~q ,vm!Ds~q ,vm!&2bV D(2.149)
is obtained from Eqs. (2.134a)–(2.134c) after partial in-tegration. In the paramagnetic phase, up to second orderin Q1 for Eq. (2.134), we obtain
ZQ~D !.exp@2Tr ln~2G0!2Tr G0Q1
2Tr G0Q1G0Q1# . (2.150)
The term linearly proportional to Q1 (the second term)vanishes and the last term is
Tr G0Q1G0Q158(q,m
xb~q,vm!Ds* ~q,vm!Ds~q,vm!,
(2.151)
where xb(q,vm) is the spin susceptibility at U50.Therefore, combined with the term SD in Eq. (2.134),^Ds* Ds& is estimated as
^Ds* ~q,vm!Ds~q,vm!&5U
2bV
1122Uxb~q,vm!
,
(2.152)
which leads to
x~q,vm!5xb~q,vm!
122Uxb~q,vm!. (2.153)
This is nothing but the RPA result. The Hartree-Fockphase diagram calculated by using the above procedureis shown in Fig. 10 for the 3D nearest-neighbor Hubbardmodel (Penn, 1966) and in Fig. 11 for the 2D Hubbardmodel (Hirsch, 1985b). Here it is assumed that the or-dering vector K is either antiferromagnetic [K5(p ,p)or (p,p,p)] or ferromagnetic [K5(0,0) or (0,0,0)] withthe lattice constant unity. The characteristic feature is arather wide region of antiferromagnetic and ferromag-netic metals near the Mott insulator, n51. We discussmore complicated types of spin or charge orderings inSec. II.H.3 and IV.
So far we have restricted our choice of theStratonovich-Hubbard transformation with Ds corre-sponding to the decoupling of ci↑
† ci↓† ci↓ci↑ into ci↑
† ci↓ andci↓
† ci↑ as in Eq. (2.129a). However, this transformationmakes possible symmetry breaking only in the xy planeof the spin space. To retain the SU(2) symmetry even
after the SH transformation, a vector SH field DW s may beintroduced (C. Herring, 1952; Capellmann, 1974, 1979;
Rev. Mod. Phys., Vol. 70, No. 4, October 1998
Korenman, Murray, and Prange, 1977a, 1977b, 1977c;Schulz, 1990c), in which case the partition function Zgiven in Eq. (2.130) is rewritten as
FIG. 10. Hartree-Fock phase diagram of three-dimensionalnearest-neighbor Hubbard model in the plane of U and a halfof filling ^n& (Penn, 1966). Here the ordinate C0 /E9 representsU/2t in our notation. ANTI, antiferromagnetic; PARA, para-magnetic; FERRO, ferromagnetic; S. FERRI, spiral ferrimag-netic; and S.S.SDW, spiral spin-density-wave phases.
FIG. 11. Hartree-Fock phase diagram of two-dimensionalnearest-neighbor Hubbard model in the plane of U/t and fill-ing ^n&[r (Hirsch, 1985a, 1985b). P, A, and F represent para-magnetic, antiferromagnetic, and ferromagnetic phases, re-spectively. The possibility of incommensurate order is notconsidered here.

1074 Imada, Fujimori, and Tokura: Metal-insulator transitions
Z5E D@c ,c#DDW si~t!DDW si* ~t!DDci~t!
3expF2E0
b
dtS (i
c is
]
]tc is
2(ij
c is~Kij2md ij!c js
12~22y !
3U (i
DW si* ~t!•DW si~t!
2~22y !
3 (i
~DW si* •c isSss8c is8
1DW si~t!•c isSs8sc is8!14y
U (i
Dci~t!2
22iy(i
Dci~t!~ c i↑c i↑1c i↓c i↓21 ! D G (2.154)
where DW s•Sss8 is an internal product with
~Sss8!x5ds↑ds8↓1ids↓ds↑ , (2.155a)
~Sss8!y5ds↑ds8↓2ids↓ds↑ , (2.155b)
~Sss8!z512
~ds↑ds8↑2ds↓ds8↓!. (2.155c)
Here we note that Dci is real while DW si is a complex
three-dimensional vector. In particular, DW si is rewrittenas
DW si5Ds0eiu inW i (2.156)
where Ds0 is a scalar for the amplitude of this Hartree-Fock field while u i is the phase and nW is the unit vector
to specify the direction of DW s in the 3D spin space. In themagnetically ordered phase, Ds0 has a finite amplitude,so that the excitation of this amplitude mode has a finitegap. In contrast, u i and nW i represent the gapless excita-tion mode. Therefore low-energy excitations are ex-hausted by the excitations through u and nW . Even whenthere is no symmetry breaking, provided that the corre-lation length is sufficiently long, the low-energy excita-tion can be described only through u and nW . This is in-deed the case for low-dimensional systems below themean-field transition temperature TMF where quantumfluctuations destroy the symmetry breaking while theamplitude itself is developed below TMF . The low-energy action described by u and nW frequently containstopological terms that cause singular and nonlinear ex-citations in the continuum limit (for example, for 1D;Haldane, 1983a, 1983b). Except in the 1D case, the roleof these topological terms, such as the Berry phase term,has not been fully clarified yet. We discuss the low-energy effective Hamiltonian for this case later.
The Hartree-Fock approximation is a self-consistentapproach which satisfies microscopic conservation laws
Rev. Mod. Phys., Vol. 70, No. 4, October 1998
for particle number, energy, and momentum. Somehigher-order diagrams were also considered in additionto the Hartree-Fock diagram so as to retain the aboveconservation laws (Bickers and Scalapino, 1989; Bickersand White, 1991), which may be viewed as an attempt toinclude perturbatively fluctuation effects that are ig-nored in the Hartree-Fock approximation. This is calledthe fluctuation exchange (FLEX) approximation.
3. Local-density approximation and its refinement
In a number of ways, as we see in this article, theoret-ical understanding of strongly correlated systems hasbeen made possible through studies on effective latticeHamiltonians derived from the tight-binding approxima-tion for a small number of bands near the Fermi level.Although the simplification to effective tight-bindingHamiltonians is useful to elucidate many universal fea-tures of correlation effects, detailed experimental datasuch as those from photoemission often have to be ana-lyzed from a more original Hamiltonian which containsmore or less all the electronic orbitals in the continuumspace under the periodic potential of the real lattice.This is because high-energy spectroscopy reflects the in-dividual character of the compounds. Electronic struc-ture calculations starting from atoms and electrons withtheir mutual Coulomb interactions in the continuumspace are sometimes called first-principles calculationsor ab initio calculations. The expected role of these first-principles calculations is not restricted to quantitativeanalyses of high-energy spectroscopy and the structuralstability of lattices but is also extended to derive or jus-tify starting effective Hamiltonians of simplified latticefermion models for each compound and to bridge thegap between high- and low-energy physics. For example,band-structure calculations provide a generally acceptedway of determining parameters of effective lattice mod-els if carefully examined. It is also expected that thephase of the ground state will be correctly reproducedwithout introducing any parameter fitting. In fact, wedescribe below several treatments that have been suc-cessful in reproducing correct ground states oftransition-metal compounds.
As it stands, ‘‘first-principles’’ calculation does notmean a rigorous, practical way of determining electronicstructure, contrary to what one might imagine from itsterminology. Basically, three types of approximationshave been employed to make the ‘‘first principles’’ cal-culation tractable in practice.
One is the configuration-interaction (CI) method, inwhich small clusters under the atomic potential with allthe relevant electronic orbitals are solved by the diago-nalization of a Hamiltonian matrix. This method is exactbut applicable only for small clusters, typically a few unitcells. Therefore it frequently underestimates the effectof electronic kinetic energy and coherence. We furtherdiscuss details of the configuration-interaction methodin Sec. III.A.1. This method has a computational simi-larity to the exact diagonalization method reviewed inSec. II.E.

1075Imada, Fujimori, and Tokura: Metal-insulator transitions
The second type of approximation is the Hartree-Fock approximation, which is one of the best ways toapproximate a true many-body fermion state by a singleSlater determinant. By taking a single Slater determi-nant as a variational state of the many-body Hamil-tonian
H52(i
\2
2meD i1(
iVlat~ri!1(
ij&
e2
uri2rju,
(2.157)
one determines the single-particle state c l(ri) from theminimization of energy by solving the self-consistentequation
F2\2
2mD1Vlat~r!1(
l8E dr8
e2
ur2r8uuc l8~r8!u2Gc l~r!
2(l8
8F E dre2
ur2r8uc l8
* ~r8!c l~r8!Gc l8~r!
5« lc l~r!. (2.158)
Here, l and l8 specify quantum numbers including or-bital degrees of freedom, and the sum (8 is taken onlyover l8, which has the same spin as that of l . The atomicperiodic potential of the lattice is denoted as an externalone by Vlat . The electron-electron Coulomb interactionis considered through the third term, the Hartree term,and the fourth (last) term, the exchange term. The ex-change term can be rewritten as
Vexl ~r!c l~r!, (2.159)
Vexl ~r!5E dr8 rex
l ~r,r8!e2
ur2r8u(2.160)
with
rexl ~r,r8!52
c l* ~r!c l~r8!( l88 c l8
* ~r8!c l8~r!
uc l~r!u2 (2.161)
where the exchange interaction is expressed as if it werea static Coulomb term. A computational difficulty of theHartree-Fock approximation is that the exchange poten-tial Vex
l (r) depends on the solution c l(r) itself, and dif-ferent exchange potentials must be taken for each quan-tum number l while the number of states l to beconsidered increases linearly with the system size. Itshould be noted that the Hartree-Fock approximationdoes not take into account correlations between elec-trons with different spins and hence an up-spin electronbehaves independently of the down-spin electrons ifthere is no symmetry breaking of spins such as the spin-density wave state as in Sec. II.D.2. To take into accountshort-ranged correlation effects of opposite-spin elec-trons, which is important in strongly correlated systems,one has to go beyond the Hartree-Fock approximation.
The third approximation is the local-density approxi-mation, which gives a basic starting point for widelyused band-structure calculations. The local-density ap-proximation is based on the density-functional theory ofHohenberg, Kohn, and Sham (Hohenberg and Kohn,
Rev. Mod. Phys., Vol. 70, No. 4, October 1998
1964; Kohn and Sham, 1965). A general and exact state-ment of the density-functional theory is that the trueground-state energy is obtained by two steps: First, onefinds the many-body state C@n(r)# that minimizes theexpectation value of the total many-body Hamiltonian,Eg@n(r)# , under given single-particle density n(r). Sec-ond one minimizes Eg@n(r)# as a functional of n(r). Animportant point is the existence of the energy functionalEg@n(r)# . Of course these two steps are difficult to per-form in practice. A basic underlying assumption in prac-tical applications of the Kohn-Sham theory is thatEg@n(r)# can be calculated by starting from single-particle states given by a single Slater determinant thatreproduces n(r), with this single-particle state being ob-tained as a solution of the Schrodinger equation
S 2\2
2mD1V~r! Dc l~r!5« lc l~r! (2.162)
with V(r) chosen to give
n~r!5(l
uc l~r!u2. (2.163)
We discuss this procedure in greater detail below. In theoriginal many-body problem, the ground-state energy isobtained through minimization of the energy expecta-tion value
E@n~r!#5^C@n~r!#uHK1Hext1HUuC@n~r!#&(2.164)
with respect to variations of both C@n(r)# and the den-sity functional n(r), where C@n(r)# is a many-bodywave function C(r1 ,r2 ,. . . ,rN) that satisfies
E dr2 dr3 ,. . . ,drNuC@n~r!#u25n~r1!. (2.165)
The kinetic energy, interaction energy, and externalatomic potential are denoted as HK , HU , and Hext , re-spectively. After minimization with respect to C withfixed n(r), the minimum in terms of n(r) is obtainedfrom
dEg@n~r!#
dn~r!50, (2.166)
where Eg@n(r)# is the minimized value with respect toC. An important point here is that, in this step, theground-state energy is calculated only from the energyfunctional Eg@n(r)# without any detailed knowledge ofthe many-body wave function. Of course, the functionalform of Eg is not easy to obtain.
When we can assume that the first minimization pro-cedure to obtain Eg@n(r)# may be performed within thesingle Slater determinant under an appropriate fictitiousexternal potential V(r), the minimization may be per-formed from the minimization of the energy functional,
E@n~r!#5EK@n~r!#1E dr Vlat~r!n~r!
1e2
2 E dr dr8n~r!n~r8!
ur2r8u1E dr Vex~r!n~r!,
(2.167)
1076 Imada, Fujimori, and Tokura: Metal-insulator transitions
with
Vex~r
1077Imada, Fujimori, and Tokura: Metal-insulator transitions
the Fermi level for MnO by allowing antiferromagneticorder (Terakura, Oguchi, Williams, and Kuller, 1984). Italso succeeds in reproducing the antiferromagnetic insu-lating state of LaMO3 (M5Cr,Mn,Fe,Ni) (Sarma et al.,1995).
However, the LSDA fails to reproduce the antiferro-magnetic ground state of many strongly correlated com-pounds such as NiS, La2CuO4, YBa2Cu3O6, LaTiO3,and LaVO3. Even in MnO, strongly insulating behaviorobserved well above the Neel temperature implies thatthe charge-gap structure is not a direct consequence ofantiferromagnetic order, although antiferromagnetic or-der is needed to open a gap in the LSDA calculation.
The LDA band-structure calculation makes a drasticapproximation in that the exchange-correlation energyVex(r) is determined only from the local electron den-sity n(r). When the electron density n(r) has a strongspatial dependence, this approximation breaks down.This is indeed the case for strongly fluctuating spin andcharge degrees of freedom in correlated metals. To im-prove this local-density approximation, the gradient ex-pansion of n(r) may be considered to take into accountthe nonlocal dependence of Vex(r) on n(r8), where r8Þr. Langreth and Mehl (1983), Perdew and Wang(1986), Perdew (1986), and Becke (1988) developed away of including the gradient expansion of n(r) in theexchange energy by keeping the constraint of negativedensity of the exchange hole everywhere in space with atotal deficit of exactly one electron. This is called thegeneralized gradient approximation (GGA) method. Itwas applied to reproduce the bcc ferromagnetic phase ofFe by Bagno, Jepsen, and Gunnarson (1989). Recentlythis method was applied to the transition-metal com-pounds FeO, CoO, FeF2, and CoF2 with partial im-provements of the LDA results. It was also applied totransition-metal oxides with 3D perovskite structure,LaVO3, LaTiO3, and YVO3 (Sawada, Hamada, Tera-kura, and Asada, 1996). It showed improvements in re-producing the band gap in LaVO3, but the ground statewas not correct for YVO3 and LaTiO3.
A serious problem in LDA and LSDA calculations isthat the self-interaction is not canceled between the con-tributions from the Coulomb term and the exchange in-teraction term because of the drastic approximation inthe exchange-interaction term. This produces a physi-cally unrealistic self-interaction, which makes the ap-proximation poor for strongly correlated systems. Per-dew and Zunger (1981) proposed imposing a constraintto remove the self-interaction. This method of self-interaction correction (SIC) was applied to the Hubbardmodel as well as to models of transition-metal oxideswith quantitative improvement of the band gap and themagnetic moment for MnO, FeO, CoO, NiO, and CuO(Svane and Gunnarsson, 1988a, 1988b, 1990).
In principle, the Kohn-Sham equation provides theprocedure to calculate exactly the ground state at theFermi level. However, it does not guarantee that excita-tions will be well reproduced. A possible way of improv-ing estimates for the excitation spectrum is to combinethe Kohn-Sham equation with a standard technique for
Rev. Mod. Phys., Vol. 70, No. 4, October 1998
many-body systems by introducing the self-energy cor-rection to the single-particle Green’s function obtainedfrom LDA-type calculations. This attempt is called the‘‘GW’’ approximation (Hedin and Lundqvist, 1969). Itwas applied to NiO (Aryasetiawan, 1992), although sys-tematic studies on transition-metal compounds are notavailable so far (for a review, see Aryasetiawan andGunnarsson, 1997). Effects of local three-body scatter-ing on the self-energy correction have also been exam-ined (Igarashi, 1983).
To counter the general tendency to underestimate theband gap of the Mott insulator in LDA-type calcula-tions, a combination of the LDA and a Hartree-Fock-type approximation called the LDA1U method wasproposed (Anisimov, Zaanen, and Andersen, 1991). TheCoulomb interaction for double occupancy of the samesite as in the Hubbard model requires a large energy Uif the eigenstate is localized as compared to extendedstates. This is not correctly taken into account in theLDA calculation, which estimates the exchange interac-tion using information from the uniform electron gas,which is appropriate only for extended wave functions.In the LDA1U approach the contribution of the inter-action proportional to U is added to the LDA energy inan ad hoc way when the orbital is supposed to be local-ized. The method thus combines arbitrariness in specify-ing the localized orbital with a drastic approximation inthe treatment of the U term (for example, the Hartree-Fock approximation was used.) The LDA1U methodhas the same difficulty as the other many-body ap-proaches in the tight-binding Hamiltonian because itdoes not necessarily provide a reliable way of treating Uterm, while, in a sense, all the important effects of strongcorrelation are relegated to this term. Another problemof this method is that the estimate of U may depend onthe choice of the basis (Pickett et al., 1996). Differentchoices of local atomic orbitals such as the linear muffin-tin orbital (LMTO) and linear combination of atomicorbitals (LCAO) give different U because the definitionof the orbital becomes ambiguous whenever there isstrong hybridization.
To take account of frequency-dependent fluctuationsignored in the LDA method, Anisimov et al. combinedthe LDA method with the dynamic mean-field approxi-mation (the d5` method described in Sec. II.D.6;Anisimov et al., 1997). They treated strongly correlatedbands by the dynamic mean-field approximation and de-scribed other itinerant bands by the LDA with a linearmuffin-tin orbital basis. Recently, the exchange-correlation energy functional was calculated as the sumof the exact exchange energy and a correlation energygiven from the RPA without introducing the local-density approximation (Kotani, 1997).
As we have seen above, in this decade substantialprogress has been achieved in the band-structure calcu-lation of transition-metal compounds. However, it is stillnot sufficient to reproduce the Mott insulator correctlyin strongly correlated materials such as La2CuO4 andYBa2Cu3O6. A more serious problem lies in the descrip-tion of the metallic state near the Mott insulator, where

1078 Imada, Fujimori, and Tokura: Metal-insulator transitions
spin and charge fluctuations play crucial roles even inthe ground state, while the band-structure calculationhas difficulty in including such fluctuation effects. Forexample, the continuous MIT should be described bythe continuous reduction of coherent excitation whenapproaching the insulator, while the available ap-proaches mentioned in this subsection fail to describeimportant contributions from the increasing weight ofincoherent part.
4. Hubbard approximation
To gain insight into the original suggestion by Mott,Hubbard (1963) developed the coherent-potential ap-proximation (CPA), which is combined with a Hartree-Fock-type approximation to address the problem of themetal-insulator transition. The CPA is a technique de-veloped to treat the effects of random potentials (see,for example, Lloyd and Best, 1975), which Hubbard hadalready developed before its widespread application(see also Kawabata, 1972). In the Hubbard approxima-tion, the Stratonovich-Hubbard transformation, usingonly the charge fluctuations Dci(t) in Eq. (2.130), is em-ployed to obtain a static approximation represented bythe Stratonovich-Hubbard field; the static field is re-garded as a random potential in the CPA. Below somedetails of the Hubbard approximation are given.
In the CPA, the t dependence of Dc(r ,t) is neglectedin the same way as in the Hartree-Fock approximation.After integrating out the Grassmann variables, one re-places Dc(r ,t) with the t-independent constants Dc(r),which is called the static approximation. In contrast tothe Hartree-Fock approximation, Dc(r) is assumed totake more than one value Dc
(l) (l51,2,.. .) in a randomway from site to site. In fact, in the Hubbard approxi-mation, two values 0 and Ui/4 are assumed for Dc .These two values are obtained from the saddle-point so-lution (2.142) if we take either ^n&51 or ^n&52. Thesetwo values can intuitively be understood because anelectron at a doubly occupied site feels a static interac-tion potential U while its potential is absent for a singlyoccupied site if all the other electrons are frozen so thatdynamic effects can be neglected. (As we shall see laterin this subsection, in the CPA, dynamic effects are par-tially taken into account in another way by introducingafterwards an v-dependent self-energy S as determinedvariationally in the single-particle excitation spectrum.)As in Eq. (2.130) the partition function is first assumedto have the form
Z5(l
Zl , (2.178a)
Zl5Pl)s
E DcsDcsexpF2E dxcs~x !]
]tcs~x !
2E dx cs~x !~K2m!cs~x !
14iDc~ l !~n↑~x !1n↓~x !21 !2
4U
Dc~ l !2G , (2.178b)
Rev. Mod. Phys., Vol. 70, No. 4, October 1998
where the spatial (or wave-number) dependence of theself-energy is neglected. The probability to have thevalue Dc
(l) is denoted by Pl . Originally, Pl was deter-mined from the Gaussian approximation obtained fromexp@2SD# with SD in Eq. (2.134c). However, in the Hub-bard approximation, as we describe below, Pl is takenrather differently, in order to consider nonlinear fluctua-tions ignored in the Gaussian approximation. We shallsee in Sec. II.D.6 that S is not dependent on wave num-ber in infinite dimensions, although, in general, it iswave-number dependent in finite dimensions. AlthoughS(t) is exactly calculated in infinite dimensions in Sec.II.D.6, the Hubbard approximation calculates it only ap-proximately as follows: The partition function (2.178a) isrewritten in the same manner as Eq. (2.134),
Zl5Plexp@2Tr ln~2G0!1Tr ln~12G0Q1l!#(2.179)
with
Q1l524iS Dc~ l ! 0
0 Dc~ l !D . (2.180)
This may be rewritten as
Zl5Plexp$2Tr@ ln~2G !2ln„12G~Q1l2S!…#%,(2.181)
where the Green’s function G has the form
G21~k,vn!5G021~k,vn!2S~vn!, (2.182)
with v-dependent self-energy S. Now the on-siteGreen’s function Gloc(vn) is defined as
Gloc~vn!5(k
G~k,vn!. (2.183)
Then, to include locally tractable and averaged effects inthe second term of Eq. (2.181), we rewrite it as
Zl5Plexp@2Tr$ln~2G !2ln@12Gloc~Q1l2S!#
2ln@12~G2Gloc!Tl#%# , (2.184)
where Tl is a t matrix,
Tl5~Q1l2S!@12Gloc~Q1l2S!#21. (2.185)
The CPA is regarded as the lowest-order expansion ofthe t matrix, since it neglects the last term in (2.184).Since it determines S in a variational way, the conditionfor determining S is ]Z/]S50. This leads to
(l
ZlTrH S Gloc2 2
]Gloc
]S DTlJ 50, (2.186)
from which we obtain the self-consistent equation forthe self-energy,

1079Imada, Fujimori, and Tokura: Metal-insulator transitions
S5(l
ZlQ1l$12Gloc~Q1l2S!%21Y (l
Zl$12Gloc~Q1l2S!%21. (2.187)
In the case of the Hubbard approximation for thenearest-neighbor Hubbard model at half filling, Q1150, Q125U , P151/2, and P251/2, where the numberof l’s is taken as two. When S is determined by solvingEq. (2.187), Z is obtained from Eq. (2.184) by puttingTl50. The procedure of the Hubbard approximation issummarized as follows:(1) Take a variational form of G and S.(2) Calculate Gloc using Eq. (2.183) and Zl using Eq.(2.184).(3) Calculate S from Eq. (2.187) by substituting thepresent form of S, Gloc , and Zl in the right-hand side.(4) Using the form of S obtained in step (3), calculate Gfrom Eq. (2.182).(5) From the form of G and S determined in steps (3)and (4), repeat the process from step (2) again until theiteration converges.
Because an electron feels the static potential of 0 or Uin the static approximation, it is rather obvious that itsucceeds in splitting the band into the so-called upperand lower Hubbard bands for the Mott insulating phase,as shown in the bottom of Fig. 13 for large U , while itmerges to a singly connected band for small U , as shownin the top panel of Fig. 13.
We shall see in Sec. II.D.6 that the solution in infinitedimensions is similar for the insulating phase, i.e., forlarge U . This is because dynamic charge fluctuations ne-glected in the Hubbard approximation are irrelevant inthe insulating phase. We shall also see in Sec. II.D.6 thatS can be determined rigorously in infinite dimensions byintroducing dynamic mean fields instead of static charge-Stratonovich variables. In the metallic phase, neglect ofthe dynamic charge fluctuations in the Hubbard approxi-mation is not at all justified.
A related problem in the Hubbard approximation isthat spin fluctuations are not taken into account becauseit starts from the Stratonovich-Hubbard transformation,in which there is decomposition only in the charge den-sity. In Sec. II.D.8, we discuss a similar type of CPAdeveloped for the case of decomposition into spin den-sity fluctuations. A crucial drawback of the Hubbard ap-proximation in the metallic phase is that the Fermi vol-ume is small for small doping away from the Mottinsulator, which does not satisfy the Luttinger require-ment of large Fermi volume for the Fermi-liquid de-scription.
5. Gutzwiller approximation
The Gutzwiller approximation (Gutzwiller, 1965) wasfirst applied to the MIT problem by Brinkman and Rice(1970). This approach is based on two stages of approxi-mation. We discuss the case of the Hubbard model [Eqs.(1.1a)–(1.1d)] here. First, it employs a variational wavefunction of the form
Rev. Mod. Phys., Vol. 70, No. 4, October 1998
uC&5)j
~12gnj↑nj↓!uF&, (2.188)
where F is a single-particle state represented by a Slaterdeterminant and g is a variational parameter to takeinto account the reduction of double occupancy of elec-trons at the same site. The free-fermion determinant wasoriginally taken as the Slater determinant. It may begeneralized to cases with other types of single Slater de-terminant where some symmetry is broken, as in thespin-density wave state or in the superconducting state.The ground-state energy
Eg5^CuHuC&/^CuC& (2.189)
is estimated from optimization of the parameter g andthe choice of a single Slater determinant. This estimatesatisfies the variational principle and hence gives the up-per bound of the ground-state energy.
Then an additional approximation is introduced to es-timate the ground state. When one assumes the numberof doubly occupied sites D , the interaction energy isexactly given by ^CuHUuC&/^CuC&5DU . However, thekinetic energy ^CuHtuC&/^CuC& is difficult to estimateanalytically. By neglecting the spin and charge short-ranged correlation, one can calculate the energy as afunction of D and g for a given system size N and num-ber of up spins N↑ and down spins N↓ . With «s
5^FuHtuF&, the optimization in terms of g at half fillinggives
Eg
N5q~ «↑1 «↓!1Ud , (2.190)
where d[D/N and q58d(122d). From minimizationwith respect to d , we obtain
Eg
N52u~ «↑1 «↓!u~12U/Uc!2 (2.191)
with Uc58u«↑1 «↓u at U,Uc , while at U.Uc , the in-sulating state with g51 is stabilized with Eg50. As theMIT point U5Uc is approached, the renormalizationfactor Z5q5m/m* is renormalized to zero as q512(U/Uc)2. For details of the derivation, readers are re-ferred to Vollhardt (1984). In the Gutzwiller approxima-tion, the uniform magnetic susceptibility xs , the chargesusceptibility xc , and the effective mass m* follow
xs}~12U/Uc!21, (2.192)
m* /mb}~12U/Uc!21, (2.193)
xc}~12U/Uc!, (2.194)
in the metallic region U,Uc . The MIT scenario of theGutzwiller approximation is described by mass diver-gence within the Fermi liquid. The Gutzwiller approxi-

1080 Imada, Fujimori, and Tokura: Metal-insulator transitions
mation ignores the wave-number dependence of theself-energy as well as the incoherent part of the excita-tions.
Away from half filling, for the doping concentration d(i.e., n↑[N↑ /N5n↓[N↓ /N5 1
2 2d), Eg is given by
Eg
N5q~ «↑1 «↓!1Ud (2.195)
with
q5~1/21d2d !~A22d1d1Ad !2
1/42d2 . (2.196)
This is minimized at d5rd with r5@(g12)y21#/2 andy5@2(g12)12Ag214g11#/@g(g14)# where g54(U/Uc21). At U.Uc , we obtain
Eg
N5~ «↑1 «↓!~r111y !„4d18~11r !d2
…2Urd1O~d3!
(2.197)
for d!1. Therefore the FC-MIT takes place at U.Uc atd50 with a change in d. At U.Uc , q has the form q5q1d1q2d2 with
q1}~U2Uc!21/2 (2.198)
near U5Uc . The charge susceptibility
xc5F 1N
~]2Eg /]d2!G21
remains finite at dÞ0 and limd→10xc5p/@16( «↑1 «↓)#with p5g2/@(11g)22Ag214g11# for U.Uc . At U5Uc , the charge susceptibility has an exponent given byxc}d2/3. The above mean-field exponents are not thesame as the exponent in 1D and 2D, as is discussed inSec. II.E and Sec. II.F.
The second step of the Gutzwiller approximation doesnot satisfy the variational principle. Alternatively, theenergy of this Gutzwiller wave function may be esti-mated numerically from Eq. (2.189) by Monte Carlosampling (Yokoyama and Shiba, 1987a, 1987b) withoutintroducing the second step of the Gutzwiller approxi-mation. This Monte Carlo method satisfies the varia-tional principle and gives the upper bound of theground-state energy. Variational Monte Carlo resultscorrectly predict the absence of MIT in the 1D Hubbardmodel at half filling, that is, the insulating state for allU.0.
As we see below in Sec. II.D.6, the Gutzwiller ap-proximation reproduces to some extent the coherentpart of the spectral weight, while it fails to treat theincoherent part, in contrast to the Hubbard approxima-tion.
6. Infinite-dimensional approach
In a simple model of phase transitions such as theIsing model for the ferromagnetic transition, the univer-sality class and critical exponents are correctly repro-duced by the mean-field theory when the system isabove the upper critical dimension dc . For sufficientlylarge dimensional systems, fluctuations are in general
Rev. Mod. Phys., Vol. 70, No. 4, October 1998
suppressed and hence the mean-field approximation be-comes valid. In fermionic systems with metallic spin andcharge excitations, however, the situation is much morecomplicated because dynamic quantum fluctuations areimportant even in large dimensions. In infinite dimen-sions, the number of spatial dimension is infinite, so spa-tial fluctuations are suppressed, while the number oftemporal dimension is always one with an inherentquantum dynamics. Therefore the mean-field theorymust be constructed in a dynamic way to describe me-tallic states in large dimensions. In the dynamic mean-field theory, the spatial degrees of freedom are replacedwith a single-site problem, while dynamic fluctuationsmust be fully taken into account. In the path-integralapproach, the ‘‘mean field’’ determined self-consistentlyshould be dynamically fluctuating in the temporal direc-tion.
To understand how the dynamical fluctuation is ex-actly taken into account in infinite dimensions, it is im-portant to notice that the self-energy of the single-particle Green’s function has no wave-numberdependence and hence is site diagonal (Muller-Hartman, 1989). By using the site-diagonal self-energy,one can obtain a set of self-consistent equations for theexact solution of the Green’s function in infinite dimen-sions. The MIT has been extensively studied with thehelp of numerical or perturbational solutions of the self-consistent equations. Below we first define the Hubbardmodel in infinite dimensions. Next the self-energy of theGreen’s function is shown to be site diagonal. The self-consistent equations are derived and several differentways of solving them are discussed. Consequences ob-tained from the results are then discussed. For more de-tailed discussions of the infinite-dimensional approach,readers are referred to the review article of Georges,Kotliar, Krauth, and Rozenberg (1996).
In infinite dimensions, the Hubbard model defined inEqs. (1.1a)–(1.1d) with nearest-neighbor hopping char-acterized by the dispersion in Eqs. (2.3a)–(2.3b) has thesame form. The dispersion of Eq. (2.3b) in d dimensionsis explicitly written as
«0~k !522t(j51
d
cos kj (2.199)
for a simple hypercubic lattice. For d→` , we have totake a proper limit to yield a nontrivial model (Metznerand Vollhardt, 1989), because the on-site interactionterm (1.1c) is still well defined in d5` while the kinetic-energy term Ht has to be rescaled. This is easily under-stood from the density of states r(E) in the noninteract-ing limit U50, which has the form
r~E !5 limd→`
12t~pd !1/2 exp@2~E/2tAd !2# . (2.200)
in the case of a hypercubic lattice. This density of statesis derived from the equivalence between r(E) and theprobability distribution function of the x coordinate of arandom walker in 2D after d steps of length 2t each witha uniform and random choice of direction in the 2D

1081Imada, Fujimori, and Tokura: Metal-insulator transitions
plane (x ,y). Equation (2.200) is simply the solution ofthe diffusion equation for d→` as it should be in thecase of a long time limit of the random walk. To take thelimit with a finite density of states, one must scale t ast5t* /2Ad with a finite t* . Therefore the bare t is scaledto zero as d increases.
As we see in Eq. (2.200), the density of states for asimple hypercubic lattice has a Gaussian distribution ofwidth t* . A drawback of this density of states is that theMIT does not take place at finite U in the strict sense,because the exponential but finite tail of the density ofstates blocks charge-gap formation at any finite U . Toget around this difficulty, van Dongen (1991) consideredreplacing the simple hypercubic lattice by the Bethe lat-tice, where the density of states has a semicircular form:
r~E !52
pt*A12~E/t* !2. (2.201)
In an explicit calculation of the Green’s function andthe self-energy described below, we use only the densityof states as input, while the calculation does not dependon more detailed knowledge of the actual lattice struc-ture. This indicates that, in d5` , lattice structure, con-nectivity for the hopping transfer, and a measure of thedistance are all irrelevant. In other words, spatial corre-lations are completely ignored in d5` .
When t is scaled as t}1/Ad , one can show that theintersite self-energy of the Green’s function S ij(v) (iÞj) is a higher order of the 1/d expansion than on-siteself-energy S ii(v) (Muller-Hartman, 1989). In the dia-grammatic expansion of the self-energy as in Fig. 12, thelowest order is a part of the on-site term S ii , whichcontains one bare Green’s function G0ii . In contrast, thelowest-order term of the intersite self-energy is secondorder in U with three bare Green’s functions, as in Fig.12. The intersite bare Green’s function G0ij is scaled as
G0ij;t uRi2Rju,
where uRi2Rju is the Manhattan distance of the i and jsites. Then the lowest-order term of S ij for the nearest-neighbor pair (i ,j) is at most scaled by t3. Therefore theself-energy which contains the i site has contributionsfrom the on-site term S ii;O(1), the nearest-neighborterm S ij;(number of nearest neighbors)3t3;dt3,and the next-nearest-neighbor term S ij;(number ofnext-nearest neighbors )3t6;d2t6
¯ . Because of t;1/Ad , these are reduced to Son-site;O(1),Snearest-neighbor;1/Ad , Snext-nearest-neighbor;1/d etc. In the
FIG. 12. The lowest-order diagrams of the intersite self-energy. The interaction is denoted by a black dotted line, whileG0 is given by a full curve. The sites are denoted by i and j .
Rev. Mod. Phys., Vol. 70, No. 4, October 1998
limit d→` , we see that the intersite terms vanish ascompared to S ii . This heuristic argument can be ex-tended to all the higher-order terms in U , which guar-antees that all the intersite terms of the self-energy canbe neglected in d5` .
We rewrite the functional integral of the Hubbardmodel introduced in Eqs. (2.41a) and (2.41b) with(2.37a)–(2.37d) as
Z5E DCDC exp@2S# , (2.202a)
S5E0
b
dt (i ,j ,s
F c is~t!S d ij
]
]t1t ij2md ijDc js~t!G1SU ,
(2.202b)
SU5(i
SUi5(iE
0
b
dtHUi~t!, (2.202c)
HUi~t!5Uc i↑~t!c i↓~t!c i↓~t!c i↑~t!. (2.202d)
Here C is a vector which depends upon site i (or wavenumber k), imaginary time t (or the Matsubara fre-quency vn), and spin s. The matrix product, such as theCAC used below, follows the same notation as thatfrom Eqs. (2.131a)–(2.131b) through (2.134a)–(2.134c).The nointeracting Green’s function at U50 is defined as
G0ij[S d ij
]
]t1t ij1md ijD 21
, (2.203)
which is transformed in Fourier space as
G0~k,v!51
ivn2«0~k!1m. (2.204)
When we use G0 , the action has the form
S5SG01SU , (2.205a)
SG0[2Tr CG0
21C , (2.205b)
where Tr[*0b dt ( i . The Green’s function G at UÞ0 is
formally given by introducing the self-energy S as
G215G0212S , (2.206)
from which the action is rewritten as
S5SG2SS1SU , (2.207a)
SS5Tr CSC . (2.207b)
Here, in the real-space and imaginary-time representa-tion, S is a diagonal matrix given by sI with the identitymatrix I , since S is site diagonal in d5` . Then the par-tition function may be given as
Z5E DCDC exp@2SG1SS2SU#
5ZG^exp@SS2SU#&G (2.208a)
with
ZG[E DCDC exp@2SG# , (2.208b)

1082 Imada, Fujimori, and Tokura: Metal-insulator transitions
^¯&G[1
ZGE DCDC exp@2SG#¯ . (2.208c)
Because S and U are site diagonal, for an N-site system,the average over G may be replaced with the averageover the on-site Green’s function Gii[Gloc after inte-gration over c j and c j with jÞi first, as
ZG^exp@SS2SU#&G5ZGloc^exp@SSi2SUi#&Gloc
,(2.209)
where
SSi5E0
b
dt8dt c i~t!S~t2t8!c i~t8!. (2.210)
Here, ^¯&Glocis defined by a local average,
^¯&Gloc5E Dc iDc i^exp@c iGii
21c i#¯&/ZGloc,
(2.211a)
ZGloc5E Dc iDc iexp@c iGii
21c i# , (2.211b)
and we have used the identity
exp@c iGii21c i#5E )
jÞidc jdc jexp@2S# .
The on-site Green’s function is related to its Fouriertransform as
Gii~t!51
Nb (vn
(k
G~k,ivn!e2ivnt. (2.212)
Then from Eqs. (2.208a)–(2.208c) and (2.209), the par-tition function has the form
Z5E Dc iDc i
3expF2E0
b
dt8dt$2c i~t!G21~t2t8!c i~t8!
1HUi%G (2.213)
with
G21~t
1083Imada, Fujimori, and Tokura: Metal-insulator transitions
chke, 1993; Si and Kotliar, 1993; Furukawa, 1995a,1995b, 1995c; Kajueter and Kotliar, 1996; Rozenberg,1996a; Mutou and Hirashima, 1996; Mutou, Takahashi,and Hirashima, 1997)
Here basic results for the d5` Hubbard model aresummarized below. We first discuss the case of the BC-MIT. In the metallic phase, the Fermi-liquid state withLuttinger sum rule is realized in the solution in d5` ifone considers only the paramagnetic phase (Georgesand Kotliar, 1992). A remarkable property of the solu-tion in d5` is seen in the density of states r(v) as illus-trated in Fig. 13. At half filling it has basically the samestructure as the Hubbard approximation in the insulat-ing region U.Uc , where the Fermi level lies in theHubbard gap sandwiched between the upper and lowerHubbard bands. The reason why the Hubbard approxi-mation can treat the dynamics more or less properly hasbeen discussed in Sec. II.D.4. In the metallic phase U,Uc but near Uc , a resonance peak appears around theFermi level in addition to the upper and lower Hubbardbands. The peak height is kept constant in the metallicregion, while the width of the peak becomes smaller andsmaller as the MIT point U5Uc is approached. Thepeak at the Fermi level eventually disappears with avanishing width at U5Uc . This is associated with a van-ishing renormalization factor Z and hence a divergingeffective mass m* . In the metallic phase this critical di-vergence of m* is essentially the same as what happensin the Gutzwiller approximation (Brinkman and Rice,1970), that is, Z21, m* and the specific-heat coefficientg are enhanced in proportion to uU2Ucu21 while thecompressibility k decreases until it vanishes at the tran-sition point. The Drude weight is also proportional touU2Ucu in the d5` approach. The magnetic suscepti-
FIG. 13. Density of states r(v)52Im G by the d5` ap-proach at T50 for the half-filled Hubbard model at U/t* 51,2, 2.5, 3, and 4 from top to bottom. The calculation is done byiterative perturbation in terms of U . The bottom one(U/t* 54) is an insulator. From Georges, Kotliar, Krauth, andRozenberg, 1996.
Rev. Mod. Phys., Vol. 70, No. 4, October 1998
bility xs is enhanced but approaches a constant ;1/J atthe transition, in contrast with the divergence in theGutzwiller approximation. Here J is the energy scale ofthe exchange interaction. This difference comes fromthe fact that xs has contributions from the incoherentpart, namely, upper and lower Hubbard bands, while theincoherent contribution is ignored in the Gutzwiller ap-proximation. Even for the filling-control MIT, results ind5` show behavior similar to that of the Gutzwillerapproximation where Z21, m* , and g are also enhancedwhile k remains finite. As we shall see in Secs. II.E andII.F, k appears to diverge at the transition point in 2D incontrast to the d5` result.
Comparisons of the spectral weight and the density ofstate with experimental data on Ca12xSrxVO3,La12xSrxTiO3, and other compounds are made in latersections. A controversy exists concerning the BC-MIT.The coherence peak at the Fermi level seems to disap-pear when the metal-insulator transition inCa12xSrxVO3 and other series of compounds such asVO2, LaTiO3, and YTiO3 takes place with the incoher-ent upper and lower Hubbard band kept more or lessunchanged, yet the optical conductivity shows that thecharge gap closes continuously at the transition. The d5` results are consistent with the former but appear tocontradict the optical data, as will be discussed in Sec.IV. Although the mass enhancement in d5` is similarto that in some experimental systems such asLa12xSrxTiO3, in the d5` result, the Wilson ratio RW[xs /g vanishes at the transition while experimentally itremains constant around 2 in La12xSrxTiO3, as is dis-cussed in Sec. IV.B.1. However, quantitatively this dis-crepancy is not remarkable.
The solution in d5` seems to combine two ap-proaches, the Hubbard approximation and theGutzwiller approximation, in a natural way. In the insu-lating phase, the Hubbard approximation provides simi-lar results, whereas, in the metallic phase, many of prop-erties have similarities with the Gutzwillerapproximation This merging of the Gutzwiller and Hub-bard approximations was pointed out in an early work ofKawabata (1975). He showed that the inelasticity ofquasiparticle scattering is crucial for realization of asharp Fermi surface, which is not considered in the Hub-bard approximation. The d5` approach further makesit possible to discuss dynamics and excitations such asspectral weight. Thus one of the mean-field pictures ofthe MIT, when combined with the d5` results, has be-come clearer.
The original solution in d5` contains only a para-magnetic phase with complete ignorance of the antifer-romagnetic order. However, by introducing two sublat-tices A and B, one can reproduce the antiferromagneticorder even in d5` (Jarrell, 1992; Jarrell and Pruschke,1993). The solution in this case indicates an antiferro-magnetic order which persists not only in the insulatingphase but also in a wide region of metals similarly to thesimple Hartree-Fock-RPA results. Therefore the MITobserved by excluding magnetic order is usually inter-rupted and masked by the appearance of the magnetictransition in reality at d5` . It was pointed out that the

1084 Imada, Fujimori, and Tokura: Metal-insulator transitions
original MIT in the paramagnetic phase could be moreor less recovered by introducing frustrations because themagnetic order could be suppressed by the frustration(Georges and Krauth, 1993; Rozenberg, Kotliar, andZhang, 1994).
The phase diagram of metals and insulators in theplane of U and temperature T shown in Fig. 14 wasargued to be similar to that of V2O3 under pressure ordoping (Rozenberg, Kotliar, and Zhang, 1994). Al-though the first-order transition appears to take place ind5` at finite temperatures even with the transfer t be-ing fixed, in the experimental situation observed in thecase of V2O3, the change in the lattice parameter at thetransition may also be an origin of the strong first-ordertransition where discontinuous reduction of the latticeconstant may stabilize the metallic state through the in-crease in the bandwidth. In the d5` approach, the first-order transition at TÞ0 is replaced with a continuoustransition at T50 (Moeller et al., 1995).
At half filling, when a two-sublattice structure is intro-duced, the antiferromagnetic transition temperature TNas a function of U shows a peak at a moderate U (seeFig. 15), whose structure is similar to the SCR result aswell as to the quantum Monte Carlo results in 3D (Scal-ettar et al., 1989), although temperature and energyscales have an ambiguity in d5` due to the rescaling oft to t* . It is clear that 2D systems show quite differentbehavior because TN should always be zero. Away fromhalf filling, TN still shows similar behavior to RPA re-sults with a wide region of antiferromagnetic metal. Aserious problem in d5` with antiferromagnetic order isthat the short-ranged spin fluctuation inherent in lower-dimensional systems is completely ignored.
As we shall see in Sec. II.F the scenarios of the MIT ind5` have some similarity, such as the mass divergence,to the low-dimensional case while they are rather differ-ent from the predictions of the scaling theory in manyrespects, such as the critical exponents themselves andthe role of antiferromagnetic correlations. If we com-
FIG. 14. Phase diagram of the d5` Hubbard model at halffilling in the plane of temperature T/t* and interaction U/t* inthe case where the magnetic order is entirely suppressed byfrustration. The solid curve is the first-order transition linewith the critical point at the black square. The region sur-rounded by dotted curve shows the coexistence of metal andinsulator, while the transition at T50 is a continuous transi-tion. From Georges, Kotliar, Krauth, and Rozenberg, 1996.
Rev. Mod. Phys., Vol. 70, No. 4, October 1998
pare the results in d5` with those in realistic low-dimensional systems including 3D, the region of the an-tiferromagnetic ordered phase may extend beyond thosefor d52 and 3. In the case without orbital degeneracy,the antiferromagnetic order can be remarkably sup-pressed due to quantum fluctuations in finite dimen-sions, while it requires some other origin, such as frus-tration, to suppress magnetic order in d5` . In the limitd5` , each exchange coupling is scaled to vanish, andhence we do not expect spin-glass-like order. However,in this case we have nonzero entropy at T50. Anothermore important difference between low-dimensionalsystems and d5` occurs in the paramagnetic metallicphase due to difference in the universality class of theMIT as well as the absence of magnetic short-range cor-relations in d5` . For example the Drude weight D ap-pears to scale linearly with d for the FC-MIT at d5` ,while it can be suppressed as D}dp, p.1 in the scalingtheory. The d5` approach may be justified only abovethe upper critical dimension dc , as we shall discuss inSec. II.F. Although some attempts have been made tocalculate 1/d corrections to compare with the Gutzwillerresults in finite dimensions (Schiller and Ingersent,1995), as it stands, the convergence properties of the 1/dexpansions are not clear. To make connections to finite-dimensional results, it would be desirable to develop asystematic approach in terms of the 1/d expansion. Inthe Mott insulating phase, the Heisenberg spin modelhas been treated by an approach similar to that in thissection (Kuramoto and Fukushima, 1998). The expan-sion can be calculated up to the order of 1/d (or up tothe order of 1/zn where zn is the number of nearestneighbors), because the polarization function remainssite diagonal up to this order in the quantum spin model.This approximation goes beyond the one-loop level andcorresponds to the spherical approximation known inspin systems.
7. Slave-particle approximation
In strongly correlated systems, the strong-couplinglimit is frequently a good starting point for understand-ing the basic physics. The strong-coupling limit is de-fined in the single-band model as the limit where doubleoccupation of the same orbital is strictly prohibited. Thet-J model (2.13) offers an example of this limit. To
FIG. 15. U dependence in the d5` Hubband model. (a) An-tiferromagnetic transition temperature as a function of U : s,d5` Hubbard model; L, d53 at half-filling. (b) U depen-dence of the square of the local moment m2. From Jarrell andPruschke, 1993.

1085Imada, Fujimori, and Tokura: Metal-insulator transitions
implement this local constraint, the slave-particlemethod has been developed. As an example, we discussthe case of the slave-boson method (Barnes, 1976, 1977;Coleman, 1984; Baskaran, Zou, and Anderson, 1987; Af-fleck and Marston, 1988; Kotliar and Liu, 1988; Su-zumura, Hasegawa, and Fukuyama, 1988) where theelectron operator cis is decoupled as
cis5f isbi† . (2.216)
Here f is is a fermion operator called a spinon, whichcarries spin degrees of freedom, while a boson operatorbi
† called a holon represents a charged hole. The localconstraint prohibiting double occupancy is representedas
(s
f is† f is1bi
†bi51 (2.217)
at all the sites i .Another way of decoupling is to assign fermion statis-
tics for charge degrees of freedom and boson statisticsfor spins. Aside from minor differences, this reduces tothe spin-wave theory at half filling where the spins arerepresented by Schwinger bosons. This formalism iscalled the slave-fermion method (Arovas and Auerbach,1988; Yoshioka, 1989a, 1989b). The advantage of theslave-fermion method is that it is easier to implementantiferromagnetic order at half filling than with theslave-boson method. Away from half filling, however,the mean-field solution of the slave-fermion methodgenerally predicts a wide region of incommensurate an-tiferromagnetic order, in contrast with the rapid disap-pearance of magnetic order believed to occur in 2D. Arelated formalism was also developed in the spin-fermion model in a rotating reference frame of antifer-romagnetic correlations (Kubert and Muramatsu, 1996).We do not discuss the details of the slave-fermion ap-proximation here.
In the slave-boson method, the t-J model defined inEq. (2.13) is represented using these operators as
H52t(i ,j&s
bifis† f jsbj
†2J
2 (ij&
ss8
@f is† f js8
† f js8f is
1f is† f js8
† f jsf js8# . (2.218)
When the local constraint (2.217) is rigorously enforced,(2.218) is equivalent to the original t-J model. However,in practical treatments, as we shall see below, this localconstraint is in many cases replaced by a global, aver-aged one. In addition to this approximation, varioustypes of mean-field decoupling have been attempted todiscuss the phase diagram of this Hamiltonian, includingflux phase, commensurate flux phase, dimer phase, andthe so-called resonating valence bond (RVB) state. As atypical example, here we discuss the case of RVB decou-pling. The uniform RVB state introduces three orderparameters for mean-field decoupling:
x ij5J(s
^f is† f js& (2.219)
Rev. Mod. Phys., Vol. 70, No. 4, October 1998
and
D ij5^bibj†& (2.220)
to decouple the transfer term proportional to t , whereas
Dij5^f i↑f j↓2f i↓f j↑& (2.221)
and x ij for decoupling of the exchange term propor-tional to J . By using the mean-field approximation^bi
†bj&}d to replace the local constraint with an aver-aged one, we can reduce the transfer term to
Ht52td(s
^ij&
f is† f js . (2.222)
This leads to an approximation that is similar to theGutzwiller result but not strictly identical, in which thebandwidth becomes narrow in proportion to the dopingconcentration d and hence the mass is enhanced criti-cally. It should be noted that the holon degrees of free-dom are frozen in the approximation ^bi
†bj&5constantand a Fermi liquid of spinons is realized. When we fur-ther decouple the exchange term by using the RVB or-der parameter x ij , the bandwidth becomes proportionalto D ij1x ij , which is proportional to J even in the limitof d→0. When the charge degrees of freedom are re-tained in a dynamical manner, with the assumption thatx ij is frozen below the mean-field temperature for x ij ,the transfer term may be rewritten as
Ht52t(s
^ij&
x ijbi†bj . (2.223)
Then, if x ij is assumed to be a mean-field constant x , itleads to Bose condensation, ^bi&Þ0, below the transitiontemperature when a weak interaction of the bosons isassumed. On the other hand, if the Bose condensation ofbi takes place, by neglecting the strict local constraint,the Fermi-liquid state of f i is realized again with finitemean-field order parameters for x ij and ^bi&. This givesa bandwidth proportional to t^bi&
21(J/2)^x ij&. Whenwe neglect J , we obtain a bandwidth proportional to^bi&
2}d again, as in the Gutzwiller approximation.Therefore, at T50, this mean-field framework alwaysleads to the same level of approximations as theGutzwiller approximation for the MIT. As discussed inSecs. II.D.6 and II.F, this approximation of course givesonly mean-field exponents with no information on theincoherent part of the charge excitation.
In the large-N limit, where the SU(2) symmetry of theoriginal spin-1/2 models is generalized to SU(N) witharbitrary integer N , this mean-field solution becomes ex-act in any dimension and the incoherent part disappearsin the leading order of 1/N (see the reviews of Newnsand Read, 1987; Kotliar, 1993; see also Jichu, Matsuura,and Kuroda, 1989).
Mean-field solutions of the slave-particle formalismgive various phases such as the dimer phase, flux phase,and RVB phase. When the dimer and flux phases aresuppressed, the metallic state at T50 is the Fermi liq-uid, and the MIT near d→0 in this framework is char-

1086 Imada, Fujimori, and Tokura: Metal-insulator transitions
acterized by Z}d and D}d where Z is the renormaliza-tion factor and D is the Drude weight. The specific-heatcoefficient g is given by g}1/(d1aJ/t) with a constant aof order unity (Grilli and Kotliar, 1990). The effectivemass m* is enhanced but remains finite, m* ;(t/J)mb inthe limit d→0.
Above the Bose condensation temperature of bi ,when using the Hamiltonian (2.218) as a starting point,one must treat the dynamic fluctuation of x ij withstrongly coupled spinons and holons if one wishes to gobeyond the mean-field approximation. A gauge-field ap-proach (Ioffe and Larkin, 1989; Ioffe and Kotliar, 1990;Nagaosa and Lee, 1990; Lee and Nagaosa, 1992) can inprinciple treat this fluctuation, where the local constraintand the fluctuation of x ij are represented by a gaugefield coupled to both spinon and holon. This may beimplemented through the fluctuation of u which is simi-lar to Eq. (2.156) but actually uses the Stratonovich-Hubbard field to decouple Eq. (2.218), where the cou-pling of holon to spinon is represented by chiralityfluctuations of u. Recently this approach was extendedto reproduce the SU(2) symmetry at half filling. The p-flux state at half filling is connected to the RVB phaseupon doping (Wen and Lee, 1996).
In the gauge-field approach, it has been claimed thatthe linear-T resistivity is reproduced from the dynamicsof holes (slave bosons) strongly coupled to the gaugefield. So far, in this gauge-field theory, the T-linear re-sistivity has been ascribed to the incoherence of slavebosons due to low boson concentration together withthe speculated retraceable nature of bosons under thecoupling to the dynamic gauge field. However, the gaugefluctuation has been considered mostly within theGaussian approximation without a self-consistent treat-ment. Self-consistent treatment of holons and spinonscoupled by the gauge field has not been attempted sofar, and it is not clear whether the above claims will beconfirmed by a self-consistent treatment. In fact, the en-ergy scale of the dynamic fluctuation of spinons is onlyJ , which yields incoherent charge dynamics only on thesame energy scale through the spinon-holon coupling bythe gauge field. This appears to contradict the experi-mental and numerical observations to be described inSecs. II.E.1 and IV.C, where s(v)}1/v extends to theorder of the bare bandwidth in the absence of the char-acteristic crossover energy scale. The energy scale forthe appearance of incoherence is of the order of theMott gap and much larger than J near the Mott insula-tor. In Secs. II.E.1 and II.F, we shall see that the inco-herence may be ascribed to different origins near theMIT.
The description of the MIT d→0 by the slave-particleapproach including the gauge-field method is ratherprimitive in many other respects: First, it does not prop-erly take account of the growth of (short-ranged) anti-ferromagnetic correlation, which plays an important rolein the incoherent dynamics. [The RPA level of antifer-romagnetic correlation was additionally consideredwithin a uniform RVB treatment (Tanamoto, Kohno,and Fukuyama, 1992)]. Secondly, at T50, as mentioned
Rev. Mod. Phys., Vol. 70, No. 4, October 1998
above, this approach gives only a simple mean-field re-sult similar to that of a Gutzwiller-type approximation,due to Bose condensation of bi . In the limit T→0, thistreatment ignores the incoherent part of the excitationsalthough the incoherence becomes important near theMott transition even at T50. This incoherence is con-sidered in the above scenario only partially via gauge-field fluctuations at finite temperatures. It is also difficultin this approach to explain the small amplitude of RHobserved in the high-Tc cuprates at high temperatures(see Secs. II.E.1 and IV.C). Diverging compressibility atT50 near d50 (see Secs. II.E.3 and IV.C.1) is also dif-ficult to explain in this scheme. All these problems are offundamental importance and contribute to the failure ofthis approach in treating the Mott transition in finitedimensions in a manner similar to the Gutzwiller ap-proximation.
One of many serious difficulties of the slave-particlemodel is that it is not clear whether the gauge-field cou-pling is weak enough to justify the original spin-chargeseparation. Without a weak enough coupling, spinonsand holons recombine to the original electrons, whichwould invalidate the model. Because this approach isbased on a very strong statement, namely, an explicitspin-charge separation, it is highly desirable to find di-rect evidence for or against it. From a theoretical pointof view, the 2D Hubbard model at low concentrationhas been extensively investigated and, although it is stillcontroversial (see for example, Narikiyo, 1997; Castel-lani et al., 1998), the conclusion appears to be that theFermi-liquid state is stable and hence the spin-chargeseparation does not take place. In general, in 2D, theFermi liquid is destroyed only when there is a singularinteraction between quasiparticles.
When we take into account the J term, below themean-field temperature of Dij , the spin degrees of free-dom may have a pseudogap structure on the mean-fieldlevel. It was claimed that this may be relevant to thepseudogap anomaly observed in the high-Tc cuprates(Kotliar and Liu, 1988; Suzumura, Hasegawa, and Fuku-yama, 1988). The basic mechanism could be closely re-lated to superconducting pairing due to antiferromag-netic fluctuations. However, the formation ofpseudogaps above the superconducting transition tem-perature Tc , expected at low doping in this framework,is rather difficult to explain from antiferromagnetic spin-fluctuation theory, while it may have an interesting con-nection to the pairing mechanism for doped spin-gapMott insulators. Pseudogap formation may be just a con-sequence of the preformed singlet pair (fluctuations) ofelectrons due to some pairing force, for example, and isnot necessarily the consequence of this particular for-malism of spin-charge separation. Indeed, on generalgrounds, it is natural to have a separation of Tc and thepseudogap formation temperature TPG at low doping, aswe shall discuss in Secs. II.F and IV.C. The critical tem-perature must go to zero as d→0 because the coherencetemperature Tcoh should go to zero when the system
1087Imada, Fujimori, and Tokura: Metal-insulator transitions
approaches the continuous MIT point, while TPG mayremain finite due to a finite pairing energy even close tothe MI transition point.
Although the slave-particle approach provides in prin-ciple an attractive way to describe the problem if thelocal constraint is reliably implemented and the fluctua-tion around the starting mean-field solution is properlyestimated, its practical realization is rather difficult andthe approximations employed so far are unfortunatelynot well controlled. As in all the mean-field theories, theway of decoupling the original Hamiltonian by assumingorder parameters in the mean-field treatment of the con-straint (2.217) is not unique and we can argue many pos-sibilities. Mean-field results give a criterion for local sta-bility of the solution while it is hard to show globalstability. It is also hard to estimate fluctuation effects ina controlled way. Generally speaking, in low-dimensional systems, this is a serious problem becauseof large quantum fluctuations. In fact, if the dimension-ality is below the upper critical dimension, phase transi-tions must be described beyond the mean-field theories.The slave-particle approximation does not reproducethe large dynamic exponent z54 observed in 2D nu-merical studies, discussed in Secs. II.E and II.F, becauseof the neglect of strong wave-number dependence.Therefore it does not reproduce important physicalquantities associated with the MIT in 2D. For qualita-tively correct descriptions of the problem, the slave-particle approach is useful for limited use on a mean-field level, but it is important to consider the overallconsistency of the obtained results with those of othertheoretical approaches and with experimental indica-tions.
8. Self-consistent renormalization approximationand two-particle self-consistent approximation
When electron correlation effects become stronger, ingeneral, spin fluctuations have to be considered seri-ously. In the Hubbard approximation and Gutzwiller ap-proximation, as well as in the infinite-dimensional ap-proach, wave-number- and frequency-dependent spinfluctuations are not taken into account. Although theRPA, discussed in Sec. II.D.2, provides a formalism todeal with spin fluctuations perturbatively, its validity isrestricted to cases of sufficiently weak spin fluctuations,as is easily understood from its derivation. It describesmagnetic transitions only at the mean-field level withuncontrolled treatment of fluctuations. To considerwave-number-dependent spin fluctuation of any ampli-tude, large or small, and especially to improve the RPAand the Hartree-Fock approximations at finite tempera-tures, the self-consistent renormalization (SCR) ap-proximation was developed by Moriya (1985). In theSCR theory, as we see below, wave-number-dependentspin fluctuations of large amplitude can be taken intoaccount more completely, while dynamic fluctuationsare more or less neglected because of the static approxi-mation employed to treat the strong-correlation regime.In the original terminology of SCR, it was a mode-
Rev. Mod. Phys., Vol. 70, No. 4, October 1998
coupling theory developed for weak ferromagnetic orantiferromagnetic systems with small-amplitude spinfluctuations within the Gaussian approximation. In addi-tion to the RPA diagrams of bubbles, within the one-loop approximation, the polarization function containsdiagrams whose bubbles are coupled to the spin fluctua-tions with different wave numbers. This generates modecouplings, which are treated self-consistently. This is ba-sically a self-consistent treatment of the one-loop ap-proximation. The original mode-coupling treatmenttakes account of dynamic fluctuations but is justifiedonly for weakly correlated systems at the one-loop leveland at the level of minor vertex corrections. On theother hand, our main interest in this review is stronglycorrelated systems. Therefore we shall use the terminol-ogy of the SCR approximation for more generalizedtreatments, formulated later, with the static approxima-tion of the Stratonovich-Hubbard variable, to coverboth small and large amplitudes (Moriya, 1985). Thismay be viewed as an extrapolation of the original SCRto the strong-correlation regime but within the static ap-proximation of the Stratonovich-Hubbard variables. Aswe shall see below, in principle, the mode-coupling con-tribution to the additionally introduced self-energy canbe implemented so as to include the original SCR treat-ment as a special case, although it has not been doneseriously. Though there exist several different ways offormulating the SCR theory, the level of approximationsused is similar. A typical formulation of the SCR theory(Moriya and Hasegawa, 1980) is reviewed below. Wealso briefly review a more or less equivalentrenormalization-group approach by Millis (1993) in Sec.II.D.9.
To calculate the partition function in the path-integralformalism with the Stratonovich-Hubbard transforma-tion, we need to calculate Eq. (2.132a). Like theHartree-Fock formulation for the strong-correlation re-gime, the SCR approximation for the strong-correlationregime employs a static approximation in which dynamicfluctuations of Ds and Dc are ignored. This static ap-proximation becomes a serious drawback in treatinganomalous metals with fluctuations related to correlatedinsulators.
Instead of the saddle-point approximation of a singlemode of D in the Hartree-Fock approximation, the SCRtheory employs a mode-coupling theory for Gaussianfluctuations combined with a coherent potential ap-proximation (CPA) which regards the wave-number-dependent static Stratonovich fields Ds as random po-tentials. The framework of the CPA is quite similar tothat for the Hubbard approximation discussed in Sec.II.C.4. Instead of the Dc considered in the Hubbard ap-proximation, the fields Ds are mainly taken into accountin SCR. The first goal is to calculate the Green’s func-tion
Gss8~k ,k8
1088 Imada, Fujimori, and Tokura: Metal-insulator transitions
Gg2152Qg5S 2Qg↑↑2S1 , 0
0, 2Qg↓↓2S2D ,
(2.225)
with Qgss given in Eq. (2.145c). The self-energy is de-scribed as S1 and S2 . In the absence of symmetrybreaking, namely, in the paramagnetic phase, the self-energy correction may be written in the original single-particle Green’s function (2.143) in the form
G2152Q02S S1 0
0 S2D . (2.226)
The self-energy is determined by the CPA combinedwith some approximations such as the Gaussian approxi-mation for the static fluctuation Ds(k,vn50). The co-herent potential approximation neglects the wave-number dependence of the self-energy and considersonly S1(k50)5S2(k50) in the absence of magneticfields. In other words, the CPA condition is to take intoaccount the effect of Q1 (or effects of dynamic Ds) bythe local on-site self-energy on average. This may beachieved by solution of the self-consistent equation
S5
K Q1~k !F12S 1N (
kG~k,v! D ~Q1~k!2S!G21L
K F12S 1N (
kG~k,v! D ~Q1~k!2S!G21L .
(2.227)
as in Eq. (2.187). Here ^¯& is the average over the dis-tribution of Ds corresponding to ( lZl¯/( lZl in Eq.(2.187). In this case, the probability Pl is taken asexp@2SD# defined in Eq. (2.134).
After one has determined the wave-number-independent but frequency-dependent S(v), a system-atic t-matrix expansion is in principle possible to allowfor corrections coming from the wave-number depen-dence. The effective action for D obtained from Eqs.(2.134a)–(2.134c),
Seff~D!5@2Tr ln~2G0!1Tr ln~12G0Q1!# ,(2.228)
is rewritten as
Seff~D!5Tr ln~2G0211Q1!5Tr ln~2G211Q12S!
52Tr@ ln~2G !2ln„12G~Q12S!…#
52Tr@ ln~2G !2ln$12Gloc~Q12S!%
2ln$12~G2Gloc!T %# , (2.229)
where the t matrix is defined as
T5~Q12S!@12Gloc~Q12S!#21 (2.230)
with the local Green’s function
Gloc~vn!51N (
kG~k,vn!. (2.231)
The CPA condition (2.227) is solved in some approxima-tion, while charge fluctuations are neglected. Then a fur-
Rev. Mod. Phys., Vol. 70, No. 4, October 1998
ther approximation such as the Gaussian approximationof Ds is taken to cut off the t-matrix expansion (Moriyaand Hasegawa, 1980). The formal procedure for solvingthe problem in this approximation is rather similar tothat explained in the Hubbard approximation (Sec.II.D.4). The result in the paramagnetic phase is
S~vn
1089Imada, Fujimori, and Tokura: Metal-insulator transitions
and CeCu2Si2 also show a variety of anomalous features,which we do not discuss in detail here.
The most serious drawback of the SCR approximationin treating strongly correlated systems is the combina-tion of the Gaussian approximation with the static ap-proximation. First, dynamic spin fluctuations beyond theGaussian level (one-loop level) are neglected. The pre-scription for the vertex correction is also insufficient.Second, since the static approximation employed in thestrong-correlation regime is justified only when the tem-perature is much higher than all the characteristic spinfluctuation energies, various interesting quantum fluc-tuations may be ignored. Intrinsically quantum-mechanical phenomena have to be treated beyond thestatic approximation.
The metal-to-Mott-insulator transition, one of themain subjects in this article, is a good example in whichthe above drawbacks become serious. MITs are essen-tially quantum phase transitions at T50 controlled byquantum fluctuations such as the band-width and thefilling. There quantum dynamics plays a crucial role. Infact, near the Mott insulator, the characteristic spin-fluctuation energy remains at a finite value even in theinsulating phase, whereas the characteristic charge exci-tation energy has to vanish toward the MIT point if thetransition is of continuous type. Therefore the tempera-ture range at which the static approximation is justifiedlies outside the interesting temperature range of chargedynamics. In addition, the existing framework of SCRon the one-loop level does not properly take into ac-count the contribution from incoherent excitations orthe reduction of the renormalization factor, which is adominant effect near the continuous MIT.
Another point to be discussed with SCR is the treat-ment of magnetic transitions at finite temperatures aswell as at zero. Self-consistent renormalization leads to amean-field prediction for critical exponents near thetransition point, because it is based on the Gaussian ap-proximation in the paramagnetic region. This is onlyvalid when the system is above the upper critical dimen-sion of the T50 quantum transition. In terms of criticalphenomena, a proper treatment beyond the mean-fieldlevel becomes necessary in low dimensions. Recently, anequivalent approach to the weak-coupling SCR approxi-mation was formulated by Hertz (1976) and Millis(1993), using renormalization-group (RG) analysis, aswe review in the next subsection (Sec. II.D.9). This RGapproach is also justified only above the upper criticaldimension. A basic point there is that the dynamic ex-ponent z is 2 for an antiferromagnetic transition in themetallic phase while z53 for a ferromagnetic transitionin metals. These dynamic exponents are derived fromthe low-energy action for an overdamped spin-wave dueto the continuum of the Stoner excitation coupled to thespin wave. From the renormalization-group study, it wassuggested that the upper critical dimension appears tobe d53 for antiferromagnetic transitions provided thatthe Fermi surface does not satisfy the nesting condition,while it is controversial for the ferromagnetic case (seethe next subsection). As we discuss in Secs. II.D.9 and
Rev. Mod. Phys., Vol. 70, No. 4, October 1998
II.F in detail, such mean-field predictions are no longerjustified in low dimensions. The mean-field predictionalso ceases to be satisfied near the Mott transition pointbecause the nesting condition has to be considered. Lowdimensionality and the proximity of the Mott insulatingphase are two typical cases in which quantum fluctua-tions are crucially important in deriving various featuresbeyond the level of the SCR approximation, as is de-tailed in Sec. II.F.
Recently, an approximation at the same level as theSCR but extended to allow explicit charge fluctuationssimultaneously and to allow an incommensurate period-icity of order has been developed as the two-particleself-consistent approach (Vilk, Chen, and Tremblay,1994; Dare, Vilk, and Tremblay, 1996). In this approach,the same functional forms as for the RPA for xs and xcare assumed, but with renormalized interactions Us andUc . These parameters Us and Uc are determined self-consistently to satisfy the constraint on a relation to^n↑n↓&. This constitutes a conserving one-loop approxi-mation at the two-particle level, in contrast to the one-particle level in the fluctuation exchange (FLEX) ap-proximation. FLEX is regarded as the same level ofapproximation as the original weak-coupling SCR ap-proximation without the vertex correction.
In the strong-coupling limit, that is, in localized spinsystems, it appears that the SCR approximation in thissubsection can be extended to reproduce the sphericalapproximation of spin systems. Kuramoto and Fuku-shima (1997) clarified the level of approximation neededto reproduce the spherical approximation in more detail.
9. Renormalization-group study of magnetic transitionsin metals
In this subsection, renormalization-group studies ofthe Gaussian fixed point of magnetic transitions in themetallic phase, developed by Hertz (1976) and Millis(1993), are reviewed. As is mentioned in Sec. II.D.8, thistreatment of the Gaussian fixed point essentially leads toequivalent results to the SCR approximation. We startwith the path-integral formalism with the Stratonovich-Hubbard transformation introduced in Sec. II.D.2.When we neglect the charge fluctuation part by takingy50 in Eq. (2.132b), the Ds-dependent part of the ac-tion derived in Eq. (2.137) is rewritten as
S54U (
kDs* ~k !Ds~k !2Tr ln@12G0Q1# . (2.233)
Since Q1 is linear in Ds , as defined in Eqs. (2.135c) and(2.133c)–(2.133e), we are able to expand S in terms ofDs and Ds* . Hereafter, for simplicity, we employ the no-tation Ds for 2Ds . Up to the fourth order of Ds , it iswritten as
S5(k
v2~k !Ds* ~k !Ds~k !1 (k1¯k4
v4~k1 ,k2 ,k3 ,k4!
3dS (i51
4
kiDDs* ~k1!Ds* ~k2!Ds~k3!Ds~k4!1¯ (2.234)

1090 Imada, Fujimori, and Tokura: Metal-insulator transitions
where
v2~k !51U
2xb~k ! (2.235)
while
xb~k !521b (
qG0~q !G0~k1q !
52(q
f~«q!2f~«k1q!
«q2«k1q1v(2.236)
is the magnetic susceptibility of the noninteracting sys-tem. The coefficient v4 is given by the fourth-order loopand can be expressed using G0 . The Gaussian coeffi-cient v2(k) is expanded in terms of k and vn by using
xb~k,ivn!5r~«F!F1213 S k
2kFD 2
2p
2uvnuukuvF
1¯ G(2.237)
for the case of ferromagnetic transitions with isotropicFermi sphere. It should be noted that this expansion ispossible only for d.3. In d51 and d52, the suscepti-bility is singular at uku52kF even for an isotropic Fermisurface and cannot be expanded regularly (Kittel, 1968).A crucial assumption of the Gaussian treatment de-scribed in this subsection is that the dispersion in v2 hasnonzero coefficient for the quadratic k dependence andthis is the leading contribution at small k . Recently, thenonanalyticity of xb in k for d<3 in the leading orderwas considered more seriously (Vojta et al., 1996; Kirk-patrick and Belitz, 1997), which led to the conclusionthat, for the ferromagnetic case, the mean-field descrip-tion is incorrect at d52 and 3, in contrast with the re-sults obtained from Eq. (2.237).
If the above assumption for the regular expansion in(2.237) is allowed, we obtain
v2~k !5D1k21uvnuuku
, (2.238)
where we have assumed nonzero and finite coefficientsfor D, k2, and uvnu/uku, which can be taken to be unity inappropriate units. Here D is the parameter measuringthe distance from the critical point (D50 at the transi-tion point) and should not be confused with the orderparameter Ds . In the antiferromagnetic case, v2(k) issimilarly expanded around the ordering wave number Qthrough xb(Q1k,ivn) for small k and vn if the nestingcondition is not satisfied and the spatial dimension dsatisfies d>3. When the nesting condition is satisfied, asin the case of transitions to the Mott insulating state, thistype of simple expansion is not possible, because vn inthe expansion (2.234) has higher-order singularities forlarger n . We do not discuss this case here. The Motttransition is the subject of Sec. II.F, and we discuss thisproblem in Sec. II.F.11. After taking proper units, wehave
v2~k !5D1k21uvnut (2.239)
for the antiferromagnetic case, where we have again as-sumed that coefficients for D, k2, and uvnu are nonzero
Rev. Mod. Phys., Vol. 70, No. 4, October 1998
and finite. We discuss the possible breakdown of thisassumption in Sec. II.F. The difference between the fer-romagnetic and antiferromagnetic cases arises from thefact that the order parameter, that is, the magnetization,commutes with the Hamiltonian and hence is conservedfor the ferromagnetic case while this is not so for thestaggered magnetization in the antiferromagnetic case.Because of the conserved magnetization, the inverselifetime t21 of the ferromagnetic fluctuation becomes klinear for small k and hence the lifetime diverges in thelimit k→0. The vn-linear dependence of the action isthe consequence of the overdamped nature of the fluc-tuation due to coupling to the continuum Stoner excita-tions of metal.
Next we consider the scaling properties of these ac-tions. When we take the scale transformation k85kband v85vbz, the Gaussian terms
S2F5(k
~D1k21 uvnu/uku!uDs~k !u2 (2.240)
for the ferromagnetic case and
S2AF5(k
@D1k21 uvnut#uDs~k !u2 (2.241)
for the antiferromagnetic case are transformed as
S2F8 5(k8
@D1k82b221 ~ uvn8 u/uk8u! b12z#uDs~k !u2
(2.242)
and
S2AF8 5(k8
@D1k82b221 ~ uvn8 ut! b2z#uDs~k !u2,
(2.243)
respectively. The action can be kept in the same formafter this scaling if the dynamic exponent z is given byz53 for the ferromagnetic case and z52 for the anti-ferromagnetic case with the following scaling taken si-multaneously:
D85Db2 (2.244)
and
Ds85Dsb2~d1z12 !/2. (2.245)
The k dependence of the fourth-order coefficient v4 isnot important for critical properties and may be re-placed with the value u[v4(k50) because v4(k50).0 is assumed to be finite to make the transition fromparamagnetic phase ^Ds&50 to the magnetic phase^Ds&Þ0 possible at D50, as in the usual Landau free-energy expansion for Ds . Then the fourth-order term isscaled as
S45b42~d1z !u (k18¯k48
dS (i51
4
ki8D3Ds8* ~k18!Ds8* ~k28!Ds8~k38!Ds8~k48!. (2.246)
Therefore, the scaling of u should be

1091Imada, Fujimori, and Tokura: Metal-insulator transitions
u85ub42~d1z ! (2.247)
to keep the scale-invariant form for S4 . This means thatthe quartic term is scaled to zero for d1z.4 after re-peating the renormalization. This is the reason why themean-field approximation is justified for d1z.4 be-cause the term S4 becomes irrelevant. [Strictly speaking,as usual, the term S4 is dangerously irrelevant. See, forexample, Ma (1976)]. In this case, in the paramagneticphase, the Gaussian approximation retaining only thequadratic term S2 is justified in describing the quantumphase transition at T50. We note, however, that if thedispersion itself in Eq. (2.240) or (2.241) is given byhigher-order kz such as k4 instead of k2, the above cri-terion d1z.4 for the justification of the mean-fieldtreatment must be replaced with d1z.2z . This is in-deed the case for the Mott transition, discussed in Sec.II.F, where hyperscaling is justified.
If only the Gaussian part of S2F or S2AF is considered,the partition function Z5e2bF[*DDs*DDse
2S is givenby
F5VE0
L ddk~2p!d E
0
Gk d«
pcoth
«
2Ttan21F «/Gk
D1k2G ,
(2.248)
where we introduce a cutoff L for the momentum and Gfor the energy, with Gk5G for antiferromagnets andGk5Gk for ferromagnets. When we first integrate outthe rapidly varying part of a thin frequency-momentumshell defined by the region L>k>L/b and Gk>«>Gk /bz, we obtain
F5VE0
L/b ddk
~2p!d E0
Gk /bz d«
pcoth
«
2Ttan21
«/Gk
D1k2
1F1ln b , (2.249)
F15VLdKdE0
GL d«
pcoth
«
2Ttan21
«/GL
D1L2
1Vz
p E0
L ddk
~2p!d cothGk
2Ttan21
1D1k2 . (2.250)
After the rescaling of k to k85bk and « to «85«bz torecover the original range of k and «, we need the re-scaling
D5D8/b2, (2.251)
T5T8/bz (2.252)
to keep the same form for F as
F5V8b2~d1z !E0
L ddk8
~2p!d E0
Gk8 d«8
p
3coth«8
2T8tan21
«8/Gk8D81k82 . (2.253)
Then the renormalization-group equation of D and u forS2 is dD/d ln b 52D and dT/d ln b 5zT. The non-Gaussian term S4 can be treated perturbatively, whenwe treat only Gaussian behavior. The free energy can be
Rev. Mod. Phys., Vol. 70, No. 4, October 1998
easily calculated up to first order in u , and rescalings ofD, T , and u are determined to keep the same form for Fafter the scale transformation b . The resultantrenormalization-group equations up to first order in uare
dD
d ln b52D1J~T ,D!u , (2.254)
dT
d ln b5zT , (2.255)
du
d ln b5@42~d1z !#u (2.256)
with
J~T ,D!52~n12 !F 2p E
0
L ddk
~2p!d kz22
3cothkz22
2T
111~D1k2!2
1KdE0
1 d«
pcoth
«
2T
«
«21~D11 !2G ,
(2.257)
where
Kd5~2p!2 d/2/~d22 !!!
for even d and
Kd52~2p!2 ~d11 !/2/~d22 !!!
for odd d . The solution of these equations is
T5T0bz, (2.258)
u5u0b42~d1z !, (2.259)
D5b2S D01u0E0
ln bdxe @22~d1z !#xF(T0ezx,D0e2x) D .
(2.260)
From the solution for u , it is clear that the Gaussiantreatment is justified in the paramagnetic phase when 42(d1z),0. Two regimes exist when the scaling stopsat D;1. One is the quantum regime, where T!1 is sat-isfied when the scaling stops at D;1. The other is theclassical regime, where T@1 for D;1. The boundary ofthese two regimes is obtained by putting T50 and D51into Eq. (2.260) to get b and substituting the resultant binto Eq. (2.258). The condition for the occurrence of thequantum regime is
1@T0 /rz/2, (2.261)
r5D01uF~T50,D0!
z1d22, (2.262)
where T0 and D0 are the bare values of the temperature
1092 Imada, Fujimori, and Tokura: Metal-insulator transitions
and the control parameter. In the quantum regime, as isusual in the Gaussian model, the correlation length isgiven by
j5r21/2. (2.263)
When T is scaled large, the renormalization-group equa-tion should be rewritten with a new variable v5uT be-cause J(T);CT for T@1, and the right-hand side ofEq. (2.254) is a function of the single variable uT . Thenthe renormalization-group equation reads
dD
d ln b52D1Cv , (2.264)
dvd ln b
5~42d !v (2.265)
up to linear order in v . The initial condition for theseequations is obtained from a solution of the originalequations (2.254)–(2.256) when the renormalizationstops at T51, as
D5T022/z@r1Bu0T0
~d1z22 !/z# , (2.266)
v5u0T0~d1z24 !/z , (2.267)
where
B51
2z E0
1dT T ~22d22z !/z@J~T !2J~0 !#/~n12 !.
(2.268)
The renormalization-group equations (2.264) and(2.265) are solved using the initial conditions (2.266) and(2.267). The Ginsburg criterion, which is the conditionfor justification of Gaussian treatment, is given by v!1when the scaling stops at D51. This criterion is
uT111/z
r1~B1C !uT111/z !1, (2.269)
which is always justified at T50 and is violated only in anarrow critical region near the critical point r1(B1C)uT111/z50 for TÞ0. We note that this derivationof the Ginsburg criterion is justified only when d1z24.0 and u remains small after renormalization.
The free energy can be computed from the solution ofthe renormalization-group equation. The specific heatcoefficient g5C/T at low T is calculated as
g}g01O~T2! (2.270)
in the quantum regime with a constant g0 , while
g}ln T (2.271)
for z5d and
g}g01aT1/z (2.272)
for z,d in the classical regime. These are indeed theresults obtained in the SCR approximation, which is es-sentially a treatment by the Gaussian fixed point withself-consistent determination of the coefficients of theGaussian term. When this description is justified, it isnatural to expect that x(q) follows the criticality of themean-field theory and hence the Curie-Weiss law x(q)
Rev. Mod. Phys., Vol. 70, No. 4, October 1998
;C/(T1u), although the coefficients C and u may berenormalized from the bare values. This is related to theCurie-Weiss law derived in the SCR approximation,where treatment by the Gaussian fixed point is justifiedaround D;0 even at low temperatures T;0. In this re-gion, as pointed out by the SCR approximation, the tem-perature dependence of the local moment ;T plays animportant role in deriving the Curie-Weiss behavior.Consequences of the Gaussian treatment for otherquantities such as the susceptibility, spin correlations,and resistivity are discussed from intuitive picture inSecs. II.D.1 and II.D.8. In the strong-correlation regime,the amplitude of the order parameter grows faster thanthe weak-correlation regime above the transition tem-perature, where the low-energy excitation is describedthrough nW i and u i by Eq. (2.156). In this region, theGaussian treatment described in this subsection is nolonger justified, even in the disordered phase. TheGaussian treatment also becomes invalid when the dis-persion of the relevant gapless excitation becomes flatterin low-dimensional systems. In this case we have to con-sider the scaling analysis. We discuss in Sec. II.F whenand how the Gaussian treatment breaks down.
E. Numerical studies of metal-insulator transitionsfor theoretical models
Algorithms for numerical computation of stronglycorrelated systems have recently been developed andapplied extensively. Several comprehensive articles inthe literature are available on these algorithms and theirapplications (Scalapino, 1990; von der Linden, 1992; Ha-tano and Suzuki, 1993; Imada, 1993d, 1995d; Dagotto,1994). Two different algorithms have been widely stud-ied and applied, so far. One is the exact diagonalizationof the Hamiltonian matrix including the Lanczosmethod. Using this method, one can obtain physicalquantities with high accuracy but only for small clusters.Tractable system size is strictly limited because the nec-essary memory size increases exponentially with systemsize. For instance, for the Hubbard model, the largesttractable number of sites for the ground state is around20. The exact diagonalization method has close ties withthe configuration-interaction method, which is the sub-ject of Sec. III.A.1.
Rigorous treatments of finite-temperature propertiesas well as dynamic properties are possible only when theHamiltonian matrix is fully diagonalized. However, fulldiagonalization by, for example, the Householdermethod is possible only for even smaller-sized systemthan the Lanczos method for the ground state only. Torelax the severe limitation of tractable size for treatingfinite-temperature and dynamic properties, a combina-tion of diagonalization and statistical sampling was in-troduced a decade ago (Imada and Takahashi, 1986). Inthis method, the trace summation is replaced by a sam-pling of randomly generated basis states, while theimaginary-time or real-time evolution, e2tH or eiHt, iscomputed exactly as in the power method. In this quan-tum transfer Monte Carlo method and the quantum mo-

1093Imada, Fujimori, and Tokura: Metal-insulator transitions
lecular dynamics method, the tractable system size is ex-tended to sizes comparable to the Lanczos method. Avery similar method was also applied recently to the t-Jmodel by replacing the power method with Lanczos di-agonalization (Jaklic and Prelovsek, 1994).
The quantum Monte Carlo method provides anotherway of calculating strong-correlation effects for rela-tively larger systems. A frequently used algorithm ofquantum Monte Carlo calculation is based on the path-integral formalism combined with the Stratonovich-Hubbard transformation. This takes a similar startingpoint to that of the method described in Secs. II.C andII.D. The Stratonovich-Hubbard variable employed inthe Monte Carlo calculation is usually chosen to breakup the interaction into two diagonal operators. A crucialdifference from the Hartree-Fock-type treatment is thatdynamic and spatial fluctuations of the Stratonovich-Hubbard variables are taken into account numerically inan honest fashion in contrast to saddle-point estimates,static approximations, or Gaussian approximations em-ployed in the mean-field-type treatments. Therefore, interms of interaction effects, the quantum Monte Carlostudy provides a controlled method of calculation. Adrawback of the numerical methods is that they cantreat only finite-size systems. Thus careful analyses offinite-size effects are important in numerical studies, es-pecially for low-energy excitations.
There exist various types of algorithms for quantumMonte Carlo simulations. For the algorithm for fermionsystems with the Stratonovich-Hubbard transformationdescribed above, readers are referred to the literature(von der Linden, 1992; Hatano and Suzuki, 1993; Imada,1993d, 1995d). In addition to this algorithm, several dif-ferent methods are known. The so-called world-line al-gorithm is a powerful method for nonfrustrated quan-tum spin systems as well as for fermion models in onedimension. Recently for the world-line method, two use-ful algorithms have been introduced. One is the clusterupdating algorithm or the loop algorithm (Evertz, Lana,and Marcu, 1993; Evertz and Marcu, 1993), which wasdeveloped based on the original cluster algorithm forclassical systems (Swendsen and Wang, 1987). By usingthe cluster algorithm, one can update the configurationof a large cluster at once, so that the sample can be moreefficiently updated with shorter autocorrelation time.This is especially powerful for example, when the criticalslowing down is serious near the critical point. The otheruseful algorithm is for continuous time simulation,where the path integral can be simulated without takinga discrete time slice, so that the procedure to take thecontinuum limit of the breakup in the time slice can beavoided (Beard and Wiese, 1996). In 1D systems, someother efficient methods of numerical calculation havealso been developed. The density-matrixrenormalization-group (DMRG) method developed byWhite (1993) is a typical example, where the numericalrenormalization-group method originally developed byWilson (1975) is successfully extended to a study of theground state of 1D lattice models using arenormalization-group scheme applied to the density
Rev. Mod. Phys., Vol. 70, No. 4, October 1998
matrix by properly considering the boundary conditionof the system. It was recently applied, as well, to a latticeof stripe such as 63n and 83n square lattices to discuss2D systems (White and Scalapino, 1996). The recentlydeveloped constrained path-integral method also ap-pears to give high accuracy in any dimension, although itrelies on a variational estimate (Zhang, Carlson, andGubernatis, 1997).
There is an enormous literature on the numerical in-vestigation of strongly correlated systems, especially onmodels for high-Tc cuprates. Because extensive reviewsof numerical results on strongly interacting lattice fer-mion models are available elsewhere (Scalapino, 1990;von der Linden, 1992; Imada, 1993d, 1995d; Dagotto,1994), here we give only a brief summary of results di-rectly related to the metal-insulator transition and theanomalous metallic states near it. We do not discuss indetail the superconducting properties studied by nu-merical methods. The reader is referred to other reviews(Scalapino, 1995, and the references cited above).
Near the MIT point, various quantities exhibit criticalfluctuations. Here we discuss calculated results for theHubbard model, the d-p model, and the t-J model.Most of the effort in numerical studies is concentrated in1D and 2D systems without orbital degeneracy, partlydue to the interest in these systems in relation to thehigh-Tc cuprates and partly due to the feasibility of es-timating finite-size effects within present computer capa-bilities. Another important motivation for investigatinglow-dimensional systems is that they show a variety ofinteresting and anomalous quantum fluctuations. To un-derstand real complexity in d-electron systems with or-bital degeneracy, an algorithm for the degenerate Hub-bard model, treating the MIT and orbital and spin-fluctuation effects, was developed and applied byMotome and Imada (1997, 1998).
1. Drude weight and transport properties
As we discuss in Sec. II.F.3, the Drude weight and thecharge compressibility are the most basic and relevantquantities for discussing the Mott transition. The Drudeweight D for periodic systems is defined from thefrequency-dependent conductivity s(v) as
s~v!5Dd~v!1sreg~v! (2.273)
at T50 where sreg describes the contribution from in-coherent excitations and must be smooth as a functionof v.
The Drude weight has been calculated by the exactdiagonalization method for the 1D and 2D Hubbardmodels as well as for the t-J models.2 Although the ex-trapolation to the thermodynamic limit is difficult be-cause of small system sizes, it appears to show that the
2Exact diagonalization studies include those of Moreo andDagotto, 1990; Sega and Prelovsek, 1990; Stephen and Horsch,1990, 1992; Fye et al., 1991; Wagner, Hanke, and Scalapino,1991; Dagotto, Moreo, Ortolani, Riera, and Scalapino, 1991;Tohyama and Maekawa, 1992; Tsunetsugu and Imada, 1997.

1094 Imada, Fujimori, and Tokura: Metal-insulator transitions
Drude weight decreases continuously and vanishes athalf filling. The vanishing Drude weight clearly showsthe appearance of the Mott insulator at half filling. TheHubbard model and the t-J model show similar behav-iors, as can be seen in Figs. 16 and 17. In 1D systems,exactly solvable models follow D}d , as we show in Sec.II.F. In constrast, 2D systems seem to follow D}d2
(Tsunetsugu and Imada, 1998).Experimental results on the cuprate superconductors
and several other transition-metal oxides such asLa12xSrxTiO3 appear to show similar continuous reduc-tion of the Drude weight with decreasing doping con-centration (see Sec. IV). In the strict sense, the Drudeweight is defined as the singularity of the conductivity at
FIG. 16. Diagonalization result for the total kinetic energy Kin (a) and Drude weight D in (b) as a function of electronfilling ^n& in the ground state for the 434 cluster of the Hub-bard model: triangles, U/t54; squares, U/t58; pentagons,U/t520; hexagons, U/t5100. The curves without symbols arefor U50. From Dagotto et al., 1992.
FIG. 17. The same as Fig. 16 as a function of hole dopingconcentration d[x512^n& for the 434 cluster of the t-Jmodel: squares, J/t50.1; solid triangles, J/t50.4; open tri-angles, J/t51. From Dagotto et al., 1992.
Rev. Mod. Phys., Vol. 70, No. 4, October 1998
v50 and T50, but experimental results always sufferfrom finite-temperature broadening as well as lifetimeeffects from the impurity scattering. This issue is furtherdiscussed in Secs. II.F and IV.
The frequency-dependent conductivity s(v) has alsobeen calculated in the Hubbard and t-J models (Inoueand Maekawa, 1990; Moreo and Dagotto, 1990; Segaand Prelovsek, 1990; Stephen and Horsch, 1990). It waspointed out that the 2D system under doping has largeweight in the incoherent part sreg(v) inside the originalcharge gap. Upon doping, in addition to the growth ofthe Drude-like part, the weight is progressively trans-ferred from the higher v region above the charge gap ofthe insulator to the region inside the gap as shown inFig. 18. This is similar to what happens in the cupratesuperconductors (see, for example, Uchida et al., 1991)as discussed in Sec. IV.C. It was also pointed out thatthe long tail of s(v) at large v seen in the numerical
FIG. 18. Optical conductivity s(v) of the t-J model with onehole at T50: (a) two-dimensional 434 cluster for threechoices of J/t50.25, 0.5, and 0.75; (b) one-dimensional 16-sitecluster at J/t50.5 for the S51/2 ground state (solid curve) andthe S515/16 ferromagnetic state (dashed curve). Note that theDrude peak appears at a finite frequency v;0.1 due to theopen boundary condition. The spectra are broadened withwidth 0.1. The inset in (a) shows the case with a higher reso-lution (the broadening is 0.02). The inset in (b) shows theweight integrated from 0 to v. From Stephan and Horsch,1990.

1095Imada, Fujimori, and Tokura: Metal-insulator transitions
results is similar to the experimental results (Azraket al., 1994). In contrast with 2D systems, the incoherentpart of the charge excitation is not clearly seen in 1Dsystems under doping, as shown in Fig. 18 (Stephen andHorsch, 1990). The transferred weight from the regionabove the gap is exhausted only in the coherent Drudepart. Recently, it was suggested that the integrablemodel in 1D has a finite Drude weight with the d-function peak at v50 in s(v), even at finite tempera-tures (Zotos and Prelovsek, 1996). It should be notedthat the overall feature of s(v) of the single ladder sys-tem shows an incoherent tail similar to the 2D case, incontrast to the naive expectation of similarity to 1D sys-tems (Tsunetsugu and Imada, 1997).
For the t-J model in 2D, in the temperature range ofthe superexchange interaction and lower, s(v) shown inFig. 19 and calculated by Jaklic and Prelovsek (1995a)appears to follow
s~v!512e2bv
vC~v! (2.274)
and the current correlation function
C~v
1096 Imada, Fujimori, and Tokura: Metal-insulator transitions
vergence factor h (Shastry, Shraiman, and Singh, 1993;Assaad and Imada, 1995). The canonical correlation^P ;Q& is defined by
^P ;Q&[E0
b dl
bTr@e2bHelHPe2lHQ# . (2.279)
Here the averaged kinetic energy is denoted by ^K& andthe current operator is given by
ja52i(iW ,s
@ t iW ,aW a~AW !c iW ,s
† c iW ,1aW a ,s
2t iW1aW a ,2aW a~AW !c iW1aW a ,sc iW ,s# (2.280)
and
t iW ,aW~AW !52t expS 2pi
F0E
iW
iW1aWAW •d lW D , (2.281)
with the flux quantum F0 and the vector potential AW .Here, a hypercubic lattice structure is assumed for sim-plicity. Since the effect of the lifetime t of the charge iswashed out in the frequency v@1/t , RH at large v rep-resents a simpler and more intrinsic property of strongcorrelations than the zero-frequency Hall coefficient. Infact it is a better probe to measure the carrier density, aspointed out by Shastry et al. (1993). At v→` , one canshow
RH* [RH~v→`!524Ld
e2B
i^~ jx ,jy!&
^K&2 (2.282)
with the commutator (a ,b)5ab2ba . Recently the v-dependent Hall coefficient was measured experimentally(Kaplan et al., 1996).
The temperature dependence of the Hall coefficientRH* as well as its frequency dependence has been calcu-lated by several authors (Shastry, Shraimann, and Singh,1993; Assaad and Imada, 1995; Tsunetsugu and Imada,1997). In the strong-correlation regime of 2D systems, itshows that, at small hole doping, RH* is electronlike(RH* ,0) with small amplitude at T.U , while it be-comes hole-like (RH* .0) with large amplitude at J,T,U where U and J are the energy scales of the repul-sive interaction and the superexchange interaction, re-spectively. When T is smaller than the energy scale ofJ , RH* again decreases and becomes negative (electron-like; see Fig. 21).
These two crossovers are explained by the followingsimple physical picture: At T.U , the Hall coefficientapproaches the value of noninteracting electrons be-cause the interaction effect may be neglected. In the re-gion J,T,U , the interaction effect becomes important,while the spin degrees of freedom are still degenerate,so that the particles behave essentially as spinless fermi-ons. In terms of the spinless fermions, the band is com-pletely filled for the filling corresponding to the Mottinsulator. Therefore a system with small hole doping isindeed expected to behave as hole-like with small car-rier number (that is, RH has large amplitude). When thetemperature is further lowered to T,J , the spin entropy
Rev. Mod. Phys., Vol. 70, No. 4, October 1998
is gradually released with the growth of antiferromag-netic correlations and up- and down-spin electrons startforming large Fermi surface consistently with the Lut-tinger volume. This state with large carrier number leadsto a small amplitude of the Hall coefficient. The sign ofRH itself may depend on details of the Fermi surface. Ifthe curvature of the Fermi surface is hole-like, RH* maybe positive.
Another interesting crossover happens when a spingap or pseudogap due to singlet pairing is formed. Al-though the tractable system size is limited to small clus-ters, this was numerically studied by explicitly forming aspin gap in a ladder structure of the lattice. Below thespin-gap temperature, RH* becomes large and generallypositive (Tsunetsugu and Imada, 1997), and the systemis transformed essentially to single-component bosonsnear the Mott insulator, although coexistence of singletpairs and quasiparticles with dynamic fluctuations mayshow aspects different from simple bosons. Because thehard-core bosons near the Mott insulator are mapped tothe case of dilute bosons near the vacuum by theelectron-hole transformation, the single-componentbosons near the Mott insulator behave as dilute holes.This is the basic reason for hole-like RH* with large am-plitude.
All the above seem to be consistent with the mea-sured temperature dependence of RH in the high-Tc cu-prates if the RH at large and small frequencies are quali-tatively similar. As is discussed in Secs. IV.C.1 and
FIG. 21. Temperature dependence of high-frequency Hall co-efficient RH* and equal-time spin structure factor S(p ,p) at d50.05 for 636 cluster of the 2D Hubbard model. Solid linewith no symbols corresponds to the U/t50 result. From As-saad and Imada, 1995.

1097Imada, Fujimori, and Tokura: Metal-insulator transitions
IV.C.3, the experimentally measured RH in the under-doped region showed strong temperature dependencefrom small amplitude at higher temperatures to largeand positive values basically scaled by the inverse holeconcentration 1/d at low temperatures. The crossoveroccurred at the temperature Tcr where the uniformmagnetic susceptibility decreased remarkably with de-creasing temperature (Nishikawa et al., 1993; Hwanget al., 1994; Nakano et al., 1994). All of these propertiescan be explained by gradual and progressive pseudogapformation (preformed singlet pair fluctuation) below thecrossover temperature Tcr , which decreases from thevalue ;500;600 K at small doping to 0 K in the over-doped region (d;0.2;0.3).
In the case of ladder systems, with the lattice structureof two chains coupled by rungs, however, the particulargeometry of the ladder leads to a large negative value ofRH* below the temperature of spin-gap formation, al-though it has been shown in a small cluster study that asubstantial interladder coupling generally drives RH* to alarge positive value (Tsunetsugu and Imada, 1997). Inmost of the above cases, the frequency dependence ofRH(v) has not yet been examined systematically. How-ever, the calculated v dependence available so far ap-pears to show similar behavior between small and largev. It is not clear whether RH(v) has a strong v depen-dence at the frequency scale of the inverse relaxationtime t21 of carriers.
2. Spectral function and density of states
Two other quantities important to our understandingof the MIT and anomalous metallic states are the spec-tral function A(k,v) and the density of states r(v) de-fined from Eqs. (2.50), (2.56), and (2.57) as
r~v!5(k
A~k,v!, (2.283)
A~k,v!521p
Im GR~k,v!, (2.284)
GR~k,v!52iE2`
`
dt eivtu~ t !^$cks~ t !,cks† ~0 !%&,
(2.285)
where the thermodynamic average ^¯& and the Heisen-berg representation O(t)5e2iHtOeiHt are introduced.In the ground state, A(k,v) may be rewritten as Eq.(2.54). Experimentally, A(k,v) is measured by angle-resolved photoemission and inverse photoemission ex-periments as described in Sec. II.C.4. The angle-integrated intensity gives r(v). Numerically, A(k,v)and r(v) have been calculated either by the exact diago-nalization method or by quantum Monte Carlo calcula-tions combined with the maximum-entropy method.
Numerical results on A(k,v) and r(v) for the Hub-bard model and the t-J model show drastic but continu-ous change upon doping (Dagotto, Moreo, et al., 1991,1992; Stephen and Horsch, 1991; Tohyama andMaekawa, 1992; Bulut, Scalapino, and White, 1994a;Moreo, Haas, Sandvik, and Dagotto, 1995; Preuss,
Rev. Mod. Phys., Vol. 70, No. 4, October 1998
Hanke, and W. von der Linden, 1995; Preuss et al.,1997). Figure 22 shows an example of the doping con-centration dependence of r(v). The density of states athalf filling clearly shows the opening of the charge gap,as we discuss below. The chemical potential shifts imme-diately upon doping to the edge of the ‘‘Hubbard gap.’’The chemical potential slowly shifts upon further dopingwithin a large density of states observed near the gapedge. This shift is accompanied by a drastic and continu-ous reconstruction from ‘‘upper’’ and ‘‘lower’’ Hubbardband structure to a single merged band structure. Whenthe doping concentration is low, in the 2D Hubbard ort-J models, A(k,v) shows dispersive quasiparticle-likestructure with a bandwidth comparable to that of J inaddition to broad incoherent backgrounds, as in Fig. 23.This basic and overall structure seems to be robust insome interval of doping range. The dispersive part has aflat band structure with stronger damping around k5(p ,0) and three other equivalent points (Bulut, Scala-pino, and White, 1994b; Dagotto, Nazarenko, and Bon-insegni, 1994). The dispersions there appear to be flatterthan that expected from the usual van Hove singularity.This flatter dispersion could be related to other unusualproperties observed numerically, such as incoherentcharge transport (Sec. II.E.1), singular charge compress-ibility (Sec. II.E.3), and incoherent spin dynamics (Sec.II.E.4). This idea is discussed in Sec. II.F.11. Recently, itwas shown that the dispersion around (p ,0) followsquartic dispersion (;k4) in agreement with the picturein Sec. II.F.11 (Imada, Assaad, et al., 1998). Althoughthe numerical results of clusters have suggested the ex-istence of a quasiparticle band of width ;J , this ‘‘band’’itself could be dominantly incoherent near the Fermilevel. Because these numerical results are results on sim-plified models, more complicated features can also beobserved in realistic situations. Effects of impurity levelsand the long-range Coulumb interaction are amongthese complexities. We compare these results on theo-retical models with photoemission results on transition-metal oxides in Secs. IV.C.3, IV.C.4 and IV.D.1. In par-ticular, in a recent comparison of 1D and 2D systems byKim et al. (1996), it was suggested that weakly dispersivebands with incoherent character in 2D be contrastedwith a clearer dispersion in 1D, as is discussed in Sec.IV.D.1. This difference between 1D and 2D is relatedwith the difference in the Drude weight discussed in Sec.II.E.1.
Angle-resolved photoemission spectra of a modelcompound of the parent insulator of high-Tc supercon-ductors, Sr2CuCl2O2 (Wells et al., 1995), can be com-pared with the Monte Carlo simulations of the Hubbardas well as of the t-J model (Dagotto, 1994), since thesingle-band Hubbard model and the t-J model are effec-tive Hamiltonians for the CuO2 plane. (The top of theoccupied band is derived from the d9→d9LI local-singletspectral weight and the bottom of the unoccupied bandforms the d9→d10 spectral weight). Figure 24 shows thatin going away from k5(0,0) a peak disperses towardslower binding energies; along the (p,p) direction, thepeak reaches closest to EF at ;(p/2,p/2) and then isshifted back toward higher binding energies, in good

1098 Imada, Fujimori, and Tokura: Metal-insulator transitions
FIG. 22. Doping concentration and temperature dependenceof the density of states r(v) for 838 Hubbard model at U/t58 for (a) d50, (b) d50.13, and (c) d50.3. The ordinateN(v) is the density of states r(v) in our notation. From Bulut,Scalapino, and White, 1994a.
Rev. Mod. Phys., Vol. 70, No. 4, October 1998
agreement with the prediction of the Monte Carlo simu-lations using the t-J model and the Hubbard model.Along the (p,0) direction, on the other hand, the peakdoes not disperse so close to EF , although the t-J andHubbard-model calculations predict a peak positionnearly equal to the ;(p/2,p/2) point. That the occupiedband has maxima along the (p ,0)-(0,p) line as in theMonte Carlo study is a generic feature of the single-band Hubbard model and is also the case in the weak-coupling spin-density wave picture (Bulut et al., 1994b).The discrepancy between theory and experiment aroundthe (p,0) point remains unexplained. Around (p,0) thepeak is rather broad due to large incoherent character,leading to uncertainty that might be the origin of thediscrepancy. Another possibility is that a more realisticmodel, such as the t-t8-J model or d-p model includingapex oxygens, will be necessary (see, for example, Naza-renko et al., 1995).
FIG. 23. The spectral weight A(k ,v) by quantum MonteCarlo calculations of the 838 Hubbard model at U58t . Darkareas correspond to large spectral weight, white areas to smallspectral weight. The solid lines in (a) and (c) are tight-bindingfits of the data while in (b) they are the quantum Monte Carloresult at ^n&51.0. Preuss et al., 1997.

1099Imada, Fujimori, and Tokura: Metal-insulator transitions
3. Charge response
In connection with the vanishing Drude weight, acharge excitation gap opens at half filling. This is directlyobserved in the density of states at half filling (White,1992). A direct estimate of the charge gap is also pos-sible from Eq. (2.16). Both the quantum Monte Carlofinite-temperature algorithm applied by Moreo, Scala-pino, and Dagotto (1991) and the projector algorithmfor T50 applied by Furukawa and Imada (1991b, 1991c,1992) to the nearest-neighbor Hubbard model at U/t54 show the charge gap Dc;0.6. Recently a moreelaborate algorithm for estimating zero-temperatureproperties in the Mott insulating phase was developedusing stabilized matrix calculations (Assaad and Imada,1996a). The application of this algorithm to the Hubbardmodel at U/t54 showed Dc /t50.6660.015 (Assaad andImada, 1996b). The amplitude of the charge gap exam-ined as a function of U in the 2D Hubbard model agreedwith the prediction of the Hartree-Fock approximationfor small U but deviated for larger U , as is expected.Figure 25 shows how the charge gap scaled as a functionof U . In Fig. 25, Uren is the interaction with which theHartree-Fock equation of the Hubbard model gives thesame charge gap as the numerically observed value inthe quantum Monte Carlo. The Hartree-Fock result pre-dicts that Dc is scaled as Dc;t exp@22pAt/U# , whileHirsch (1985b) suggested a slight modification, namely,replacing the prefactor t with AtU .
The charge compressibility k is essentially the same asthe charge susceptibility xc and is defined as
xc5n2k5]n/]m (2.286)
where n is the electron density and m is the chemicalpotential. The charge susceptibility vanishes in the Mottinsulating phase because of incompressibility. However,quantum Monte Carlo results on 2D systems show thatdoped systems can be very compressible near the MITon the metallic side (Otsuka, 1990; Furukawa andImada, 1991b, 1992, 1993). In 2D systems, in contrast tothe Drude weight, the charge susceptibility xc does not
FIG. 24. Quasiparticle dispersions in angle-resolved photo-emission spectra of Sr2CuCl2O2 (Wells et al., 1995) comparedwith t-J model calculations given by solid curve (left panel)and crosses with an interpolation of crosses by dotted curve(right panel). From Bulut, Scalapino, and White, 1994a, 1994b.
Rev. Mod. Phys., Vol. 70, No. 4, October 1998
gradually and continuously vanish when one controls thedoping concentration from the metallic phase to theMIT point d50. The scaling plot of xc even shows asingular divergence in the form
xc}1/udu (2.287)
for dÞ0, as illustrated in Fig. 26 (Furukawa and Imada,1992, 1993). The singular divergence in the form of(2.287) is observed not only in the nearest-neighborHubbard model (1.1a) but also in a model extended byadding a finite next-nearest-neighbor transfer t8. Thisindicates that the origin of this scaling has nothing to doeither with electron-hole symmetry, perfect nesting, orwith the Van Hove singularity because they are absentin a model with nonzero t8. Similar behavior is also ob-served in the 2D t-J model (Jaklic and Prelovsek, 1996;Kohno, 1997). In 1D systems the same scaling xc}d21 isderived in exactly solvable cases, as we shall see in Sec.II.F.6. There we shall discuss how the 1D and 2D sys-tems differ in terms of the quantum phase transition de-
FIG. 25. The renormalized interaction Urn derived so as toreproduce the numerically observed charge gap by theHartree-Fock calculation is plotted against the bare U for the2D Hubbard model (from N. Furukawa and M. Imada, unpub-lished). This indicates that the Hartree-Fock gap becomes cor-rect for small U .
FIG. 26. Chemical potential vs d2 for the 2D Hubbard modelof various sizes at T50: open symbols, without next-nearest-neighbor transfer t8; filled symbols, with t850.2. From Fu-rukawa and Imada, 1993.

1100 Imada, Fujimori, and Tokura: Metal-insulator transitions
spite their seemingly identical behavior. This is due tothe difference in universality class. Experimental aspectsof xc and the chemical-potential shift upon doping of a2D MIT are discussed in Secs. IV.C.1 and IV.G.5 andinterpretation in terms of Fermi-liquid theory is given inSec. II.D.1.
When the charge susceptibility is singularly divergentas a power law of d for d→10, the single-particle de-scription of low-energy excitations is made possible onlyby the divergence of the effective mass of a relevantparticle. This is in contrast with the usual transition be-tween metals and band insulators, in which the numberof carriers goes to zero as the effective mass of the qua-siparticle remains finite. This numerical study by Fu-rukawa and Imada prompted subsequent theoreticalstudies of continuous MITs based on the scaling theory,the main subject of Sec. II.F.
When the charge susceptibility is scaled by Eq.(2.287), it may be regarded as tending strongly towardphase separation as d→0 although real phase separationis not achieved. In fact, a continuous transition to aphase-separated state may be probed by the singularityxc→` . The growth of charge-density fluctuations, ob-served when xc is enhanced is reminiscent of the pro-posal of phase separation by Visscher (1974) and Emery,Kivelson, and Lin (1990). The possibility of phase sepa-ration in the 2D t-J model was examined recently byHellberg and Manousakis (1997), who claimed to find aphase separation for any J/t at close to half filling. Thisresult contradicts the observation of Kohno mentionedabove. The numerical methods of these two studies aresimilar, while Hellberg et al. derived the opposite con-clusion basically by relying on a single data point nearhalf filling. Further studies in the t-J model are clearlyneeded, including a reexamination of the convergence tothe ground state for this region. The quantum MonteCarlo results in the Hubbard model imply that xc di-verges only for d→10, and there the transition to aMott insulator takes place without a real phase separa-tion. If a phase separation took place at finite dopingconcentration, the quantum Monte Carlo method couldindeed detect it, as we shall see later in the case of theIsing-like boson t-J model in Sec. II.E.12. We of coursehave to note here the limitation of the numerical studyfor the ultimate limit of d→0, because the numericalresults can be obtained only at finite d in finite-size sys-tems. In any case, the overall numerical results indicatethat rapid growth of the charge compressibility and thetendency towards phase separation do exist near halffilling. It is interesting to regard the critical enhancementof xc at small d as a general tendency not of static but ofdynamic fluctuation toward the phase separation. Infact, static phase separation is suppressed due to thelong-range Coulomb force, ignored in this discussion,and the above controversy is not so serious in real ma-terials. The dynamic phase separation provides an alter-native view to Eq. (2.287). We discuss this issue furtherin Secs. II.H.3, IV.C., and IV.E.
Rev. Mod. Phys., Vol. 70, No. 4, October 1998
4. Magnetic correlations
Effects of spin fluctuations are another intensivelystudied issue. In low-dimensional systems, the antiferro-magnetic correlation is under the strong influence ofquantum fluctuations. The one-dimensional spin-1/2Heisenberg model and the Hubbard model at half fillingshow a power-law decay of the antiferromagnetic corre-lation at T50, ^S(r)•S(0)&}1/r . For spin-1/2 systems,the spin-wave theory in 2D predicts the existence of an-tiferromagnetic order (Anderson, 1952; Kubo, 1952).Although the existence of long-range order is proven fora spin S>1 on a square lattice (Neves and Perez, 1986;Kubo and Kishi, 1988), at the moment, no rigorousproof for long-range order exists at S51/2, even fornearest-neighbor coupling on a square lattice. QuantumMonte Carlo results on the square-lattice Heisenbergmodel appear to show antiferromagnetic order at T50(Okabe and Kikuchi, 1988; Reger and Young, 1988;Makivic and Ding, 1991). In the 2D Hubbard model,quantum Monte Carlo results also suggest the existenceof antiferromagnetic long-range order in the Mott insu-lating phase, d50 (White et al., 1989). The existence oflong-range order is also inferred in a parameter regionof the d-p model (Dopf, Wagner, et al., 1992).
In the 2D Hubbard model, long-range order appearsto be lost immediately upon doping (Furukawa andImada, 1991b, 1992). The Fourier transform of theequal-time spin-spin correlation function
S~k!513 E e2ik•r^S~r!•S~0 !&dr (2.288)
shows a short-ranged incommensurate peak at k5Qaway from the antiferromagnetic Bragg point k5(p ,p) when the doping proceeds as we see in Fig. 27(Imada and Hatsugai, 1989; Moreo, Scalapino, et al.,1990; Furukawa and Imada, 1992). Similar incommensu-rate peaks are observed in the 2D t-J model (Moreo andDagotto, 1990) and in the d-p model (Dopf, Mura-matsu, and Hanke, 1992). Figure 28 indicates that thispeak value S(Q) becomes finite for dÞ0, which meansthe disappearance of long-range order in the whole me-tallic region, dÞ0. The scaling of S(Q) appears to follow
S~Q!}1/d , (2.289)
which can be interpreted as the antiferromagnetic corre-lation length jm scaled by jm}d21/2 (Furukawa andImada, 1993). Here it should be noted that the existenceof an antiferromagnetic correlation length in the metal-lic phase is nontrivial because the correlation at an as-ymptotically long distance should follow a power-lawdecay in the usual spin gapless metals and, naively, thisshould lead to divergence of the correlation length. TheMonte Carlo results in 2D suggest that the spin correla-tion of the period given by the wave number Q is con-stant as in the Heisenberg model for the distance 1!r!jm while it decays as a power law }1/rg with g.2 inthe region r@jm . In the 1D doped Hubbard model, ithas been established that the incommensurate spin cor-relation decays as 1/r for 1!r!jm while as 1/r11Kr for

1101Imada, Fujimori, and Tokura: Metal-insulator transitions
r@jm with jm}d21 (Imada, Furukawa, and Rice, 1992;Iino and Imada, 1995). Kr is the exponent of theTomonaga-Luttinger liquid given in Sec. II.G.1. Thisnontrivial way of defining jm in 1D and 2D is furtherdiscussed in Sec. II.F.10. We note that the immediatedestruction of antiferromagnetic order, which is numeri-cally observed, may be a characteristic feature in single-band 2D systems.
Experimentally, so far we have no definite example ofan antiferromagnetic metal near the Mott insulator inhighly 2D single-band systems, in agreement with theabove numerical studies. As is well known and discussedin Sec. IV.C, the cuprate superconductors in general loseantiferromagnetic order upon small doping without anyindication of antiferromagnetic metals. Antiferromag-netic order survives up to d50.02, while insulating be-havior persists until d50.05 for La22d SrdCuO4. TheMIT at small but finite d is clearly due to Andersonlocalization under random potentials.
In 3D systems, however, antiferromagnetic metalsmay exist, although no numerical study is available sofar. They have been found adjacent to the Mott insula-tor in limited examples, such as NiS22xSex with pyritestructure and V2O32y , as will be discussed in Sec. IV.A.However, it should also be noted that these two materi-als have orbital degeneracies with spins larger than 1/2in the insulator, which may stabilize the antiferromag-netic metals. In the weak-correlation regime, other ex-amples of antiferromagnetic metals are known, for in-
FIG. 27. Incommensurate peak in the momentum space ofequal-time magnetic structure factor S(q ,t50) for the 2DHubbard model of a 10310 cluster at T50: (a) d50.18; (b)d50.26; (c) d50.42; and (d) d50.5 at U/t54. From Furukawaand Imada, 1992.
Rev. Mod. Phys., Vol. 70, No. 4, October 1998
stance in such d-electron systems with orbitaldegeneracy as V3Se4, V5Se8, and V3S4. Even in 3D, sofar, antiferromagnetic metals are observed only in caseswith strong orbital degeneracy. From both theoreticaland experimental viewpoints, the stability of antiferro-magnetic and metallic phases near the Mott insulator forsingle-band systems, even in 3D, calls for further study.It is not clear whether the lower critical dimension ofantiferromagnetism in metals, dml , is even higher thanthree for systems without orbital degeneracy, that is,two-component systems. This uncertainty is due in partto the difficulty of finding an effectively single-band sys-tem in 3D.
The temperature dependence of the antiferromag-netic correlation length jm has also been studied exten-sively by numerical approaches. In the undoped case, jmcontinuously and rapidly increases until T→0 becausethe antiferromagnetic transition takes place at T50 in2D. Chakraverty, Halperin, and Nelson (1989) pointedout the relation of the quantum Heisenberg model in 2Dto the O(3) nonlinear sigma model in 3D and suggestedthe existence of two regions, namely, where jm}1/T athigher temperatures (the quantum critical regime) andwhere jm increases exponentially at lower temperaturesin the renormalized classical regime. This basic picturehas been more or less confirmed numerically (for ex-ample, Makivic and Ding, 1991).
At finite doping, jm(T) was also computed for the 2DHubbard model (Imada, 1994a). It displayed a sharpcontrast with the undoped case. Both jm and the peakvalue of the equal-time spin structure factor S(Q)started growing at high temperatures, T.J . With de-creasing temperature, however, they showed rapid satu-ration at rather high temperatures, as in Fig. 29. Forexample, at d;0.15, jm more or less saturated at T;Jand did not grow below it. This means that jm quicklyapproaches the intrinsic correlation length ;1/Ad givenfrom Eq. (2.289). The temperature below which jm be-comes more or less temperature independent is denotedas Tscr . Tscr rapidly increases from 0 at d50 to Tscr;J at
FIG. 28. Inverse of equal-time spin structure factor S21(Q ,t50) at the peak point q5Q as a function of doping d for the2D Hubbard model at U/t54 with various sizes. From Fu-rukawa and Imada, 1992.

1102 Imada, Fujimori, and Tokura: Metal-insulator transitions
d;0.15;0.2. A similar and consistent result was alsoobtained in the 2D t-J model by Jaklic and Prelovsek(1995b), who applied the finite-temperature Lanczosmethod mentioned above and found that Im x(q,v)/vhas a peak around (p,p) and grows with decreasing tem-perature, while the width in v and q is temperature in-dependent at T,J for the doping d;0.15; see Fig. 30.This peak structure is associated with the ‘‘incoherentpart’’ of the spin correlation, while the ‘‘coherent part’’has only a low weight at lower frequencies when thedoping concentration becomes low. This coherent partmay give rise to the Fermi-surface effect at low tempera-tures, which is associated with a power-law decay of thespin correlation at long distances in metals.
These numerical results are consistently interpretedby the following picture, as discussed by Imada (1994a)and Jaklic and Prelovsek (1995b): Although it is notcompletely correct, it is useful to analyze the spin corre-lation as the sum of incoherent and coherent parts. Asthe doping concentration decreases, the weight of thecoherent part decreases to zero and the incoherentweight becomes dominant. The coherent part comesfrom an asymptotically long-time and long-distance partbeyond tm([jm
z ) and jm , where the correlation decaysas a power law at T50. Here z is the dynamic exponentdiscussed in detail in Sec. II.F. The incoherent partarises from the short-time and short-distance part (t,jm
z and r,jm). As jm→` with decreasing d, it is clearthat the incoherent spin correlation dominates and thecoherent weight vanishes. The spin structure factor
S~q,v
1103Imada, Fujimori, and Tokura: Metal-insulator transitions
Im x(q,2v)52Im x(q,v), leading to the result that*dq Im x(q,v) is universally scaled as
E dq Im x~q ,v!}~12e2bv! (2.294)
at v,jm2z when the incoherent contribution is domi-
nant. It was pointed out (Imada, 1994a) that this ex-plains the neutron and NMR results in high-Tc cuprateswhere *dq Im x(q,v) is reported to be universallyscaled by v/T (Hayden et al., 1991a; Keimer et al., 1992;Sternlieb et al., 1993) while the NMR relaxation rateT1;const at T.Tcoh (Imai et al., 1993). The coherencetemperature Tcoh is estimated to be ;100;300 K at theoptimal doping d;0.15. More detailed analysis of theantiferromagnetic correlation based on scaling theory isgiven in Sec. II.F.10. Experimental aspects of high-Tccuprates are discussed in Secs. IV.C.1 and IV.C.3.
5. Approach from the insulator side
So far we have discussed the Mott transition from themetallic side. Recently, a method of probing the transi-tion from the insulator side was developed (Assaad andImada, 1996a, 1996b). If the transition is continuous, itcan be shown that critical exponents in both sides shouldbe the same. Therefore, any information gained aboutthe transition from the insulator side also helps to clarifyits character on the metallic side. A large advantage ofobserving the transition from the insulator side is thatwe can avoid the negative-sign problem, which hasplagued the quantum Monte Carlo method (Loh et al.,1990; Furukawa and Imada, 1991a). For the case ofelectron-hole symmetry, as in the nearest-neighbor Hub-bard model on a bipartite lattice, the negative sign doesnot appear at half filling (Hirsch, 1983).
The insulator undergoes a transition to a metal whenthe chemical potential m approaches the critical point mcfrom the region of the charge gap. The ground-statewave function uFg& in the insulating phase should notchange when m changes because the number of particlesis fixed at N within the gap, while the Hamiltonian con-tains m only through the term mN irrespective of the
FIG. 31. Total typical and schematic structure of S(q ,v)around the antiferromagnetic peak point. The incoherent con-tribution is illustrated as a bold gray curve and the total am-plitude is given by a black solid curve.
Rev. Mod. Phys., Vol. 70, No. 4, October 1998
eigenvectors in the Hilbert space of N particles. Thetwo-body correlation function is also independent of mwithin the charge gap. However, the single-particleGreen’s function defined in Eq. (2.44) as
G~r ,t!5^Tc~r ,t!c†~0,0!& (2.295)
depends on m because it propagates a particle createdabove the gap in the N11-particle sector for the intervalof t.0. This Green’s function yields a factor ofe2t(En2m) in Eq. (2.295) for a created particle with en-ergy En . Then the m dependence of G(r ,t) is simplyemt. Therefore, when G(r ,t) at m50 is calculated,G(r ,t) at mÞ0 is given as G(r ,t ,mÞ0)5G(r ,t ,m50)emt. This means that all the G(r ,t) for m within thecharge gap can be obtained by calculating G(r ,t) once atm50. Because there may be numerical instability forlarge t due to the factor emt, a numerical stabilizationtechnique for the matrix calculation is necessary (As-saad and Imada, 1996a).
In any case, the calculated Green’s function providesthe localization length j l defined by
G~r ,v5m
1104 Imada, Fujimori, and Tokura: Metal-insulator transitions
sive studies. When disorder drives the transition inbosonic systems, a superfluid undergoes a transition to aBose glass phase. Studies of the critical exponents of thetransition from superfluid to Bose glass were motivatedby the proposal of the scaling theory (Fisher et al., 1989).The results of quantum Monte Carlo calculations appearto support the scaling theory, as discussed in Sec. II.F.12(So”rensen et al., 1992; Wallin et al., 1994; Zhang et al.,1995).
In the transition between a superfluid and a Mott in-sulator, an interesting case is that of multicomponentbosons. In analogy with the fermion t-J model (2.13),the boson t-J model of two-component hard-corebosons was investigated by Imada (1994b). In the case ofIsing-exchange for J , Monte Carlo results clearly show aphase separation into the Mott insulating phase at d50 and another component-ordered phase at a finite dcnear the Mott insulator (Motome and Imada, 1996). Aremarkable fact is that the component correlation lengthdiverges at the continuous transition point d5dc whenthe filling is changed from d.dc to d→dc while phaseseparation takes place for d,dc . Strong mass enhance-ment and vanishing superfluid density are observed withd→dc . This appears to come from a mechanism of massenhancement at finite d which is different from themechanism of the mass divergence in the 2D Hubbardmodel discussed above. The origin of the mass enhance-
FIG. 32. Localization length j l vs um2mcu for the Hubbardmodel at U/t54 for (a) two-dimensional systems, (b) one-dimensional systems. Monte Carlo data are illustrated by solidcircles. From Assaad and Imada, 1996b.
Rev. Mod. Phys., Vol. 70, No. 4, October 1998
ment was speculated to be the persistence of the Ising-like component order for d<dc .
F. Scaling theory of metal-insulator transitions
The Mott transition defined as the transition betweena metal and a Mott insulator, has two types, the filling-control transition (FC-MIT) and the bandwidth-controltransition (BC-MIT), as explained in Sec. I and illus-trated in Fig. 33. Both of these transitions are controlledby quantum fluctuations rather than by temperatures.The FC-MIT has as control parameters the electron con-centration or the chemical potential. The BC-MIT has asa control parameter the ratio of the bandwidth to theinteraction, t/U . The quantum fluctuation is enhancedfor large t/U , which stabilizes the metallic phase,namely, the quantum liquid state of electrons, whilelarge U/t makes the localized state more stable. Becausethese control parameters are intrinsically quantum me-chanical, the MIT is the subject of research in the moregeneral field of quantum phase transitions. The transi-tion itself can take place either through continuousphase transitions or through a first-order transition ac-companied by hysteresis. Critical fluctuations of metallicstates can be observed more easily near the continuoustransition point. In this section, we look more closely atcontinuous transitions.
In Sec. II.D, various theoretical approaches to theMott transition and correlated metals are described, in-cluding the Gutzwiller approximation, the Hubbard ap-proximation, the infinite-dimensional approach, slave-particle methods, and spin-fluctuation theories.Although their physical consequences vary and some-times conflict with each other, these methods share acommon limitation in that they all rely on the mean-fieldapproximation. The level of mean-field approximationsused ranges from dynamically correct treatments thatneglect spatial correlations, as in the d5` approach, tosimple static approximations on the Hartree-Fock level.In Sec. II.D.9, we have seen that the magnetic transition
FIG. 33. Schematic phase diagram of a metal and a Mott in-sulator in the plane of m/t and t/U . Route A shows filling-control transition, FC-MIT (generic transition), while route Bis the bandwidth-control transition, BC-MIT (multicriticaltransition). Dotted curves illustration density contour lines.
1105Imada, Fujimori, and Tokura: Metal-insulator transitions
in metals independent of the MIT seems to be describedby mean-field fixed points for antiferromagnetic transi-tions at d>3 and for ferromagnetic transitions at d>2or d>3 under certain assumptions. However, in this sec-tion, we discuss some rather different features of theMott transition.
In general, mean-field approximations are justified ifthe dimension is high enough. However, in the Motttransition of fermionic models, the upper critical dimen-sion beyond which the mean-field approximation is jus-tified is not so straightforwardly estimated as in simplemagnetic transitions of the Ising model. As we saw inSec. II.D.6, the infinite-dimensional approach providesan example where the mean-field approximation be-comes exact at d5` by taking account of dynamic fluc-tuations correctly. On the other hand, other mean-fieldapproximations do not take account of on-site dynamicfluctuations and incoherent excitations correctly, leadingto failure of the method even in the limit of large dimen-sions, because incoherent excitations become over-whelming near the transition point.
In low-dimensional systems, temporal as well as spa-tial fluctuations from both thermal and quantum originsbecome important. A generally accepted view is that themean-field theories for phase transitions become invalidbelow the upper critical dimension due to large spatialfluctuations.
Below the upper critical dimension, where the mean-field description breaks down, phase transitions are be-lieved in general to be described by scaling theory, withhyperscaling assumed. In this subsection we review thescaling theory of the Mott transition and examine itsvalidity based on recent numerical work. Its conse-quences and experimental relevance are also discussed.Among various Mott transitions categorized in Sec.II.B, @I-1↔M-1# , @I-1↔M-2# , @I-2↔M-2# , and@I-2↔M-4# are basically characterized by vanishingcarrier number as the MIT is approached. In this case,the universality class of the MIT may be characterized asthe same as that for a transition between a band insula-tor and a standard metal, as will be discussed in Sec.II.F.8. On the other hand, for the case of @I-1↔M-3# ,an unusual type of MIT can take place with an anoma-lous metallic phase. In this case the MIT is characterizedby diverging single-particle mass (Imada, 1993a). As weshall see below and also in Sec. II.E, critical propertiesof the MIT are observed numerically in a wide regionaround the critical point. The existence of such a widecritical region also leads to a wide region of an anoma-lous metallic state near the MIT with strongly incoher-ent charge dynamics. In this sense, the scaling argumentfor the MIT discussed in this section is not limited to anarrow region but appears to be relevant for a wide re-gion of unusual metallic behavior observed in transition-metal compounds.
In 2D systems, numerical analyses support the as-sumption of hyperscaling and the mean-field descriptionbreaks down. This observation may be related to thestrong and singular wave-number dependence of therenormalized charge excitations near the Mott insulator.
Rev. Mod. Phys., Vol. 70, No. 4, October 1998
The universality class obtained in 2D is characterized byan unusually large dynamic exponent z54. An impor-tant consequence of this new universality class is thesuppression of coherence as compared to that in thetransition between band insulators and metals. We dis-cuss in Sec. II.F.9 how and why the coherence of chargeand spin dynamics is suppressed for the Mott transition.We also discuss the instability of the large-z state tosuperconducting pairing. The success of the hyperscalingdescription is a nontrivial consequence for large z be-cause, generally speaking, the upper critical dimensionbecomes low for large z . A possible microscopic originfor hyperscaling with z54 in 2D is discussed in Sec.II.F.11. In Sec. II.F.12, superfluid-insulator transitionsare discussed.
1. Hyperscaling scenario
Continuous MITs were first analyzed in terms of thescaling concept in the Anderson localization problem inthe 70s. Scaling has proven to be useful in establishingthe marginal nature of 2D systems for localization bydisorder (Wegner, 1976; Abrahams et al., 1979). The un-derlying assumption in this approach is the hyperscalinghypothesis. In this subsection, we introduce the hyper-scaling description of the MIT caused by the electroncorrelation from more general point of view followingrecent developments (Continentino, 1992, 1994; Imada,1994c, 1995a, 1995b). Because the MIT is controlled byquantum fluctuations, we may use control parameterssuch as the electron chemical potential m or the band-width t and measure the distance from the critical pointby D. The control parameter can either be the chemicalpotential to control the filling or the bandwidth (or theinteraction), as can be seen in Fig. 33. The scaling theoryassumes the existence of a single characteristic lengthscale j, which diverges as uDu→0, and a single character-istic frequency scale V, which vanishes as uDu→0. Thecorrelation length j is assumed to follow
j;uDu2n (2.298)
as D→0, which defines the correlation length exponentn. The frequency scale V is determined from the quan-tum dynamics of the system independently of the lengthscale in general. The dynamical exponent z determineshow V vanishes as a power of D,
V;j2z;uDuzn. (2.299)
In critical phenomena, hyperscaling is believed to holdbetween the upper critical dimension dc and the lowercritical dimension dl (see, for example, Ma, 1976).Above dc , the mean-field description is justified and thehyperscaling description breaks down, whereas below dlthe transition itself disappears. Here, dc and dl shouldnot be confused with dml and dil defined in Sec. II.B. dcand dl are defined as the critical dimensions of the MITand not of the magnetic transition. Hyperscaling assertsthe homogeneity in the singular part of the free-energydensity fs in terms of an arbitrary length-scale transfor-mation parameter b :
fs~D!;b2~d1z !fs~b1/nD!;Dn~d1z !. (2.300)

1106 Imada, Fujimori, and Tokura: Metal-insulator transitions
This scaling is derived, in the absence of anomalous di-mensions, from dimensional analysis of the free-energydensity defined by
f52 limb→`
limN→`
1bN
ln Z , (2.301)
which is proportional to [frequency]3[length]2d. Thescale transformation of the argument }b1/nD in fs ismade dimensionless using the single characteristiclength scale (2.298). When the inverse temperature band the linear dimension of the system size L are bothlarge but finite, a finite-size scaling function F is ex-pected to hold as
fs~D!;Dn~d1z !F~j/L ,jz/b! (2.302)
in the combination of dimensionless arguments.Here, we confirm that the hyperscaling scenario is sat-
isfied for the transition between a metal and a band in-sulator in any number of dimensions 1<d<` . In a non-interacting fermion system, the control parameter D isthe chemical potential that controls the filling, and theground-state energy has the form
Eg;E0
kFdk kd21
k2
2m;
kFd12
2~d12 !m
5~2m !d/2
d12D~d12 !/2, (2.303)
where D is the chemical potential measured from thebottom of the band edge with a quadratic dispersion,«(kF)5kF
2 /2m . Comparison of Eqs. (2.303) and (2.300)clearly shows that the hyperscaling scenario is satisfiedwith n51/2 and z52. The characteristic length j and thecharacteristic energy V are nothing but the Fermi wave-length kF
21 and the Fermi energy EF5mF5D , respec-tively. The reason why hyperscaling holds in any dimen-sion in this case is rather trivial, namely, theHamiltonian is quadratic and it is always at the Gaussianfixed point.
2. Metal-insulator transition of a noninteracting systemby disorder
The idea of scaling for the MIT in the form first intro-duced (Wegner, 1976, 1979; Abrahams et al., 1979) forthe Anderson localization problem is certainly equiva-lent to the assumption of hyperscaling (Abrahams andLee, 1986). We introduce here the scaling function foran external field h relevant to the order parameter
fs~D ,T ,h !5b2~d1z !Fsh~b1/nD ,byhh ! (2.304)
with the exponent yh . Since the order parameter for adisordered transition is the single-particle density ofstates r at the Fermi level, we obtain the scaling of thedensity of states as
r~D!51T
]f
]h Uh50
5b2~d2yh!r~b1/nD ,byhh !
}Dn~d2yh!. (2.305)
Rev. Mod. Phys., Vol. 70, No. 4, October 1998
Since the order parameter exponent is shown to be non-critical (McKane and Stone, 1981) for a transition con-trolled by disorder, Eq. (2.305) leads to the relation yh5d . The order-parameter susceptibility also has thescaling form
x~D!51T
]2f
]h2 Uh50
5b2yh2dx~b1/nD ,byhh !. (2.306)
From the fluctuation dissipation theorem (Kubo, 1957),we see that Eq. (2.306) is equal to the density-densitycorrelation function
C~k,v!5i]n/]m
2iv1Dck2 (2.307)
at v50. Because of the noncriticality of the compress-ibility at a transition driven by disorder, we have
C~k,v50 !}Dc21k22. (2.308)
Therefore C , which follows the same scaling form as Eq.(2.306),
C~k,v50 !5b2yh2dC~bk,v50 !, (2.309)
leads to scaling of the diffusion coefficient Dc as
Dc~k,v50 !5b21d22yhDc~bk,v50 !. (2.310)
Combined with d5yh , this is indeed consistent with theoriginal scaling function of the conductivity s}Dc intro-duced by Wegner (1976) in the form
s~k,v!5b22ds~bk,bzv!. (2.311)
This demonstrates that d52 is marginal. This scalingform has inspired subsequent studies by perturbation ex-pansion in terms of «F /t in the weakly localized regime.The scaling form (2.310) is supported by numericalanalysis (MacKinnon and Kramer, 1993).
In the case of the Anderson transition, the compress-ibility k, g, and the density of states are all nonsingularat the critical point, in contrast with the Mott transition.This is because a finite density of states exists on bothsides of the mobility edge. As we shall see later, g and kare scaled by Dn(d2z), leading to z5yh5d .
So far we have discussed the noninteracting case. Totreat the Anderson transition with an interaction term,we can write the original action in the path-integral for-malism. After making the Stratonovich-Hubbard trans-formation for the interaction part with the replica trickfor the random potential, we can reduce the effectiveaction to the nonlinear sigma model,
S@Q#521
2G E dr tr„“W Q~r!…212HE dr tr„VQ~r!…
1Sint~Q !, (2.312)
where Q is an infinite matrix with matrix element Qnmab
given by spin quarternions represented by 434 complexmatrices (Finkelstein, 1983, 1984). The indices n ,m arefor the Matsubara frequencies, while a,b denote replicaindices. The c-number variables Q are obtained as theStratonovich variables from the interaction and the ran-

1107Imada, Fujimori, and Tokura: Metal-insulator transitions
dom potential combined, and Sint(Q) represents the in-teraction part. The coupling constants G54/pNFDc andH5pNF/4 are given from the density of states NF andthe diffusion constant Dc . The critical exponent n forthe transition by disorder is known to follow n>2/d(Chayes et al., 1986). Experimentally and theoretically,the critical exponents are examined for various caseswith and without magnetic field, magnetic impurities,and spin-orbit scattering. For example, under the spin-flip mechanism, as in magnetic fields, n51 has been sug-gested experimentally [for example Dai, Zhang, and Sa-rachik (1992) and Bishop, Spencer, and Dynes (1985)].When antiferromagnetic symmetry breaking exists onboth sides of the MIT, it has been argued (Kirkpatrickand Belitz, 1995) that the effect of disorder can bemapped onto the random-field problem where the hy-perscaling description is known to be modified even be-low the upper critical dimension.
So far the effect of interaction has been considered inthis nonlinear sigma model only by the saddle-point ap-proximation and hence at the Hartree-Fock level. Thecritical exponents have been calculated by perturbativerenormalization-group analysis in the « expansion. Inthe latter part of Sec. II.F, we shall see that the Motttransition must be treated by taking the interaction ef-fect beyond the Hartree-Fock level because the criticalbehavior of the MIT itself is due to the critical fluctua-tion of interaction effects. Therefore qualitatively differ-ent aspects of scaling behavior at the Mott transitionpoint appear, as we discuss later.
For more detailed discussions of the MIT caused bydisorder in the case of minor contribution of electroncorrelation effects at the Hartree-Fock level, readers arereferred to the extensive review articles of Lee and Ra-makrishnan (1985) and Belitz and Kirkpatrick (1994).An important open question remains concerning the na-ture of the MIT when both correlation effects and dis-order are crucially important near the Mott insulator. Adynamic mean-field theory (infinite-dimensional ap-proach) was recently formulated to discuss the MITwhen both electron correlation and disorder are strong(Dobrosavljevic and Kotliar, 1997). It shows the appear-ance of a metallic non-Fermi-liquid phase near the MITand strong effects of correlation even away from halffilling. A recent experiment by Kravchenko et al. (1995)appears to show the existence of a true MIT in 2D in-teracting systems, in contrast with the conventional ar-gument for noninteracting systems in which 2D systemsbecome insulating even with weak disorder. The scalingproperties of this transition have been discussed theo-retically, for example, by Dobrosavljevic et al. (1997).
3. Drude weight and charge compressibility
The Drude weight defined in Eq. (2.273) and thecharge compressibility in Eq. (2.286) are the two impor-tant and relevant quantities needed to describe the Motttransition. A Mott insulator has two basic properties,one its insulating property and the other its incompress-ibility. In particular, incompressibility is a property that
Rev. Mod. Phys., Vol. 70, No. 4, October 1998
clearly distinguishes Mott insulators from Anderson-localized insulators, whose compressibility is generallynonzero, because incoherent states localized around im-purities contribute to the compressibility. The Drudeweight and the charge compressibility are both zero inthe Mott insulating phase, whereas they are both non-zero in metallic phases. Therefore these two quantitiesmust both be nonanalytic at the Mott transition point.The existence of nonanalyticities in these two quantitiesat the transition point is also common in the transitionto a band insulator. However, as we shall see below, theway of reaching the transition point, in other words, thecritical exponents and hence the universality class, canbe different for a Mott transition and for the usual band-insulator/metal transition.
To understand the fundamental importance of theDrude weight and the charge compressibility, it is help-ful to represent them as stiffness constants to the twist inboundary conditions in the path-integral formalism. Thestiffness constant to the twist is in general useful in iden-tifying phase transitions. One simple example is found inthe ferromagnetic transition of the Ising model at thecritical temperature. Suppose one imposes two differenttypes of fixed boundary conditions at the boundaries inone spatial direction, x , in a system with a hypercubicstructure. In one of the boundary conditions, one fixesall the up spins at the boundary rx50 and rx5L , whererx denotes the x coordinate of the spatial point r. In theother boundary condition, one fixes all the up spins atrx50 and all the down spins at rx5L . Let the averagedenergy under the former boundary condition be Eu andunder the latter, Et . Then dE5lim
L→`Et2Eu must be
zero in the paramagnetic phase because the spin corre-lation length is finite, whereas dE remains nonzero asL→` in the ferromagnetically long-range-orderedphase because a domain wall in the plane perpendicularto the x axis has to be introduced only for the latterboundary condition due to the twist. The latter bound-ary condition has higher energy coming from the forma-tion energy of a domain wall.
When one wishes to establish similar criteria for theMIT, one has to work with the path-integral formalismbecause this transition is intrinsically quantum mechani-cal. Because of this quantum-mechanical nature, one hastwo ways of imposing twists in the (d11)-dimensionalspace of the path integral. One way is to impose twist inthe spatial direction while the other is to impose it in thetemporal direction. Since the wave function in a metal ischaracterized by phase coherence, while that in an insu-lator is characterized by incoherence of the phase, thesetwo types of wave functions respond differently to atwist of the phase in boundary conditions in terms ofrigidity of the phase. In particular, in the Mott insulator,space-time localized wave functions result in the absenceof phase rigidity in both the space and the time direc-tions. Below it is shown that spatial and temporalrigidities are associated with nonzero Drude weight andnonzero charge compressibility, respectively (Continen-tino, 1992 Imada, 1994c, 1995a, 1995b).

1108 Imada, Fujimori, and Tokura: Metal-insulator transitions
An infinitesimally small twist of the phase, fL , im-posed between two boundaries rx50 and rx5L may al-ternatively be expressed by a transformation of theGrassmann variable introduced in Sec. II.C in the form
cs~r,t!→cs~r,t!exp@ irx¹f# , (2.313)
where ¹f5fL /L and rx denotes the x coordinate of r.It has been shown by Kohn (1964), Thouless (1974), andShastry and Sutherland (1990) that this type of phasetwist measures the stiffness, which is proportional to theDrude weight.
In a tight-binding Hamiltonian, the transformation(2.313) may equivalently be replaced by transformingthe off-diagonal transfer term t(r ,r8)c(r)c(r8) in theHamiltonian as
t~r ,r8!→t~r ,r8!exp@ i~rx2rx8!fL /L# . (2.314)
This is nothing but the Peierls factor. In other words,Eq. (2.314) is the same as applying a vector potential
Ax5cfL /Le (2.315)
in the x direction. Because a small uniform phase twistand hence a uniform vector potential is imposed, itshould be associated with the electromagnetic responseat k5v50 in the second-order perturbation. This is in-deed shown as follows: Under the vector potential(2.315), the change in the Hamiltonian up to the secondorder in fL reads
dH52jx
LfL2
Kx
2L2 fL2 1O~fL
3 !, (2.316)
where jx and Kx are the current and the kinetic energyoperator in the x direction, respectively. In the case ofthe nearest-neighbor Hubbard model (1.1a), these op-erators in the coherent-state representation have theform
jx52t(k,s
sin kxckscks , (2.317)
Kx522t(k,s
cos kxckscks . (2.318)
The change in the ground-state energy up to fL2 is ob-
tained from the second-order perturbation as
dE5DfL
2
L22d 1O~fL4 !, (2.319)
D521Ld S 1
2d^K&1 (
nÞ0
u^0ujxun&u2
En2E0D , (2.320)
for a d-dimensional hypercubic lattice. In Eq. (2.320), un&denotes an eigenstate with the energy En and n50 de-notes the ground state. The total average kinetic energyis ^K&.
Rev. Mod. Phys., Vol. 70, No. 4, October 1998
Under the frequency-dependent vector potential Ax5Ax
0eivt, the electric field of the x component is givenby
Ex5Ax0iv/c . (2.321)
When one uses the linear-response theory (Kubo, 1957),the current response to this electric field yields the con-ductivity as
Im s~v!52e2
vD . (2.322)
From the Kramers-Kronig relation
Im s~v!5E2`
`
dv8P
v2v8Re s~v8!dv8,
the change in the energy density df5dE/Ld is given byusing the Drude weight defined in Eq. (2.273) as
df51
2pe2
fL2
L2 D1OS S fL
L D 4D . (2.323)
Equation (2.323) shows that the stiffness constant forthe spatial phase twist is proportional to the Drudeweight. An important point to keep in mind is that theDrude weight is obtained by taking the limit fL→0 firstand L→` afterwards. If the opposite limitlimfL→0limL→` is taken, one has to take account of pos-
sible level crossings at finite fL in the limit L→` , whichyields in principle a different quantity, namely, the su-perfluid density (Byers and Yang, 1961; Scalapino,White, and Zhang, 1993).
An infinitesimally small twist of the phase fb imposedbetween two boundaries t50 and t5b is equivalent totransforming the Grassmann variable as
cs~r,t!→cs~r,t!exp@ itf# (2.324)
with f5fb /b , where s in general denotes quantumnumbers other than the spatial coordinate. In case of theHubbard model, s is the spin. The transformation(2.324) may be replaced with the transformation of theHamiltonian
H→H1if(r,s
cs~r!cs~r!. (2.325)
This equivalence is proven as follows: To calculate thepartition function, one calculates the matrix element in aTrotter slice of the path integral:
L~t ,c ,H!5^c~t1Dt!ue2Dt•H[c†,c]uc~t!&
5^0u)a
„11ca~t1Dt!ca…e2DtH[c†,c]
3)g
„12ca~t!ca†…u0&
5e2DtH[c~t1Dt!,c~t!]. (2.326)
If one takes the transformation (2.325), this matrix ele-ment is transformed to
1109Imada, Fujimori, and Tokura: Metal-insulator transitions
L~t ,ceitf,H!5L~t ,c ,H!2i~Dt!fca~t1Dt!ca~t!
1O„~Dt!2…
5^c~t1Dt!ue2~Dt!$H[c†,c]1ifc†c%uc~t!&
1O„~Dt!2…. (2.327)
This proves equivalence to the transformation (2.325) inthe functional integral limit Dt→0.
From Eq. (2.325) it turns out that 2if is the same asan additional change in the chemical potential m→m
2if . Therefore the free energy as a function of the im-posed small twist should have the form
f~f !5f~f50 !1ifb
br1
fb2
2b2 k1O~fb3 !, (2.328)
where the electron density r52]f/]m and the chargecompressibility k5]r/]m are obtained as expansion co-efficients. Equation (2.328) shows that k indeed mea-sures the stiffness constant of the phase in the temporaldirection.
4. Scaling of physical quantities
Combining Eqs. (2.323) and (2.328) for the Drudeweight and the compressibility, respectively, with thefinite-size scaling form derived from hyperscaling, oneobtains useful scaling forms for physical quantities(Imada, 1994c, 1995a, 1995b; Continentino, 1994). Thisis because the finite-size scaling form (2.302) is also validfor df , namely, the difference of the free energy be-tween the cases in the presence and the absence of thetwists. From a comparison of Eqs. (2.323) and (2.302) inthe order of L22, the scaling of D is obtained:
D}Dz (2.329)
with z5n(d1z22). Comparison of Eqs. (2.302) and(2.328) yields, in the order of b21 and b22,
d}D2a11 (2.330)
and
k}D2a (2.331)
with a5n(z2d), where d denotes the doping concen-tration, that is, the density measured from the Mott in-sulator.
When hyperscaling holds, scaling of other physicalquantities can also be derived from Eqs. (2.300) and(2.302). In the insulating phase, the charge excitationgap Eg and the localization length j l defined in Eq.(2.296) should be determined from the single character-istic energy and length scale V and j, respectively. Then,
Eg}uDuzn (2.332)
and
j l}uDun (2.333)
immediately follows, where we have used the fact that nand z are identical on both sides of the transition point.This is shown by connecting the two sides via a route
Rev. Mod. Phys., Vol. 70, No. 4, October 1998
through the parameter space of D, temperature, andstaggered magnetic fields. On the metallic side, the scal-ing of the specific heat C5b2]2(ln Z)/]b2 is given fromEq. (2.302):
C5Dn~d1z !T]2
]T2 F~j/L50,jzT !. (2.334)
At the critical point, the specific heat is given from theD-independent term as
C}Td/z. (2.335)
If C5gT is satisfied at low temperatures in the metallicphase, the coefficient g follows:
g}Dn~d2z !. (2.336)
In general, if C is not linear in T but proportional to Tq
as C};gTq, g is scaled as
g}Dn~d2qz !. (2.337)
Another interesting quantity is the coherence tempera-ture TF below which the electron motion becomes quan-tum mechanical and degenerate. It is clear that TF has toapproach zero as D→0 in a continuous transition. Incase of the Fermi liquid, TF is nothing but the Fermitemperature. The existence of a single characteristic en-ergy scale with singularity at D50 leads to the scaling ofTF in the form
TF}Dnz. (2.338)
5. Filling-control transition
When the control parameter D is the chemical poten-tial m measured from the critical point mc , it representsthe filling-control MIT (FC-MIT) and, in the terminol-ogy of critical phenomena, it is called a generic transi-tion. In this case, it is possible to derive a useful scalingrelation. Because the doping concentration is d52]fs /]m52]fs /]D , it scales as
d;Dn~d1z !21. (2.339)
From the comparison of Eqs. (2.339) and (2.330), wederive
nz51. (2.340)
The characteristic length scale is then
j;d21/d, (2.341)
which is the length scale of the ‘‘mean hole distance.’’This is a natural consequence because the mean holedistance is indeed a characteristic length scale which di-verges at D50. From the scaling relation (2.340) thenumber of independent critical exponents is reduced toone in the above physical quantities. In the case of theFC-MIT, because the doping concentration d is easier tocontrol than the chemical potential, various exponentsin terms of d are summarized for convenience as follows:
j;d21/d, (2.342a)
D;dz/d, (2.342b)

1110 Imada, Fujimori, and Tokura: Metal-insulator transitions
k;d12z/d, (2.342c)
D;d11~z22 !/d, (2.342d)
g;d12z/d, (2.342e)
TF;dz/d. (2.342f)
6. Critical exponents of the filling-control metal-insulatortransition in one dimension
In several 1D systems, we can derive rigorous esti-mates of various critical exponents for the cases of inte-grable models. After comparison of various cases, itturns out that the hyperscaling scenario holds for theMIT in 1D with n51/2 and z52 for all cases (Imada,1995b; see also Stafford and Millis, 1993). This meansthat 1D is between the upper and lower critical dimen-sions of MIT. We start with the case of the Hubbardmodel. From the Bethe Ansatz solution, it is known thatthe compressibility (Usuki, Kawakami, and Okiji, 1989),the Drude weight (Shastry and Sutherland, 1990), andthe specific-heat coefficient (Takahashi, 1972; Usuki,Kawakami, and Okiji, 1989) scale as
xc}d21, (2.343a)
D}d , (2.343b)
g}d21, (2.343c)
for the 1D Hubbard model. For the supersymmetric t-Jmodel, with t5J in 1D, the Bethe Ansatz solution showsthe same scaling as in Eqs. (2.343a)–(2.343c)(Kawakami and Yang, 1991). This is actually the samescaling form as we saw in Eq. (2.303) for noninteractingfermions near a band insulator. To understand the hy-perscaling in 1D more intuitively, it is useful to considerthe bosonized Hamiltonian derived after the asymptoticspin-charge separation. As will be derived in Sec. II.G.1,the Hamiltonian for the charge part has the form
Hr5E dxS pvrKr
2Pr
21vr
2pKr~]xfr!2D , (2.344)
where the charge-density phase field fr and the conju-gate momentum Pr satisfy the Bose commutation rela-tion and constitute a noninteracting Hamiltonian withlinear dispersion, vr(k)5vruku (Emery, 1979; Haldane,1980; Schulz, 1990b). This free-boson system indeed de-scribes the case z51/n52 when vr}j21. It should alsobe noted that, when the Hubbard model is mapped tothe massive Thirring model, the transition to a Mott in-sulator with a Mott gap is mapped to the transition to aband insulator with a hybridization gap (Hida, Imada,and Ishikawa, 1983; Mori, Fukuyama, and Imada, 1994).This also shows that in 1D, the universality class shouldbe the same between the metal Mott-insulator and metalband-insulator transitions. Even in bosonic systems, theMott transition in 1D is characterized by the same uni-versality class, z51/n52 (Imada, 1995b).
As for the MIT in 1D, the universality class is alwaysthe same irrespective of the character of low-energy ex-
Rev. Mod. Phys., Vol. 70, No. 4, October 1998
citations in the metallic phase. In the metallic phase, thelow-energy spin and charge excitations can be character-ized either by free fermions or by some type ofTomonaga-Luttinger liquid. However, the critical expo-nents of the MIT do not reflect this difference. In themetallic phase, the characteristic length and energyscales for the MIT are finite and always determine acrossover scale, while the character of a liquid is associ-ated with behavior below this energy scale. The presentscaling approach treats equally the zero-temperaturetransition for different types of metals, while the univer-sality class of the transition does not necessarily specifythe nature of coherent metals.
7. Critical exponents of the filling-control metal-insulatortransition in two and three dimensions
In two or three dimensions, we have no exact solutionfor this problem. Therefore we have to rely on com-bined analyses of several numerical results. The mostimportant question to be answered is whether 2D and3D are lower than the upper critical dimension dc ornot. If dc,2, some type of mean-field theory would bejustified even in 2D, whereas we have to go beyond themean-field level if dc.2. We first review the predictionsof various mean-field theories. In the Hartree-Fock ap-proximation, the 2D and 3D Hubbard model in generalhas a phase diagram with an extended region of antifer-romagnetic order in the metallic region around the Mottinsulator, as in Figs. 10 and 11. Therefore the MIT takesplace as a transition between insulating and metallicstates, both with antiferromagnetic order. The solutionof the unrestricted Hartree-Fock approximation showsthat incommensurate periodicity at the wave-number kÞ(p ,p) appears at finite doping. Irrespective of com-mensurate or incommensurate cases, the metal-insulatortransition is in general achieved by the shrinking of holepockets. This is the case for the transition @I-1↔M-1#discussed in Sec. II.B. It appears to be realized in some3D compounds with orbital degeneracy, such asNiS22xSex , as will be discussed in Sec. IV.A.2.
Various experimental and numerical results, however,do not support this class in 2D. This is suggested by theabsence of an antiferromagnetic metal in 2D. It meansdml.2 at least unless the orbital degeneracy is too large.In this case possible types of transition in 2D would be@I-1↔M-2# and @I-1↔M-3# . Quantum Monte Carlo cal-culations first performed on the metallic side haveshown xc}d21 and an antiferromagnetic correlationlength jm}d21/2, which suggests a new universality class(Furukawa and Imada, 1992, 1993). This implication onthe metallic side has been examined in terms of the scal-ing theory, leading to the conclusion that there does ex-ist a new universality class z51/n54 in this case (Imada,1994c, 1995b). Moreover, a localization length j l scaledby j l}um2mcu2n is predicted on the insulating side. Thisprediction for the insulating side has been criticallytested by a quantum Monte Carlo calculation. The resultis j l}um2mcu2n, n50.2660.05. Therefore all the dataare consistently explained by the scaling theory with auniversality class of z54 and n51/4 for the case

1111Imada, Fujimori, and Tokura: Metal-insulator transitions
@I-1↔M-3# . These two results can be explained neitherby the Hartree-Fock approximation nor by the d5` re-sults. Indeed, neither the Hartree Fock approximationnor the d5` results satisfies the assumption of hyper-scaling [Eq. (2.300)]. For example, the Hartree-Fock ap-proximation predicts n51/2. Furthermore, scaling of thelocalization length j l excludes the possibility that theMITs in 1D and 2D belong to the same universalityclass, because j l scales following n51/2 in 1D. Thereforenumerical results on the 2D Hubbard model support thefollowing four points for single-band systems in 2D on asquare lattice:
(1) The upper critical dimension dc of the MIT satis-fies dc.2 so that none of the mean-field approaches,including the Hartree-Fock approximation and theinfinite-dimensional approach, is justified.
(2) Hyperscaling is satisfied in 2D with a new univer-sality class of n51/4 and z54.
(3) dml.2.dil , which means there are no antiferro-magnetic metals close to the Mott insulator in 2D.
(4) The universality class is different for 1D and 2Dbecause z51/n52 in 1D.In 3D systems, the universality class of MIT for the caseof @I-1↔M-3# is not well known. Experimental indica-tions in (La,Sr)TiO3 appear to support the mass-diverging-type MIT, will be as discussed in Sec. IV.B.1,and hence suggest that z.2 is also satisfied.
8. Two universality classes of the filling-controlmetal-insulator transition
Two different types of filling-control Mott transitionhave been shown to exist in the previous two subsec-tions. One is characterized by z51/n52, which is thesame as the band-insulator/metal transition. This is thecase of all 1D systems as well as of several transitions athigher dimensions, where z51/n52 is expected for@I-1↔M-1# , @I-1↔M-2# , @I-2↔M-2# , and @I-2↔M-4# inthe classification scheme in Sec. II.B. In general, thisclass of transition appears when the component degreesof freedom do not contribute to low-energy excitationsexcept in the Goldstone mode near the critical point.One way such contributions are realized is when bothsides of the critical point are in broken-symmetry phasessuch as the magnetic ordered and superconducting or-dered phases. The component degrees of freedom arealso inert when an excitation gap such as a spin gap isformed. To understand the case @I-2↔M-2# , it is helpfulto consider the strong-coupling limit, where the problemis essentially reduced to single-component bosons be-cause of the bound-state formation. Then it is equivalentto the problem of a superfluid-insulator transition, to bediscussed in Sec. II.F.12.
The other case is characterized by values of z largerthan two. This is seen in the case of @I-1↔M-3# . Two-dimensional systems with a single orbital, as in the Hub-bard model on a square lattice, are shown in numericalcalculations to follow z51/n54. Such a large dynamicexponent is associated with suppression of coherence, aswe discuss in the next subsection, and this suppression in
Rev. Mod. Phys., Vol. 70, No. 4, October 1998
turn is associated with strong incoherent scattering ofcharge by a large degeneracy of component excitations.This degeneracy, coming from softened excitations ofcomponent degrees of freedom, is due to critical fluctua-tion of component correlations.
9. Suppression of coherence
In the new universality class discussed in the previoussubsection (Sec. II.F.7), physical quantities show manyanomalous features in terms of the standard MIT, themost important of which is the suppression of coher-ence. In this subsection we discuss several unusual as-pects of this suppression for the new universality class.
Scaling theory predicts that the Drude weight is D}d11(z22)/d. As is well known, D}d is satisfied in theusual MIT, which is consistent with scaling theory whenz52. When the universality class is characterized by z51/n.2, D is suppressed more strongly than d-lineardependence at small d. For example, when z54 is satis-fied in 2D, as suggested in numerical studies, D}d2 isderived. This is one of the indications for the unusualsuppression of coherence in this universality class andindeed supported by recent results for the t-J model(Tsunetsugu and Imada, 1998). Relative suppression ofD as compared to the value D0 for the metal band-insulator transition is given by D/D0 , }d(z22)/d.
From the sum rule, the v-integrated conductivitygives the averaged kinetic energy
2^K&5E0
`
s~v!dv . (2.345)
In the strong-coupling limit, as in the t-J model, thetotal kinetic energy ^K&52(t/N)(^ij&^cis
† cjs1H.c.& isexpected to be proportional to d, that is, 2^K&}d .Therefore, from the above sum rule, the Drude part D}d11(z22)/d becomes negligibly small at small d in thetotal weight 2^K&}d if z.2. This means most of thetotal weight 2^K& is exhausted in the incoherent partsreg(v) in Eq. (2.273). In scaling theory, the form ofsreg(v) is not specified, and indeed it may depend ondetails of systems including the interband transition.However, for the intraband contribution, s(v) is ex-pected to follow s(v);(12e2bv)/v at very high tem-peratures t,T because the current correlation functionC(v) defined in Eq. (2.275) becomes temperature andfrequency insensitive for v,t . In fact, s(v);1/T forsmall v and s(v);1/v for larger v is a general featureat high temperatures (Ohata and Kubo, 1970; Rice andZhang, 1989; Metzner et al., 1992; Kato and Imada,1997). When the temperature is lowered, this incoherentpart ;(12e2bv)/v is in general transferred to theDrude part ;1/(2iv1g) below the coherence tem-perature. In the usual band-insulator metal transition,this transfer can take place for the dominant part of theweight because 2^K& and D both may be proportionalto d. Therefore the incoherent part is totally recon-structed to the Drude part with decreasing temperature.However, for z.2, this transfer takes place only in atiny part of the total weight because the relative weightof the Drude part to the whole weight is d(z22)/d, whichvanishes as d→0 for z.2. Even at T50, a large fraction

1112 Imada, Fujimori, and Tokura: Metal-insulator transitions
of the conductivity weight must be exhausted in the in-coherent part. Since scaling theory gives us no reason toexpect a dramatic change of the form for sreg(v) at anytemperature at the critical point, the optical conductivitymore or less follows the form
sreg~v!;C12e2bv
v(2.346)
even for t.v and t.T , where we have neglectedmodel-dependent features such as the interband transi-tion. The intraband part of the incoherent weight C mayfollow C}d . Such dominance of the incoherent part isconsistent with the numerical results for 2D systems, asis discussed in Sec. II.E.1. It is also consistent with theexperimental indications of high-Tc cuprates as will bediscussed in Secs. IV.C.1 and IV.C.3. The scaling of s(v)by Eq. (2.346) is another argument in support of z.2 in2D. We discuss in Sec. II.G.2 how the form of Eq.(2.346) is equivalent to the scaling of the marginal Fermiliquid. In contrast, the numerical results in 1D byStephan and Horsch (1990), discussed in Sec. II.E.1, sup-port a small incoherent part at low temperatures. Thismay be due to z52 in 1D because the majority of theweight seems to be exhausted in the Drude weight. In3D perovskite systems, the dominance of the incoherentpart is a common feature, as we see in systems such as(La,Sr)TiO3, (La,Sr)VO3, and (La,Sr)MnO3 (see Sec.IV for details). This seems to suggest z.2 in 3D, aswell. In the high-Tc cuprates, it appears that the coher-ent part is almost absent, while in 3D systems, a smallfraction of the coherent weight appears to exist whichyields T2 resistivity.
Another aspect of the suppression of coherence isseen in the coherence temperature Tcoh . The scaling ofTcoh is given by Tcoh}dz/d. Because the standard MIT ischaracterized by Tcoh0}d2/d, the relative suppressionTcoh /Tcoh0 is again proportional to d(z22)/d. When z54, as suggested by numerical results in 2D, we obtainTcoh}d2 in 2D in contrast with Tcoh0}d for z52.
In the Mott insulating phase, the charge degrees offreedom are not vital and only the spin or orbital de-grees of freedom (that is, the component degrees offreedom) contribute to low-energy excitations. Whensymmetry is broken by the component degrees of free-dom, the entropy coming from the components is re-duced essentially to zero. The entropy is also reducedwhen the component excitation has a gap, as in the spin-gap phase. Even without such a clear phase change, thegrowth of short-ranged component correlation progres-sively reduces the entropy with decreasing temperature.For example, in 2D single-band systems, exponentialgrowth of the antiferromagnetic correlations leads to ex-ponentially small residual entropy at low temperatures,except for the contribution from the Goldstone mode.When carriers are doped, an additional entropy due tothe charge degrees of freedom is expected proportionalto d. Of course, this additional entropy is assigned notsolely to the charge but also to the spin entropy, becausethey are coupled, causing the destruction of antiferro-magnetic long-range order and yielding a finite correla-
Rev. Mod. Phys., Vol. 70, No. 4, October 1998
tion length j}1/d1/d. This additional entropy }d is re-leased below the coherence temperature Tcoh .Therefore we are led to a natural consequence that ifT-linear specific heat characterizes the degenerate (co-herent) temperature region, the coefficient g should begiven by g;d/Tcoh;d12z/d. This is indeed the scalinglaw we obtained in Eq. (2.336). From this heuristic ar-gument, it turns out that the metallic phase near theMott insulator is characterized by large residual entropyat low temperatures, which is also related to the sup-pression of the antiferromagnetic correlation. This largeresidual entropy again has numerical support in the 2Dt-J model (Jaklic and Prelovsek, 1996). It may also besaid that anomalous suppression of coherence at small dis caused by short-ranged component correlations, whichscatter carriers incoherently.
In a Mott insulator, because the single-particle pro-cess is suppressed due to the charge gap, we have toconsider the two-particle process (electron-hole excita-tions) expressed by the superexchange interaction. Simi-larly, even in the metallic region, suppression of coher-ence for the single-particle process leads us to considerthe relevance of two-particle processes. In contrast withthe insulating phase, the two-particle processes in metalscontain not only the particle-hole process (the exchangeterm) but also particle-particle processes through an ef-fective pair hopping term. Such processes may be ge-nerically described by
HW52tW(i
S (ds
~cis† ci1ds1ci1ds
† cis! D 2
. (2.347)
Coherence is not suppressed anomalously near the Mottinsulator in the case of a two-particle process becausethe universality class of the two-particle transfer is givenby z51/n52, making it more relevant than single-particle transfer for small d. In fact, this term does notsuffer from the mass enhancement effect. This new termadded to the Hubband model, namely the t-U-W modelleads to the appearance of the d-wave superconductingphase (Assaad, Imada, and Scalapino, 1996, 1997; As-saad and Imada, 1997), although it is not clear whetherthe bare Hubband model implicitly contains sufficientlylarge coupling of this form. The filling-control transitionfrom superconductor to Mott insulator is indeed charac-terized by z51/n52. This shows an instability of metalsnear the Mott insulator to superconducting pairing or,more generally, an instability of the z54 universalityphase to a broken symmetry state.
A related but different view was proposed for the roleof incoherence in the mechanism of superconductivity(Wheatley, Hsu, and Anderson, 1988). According to thisproposal, lack of coherent transport in the interlayer di-rection occurs when electrons are confined due to spin-charge separation in 2D. The coherence recoversthrough interlayer tunneling after pair formation, whichleads to a kinetic-energy gain in the interlayer direction.In the analysis given in this section, the driving force forrecovering coherence by pair formation already exists ina single layer because of the novel universality class ofthe MIT. The enhancement of the pairing correlation for

1113Imada, Fujimori, and Tokura: Metal-insulator transitions
systems with a flat band near the Fermi level was alsosuggested in numerical studies (Yamaji and Shimoi,1994; Kuroki, Kimura, and Aoki, 1996; Noack et al.,1997).
10. Scaling of spin correlations
In the previous subsections, an unusually large z wasobtained when the MIT was accompanied by a simulta-neous component order transition, as in the 2D Hub-bard model. In this case, a component correlation, suchas the antiferromagnetic correlation or the orbital corre-lation, follows a particular scaling behavior near thetransition point. Here as an example we discuss the scal-ing of the antiferromagnetic correlation in a single-bandmodel. The destruction of magnetic order in the metallicregion is ascribed to charge dynamics. In this case, thescaling of the magnetic correlation length jm followsjm;j , where j is the length scale of the MIT itself, andhence the mean distance of doped holes is given by Eq.(2.342a). In other words, the magnetic correlation lengthis controlled by j because long-range order is destroyedby the charge motion. We need to be careful about thedefinition of jm in metals because they have gaplessmagnetic excitations, leading to a power-law decay atasymptotically long distances at T50. In general, at thecritical point of the magnetic transition, the spin corre-lation follows
^S~0 !•S~r!&;r2~d1z221h!eiQ•r (2.348)
with the ordering vector Q and the exponent h. Here,the magnetic correlation in the insulating phase has tobe kept unchanged up to the critical point as a functionof the control parameter, the chemical potential. Thereason is the following: The spectral representation ofthe spin correlation
^S~0 !•S~r!&51Z (
m^muS~0 !•S~r!um&e2b~Em2mN !
(2.349)
does not contain an explicit dependence on the chemicalpotential m at T50 because the number of particles iskept constant in the Mott insulating phase and ebmN inthe numerator is canceled by the same factor in the par-tition function Z . This means that the staggered magne-tization defined by
Ms51N (
iSi
zeiQ•ri (2.350)
is a constant in the insulating phase. Therefore the mag-netization exponent bs , defined by
Ms}uDsubs, (2.351)
has to satisfy bs50 and h522d2z . Note that this is acontinuous transition because jm diverges continuously,although Ms jumps at D50. In the metallic region, thisconstant staggered magnetization is cut off at jm and theantiferromagnetic correlation has to decay as a powerlaw beyond jm . The exponent for the power law at r.jm is determined from the Fermi-surface effect in the
Rev. Mod. Phys., Vol. 70, No. 4, October 1998
coherent region of metals. This nontrivial definition ofthe correlation length jm is indeed known to exist in the1D Hubbard model (Imada, Furukawa, and Rice, 1992),where the antiferromagnetic correlation decays as;1/r3/2 at r.jm while it decays as ;1/r for r,jm ex-cepting logarithmic corrections. The decay rate }1/r3/2 isindeed the asymptotic correlation in the metallic regionfor d→10, while the decay rate }1/r is the long-distance behavior in the insulating phase, because jm}1/d . In 2D, the insulating behavior at r,jm is charac-terized by a constant because of the presence of long-range order in a Mott insulator. The exponent of thepower-law decay beyond jm in 2D is not rigorouslyknown. In a Fermi liquid, it has to follow ^S(0)•S(r)&}r2g with g53 at r.jm in 2D.
With this nontrivial definition of jm in mind, the scal-ing form for the singular part of the free energy is gen-eralized to include dependence on the staggered mag-netic field hs with wave number Q as
fs~D ,hs!}uDun~d1z !Y~hs /uDuw! (2.352)
at T50, where w is the exponent for hs . From this ex-pression, the staggered magnetization is derived as
Ms5]fs
]hsU
hs→0
5uDubs. (2.353)
with the exponent
bs5n~d1z !2ws . (2.354)
Therefore, from bs50, we obtain ws5n(d1z). Thenthe staggered susceptibility x(Q,v50) is scaled as
x~Q,v50 !5]Ms
]hsU
hs→0
;D2gs (2.355)
with gs5n(d1z). Re x(q,v) and Im x(q,v)/v both havea peak around q5Q at v50 with the same critical be-havior of the peak height }D2gs and widths ;j2z in vspace and ;j21 in k space. The dynamical structurefactor is given from the fluctuation-dissipation theorem
Im x~q ,v!5~12e2bv!S~q ,v!. (2.356)
At T50, S(q ,v) also has a peak height }D2gs with thewidths j2z and j21 in v and q spaces, respectively. Theconsistency of this scaling with the spin correlation^S(r)S(0)& discussed above is confirmed from the rela-tion
S~Q,t50 !5E2`
`
S~Q,v!dv
}D2gsj2z;D12gs;jd;d21. (2.357)
This is indeed the structure factor
S~Q,t50 !5E ^S~r!S~0 !&eiQ•rdr (2.358)
expected for spins with correlation length jm5j , assum-ing the correlation is cut off at jm .
However, from the nontrivial definition of jm above,we should keep in mind that the power-law correlation

1114 Imada, Fujimori, and Tokura: Metal-insulator transitions
beyond jm is neglected in this argument. When the spincorrelation follows the exponential form e2r/jm, S(q,v)satisfies simple Lorentzian form, indeed with the widthdiscussed above. However, if the correlation is not ex-ponentially cut off but obeys a power-law decay beyondjm , this contribution of the long-ranged part has to besuperimposed around q5Q and v50 in S(q,v) as anon-Lorentzian contribution. We call this contributionthe coherent part of the spin correlation, as discussed inSec. II.E.4. Because of the presence of the coherent con-tribution, the width of the peak in q or v space becomesill defined, and the peak structure in general may have asingular structure such as a cusp at incommensurate po-sitions, as schematically illustrated in Fig. 31. Such non-Lorentzian structure is due to the coherent contributionand grows below Tcoh . We discuss temperature depen-dence later in greater detail. Although the width is notwell defined, the total weight in q or v space satisfies theabove scaling because the weight in the coherent partdoes not exceed the incoherent contribution when theexponent of the power-law decay g satisfies g.d , as inthe Fermi-liquid case (in a Fermi liquid, g5d11). Thenthe q-integrated and v-integrated intensities at T50 fol-low
E dq Im x~q ,v!}Dn2gs;d212~z21 !/d, (2.359)
E dv Im x~q ,v!}D12gs;d21. (2.360)
Next we discuss the temperature dependence of thescaling. The intrinsic correlation length jm is severelycontrolled by the hole concentration d. However, theincoherent part at distance r,jm and time t,jm
z hasbasically the same structure as for a Mott insulatorwhere there is no effect of holes. At finite temperatures,the thermal antiferromagnetic correlation length jmT isa well-defined quantity because the correlation shoulddecay exponentially at TÞ0 as e2r/jmT in both metalsand Mott insulators in 2D. If the temperature is lowered,this thermal correlation length diverges as T→0. In theMott insulating phase it leads to long-range order at T50. In metals, although jmT diverges, the intrinsic cor-relation length jm cuts off the correlation even whenjmT exceeds jm . It is rather trivial that the spin correla-tion shows essentially the same behavior at high tem-peratures if jmT,jm whether in metals or in insulators.The crossover temperature Tscr where jmT exceeds jmwas introduced in Sec. II.E.4 and is schematically shownin Fig. 34. At low doping concentration, Tscr is in gen-eral higher than Tcoh because of the suppression ofTcoh , as can be seen in Fig. 34. As is discussed in Sec.II.E.4, the dominant weight Sinc(q ,v) has no appre-ciable temperature dependence below Tscr with jm un-changed. This leads to the scaling form
Im x~q ,v!5~12e2bv!Sinc , (2.361)
where Sinc has the temperature-insensitive widths ;jm21
in q and ;jm2zJ in v space. These widths are rather wide
because they are of the order of ;2pAd in q and
Rev. Mod. Phys., Vol. 70, No. 4, October 1998
(2pAd)zJ in v. Therefore the dominant v dependenceat small v in Im x is given by the factor 12e2bv. Due tothis simplification, the neutron scattering weight*dq Im x(q,v) follows
E dq Im x~q ,v!;12e2bv (2.362)
and the NMR relaxation rate T1 is given as
1T1T
5 limv→0
E Im x~q ,v!
vf~q !dq;
1T
(2.363)
when the atomic form factor f(q) is a smooth functionwith an appreciable weight around Q. Numerical resultsin accordance with the above scaling and also in agree-ment with experimental indications in the high-Tc cu-prates are discussed in Sec. II.E.4 and IV.C. When thetemperature is lowered to T,Tcoh , complexity arisesbecause of the growth of the coherent part. In the co-herent temperature region, no microscopic calculation isavailable for the explicit temperature dependence. How-ever, because the weight of the incoherent part is domi-nant over the coherent weight for small d, the scaling ford dependence given above at T50 should be valid inthis temperature range.
A qualitatively different feature may appear in thepseudogap region of underdoped high-Tc cuprates dueto an increase in the coherent contribution from pairingfluctuations.
11. Possible realization of scaling
A microscopic description of the Mott transitionwhich satisfies the scaling theory has not yet been fullyworked out. Hyperscaling implies the existence of singu-lar points at the MIT, around which charge excitationscan be described. The large dynamic exponent z54 im-plies that the relevant charge excitation has a flat disper-sion «}k4 around those points near the MIT. This flatdispersion has to be realized around some point in kspace near the large Fermi surface if the quasiparticledescription is to be justified. We consider the case inwhich the paramagnetic phase is kept near the antifer-romagnetic insulator (@I-1↔M-3# in the category of Sec.II.B). In this case, the Fermi surface must be renormal-ized to the completely nested one when the doping con-centration decreases and the system approaches the an-tiferromagnetic insulator in a continuous fashion
FIG. 34. Scaling of Tscr and Tcoh in the plane of temperatureand doping concentration in a typical situation of 2D systems.

1115Imada, Fujimori, and Tokura: Metal-insulator transitions
(Miyake, 1996). This is because the shape of the Fermisurface changes continuously with doping while on theverge of the transition, it must coincide with the com-pletely nested shape of the Fermi level of the antiferro-magnetic insulator. Therefore at the Mott transitionpoint on the metallic side, a flat dispersion should beobserved around the completely nested surface. In nu-merical studies in the low-doping regime, as discussed inSec. II.E.2, the spectral function A(k,v) in 2D Hubbardand t-J models indeed shows a flat dispersion around k5(p ,0) (Bulut et al., 1994b; Dagotto et al., 1994; Preusset al., 1997). In addition, there are several experimentalindications from angle-resolved photoemission whichsuggest a flat dispersion around k5(p ,0) (Liu et al.,1992a; Dessau et al., 1993; Gofron et al., 1994; Marshallet al., 1996), as is discussed in Secs. IV.C.3 and IV.C.4.This flat dispersion appears to be proportional to k4,which means that the original Van Hove singularitypresent in the noninteracting case for the nearest-neighbor Hubbard model is not sufficient and the flat-ness must be much more enhanced by electron correla-tion (Imada, Assaad, et al., 1998) The description‘‘extended Van Hove singularity’’ inadequately de-scribes this circumstance, which we call a ‘‘flat disper-sion.’’ A possible way to realize the z54 universalityclass is, for example, for the dispersion to have the form«;qx
42qy4 , around k05(p ,0) with q5k2k0 . In fact,
this can occur if there is next-nearest-neighbor hoppingbut no nearest-neighbor hopping. It may occur if antifer-romagnetic correlation is enhanced critically, becausehopping to a different sublattice is suppressed by anti-ferromagnetic ordering. This flat dispersion may gener-ate a strong channel of antiferromagnetic as well as Um-klapp scattering with the momentum transfer k5(p ,p)by scattering the quasiparticle around k5(p ,0) to thataround k5(0,p). Therefore spin degeneracies (correla-tions) are strongly coupled with the charge degeneracyin momentum space, which further enhances the inco-herence of the charge excitations in a self-consistentfashion. The renormalization of the Fermi surface to aperfectly nested one, as well as the appearance of theflat dispersion around (p,0), implies that the self-energyof the single particle has a singular k dependencearound (p,0). The instability of single-particle statesagainst the two-particle process for this flat dispersionmay result in the formation of bound states around(p,0), as is discussed in Sec. II.F.9 which may be associ-ated with the pseudogap phenomena in the high-Tc cu-prates. Relationship between the scope here and experi-mental results is dicussed in Secs. IV.C.3 and IV.C.4.From both theoretical (numerical) and experimentalpoints of view, the wave-number dependence of chargeexcitations with high-energy resolution is one of thehardest quantities to measure. Further studies areneeded for a more accurate and quantitative picture.
12. Superfluid-insulator transition
The scaling theory of the superfluid-insulator transi-tion is a closely related subject, which we review briefly
Rev. Mod. Phys., Vol. 70, No. 4, October 1998
in this subsection. The situation is simpler for this tran-sition than for the fermionic Mott transition because itcan be associated with the explicitly defined order pa-rameter of the superfluid phase. This makes it possibleto write down an effective action explicitly using the su-perfluid order parameter (Fisher et al., 1989). TheHamiltonian for interacting bosons may be written as
H5H01H1 , (2.364)
H052(ij&
t ij~bi†bj1H.c.!, (2.365)
H15U(i
ni22m(
ini (2.366)
with ni5bi†bi and the boson operators bi
† and bi . WhenU is large, the Mott insulating phase appears at integerfillings similarly to the fermionic case. The system un-dergoes the Mott transition from Mott insulator to su-perfluid when one changes filling or U/t ij . The action isgiven as
S5E0
b
dt@bi†]tbi1H# . (2.367)
After making the Stratonovich-Hubbard transformationby introducing the c-number Stratonovich variablec i(t), we can expand the action in terms of c i as
S5E dk dv r~k ,v!uc~k ,v!u2
1gE dk dv ivuc~k ,v!u2
1uE dx dtuc~x ,t!u41Sphase~f ,c!. (2.368)
The superfluid order is realized by ^uc i(t)u&Þ0, which islinearly related to the superfluid order parameterF(r ,t)5uF(r ,t)ueif(r ,t) with the amplitude mode uFuand the phase f. The mean-field action is obtained byneglecting the phase fluctuation part Sphase(f ,c). How-ever, low-energy fluctuations are generated from thephase mode after integrating out the amplitude mode as
Seff5E drE0
b
dtS r~ if !1kf21rs
m~¹f!2D , (2.369)
where r, k, m , and rs are the average density, the com-pressibility, the mass, and the superfluid density, respec-tively. To derive Eq. (2.369), we used the fact that fromthe similar derivations to D and k in the fermionic case,the superfluid density rs and k are related to the phasestiffness constant when twists are imposed in the bound-ary condition of the path integral. From a comparison ofthe hyperscaling form for the singular part of the freeenergy,
fs;Dn~d1z !F~j/L ,jz/b!, (2.370)
with the form for k and rs , we obtain
k}Dn~d2z ! (2.371)

1116 Imada, Fujimori, and Tokura: Metal-insulator transitions
and
rs}Dz (2.372)
with z5n(d1z22) similarly to the fermionic case. Fora filling-control Mott transition (in other words, a ge-neric transition) in a pure system, it was deduced thatthe exponents z51/n52 and z51 hold in all dimensions(Fisher et al., 1989). For a bandwidth-control Mott tran-sition (that is, a multicritical transition) in a pure system,the effective action is mapped to the (d11)-dimensional XY model. Because of space-time isotropy,z51 holds. The upper critical dimension dc is thus givenby dc53 and at d.3, z51 and n51/2 hold. For adisorder-driven transition between a Bose glass and asuperfluid, the dynamic exponent z is considered to bez5d as in the case of the disordered transition of fermi-ons because the compressibility is nonsingular. TheBose-glass superfluid transition has been numericallystudied by the Monte Carlo method. The conclusion z52 in 2D is consistent with scaling theory (Wallin et al.,1994; Zhang, Kawashima, Carlson, and Gubernatis,1995).
G. Non-fermi-liquid description of metals
1. Tomonaga-Luttinger liquid in one dimension
This article does not attempt to review recentprogress in theoretical studies of interacting 1D systems.We summarize the elementary properties of theTomonaga-Luttinger liquid in 1D theoretical systemsonly insofar as these are needed to discuss the presentexperimental situation in d-electron systems. It is wellknown and can be easily shown that a perturbation ex-pansion in terms of the interaction breaks down in 1Dsystems. For instance, in a second-order perturbation ex-pansion of the Hubbard model in terms of U , the mo-mentum distribution function n(k)[(s^cks
† cks& showslogarithmic divergences at the Fermi level kF even in thesecond order of U , which is an indication of the break-down of the Fermi-liquid state. After summing the so-called parquet diagrams up to infinite order, we find thatn(k) at kF has a power-law singularity. Other ap-proaches such as the bosonization technique also sup-port this singularity. The breakdown of the Fermi-liquidstate in 1D was first suggested by Tomonaga (1950), whocarried out the bosonization procedure for spinless in-teracting fermions in the continuum limit. The power-law singularity of n(k) was analyzed in a similar modelby Luttinger (1963). In the seventies, experimental stud-ies on quasi-1D conductors further stimulated theoreti-cal studies on 1D systems. Exact solutions by the Betheansatz, perturbation expansions, renormalization-groupapproaches, and bosonization techniques were devel-oped (see, for example, Emery, 1979 Solyom, 1979). TheTomonaga-Luttinger liquid as a universal feature of in-teracting 1D systems was emphasized by Haldane (1980,1981). The Bethe ansatz wave function for finite-size sys-tems of the Hubbard model in the limit of U5` wasutilized to estimate numerically the singularity of metal-
Rev. Mod. Phys., Vol. 70, No. 4, October 1998
lic states (Ogata and Shiba, 1990). Recently, finite-sizecorrections to the Bethe ansatz solution have been com-bined with the conformal field theory to calculate thecritical exponents of the Tomonaga-Luttinger liquid inthe strongly correlated regime (Frahm and Korepin,1990; Kawakami and Yang, 1990; Schulz, 1990b, 1991).
Here we summarize the case of simple systems such asthe Hubbard model and the t-J model. In 1D interactingsystems, the elementary excitation is not described bythe electrons but by the spin density and charge-densitydegrees separately. When the spin and charge degrees offreedom both have gapless excitations, as in the case ofthe Hubbard model in the metallic phase, this quantumliquid is called a Tomonaga-Luttinger liquid, as com-pared to a Luther-Emery liquid, which we discuss later.The momentum distribution function n(k) of aTomonaga-Luttinger liquid is given by
^n~k !&5^nkF&2const3uk2kFuu sgn~k2kF!,
(2.373)
where the exponent u is related to the exponents forspin and charge correlation functions through Kr as
u5~Kr21 !2/4Kr . (2.374)
It is clear that the renormalization factor Z of the Fermiliquid vanishes in a Tomonaga-Luttinger liquid because^n(k)& does not have a jump at k5kF . The charge andspin correlation functions ^r(r)r(0)& and ^s(r)s(0)&,respectively, are given at the asymptotically long dis-tance r as
^r~r !r~0 !&;const1a0r221a2r2~11Kr!
3cos 2kFr1a4r24Kr cos 4kFr (2.375)
and
^s~r !s~0 !&;b0r221b2r2~11Kr!cos 2kFr . (2.376)
The Fermi-liquid state is reproduced by taking Kr51.However, in 1D interacting systems, Kr is generally dif-ferent from one. In the Hubbard model, Kr depends onU and filling in the range 1
2 <Kr<1. In the limit of halffilling, d→0, Kr→ 1
2 irrespective of UÞ0 while Kr5 12 is
satisfied at any filling in the limit U→` . This power-lawdecay of spin and charge correlations is related to thebranch cut in the single-particle Green’s function givenby
G~r ,t !;1
@x2vst1~ i/L!sgn t#1/2
1
@x2vct1~ i/L!sgn t#1/2
3@L2~x2vct1i/L!~x1vct2i/L!#2ac, (2.377)
where L is a cutoff on the order of vF /a , where a is thelattice constant, while ac5u/2. The spin and charge de-grees of freedom are decoupled in the asymptotic low-energy scale to cause the separation of spin and chargegroup velocities vs and vc . An electron propagates withthe group velocity vF in a Fermi liquid at the Fermilevel, while it separates into spin and charge degrees offreedom with different group velocities vs and vc in aTomonaga-Luttinger liquid. Because of this separation,

1117Imada, Fujimori, and Tokura: Metal-insulator transitions
the single-particle spectral weight G(q ,v) does not havea pole structure as in the Fermi liquid. After taking theFourier transform of Eq. (2.377), we find that it has thestructure
G~q ,v!5uq/kFuu
qvcFS v
vsq,vs
vcD (2.378)
with power-law singularities.Thus the spectral function A(k ,v) of the Tomonaga-
Luttinger model shows power-law singularities insteadof Lorentzian-like quasiparticle peaks. The thresholds ofthe power-law singularities for the Tomonaga-Luttingermodel are at v5vn(k2kF)1m and 2vn(k1kF)1m ,where vn5vs and vc (Meden and Schonhammer, 1993a,1993b; Voit, 1993). The density of states near the chemi-cal potential then behaves as
r~v!}uv2muu. (2.379)
Thus the photoemission spectra do not show a Fermiedge but instead have an intensity that vanishes at theFermi level as a power law.
The disappearance of the Fermi edge has beenclaimed for many organic and inorganic quasi-1D metals(Dardel et al., 1992a, 1992b; Coluzza et al., 1993; Naka-mura et al., 1994a). The photoemission spectra ofquasi-1D metals near the Fermi level indeed show thedisappearance of the Fermi edge, as predicted by Eq.(2.379). However, the exponent u obtained from the ex-perimental data is typically 0.7–2, which is much largerthan the maximum value of 0.125 predicted for the Hub-bard model (Kawakami and Yang, 1990). It has beensuggested that this is related to long-ranged electron-electron interactions in these compounds because arbi-trarily large u is possible for long-range interactions(Luttinger, 1963). Another puzzling aspect of the experi-mental results is that the energy range in which thepower-law fit is successful is as large as ;0.5 eV, in spiteof the fact that the power-law behavior of r(v) is a resultof spin-charge separation and therefore should be lim-ited at most to the maximum spinon energy, which is ofthe order of the superexchange interaction J&0.1 eV.Thus, at the moment, it is not clear whether the experi-mental indications mentioned above constitute evidencefor the Tomonaga-Luttinger liquid.
The thermodynamic quantities of a Tomonaga-Luttinger liquid are at a first glance similar to those of aFermi liquid. For example, the specific heat, the uniformmagnetic susceptibility, and the charge susceptibility atlow temperatures are given as
C;gT , (2.380)
xs;xs0;const, (2.381)
xc;xc0;const, (2.382)
respectively. At asymptotically low temperatures g is ac-tually given as the sum of spin and charge contributions,
g5gc1gs , (2.383)
where gc} 1/vc and gs} 1/vs while xs0} 1/vs and xc0} 1/vc .
Rev. Mod. Phys., Vol. 70, No. 4, October 1998
So far we have discussed the case of a quantum liquidfor both spin and charge degrees of freedom. In somecases, such as the attractive Hubbard model with U,0,the spin degrees of freedom have an excitation gap dueto the formation of a singlet or triplet bound state.When the spin gap is formed, the charge correlation hasthe asymptotic form
^r~r !r~0 !&;const1a0r221a2r2Krcos 2kFr
1a4r24Krcos 4kFr . (2.384)
This charge correlation function is compared with thesinglet and triplet pair correlation functions given by
^O†~r !O~0 !&;c1r21/Kr (2.385)
(except for logarithmic corrections), where O is theCooper pair order parameter. This class of quantum liq-uid with spin gap is called a Luther-Emery-type liquid.When Kr.1, the singlet pairing correlation dominatesover the charge-density correlation at k52kF . This isthe case for the attractive Hubbard model at dÞ0. Sev-eral attempts at models for other interacting 1D systemssuch as the dimerized t-J model (Imada, 1991), a frus-trated t-J model (Ogata et al., 1991), and the ladder sys-tem (Dagotto, Riera, and Scalapino, 1992; Rice et al.,1993; and for a review see Dagotto and Rice, 1996) alsoindicate that the singlet pairing correlation can be thedominant correlation at asymptotically long distance.
An interesting but controversial problem is the evolu-tion of three dimensionality with increasing interchaintransfer when we start from separate chains. This ques-tion was posed by Anderson (1991b) and promptedmany studies, which appear to have reached a consensusthat infinitesimally small interchain transfer is relevantand destroys the Tomonaga-Luttinger liquid in the senseof relevance in the renormalization group (Schulz, 1991;Castellani, di Castro, and Metzner, 1992; Fabrizio, Pa-rola, and Tosatti, 1992; Haldane, 1994; Nersesyan,Luther, and Kusmartsev, 1993). This problem was read-dressed by Clarke, Strong, and Anderson (1994), whoclaimed that the incoherence of the interchain hoppingprocess still remains up to a finite critical value of inter-chain transfer. A related controversy concerns the ques-tion whether the Tomonaga-Luttinger liquid can be re-alized in 2D systems as hypothesized by Anderson(1990, 1997). We shall not discuss this controversy.
Below, we assume the relevance of interchain hoppingand discuss dimensional crossover in quasi-1D systemswith weak coupling between the chains. The problemhere is how the physical properties change from those oflow-dimensional systems to those of 3D ones as a func-tion of temperature and excitation energy. If we denotethe renormalized transfer integral between the chains(planes) by t'* , the spectral function will behave as thatof a low-dimensional system at uv2mu@t'* or at pkT@t'* whereas it will show 3D character at uv2mu,t'*and pkT,t'* . The photoemission spectra of thequasi-1D organic conductor (DCNQI)2Cu salt, which isknown to have considerable interchain coupling throughintervening Cu atoms, exhibits such a behavior

1118 Imada, Fujimori, and Tokura: Metal-insulator transitions
(Sekiyama et al., 1995). The spectra show that the Fermiedge disappears at high temperatures, whereas a weakFermi edge is observed at lower temperatures. On theother hand, in the temperature dependence of the pho-toemission spectra of BaVS3, which is thought to bemore 1D like than the DCNQI-Cu salt, no sign of aFermi edge has been observed, but rather a suppressionof the intensity at the Fermi level even more pro-nounced than the power-law behavior at low tempera-tures just above the MIT (at ;70 K), as discussed in Sec.IV.D.2. The schematic T2t'* phase diagram of Fig. 35shows these experimental results in the context of di-mensional crossover as a function of temperature: Atlow temperatures, T!t'* /pk , the charge transport be-tween chains is coherent and the coupled chains behaveas a 3D system (Kopietz, Meden, and Schonhammer,1995). Therefore we denote the characteristic tempera-ture of the 3D Fermi liquid t'* /pk as TF
3D . On the otherhand, Fermi-surface nesting is more easily realized forsmaller t'* , leading to increase of the charge-density-wave or spin-density-wave transition temperature in themean-field sense, Tt
MF . Since true long-range order ispossible in 3D but not in 1D, the MIT with CDW orSDW formation occurs at the lower of Tt
MF and TF3D .
For small t'* , there is a temperature region TF3D,T
,TtMF , where there is short-range order due to dynami-
cal CDW or SDW fluctuations. The characteristic en-ergy of the Tomonaga-Luttinger liquid TTL
1D (@TF3D) is
determined by intrachain coupling (t i* , U , etc.) and istherefore independent of t'* . If t'* is small, TF
3D,TtMF
and no Fermi-liquid region exists, while (DCNQI)2Cumay belong to the large-t'* region, where the Fermi-liquid region exists. For small t'* , the short-range orderat TF
3D,T,TtMF may create a pseudogap in the spectral
function even if the system is metallic.
2. Marginal Fermi liquid
Since the discovery of the high-Tc cuprates, it hasturned out that many electronic properties of the cu-
FIG. 35. A schematic phase diagram describing a dimensionalcrossover between 1D and 3D. t'* is the (renormalized) inter-chain transfer integral. TF
3D[t'* /p is the 3D ‘‘Fermi tempera-ture,’’ Tt
MF is the mean-field CDW or SDW transition tem-perature, Tt is the MIT temperature with long-range CDW orSDW order, and TTL
1D is the characteristic temperature of the1D Tomonaga-Luttinger liquid.
Rev. Mod. Phys., Vol. 70, No. 4, October 1998
prates are unusual in the normal state in terms of thestandard Fermi-liquid theory of metals. Aside fromsome unusual properties observed in the underdoped re-gion associated with the so-called pseudogap formation,typical examples of these properties include the follow-ing, to be discussed in greater detail in Sec. IV.C:
(i) The resistivity has more or less linear dependenceon T , r}T .
(ii) The optical conductivity s(v) has a long tail pro-portional to 1/v up to the order of several tenths or even1 eV, while the true Lorentzian part of the Drude con-ductivity seems to have unusually low weight.
(iii) The Raman scattering intensity has a flat back-ground extending to several tenths of an eV.
(iv) In photoemission experiments, the quasiparticlepeak is unusually broad and accompanied by an intenseincoherent background, leading to a very small spectralweight of the quasiparticle, if any exists.
(v) Nuclear magnetic resonance of Cu shows an un-usually flat temperature dependence of the longitudinalrelaxation time T1 above room temperature for a certainrange of doping, excepting the very low doping region.
On phenomenological grounds, Varma et al. (1989)proposed a form of single-particle self-energy S to ex-plain all the above unusual features. This is substanti-ated by
( ~k,v!;g2Nb~m!2F ~v2m!lny
vc2
ip
2yG , (2.386)
where y stands for y;max(uv2mu,T). Here g is a cou-pling constant and vc is a high-energy cutoff energy.Clearly, this form leads to breakdown of the Fermi-liquid theory in a marginal way. The imaginary part ofthe self-energy is proportional to uv2mu or T so that theinverse lifetime of the quasiparticle is comparable to itsenergy. Because the quasiparticle can be defined as anelementary excitation only when its energy v is muchlarger than the inverse lifetime t21, this form makes thequasiparticle only marginally defined because v and t21
are comparable. The form of the real part of the self-energy in Eq. (2.386) is a consequence of causalitythrough the Kramers-Kronig relation. This self-energy issingular at uv2mu50 but retains Fermi-liquid propertiesin a marginal way. That is, it conserves the ‘‘Fermi sur-face’’ (as in the 1D Tomonaga-Luttinger liquids), butthe quasiparticle weight Zk vanishes logarithmically asone approaches the Fermi surface, uv2mu→0. BecauseuIm ((k,v)u rises steeply with energy, i.e., rises linearlywith uv2mu rather than quadratically as in a Fermi liq-uid, the ‘‘quasiparticle’’ width dramatically increases asit disperses away from the chemical potential, in agree-ment with experimental results (Olson et al., 1989; Des-sau et al., 1993).
This phenomenological description of excitation spec-tra does not assume explicit wave-number dependence.To understand the origin of this marginal behavior frommore microscopic points of view, Virosztek and Ruvalds(1990) examined the effect of Fermi-surface nesting, ex-pected near the antiferromagnetic instability, as a candi-date for incoherent character. A nearly nested Fermisurface may have a strong scattering mechanism at the

1119Imada, Fujimori, and Tokura: Metal-insulator transitions
nesting wave vector. However, this proposal does notnecessarily reproduce marginal behavior in a wide re-gion of doping because the nesting condition is easilydestroyed by doping and, in addition, in the YBCO com-pounds (YBa2Cu3O72y), the nesting condition, mean-ingfully defined only from the weak-correlation ap-proach, is clearly not satisfied even near the Mottinsulator, because of these compounds’ rather roundFermi surface (see Sec. IV.C.3).
As is discussed in Secs. II.E.1 and II.E.3, this marginalbehavior has recently received support from numericalanalyses of the t-J and Hubbard models. The frequency-dependent spin susceptibility and conductivity are givenby Eqs. (2.274) and (2.293). According to the above nu-merical analyses, the spin-dynamical structure factorRe S(q,v) and the current-current correlation functionC(v), discussed in Secs. II.E.1 and II.E.3, are more orless temperature independent for the dominant part,with a broad peak around v50 or q5Q , v50 wheretheir widths in v space are on the order of eV for C(v)and comparable or less than a tenth of an eV for S(q ,v)at d;0.1;0.2. This implies that the spin and charge dy-namics are strongly incoherent with a short time scale ofrelaxation whose inverse is of the order of 1 eV forC(v). In the conductivity this means that C(v)5(nmu^nuJum&u2d(«n2«m2v) is v insensitive at small v.When we take the Kramers-Kronig transformation ofIm x(q,v) or Re s(v), it turns out that it necessarilyleads to a form of ‘‘marginal Fermi liquid.’’ For ex-ample, in the case of conductivity, one can show fromEq. (2.274)
Im s~v!;bbv
bv1aC~v!, (2.387)
where a and b are constants. When we wish to interpretthis behavior by extending the Drude analysis and intro-ducing an v-dependent mass m* (v) and a relaxationtime t(v) in the form
s~v!5s0~v!
2iv1t21~v!,
s0~v!5ne2
m* ~v!,
we obtain t21(v)[v @Re s(v)/Im s(v)# . (1/b) v1 (a/b) T . This leads to t21 that is linear in T at smallv, just as in the phenomenological description of a mar-ginal Fermi liquid, in overall agreement with experi-ments in cuprates, as is discussed in Sec. IV.C (Thomaset al., 1988; Schlesinger et al., 1990; Uchida et al., 1991;Cooper et al., 1992; for a review see Tajima, 1997). Thisinterpretation is based on the observation that thecharge dynamics is totally incoherent because C(v) hasvery broad structure with more or less v-independentvalue C0 up to the order of eV. The constant C0 has adoping concentration dependence C0}d , so that the v-integrated conductivity up to the order of 1 eV showsthe scaling *s(v)dv}d . However, it should be notedthat this contribution comes from totally incoherentcharge dynamics without any true Drude response, as
Rev. Mod. Phys., Vol. 70, No. 4, October 1998
we see from Eq. (2.274). The true Drude contributionhas stronger d dependence. This is closely related to thelarge dynamic exponent of the Mott transition. We fur-ther discuss this problem in Sec. II.F.9. In the case ofspin correlations, S(q ,v) also has a strong incoherentcontribution, as discussed in Sec. II.E.4. A point to benoted here is that the dominant incoherent contributiongives again marginal Fermi-liquid-like behavior becauseS(q ,v) has broad structure but the Bose factor 12e2bv yields marginal character. For example, theNMR relaxation rate T1
21 follows (T1T)21}1/T as inEq. (2.363) for the contribution from the incoherentpart. Another point to be stressed here is that althoughS(q ,v) has a broad peak structure at d>0.1 as C/@ iv1D(q21k2)# , as discussed in Sec. II.E.4, its widths in qand v space become critically sharpened as d→0. Origi-nally the marginal Fermi-liquid hypothesis was proposedwithout considering appreciable q dependence. This v-dependent but q-independent structure is naturally un-derstood from the form of Eqs. (2.274) and (2.293) whenwe ascribe this behavior to incoherent dynamics. Theorigin of this incoherence is discussed in Sec. II.F.
There are two different views concerning the micro-scopic origin of marginal behavior, or incoherent dy-namics. Marginal behavior or more generally non-Fermi-liquid behavior can appear when charge iscoupled to other degenerate degrees of freedom in ad-dition to the Fermi degeneracy. This indeed happens ata critical point such as the magnetic instability point,where there is an arbitrarily small energy scale due tothe degeneracy. In one view, the critical point exists atdÞ0 while in the other the critical point is at d50, theMott transition point.
In the first view, degeneracy, arises at the critical pointbetween the phases of normal metal and the supercon-ducting state at T50. For example, Varma (1996b)claimed that the critical point is at the optimal dopingconcentration for the highest superconducting Tc andthat degeneracy is due to a double-well-type structure ofpotentials for local charge which comes from valencefluctuation.
Another possible origin of marginal behavior with in-coherent charge dynamics is the Mott transition itself(Imada, 1995b). The Mott transition has a unique char-acter with a large dynamic exponent z54, as explainedin Sec. II.F, which causes quantum critical behavior in awide region of the (d ,T) plane. In consequence there issuppression of the coherence temperature Tcoh}d2,which leads to incoherent charge dynamics, consistentwith the observation described in the first part of thissubsection. This also naturally explains why the wave-number dependence is absent in the ‘‘marginal-Fermi-liquid’’ behavior.
H. Orbital degeneracy and other complexities
1. Jahn-Teller distortion, spin, and orbital fluctuationsand orderings
In transition-metal compounds, various degrees offreedom combined together can play roles in physical

1120 Imada, Fujimori, and Tokura: Metal-insulator transitions
properties. Roles of spin degrees of freedom are dis-cussed in previous subsections in detail. However, intransition-metal compounds, as mentioned in Sec. II.A,the orbital degrees of freedom are degenerate in variousways depending on the crystal field coming from the ba-sic lattice structure and Jahn-Teller distortions. This de-generacy produces a rich structure of low-energy excita-tions through orbital fluctuations and orbital orderings.In this subsection the role of orbital degeneracies, com-bined sometimes with the Jahn-Teller effect, is dis-cussed. The degenerate Hubbard model defined in Eqs.(2.6a)–(2.6e) may be a good starting point, if we mayneglect the coupling to the lattice. As is mentioned inSec. II.A.2, the first term of HDUJ is the origin of theHund’s-rule coupling, which is the strong driving forcethat aligns spins of d electrons on the same atom.
We discuss here the basic structure of degeneracy in acubic crystal field. When three t2g orbitals are degener-ate, d2 and d3 states usually have spin quantum numberS51 and S53/2 where two or three t2g orbitals are oc-cupied with parallel spins, as in V31 and Cr31. If thecrystal-field splitting between t2g and eg is smaller thanthe Hund’s-rule coupling, d4, and d5 states are realizedby occupying three spin-aligned t2g orbitals and one ortwo electrons with the same spin in the eg orbitals, as inMn31 and Fe31, respectively. As in Co31, there may besubtlety in d6 due to competing states of fully occupiedt2g orbitals (a low-spin state), five electrons in the t2gorbitals in addition to one eg electron (an S51 state),and four electrons in the t2g orbital plus two spin-alignedeg electrons (S52 state). For the case of d7 as in Ni31,the low-spin state is realized with fully occupied t2g or-bital and singly occupied eg orbital with S51/2, as inRNiO3. As in Ni21, d8 is given by a state in which the t2gorbitals are completely filled and two eg orbitals are oc-cupied by spin-aligned electrons (S51 state) if thecrystal-field splitting of dx22y2 and d3z22r2 is weak. Insuch ways, depending on these electron fillings, differentphysics appears. Dynamic coupling to the lattice is an-other source of complexity.
We start with the simplest degenerate case, with twoorbitals with one electron (or one hole) occupied at eachsite on average. This is indeed the case, for example, inKCuF3, in which the Cu d9 state leads to one hole persite in the twofold degenerate eg orbitals, under the cu-bic crystal field of the perovskite structure. RNiO3 (R5La, Nd, Y, Sm) is another example, in which eg orbit-als are occupied with one electron per site although t2gorbitals are fully occupied. If the intrasite Coulomb in-teraction Unn8 in Eq. (2.6c) is large enough, as inKCuF3, this integer filling state should be the Mott insu-lator. Here, we discuss the effective Hamiltonian for thestrong-coupling limit to derive the orbital and spin ex-change as in Eq. (2.8). To understand the basic physics,we make a drastic simplification to Eq. (2.8). We firstassume only the diagonal transfer t ij
nn85tdnn8 and n-dependent interaction Unn85U8 for nÞn8 and Unn
5U . Here JH is the Hund’s-rule coupling. Through thesecond-order perturbation, the exchange interaction isgiven by the simplified Hamiltonian
Rev. Mod. Phys., Vol. 70, No. 4, October 1998
H5(i ,j&
~JsSi•Sj1JttW i•tW j1JstSi•SjtW i•tW j!, (2.388)
where the usual spin-orbit interaction St is neglected(Inagaki and Kubo, 1973, 1975; Kugel and Khomskii,1982). Here, the parameters are given by
Js5t2S 21
U82JH1
1U8
13U D , (2.389a)
Jt5t2S 3U82JH
11
U82
1U D , (2.389b)
Jst54t2S 1U82JH
21
U81
1U D . (2.389c)
If Jst is positive and Jt.Js , this leads to stabilization ofthe ferromagnetic state with the ‘‘antiferro-orbital’’ or-dering (Roth, 1966, 1967; Inagaki, 1973). In more realis-tic cases, the transfer is anisotropic with finite off-diagonal hoppings, and hence Jt and Jst become highlyanisotropic depending on the direction.
The orbital degeneracy can be lifted by several on-sitemechanisms, including the spin-orbit interaction and theJahn-Teller distortion. In the case of spin-orbit interac-tion, splitting of orbital levels is usually accompanied bysimultaneous spin symmetry breaking. For example, ifthe spins order along the z axis, then the LS interactionlL–S immediately stabilizes the orbitals with the z com-ponent of the angular momentum Lz561 or Lz562instead of Lz50. Depending on the sign of l, the orbit-als are chosen so that Lz and the spin align in a parallelor antiparallel way. (Strictly speaking, the spin and or-bital quantum numbers are not good quantum numbersseparately, but the total angular momentum is con-served.) When a finite Lz state is chosen, it may alsoinduce lattice distortion. For example, in the octahedronsurroundings of the ligand atoms, a Jahn-Teller distor-tion occurs in such a way that the octahedron elongatesin the z direction because the electrons occupy nonzeroLz states, such as yz and zx orbitals.
Coupling between orbital occupancy and the Jahn-Teller distortion can play a major role as a driving forceof symmetry breaking, because the orbital occupationmay strongly couple to the lattice in some cases. Thesimplest example of this coupling is seen in Fig. 36,where an electron in a d3z22r2 or dx22y2 orbital inducesdistortion of anions in the octahedron structure aroundthe transition-metal elements. The static Jahn-Teller dis-tortion of course lifts the original degeneracy of t2g or egorbitals. The Jahn-Teller distortion occurs because theenergy gain due to this splitting of the degeneracy,which is linear in the distortion, always wins in compari-son to the loss of energy due to the lattice elastic energy,which is quadratic in the distortion. When the crystallattice of these transition-metal elements and anions isformed, the static Jahn-Teller distortion frequently fa-vors a specific type of distortion pattern. For example, inthe configuration of Fig. 36, the Jahn-Teller distortionstabilizes the ‘‘antiferro-orbital’’ ordering of the pseu-dospin t for dx22y2 and d3z22r2 orbitals. This induces the
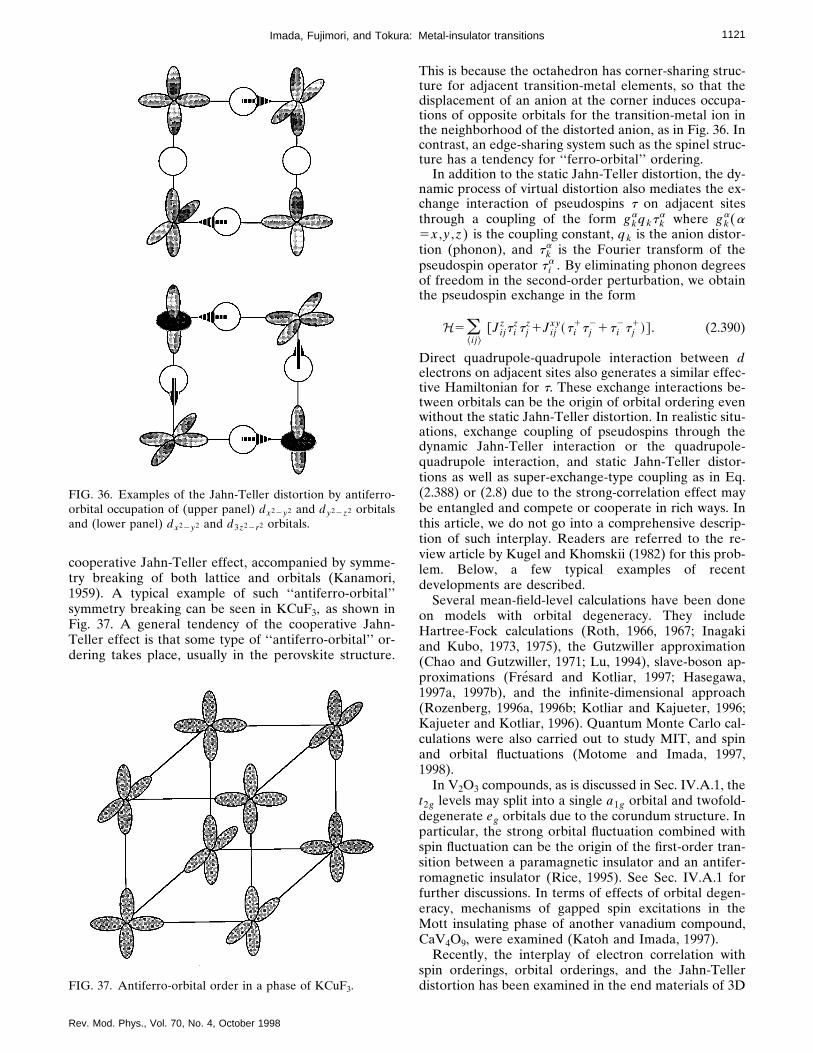
1121Imada, Fujimori, and Tokura: Metal-insulator transitions
cooperative Jahn-Teller effect, accompanied by symme-try breaking of both lattice and orbitals (Kanamori,1959). A typical example of such ‘‘antiferro-orbital’’symmetry breaking can be seen in KCuF3, as shown inFig. 37. A general tendency of the cooperative Jahn-Teller effect is that some type of ‘‘antiferro-orbital’’ or-dering takes place, usually in the perovskite structure.
FIG. 36. Examples of the Jahn-Teller distortion by antiferro-orbital occupation of (upper panel) dx22y2 and dy22z2 orbitalsand (lower panel) dx22y2 and d3z22r2 orbitals.
FIG. 37. Antiferro-orbital order in a phase of KCuF3.
Rev. Mod. Phys., Vol. 70, No. 4, October 1998
This is because the octahedron has corner-sharing struc-ture for adjacent transition-metal elements, so that thedisplacement of an anion at the corner induces occupa-tions of opposite orbitals for the transition-metal ion inthe neighborhood of the distorted anion, as in Fig. 36. Incontrast, an edge-sharing system such as the spinel struc-ture has a tendency for ‘‘ferro-orbital’’ ordering.
In addition to the static Jahn-Teller distortion, the dy-namic process of virtual distortion also mediates the ex-change interaction of pseudospins t on adjacent sitesthrough a coupling of the form gk
aqktka where gk
a(a5x ,y ,z) is the coupling constant, qk is the anion distor-tion (phonon), and tk
a is the Fourier transform of thepseudospin operator t i
a . By eliminating phonon degreesof freedom in the second-order perturbation, we obtainthe pseudospin exchange in the form
H5(ij&
@Jijz t i
zt jz1Jij
xy~t i1t j
21t i2t j
1!# . (2.390)
Direct quadrupole-quadrupole interaction between delectrons on adjacent sites also generates a similar effec-tive Hamiltonian for t. These exchange interactions be-tween orbitals can be the origin of orbital ordering evenwithout the static Jahn-Teller distortion. In realistic situ-ations, exchange coupling of pseudospins through thedynamic Jahn-Teller interaction or the quadrupole-quadrupole interaction, and static Jahn-Teller distor-tions as well as super-exchange-type coupling as in Eq.(2.388) or (2.8) due to the strong-correlation effect maybe entangled and compete or cooperate in rich ways. Inthis article, we do not go into a comprehensive descrip-tion of such interplay. Readers are referred to the re-view article by Kugel and Khomskii (1982) for this prob-lem. Below, a few typical examples of recentdevelopments are described.
Several mean-field-level calculations have been doneon models with orbital degeneracy. They includeHartree-Fock calculations (Roth, 1966, 1967; Inagakiand Kubo, 1973, 1975), the Gutzwiller approximation(Chao and Gutzwiller, 1971; Lu, 1994), slave-boson ap-proximations (Fresard and Kotliar, 1997; Hasegawa,1997a, 1997b), and the infinite-dimensional approach(Rozenberg, 1996a, 1996b; Kotliar and Kajueter, 1996;Kajueter and Kotliar, 1996). Quantum Monte Carlo cal-culations were also carried out to study MIT, and spinand orbital fluctuations (Motome and Imada, 1997,1998).
In V2O3 compounds, as is discussed in Sec. IV.A.1, thet2g levels may split into a single a1g orbital and twofold-degenerate eg orbitals due to the corundum structure. Inparticular, the strong orbital fluctuation combined withspin fluctuation can be the origin of the first-order tran-sition between a paramagnetic insulator and an antifer-romagnetic insulator (Rice, 1995). See Sec. IV.A.1 forfurther discussions. In terms of effects of orbital degen-eracy, mechanisms of gapped spin excitations in theMott insulating phase of another vanadium compound,CaV4O9, were examined (Katoh and Imada, 1997).
Recently, the interplay of electron correlation withspin orderings, orbital orderings, and the Jahn-Tellerdistortion has been examined in the end materials of 3D

1122 Imada, Fujimori, and Tokura: Metal-insulator transitions
perovskite compounds. In the 3D perovskite com-pounds, RMO3, in addition to the Jahn-Teller distor-tion, tilting of the MO6 octahedron, illustrated in Fig.38(a), plays an important role in determining the hybrid-ization of different orbitals on adjacent sites and conse-quently in controlling the bandwidth. Considering thistilting as well as the Jahn-Teller distortion and spin andorbital orderings, Mizokawa and Fujimori (1996a,1996b) performed unrestricted Hartree-Fock calcula-tions on RMO3. In general, the spin and orbital order-ings obtained were in good agreement with those of theexperimentally observed results when the observedJahn-Teller and tilting distortions were assumed. Elec-tronic structure calculations with the local spin-densityapproximation (Hamada, Sawada and Terakura, 1995;Sarma et al., 1995), with GGA (Sawada, Hamada, Tera-kura, and Asada, 1996) and with the LDA1U method(Solovyev, Hamada, and Terakura, 1996b) also suc-ceeded in improving and reproducing general tendencyof spin and orbital orderings by assuming the properJahn-Teller and tilting distortion. However, these twoapproaches show different tendencies for the band gap.The Hartree-Fock and LDA1U calculations in generaloverestimate the band gap, while the LSDA and GGAcalculations tend to underestimate the gap, as is ex-plained in Sec. II.D.3. At the moment, self-consistentdetermination of lattice distortion, orbital occupation,and spin ordering have not been attempted successfullyexcept in the case of KCuF3 by Liechtenstein, Anisimov,and Zaanen (1995). Detailed discussions of each com-pound are given in Secs. IV.A.3, IV.B.1, IV.B.2, and
FIG. 38. Types of lattice distortion and antiferromagnetic or-der. (a) GdFeO3-type tilting distortion of MO6 octahedron; (b)types of Jahn-Teller distortion in 3D perovskite structure; (c)types of antiferromagnetic order in 3D perovskite structure.
Rev. Mod. Phys., Vol. 70, No. 4, October 1998
IV.F.1. Various types of Jahn-Teller distortions and an-tiferromagnetic order realized in 3D perovskite struc-ture are shown in Figs. 38(b) and 38(c), respectively.
Although the spin degrees of freedom have been stud-ied rather thoroughly on the level of their fluctuations inthe paramagnetic phase, fluctuations of the orbital de-grees of freedom have been neither experimentally northeoretically well studied. These fluctuation effects maybe important when the system is metallized away fromthe end material.
Orbital ordering phenomena are also widely observedin f-electron systems, where they are called quadrupoleorderings. An example is seen in CeB6. The interplay ofspin and orbital fluctuations may be very similar in d-and f-electron systems, though it is not fully understoodso far.
2. Ferromagnetic metal near a Mott insulator
When the Jahn-Teller distortion is absent in LaMnO3,the antiferro-orbitally ordered 3x22r2 and 3y22r2
states strongly hybridize with the 3z22r2 orbital be-cause of high symmetry and hence enhance the ferro-magnetic coupling, basically the same as in the Hundmechanism. It has been argued that this is also the originof ferromagnetism in metallic doped systems likeLa12xSrxMnO3 because the static Jahn-Teller distortionseems to disappear in the metallic phase. The basicphysics of this mechanism was pointed out by Kanamori(1959).
Although the underlying physics and the mechanismare similar, a slightly different way of explaining the fer-romagnetism in metallic La12xSrxMnO3 is the so-calleddouble-exchange mechanism (Zener, 1951; de Gennes,1960; Anderson and Hasegawa, 1955). Because the lo-calized 3t2g electrons are perfectly aligned due to theHund’s-rule coupling, the double-exchange Hamiltoniandefined in Eqs. (2.9a)–(2.9c) may be a good startingpoint if degeneracy of the eg orbitals can be neglected.In the completely ferromagnetic phase, eg electrons canhop coherently without magnetic scattering by t2g spins,while they become strongly incoherent due to scatteringthrough the JH term if the localized t2g spins are disor-dered. In other words, if t2g spins on adjacent sites havedifferent directions, the eg electron feels a higher energyon one of the two sites because of Hund’s-rule coupling.The gain in kinetic energy due to coherence favors theferromagnetic order in the metallic phase. When the t2gorbital electrons are treated as a classical spin coupledwith eg electrons by very large Hund’s-rule coupling, thespin axis of the quantization may be taken in the direc-tion of the t2g spins as in the discussion below Eq.(2.156). Then the transfer between the sites i and j inEq. (2.9b) is modified through the relative angle of thet2g spins at the i and j sites as
t ij5t@cos~u i/2!cos~u j/2!1sin~u i/2!sin~u j/2!ei~f i2f j!# ,(2.391)
where f is the phase of the wave function. Neglectingthe phase fluctuations, this leads to

1123Imada, Fujimori, and Tokura: Metal-insulator transitions
t ij5t cos~u ij/2!, (2.392)
where u ij is the relative angle of the t2g spins. In theHartree-Fock treatment, the effective averaged transferis given by
t 5t^cos~u ij/2!&. (2.393)
Recently, giant or colossal negative magnetoresis-tance has attracted renewed interest in ferromagneticmetals in Mn and Co perovskite compounds. This is dis-cussed in detail in Sec. IV.F. From the theoretical pointof view, d electrons in Mn and Co compounds havestrong coupling to Jahn-Teller-type distortions and fluc-tuations. These couplings as well as orbital degeneracyin eg orbitals make magnetic and transport propertiescomplicated, especially near the Mott insulating phase.The hardest and most challenging subject is to under-stand the interplay of spin, orbital, and lattice fluctua-tions when the critical fluctuations of the Mott transi-tion, exemplified by incoherent charge dynamics,appear. We review the present status of this theoreticaleffort in Sec. IV.F.1 and compare theory with experi-mental indications.
3. Charge ordering
Periodic structures of spin and charge orderings arediscussed within the framework of the Hartree-Fock ap-proximation in Sec. II.D.2, where the periodicity of thespin or charge orderings is assumed to be commensurateto the lattice periodicity. This commensurate order, as-sumed in the above results, has been reexamined in 2Dwithin the unrestricted Hartree-Fock approximation toallow an incommensurate ordering vector (Machida,1989; Poilblanc and Rice, 1989; Schulz, 1990a; Inui andLittlewood, 1991; Verges et al., 1991). These analyses in-dicate that, within the Hartree-Fock approximation, an-tiferromagnetic ordering at the commensurate wave vec-tor (p,p) gives way to incommensurate ordering if thefilling deviates away from half filling. Incommensurateordering may also be realized by introducing a stripestructure in real space, such as the periodic stripe of holearrays (Zaanen and Gunarson, 1989). In this case,Hartree-Fock solutions give an insulating phase up tosome finite doping concentration of holes even awayfrom half filling. This problem was further explored bythe variational Monte Carlo method by Giamarchi andLhuiller (1990) and by a Monte Carlo method withfixed-node approximation by An and van Leeuwen(1991). The possibility of phase separation into hole-richand hole-free phases was also examined, although calcu-lational results are limited to small clusters (Emery, Kiv-elson, and Lin, 1990). As we discuss later, the problemwith the above arguments is that the effects of quantumfluctuations, which may destroy the stripe phase andphase separation, have not been seriously considered. InSec. II.E.6, we show that phase separation is clearly seenby numerical methods in some other models, as it shouldbe, whereas it is not observed numerically in the 2DHubbard model. Although the stability of incommensu-rate phases against quantum fluctuations is questionable,
Rev. Mod. Phys., Vol. 70, No. 4, October 1998
charge ordering with some commensurate periodicity tothe lattice may occur. This commensurate charge ordermay indeed be stabilized in the presence of intersiteCoulomb interactions, as in the extended Hubbardmodel [Eqs. (2.5b)–(2.5c) with VÞ0]. The charge orderat a simple commensurate filling may also be stabilizedby the underlying mass enhancement due to the proxim-ity of the Mott transition. In this sense, the charge or-dering effect is enhanced in strongly correlated systemsas a secondary effect of the Mott transition. Charge or-dering at a commensurate filling leads to an incompress-ible state, which may have similarities to the most funda-mental Mott insulator itself. Experimentally, chargeorderings are observed for some simple commensurateperiodicities, as will be discussed in Sec. IV.E. This isalso related to the valence fluctuation problem in heavy-fermion compounds. We discuss theoretical aspects ofcharge ordering in each compound in connection withthe experimental results in more detail in Sec. IV. Pos-sible pairing mechanisms due to dynamic fluctuation ofcharge ordering or phase separation will be discussed inSec. IV.C.3.
III. MATERIALS SYSTEMATICS
A. Local electronic structure of transition-metal oxides
1. Configuration-interaction cluster model
Prior to the early 1980s, the most widely accepted pic-ture of band-gap formation in a Mott insulator was thatthe d band was split into lower and upper Hubbardbands, separated by the on-site d-d Coulomb interac-tion U , as discussed in Sec. II and shown in Fig. 5(a).Charge excitations across that band gap were thus real-ized by a charge transfer of the type (dn) i1(dn) j→(dn21) i1(dn11) j , where i and j denote transition-metal sites, and cost energy U . This classical picture wasfirst questioned by resonance photoemission studies ofNiO (Oh et al., 1982; Thuler et al., 1983) and of a seriesof transition-metal halides (Kakizaki et al., 1983). Untilthen the photoemission spectra of NiO had been inter-preted within ligand-field theory (Sugano et al., 1970) asdue to transitions from the d8 ground state of the Ni21
ion to the d7 final-state multiplet. As shown in Fig. 39,these transitions constitute the topmost part of thevalence-band photoemission spectra of NiO, belowwhich is located the oxygen 2p band. In addition tothese ‘‘main’’ features, there is another structure belowthe O 2p band called a ‘‘shake-up satellite’’ or ‘‘multi-electron satellite.’’ It was thought that the satellite arosefrom a transition from the filled oxygen p orbitals to theunoccupied metal d orbitals subsequent to the emissionof the d electron from the d8 ground state. If this assign-ment were correct, the satellite would be due to the d8LIfinal states as opposed to the d7 final states of the mainband, where LI denotes a hole in the ligand O 2p band.Then photoemission spectra recorded using photons inthe Ni 3p→3d absorption region should have shownenhancement of the main band derived from the 3d8
→3d7 spectral weight through the resonance photoemis-

1124 Imada, Fujimori, and Tokura: Metal-insulator transitions
sion process, 3p63d81hn→3p53d9→3p63d71«l ,where «l is a photoelectron. However, the experimentalresults showed the enhancement of the satellite ratherthan the main band, which implied that the satellite wasin fact due to the d7 final states, that is, the lower Hub-bard band is located below the O 2p band. Davis (1982)made an analysis of the resonance photoemission resultsof the Ni compounds by treating the configuration inter-
FIG. 39. Photoemission and inverse-photoemission (BIS)spectra of NiO (Sawatzky and Allen, 1984) and their analysisusing ligand-field (LF) theory with the Ni21 ion and that usingCI theory for the NiO6 cluster model (Fujimori, Minami, andSugano, 1984).
Rev. Mod. Phys., Vol. 70, No. 4, October 1998
action (CI) within a simplified metal-ligand clustermodel, in which one ligand LI orbital and one d orbitalare considered. He showed that the satellite should bedue to d7 final states rather than d8LI final states if itshowed resonance enhancement at the 3p→3d thresh-old. Subsequently, a more realistic CI cluster-modelanalysis of the photoemission spectra of NiO was madeby Fujimori, Minami, and Sugano (1984), who took intoaccount the multiplet structure of the Ni ion andsymmetry-adopted molecular orbitals consisting of theligand p orbitals. According to their analysis, shown inFig. 39, it was confirmed that the satellite corresponds tothe lower Hubbard band (d8→d7 spectral weight) and islocated below the O 2p band (d8→d8LI spectralweight), corresponding to the situation schematically de-picted in Fig. 5(b). In NiO, the O 2p-to-Ni 3d charge-transfer energy D (;4 eV) is smaller than the on-sited-d Coulomb energy U (; 7 eV), which makes thep-to-d charge transfer, (dn) i1(dn) j→(dnLI ) i1(dn11) j , the lowest-energy charge fluctuation andhence the band gap of the system (see Fig. 39). Here, thecharge-transfer energy D is defined as the energy re-quired to transfer an electron from the filled ligand porbitals to the empty metal d orbitals, dn→dn11LI .
Because the on-site Coulomb energy U is often largerthan the d bandwidths in 3d transition-metal com-pounds (U being typically as large as 4–8 eV), it is oftenmore convenient to consider the total energies of ametal-ligand cluster such as NiO6 within CI theoryrather than as the energies of one-electron states, atleast for insulating compounds. Figure 40 shows thetotal-energy diagram of the NiO6 cluster in the neutral,positively ionized, and negatively ionized states, whichwe refer to as N-electron, (N21)-electron, and (N11)-electron states, respectively (Fujimori and Minami,1984). Here, it should be noted that the ‘‘neutral’’ NiO6cluster has negative charges of 12- @(NiO6)
122# in order
FIG. 40. Total-energy diagram of the NiO6 cluster in the ‘‘neutral’’ (N-electron), positively ionized [(N21)-electron], andnegatively ionized [(N11)-electron] states. Eh and Ee are the minimum energies required to create an electron and hole,respectively. eF denotes an electron at the Fermi level.

1125Imada, Fujimori, and Tokura: Metal-insulator transitions
to ensure the complete filling of the O 2p band and thed-band filling of eight as in bulk NiO. The ground stateof the N-electron state primarily consists of the d8 con-figuration (corresponding to the ionic Ni21 and O22 con-figurations) with admixture of charge-transfer configura-tions d9LI and to a lesser extent d10LI 2:
Fg~N !5a1ud8&1a2ud9LI &1a3ud10LI 2& . (3.1)
The ground state of the N-electron state is split intomultiplet terms due to intra-atomic Coulomb and ex-change interactions. The lowest multiplet term 3A2g hasa high-spin (S51) t2g
6 eg2 configuration, as predicted by
ligand-field theory. Hybridization with the charge-transfer states d9LI , which are located by ;D higher,causes a ‘‘crystal-field splitting’’ of the d8 multiplet aswell as a lowering of the ground-state energy Eg(N).This energy lowering signifies the covalency contribu-tion to the cohesive energy of the ground state.
If there were no multiplet splitting and p-d hybridiza-tion, the total energy of the cluster with the central ionin the dn configuration would be given by (Bocquetet al., 1992a; Fujimori et al., 1993)
E~dn!5E01n«d01
12
n~n21 !U , (3.2)
where E0 is a reference energy and «d0 is the energy of a
bare d electron (including the Madelung potential at thecation site). The charge-transfer energy D is then givenby
D5E~dn11!2«p2E~dn!5«d02«p1nU[«d2«p ,
(3.3)
where «p is the energy of the ligand p orbital neglectingthe finite p bandwidth. Here, the Coulomb interactionamong the p electrons and that between neighboring pand d electrons are ignored. One can obtain the groundstate Eq. (3.1) by solving a secular equation for theHamiltonian,
H5S E~d8!2DE8 2&T 0
2&T E~d8!1D 2&T
0 2&T E~d8!12D1UD ,
(3.4)
for NiO. Here, T[2)(pds)[22tpd [with (pds) be-ing a Slater-Koster parameter (Harrison, 1989)] is a p-dtransfer integral and 2DE8 is the shift of the 3A2g termof the d8 multiplet relative to the center of gravityE(d8) of the d8 multiplet. In the present CI treatment,the crystal-field splitting between the t2g and eg orbitalsis included not through an input parameter 10Dq as inligand-field theory but as a result of the different p-dhybridization strengths for the t2g and eg orbitals. (Onehas also to consider a small nonorthogonality contribu-tion to 10Dq , typically ;0.5 eV.)
The band gap Egap of the system is given by the lowestenergy of an electron plus that of a hole, which are cre-ated in the crystal independently. In the cluster model,
Rev. Mod. Phys., Vol. 70, No. 4, October 1998
therefore, one has to remove an electron from theN-electron ground state of one cluster and to add thatelectron to the N-electron ground state of another clus-ter and calculate the total energy difference:
Egap5Eg~N11 !1Eg~N21 !22Eg~N !, (3.5)
where Eg(N21) and Eg(N11) denote the lowest en-ergies of the (N21)- and (N11)-electron states, re-spectively. In Fig. 40 are plotted the total energies of the(N21)- and (N11)-electron states as well as those ofthe N-electron state of the NiO6 cluster. In the(N21)-electron state, the d7 states are located abovethe charge-transfer d8LI states because D,U , and theenergy separation between the two configurations is U2D . In analogy with Eq. (3.1), the (N21)-electronstate of a given spin and spatial symmetry is given by
F i~N21 !5b i1ud7&1b i2ud8LI &1¯ . (3.6)
In the (N11)-electron state, the d10LI configuration islocated well above d9 because of the large energy sepa-ration U1D@0. From Fig. 40, one can also recognizethat the magnitude of the band gap (Egap5Ee1Eh ,where Ee and Eh are the lowest energies of the extraelectron and the extra hole added to the N-electronground state, respectively, as shown in the figure) is ;Drather than ;U .
2. Cluster-model analyses of photoemission spectra
To obtain the electronic structure parameters D, U ,and T , the CI cluster model has been widely used toanalyze photoemission spectra. The wave functions ofthe ground state, photoemission final states, and inverse-photoemission final states of the MOm metal-oxygencluster are given by
Fg~N !5a1udn&1a2udn11LI &1a3udn12LI 2&1¯ ,
F i~N21 !5b i1udn21&1b i2udnLI &1b i3udn11LI 2&1¯ ,
F i~N11 !5g i1udn11&1g i2udn12LI &1g i3udn13LI 2&1¯ .(3.7)
Here, each wave function is an eigenstate of the totalspin S and Sz and has the proper point-group symmetryof the cluster. The d-derived spectral function(d-derived density of states) rd(v) is thus calculated us-ing Eq. (2.54), with ck and ck
† replaced by the annihila-tion and creation operators of the d electron, cd and cd
† :
rd~v!5(i
ub i1* a11b i2* a21b i3* a3u2
3d„v1Ei~N21 !2Eg~N !…
1(i
ug i1* a11g2* a i2u2
3d„v2Ei~N11 !1Eg~N !…. (3.8)

1126 Imada, Fujimori, and Tokura: Metal-insulator transitions
Since the energy levels of the cluster are discrete, thedelta functions in Eq. (3.8) have to be appropriatelybroadened in order to be compared with experiment.
Let us consider the simplest case in which only twoconfigurations are used as basis functions for each of theN- and N21-electron states:
Fg~N !5cos uudn&1sin uudn11LI &,
F2~N21 !5cos fudn21&1sin fudnLI &,
F1~N21 !52sin fudn21&1cos fudnLI &, (3.9)
where 2p/2,u , f,p/2. The Hamiltonian for theN-electron state is
H5S E~dn! 2A102nT
2A102nT E~dn!1DD . (3.10)
Here, the multiplet structure and the different transferintegrals for the eg and t2g orbitals have been ignored.For the (N21)-electron final states
H5S E~dn21! 2A112nT
2A112nT E~dn21!1D2U D , (3.11)
whose lower and higher energy eigenvalues are denotedby E2(N21) and E1(N21), respectively. These finalstates correspond to the main feature and the satellite ofthe photoemission spectrum, respectively. Then thed-derived photoemission spectrum (the v,m part of thed spectral function) is given by
rd~v!5ucos u cos f1sin u sin fu2
3d„v1E2~N21 !2Eg~N !…
1u2cos u sin f1sin u cos fu2
3d„v1E1~N11 !2Eg~N !…, (3.12)
where the first term gives a peak at the lower bindingenergy @m2v5E2(N21)2Eg(N)1m# and the secondterm at the higher binding energy @m2v5E1(N21)2Eg(N)1m# . The ratio between the spectral weight(I1) of the higher final state F1(N21) and that (I2) ofthe lower final state F2(N21) is given by I1 /I2
;tan2(u2f) according to Eq. (3.12). Because the differ-ence between u and f increases with decreasing uTu orwith increasing U , spectral weight transfers from thelower to the higher binding energy peak with increasingU/uTu.
The above spectral weight transfer may be viewed in adifferent way if we refer to the basis functions of fixedlocal configurations and regard the p-d transfer integralsas a perturbation. In this picture, T causes spectralweight transfer in the opposite direction, namely, fromhigher to lower energies. By increasing uTu, the differ-ence between u and f becomes small, resulting in anincrease in I1 /I2;tan2(u2f). Here, we point out thatthe p-d transfer integrals effectively increase due toelectron correlation, i.e., in going from the one-electronHartree-Fock picture to the many-body CI picture. Ifone treats the cluster model in the Hartree-Fock ap-proximation, the one-electron Hamiltonian has off-
Rev. Mod. Phys., Vol. 70, No. 4, October 1998
diagonal matrix elements of ;T , whereas in the CItreatment the off-diagonal matrix elements of the many-electron Hamiltonian are A102nT , A112nT , orA92nT in the N-electron, (N21)-electron, or(N11)-electron states [Eqs. (3.10) and (3.11)], respec-tively. Such enhanced off-diagonal matrix elements en-hance spectral weight transfer from high-energy to low-energy states (satellites to main features) as well asenhance the energy splitting between them. This can beseen by comparing the Hartree-Fock band density ofstates (DOS) of NiO and the actual photoemission spec-trum [or the Hartree-Fock band DOS corrected for theself-energy (Mizokawa and Fujimori, 1996a; Takahashiand Igarashi, 1996)], where the lower Hubbard band,well (;7 eV) below EF in the Hartree-Fock approxima-tion, is shifted further away from EF and spread in en-ergy and the spectral weight of the lower Hubbard bandis transferred to the main band within ;5 eV of EF .
3. Zaanen-Sawatzky-Allen classification scheme
In the (N21)-electron state of NiO, where D,U , thednLI configuration is located below the dn21 configura-tion, resulting in a p-to-d band gap. If D.U , on theother hand, the dn21 configuration would lie below thednLI configuration, leading to a d-to-d band gap.Zaanen, Sawatzky, and Allen (1985) and Hufner (1985)extended this view of electronic structure to a widerange of 3d transition-metal compounds, including lighttransition-metal (Ti,V,...) compounds. For D,U , theband gap is of the p-d type; the p band is located be-tween the upper and lower Hubbard bands in the spec-tral function, as shown in Fig. 5(b). The gap is thuscalled a charge-transfer gap and the compound is calleda charge-transfer insulator. It has a band gap of magni-tude ;D . If D.U , on the other hand, the band gap is ofthe d-d type as in the original Hubbard picture [Fig.5(a)]. The gap is then called a Mott-Hubbard gap andthe compound is called a Mott-Hubbard insulator. It hasa band gap of magnitude ;U . Figure 41 shows a two-dimensional plot, the so-called Zaanen-Sawatzky-Allenplot, of the transition-metal compounds according to therelative magnitudes of U and D. The straight line U5D separates the U-D space into Mott-Hubbard andcharge-transfer regimes. It should be noted, however,that because of hybridization between the d and pstates, the boundary U5D is not a sharp phase bound-ary but is a crossover line at which the character of theband gap changes continuously.
Whether doped carriers in a ‘‘filling-control’’ systemhave oxygen p character or transition-metal d characteris an important question in considering the transportproperties of the transition-metal oxides. Since theground state of the N-electron state is usually domi-nated by the dn configuration, the doped holes will havemainly d character if the lowest (N21)-electron state isdominated by the dn21 configuration and will havemainly p character if it is dominated by the dnLI configu-ration. That is, doped holes have mainly d character in aMott-Hubbard insulator (D.U) and p character in a

1127Imada, Fujimori, and Tokura: Metal-insulator transitions
charge-transfer insulator (D,U). In either case, thedoped electrons have mainly d character because thelowest unoccupied states are dominated by the dn11
configuration, since the dn11→dn12LI charge-transferenergy D1U is always a large positive number.
In going from lighter to heavier transition-metal ele-ments, the d level is lowered and therefore D is de-creased, whereas U is increased because the spatial ex-tent of the d orbital shrinks with atomic number. Thismeans that early transition-metal compounds tend to be-come Mott-Hubbard type and late transition-metal com-pounds tend to become charge-transfer type. When theligand atom becomes less electronegative, the p level israised and hence D is decreased. For instance, transition-metal chalcogenides are more likely to become charge-transfer type than transition-metal oxides. Compoundsto be plotted in Fig. 41 indeed follow this chemicaltrend, where Ti and V oxides are classified as typicalMott-Hubbard-type compounds and Cu oxides as typi-cal charge-transfer compounds. Systematic variation ofthe electronic structure is described below in more de-tail.
The diagram of Fig. 41 contains a metallic region(shaded area) near the D- and U-axes, where the mag-nitude of the band gap, ;D or ;U , becomes small. Dand U are defined with respect to the center of the p andd bands and therefore the actual band gap is smallerthan D or U by the half widths of the p and d bands: Iffor simplicity, one ignores hybridization between themetal d and ligand p orbitals and multiplet effects, themagnitude of the band gap is given by Egap;D2 1
2 (Wp1Wd) for a charge-transfer insulator and Egap;D2Wd for a Mott-Hubbard insulator, where Wd and Wpare the bandwidths of d and p , respectively (see Fig. 5).If the energy shifts due to p-d hybridization are takeninto account, 2d(N)2d(N21)2d(N11) should be
FIG. 41. Zaanen-Sawatzky-Allen plot for classifying 3dtransition-metal compounds. The straight line U5D separatesthe Mott-Hubbard regime (A) and the charge-transfer regime(B). Between the two regimes is located an intermediate re-gime (AB). The shaded areas near U50 and D50 are metal-lic regions where a Mott-Hubbard-type or charge-transfer-typeband gap is closed. From Zaanen, Sawatzky, and Allen, 1985.
Rev. Mod. Phys., Vol. 70, No. 4, October 1998
added to the above Egap , where d(N) is the decrease inenergy of the lowest N-electron state due to p-d hybrid-ization.
The effect of the finite p bandwidth Wp can be incor-porated by replacing the ligand molecular orbitals by acontinuum of the p band (Zaanen et al., 1985). Theproblem should then be formulated using the Andersonimpurity model instead of the cluster model. The Hamil-tonian of this model is given by
H5(n
«dnndn112 (
nn8mm8^nn8uumm8&dn8
† dn†dmdm8
1(k
«pknpk2(nk
~Tnkdn†pk1H.c.!, (3.13)
where n, m, etc., denote the spin and orbital of the dstates and ^nn8uumm8&[*dr*dr8fn* (r)fn8
* (r8)e2/(ur2r8u) fm(r)fm8(r8). dn
† and pk† are the creation opera-
tors of localized d and bandlike p electrons, respec-tively. This Hamiltonian can be rewritten as
H5(n
«dnndn112 (
nn8mm8^nn8uumm8&dn8
† dn†dmdm8
1E«p2 Wp/2
«p2 Wp/2«np~«!d«
2(nE
«p2 Wp/2
«p2 Wp/2d«@Tn~«!dn
†p~«!1H.c.# , (3.14)
where
uTn~«!u2dnn8[(k
TnkTn8k* d~«pk2«!. (3.15)
The ground state of the formally d8 impurity embeddedin the filled p-band continuum is given by
Fg~N !5AF ud8&1E«p2 Wp/2
«p1 Wp/2a~«!ud9LI ~«!&d«1¯G ,
(3.16)
where « is the energy of an electron in the ligand pband. By inserting Eq. (3.16) into the Anderson impu-rity Hamiltonian (3.14) [neglecting the ud10LI («)2&term], we obtain an equation
d5E«p2 Wp/2
«p1 Wp/2 2uTn~«!u2d«
d2«1«p1D1DE8, (3.17)
where n is one of the eg orbitals and &Tn(«)[^d8uHud9LI («)&, which satisfies Tpd
2
5*«p2Wp/2«p1Wp/2uTn(«)u2d« . The lowest-energy solution of
Eq. (3.16) yields d5d(N). Figure 42(a) shows that p-dhybridization lowers the energy of the d8 multiplet com-ponent (the 3A2g term in the case of NiO). In the (N21)-electron state, although the d8LI continuum lies be-low the discrete d7 state, strong p-d hybridization cre-ates a split-off state of predominantly d8LI character be-low the d8LI continuum, as shown in Fig. 42(b). Thediagram of Fig. 41 was indeed calculated using such anAnderson impurity model for the N-, (N21)-, and (N
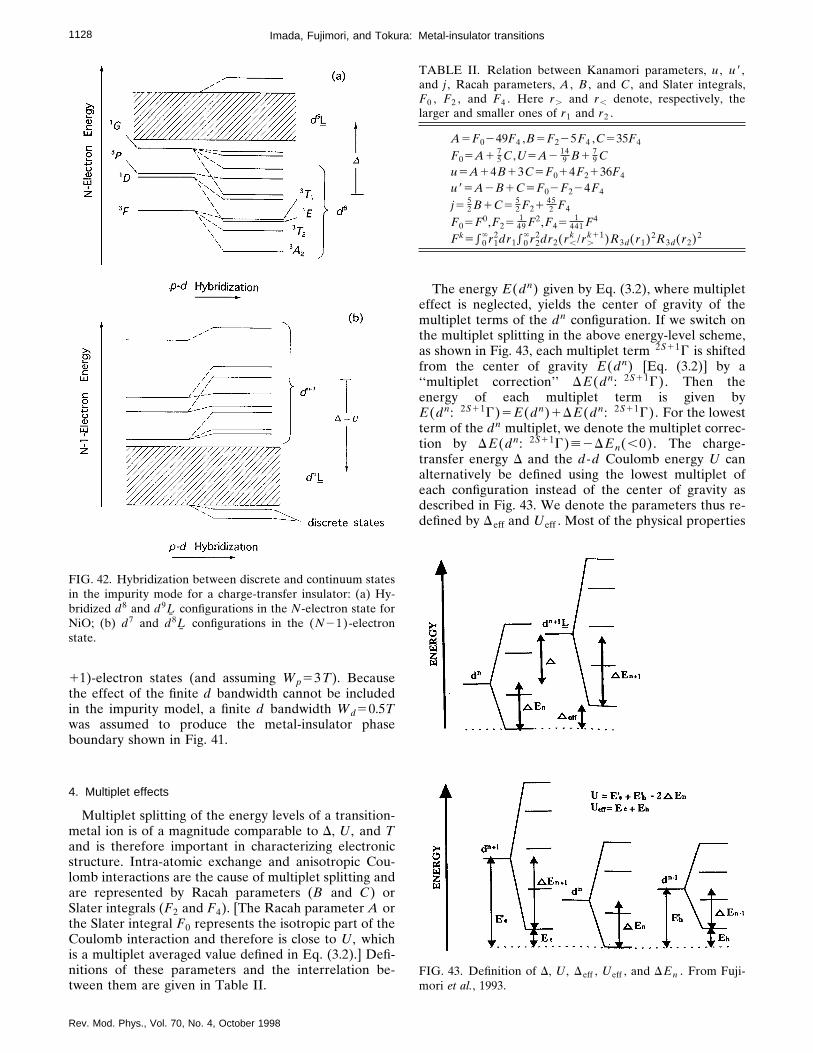
1128 Imada, Fujimori, and Tokura: Metal-insulator transitions
11)-electron states (and assuming Wp53T). Becausethe effect of the finite d bandwidth cannot be includedin the impurity model, a finite d bandwidth Wd50.5Twas assumed to produce the metal-insulator phaseboundary shown in Fig. 41.
4. Multiplet effects
Multiplet splitting of the energy levels of a transition-metal ion is of a magnitude comparable to D, U , and Tand is therefore important in characterizing electronicstructure. Intra-atomic exchange and anisotropic Cou-lomb interactions are the cause of multiplet splitting andare represented by Racah parameters (B and C) orSlater integrals (F2 and F4). [The Racah parameter A orthe Slater integral F0 represents the isotropic part of theCoulomb interaction and therefore is close to U , whichis a multiplet averaged value defined in Eq. (3.2).] Defi-nitions of these parameters and the interrelation be-tween them are given in Table II.
FIG. 42. Hybridization between discrete and continuum statesin the impurity mode for a charge-transfer insulator: (a) Hy-bridized d8 and d9LI configurations in the N-electron state forNiO; (b) d7 and d8LI configurations in the (N21)-electronstate.
Rev. Mod. Phys., Vol. 70, No. 4, October 1998
The energy E(dn) given by Eq. (3.2), where multipleteffect is neglected, yields the center of gravity of themultiplet terms of the dn configuration. If we switch onthe multiplet splitting in the above energy-level scheme,as shown in Fig. 43, each multiplet term 2S11G is shiftedfrom the center of gravity E(dn) [Eq. (3.2)] by a‘‘multiplet correction’’ DE(dn: 2S11G). Then theenergy of each multiplet term is given byE(dn: 2S11G)5E(dn)1DE(dn: 2S11G). For the lowestterm of the dn multiplet, we denote the multiplet correc-tion by DE(dn: 2S11G)[2DEn(,0). The charge-transfer energy D and the d-d Coulomb energy U canalternatively be defined using the lowest multiplet ofeach configuration instead of the center of gravity asdescribed in Fig. 43. We denote the parameters thus re-defined by Deff and Ueff . Most of the physical properties
TABLE II. Relation between Kanamori parameters, u , u8,and j , Racah parameters, A , B , and C , and Slater integrals,F0 , F2 , and F4 . Here r. and r, denote, respectively, thelarger and smaller ones of r1 and r2 .
A5F0249F4 ,B5F225F4 ,C535F4
F05A175 C ,U5A2
149 B1
79 C
u5A14B13C5F014F2136F4
u85A2B1C5F02F224F4
j5 52 B1C5
52 F21
452 F4
F05F0,F251
49 F2,F451
441 F4
Fk5*0`r1
2dr1*0`r2
2dr2(r,k /r.
k11)R3d(r1)2R3d(r2)2
FIG. 43. Definition of D, U , Deff , Ueff , and DEn . From Fuji-mori et al., 1993.
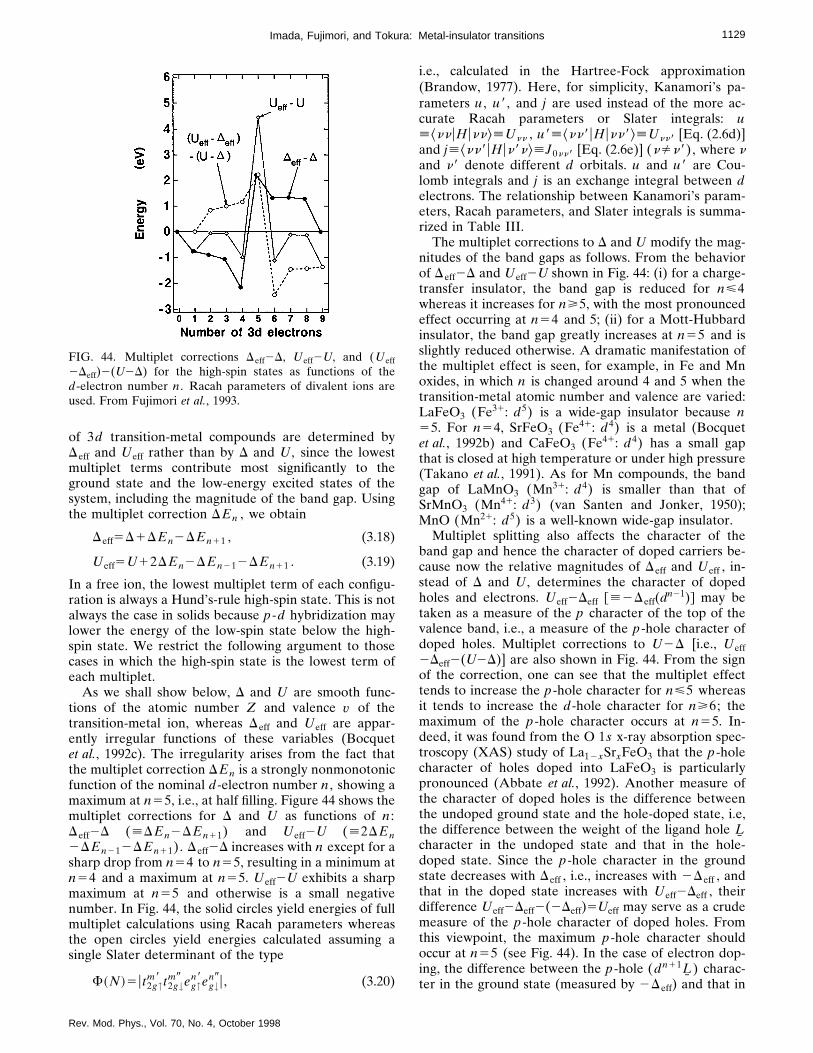
1129Imada, Fujimori, and Tokura: Metal-insulator transitions
of 3d transition-metal compounds are determined byDeff and Ueff rather than by D and U , since the lowestmultiplet terms contribute most significantly to theground state and the low-energy excited states of thesystem, including the magnitude of the band gap. Usingthe multiplet correction DEn , we obtain
Deff5D1DEn2DEn11 , (3.18)
Ueff5U12DEn2DEn212DEn11 . (3.19)
In a free ion, the lowest multiplet term of each configu-ration is always a Hund’s-rule high-spin state. This is notalways the case in solids because p-d hybridization maylower the energy of the low-spin state below the high-spin state. We restrict the following argument to thosecases in which the high-spin state is the lowest term ofeach multiplet.
As we shall show below, D and U are smooth func-tions of the atomic number Z and valence v of thetransition-metal ion, whereas Deff and Ueff are appar-ently irregular functions of these variables (Bocquetet al., 1992c). The irregularity arises from the fact thatthe multiplet correction DEn is a strongly nonmonotonicfunction of the nominal d-electron number n , showing amaximum at n55, i.e., at half filling. Figure 44 shows themultiplet corrections for D and U as functions of n :Deff2D ([DEn2DEn11) and Ueff2U ([2DEn2DEn212DEn11). Deff2D increases with n except for asharp drop from n54 to n55, resulting in a minimum atn54 and a maximum at n55. Ueff2U exhibits a sharpmaximum at n55 and otherwise is a small negativenumber. In Fig. 44, the solid circles yield energies of fullmultiplet calculations using Racah parameters whereasthe open circles yield energies calculated assuming asingle Slater determinant of the type
F~N !5ut2g↑m8 t2g↓
m9 eg↑n8eg↓
n9u, (3.20)
FIG. 44. Multiplet corrections Deff2D, Ueff2U, and (Ueff2Deff)2(U2D) for the high-spin states as functions of thed-electron number n . Racah parameters of divalent ions areused. From Fujimori et al., 1993.
Rev. Mod. Phys., Vol. 70, No. 4, October 1998
i.e., calculated in the Hartree-Fock approximation(Brandow, 1977). Here, for simplicity, Kanamori’s pa-rameters u , u8, and j are used instead of the more ac-curate Racah parameters or Slater integrals: u[^nnuHunn&[Unn , u8[^nn8uHunn8&[Unn8 [Eq. (2.6d)]and j[^nn8uHun8n&[J0nn8 [Eq. (2.6e)] (nÞn8), where nand n8 denote different d orbitals. u and u8 are Cou-lomb integrals and j is an exchange integral between delectrons. The relationship between Kanamori’s param-eters, Racah parameters, and Slater integrals is summa-rized in Table III.
The multiplet corrections to D and U modify the mag-nitudes of the band gaps as follows. From the behaviorof Deff2D and Ueff2U shown in Fig. 44: (i) for a charge-transfer insulator, the band gap is reduced for n<4whereas it increases for n>5, with the most pronouncedeffect occurring at n54 and 5; (ii) for a Mott-Hubbardinsulator, the band gap greatly increases at n55 and isslightly reduced otherwise. A dramatic manifestation ofthe multiplet effect is seen, for example, in Fe and Mnoxides, in which n is changed around 4 and 5 when thetransition-metal atomic number and valence are varied:LaFeO3 (Fe31: d5) is a wide-gap insulator because n55. For n54, SrFeO3 (Fe41: d4) is a metal (Bocquetet al., 1992b) and CaFeO3 (Fe41: d4) has a small gapthat is closed at high temperature or under high pressure(Takano et al., 1991). As for Mn compounds, the bandgap of LaMnO3 (Mn31: d4) is smaller than that ofSrMnO3 (Mn41: d3) (van Santen and Jonker, 1950);MnO (Mn21: d5) is a well-known wide-gap insulator.
Multiplet splitting also affects the character of theband gap and hence the character of doped carriers be-cause now the relative magnitudes of Deff and Ueff , in-stead of D and U , determines the character of dopedholes and electrons. Ueff2Deff @[2Deff(dn21)# may betaken as a measure of the p character of the top of thevalence band, i.e., a measure of the p-hole character ofdoped holes. Multiplet corrections to U2D [i.e., Ueff2Deff2(U2D)] are also shown in Fig. 44. From the signof the correction, one can see that the multiplet effecttends to increase the p-hole character for n<5 whereasit tends to increase the d-hole character for n>6; themaximum of the p-hole character occurs at n55. In-deed, it was found from the O 1s x-ray absorption spec-troscopy (XAS) study of La12xSrxFeO3 that the p-holecharacter of holes doped into LaFeO3 is particularlypronounced (Abbate et al., 1992). Another measure ofthe character of doped holes is the difference betweenthe undoped ground state and the hole-doped state, i.e,the difference between the weight of the ligand hole LIcharacter in the undoped state and that in the hole-doped state. Since the p-hole character in the groundstate decreases with Deff , i.e., increases with 2Deff , andthat in the doped state increases with Ueff2Deff , theirdifference Ueff2Deff2(2Deff)5Ueff may serve as a crudemeasure of the p-hole character of doped holes. Fromthis viewpoint, the maximum p-hole character shouldoccur at n55 (see Fig. 44). In the case of electron dop-ing, the difference between the p-hole (dn11LI ) charac-ter in the ground state (measured by 2Deff) and that in

1130 Imada, Fujimori, and Tokura: Metal-insulator transitions
the doped state (negligibly small dn12LI character)yields the p-electron character of the doped electrons.Therefore one can conclude from Fig. 44 that n55 com-pounds have maximum d character for doped electronsand that n54 compounds have maximum p characterfor doped electrons. From this we expect that SrFeO3(Abbate et al., 1992; Bocquet et al., 1992b) would ac-commodate doped electrons predominantly in the ligandp orbitals to form the stable d5 configuration.
5. Small or negative charge-transfer energies
In a charge-transfer insulator, if the charge-transferenergy D or Deff is small compared to T , hybridizationbetween the dn and dn11LI configurations becomesstrong and the contribution of the dn11LI configurationto the ground state becomes substantial. If D or Deff,0, the weight of the dn11LI configuration becomesdominant in the ground state. This situation is expectedto occur when the valence of the transition-metal ion isunusually high because D is expected to decrease withmetal valence. The dn11LI configuration is a continuum.However, within the Anderson impurity model, it can beshown that sufficiently strong p-d hybridization causes adiscrete state of dn11LI character to be split off belowthe continuum in the same way as in the formation of asplit-off state in the (N21)-electron state of a charge-transfer insulator described above [see Fig. 42(b)]. Theinsulating region was restricted to positive D values inthe original Zaanen-Sawatzky-Allen diagram (Fig. 41)because it was assumed that the p-d hybridizationstrength was small T5 1
3 Wp (Zaanen et al., 1985). In or-der to extend the Zaanen-Sawatzky-Allen framework tosmall and negative D values, the magnitude of the bandgaps has been calculated using the Anderson impuritymodel for various sets of D, U , T @[2)(pds)# , andWp as shown in Fig. 45 (Mizokawa et al., 1994), whereone can see that the insulating region is extended tonegative D values for certain parameters. In the small ornegative D regime, the magnitude of the band gap isproportional neither to D nor to U but is sensitively de-
FIG. 45. Modified Zaanen-Sawatzky-Allen diagram includingthe effect of strong p-d hybridization in the region D;0 (Mi-zokawa et al., 1994). In this region, the gap increases with in-creasing p-d transfer or decreasing p bandwidth wp .
Rev. Mod. Phys., Vol. 70, No. 4, October 1998
pendent on the p-d hybridization strength T . Therefore,as the ligand bandwidth Wp decreases or the transferintegral T increases, the band gap tends to increase. InFig. 45 are plotted sets of U and D which give Egap50.4 eV as a measure of the metal-insulator phaseboundary.
The effect of lattice periodicity is much more compli-cated in the case of negative D than in the case of posi-tive D. In the periodic lattice, d orbitals at neighboringtransition-metal atoms share intervening anion p orbit-als, which leads to a complicated many-body problem,especially for a small or negative D. This will effectivelydecrease the 3d-ligand hybridization strength T . Also,the dispersional widths of the (N21)- and(N11)-electron states resulting from intercluster hy-bridization would effectively increase the ligand band-width Wp . Therefore intercluster hybridization effec-tively decreases T or increases Wp , thereby shrinkingthe insulating region in the U-D phase diagram. Thestrength of the intercluster hybridization is dependenton the metal-oxygen-metal bond angle (see Sec. III B):It is maximized at 180° and minimized at 90°. This mayexplain why LaCuO3, in which octahedral CuO6 clustersare interconnected with ;180° Cu-O-Cu bond angles, ismetallic and NaCuO2, in which square-planar CuO4clusters are interconnected with ; 90° Cu-O-Cu angles,is insulating, although the Cu is formally trivalent inboth compounds (Mizokawa et al., 1991). For a negativeD, the lowest (N21)-electron state is dn11LI 2 [becauseE(dn11LI 2)5E(dnLI )1D,E(dnLI ); see Eq. (3.2)] andthe lowest (N11)-electron state is dn11. Since the mainconstituent of the ground state is the dn11LI configura-tion, the charge transfer (dn11LI ) i1(dn11LI ) j→(dn11LI 2) i1(dn11) j gives the lowest-energy chargefluctuation and therefore the band gap has predomi-nantly p-to-p character. This situation is illustrated inFig. 46.
FIG. 46. Schematic picture of the one-electron density ofstates of the negative-D insulator (Mizokawa et al., 1994).
1131Imada, Fujimori, and Tokura: Metal-insulator transitions
The fact that NaCuO2 is a nonmagnetic insulator (S50) was explained by the low-spin (S50) solution ofthe CI cluster model, whereas band-structure calcula-tions using the local-density approximation (LDA;Karlsson et al., 1992; Singh, 1994) have also given a non-magnetic insulating ground state. Therefore it is not ob-vious whether NaCuO2 is a correlated insulator or aband insulator. According to the configuration-interaction picture, the nonmagnetic ground state domi-nated by the d9LI configuration may be viewed as avalence-bond state in which the local spin of the d hole(d9) and that of the ligand hole (LI ) form a local singlet.Therefore the negative D insulator with low-spin con-figuration may be called a ‘‘local-singlet lattice’’ or‘‘valence-bond (Heitler-London) insulator.’’ In this pic-ture, the wave function of the ground state is quite dif-ferent from a single Slater determinant without electroncorrelation. Such a lattice consisting of the local singletsis, however, analytically connected to the nonmagneticband insulator. Because the origin of the band gaps ininsulators with small or negative D is neither U nor Dbut rather the strong p-d hybridization. Sarma and co-workers referred to them as ‘‘covalent insulators’’(Nimkar et al., 1993). According to their Hartree-Fockband-structure calculations on the p-d model, the char-acter of the band gap is of strongly hybridized pd-p typerather than pure p-p type. On the other hand, it is closerto the p-p type according to the LDA calculation ofSingh (1994).
B. Systematics in model parameters and charge gaps
To understand the diverse physical properties of 3dtransition-metal compounds from a unified point ofview, it is important to clarify the systematics underlyingchanges in the electronic structure and hence in themodel parameters, D, U , and T as functions of chemicalenvironment, namely, as functions of the atomic numberand valence of the transition-metal ion, the nature (elec-tronegativity, ionic radius, etc.) of the ligand atom, andthe crystal structure. In the following, we present threedifferent approaches to this task, namely, (1) methodsbased on the ionic crystal model, (2) semiempiricalmethods based on the analysis of photoemission spectra,and (3) theoretical methods using first-principles elec-tronic structure calculations.
1. Ionic crystal model
The simplest method of estimating values for the pa-rameters D and U is the ionic crystal model, which wasapplied to 3d transition-metal oxides by Torrance et al.(1991). Assuming that each atom is a point charge hav-ing its formal ionic charge, they calculated the bareMadelung potential energy at each atomic site and esti-mated Deff and Ueff using the ionization potentials andelectron affinities of the constituent ions. Here, the mul-tiplet corrections are included in the parameters thusestimated since the experimental ionization potentialsare used.
Rev. Mod. Phys., Vol. 70, No. 4, October 1998
Using the ionization potential I(Mv1) and the elec-tron affinity A(Mv1) of the transition-metal Mv1 ion,Ueff is given by
Ueff5I~Mv1!2A~Mv1!2e2
dM2M, (3.21)
where e2/(dM2M) is the attractive Coulomb energy be-tween nearest-neighbor metal ions that are separated bydM2M . Here, the inclusion of the e2/(dM2M) term cor-responds to the optical excitation, where an electron anda hole are created on nearest-neighbor cation sites.Without the latter term, Ueff would correspond to pho-toemission and inverse photoemission, where the elec-tron and hole are well separated from each other and donot interact. Correspondingly, Deff is given by
Deff5eDVMad1I~O22!2A~Mv1!2e2
dM2O, (3.22)
where DVMad is the difference in the Madelung potentialbetween the metal site and the oxygen site and dM2O isthe nearest-neighbor metal-oxygen distance. The defini-tion of Deff also contains the electron-hole interactionterm relevant to optical transitions.
In Fig. 47 are plotted values for Deff and Ueff esti-mated using Eqs. (3.21) and (3.22). These Deff and Ueffvalues have been calculated using the bare electrostaticpotential without screening and are therefore expectedto overestimate the actual parameter values. Indeed,they range from 210 eV to 120 eV, extending over amuch wider energy range than parameter values esti-mated using first-principles methods or the spectro-scopic method. One can see from Fig. 47 that, althoughthe absolute magnitudes of Deff and Ueff are overesti-mated, the qualitative trends are the same as those esti-mated using spectroscopic methods. The charge-transfertype (Deff,Ueff) versus Mott-Hubbard type (Deff.Ueff)seems almost correctly predicted by this method: Latetransition-metal compounds fall into the charge-transferregime and early transition-metal compounds into theMott-Hubbard regime with some V compounds withhigh valences in the charge-transfer regime. Accordingto the Zaanen-Sawatzky-Allen picture, a charge-transferinsulator becomes metallic when the charge-transfer gapof magnitude Deff2
12(Wp1Wd) becomes negative, while
a Mott-Hubbard-type insulator becomes metallic whenthe Mott-Hubbard-type gap of magnitude Ueff2Wd be-comes negative. The vertical (Deff5DB) and horizontal(Ueff5UB) lines in Fig. 47 are drawn in an attempt toseparate metals from insulators. DB;10 eV and UB;11 eV would mean that Wp;Wd;10 eV. The lattervalues are, however, unrealistically large and would con-tain other contributions (such as incomplete screening ofthe bare electrostatic potentials in the ionic model).
The band gaps predicted by the ionic model werecompared with the optical band gaps of perovskite-typeRMO3 compounds, where R is La or Y, by Arima,Tokura, and Torrance (1993). The experimentally deter-mined optical gaps are shown in Fig. 48. The figureshows that the lowest-energy gap is of the Mott-

1132 Imada, Fujimori, and Tokura: Metal-insulator transitions
FIG. 47. Charge-transfer energies Deff and on-site d-d Cou-lomb energies Ueff of transition-metal oxides calculated usingthe ionic model by Torrance et al. (1991). The vertical (Deff5DB) and horizontal (Ueff5UB) lines are drawn to separatemetals (solid symbols) and insulators (open symbols). Thenumber next to each element gives its oxidation state, e.g.,Fe3: a-Fe2O3 and LaFeO3.
FIG. 48. Measured optical gaps for RMO3 (R5La or Y) plot-ted against the transition-metal atom (Arima, Tokura, andTorrance, 1993). The open symbols give charge-transfer (p-to-d) gaps, while the solid symbols give Mott-Hubbard (d-to-d)gaps.
Rev. Mod. Phys., Vol. 70, No. 4, October 1998
Hubbard type for M5Ti and V and is of the charge-transfer type for M5Mn to Cu. The magnitude of thegap shows a maximum at n55 (M5Fe), due to themaximum stabilization of the completely filled t2g↑ andeg↑ levels as shown in Fig. 44. The peak at n53 (M5Cr) is due to the complete filling of the t2g↑ level. Thedip at n54 (M5Mn) seen in Fig. 48 can also be under-stood from the multiplet correction (Fig. 44). A com-parison of the optical gap values with those calculatedusing the ionic model is made in Fig. 49, where one cansee excellent correlation between the experimental andthe calculated values except for the ;10 eV overesti-mate of the calculated values. The ;10 eV differenceshould have the same origin as the metal-insulatorboundary Deff5DB and Ueff5UB noticed in Fig. 47.
There are slightly different methods of estimating theparameters U and D using the ionic crystal model. Ohtaet al. (1991a, 1991b) assumed that the Madelung termeDVMad is screened by the optical dielectric constant«` : eDVMad /«` . Zaanen and Sawatzky (1990) arguedthat the dielectric constant, which describes screeningbetween charges separated by many lattice spacings, isnot appropriate for describing the screening processconsidered here. Instead they added the polarization en-ergies of surrounding atoms 22Epol and 24Epol to Eqs.(3.21) and (3.22), respectively. Here, Epol is the polariza-tion energy for a unit point charge 6e in the crystal andis given by Epol5
12 ( ja jFj
2 , where Fj is the electric fieldproduced by the point charge at ion j and a is the po-larizability of ion j . The Racah parameter A and charge-transfer energy D estimated by this method for various3d transition-metal monoxides are listed in Table III.Here, in order to estimate Epol , parameters for NiOhave been determined so as to fit the photoemissionspectra, and the empirical 1/d4 dependence of Epol onthe interatomic distance d has been used.
2. Spectroscopic methods
The valence-band photoemission spectra of a numberof 3d transition-metal compounds have so far been ana-
FIG. 49. Experimental optical gaps vs charge-transfer (opensymbols, D) or Mott-Hubbard (solid symbols, U) gaps calcu-lated using the ionic model. From Arima, Tokura, and Tor-rance, 1993.

1133Imada, Fujimori, and Tokura: Metal-insulator transitions
lyzed using the CI cluster model and the Anderson im-purity model (Fujimori et al., 1986, 1990; Eskes et al.,1990; van Elp et al., 1991) and the model parameters D,U , and T have been estimated. Having obtained N- and(N21)-electron eigenstates, one calculates the photo-emission spectrum by
r~v!5(i
u^F i~N21 !uduFg~N !&u2
3d„v1Ei~N21 !2Eg~N !…, (3.23)
where Fg(N) and F i(N21) are the ground state andthe final states of photoemission, Eg(N) and Ei(N21)are their energies, d is the annihilation operator of a delectron and v[«kin2hn . Therefore m2v, where m isthe electron chemical potential, i.e., the Fermi level, isthe electron binding energy measured from the Fermilevel and r(v) with v,m gives a photoemission spec-trum. The summation in Eq. (3.23) runs over all finalstates that can be reached by the annihilation of one delectron. By inserting Eqs. (3.1) and (3.6) into Eq.(3.23), one obtains r(v)5( iua1bi11a2bi21¯u2d„v1Ei(N21)2Eg(N)…. When one compares the calcu-lated spectra with experiment, the delta function in Eq.(3.23) is replaced by a Gaussian function (broadened bya Lorentzian function) in order to represent the finitebandwidths, lifetime widths, and other broadening ef-fects. In addition, the oxygen p band is superposed onthe d-electron spectrum.
Figure 50 shows the photoemission spectra and thebest-fit results for a series of transition-metal monox-ides. Since CuO and NiO are charge-transfer insulators,the main band closer to the Fermi level is due to dnLIfinal states and the satellite at higher binding energies isdue to dn21 final states. The separation between themain and satellite features is given by ;U2D (plusshifts due to p-d hybridization). In going from heavierto lighter transition-metal atoms, the separation be-tween the main band and the satellite decreases, mean-ing that U2D decreases. The cluster-model analysisshown in Fig. 50 yields a systematic increase of D withdecreasing atomic number, while the systematic de-crease of U is not so significant. U.D for the charge-
TABLE III. On-site Coulomb (U) and exchange (J) energiesestimated using the constrained LDA method (Anisimov et al.,1991), compared with the empirical estimates for the Racahparameter A and charge-transfer energy D (Zaanen and Sa-watzky, 1990). Ueff is the splitting between the dn21 and dn11
high-spin states. Energies are in eV.
U J Ueff A D
CuO/CaCuO2 7.5 0.98 6.5 4.0 4.0NiO 8.0 0.95 7.1 (6.0) (4.92)CoO 7.8 0.92 6.9 5.02 5.53FeO 6.8 0.89 5.9 4.46 6.21MnO 6.9 0.86 10.3 5.43 8.23VO 6.7 0.81 5.9 3.54 10.47TiO 6.6 0.78 5.8 3.02 10.01
Rev. Mod. Phys., Vol. 70, No. 4, October 1998
transfer-type CuO and NiO, and U,D for the Mott-Hubbard-type VO (although this compound is metallic).MnO with U;D is intermediate between the charge-transfer-type and Mott-Hubbard-type compounds.
The photoemission spectra of the core levels of the 3dtransition-metal atom also yield nearly the same infor-mation as the valence-band spectra (van der Laan et al.,1981). The core-level spectra have an advantage overthe valence-band spectra in that there are no overlap-ping features, such as the O 2p band, that obscure thecluster-model analysis, while they have the disadvantagethat the unknown strength of the core-hole potential in-troduces an additional parameter. The final state ofcore-level photoemission is given by
F~cI N !5e1ucI dn&1e2ucI dn11LI &1¯ (3.24)
and the photoemission spectrum by
r~v!5(i
ua1ei11a2ei21¯u2d„v1Ei~cI N !2Eg~N !…
(3.25)
FIG. 50. Valence-band photoemission spectra of CuO (Eskeset al., 1990), NiO (Fujimori and Minami, 1984), MnO (Fuji-mori et al., 1990) and VO (Werfel et al., 1981) and theircluster-model analyses. D;2.75 eV and U;6.5 eV for CuO,D;4.0 eV and U;7.5 eV for NiO, and D;7.0 eV and U;7.5 eV for MnO. VO is metallic and no cluster-model analy-sis could be made.

1134 Imada, Fujimori, and Tokura: Metal-insulator transitions
A systematic analysis of the metal 2p core-level spec-tra for a wide range of 3d transition-metal compoundswas attempted by Bocquet et al. (1992a; 1996) using asimplified version of the CI cluster model, where wavefunctions of single Slater determinants [Eq. (3.20)] andKanamori’s parameters were employed for both theground state and the final states. The parameter valuesthus obtained are not exactly the same as, but are rea-sonably close to, those obtained from analysis of thevalence-band photoemission spectra. More elaboratefull multiplet cluster-model calculations have been madefor the transition-metal dihalides MX2 and trivalenttransition-metal oxides M2O3 by Kotani and co-workers(Okada et al., 1992; Uozumi et al., 1997). The D valuesthus obtained for M2O3 are generally smaller than thosefor the monoxides MO but show a tendency to increasewith decreasing transition-metal atomic number, as inthe case of the monoxides. Thus D seems to decreasesystematically with atomic number Z and valence v ofthe transition-metal ion. This tendency is clearly seen inFig. 51, where D values deduced from the 2p core-levelspectra are plotted as a function of Z and v . In Fig. 52are plotted U values, which weakly increase with theatomic number and valence of the transition-metal dueto shrinkage of the spatial extent of the 3d orbitals. Fig-ure 52 also shows that the decrease in the electronega-tivity of the ligand atom (in going from oxygen to sulfur)decreases the D value. The systematic variation of D andU with Z and v demonstrated above may be verycrudely written as
D;D020.6Z22.5v , (3.26)
U;U010.3Z10.5v , (3.27)
where D0;26 eV and U0;22.5 eV for oxides and D0;23.5 eV and U0;24.5 eV for sulfides.
Figure 52 shows that light transition-metal compoundsstill have sizable U values, which in some cases exceedD. This means that many light transition-metal oxidesare not ideal Mott-Hubbard-type compounds, in whichD is larger than U and the magnitude of the band gap is;U . Indeed, recent cluster-model analyses of the metal2p core levels of Ti and V oxides have shown that U iscomparable to or larger than D (Uozumi et al., 1993;Okada et al., 1994; Bocquet et al., 1996). The prefactorA102n in the off-diagonal matrix elements Teff[A102nT increases with decreasing atomic number Z ,not only because of the increase in T itself (Fig. 53), butalso because of the increase in (102n). Therefore, inthe light transition-metal oxides, Teff is often larger thanU and D and sets the largest energy scale. Then Teffplays the most important role in determining the magni-tude of the band gap, unlike in the original Zaanen-Sawatzky-Allen picture. This situation may be describedas follows: For example, for the d1 system Ti2O3, theoccupied d band seen by photoemission is actually asplit-off state of predominantly d1LI character ratherthan d0 in the photoemission final state (Uozumi et al.,1996) in a manner similar to that shown in Fig. 42(b).Figure 54 shows various transition-metal oxides plotted
Rev. Mod. Phys., Vol. 70, No. 4, October 1998
in the Zaanen-Sawatzky-Allen diagram (Fig. 41) butwith U/Teff and D/Teff shown in the plot instead of U/Tand D/T . Most of the V and Ti oxides are found nearthe origin (U/Teff;0 and D/Teff;0) because of the largeTeff values. The parameter values shown in Fig. 54 indi-cate that the D of compounds with high metal valencies,such as Ti41, V41, and V51, is comparable to or lowerthan U .
If there were no p-d hybridization and the band-widths (Wp and Wd) were zero, the band gap would begiven by Deff for a charge-transfer insulator and by Uefffor a Mott-Hubbard insulator. Values for Deff and Ueffdeduced from the cluster-model analysis of the metal 2pcore-level spectra are plotted for various transition-metal compounds in Fig. 55 as functions of n . Figure55(a) demonstrates that Deff decreases monotonicallywith n except for the large discontinuity between n54and 5. This variation reflects both the smooth variationof D with n and its multiplet correction, Deff2D (Fig. 44),which is a large negative value for n54 and a large posi-tive value for n55. Figure 55 also shows that, for a fixedn , Deff (and hence D) decreases as the valence of themetal ion increases, reflecting the lowering of the 3denergy level due to the increasing positive charges at thetransition-metal ion. Figure 55(b) shows that Ueff slowlyand monotonically increases with n except for the sharppeak at n55. Calculated band gaps are shown in Fig. 56.Due to p-d hybridization, the d-d and p-d characters ofthe band gaps are mixed with each other and the varia-tion of the band gap with n reflects both that of Deff andthat of Ueff . The p-d hybridization weakens the degreeof variation of the band gap compared to that of Deff orUeff . Moreover, p-d hybridization lowers the ground-state energy Eg(N), thereby increasing Egap [see, Eq.(3.5)]. In addition to the Egap peak at n55, which isderived from the peak in Deff and/or Ueff , there is asmall peak at n53. This comes from the stabilization ofthe d3 configuration due to intra-atomic exchange cou-pling (Hund’s rule coupling), since the t2g orbitals arehalf-filled by three electrons. The calculated Egap for ox-ides of composition RMO3 compare favorably with theexperimental values (Fig. 48).
Using the cluster-model calculation, one can studywhether doped carriers occupy the metal d or ligand porbitals. We may define the p character of doped holesand the d character of doped electrons from the nd val-ues of the N-, (N21)-, and (N11)-electron states,nd(N)([nd), nd(N21), and nd(N11), as Chole
p 512@nd(N)2nd(N21)# and Cel
d 5nd(N11)2nd(N).The Chole
p shown in Fig. 57(a) generally increases with n ,reflecting the decrease in D. The curves have a peak atn55 and a dip at n56 due to the multiplet effect. InFig. 57(b), Cel
d is plotted against n . The exchange stabi-lization and hence the reduced covalency for the d5 con-figurations enhances the d character of doped electronsand the p character of doped holes. One can also seethat the d character of doped electrons decreases withthe valence of the transition-metal ion, reflectingthe decrease in D with metal valence. In the above

1135Imada, Fujimori, and Tokura: Metal-insulator transitions
FIG. 51. Charge-transfer energies D of various 3d transition-metal compounds displayed with respect to (a) the transition-metalatomic number (b) its valence, and (c) the ligand electronegativity (Bocquet et al., 1992a, 1992c, 1996).
definition those compounds which have Cholep smaller
than 0.5 and Celd larger than 0.5 can be said to have d-d
gaps, while those compounds which have Cholep larger
than 0.5 and Celd larger than 0.5 can be said to have p-d
gaps.
Rev. Mod. Phys., Vol. 70, No. 4, October 1998
3. First-principles methods
There has also been considerable progress in first-principles methods for estimating the parameter valuesusing the local(-spin)-density approximation [L(S)DA].Although the L(S)DA often fails to predict the correct

1136 Imada, Fujimori, and Tokura: Metal-insulator transitions
FIG. 52. On-site d-d Coulomb energies U of various 3d transition-metal compounds displayed with respect to (a) the transition-metal atomic number, (b) its valence and (c) the ligand electronegativity (Bocquet et al., 1992a, 1992c, 1996).
ground-state properties of Mott insulators, it gives basi-cally correct model parameters.
The p-d transfer integral T [or (pds), (pdp)] can beestimated by fitting the LDA energy band structure us-ing a tight-binding Hamiltonian, which contains the p-dtransfer integrals as well as the p-p transfer integrals
Rev. Mod. Phys., Vol. 70, No. 4, October 1998
@(pps), (ppp)# , the transition-metal d level «d , andthe anion p level «p . Systematic changes of these pa-rameters with transition-metal atomic number werefound in an early study of 3d transition-metal monox-ides (Mattheiss, 1972): Tight-binding fits to non-self-consistent band-structure calculations showed an in-

1137Imada, Fujimori, and Tokura: Metal-insulator transitions
crease in «d2«p by ;0.7 eV per unit increase in Z , ingood agreement with the spectroscopic estimates de-scribed above.
Using the tight-binding fit approach to band structurescalculated within the LDA, Mahadevan, Shanti, andSarma (1996) systematically studied a series of LaMO3compounds. Figure 58 shows deduced values for varioustransfer integrals including (pds) and (pdp) betweenthe metal and other oxygen orbitals. The decreasing
FIG. 53. p-d transfer integral (pds) plotted against the nomi-nal d-electron number n (Bocquet et al., 1996).
FIG. 54. Zaanen-Sawatzky-Allen U/Teff-D/Teff plot for 3dtransition-metal oxides (Bocquet et al., 1996).
Rev. Mod. Phys., Vol. 70, No. 4, October 1998
trend of their magnitudes with atomic number is in ac-cordance with the spectroscopic estimates shown in Fig.53. Values for «d2«p deduced simultaneously are plot-ted in Fig. 59, which again shows the same decreasingtrend with metal atomic number as the D values deducedfrom electron spectroscopy (Fig. 51). One can see fromthe figures that D is generally larger than «d2«p by afew eV. This can be understood from the definition ofthe LDA eigenvalue «LDA,d[«d
01(n2 12 )U [see Eq.
(3.29) below] and that of the d-electron affinity level«d[«d
01nU [see Eqs. (3.2) and (3.3)].
FIG. 55. Effective charge-transfer energy Deff (a) and effectiveaveraged d-d Coulomb energy Ueff (b) of 3d transition-metaloxides plotted against the nominal d-electron number n . Thedotted line for MO is deduced from the extrapolated values ofD and U for MO. Dashed lines represent behaviors expectedfrom the systematic variation of the parameters. From Saitoh,Bocquet, et al., 1995a.

1138 Imada, Fujimori, and Tokura: Metal-insulator transitions
The Coulomb interaction parameter U in solids canbe calculated using constrained local-density functionaltechniques (McMahan et al., 1989, 1990; Gunnarssonet al., 1989; Hybertsen et al., 1990). In the L(S)DA, theone-electron potential at a given spatial point r is ap-proximated by a function of the charge density at thatpoint r, r(r) [and the spin density s(r)[r↑(r)2r↓(r)].If we use atomic orbitals as the basis set, the total energyof a transition-metal atom is given by the d-electronnumber n at the atomic site (which is here regarded as acontinuous variable) as
ELDA~n !5E01n«d01
12
n~n21 !U , (3.28)
when the orbitals are not spin polarized. The one-electron eigenvalue of the atomic d orbital is given bythe derivative of the total-energy functional with respectto n :
«LDA,d~n !5]ELDA~n !
]n5«d
01S n212 DU . (3.29)
Therefore U is given by the n derivative of the eigen-value «LDA :
U5]«LDA,d
]n. (3.30)
In order to evaluate this quantity, one calculates «LDA,dfor various fixed n values. To do so, one employs theconstrained LDA method in the impurity model or thesupercell model, in which the transfer integrals connect-ing the d atomic orbitals of the central transition-metalion with surrounding orbitals (including anion p) are setto zero, making n a good quantum number. The sur-rounding orbitals are allowed to relax as a function of
FIG. 56. Band gaps Egap of 3d transition-metal compoundscalculated using the cluster model. The dotted line for MOrepresents the calculated results using the extrapolated valuesof D and U for MO (Saitoh, Bocquet, et al., 1995a).
Rev. Mod. Phys., Vol. 70, No. 4, October 1998
the change in n in order to include solid-state screeningeffects in self-consistent calculations for the U value.
In order to deduce the charge-transfer energy D, theaffinity level, E(dn11)2E(dn)5«d [Eq. (3.3)], or theionization level E(dn)2E(dn21)5«d2U of the d or-bital has to be evaluated. For this purpose, Slater’stransition-state rule (Slater, 1974) is utilized:
«d[ELDA~dn11!2ELDA~dn!5«LDA,d~n1 12 !, (3.31)
which also follows from Eqs. (3.28) and (3.29). Slater’stransition-state rule can also be applied to evaluate U :
U[@E~dn11!2E~dn!#2@E~dn!2E~dn21!#
5«LDA,d~n1 12 !2«LDA,d~n2 1
2 !. (3.32)
The p-level energy «p is assumed to be correctly givenby the LDA eigenvalue.
When the system is spin polarized, the LSDA func-tional becomes a function not only of n[n↑1n↓ but alsoof the d-electron number of each spin, n↑ and n↓ :
ELSDA~n↑ ,n↓!5E01n«d01
12
n~n21 !U
212
n↑~n↑21 !J212
n↓~n↓21 !J , (3.33)
FIG. 57. Character of doped electron and hole in 3dtransition-metal compounds: (a) p character of the doped holeChole
p ; (b) d character of the doped electron Celd . From Saitoh,
Bocquet, et al., 1995a.

1139Imada, Fujimori, and Tokura: Metal-insulator transitions
where J([j[JH/2) is the exchange integral between thed electrons. The one-electron eigenvalues of the spin-upand spin-down d levels are given by (Anisimov et al.,1991)
«LSDA,ds~n↑ ,n↓!5]ELSDA~n↑ ,n↓!
]ns
5«d01~n2 1
2 !U2~ns2 12 !J , (3.34)
where s5↑ or ↓. Using this expression, one can estimatethe parameters U and J by
U5«LSDA,d↑S n
21
12
,n
2 D2«LSDA,d↑S n
21
12
,n
221 D ,
(3.35)
J5«LSDA,d↓S n
21
12
,n
22
12 D2«LSDA,d↑S n
21
12
,n
22
12 D .
(3.36)
Here, it should be noted that setting n↑5n↓512 n in Eq.
(3.35) does not reduce to Eq. (3.32), meaning that thedefinition of U is different between the two expressions.J in Eq. (3.36) is equal to j , and U in Eq. (3.35) is acertain average of u and u8 (see Table II). Parametersthus estimated are listed in Table III for some 3dtransition-metal monoxides (Anisimov et al., 1991). Aserious shortcoming of this method is that the Coulombenergy tends to be overestimated for light 3d transition-metal oxides: U’s for TiO and VO were calculated too
FIG. 58. Various p-d and p-p transfer integrals in the 3dtransition-metal oxide series LaMO3 derived from a tight-binding fit to the LDA band structures (Mahadevan et al.,1996). The inset shows the metal-oxygen and oxygen-oxygendistances in Å.
Rev. Mod. Phys., Vol. 70, No. 4, October 1998
large, as shown in Table III, and hence these compoundsare incorrectly predicted to be wide gap insulators. Thisis related to the problem of how well the constrainedLDA works in describing the screening process in thesolid state and also to the problem of how one can de-fine localized orbitals in a strongly hybridized system.
C. Control of model parameters in materials
1. Bandwidth control
The electron correlation strength can be controlled bymodifying the lattice parameters or the chemical compo-sition while essentially maintaining the original latticestructure. The on-site (U) or intersite (V) Coulomb in-teraction is kept almost unchanged during the aboveprocedure and hence control of electron correlationstrength is usually achieved by control of the transferinteraction (t) or the one-electron bandwidth (W). Onemethod of controlling W is the application of pressure.In general, an application of hydrostatic pressure de-creases the interatomic distance and hence increases thetransfer interaction. Pressure-induced Mott-insulator-to-metal transitions are observed typically for V2O3 (seeSec. IV.A.1) and RNiO3 (R5Pr and Nd; see Sec.IV.A.3). Hydrostatic pressure is an ideal perturbationthat modifies W and that is suitable for investigating thecritical behavior of the phase transition. To derive amore quantitative picture of the transition, however, weneed to know the lattice structural change under a pres-sure that is usually not so easy to determine. In particu-lar, in the anisotropic crystals, such as a layered perov-skite structure, anisotropic compressibility affects W in acomplex manner.
Another method of W control is modification of thechemical composition using the solid solution or mixed-crystal effect. In the case of transition-metal compounds,the electron correlation arises from a narrow d band.
FIG. 59. Variation of «d2«p for the LaMO3 series with themetal M element. From Mahadevan et al., 1996.

1140 Imada, Fujimori, and Tokura: Metal-insulator transitions
Therefore alloying of the transition-metal cations shouldbe avoided for W control, and the solid solution in otherchemical sites is usually attempted. One of the best-known examples of this W control is the case ofNiS22xSex crystals (Wilson, 1985). The schematic metal-insulator phase diagram for NiS22xSex is shown in Fig.60 (see Sec. IV.A.2 for the details and references). Theparent compound NiS2 is a charge-transfer insulatorwith the charge gap between the Ni 3d-like state (upperHubbard band) and the S2 2p band. The partial substi-tution of Se on the S site enlarges the amalgamated 2pband and increases d-p hybridization. Around x50.6the mixed crystal NiS22xSex undergoes the insulator-metal transition at room temperature. At low tempera-tures, the antiferromagnetic metal (AFM) state exists inbetween the Pauli paramagnetic metal (PM) and antifer-romagnetic insulator phase. It has been confirmed thatan application of hydrostatic pressure near theAFM-PM phase boundary reproduces a change in thetransport properties like that observed in the case of xcontrol, indicating a nearly identical role of pressure andcompositional control.
Another useful method of W control for a perovskite-type compound (ABO3, see Fig. 61) is modification ofthe ionic radius of the A site. The lattice distortion ofthe perovskite ABO3 is governed by the so-called toler-ance factor f , which is defined as
f5~rA1rO!/&~rB1rO!. (3.37)
Here, ri (i5A , B, or O) represents the ionic size of eachelement. When f is close to 1, the cubic perovskite struc-ture is realized, as shown in Fig. 62. As rA or equiva-lently f decreases, the lattice structure transforms torhombohedral and then to orthorhombic (GdFeO3-type)structure (Fig. 61), in which the B-O-B bond is bent andthe angle is deviated from 180°. In the case of the ortho-rhombic lattice (the so-called GdFeO3-type lattice), thebond angle (u) varies continuously with f (Marezio et al.,
FIG. 60. Phase diagram of NiS22xSex in the plane of tempera-ture and x (Czjzek et al., 1976; Wilson and Pitt, 1971).
Rev. Mod. Phys., Vol. 70, No. 4, October 1998
1970; MacLean et al., 1979), as shown in Fig. 62, nearlyirrespective of the species of A and B . The bond angledistortion decreases the one-electron bandwidth W ,since the effective d electron transfer interaction be-tween the neighboring B sites is governed by the super-transfer process via the O 2p state. For example, let usconsider the hybridization between the 3d eg state andthe 2p s state in a GdFeO3-type lattice composed of thequasi-right BO6 octahedral tilting alternatively (see Fig.61). In the strong-ligand-field approximation, the p-dtransfer interaction tpd is scaled as tpd
0 cos(p2u), where
FIG. 61. Orthorhombically distorted perovskite (GdFeO3-type) structure.
FIG. 62. The metal-oxygen-metal bond angles in an ortho-rhombically distorted perovskite (GdFeO3-type) as a functionof tolerance factor.

1141Imada, Fujimori, and Tokura: Metal-insulator transitions
tpd0 is the value for the cubic perovskite. Thus W is ap-
proximately proportional to cos2u. A similar relation willhold approximately for the one-electron bandwidth ofthe t2g electron state, although a more complicated cal-culation for distortion-induced mixing between the t2gand 2p s orbitals is necessary (Okimoto et al., 1995b).
An advantage of using a distorted perovskite for Wcontrol is that the A site is not directly relevant to theelectronic properties inherent in the B-O network andalso that the W value can be varied to a considerableextent (by 30–40 %) by choice of different rare-earth oralkaline-earth cations as the A-site element. The bestexample of successful W control is the MIT for RNiO3,with R being the trivalent rare-earth ions (La to Lu).The MI phase diagram for RNiO3 derived by Torranceet al. (1992) is shown in Fig. 63. The tolerance factor f asthe abscissa represents the variation of the one-electronbandwidth or the degree of p-d hybridization tpd . Theeffective valence of Ni in RNiO3 is 31 and hence the delectron configuration is t2g
6 eg1 with S51/2. LaNiO3 with
the maximal tpd is metallic, while the other RNiO3 com-pounds with smaller f or tpd are charge-transfer insula-tors with an antiferromagnetic ground state. The MIphase boundary is slanting in the T-f plane, as shown inFig. 63. For example, PrNiO3 shows a first-order I-Mtransition around 200 K associated with an abruptchange in the lattice parameters and the sudden onset ofantiferromagnetic spin ordering. For the smaller-f re-gion, however, the paramagnetic insulating phase ispresent above the antiferromagnetic insulating phase, asin most of the correlated insulators. Again, an applica-tion of pressure increases tpd and in fact drives the IMtransition for PrNiO3 and NdNiO3 because these twocompounds are located in the vicinity of the MI phaseboundary. (See Sec. IV.A.3 for the details.)
Such a strategy for W control in the perovskite-typecompounds has been widely used. In Sec. IV, we shallsee ample examples of W control not only for the parent(integer-n) compounds but also for the carrier-doped
FIG. 63. Electronic phase diagram of RNiO3 (Torrance et al.,1992).
Rev. Mod. Phys., Vol. 70, No. 4, October 1998
compounds such as R12xAxMO3 (M5Ti, V, Mn, andCo), where the averaged ionic size of the rare-earth (R)and alkaline-earth (A) ions on the perovskite A sitescan be systematically modified.
2. Filling control
The importance of filling control in correlated metalshas been widely recognized since the discovery of high-temperature superconductivity as a function of filling inthe layered cuprate compounds. The standard methodof filling control is to utilize ternary or multinary com-pounds in which ionic sites other than the 3d (4d) or 2pelectron related sites can be occupied by different-valence ions. For example, the band filling (n) ofLa22xSrxCuO4 is controlled by substitution of divalentSr on the trivalent La sites and is given by the relation;n512x . Similarly, a number of filling-controlled com-pounds can be made by forming the A-site mixed crys-tals of perovskites, such as La12xSrxMO3, M being the3d transition-metal element. Taking the correlated insu-lator (Mott or CT insulator with n5integer filling) asthe parent compound, we customarily use the nomencla-ture ‘‘hole doping’’ when the band filling is decreasedand ‘‘electron-doping’’ when it is increased, although thecarriers are not necessarily hole-like or electron-like.
Among a number of ternary and multinary com-pounds, perovskite and related compounds are quitesuitable for filling control since their structure is verytough in withstanding chemical modification on theA-site. We show in Fig. 64 a guide map for the synthesisof quasicubic and single-layered (K2NiF4-type) perov-skite oxides of 3d transition-metals (Tokura, 1994), e.g.,(La,Sr)MO3 and (La,Sr)2MO4, with a variable numberof 3d electrons (or with a variable filling of the3d-electron-related band). Black bars indicate the rangeof the solid solution (mixed-crystal) compounds thathave so far been successfully synthesized. We can imme-diately see that quite a wide range of the band fillingscan be achieved by A-site substitution of perovskite-related structures.
For the pseudocubic perovskites of 3d transition-metal oxides, we show in Fig. 65 a schematic metal-insulator phase diagram (Fujimori, 1992) with the rela-tive electron correlation strength represented by U/W asan ordinate and the band filling of the 3d band as anabscissa. As described in the previous section, YMO3shows stronger electron correlation than LaMO3 be-cause of reduced W due to M-O-M bending in the dis-torted perovskite structure. The n5integer filled 3dtransition-metal oxides with perovskite-type structureare mostly correlated insulators, as can be seen in Fig.65, apart from LaCuO3 and LaNiO3. A fractional va-lence or filling drives the system metallic, yet in somecases the compounds remain insulating for large U/W .
Nonstoichiometry or altered stoichiometry for the el-ement composition sometimes plays the role of fillingcontrol. A well-known example of this is the case ofYBa2Cu3O61y with variable oxygen content. The y51compound (YBa2Cu3O7) is composed of CuO2 sheets

1142 Imada, Fujimori, and Tokura: Metal-insulator transitions
FIG. 64. A guide map for the synthesis of filling-controlled (FC) 3d transition-metal oxides with perovskite and layered perovskite(K2NiF4-type) structures.
and CuO chains. The nominal valence of Cu on thesheet and chain is estimated to be approximately 12.25and 2.50, respectively (Tokura et al., 1988). In otherwords, the holes are almost optimally doped into thesheet to produce superconductivity in this stoichiometriccompound. The oxygen content on the chain site can bereduced, either partially (0,y,1) or totally (y50),which results in a decrease in the nominal valence of Cuon the sheet, lowering the superconducting transitiontemperature Tc and finally (y,0.4) driving the systemto a Mott insulator (or more rigorously, a CT insulator).The nominal valence of the chain-site Cu in the y50compound is 11 due to the twofold coordination, whilethat for the y51 compounds is '12.5. Thus the nomi-nal hole concentration or Cu valence in the sheet canapparently be controlled by oxygen nonstoichiometry onthe chain site, yet it bears a complicated relation to theoxygen content (y) and furthermore depends on the de-tailed ordering pattern of the oxygen on the chain sites.
Rev. Mod. Phys., Vol. 70, No. 4, October 1998
Filling control by use of nonstoichiometry (offstoichi-ometry) has also been carried out for other systems, forexample V22yO3 (see Sec. IV.A.1) and LaTiO31y (Sec.IV.B.1), which both show the Mott-insulator-to-metaltransition with such slight offstoichiometry as y<0.03.The advantage of utilizing oxygen nonstoichiometry isthat one can accurately vary the filling on the samespecimen by a post-annealing procedure under oxidizingor reducing atmosphere. Since vacancies or interstitialsmay cause an additional random potential, the abovemethod is not appropriate for covering a broad range offillings.
3. Dimensionality control
Anisotropic electronic structure and the resultant an-isotropy in the electrical and magnetic properties of delectron systems arises in general from anisotropic net-work patterns of covalent bondings in the compounds.
FIG. 65. A schematic metal-insulator diagram for the filling-control (FC) and bandwidth-control (BC) 3d transition-metal oxideswith perovskite structure. From Fujimori, 1992.
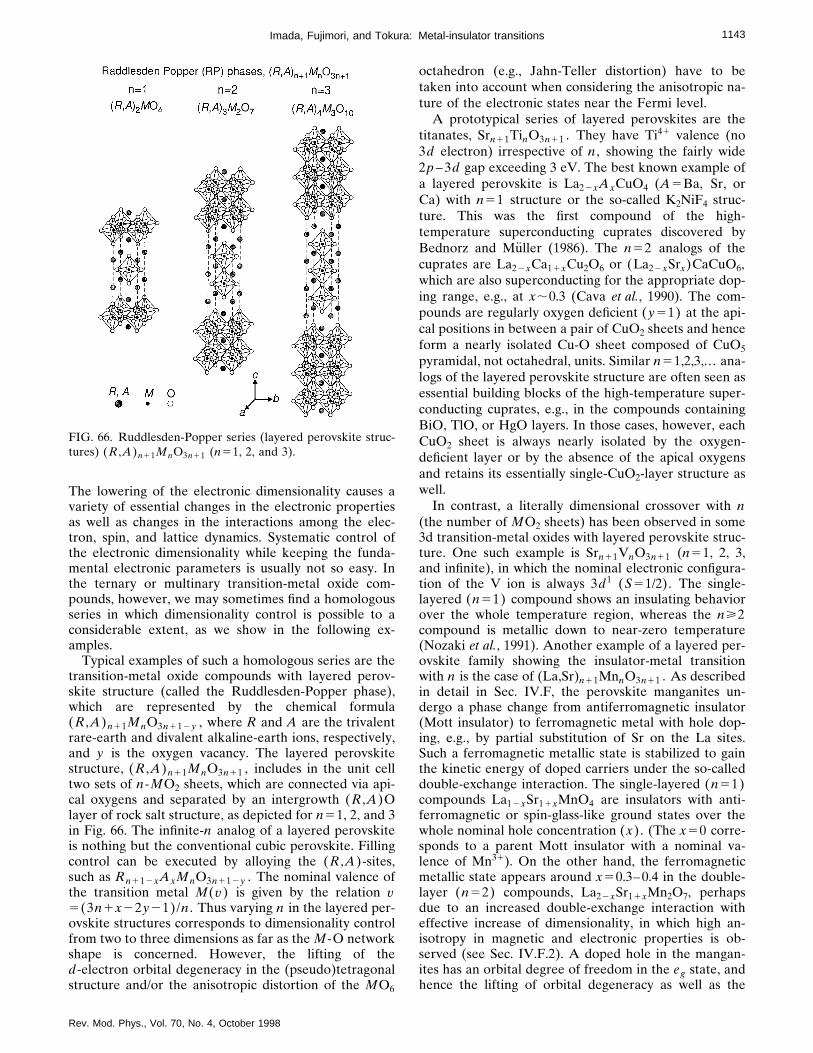
1143Imada, Fujimori, and Tokura: Metal-insulator transitions
The lowering of the electronic dimensionality causes avariety of essential changes in the electronic propertiesas well as changes in the interactions among the elec-tron, spin, and lattice dynamics. Systematic control ofthe electronic dimensionality while keeping the funda-mental electronic parameters is usually not so easy. Inthe ternary or multinary transition-metal oxide com-pounds, however, we may sometimes find a homologousseries in which dimensionality control is possible to aconsiderable extent, as we show in the following ex-amples.
Typical examples of such a homologous series are thetransition-metal oxide compounds with layered perov-skite structure (called the Ruddlesden-Popper phase),which are represented by the chemical formula(R ,A)n11MnO3n112y , where R and A are the trivalentrare-earth and divalent alkaline-earth ions, respectively,and y is the oxygen vacancy. The layered perovskitestructure, (R ,A)n11MnO3n11 , includes in the unit celltwo sets of n-MO2 sheets, which are connected via api-cal oxygens and separated by an intergrowth (R ,A)Olayer of rock salt structure, as depicted for n51, 2, and 3in Fig. 66. The infinite-n analog of a layered perovskiteis nothing but the conventional cubic perovskite. Fillingcontrol can be executed by alloying the (R ,A)-sites,such as Rn112xAxMnO3n112y . The nominal valence ofthe transition metal M(v) is given by the relation v5(3n1x22y21)/n . Thus varying n in the layered per-ovskite structures corresponds to dimensionality controlfrom two to three dimensions as far as the M-O networkshape is concerned. However, the lifting of thed-electron orbital degeneracy in the (pseudo)tetragonalstructure and/or the anisotropic distortion of the MO6
FIG. 66. Ruddlesden-Popper series (layered perovskite struc-tures) (R ,A)n11MnO3n11 (n51, 2, and 3).
Rev. Mod. Phys., Vol. 70, No. 4, October 1998
octahedron (e.g., Jahn-Teller distortion) have to betaken into account when considering the anisotropic na-ture of the electronic states near the Fermi level.
A prototypical series of layered perovskites are thetitanates, Srn11TinO3n11 . They have Ti41 valence (no3d electron) irrespective of n , showing the fairly wide2p –3d gap exceeding 3 eV. The best known example ofa layered perovskite is La22xAxCuO4 (A5Ba, Sr, orCa) with n51 structure or the so-called K2NiF4 struc-ture. This was the first compound of the high-temperature superconducting cuprates discovered byBednorz and Muller (1986). The n52 analogs of thecuprates are La22xCa11xCu2O6 or (La22xSrx)CaCuO6,which are also superconducting for the appropriate dop-ing range, e.g., at x;0.3 (Cava et al., 1990). The com-pounds are regularly oxygen deficient (y51) at the api-cal positions in between a pair of CuO2 sheets and henceform a nearly isolated Cu-O sheet composed of CuO5pyramidal, not octahedral, units. Similar n51,2,3,.. . ana-logs of the layered perovskite structure are often seen asessential building blocks of the high-temperature super-conducting cuprates, e.g., in the compounds containingBiO, TlO, or HgO layers. In those cases, however, eachCuO2 sheet is always nearly isolated by the oxygen-deficient layer or by the absence of the apical oxygensand retains its essentially single-CuO2-layer structure aswell.
In contrast, a literally dimensional crossover with n(the number of MO2 sheets) has been observed in some3d transition-metal oxides with layered perovskite struc-ture. One such example is Srn11VnO3n11 (n51, 2, 3,and infinite), in which the nominal electronic configura-tion of the V ion is always 3d1 (S51/2). The single-layered (n51) compound shows an insulating behaviorover the whole temperature region, whereas the n>2compound is metallic down to near-zero temperature(Nozaki et al., 1991). Another example of a layered per-ovskite family showing the insulator-metal transitionwith n is the case of (La,Sr)n11MnnO3n11 . As describedin detail in Sec. IV.F, the perovskite manganites un-dergo a phase change from antiferromagnetic insulator(Mott insulator) to ferromagnetic metal with hole dop-ing, e.g., by partial substitution of Sr on the La sites.Such a ferromagnetic metallic state is stabilized to gainthe kinetic energy of doped carriers under the so-calleddouble-exchange interaction. The single-layered (n51)compounds La12xSr11xMnO4 are insulators with anti-ferromagnetic or spin-glass-like ground states over thewhole nominal hole concentration (x). (The x50 corre-sponds to a parent Mott insulator with a nominal va-lence of Mn31). On the other hand, the ferromagneticmetallic state appears around x50.3–0.4 in the double-layer (n52) compounds, La22xSr11xMn2O7, perhapsdue to an increased double-exchange interaction witheffective increase of dimensionality, in which high an-isotropy in magnetic and electronic properties is ob-served (see Sec. IV.F.2). A doped hole in the mangan-ites has an orbital degree of freedom in the eg state, andhence the lifting of orbital degeneracy as well as the

1144 Imada, Fujimori, and Tokura: Metal-insulator transitions
effective decrease of W should be taken into accountwhen considering the variation of electronic propertieswith n .
A new homologous series of the ladder chain systemsof the copper oxides, Srn21Cun11O2n , may be viewed asa successful example of dimensionality control between1D and 2D. The structures are depicted for n53 and 5in Fig. 67. The n5` compound corresponds to the so-called infinite-layer compound, SrCuO2 (higher-pressurephase), which is composed of alternating sheets of CuO2and Sr. A strong antiferromagnetic exchange interaction(of the order of 0.1 eV) works between the S51/2 spinson the Cu21 sites connected via the corner oxygens (i.e.,on the corner-sharing Cu sites) but not on the edge-sharing Cu sites. Thus the Cu-O networks shown in Fig.67 can be viewed as representing the two-leg and three-leg antiferromagnetic Heisenberg spin-ladder systems. Itwas theoretically predicted (Dagotto, Riera, and Scala-pino 1992; Rice et al., 1993) that the even-leg chainswould show the singlet ground-state with a spin gap,while the odd-leg chains would have no spin gap.
Takano and co-workers (Hiroi et al., 1991; Azumaet al., 1994; Hiroi and Takano, 1995) have succeeded inpreparing a series of these spin-ladder compounds, n53, 5, and infinite, with use of an ultrahigh-pressure fur-nace. In fact, they have observed a spin-gap behavior inthe temperature dependence of the magnetic suscepti-bility and the NMR relaxation rate (T1) for the n53compound, but not for the n55 compound. Dagotto,Riera, and Scalapino (1992) and Rice et al. (1993) pre-dicted theoretically that hole-doping in a spin-laddersystem with a spin gap might produce the metallic statewith a pseudo spin gap in the underdoped region andgive rise to novel superconductivity. Unfortunately, car-rier doping has not been successful up to now for thespin-ladder systems shown in Fig. 67. However, it is pos-sible for somewhat modified spin-ladder systems, and infact superconductivity was discovered (Uehara et al.,1996), as detailed in Sec. IV.D.1.
IV. SOME ANOMALOUS METALS
In Table IV we summarize the basic properties ofcompounds discussed in this section.
FIG. 67. Schematic structures of spin-ladder chain systems,Srn21Cun11O2n (n53 and 5). From Azuma et al., 1994.
Rev. Mod. Phys., Vol. 70, No. 4, October 1998
A. Bandwidth-control metal-insulator transition systems
1. V2O3
Vanadium sesquioxide V2O3 and its derivatives havebeen extensively studied over the past three decades asthe canonical Mott-Hubbard system. The discovery ofhigh-temperature superconductivity in the doped cu-prates has revived interest in the vanadium and titaniumoxides with many similar ingredients for correlated me-tallic states in close proximity to insulating antiferro-magnetic states. As for undoped and doped V2O3, theliterature is vast (.500 papers), yet a review by Mott(1990) summarizes the basic features (see also Bruckneret al., 1983). Here, we should like to focus on recentadvances in the study of V2O3 achieved in the 1990s.
V2O3 shows the corundum structure (Fig. 68), inwhich the V ions are arranged in V-V pairs along the caxis and form a honeycomb lattice in the ab plane. Theoxidation state of V ions is V31 with 3d2 configuration.Each V ion is surrounded by an octahedron of O atoms.The t2g orbitals are subject to lifting of degeneracy dueto trigonal distortion of the V2O3 lattice and splittinginto nondegenerate a1g and doubly degenerate eg levels.This set of t2g levels forms a group of subbands whichare isolated in energy but do not decouple further withinthe subbands. A recent LDA band-structure calculationby Mattheiss (1994) confirms this feature. On the otherhand, the c-axis V-V pairs have a large overlap of orbit-als in the a1g levels and hence it has been assumed inmany theoretical studies that one electron per V atomresides in a singlet bond of a1g levels and the remainingelectron is accommodated in the doublet eg levels. How-ever, as we discuss below, the electronic state of thismaterial is still controversial.
Direct information about the electronic structure ofV2O3 has been obtained by photoemission and x-ray ab-sorption spectroscopic studies since the 1970s. As shownin Fig. 69, the valence-band photoemission spectra ofV2O3 show the O 2p band located from ;24 to;210 eV and the V 3d band within ;3 eV of the Fermilevel (EF), apparently indicating a typical Mott-Hubbard-type electronic structure, i.e., D.U (Shinet al., 1990). The peak of the V 3d band (at 1–1.5 eVbelow EF) shows a weak dispersion of ;0.5 eV accord-ing to angle-resolved photoemission spectroscopy(Smith and Henrich, 1988). This assignment was con-firmed by a resonant photoemission study, in which astrong enhancement of the near-EF feature was ob-served for photon energies above the V 3p→3d coreabsorption threshold (hn*45 eV), as shown in the fig-ure. However, hybridization between the O 2p and V3d states is substantial, as indicated by their havingnearly the same D and U values (;4 eV), as describedin Sec. III.B (Bocquet et al., 1996). If one applies thelocal-cluster configuration-interaction picture to V2O3,the V 3d band just below EF in the photoemission spec-tra is described as made up of bonding states which areformed between the d1 and d2LI configurations in the(N21)-electron final state and are pushed out of thep-band continuum (i.e., d2LI ) due to strong p-d
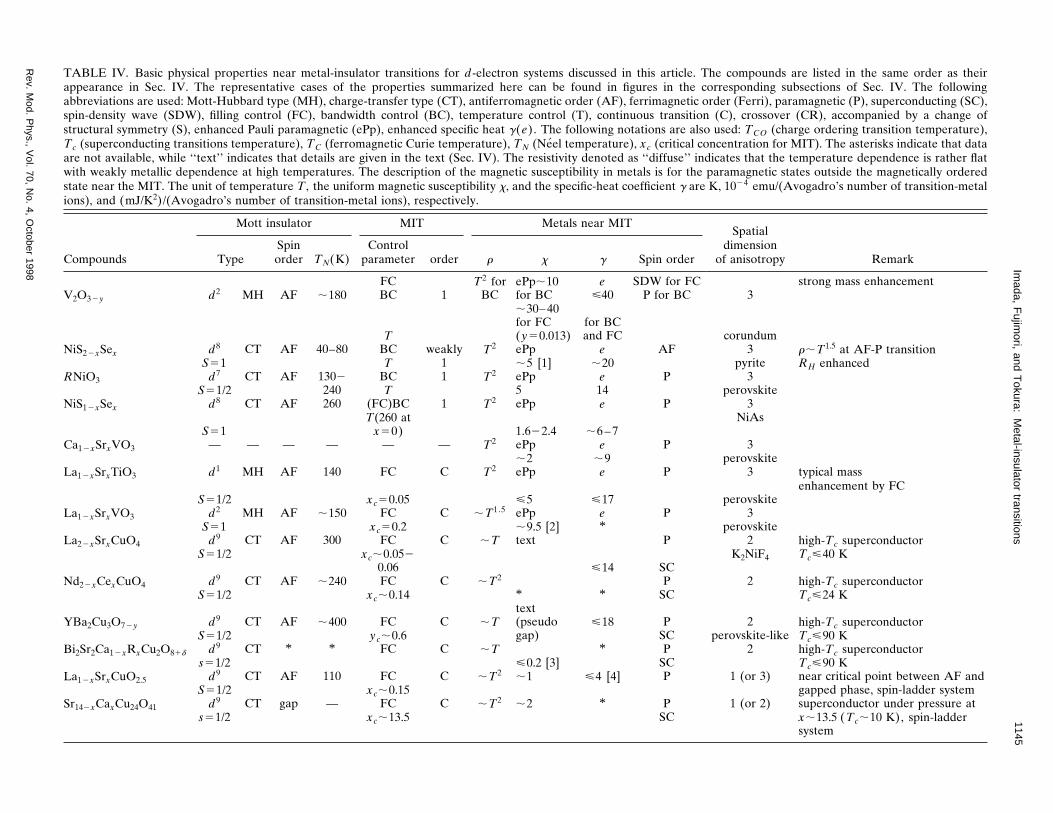
ounds are listed in the same order as theirding subsections of Sec. IV. The followingri), paramagnetic (P), superconducting (SC),ssover (CR), accompanied by a change of
CO (charge ordering transition temperature),on for MIT). The asterisks indicate that dataat the temperature dependence is rather flatetic states outside the magnetically orderedmu/(Avogadro’s number of transition-metal
ialsiontropy Remark
strong mass enhancement
dumr;T1.5 at AF-P transition
te RH enhanced
skite
s
skitetypical massenhancement by FC
skite
skitehigh-Tc superconductor
iF4 Tc<40 K
high-Tc superconductorTc<24 K
high-Tc superconductorte-like Tc<90 K
high-Tc superconductorTc<90 K
3) near critical point between AF andgapped phase, spin-ladder system
2) superconductor under pressure atx;13.5 (Tc;10 K), spin-laddersystem
1145Im
ada,F
ujimori,
andT
okura:M
etal-insulatortransitions
Rev.
Mod.
Phys.,
Vol.
70,N
o.4,
October
1998
TABLE IV. Basic physical properties near metal-insulator transitions for d-electron systems discussed in this article. The compappearance in Sec. IV. The representative cases of the properties summarized here can be found in figures in the corresponabbreviations are used: Mott-Hubbard type (MH), charge-transfer type (CT), antiferromagnetic order (AF), ferrimagnetic order (Ferspin-density wave (SDW), filling control (FC), bandwidth control (BC), temperature control (T), continuous transition (C), crostructural symmetry (S), enhanced Pauli paramagnetic (ePp), enhanced specific heat g(e). The following notations are also used: TTc (superconducting transitions temperature), TC (ferromagnetic Curie temperature), TN (Neel temperature), xc (critical concentratiare not available, while ‘‘text’’ indicates that details are given in the text (Sec. IV). The resistivity denoted as ‘‘diffuse’’ indicates thwith weakly metallic dependence at high temperatures. The description of the magnetic susceptibility in metals is for the paramagnstate near the MIT. The unit of temperature T , the uniform magnetic susceptibility x, and the specific-heat coefficient g are K, 1024 eions), and (mJ/K2)/(Avogadro’s number of transition-metal ions), respectively.
Compounds
Mott insulator MIT Metals near MITSpat
dimenof anisoType
Spinorder TN(K)
Controlparameter order r x g Spin order
FC T2 for ePp;10 e SDW for FCV2O32y d2 MH AF ;180 BC 1 BC for BC <40 P for BC 3
;30–40for FC for BC
T (y50.013) and FC corunNiS22xSex d8 CT AF 40–80 BC weakly T2 ePp e AF 3
S51 T 1 ;5 [1] ;20 pyriRNiO3 d7 CT AF 1302 BC 1 T2 ePp e P 3
S51/2 240 T 5 14 perovNiS12xSex d8 CT AF 260 (FC)BC 1 T2 ePp e P 3
T(260 at NiAS51 x50) 1.622.4 ;6 –7
Ca12xSrxVO3 — — — — — — T2 ePp e P 3;2 ;9 perov
La12xSrxTiO3 d1 MH AF 140 FC C T2 ePp e P 3
S51/2 xc50.05 <5 <17 perovLa12xSrxVO3 d2 MH AF ;150 FC C ;T1.5 ePp e P 3
S51 xc50.2 ;9.5 [2] * perovLa22xSrxCuO4 d9 CT AF 300 FC C ;T text P 2
S51/2 xc;0.052 K2N0.06 <14 SC
Nd22xCexCuO4 d9 CT AF ;240 FC C ;T2 P 2S51/2 xc;0.14 * * SC
textYBa2Cu3O72y d9 CT AF ;400 FC C ;T (pseudo <18 P 2
S51/2 yc;0.6 gap) SC perovskiBi2Sr2Ca12xRxCu2O81d d9 CT * * FC C ;T * P 2
s51/2 <0.2 [3] SCLa12xSrxCuO2.5 d9 CT AF 110 FC C ;T2 ;1 <4 [4] P 1 (or
S51/2 xc;0.15Sr142xCaxCu24O41 d9 CT gap — FC C ;T2 ;2 * P 1 (or
s51/2 xc;13.5 SC

atialnsion
sotropy Remark
1 TL liquid?gonal
ferrimagnetic Tc5858 K3 charge order Tco5121 Kinel resistivity is metallic (dr/dT.0)
only at T.350 K3 charge ordervskite x50.66 Tco5210 K, dr/dT,0
even at T.Tcocharge order
2 y50.125 TN5110 KNiF4 x50.33 Tco5240 K,
TN5180 K x50.5Tco5340 K, dr/dT,0
even at T>Tco2 charge orderNiF4 x50.5 Tco5217 K, TN5110 K3 double-exchange systemvskite ferromagnetic Tc;370 K (x;0.3)2 double-exchange systemvskite3ed NaClr 3
tile3ndum3 low-spin, intermediate-spinvskite (high-spin) transition
2isfit
2 superconducting Tc;1 KNiF43vskite
1146Im
ada,F
ujimori,
andT
okura:M
etal-insulatortransitions
Rev.
Mod.
Phys.,
Vol.
70,N
o.4,
October
1998
TABLE IV. (Continued).
Compounds
Mott insulator MIT Metals near MITSp
dimeof aniType
Spinorder TN(K)
Controlparameter order r x g Spin order
BaVS3 d1 MH AF ;35 T C diffuse CW * PS51/2 (74 K) hexa
Fe3O4 d6,d5 Ferri T 1 diffuse — — PS52,5/2 (121 K) S Ferri sp
La12xSrxFeO3 d5 CT AF 740(x50) FC C diffuse CW * P(x,0.7) orS55/2 134(x51) T (at Tco) AF(x51) pero
;500 atLa22xSrxNiO41y d8 CT AF x5y50 [5] FC C diffuse ;4[6] * P
xc;0.72 K2
0.8
La12xSr11xMnO4 d4 CT AF 120 — — — — — —S52 K2
La12xSrxMnO3 d4 CT AF 140 FC C T2 — ;3 –5 FS52 (xc;0.17) pero
La222xSr112xMn2O7 d4 CT * * FC C * — * FS52 (xc;0.3) pero
FeSi gap — T CR diffuse CW — P(300 K) distort
VO2 d1 (MH) gap — T 1 T? ePp — P 1 o(340 K) S ;6 ru
Ti2O3 d1 MH gap — (FC) T CR diffuse * — P400 K–600 K coru
LaCoO3 d6 CT gap — T CR diffuse CW — PS50,1, ;500 K pero
2La1.172xAxVS3.17 d2 (MH) gap — FC(xc;0.35) CR diffuse ePp e P
T (280 K mat x50.17) 4.4 ,20
Sr2RuO4 — — — — — — ;T2 ePp 9.7 39 PSC K2
Ca12xSrxRuO3 — — — — — — T2 CW 30 P(x,0.4)(x,0.4) x51 F(x.0.4) pero

1147Imada, Fujimori, and Tokura: Metal-insulator transitions
(d1-d2LI ) hybridization (Uozumi et al., 1993). Cluster-model analysis has revealed considerable weight ofcharge-transfer configurations, d3LI ,d4LI 2,. . . , mixed intothe ionic d2 configuration, resulting in a net d-electronnumber of nd.3.1 (Bocquet et al., 1996). This value isconsiderably larger than the d-band filling or the formald-electron number n52 and is in good agreement withthe value (nd53.0) deduced from an analysis of core-core-valence Auger spectra (Sawatzky and Post, 1979).If the above local-cluster CI picture is relevant to experi-ment, the antibonding counterpart of the split-off bond-ing state is predicted to be observed as a satellite on thehigh-binding-energy side of the O 2p band, although itsspectral weight may be much smaller than the bondingstate [due to interference between the d2→d11e andd3LI→d2LI 1e photoemission channels; see Eq. (3.12)].Such a spectral feature was indeed observed in an ultra-violet photoemission study by Smith and Henrich (1988)and in a resonant photoemission study by Park andAllen (1997). In spite of the strong p-d hybridizationand the resulting charge-transfer satellite mechanism de-scribed above, it is not only convenient but also realisticto regard the d1-d2LI bonding band as an effective V 3dband (lower Hubbard band). The 3d wave function isthus considerably hybridized with oxygen p orbitals andhence has a relatively small effective U of 1–2 eV (Sa-watzky and Post, 1979) instead of the bare value U;4 eV. Therefore the effective d bandwidth W becomescomparable to the effective U : W;U . With these factsin mind, one can regard V2O3 as a model Mott-Hubbardsystem and the (degenerate) Hubbard model as a rel-evant model for analyzing the physical properties ofV2O3.
The time-honored phase diagram for doped V2O3 sys-tems, (V12xCrx)2O3 and (V12xTix)2O3 , is reproducedin Fig. 70. The phase boundary represented by the solidline is of first order, accompanied by thermal hysteresis(Kuwamoto, Honig, and Appel, 1980). In a Cr-dopedsystem (V12xCrx)2O3 , a gradual crossover is observedfrom the high-temperature paramagnetic metal (PM) to
FIG. 68. Corundum structure of V2O3.
Rev. Mod. Phys., Vol. 70, No. 4, October 1998
FIG. 69. Photoemission spectra of V2O3 in the metallic phasetaken using photon energies in the 3p-3d core excitation re-gion. From Shin et al., 1990.
FIG. 70. Phase diagram for doped V2O3 systems,(V12xCrx)2O3 and (V12xTix)2O3. From McWhan et al., 1971,1973.

1148 Imada, Fujimori, and Tokura: Metal-insulator transitions
the paramagnetic insulator (PI) with decreasing tem-perature from above the 500-K region. In a(V12xCrx)2O3 (x50.03) crystal, for example, one en-counters the three transitions from the high-temperatureside: PM to PI, PI to PM, and PM to antiferromagneticinsulator, the last two of which are of first order. Such areentrant MIT disappears for x(Cr),0.05, and withx(Ti).0.05 the metallic phase dominates over thewhole temperature region.
As first theoretically demonstrated by Castellani et al.(1978a, 1978b, 1978c), orbital spin coupling of the type(2.8) is particularly important for our understanding ofthe ordered spin structure in the antiferromagnetic insu-lating (AFI) phase, since the sign and magnitude of thespin-spin superexchange couplings are dependent on theorbital occupancy. More recently, Rice (1995) stressedthat the interaction between orbital and spin degrees offreedom is strong and mutually frustrating, so that theparamagnetic phases may have strong spin and orbitalfluctuations which are unrelated to the ordered phase.This may explain the first-order nature of the magneticorder transition because, in general, two competing or-der parameters easily trigger a first-order transition, ascan be seen in the Landau free-energy expansion. Rice’sconjecture has been confirmed in a recent inelastic neu-tron scattering measurement by Bao et al. (1997). Themomentum dependence of the spin fluctuation in thePM state is not related at all to that of the spin orderingin the AFI state, where the orbital ordering effect issupposed to be important.
The pioneering and extensive work by McWhan andcoworkers (McWhan et al., 1973) demonstrated thatthere is an empirical scaling relating the addition of Ti31
(Cr31) and external pressures, 0.4 GPa per 0.01 additionof Ti31 and 0.4 Gpa per 0.01 removal of Cr31. It hadbeen anticipated that the doping of Cr or Ti would notalter the electron counting of the V sites but ratherwould affect the one-electron bandwidth via a slightmodification of the lattice. In the case of Cr doping, thethree 3d electrons on the impurity Cr-site may be tightlybound, so the above hypothesis holds fairly well. By con-trast, the doped Ti atom can be in a mixed valence be-tween 31 and 41 , indicating a possible change in theband filling. Thus the Ti-doping-induced MIT is notpurely a BC-MIT but has the character of an FC-MIT.
A difference between Ti doping and application ofpressure is seen in the ground state of the metallic state:The Ti-doped metallic crystal (0.06,x,0.30) undergoesan antiferromagnetic transition at 10–50 K (Ueda et al.,1979), though this is not shown in Fig. 70. Ueda, Kosuge,and Kachi (1980) also found that an electronic phasediagram similar to the case of Ti doping occurs for O-rich (or equivalently V-deficient) samples (V22yO3):The AFI abruptly disappears with y.0.02 and insteadthe antiferromagnetic metal (AFM) phase is present be-low 8–10 K up to y50.05, beyond which the sampleshows a phase separation.
The spin structure in the AFM phase was recentlydetermined by neutron scattering for an O-rich crystal(Bao et al., 1993; Bao, Broholm, et al., 1996). The phase
Rev. Mod. Phys., Vol. 70, No. 4, October 1998
diagram for a V22yO3 system as a function of both pres-sure (P) and y is displayed in Fig. 71. Notably, the me-tallic V22yO3 develops a spiral spin-density wave(SDW) below TN59 K (in the AFM phase), with incom-mensurate wave vector q'1.7c* . The incommensuratespin structure is depicted in Fig. 72: The ordered spin fory50.027 is in the basal plane with a magnitude of0.15mB , forming a perfect planar honeycomb antiferro-magnet, and spins in the nearest-neighbor plane are al-most perpendicular. More recently, a nearly identical
FIG. 71. Phase diagram for V22yO3 system as a function ofboth pressure (P) and y (Carter et al., 1993, 1994). From Baoet al., 1993.
FIG. 72. Incommensurate spin structure of V22yO3. From Baoet al., 1993.

1149Imada, Fujimori, and Tokura: Metal-insulator transitions
spin structure and moment were confirmed to be presentin the AFM phase for a Ti-doped (x50.05) crystal.
In contrast with the robust helical SDW phase againsty in V22yO3, pressure above 2 GPa transforms a neatV2O3 crystal to the low-temperature metallic state with-out magnetic order (McWhan et al., 1973; Carter et al.,1994). Importantly, there is no sign of superconductivitydown to 350 mK in this BC-MIT (Carter et al., 1994).The magnetic properties of such a pressurized metallicstate were investigated by measurements of the 51VNMR Knight shift and the spin-lattice relaxation rate(1/T1 ; Takigawa et al., 1996). [At 1.83 GPa, the highestpressure attainable in that measurement, a major frac-tion of the sample showed the MIT around 70 K, while afinite fraction (about 4%) of the PM phase remained atthe lowest temperature for unidentified reasons but notdue to the presence of impurities or nonstoichiometry.]The spin susceptibility deduced from the Knight-shiftdata has a maximum at 40 K. Also, a peak was observedin the 1/T1T versus T curve at 8 K. These phenomenaresemble the spin-gap behavior observed in lightlydoped (underdoped) cuprate superconductors (see Sec.IV.C.3), although the temperature scale differs by nearlyone order of magnitude. At the moment, it is not clearwhether this ‘‘gap’’ behavior arises from the spin contri-bution or the orbital one due to orbital degeneracy (Cas-tellani et al., 1978a, 1978b, 1978c; Rice, 1995). Such ananomalous metallic state in pressurized V2O3 is particu-larly interesting in light of the possibility of a spin-gapped metal or an orbital contribution and warrantsfurther study.
The Ti-doping-induced or V-deficiency-induced MITis easier to investigate experimentally than the undopedcase, which needs relatively high pressure. However, therobust presence of the SDW in the AFM phase compli-cates the interpretation of T50 MIT in terms of thecanonical Hubbard model. Nearly a quarter of a centuryago, McWhan and co-workers (1971) found that theT-linear term in the heat capacity in the Ti-doped (x50.08) metallic state was very large (g580 mJ K22 permol. of V2O3) and that the Wilson ratio x/g51.8. Onthe other hand, the Hall coefficient for the metallic V2O3both under pressure (2 GPa, T54.2 K) and at ambientpressure (T5150 K), is 1(3.560.4)31024 cm3/C, indi-cating nearly one hole-type carrier per V site. Such alarge mass enhancement effect has been interpreted as aclear manifestation of Brinkman-Rice-type mass renor-malization on the verge of the BC-MIT. One may no-tice, however, that the low-temperature metallic state isdifferent for the different cases, namely, those underpressures of more than 2 GPa and those induced by Tidoping (or V deficiency). The critical behavior of g aswell as of the Hall coefficient was reinvestigated recentlyby Carter and her co-workers (1993, 1994). Figure 73shows the Hall coefficient versus temperature for (a) aseries of barely metallic V-deficient crystals and (b) aninsulating crystal driven to metallic under pressure.[Note that both cases show the SDW phase below about10 K in the measured composition (y) and pressure re-gion. See also the phase diagram in Fig. 71.] The respec-
Rev. Mod. Phys., Vol. 70, No. 4, October 1998
tive Hall coefficient versus temperature curves showmaxima at around the SDW transition temperature(;10 K). As the paramagnetic high-temperature stateapproaches the SDW transition with decrease of tem-perature, the Hall coefficient is critically enhanced fromthe high-temperature value (3 –431024 cm3/C), whichis comparable with the value observed for a pressure-driven metallic V2O3 (20 GPa, 4.2 K; McWhan et al.,1973). Such an anomalous enhancement of the Hall co-efficient is reminiscent of the high-temperature super-conducting cuprates (see Sec. IV.C), although the en-hanced amplitude is substantially smaller than that inthe high-Tc cuprates. The enhancement ceases as thetemperature is decreased below TN .
Another notable feature in Fig. 73 is that the V defi-ciency y , or equivalently the change in the band filling,remarkably suppresses such an enhancement of the Hallcoefficient, which is nearly linear with y around TN . Theobserved behavior bears a qualitative resemblance tothe case of the hole-doped cuprates, e.g., La22xSrxCuO4(see Sec. IV.D), in which the Hall coefficient shows astrong temperature dependence in the underdoped re-gion and the enhanced coefficient nearly scales with 1/xrather than the inverse band filling (12x)21. One mightspeculate that the two systems share a common under-lying physics caused by strong antiferromagnetic spinfluctuations. However, we need careful and furtheranalyses, because the enhanced amplitude is consider-ably different (typically by an order of magnitude).
The critical behavior of the electronic specific-heat co-efficient g is shown in Fig. 74 as a function of y (atambient pressure) as well as of pressure P for the spe-cific (y50.013) crystal (Carter et al., 1993). In the lightof the phase diagram depicted in Fig. 71, the metalliccrystal whose g is shown in Fig. 74 is in the SDW stateand not in the paramagnetic phase. The aforementionedlarge g for the Ti-doped (x50.95) crystal that was re-ported by McWhan et al. (1971) must also be for theSDW state. As seen in Fig. 74, the g for the pressurized
FIG. 73. Temperature dependence of Hall coefficient for (a) aseries of V-deficient crystals in the metallic phase and (b) aninsulating crystal driven to metallic with pressure. From Carteret al., 1993, 1994.
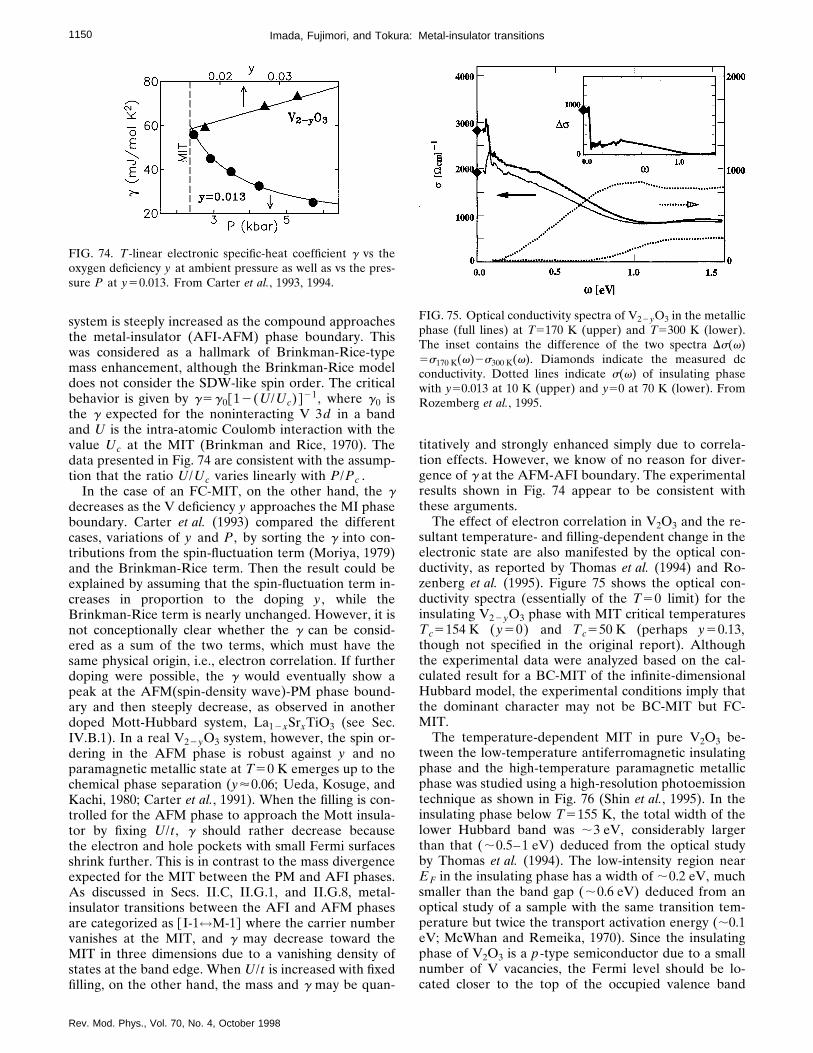
1150 Imada, Fujimori, and Tokura: Metal-insulator transitions
system is steeply increased as the compound approachesthe metal-insulator (AFI-AFM) phase boundary. Thiswas considered as a hallmark of Brinkman-Rice-typemass enhancement, although the Brinkman-Rice modeldoes not consider the SDW-like spin order. The criticalbehavior is given by g5g0@12(U/Uc)#21, where g0 isthe g expected for the noninteracting V 3d in a bandand U is the intra-atomic Coulomb interaction with thevalue Uc at the MIT (Brinkman and Rice, 1970). Thedata presented in Fig. 74 are consistent with the assump-tion that the ratio U/Uc varies linearly with P/Pc .
In the case of an FC-MIT, on the other hand, the gdecreases as the V deficiency y approaches the MI phaseboundary. Carter et al. (1993) compared the differentcases, variations of y and P , by sorting the g into con-tributions from the spin-fluctuation term (Moriya, 1979)and the Brinkman-Rice term. Then the result could beexplained by assuming that the spin-fluctuation term in-creases in proportion to the doping y , while theBrinkman-Rice term is nearly unchanged. However, it isnot conceptionally clear whether the g can be consid-ered as a sum of the two terms, which must have thesame physical origin, i.e., electron correlation. If furtherdoping were possible, the g would eventually show apeak at the AFM(spin-density wave)-PM phase bound-ary and then steeply decrease, as observed in anotherdoped Mott-Hubbard system, La12xSrxTiO3 (see Sec.IV.B.1). In a real V22yO3 system, however, the spin or-dering in the AFM phase is robust against y and noparamagnetic metallic state at T50 K emerges up to thechemical phase separation (y'0.06; Ueda, Kosuge, andKachi, 1980; Carter et al., 1991). When the filling is con-trolled for the AFM phase to approach the Mott insula-tor by fixing U/t , g should rather decrease becausethe electron and hole pockets with small Fermi surfacesshrink further. This is in contrast to the mass divergenceexpected for the MIT between the PM and AFI phases.As discussed in Secs. II.C, II.G.1, and II.G.8, metal-insulator transitions between the AFI and AFM phasesare categorized as @I-1↔M-1# where the carrier numbervanishes at the MIT, and g may decrease toward theMIT in three dimensions due to a vanishing density ofstates at the band edge. When U/t is increased with fixedfilling, on the other hand, the mass and g may be quan-
FIG. 74. T-linear electronic specific-heat coefficient g vs theoxygen deficiency y at ambient pressure as well as vs the pres-sure P at y50.013. From Carter et al., 1993, 1994.
Rev. Mod. Phys., Vol. 70, No. 4, October 1998
titatively and strongly enhanced simply due to correla-tion effects. However, we know of no reason for diver-gence of g at the AFM-AFI boundary. The experimentalresults shown in Fig. 74 appear to be consistent withthese arguments.
The effect of electron correlation in V2O3 and the re-sultant temperature- and filling-dependent change in theelectronic state are also manifested by the optical con-ductivity, as reported by Thomas et al. (1994) and Ro-zenberg et al. (1995). Figure 75 shows the optical con-ductivity spectra (essentially of the T50 limit) for theinsulating V22yO3 phase with MIT critical temperaturesTc5154 K (y50) and Tc550 K (perhaps y50.13,though not specified in the original report). Althoughthe experimental data were analyzed based on the cal-culated result for a BC-MIT of the infinite-dimensionalHubbard model, the experimental conditions imply thatthe dominant character may not be BC-MIT but FC-MIT.
The temperature-dependent MIT in pure V2O3 be-tween the low-temperature antiferromagnetic insulatingphase and the high-temperature paramagnetic metallicphase was studied using a high-resolution photoemissiontechnique as shown in Fig. 76 (Shin et al., 1995). In theinsulating phase below T5155 K, the total width of thelower Hubbard band was ;3 eV, considerably largerthan that (;0.5–1 eV) deduced from the optical studyby Thomas et al. (1994). The low-intensity region nearEF in the insulating phase has a width of ;0.2 eV, muchsmaller than the band gap (;0.6 eV) deduced from anoptical study of a sample with the same transition tem-perature but twice the transport activation energy (;0.1eV; McWhan and Remeika, 1970). Since the insulatingphase of V2O3 is a p-type semiconductor due to a smallnumber of V vacancies, the Fermi level should be lo-cated closer to the top of the occupied valence band
FIG. 75. Optical conductivity spectra of V22yO3 in the metallicphase (full lines) at T5170 K (upper) and T5300 K (lower).The inset contains the difference of the two spectra Ds(v)5s170 K(v)2s300 K(v). Diamonds indicate the measured dcconductivity. Dotted lines indicate s(v) of insulating phasewith y50.013 at 10 K (upper) and y50 at 70 K (lower). FromRozemberg et al., 1995.

1151Imada, Fujimori, and Tokura: Metal-insulator transitions
than to the bottom of the unoccupied conduction bandand should thus be separated from the top of the va-lence band by a p-type transport activation energy. Theorigin of the small discrepancy between the photoemis-sion gap (;0.2 eV) and the activation energy ;0.1 eVis not clear but might be due to a polaronic effect, whichgenerally increases the photoemission gap compared tothe transport gap for p-type semiconductors. In the in-sulating phase, the spectrum shows a shoulder on thelow-binding-energy side of the lower Hubbard band, i.e.,at ;0.5 eV below EF , which may correspond to the co-herent part of the spectral function as predicted byHubbard-model calculations for the Mott insulatingphase (Shin et al., 1995). In the metallic phase (T.155 K), the gap is closed and finite spectral weightappears at EF . However, the lower Hubbard band per-sists in the metallic phase without significant change inits line shape from that in the insulating phase, exceptfor a broadening by ;0.5 eV. This indicates that elec-tron correlation remains substantial even in the metallicphase, in accordance with the strong mass renormaliza-tion of conduction electrons. If we attribute the spectralweight near EF , which appeared above the MIT tem-perature, to that of quasiparticles, the quasiparticle spec-tral weight Z[mb /mv [Eq. (2.73c)] is as small as ;0.05.On the other hand, the spectral intensity at EF@5(mk /mb)Nb(m)# is only 10–20 % of Nb(m) deducedfrom the band-structure calculation (Ashkenazi andWeger, 1973). Thus the effective mass m* /mb5(mk /mb)(mv /mb);224, which is consistent withm* /mb.5 deduced from the electronic specific heat ofthe metallic phase of V2O3 (stabilized at low tempera-tures by pressure or V vacancies). The small quasiparti-cle weight Z;0.05 indicates that the metallic carriersare largely incoherent in V2O3, consistent with thelargely incoherent optical conductivity spectra (Thomaset al., 1994).
The high-temperature MIT in Cr-doped samples be-tween the high-temperature paramagnetic insulating(PI) phase and the low-temperature paramagnetic me-tallic (PM) phase was studied by photoemission bySmith and Henrich (1994). They found the spectral in-
FIG. 76. High-resolution photoemission spectra of V2O3 aboveand below the MIT temperature (Shin et al., 1995). The Fermiedge disappears below the transition temperature.
Rev. Mod. Phys., Vol. 70, No. 4, October 1998
tensity at EF to be reduced again above the transition,but the high-temperature insulating phase had a largerbandwidth than that of the low-temperature insulatingphase, which would partly be due to thermal broadeningand partly due to the absence of magnetic ordering.
As mentioned above, most of the theoretical studieson V2O3 (Ashkenazi and Weger, 1973; Castellani, Na-toli, and Ranninger, 1978a, 1978b, 1978c; Hertel and Ap-pel, 1986) employed a model in which one electron oc-cupied the eg level and the other electron occupied thea1g level. Here, the a1g electrons were assumed to forma Heitler-London-type singlet bond between the two ad-jacent V atoms along the c axis (or equivalently, twoelectrons occupied the bonding state formed betweenthe a1g orbitals of the two V ions). Thus the remainingeg electron contributed to the magnetic and transportproperties and the Hubbard model, with one electronper site used as an appropriate starting point for V2O3.Recently, based on their LDA1U band-structure calcu-lations, Czyzyk and Sawatzky (1997) proposed a newmodel in which the two d electrons occupy the eg orbit-als, forming a high-spin (S51) state. Then the experi-mental value of the ordered magnetic moment, 1.2mB , isnaturally explained by the reduction of the high-spinmoment (2mB) due to a covalency effect. Indeed, thenearest-neighbor V-V distance is elongated compared tothat of the ideal corundum structure, implying that theneighboring V ions do not form a chemical bond. Thismodel was supported by recent V 2p x-ray absorptionspectroscopy (Park et al., 1997b). If this model is correct,the whole scenario of V2O3 should be fundamentallymodified. Further experimental and theoretical studiesare necessary to confirm this point in the future.
2. NiS22xSex
The pyrite system NiS22xSex has long been one of thetypical compounds for BC-MIT systems. The progressup to the mid 1980s was thoroughly reviewed by Wilson(1985). A more concise review on the MIT in NiS22xSexwas also given by Ogawa (1979), who with his co-workers had done pioneering work on this system. Here,let us confine ourselves to the nature of the metallicstate on the verge of the BC-MIT in NiS22xSex .
The end member NiS2 shows a pyrite structure, inwhich Ni and S2 form a NaCl-type lattice. Due to strongintradimer bonding, the S2 pair accepts only two elec-trons in the bonding state and hence serves as a singleanion S2
22. Ni in the pyrite is hence formally divalentwith two dg electrons. As we shall discuss below, ac-cording to the renewed view on the correlated electronicstructure, NiS2 is a charge-transfer insulator (Fujimori,Mamiya, et al., 1996). The other end compound NiSe2,which is isostructural with NiS2, is a paramagnetic metalover the whole temperature range. This is because the porbital of the Se2
22 ion has larger spatial extent thanthat of S2
22 and hence larger p-d and p-p transfer in-teractions. Thus NiSe2 may be viewed as derived from acharge-transfer insulator by closing of the CT gap.

1152 Imada, Fujimori, and Tokura: Metal-insulator transitions
The solid solution NiS22xSex with amalgamated pbands undergoes the BC-MIT around x50.8 at roomtemperature and around x50.45 at low temperaturesbelow about 100 K (Wilson and Pitt, 1971; Bouchardet al., 1973; Jarrett et al., 1973; Czjzek et al., 1976), asshown in Fig. 60 and also reproduced in the top panel ofFig. 77 (Miyasaka et al., 1998). The antiferromagneticmetal phase is present in between the antiferromagneticinsulator and paramagnetic metal phases, which bearssome analogy to the case of V2O3 (see Sec. IV.B.1). TheAFI-AFM transition is weakly first order, while theAFM-PM transition is second order. The AFI state ofNiS2 shows a complicated spin structure (Miyadai et al.,1978; Panissod et al., 1979), which is a superposition oftwo kinds of sublattice structures, M1 and M2. In theAFM phase, only the M1-type (MnTe2-type) magneticstructure appears to be preserved through the AFI-AFM transition and the averaged staggered momentshows a gradual decrease with x , for example, from'1.0mB for x50 (AFI) to '0.5mB for x50.65 (AFM)(Miyadai et al., 1983).
The electronic structure of NiS2 and NiS22ySey as wellas of the pyrite-type chalcogenides of Fe and Co hasbeen studied by photoemission and inverse-photoemission spectroscopy for decades. Figure 78shows combined photoemission and BIS spectra of thenonmagnetic semiconductor FeS2 (Mamiya et al.,1997b). There is a large gap between the occupied ppband and the unoccupied antibonding ps* band, both
FIG. 77. The x dependence of x, A , and residual resistivity(r0) for NiS22xSex . From Miyasaka et al., 1997.
Rev. Mod. Phys., Vol. 70, No. 4, October 1998
originating from the corresponding molecular orbitals ofthe S2
22 molecule. The narrow t2g band of Fe 3d originis completely filled and located within the pp-ps* gap;the relatively wide eg band is empty and overlaps theempty ps* band. In going from FeS2 to CoS2 to NiS2,the t2g band is progressively broadened and an addi-tional feature due to the occupation of the eg band ap-pears near EF . The transition-metal ions in the pyrite-type compounds tend to take low-spin configurations:S50 for Fe21(d6), S51/2 for the Co21(d7) ion, and S51 for Ni21(d8). [No low-spin (S50) ground state ispossible for the d8 ion in a cubic crystal field.] Earlierphotoemission studies utilized ligand field theory (vander Heide et al., 1980), molecular-orbital calculations onMS6 clusters (E. K. Li et al., 1974) and band-structurecalculations (Krill and Amamou, 1980; Folkerts et al.,1987) and the structures within ;4 eV from EF , wereattributed to metal 3d states. A recent resonant photo-emission study of NiS2 (Fujimori, Mamiya, et al., 1996),however, showed that 3p-to-3d resonance enhancementoccurs at 5–10 eV below EF rather than in the ‘‘d-band’’region near EF , indicating that NiS2 is a charge-transferinsulator. In going from NiS2 through CoS2 to FeS2, thenear-EF region becomes more strongly enhanced, indi-cating that the system gradually changes from charge-transfer-like to Mott-Hubbard-like because of the in-creasing D (and decreasing U). The photoemissionspectra of NiS2 were analyzed using the CI cluster model
FIG. 78. Photoemission and inverse-photoemission (BIS)spectra of FeS2 (Mamiya et al., 1997b) compared with theband-structure calculation (Folkerts et al., 1987). Good agree-ment is found between theory and experiment.

1153Imada, Fujimori, and Tokura: Metal-insulator transitions
(Fujimori, Mamiya, et al., 1996). The electronic structureparameters were obtained as D51.8 eV, U53.3 eV,and the charge transfer energy (pds)51.5 eV, confirm-ing the p→d charge-transfer nature of the band gap. Wenote that the global spectral line shape does not changevery much across the Se-substitution-induced MIT ex-cept for a slight narrowing of the photoemission main(d8LI final-state) peak in the metallic phase and overallshifts of the empty d and ps* bands in the inverse-photoemission spectra toward EF in going from the me-tallic to the insulating phase by 0.2–0.3 eV (Mamiyaet al., 1997b) due to closure of the band gap.
Viewed from the paramagnetic metallic side, the MITis accompanied by strong enhancement of the electronicspecific heat(g), the paramagnetic susceptibility (x), andthe coefficient of the T2 term (A) in the temperature-dependent resistivity, as noted by Ogawa (1979) and re-cently reinvestigated by Miyasaka et al. (1998). The xdependence of x, A , and the residual resistivity (r0) issummarized in Fig. 77 (Miyasaka et al., 1998). In the PMphase (1.0,x,2.0), g increases critically with decreas-ing x down to the PM-AFM phase boundary (x51.0)from 10 mJ/mol K2 for x52.0 (NiSe2) to 28 mJ/mol K2.On the other hand, the Hall coefficient in the PM phaseis almost temperature independent and approximately1024 cm3/C with positive sign, as shown in the x.1 dataof Fig. 79, which is consistent with a large Fermi surfacecontaining '2 carriers per atom of Ni. These resultsclearly indicate mass renormalization as the insulatorphase is approached, while the Fermi surface is pre-served in volume. In accord with this, the nearlytemperature-independent x is also enhanced (Ogawa,1979) and the Wilson ratio x/g is around 2, nearly con-stant against x .
The T2 coefficient A of the resistivity also reflectssuch an x-dependent mass-renormalization effect, asshown in the third panel of Fig. 77. Except for the region
FIG. 79. Temperature dependence of Hall coefficient in thePM phase for x.1 of NiS22xSex . From Miyasaka et al., 1998.
Rev. Mod. Phys., Vol. 70, No. 4, October 1998
near the AFM-PM phase boundary, A is nearly propor-tional to g2, obeying the Kadowaki-Woods relation for astrongly correlated Fermi liquid (Kadowaki and Woods,1986). The T2 dependence of the resistivity in the PMphase is seen up to relatively high temperatures (say,200 K), yet the deviation of the T2 law above some tem-perature is conspicuous near the PM-AFM phaseboundary (x51.0) and the resistivity follows the T1.5
dependence rather than T2 dependence down to lowtemperatures. In the immediate vicinity of the AFM-PMphase boundary, T1.5 dependence persists down toliquid-helium temperatures and hence the T2 coefficienttends to diverge (Ogawa, 1979), as seen in the thirdpanel of Fig. 77. This is in line with the SCR theory(Ueda, 1977; Moriya, 1995) and can be ascribed tostrong spin fluctuations, as discussed in Secs. II.D.1 andII.D.8. The T1.5 dependence in this framework is derivedin Eq. (2.118). All these observations are consistent withthe canonical view of a Fermi liquid with strong electroncorrelation. Because A diverges while g remains finite,the Kadowaki-Woods relation discussed in Sec. II.D.1 isclearly not satisfied near the AFM-PM boundary.
Let us now turn to the feature in the AFM phase nearthe MI phase boundary. Hall coefficients in the AFMphase (Fig. 79, Miyasaka et al., 1998) show a remarkableincrease with lowering of temperature. The low-temperature value increases with decrease of x , imply-ing that in the AFM phase the carrier number decreasesas the AFI phase is approached. It is worth noting thatthe temperature-dependent enhancement of the Hall co-efficient is discernible in the high-temperature PM phaseabove TN , perhaps due to antiferromagnetic spin fluc-tuations. Such a shrinkage of the Fermi surface in theAFM phase is also reflected in a change in the residualresistivity, as shown in the bottom panel of Fig. 77. Theresidual resistivity, which is free from renormalizationeffects of electron correlation, can be expressed with aFermi surface area SF and mean impurity distance Li as(Rice and Brinkman, 1972)
r05~e2SFLi/12p3!21. (4.1)
In the high-pressure measurements, of which results areplotted with open circles in the figure, Li was kept con-stant and hence r0 directly probed the Fermi surfacesize SF . In this system, the application of pressure wasequivalent to Se substitution for bandwidth control, asthe scaling relation indicates on the upper scale of Fig.77 for the x50.7 crystal. The residual resistivity underpressure remained constant in the paramagnetic metalphase (P.2 GPa) irrespective of the x-dependent massrenormalization, indicating that the carrier density wasessentially unchanged in the PM phase. By contrast, theresidual resistivity in the AFM phase (P,2 GPa) in-creased rapidly towards the metal-insulator phaseboundary, indicating shrinkage of the Fermi surface orreduction in carrier density, in accordance with the Hallcoefficient.
As the AFI-AFM phase boundary (x50.45) is ap-proached from the metallic side, the T2 coefficient of theresistivity (A) is again enhanced by the Brinkman-Rice

1154 Imada, Fujimori, and Tokura: Metal-insulator transitions
mechanism (Husmann et al., 1996). In the low-temperature region below 1 K near the MI phase bound-ary, however, the conductivity s shows the T1/2 depen-dence that is characteristic of a MIT by disorder due toAnderson localization under the electron-electron inter-actions, as discussed in Sec. II.G.2 (Lee and Ramakrish-nan, 1985; Belitz and Kirkpatrick, 1994). However, inthe pressure-tuned AFM phase on the verge of the MIphase boundary (at a distance with DP5P2Pc,0.2 Kbar), the conductivity shows a T0.22 dependence.Husmann et al. (1996) argued that this supports viola-tion of hyperscaling for the AFM-AFI transition. Such aviolation had indeed been discussed in connection withthe mapping to the random-field problem (Kirkpatrickand Belitz, 1995). For theoretical aspects of this issue,see Sec. II.G.2.
The temperature-induced MIT in NiS22ySey with x;0.5 has been the subject of recent high-resolution pho-toemission studies. The angle-integrated spectra ofNiS1.55Se0.45 near EF shown in Fig. 80 exhibit spectralweight transfer from the near-EF region to 0.2–0.4 eVbelow it as the temperature increases from below Tt;60K (AFM) to above it (PI) (Mamiya et al., 1997a). (Thiscan be more clearly seen by comparing the solid curve,which represents the 15-K spectrum temperature-broadened to 300 K, with the actual 300-K spectrum inFig. 80). The peak at ;50 meV below EF in the AFMstate may correspond to the quasiparticle spectralweight, as predicted by the calculations for the Hubbardmodel in three and higher dimensions discussed inSec. II.E.6 for the infinite-dimensional approach(Georges et al., 1996; Ulmke et al., 1996). However, itshould be noted that the calculations were done for theparamagnetic metal state and not for the AFM. A simi-lar change in the spectrum near EF can be identified in acomposition-dependent MIT, between the AFM (x.0.5) and AFI (x,0.5). In the one-electron band pic-ture, energy bands of the paramagnetic phase are foldedinto the antiferromagnetic Brillouin zone, and accord-ingly a gap or a pseudogap tends to open at EF . Al-though this picture contrasts with the observation of the50-meV peak, the pseudogap at EF might collapse, if
FIG. 80. Photoemission spectra of NiS1.55Se0.45 in the antifer-romagnetic metallic state (15 K) and the paramagnetic insulat-ing state (300 K) (Mamiya et al., 1997a). The solid curve is the15-K spectrum broadened with a Gaussian to ‘‘300 K.’’
Rev. Mod. Phys., Vol. 70, No. 4, October 1998
band narrowing due to electron correlation near EFwere strong enough. The 50-meV peak was observed tobe even sharper and only very weakly dispersing in theangle-resolved photoemission study of NiS1.5Se0.5 byMatsuura et al. (1996; Fig. 81), indicating that the bandnarrowing is indeed very strong. The spectrum of the PIphase in Fig. 80 shows no gap at EF in spite of the factthat the electrical conductivity is of the activated p typewith an activation energy of ;75 meV. This means thatthe activated transport comes from the mobility, consis-tent with the observed low mobility !1 cm2 V21 sec21,which is in the range of small polaron hopping (Kwizeraet al., 1980; Thio and Bennett, 1994). Indeed, the Hallcoefficient is small and temperature independent in thehigh-temperature paramagnetic insulator phase, mean-ing that the carrier number is large (;2 hole/Ni; Mi-yasaka et al., 1997). For pure NiS2 also, the photoemis-sion spectrum shows almost no gap at EF , implying thatthe transport activation energy (;300 meV at 300 K) ismostly due to the mobility.
3. RNiO3
The interest in RNiO3 has recently been revived by asystematic study on MITs by Torrance et al. (1992). TheMI phase diagram as a function of the perovskite toler-ance factor (or equivalently the p-d transfer interaction)was shown (Fig. 63) in Sec. III.C as a prototypical ex-ample of a BC-MIT. The metal-insulator phase diagramqualitatively resembles that of V2O3 (Fig. 68) or the the-oretical prediction for the infinite-dimensional Hubbardmodel, although the insulating state of RNiO3 should beclassified as a charge-transfer (CT) insulator rather thana Mott-Hubbard insulator. Among charge-transfer-type
FIG. 81. Angle-resolved photoemission spectra of NiS1.5Se0.5in the antiferromagnetic phase (Matsuura et al., 1996). Thespectra label the analyzer angle. The shaded feature due to anarrow Ni 3d band shows little dispersion.

1155Imada, Fujimori, and Tokura: Metal-insulator transitions
compounds, the high valency of the Ni31 ions in RNiO3makes its charge-transfer energy D as small as ;1 eVand stabilizes its low-spin configuration t2g↑
3 t2g↓3 eg↑ , as
shown by CI cluster-model analysis of photoemissionspectra (Barman et al., 1994; Mizokawa et al., 1995). Be-cause of the small D, the ground state is a strong mixtureof d7, d8LI , and d9LI 2 configurations, resulting in a netd-electron number as large as nd57.8. On the otherhand, the Ni magnetic moment is calculated to be;0.91mB , in good agreement with experiment, and isnot strongly reduced from the ionic value, 1mB . This isbecause for the low-spin Ni31 ion charge transfer occursfrom O 2p orbitals to eg↑ and eg↓ orbitals.
Since there is nominally one electron in the eg orbital,as in LaMnO3, one may expect a Jahn-Teller distortionand associated orbital ordering in the insulating RNiO3compounds. Indeed, the unusual spin ordering struc-tures in PrNiO3 and NdNiO3 was attributed to the for-mation of an orbital superlattice (Garcıa-Munoz et al.,1992), but so far no evidence for Jahn-Teller distortionhas been found. The magnetic ground state, describedby a commensurate k5(1/2,0,1/2) spin-density wave,shown schematically in Fig. 82, was determined from aneutron-scattering study by Garcıa-Munoz et al. (1992).The 3D magnetic ordering consists of alternating in-verted bilayers: AA(AA)AA(AA)... along the [001] di-rection, with A representing the magnetic arrangementof Ni moments in one (001) plane (Fig. 82). The tem-perature dependence of the magnetic moment for bothcompounds is shown in Fig. 83. Reflecting the first-ordernature of the transition, the abrupt appearance of theordered moment ('0.9mB) is observed at the metal-insulator transition. The coexistence of F and AF inter-actions, which manifest themselves in the ordered spinstructure, suggests the existence of an orbital superlat-tice, such as regular occupation of either d3z22r2 ordx22y2 type orbitals, as shown in Fig. 82. The nominalNi31 in RNiO3 indicates one electron accommodated inthe doubly degenerate eg orbital. Thus one should con-sider the orbital degree of freedom (or orbital pseu-dospin; Kugel and Khomskii, 1973, 1982) on an equal
FIG. 82. The magnetic and orbital order structure of RNiO3determined by a neutron-scattering study by Garcıa-Munozet al. (1992).
Rev. Mod. Phys., Vol. 70, No. 4, October 1998
footing with the spin (S51/2) degree of freedom, as dis-cussed in Sec. II.I.1. Hartree-Fock band-structure calcu-lations were made to investigate the possibility of orbitalordering in these materials using the parameters D, U ,and (pds) deduced from a cluster-model analysis of thephotoemission spectra (Mizokawa et al., 1995; Mi-zokawa and Fujimori, 1995). The ground states withvarious spin- and orbital-ordered structures (ferromag-netic and G-, A-, and C-type antiferromagnetic order-ing) were found to fall within a narrow energy range of;70 meV/Ni, indicating that the complicated orbital or-dering proposed by the neutron study, which can beviewed as a combination of these spin-orbital orderedstructures, is quite likely. However, the Hartree-Fockcalculations predicted that an orbital superlattice of thex2-y2 –3z2-r2-type would have an energy lower than theabove spin-orbital-ordered states. A possible cause forthe absence of Jahn-Teller distortion in RNiO3 is hy-bridization of the eg and t2g orbitals as a result of thepair-transfer term (ct2g↑
† ct2g↓† ceg↑ceg↓ and its Hermitian
conjugate) in the degenerate Hubbard-model Hamil-tonian [Eq. (2.6e)]: The Hartree-Fock approximationgives terms of the type ct2g↑
† ceg↑ , which cause a one-electron hybridization between the t2g and eg orbitals onthe mean-field level. There is no pair-transfer contribu-tion in the high-spin Mn31 ion because the spin is fullypolarized.
Torrance et al. (1992) discussed the metal-insulatortransition in terms of a closing of the charge-transfer gapwith increase of p-d hybridization. To substantiate this,Arima and Tokura (1995) investigated optical conduc-tivity spectra at room temperature for a series of RNiO3(metallic for R5La and Nd and insulating for R5Smand Y) as shown in Fig. 84. In accord with the metal-insulator phenomena in dc conductivity, the R5Sm andY compounds showed decreasing optical conductivity asv approached zero, that is, the gap feature. On the otherhand, the optical conductivity appeared to remain at afinite value for the metallic (R5La and Nd) compounds.The spectral feature was not a simple Drude form, butthe 2p –3d interband transitions seemed to contribute
FIG. 83. Temperature dependence of the magnetic momentfor RNiO3. From Gracıa-Munoz et al., 1992.

1156 Imada, Fujimori, and Tokura: Metal-insulator transitions
down to the low-energy part of the conductivity spectra.A point to be noted is the conspicuous change in theconductivity spectra over a wide energy region up toseveral eV with variation of R site: This change in theconductivity spectra is apparently accompanied by theisosbetic (namely, equal-absorption) point at 3.5–4.0 eV,across which the spectral weight is transferred fromhigh- to low-energy regions upon closing of the CT gap.Such a large energy scale arises from the large-energyquantities that govern the opening and closing of the CTgap, namely, 3d electron correlation and the p-d trans-fer interaction. Thus collapse of the CT gap with in-crease of the tolerance factor (e.g., from R5Sm to R5La) is obviously not a simple closing of the gap likethat expected for a semiconductor-to-semimetal transi-tion, but accompanies a reshuffle of the whole electronicstructure relating to the 3d –2p states.
Among the RNiO3 compounds, LaNiO3 remains me-tallic down to low temperature, and shows features of acorrelated metallic system (Mohan Ram et al., 1984;Vasanthacharya et al., 1984; Sreedhar et al., 1992). Theresistivity shows T2 dependence, r5r01AT2, below50–70 K, although the (r0 ,A) values are scattered inreports (Sreedhar et al., 1992; Xu et al., 1993), perhapsbecause of difficulty in the characterization of thesample quality (particularly the oxygen content). Theheat capacity data below 10 K can be fitted to the rela-tion (Sreedhar et al., 1992)
C5gT1bT31dT3 lnT . (4.2)
The last term arises as a consequence of spin fluctua-tions (Pethick and Carneiro, 1973). The electronicspecific-heat coefficient g514 mJ/mol K2 and the Paulimagnetic susceptibility x55.131024 emu/mol are en-hanced well above their free-electron gas values. TheWilson ratio g/x for LaNiO3 is 2.4, which is typical of acorrelated system.
As shown in the MI phase diagram (Fig. 63), RNiO3metals (R5Pr, Nd, Sm, and Eu) undergo a MIT withdecrease of temperature. Among them, PrNiO3 andNdNiO3 exhibit a transition from the paramagneticmetal (PM) to the antiferromagnetic insulator (AFI) ataround 135 K and 200 K, respectively. The MIT is firstorder with thermal hysteresis (Granados et al., 1992) and
FIG. 84. Optical conductivity spectra at room temperature fora series of RNiO3. From Arima and Tokura, 1995.
Rev. Mod. Phys., Vol. 70, No. 4, October 1998
accompanied by a subtle increase in the cell volume by'0.02% (Torrance et al., 1992). A more detailedneutron-diffraction study (Garcıa-Munoz et al., 1994) re-vealed that the lattice transition is accompanied bycoupled tilts of NiO6 octahedra, which implies changesin the Ni-O-Ni angles (by 20.5°) governing the transferinteraction between the Ni eg and O 2p orbitals. How-ever, the structural change with the transition is a subtleone and the MIT may be viewed as electronically driven.
The control of the p-d transfer interaction by changesin the tolerance factor can be mimicked by applicationof external pressure (Canfield et al., 1993; Obradorset al., 1993; Takagi et al., 1995). We show an example ofthe pressure dependence of the r(T) curves for PrNiO3(Obrandors et al., 1993) in Fig. 85. The metal-insulatorphase boundary under pressure for PrNiO3 and NdNiO3can be related to the phase diagram shown in Fig. 63 byassuming that the pressure effectively increases the Ni-O-Ni angle (or tolerance factor). It is also noted in Fig.85 that the r(T) curve shows an apparent reentrant fea-ture like the M-I-M transition in the vicinity of thepressure-induced disappearance of the AFI phase. Thiswas ascribed to the nature of the first-order phase tran-sition (Obradors et al., 1993): The first-order phasetransformation occurring at TMI is incomplete due to aslowdown of the growth rate of the insulating phase, andthe metallic phase remains dominant, producing reducedresistivity at low temperatures.
Another important aspect of the MIT to be kept inmind is the complicated ordered spin structure for theAFI phase of PrNiO3 and NdNiO3 and possible orbital
FIG. 85. Pressure dependence of r(T) for PrNiO3. FromObradors et al., 1993.

1157Imada, Fujimori, and Tokura: Metal-insulator transitions
ordering. It is essential to consider the orbital contribu-tion to the total free energy not only for bandwidth-controlled MITs in RNiO3 but also possibly for electronproperties in the metallic phase.
We show in Fig. 86 the temperature dependence ofthe optical conductivity spectrum of NdNiO3 (Katsufuji,Okimoto, Arima, Tokura, and Torrance, 1995), whichundergoes the PM-to-AFI transition at TMI5200 K.Drude-like increase of the optical conductivity as v→0is suppressed, and the opening of the charge gap is ob-served below TMI . The missing spectral weight in thelow-energy part is redistributed over the energy regionabove 0.3 eV, but such a change in spectral features inthe course of a thermally induced MIT is obviously dif-ferent from the case of an MIT with variation of the Rsite (Fig. 84) affecting the energy scale for the spectralweight transfer. The evolution of the gap below TMI isgradual with temperature, which appears to be well fit-ted with the BCS function (Katsufuji, Okimoto, Arima,Tokura, and Torrance, 1995). The feature is reminiscentof the SDW gap, whose ground-state magnitude shouldbe 2D(0)'3.5kB (Overhauser, 1962). However, whathappens in NdNiO3 is beyond this picture. In the case ofCr metal, which is a prototypical SDW system, the ex-perimentally observed peak energy relevant to the gapstructure in the conductivity spectrum is 5.2kBTc . Thiswas interpreted in terms of a slight modification of themean-field theory by the phonon-scattering effect(Barker et al., 1968). By contrast, the peak conductivityenergy for NdNiO3 at 9 K is '20kBTc as can be seen inFig. 86. This is much larger than the value expected for asimple SDW transition and implies that electron corre-lation plays an important role in producing the AFIphase. The effect of the simultaneous formation of anorbital superlattice may also be relevant to the large-gapfeature in the low-temperature phase of NdNiO3.
4. NiS
The hexagonal form of NiS (b-NiS) undergoes a first-order phase transition from an antiferromagnetic non-metal to a paramagnetic metal with temperature or un-
FIG. 86. Temperature dependence of optical conductivityspectra of NdNiO3. From Katsufuji et al., 1995.
Rev. Mod. Phys., Vol. 70, No. 4, October 1998
der pressure (Sparks and Komoto, 1967; Anzai andOzawa, 1968). Figure 87 shows the pressure-temperature phase diagram (McWhan et al., 1972). Thediscovery of the MIT in NiS has attracted considerableattention because the transition is not accompanied by achange in the symmetry of the crystal structure and istherefore a candidate for a Mott transition driven byelectron-electron interaction. The b-NiS, which is ametastable phase at room temperature and can only beobtained by quenching from high temperatures above;600 K, crystallizes in the NiAs structure as shown inFig. 88. Here the NiS6 octahedra shares edges within theab plane and share faces along the c direction. TheNi-Ni distance along the c direction is therefore short,dNi-Ni52.65–2.7 A, making the Ni-Ni interaction alongthe c axis important. At the MIT, the hexagonal lattice
FIG. 87. Pressure-temperature phase diagram of NiS samples:circles, Tt5230 K; squares, Tt5210 K. Open symbols repre-sent increasing pressures and closed symbols decreasing pres-sures. From McWhan et al., 1972.
FIG. 88. Crystal structure of NiS (Matoba et al., 1991). Smallcircles, Ni atoms; large circles, S atoms.

1158 Imada, Fujimori, and Tokura: Metal-insulator transitions
parameters a (.3.45 A) and c (.5.3–5.4 A) decreaseby 0.3% and 1%, respectively, in going from the nonme-tallic phase to the metallic phase, resulting in a volumecollapse as large as ;2%.
Electrical resistivity as a function of temperatureshows a jump by a factor of ;20 at the MIT temperatureTt , as shown in Fig. 89 (Anzai and Ozawa, 1968; Sparksand Komoto, 1968; Anzai et al., 1986). Above Tt , theresistivity is as low as 1025 –1024 V cm and increaseswith temperature. Below Tt , the resistivity is nearlytemperature independent in the 1023 V cm range downto T;0, in contrast to typical semiconductors or insula-tors, indicating that the low-temperature phase is a semi-metal (White and Mott, 1971; Koehler and White, 1973)or a degenerate semiconductor (Ohtani, Kosuge, andKachi, 1970; Barthelemy, Gorochov, and McKinzie,1973). Accordingly, we refer to the low-temperaturephase as the ‘‘nonmetallic’’ phase rather than the insu-lating or semiconducting phase. The nonmetallic phaseis always doped with holes due to a small concentrationof naturally present Ni vacancies (typically x50.002 inNi12xS). Tt5260 K for nearly stoichiometric samplesand decreases with Ni vacancies.
The Hall coefficient RH of Ni12xS with small x(0.004,x,0.017) is positive in the nonmetallic phaseand n51/eRH is nearly equal to 2x per unit formula,which indicates that one Ni vacancy produces two holecarriers (Ohtani, Kosuge, and Kachi, 1970; Ohtani,1974). The mobility is small (53 cm2 V21 sec21) andnearly temperature independent, indicating transport ina narrow band. The Hall coefficient in the metallic phaseis smaller than in the nonmetallic phase by a factor of;40 and becomes negative (Barthelemy, Gorochov, andMcKinzie, 1973), meaning that in going from the non-metallic to the metallic phase, the number of carriersdramatically increases. Presumably the character of theFermi surfaces changes from ‘‘small’’ hole pockets to‘‘large’’ electronlike (Luttinger) Fermi surfaces. Ther-
FIG. 89. Electrical resistivity of NiS12ySey : Open symbols arefor heating runs, closed symbols for cooling runs. From Anzaiet al., 1986.
Rev. Mod. Phys., Vol. 70, No. 4, October 1998
moelectric power is positive and relatively large belowTt and becomes negative and small above Tt , consistentwith the sign of the Hall coefficient (Ohtani, 1974; Ma-toba, Anzai, and Fujimori, 1986). Below Tt , the Seebeckcoefficient is roughly proportional to the temperature, acharacteristic of a degenerate semiconductor, with somephonon-drag contribution. Above Tt , the Seebeck coef-ficient is negative and small, but again is proportional tothe temperature, showing more typical metallic behav-ior. If there is one type of carrier in each of the metallicand nonmetallic phases, the jump of the resistivity at theMIT by a factor of ;20 and that of the Hall coefficientby a factor of ;40 means that the mobility in the metal-lic phase is similar to, or somewhat smaller than, that inthe nonmetallic phase. However, according to band-structure calculations, the metallic phase has severalFermi surfaces (Mattheiss, 1974; Nakamura et al.,1994b), and the simple relation n51/eRH may not holdin the metallic phase.
According to neutron-diffraction studies (Sparks andKomoto, 1968; Coey et al., 1974), the magnetic momentof Ni in NiS is 1.5–1.7mB at T54.2 K and it is ferromag-netically coupled within the ab plane and antiferromag-netically coupled along the c axis. The magnetic suscep-tibility of NiS is flat below Tt and abruptly decreases atT5Tt , as shown in Fig. 90 (Anzai et al., 1986). The sus-ceptibility above Tt is not typical Pauli paramagnetismand has a positive slope (dx/dT.0). (Unfortunately,measurements above ;300 K are prohibited by thephase instability). The magnetic susceptibility of singlecrystals has shown that the susceptibility x' perpendicu-lar to the magnetization axis (c axis) is very small belowTt (Koehler and White, 1973); therefore the exchangecoupling constant J between two Ni atoms along the cdirection (5NmB
2 /2zx' , where z52 is the number ofnearest-neighbor Ni ions) is as large as 0.14 eV. An in-
FIG. 90. Magnetic susceptibility of NiS12ySey . Open circlesare for heating runs, filled circles for cooling runs. From Anzaiet al., 1986.

1159Imada, Fujimori, and Tokura: Metal-insulator transitions
elastic neutron-scattering study indeed revealed a highspin-wave velocity along the c axis and J50.1 eV wasobtained (Hutchings, Parisot, and Tocchetti, 1978).From this J value, the Neel temperature was predictedto be TN;1000 K, which is much higher than Tt5260 K. This indicates that the antiferromagnetic-to-paramagnetic transition is not driven by a spin disorder-ing along the c axis but by a spin disorder within the abplane or by the appearance of the metallic phase itself.The strong exchange coupling J suggests the existence ofantiferromagnetic correlation in the paramagnetic me-tallic state and is possibly the origin of the positive slopein the magnetic susceptibility of the metallic phase. Thishas some analogy with the metallic phase of high-Tc cu-prates, although in NiS the electronic transport is threedimensional and the magnetic correlation is rather onedimensional.
A pressure-induced MIT is an ideal BC-MIT, forwhich interpretation of experimental data is moststraightforward. On the other hand, it is rather difficultto obtain a set of accurate experimental data under highpressure. Substitution of Se for S causes an effect almostidentical to pressure as far as the electronic phase dia-grams are concerned (see Fig. 87 and the x50 curve inFig. 91). However, it should be noted that Se substitu-tion increases the crystal volume rather than decreases it(Barthelemy et al., 1976). NiS12ySey is a charge-transfer-type compound (see below) whose band gap is formedbetween the occupied chalcogen p and empty Ni 3dstates. Since the Se 4p band is higher than the S 3pband, Se substitution reduces the band gap and drivesthe system toward the metallic phase. The transitiontemperature Tt and the magnitude of the resistivityjump at Tt decrease with Se substitution in NiS12ySey .In fact, Tt is completely suppressed above y.0.13,where the electrical resistivity of the metallic phase canbe studied down to T;0. The resistivity of Ni0.98S12ySeyshows a T2 behavior at low temperatures and is ana-lyzed using the formula r5r01AT2 (Fig. 92) (Matobaand Anzai, 1987). The coefficient A , however, shows
FIG. 91. Composition dependence of the transition tempera-ture Tt in Ni12xS12ySey (Matoba, Anzai, and Fujimori, 1991).Solid symbols are cooling runs and open symbols heating runs.The inset shows a schematic T-x-y phase diagram.
Rev. Mod. Phys., Vol. 70, No. 4, October 1998
only a weak composition (y) dependence and does notshow an increase towards the MIT (y50.1 inNi0.98S12ySey). This is contrasted with the A ofNiS22ySey in the PM phase, which exhibits divergentbehavior towards the PM-AFM transition, as predictedby spin-fluctuation theory (Moriya, 1985). Presumably,the first-order composition-dependent MIT in Se-substituted NiS has prevented our approaching the criti-cal region. Indeed, the discontinuity of the lattice pa-rameters at the y-dependent MIT is substantial at T;0.Figure 90 shows that the magnetic susceptibility as wellas the positive slope dx/dT in the metallic phase de-creases with Se concentration (Matoba, Anzai, and Fuji-mori, 1991). This may indicate that the antiferromag-netic spin fluctuations are weakened as the system isdriven away from the MIT boundary into the metallicregion. (The y dependence of r0 was explained as due todisorder scattering.)
An FC-MIT in NiS can be studied in Ni12xS (Sparksand Komoto, 1968). The MIT temperature Tt decreaseswith x in a manner analogous to that for pressure and Se
FIG. 92. Electrical resistivity of Ni0.98S12ySey . (a) Tempera-ture vs resistivity curves; (b) its low-temperature part is fittedto r5r01AT2 and A and r0 are plotted against Se concentra-tion y . From Matoba and Anzai, 1987.

1160 Imada, Fujimori, and Tokura: Metal-insulator transitions
substitution, and Tt is completely suppressed at x.0.033. This can be seen from the phase diagram of theNi12xS12ySey system shown in Fig. 91: 4x and y showalmost the same effect on Tt . The changes in the ther-moelectric power of NiS12ySey with Se content (Ma-toba, Anzai, and Fujimori, 1991) are also almost identi-cal to those of Ni12xS (Ohtani, 1974) if ‘‘4x-y scaling’’ isapplied. It should be noted that the Ni vacancies notonly introduce holes but also decrease the volume, sothat the Ni12xS system is influenced by a combination offilling and bandwidth control. The volume contraction ofNi12xS in going from x50 to x50.033 corresponds tothat of NiS under pressure of ;10 kbar, which is half ofthe pressure (23 kbar) necessary to induce the MIT inNiS.
There have been studies of another type of substitu-tion carried out on NiS, namely, 3d transition-metal sub-stitution for Ni. It is not clear a priori whether this kindof substitution belongs to the BC type or the FC type;various experimental results and chemical consider-ations have been combined to estimate the number andsign of carriers in the substituted materials. SubstitutedFe and Co are considered to form Fe21 and Co21 ionsfrom the chemical point of view. This is consistent withthe increase of Tt for Fe and the decrease of Tt for Cobecause FeS is more insulating and CoS more metallic(Coey and Roux-Buisson, 1979; Futami and Anzai,1984). Substitution of Ti, V, or Cr for Ni is more subtle,since these elements can take various valence states insulfides, although Ti and V tend to take valences higherthan two (Anzai, Futami, and Sawa, 1981). Chemicalshifts of core-level x-ray photoemission spectroscopypeaks indicated that Ti, V, and Cr are in the trivalentstate and act as donors. Indeed, thermoelectric power inthe nonmetallic phase changes the sign from positive tonegative at around 2–5% V or Cr substitutions, indicat-ing n-type doping to the NiS host (Matoba, Anzai, andFujimori, 1994). Thermoelectric power in the metallicphase, on the other hand, remains negative, probablyindicating that the transport properties of the metallicstate with large Fermi surfaces is not sensitive to a smallchange in the band filling.
Now, we characterize more quantitatively the proper-ties of conduction electrons in the metallic phase of NiS.The electronic contribution to the specific heat of NiS inthe metallic phase is difficult to estimate because of thehigh MIT temperature. Brusetti et al. (1980) estimatedthe gT term by subtracting calculated lattice contribu-tions from the measured entropy change at the MIT.The deduced value was g.6 mJ mol21 K22, which wasincidentally close to the g value of Ni12xS with x50.0420.05, in which Tt is suppressed to zero. On the otherhand, the magnetic susceptibility decreases with increas-ing Se concentration, as shown in Fig. 90. Thus the Wil-son ratio (pkB
2 /3mB2 )(x/g) decreases from ;2.9 for NiS
(x52.3631024 emu mol21) to ;2.1 for the 18% Se-substituted sample (x51.7531024 emu mol21) if thesame g is assumed. The g and x of Ni0.98S12xSex wererecently studied over the wide range of 0.1,x<1 byWada et al. (1997) and are plotted in Fig. 93, where one
Rev. Mod. Phys., Vol. 70, No. 4, October 1998
can see that the g is constant and that the magnetic sus-ceptibility is weakly enhanced near x50, resulting in aweak enhancement of the Wilson ratio near x50. If wecompare the g and the DOS at EF deduced from anLDA band-structure calculation in the nonmagneticstate (Terakura, 1987), we obtain a mass enhancementfactor m* /mb51.7. If A for Ni0.98S12ySey with y;0.1 isemployed, we obtain a Kadowaki-Woods ratio of A/g2
;531025 mV cm(mol K/mJ)2, which is closer to(though significantly larger than) the strong-correlationlimit 1.031025 rather than the weak correlation limit0.431026.
Direct information about low-energy excitations wasobtained in an infrared optical reflection study byBarker and Remeika (1974). Figure 94(a) shows the op-tical conductivity spectra obtained from the Kramers-Kronig analysis of the reflectivity data. The spectrum ofthe nonmetallic phase shows a threshold at 0.14 eV anda peak at 0.4 eV due to gap excitations. If the minimumband gap is an indirect one, the transport gap (indirectgap) can be much smaller than the optical gap. A non-self-consistent band-structure calculation by Mattheiss(1974) predicts a direct gap of 0.15 eV, whereas theminimum gap of indirect type is vanishingly small [Fig.94(b)]. The ratio between the magnitude of the gap andthat of the transition temperature, 2D(0)/kBTt , is ;6 ifwe take the threshold energy 2D(0)50.14 eV or ;18 ifwe take the peak energy 2D(0)50.4 eV. This indicatesthat the gap cannot be an ordinary SDW gap and that itsopening involves electron correlation. Figure 94(a) alsoshows that the spectrum changes over a wide energy
FIG. 93. Magnetic susceptibility x at 300 K, the electronicspecific-heat coefficient g, and the Wilson ratio forNi0.98S12xSex . From Wada et al., 1997.

1161Imada, Fujimori, and Tokura: Metal-insulator transitions
range (even above hn;1 eV) between the two phases,indicating that the MIT reorganizes the electronic struc-ture up to high energies. The Drude peak in the metallicphase is broad and the scattering rate of charge carriersis estimated to be as high as 1/t;0.3 eV (if one ignoresthe frequency dependence of 1/t). The width of theDrude peak in the nonmetallic phase is an order of mag-nitude smaller than that in the metallic phase: 1/t;0.03 eV. From the mobility ratio between the metallic(M) and nonmetallic (NM) phases, mM /mNM;1/2 (if weassume n51/eRH in both phases) and from the scatter-ing rate ratio tM /tNM;1/10, we may deduce the effec-tive mass ratio mM* /mNM* ;1/5.
In order to explain the unusual transport and mag-netic properties of NiS and its MIT mechanism, variousmodels of the electronic structure have been proposed(White and Mott, 1971; Koehler and White, 1973).These models consider the eg band of Ni near EF in thenonmagnetic and magnetic states, with the t2g and S 3pbands completely occupied. Earlier band-structure cal-culations (Tyler and Fry, 1971; Kasowski, 1973) did nottake into account the magnetic ordering and were not
FIG. 94. Optical conductivity and band structure of NiS: (a)Optical conductivity. Solid curve, metallic phase; dashed curve,nonmetallic phase (Barker and Remeika, 1974). (b) Bandstructure of NiS in the antiferromagnetic state calculated byMattheiss (1974). The arrows show direct gaps while the indi-rect gap is vanishingly small.
Rev. Mod. Phys., Vol. 70, No. 4, October 1998
able to predict the insulating behavior of the antiferro-magnetic phase, whereas the calculated DOS well ex-plains the overall line shape of the photoemission spec-tra (Hufner and Wertheim, 1973). Mattheiss (1974)simulated the antiferromagnetic state within the non-self-consistent augmented plane-wave (APW) methodby introducing a potential difference (6Vs) betweenthe muffin-tin spheres of the spin-up and spin-down Nisites and succeeded in opening a gap as described in Fig.94(b). More recently, Terakura (1987) performed LSDAcalculations for the antiferromagnetic as well as for theparamagnetic state, using the self-consistent linearizedAPW (LAPW) method. However, the self-consistent so-lution converged to a nonmagnetic state for the experi-mental lattice constants. In order to obtain the antifer-romagnetic solution with a finite band gap, an externalstaggered magnetic field was applied, but the inducedmagnetic moment was still as small as ;1mB , comparedto the experimental value of 1.5–1.7mB (Fujimori, Tera-kura, et al., 1988). Figure 95(a) shows that although thecalculated DOS of the paramagnetic state is in rathergood agreement with experiment, the DOS for the anti-ferromagnetic state is quite different from the experi-mental line shape. The discrepancy was traced back tothe exchange splitting as large as ;2 eV of the Ni 3dband in the calculated antiferromagnetic DOS, whichvanishes in the nonmagnetic state.
As many difficulties are encountered in the band-theoretical description of the electronic structure of NiS,a different approach has been taken based on the NiS6cluster model, in which electron correlation is fullytaken into account within a small cluster (Fujimori,Terakura, et al., 1988), in analogy with the local clusterpicture of NiO. Figure 95(b) shows that the theoreticalphotoemission spectrum calculated using the CI clustermodel and the measured photoemission spectrum are ingood agreement with each other. The result shows thatthe peak located from 0 to ;3 eV below EF , which waspreviously assigned to the Ni 3d band, is now assignedto the d8LI charge-transfer final states, and the d7 finalstates appear as satellites 5–10 eV below EF (Hufner,Riesterer, and Hulliger, 1985). Although the clustermodel is too crude to describe the electronic structurenear EF , such as the semiconducting band gap of order0.1 eV and the Fermi surfaces, it well describes the spec-tral weight distribution on the coarse energy scale of 1eV to several eV. The calculated magnetic moment atthe Ni site is found to be 1.7mB , in good agreement withexperiment. This means that the reduction of the mag-netic moment from the ionic value of Ni21 ion is largelydue to p-d covalency and we do not need to invokeitinerant-electron antiferromagnetism as previously sug-gested (Coey et al., 1974).
Since the CI cluster model can describe localized elec-tronic states with a finite local magnetic moment, thegood agreement between the experimental and theoret-ical photoemission spectra and the magnetic moment in-dicates that the electronic structure of the nonmetallicphase of NiS is essentially that of a Mott insulator. Onthe other hand, the loss of local magnetic moment in the

1162 Imada, Fujimori, and Tokura: Metal-insulator transitions
FIG. 95. Photoemission spectra of NiS in the metallic (T5300 K) and nonmetallic (T580 K) phases compared with (a)the band-structure DOS of the nonmagnetic and antiferromag-netic states and (b) the CI cluster-model calculation (Fujimoriet al., 1988). Best-fit parameters are D52, U54, and (pds)521.5 eV.
Rev. Mod. Phys., Vol. 70, No. 4, October 1998
metallic phase would naturally cast doubt upon the va-lidity of the model in that phase, even though the calcu-lated and measured photoemission spectra are in goodagreement with each other. In order to reconcile thespectroscopic data and the nonmagnetic behavior, onecould argue that the local magnetic moment exists onthe time scale of photoemission (10215 sec), but its fastquantum fluctuations lead to the Pauli paramagnetism.The unusual paramagnetic metallic state has been cor-roborated by an exact diagonalization study of a Ni4X4cluster, where X is a sulfur atom in the present case andthe degeneracy of the eg orbitals is taken into account(Takahashi and Kanamori, 1991). Takahashi and Kan-amori found that between the insulating phase (for largeD), where the Ni ions are in the ‘‘high-spin’’ state(^SNi
2 &;2) and are antiferromagnetically coupled, andthe metallic phase (for small D), where they are in the‘‘low-spin’’ state (^SNi
2 &;0.4), there is an intermediatephase where the local moment remains substantial(^SNi
2 &;1) but the antiferromagnetic correlation be-tween nearest neighbors is reduced. Calculated photo-emission spectra do not significantly change between theinsulating and intermediate phases, which may explainthe result of the photoemission experiment.
The low-energy electronic structure and its tempera-ture dependence were investigated using high-resolutionphotoemission spectroscopy by Nakamura et al. (1994b).Figure 96 shows the photoemission spectra near EFtaken with an energy resolution of ;25 meV. Startingfrom the thermally broadened Fermi edge of the metal-lic phase, a gap of ;10 meV is opened below Tt . A
FIG. 96. Photoemission spectra of NiS (Tt5260 K) and Fe-substituted NiS (Tt;350 K) near the Fermi level comparedwith LDA (paramagnetic metal), LSDA [AF(1): metallic;AF(2): insulating], and LDA1U [AF(0)] band-structure cal-culations. From Nakamura et al., 1994b.

1163Imada, Fujimori, and Tokura: Metal-insulator transitions
remarkable feature in the spectra of the nonmetallicstate is that the band edge is an almost resolution-limited step function, whereas the band-structure calcu-lation (the LSDA calculation with the applied staggeredmagnetic field) predicts a much broader band edge. Thismeans that actual energy bands near the top of the va-lence band are strongly narrowed compared to thosepredicted by band-structure calculations, most probablydue to strong electron correlation. Comparison betweenthe band DOS and the photoemission spectra of thenonmetallic phase shown in Fig. 96 suggests a band-narrowing factor (mass enhancement factor) of m* /mb*10. This value is larger than the mass enhancementfactor in the metallic phase (m* /mb51.7) estimatedfrom the electronic specific heat, and it is consistent withthe relationship mM* /mNM* ;1/5 deduced from the trans-port and optical data above. It is tempting to view thevery narrow quasiparticle bands near the band edge ofthe nonmetallic phase as reminiscent of a band structurewith a nearly k-independent SDW gap, which is openedon the entire Fermi surfaces of the metallic states as in aBCS superconductor, even though the nonmetallicphase of NiS is not near a (hypothetical) second-orderMIT. Recently, Miyake (1996) showed, using Luttinger’ssum rule and the Ward identity, that in any spatial di-mension, if a continuous phase transition occurs be-tween a paramagnetic metal and an antiferromagneticinsulator, the Fermi surface should exhibit perfect nest-ing at the MIT on the metallic side.
5. Ca12xSrxVO3
Both SrVO3 and CaVO3 exhibit metallic conductivity,as shown in Fig. 97, and nearly T-independent paramag-netism (apart from the increase at low temperaturesprobably due to impurities), as shown in Fig. 98 (Onoda,Ohta, and Nagasawa, 1991; Fukushima et al., 1994; In-
FIG. 97. Electrical resistivity of CaVO3 and SrVO3. FromOnoda, Ohata, and Nagasawa, 1991.
Rev. Mod. Phys., Vol. 70, No. 4, October 1998
oue et al., 1997b). Stoichiometric SrVO3 crystallizes in acubic perovskite structure, while CaVO3, because of thesmall ionic radius of Ca21 compared to Sr21, forms aGdFeO3-type orthorhombic structure. Although they donot show a metal-insulator transition, magnetic order-ing, or superconductivity, these compounds (and theiralloy system Ca12xSrxVO3) allow us to deduce impor-tant information about the nature of electron correlationin the normal metallic states when the d-band width iscontinuously varied. Both compounds are thought to bein the Mott-Hubbard regime (for details see below), andthe V 3d bands are occupied by one electron per Vatom. The on-site d-d Coulomb repulsion U is thoughtto be nearly the same for each of the two compoundsbecause of the same valencies of the V ions. The differ-ence between SrVO3 and CaVO3 lies in the differentV-O-V bond angles, u5180° in SrVO3 and 155° –160° inCaVO3, which should lead to a decrease in the one-electron d-band width W}cos2u by ;15% in going fromSrVO3 to CaVO3, or equivalently an increase in thebare band mass mb by ;15%.
For CaVO3, from the T-independent spin susceptibil-ity x52.331024 emu mol21 (corrected for the corediamagnetism and the Van Vleck susceptibility)and the electronic specific-heat coefficient g59.25 mJ mol21 K22 (Inoue et al., 1997a), we obtain aWilson ratio of (pkB
2 /3mB2 )(x/g)51.8, a value similar to
those found for La12xSrxTiO3 and Y12xCaxTiO3(Tokura, Taguchi, et al., 1993; Taguchi et al., 1993). Asfor SrVO3, x51.6531024 emu mol21 and g58.18 mJ mol21 K22, Inoue et al. (1997a, 1997b) give(pkB
2 /3mB2 )(x/g)51.5, which is smaller than the ratio of
CaVO3 by ;20%. Electrical resistivity shows a nearlyT2 behavior (Fig. 97), indicating electron-electron scat-tering, but surprisingly the T2 behavior persists up toroom temperature. The Kadowaki-Woods ratio is A/g2
50.931025 and 1.231025 mV cm(mol K/mJ)2 forCaVO3 and SrVO3, respectively, in the same range asheavy fermions in the case of perovskite-type Ti oxides(Tokura, Taguchi, et al., 1993). In going from SrVO3 to
FIG. 98. Magnetic susceptibility of Ca12xSrxVO3. From Inoueet al., 1997b.

1164 Imada, Fujimori, and Tokura: Metal-insulator transitions
CaVO3, since the electronic specific heat indicates thatthe quasiparticle mass m* increases by ;15% and thebare band mass mb increases by ;15%, the mass en-hancement factor m* /mb does not increase. This is con-trary to the general belief that the effective mass is en-hanced (or even diverges) as one approaches the BC-MIT point with increasing U/W . As further evidence fornormal Fermi-liquid behavior, the Hall coefficient ofSrVO3 is negative and has a nearly T-independentvalue, which corresponds to one electron per unit cell, asin La12xSrxTiO3 with x*1 (Eisaki, 1991). An NMRstudy of SrVO3 (Onoda, Ohta, and Nagasawa, 1991)showed a nearly T-independent Knight shift and a con-stant T1T .
Further insight into the mass renormalization inSrVO3 and CaVO3 was obtained from a series of photo-emission studies (Fujimori, Hase, et al., 1992a; Inoueet al., 1995; Morikawa et al., 1995). Figure 99 shows com-bined photoemission and BIS spectra of SrVO3 andCaVO3. They show a typical Mott-Hubbard-type elec-tronic structure as in V2O3: The V 3d band is locatedaround EF and the filled O 2p band well (3–10 eV)below EF . It should be noted, however, that the ‘‘V 3dband’’ is not a simple V 3d band in the original Mott-Hubbard sense but is made up of states split off from theO 2p continuum due to strong p-d hybridization as inthe case of V2O3. Since D’s for V41 compounds aresmaller than those for V31 compounds, SrVO3 andCaVO3 fall into the D,U region, meaning that the ad-mixture of states with O 2p character into the ‘‘V 3d
FIG. 99. Photoemission and inverse-photoemission spectra ofSrVO3 and CaVO3 in the V 3d band region compared with aLDA band-structure calculation of Takegahara (1994). FromMorikawa et al., 1995.
Rev. Mod. Phys., Vol. 70, No. 4, October 1998
band’’ is even more substantial. A comparison betweenthe photoemission spectra and the band-structure DOSof the t2g subband of V 3d is made in Fig. 99. Spectralfeatures from ;20.7 to 11.5 eV correspond to the V3d band in the LDA band structure and are thereforeattributed to the coherent contribution or the quasipar-ticle part of the V 3d-derived spectral function. Thepeak at ;21.6 eV has no corresponding feature in theband-structure DOS and is therefore attributed to theincoherent part of the spectral function, reminiscent ofthe lower Hubbard band. The photoemission spectra ofCa12xSrxVO3 shown in Fig. 100 indicate a systematicspectral weight transfer with increasing U/W . The V 3dspectral weight is transferred from the coherent part tothe incoherent part of the spectral function (Inoue et al.,1995), in good agreement with the dynamic mean-fieldcalculation of the Hubbard model (Zhang, Rozenberg,and Kotliar, 1993). However, there is an important dif-ference between the dynamic mean-field calculation andthe experimental results. That is, with increasing U/W ,the quasiparticle band is narrowed in the calculationwhereas the overall intensity of the quasiparticle banddecreases without significant band narrowing in themeasured spectra. A high-resolution photoemissionstudy has confirmed the absence of a sharp quasiparticlepeak at EF (Morikawa et al., 1995).
The deviation of the spectral function r(v) from theLDA band structure can be expressed in terms of a self-energy correction S(k,v) to the LDA eigenvalues «0(k)as described in Sec. II.D.1. The spectral intensity at EF ,r(m), differs from that of the LDA calculation by a fac-tor mk /mb , where mk is the k mass defined by the mo-mentum derivative of the self-energy [Eq. (2.73e)]. Thequasiparticle mass m* , which is inversely proportionalto the coherent bandwidth and is equal to the thermal(and transport) masses, is given by m* /mb5(mv /mb)(mk /mb), where mv is the v mass defined by the
FIG. 100. Photoemission spectra of Ca12xSrxVO3 in the V 3dband region (Inoue et al., 1995). The upper panel shows theDOS derived from LDA band-structure calculation.

1165Imada, Fujimori, and Tokura: Metal-insulator transitions
energy derivative of the self-energy [Eq. (2.73d)]. Here,we have assumed that the quasiparticle residue Zk(v)[Eq. (2.70)] does not vary significantly within the quasi-particle band (Zk(v)[mb /mv). Then the coherent-to-incoherent spectral weight ratio is given by mb /mv :(12mb /mv). The remarkable spectral weight transferfrom the coherent part to the incoherent part in goingfrom SrVO3 to CaVO3 means that mv increases as thesystem approaches the Mott transition from the metallicside. The observed simultaneous decrease in spectral in-tensity at EF indicates that mk decreases towards theMott transition: for SrVO3, mk /mb.0.25, mv /mb.6,and m* /mb.1.5; for CaVO3, mk /mb.0.07, mv /mb.20, and m* /mb.1.4. Almost the same m* for the twocompounds is consistent with the specific heat g and theeffective electron numbers (}1/m* ) deduced from anevaluation of the optical conductivity at about 1.5 eV(Dougier, Fan, and Goodenough, 1975).
B. Filling-control metal-insulator transition systems
1. R12xAxTiO3
The perovskitelike RTiO3 (where R is a trivalentrare-earth ion) and its ‘‘hole-doped’’ analogR12xAxTiO3 (where A is a divalent alkaline-earth ion)are among the most appropriate systems for experimen-tal investigations of the FC-MIT. The end memberRTiO3 is a typical Mott-Hubbard (MH) insulator withTi31 3d1 configuration, and the A (Sr or Ca) content (x)represents a nominal ‘‘hole’’ concentration per Ti site,or equivalently the 3d band filing (n) is given by n512x .
The electronic and magnetic phase diagram forR12xSrxTiO3 is depicted in Fig. 101. The crystalline lat-tice is an orthorhombically distorted perovskite (of theGdFeO3 type; see Fig. 61). As described in detail in Sec.III.C.1, the Ti-O-Ti bond angle distortion, which affects
FIG. 101. Electronic and magnetic phase diagram for theR12xSrxTiO3.
Rev. Mod. Phys., Vol. 70, No. 4, October 1998
the transfer energy (t) of the 3d electron or the one-electron bandwidth (W), depends critically on the ionicradii of the (R ,A) ions or the tolerance factor. For ex-ample, the Ti-O-Ti bond angle is 157° for LaTiO3 butdecreases to 144° (ab plane) and 140° (c axis) forYTiO3 (MacLean et al., 1979), which causes a reductionin W of the t2g state by as much as 20%, according to anestimate by a simple tight-binding approximation(Okimoto et al., 1995b). The W value can be finely con-trolled by use of the solid solution La12yYyTiO3 or inRTiO3 by varying the R ions. The abscissa in Fig. 101thus represents the effective correlation strength U/W .
On the end (x50) plane, the variation of the antifer-romagnetic (AF) and ferromagnetic (F) transition tem-peratures is plotted for La12yYyTiO3 (Goral, Greedan,and MacLean, 1982; Okimoto et al., 1995b). Due to or-bital degeneracy and orbital ordering, the x50 insula-tors with large U/W value or a Y-rich (y,0.2) regionshow a ferromagnetic ground state. In fact, a recentstudy using polarized neutrons showed the presence oft2g orbital ordering associated with a minimal Jahn-Teller distortion of TiO6 octahedron (Akimitsu et al.,1998).
Figure 102 shows the optical conductivity spectrum ofthe gap excitations in YTiO3 (Okimoto et al., 1995b):The onset of the Mott-Hubbard gap transition can beclearly seen around 1 eV, while the rise in optical con-ductivity around 4 eV is ascribed to the charge-transfergap between the O 2p filled state and the Ti 3d upperHubbard band. The observation of the two kinds of gaptransition and their relative positions indicate thatRTiO3 is a Mott-Hubbard insulator rather than a CTinsulator in the scheme of Zaanen, Sawatzky, and Allen.The U/W dependence of the Mott-Hubbard gap magni-tude (Eg) normalized by W , which was obtained by op-tical measurements of La12yYyTiO3 (Okimoto et al.,1995b), is plotted in the x50 end plane of Fig. 101. TheMott-Hubbard gap magnitude changes critically with arather gentle change (520%) of W . A similar W de-pendence of the Mott-Hubbard gap was also observedfor a series of RTiO3 (Crandles et al., 1994; Katsufuji,
FIG. 102. Optical conductivity in YTiO3. From Okimoto et al.,1995b.

1166 Imada, Fujimori, and Tokura: Metal-insulator transitions
Okimoto, and Tokura, 1995; Katsufuji, Okimoto, Arima,Tokura, and Torrance, 1995).
Before considering the electronic structure ofR12xAxTiO3, it is necessary to understand the elec-tronic structure of the parent Mott insulators RTiO3.Neither the local spin-density approximation nor thegeneralized gradient approximation is sufficient to ex-plain the insulating nature of these compounds withinone-electron band theory; calculations on the level ofthe Hartree-Fock or LDA1U approximation, in whichthe spin and orbital degrees of freedom are taken intoaccount on an equal footing, are found to be necessary(Mizokawa and Fujimori, 1995, 1996b; Solovyev, Ha-mada, and Terakura, 1996b). With decreasing size of theR ion, RTiO3 changes from an antiferromagnetic insula-tor (LaTiO3) to a ferromagnetic insulator (YTiO3). Ac-cording to the Hartree-Fock calculation (which includesthe Ti 3d spin-orbit interaction), the t2g
1 configuration inthe nearly cubic LaTiO3 is in the quadruply degeneratespin-orbit ground state, out of which two states with an-tiparallel orbital and spin moments [both directed in the(111) direction] are alternating between nearest neigh-bors, resulting in a G-type antiferromagnetic state (seeFig. 38). Larger GdFeO3-type distortion [see Figs. 38(a)and 61] induces greater hybridization between neighbor-ing xy , yz , and zx orbitals, which makes the antiferro-orbital exchange as well as ferromagnetic exchangelarger through the Hund’s-rule coupling. The orderingstabilizes the Jahn-Teller distortion of type d (see Fig.38) and the t2g level is split into two lower-lying levelsand one higher-lying level (for example, for an octahe-dron elongated along the x direction, the energies of thexy and zx orbitals are lowered relative to the yz or-bital). At each site, one of the two low-lying orbitals isoccupied so that the neighboring orbitals are approxi-mately orthogonal to each other with the spins ferro-magnetically aligned. This is why the G-type antiferro-magnetic order and the small Jahn-Teller distortion inLaTiO3 is changed to ferromagnetic order with d-typeJahn-Teller distortion in YTiO3. It has always been con-troversial whether orbital ordering is driven by electron-electron interaction or by electron-lattice interaction(the Jahn-Teller effect). Considering the small Jahn-Teller distortion in the present Ti perovskites, the or-bital ordering would be largely of electronic origin.
Filling control in the 3d band can be achieved by par-tially replacing the trivalent ions with divalent Ca or Srions. The solid solution can be formed for an arbitraryR/A ratio and hence the filling (n) can be varied from 1to 0. Figure 103 shows the temperature dependence ofthe resistivity for LaTiO31d/2 or La12xSrxTiO3 and forY12xCaxTiO3 near the FC-MIT. For LaTiO3, which hasrelatively weak electron correlation, several % of hole-doping is sufficient to destroy the antiferromagnetic or-dering and cause the MIT. To control the filling on a finescale, nonstoichiometry (d/2) of oxygen is also utilized,as shown in the figure: n512d . The upturn or inflectionpoint in the resistivity curve corresponds to the antifer-romagnetic transition temperature. For YTiO3 withlarger U/W , by contrast, the insulating phase persists up
Rev. Mod. Phys., Vol. 70, No. 4, October 1998
to x50.4, though ferromagnetic spin ordering disap-pears around x50.2 (see also Fig. 101; Taguchi et al.1993; Tokura, Taguchi, et al., 1993). In the immediatevicinity of the MIT, the resistivity curve of Y12xCaxTiO3shows a maximum around 150–200 K. The resistivity be-havior below the temperature for the maximum is ac-companied by thermal hysteresis, indicating the occur-rence of a first-order insulator-metal transition, althoughthis feature is blurred, perhaps due to the inevitable ran-domness of a mixed-crystal system. A similar tempera-ture dependence or reentrant MIT with change of tem-perature was observed in Sm12xCaxTiO3 near the FC-MIT (Katsufuji, Taguchi, and Tokura, 1997). However,no structural transition has been detected so far near thehysteresis.
Metallic compounds, La12xSrxTiO3 for x.0.05 andY12xCaxTiO3 for x.0.4, show strongly filling-dependent properties near the metal-insulator phaseboundary (Kumagai et al., 1993; Taguchi et al., 1993;Tokura, Taguchi, et al., 1993). The upper panel of Fig.
FIG. 103. Temperature dependence of the resistivity forLaTiO31d/2 or La12xSrxTiO3 and for Y12xCaxTiO3. From Kat-sufuji and Tokura, 1994.

1167Imada, Fujimori, and Tokura: Metal-insulator transitions
104 shows the x dependence of the electronic specific-heat coefficient (g) and the Pauli paramagnetic suscep-tibility (x) in the metallic region of La12xSrxTiO3 andY12xCaxTiO3. In the lower panel of the figure, the ef-fective carrier number per Ti site (nc), deduced fromthe Hall coefficient (RH) via the relation RH51/ncec , isshown as a function of x5(12n). Thus the estimatedvalue of nc approximately equals the filling n , as indi-cated by a solid line in the lower panel of the figure.Such a relation is consistent with a simple band picture.On the other hand, g shows a critical increase as thesystem approaches the Mott-Hubbard insulator phase(x.0). The x dependence of x is almost parallel withthat of g, showing a nearly constant Wilson ratio ofabout 2. Provided that the band is parabolic with a con-stant effective mass m* , g or the density of states at theFermi level (EF) should be proportional to n1/3, asshown by a solid line in the upper panel of Fig. 104. Thecritical enhancement of g and x as compared with thisreference line is ascribed to the increase of m* as thesystem approaches the Mott-Hubbard insulator phase.Such a filling-dependent mass renormalization is a ge-neric feature of the FC-MIT, as predicted theoretically(Furukawa and Imada, 1992; Imada, 1993a; see Sec.II.G). The mass enhancement observed in the experi-ments also is consistent with the result in infinite dimen-sions (Rozenberg, Kotliar, and Zhang, 1994; see for areview, Georges et al., 1996). The observed Wilson ratiois clearly not inconsistent with the d5` result, as dis-cussed in Sec. II.D.6. In the case of Y12xCaxTiO3, alarge mass enhancement in metals near x;0.4 may beassociated with orbital fluctuations instead of spin fluc-tuations.
FIG. 104. Upper panel, x-dependence of the electronicspecific-heat coefficient (g) and the Pauli paramagnetic suscep-tibility (x) in the metallic region of La12xSrxTiO3 andY12xCaxTiO3; Lower panel, the effective carrier number perTi-site (nc), deduced from the Hall coefficient (RH) as a func-tion of x5(12n) (Tokura et al., 1993; Taguchi et al., 1993).
Rev. Mod. Phys., Vol. 70, No. 4, October 1998
The temperature dependence of the resistivity in me-tallic La12xSrxTiO3 can be well expressed up to 300 Kby the relation r5r01AT2, as can be seen in Fig. 105.The T2 dependence of the resistivity is reminiscent ofthe dominant electron-electron scattering process as de-rived in Eq. (2.83) (see Sec. II.E.1). The coefficient A isalso enhanced as the Mott-Hubbard insulator is ap-proached from the metallic side. In the inset of the fig-ure, the relation between A and g is shown for thesamples near the metal-insulator boundary. The well-known relation for heavy-fermion systems, A5Cg2
(Kadowaki and Woods, 1986), also seems to hold ap-proximately in this system, with [email protected] V cm(mol K/mJ)2# , which is nearly the same asthe universal constant (Tokura, Taguchi, et al., 1993).This proportional constant seems to be in agreementwith the infinite-dimensional result (Moeller et al.,1995).
Such a critical enhancement of the carrier effectivemass near the MIT phase boundary can also be probedby Raman spectroscopy. According to the theory ofMills, Maradudin, and Burstein (1970) for phonon Ra-man scattering in metals, the scattering cross section ofan even-parity phonon is given by
d2I
dV dv}$gph /@gph
2 1~v2vph!2#%udxu2, (4.3)
where vph is the phonon frequency and gph is the widthof the phonon spectrum. dx is the modulation of thecharge susceptibility caused by the atomic displace-ments. It was shown by a crude approximation (Katsu-fuji and Tokura, 1994) that dx is proportional to theDrude weight, nc /m* . The Raman process in metals ismediated by particle-hole excitations across the Fermilevel, while that in insulators is mediated by interbandtransitions. Thus, roughly speaking, the spectral inten-sity of the phonon is proportional to (nc /m* )2 or thesquare of the Drude weight in metals. [However, we
FIG. 105. Temperature dependence of the resistivity in metal-lic La12xSrxTiO3. From Tokura et al., 1993.

1168 Imada, Fujimori, and Tokura: Metal-insulator transitions
need more careful analysis on the frequency depen-dence. As we shall discuss later, the true Drude weight isvery small, with a presumably smaller frequency widththan the phonon frequency vph in the Raman process.In the frequency range out of the Drude-dominant fre-quency, s(v) is governed by the incoherent charge dy-namics discussed in Secs. II.F.1 and II.G.9. Therefore,strictly speaking, the intensity picks up the incoherentweight of intraband excitations.] We show in Fig. 106 thevariation of phonon Raman intensities for the Ti-Obending A1g mode as a function of x in La12xSrxTiO3and Y12xCaxTiO3. This mode becomes Raman active asa result of the orthorhombic distortion of the crystallinelattice, which is present for x,0.4 in La12xSrxTiO3 andfor the whole compositional range in Y12xCaxTiO3. Ascan be seen in the figure, the spectral intensity in themetallic regions steeply decreases as the metal-insulatorphase boundary (vertical dotted lines) is approached,and almost disappears in the insulating regions. This in-dicates that this phonon Raman mode is activated in themetallic state via coupling with the intraband excitationacross the Fermi level, as described above, but not in theinsulating state with a charge gap larger than the phononenergy. The phonon intensity can be corrected by thex-dependent orthorhombic distortion. It decreases tozero with decreasing x , indicating that the intraband re-sponse at vph vanishes as the MIT is approached. As isnoticed by Katsufuji and Tokura (1994), this x depen-dence of the phonon intensity is roughly scaled by @(12x)/g#2 where g is the specific-heat coefficient. Al-though the simple interpretation of dx as the Drudeweight needs caution as discussed above, it is interestingto note that dx appears to follow the scaling (12x)/g ,implying that the low-energy incoherent weight given bythe v-independent prefactor for the incoherent part ofs(v) follows the same scaling as 1/g near x50.
The FC-MIT causes a change in electronic structureover a fairly large energy scale. In particular, spectral
FIG. 106. Variation of phonon Raman intensities for the Ti-Obending A1g mode as a function of x in La12xSrxTiO3 andY12xCaxTiO3. From Katsufuji and Tokura, 1994.
Rev. Mod. Phys., Vol. 70, No. 4, October 1998
weight transfer from the correlation gap (Mott-Hubbardor CT gap) excitations to the inner gap excitations withcarrier doping is a common feature of FC-MIT systems.The doping-induced changes in the optical conductivityspectra in R12xSrxTiO31y or R12xCaxTiO31y (whereR5La, Nd, Sm, and Y and y is a small oxygen non-stoichiometry, mostly ,0.02; Katsufuji, Okimoto, andTokura, 1995) are shown in Fig. 107. The spectra of therespective samples are labeled with the nominal holeconcentration d, where d5x12y512n , and with thevalue of the one-electron bandwidth W normalized bythat of LaTiO3. The open circles show the magnitude ofthe dc conductivity, s(v50), at room temperature. Inthe case of R5Nd (Nd12xCaxTiO3), for example, s(v)for d50 (n51) shows negligible spectral weight below0.8 eV but steeply increases above 0.8 eV due to theonset of the Mott-Hubbard gap excitations. The spectralweight of the Mott-Hubbard gap excitations is reducedwith increase of d, while that inside the gap increases.The spectral weight appears to be transferred graduallyone from the above-gap region to the inner-gap regionacross an isosbetic (equal-absorption) point around 1.2eV.
It is remarkable in Fig. 107 that, though s(v) changeswith d in a similar way irrespective of the element R , theevolution rate of the inner-gap excitation (quasi-Drudepart) with d is critically dependent on the magnitude ofW . That is, spectral weight transfer into the quasi-Drudepart decreases with a decrease of W . In quantitativeterms, the effective number of electrons is
Neff~v!52m0
pe2N E0
v
s~v8!dv (4.4)
where m0 is the free-electron mass and N the number of
FIG. 107. Optical conductivity spectra in R12xSrxTiO31y orR12xCaxTiO31y (R5La, Nd, Sm, and Y). From Katsufuji,Okimoto, and Tokura, 1995.

1169Imada, Fujimori, and Tokura: Metal-insulator transitions
Ti atoms per unit volume. Neff(v) is nearly independentof d, with v52.5 eV, which includes the spectral weightof both the inner-gap and the Mott-Hubbard-gap excita-tions. The sum of these two parts is nearly conservedunder a variation of d, but the spectral weight is trans-ferred from the Mott-Hubbard part to the inner-gappart across the isosbetic point \vc ('1.1 eV forNd12xCaxTiO3). Thus the value defined as ND5Neff(vc)d2Neff(vc)d50 is the low-energy spectralweight transferred from the higher-energy region withdoping. In Fig. 108, ND , which is normalized to ND0 ,the value of ND for U50 and d50 (n51), is plotted asa function of d. The observed linear increase of ND withd,
ND /ND05Cd , (4.5)
is consistent with theoretical studies of the Hubbardmodel in d5` (Jarrell, Fredericks, and Pruschke, 1995),provided that ND is interpreted as the Drude weight atv50. However, because ND also includes incoherentexcitations up to vc , this d dependence is dominated bythat of the intraband kinetic energy and hence domi-nated by the incoherent charge response discussed inSec. II.F.1. In fact, the optical conductivity shown in Fig.107 shows a rather similar feature to the incoherent re-sponse s(v).(12e2bv)/v discussed in Secs. II.F.1,II.G.9, and II.M.2 because both have a long tail at largev roughly scaled as 1/v , although s(0);1/T2 seen inFig. 105 does not fit this form. This implies that the trueDrude weight associated with T2 resistivity is very small,only prominent around v;0, while the dominant weightin the observed s(v) is exhausted in the incoherent partwith the long tail up to large v;1 eV. This is in contrastwith the theoretical results in d5` and similar to theincoherent response discussed in Secs. II.F.1 and II.G.9.The integrated intensity itself (namely, the kinetic en-
FIG. 108. ND to ND0 as a function of d (Katsufuji, Okimoto,and Tokura, 1995) for La12xSrxTiO3.
Rev. Mod. Phys., Vol. 70, No. 4, October 1998
ergy of the intraband part containing both the trueDrude and the incoherent responses) seems to be scaledby the doping level and is consistent with both the scal-ing theory in Sec. II.G.9 and the d5` result (Kajueterand Kotliar, 1997).
Figure 109 (lower panel) shows the W21 (strength ofelectron correlation) dependence of C21, while the up-per panel shows the value of 2D/W (the optical energygap normalized to the bandwidth) as well as the normal-ized activation energy (2Dact /W) of the resistivity. Thesolid line, which is a linear fit to the data points of2Dact /W , crosses the 2D50 line (abscissa) at a finitevalue of W('0.97) corresponding to the critical valuefor the BC-MIT @(U/W)c# at which the charge gapcloses and the Mott transition occurs. The relation Dact}@U/W2(U/W)c#
a with the exponent a;1 impliesthat the critical exponents of a BC-MIT here are char-acterized by nz;1 where n and z are the correlationlength and dynamic exponents, respectively, as is dis-cussed in Sec. II.F.4 [see Eq. (2.332)].
On the other hand, the lower panel of Fig. 109 indi-cates that C21 decreases linearly with a decrease inW21. It is to be noted that the value of W21 at whichC21 becomes zero nearly coincides with the value atwhich 2D becomes zero. This means that the rate of evo-lution of the low-energy incoherent part with d is criti-cally (divergently) enhanced as the electron correlation(U/W) approaches the critical value (U/W)c for theBC-MIT, following the relation
C}@~U/W !2~U/W !c#21. (4.6)
Strictly speaking, the MIT is defined as the point wherethe true Drude weight vanishes. However, it is interest-ing to note that the weight of the broad incoherent part
FIG. 109. Lower panel, the W21 (strength of electron correla-tion) dependence of C21: upper panel, the value of 2D/W (theoptical energy gap normalized to the bandwidth) as well as theactivation energy (2Dact) of the resistivity for R12xCaxTiO3.From Katsufuji, Okimoto, and Tokura, 1995.

1170 Imada, Fujimori, and Tokura: Metal-insulator transitions
with the 1/v tail also more or less vanishes at the BC-MIT point because Neff(vc)d50 is small. Since Neff mea-sures the kinetic energy when v is taken to be large, Cmeasures approximately the singular part of the kineticenergy near the MIT. The exponent in Eq. (4.6) contra-dicts that in the Gutzwiller approximation given in Eq.(2.198), which implies the breakdown of the mean-fieldtreatment in 3D.
A proper microscopic description of mass enhance-ment near the FC-MIT is an important step in elucidat-ing the nature of the Mott transition, as reflected by thespecific heat and the magnetic susceptibility mentionedabove. Photoemission spectroscopy gives such informa-tion in the same way as was described for thebandwidth-control system Ca12xSrxVO3 (Sec. IV.A.5).For filling-control systems, in addition to the spectralweight transfer between the coherent quasiparticle partand the incoherent part, spectral weight should be trans-ferred between the occupied (v,m) and unoccupied(v.m) portions of the spectral function because of thesum rule that *2`
m dvr(v) is equal to the number ofelectrons [see Eq. (2.58)].
Spectral weight transfer in the photoemission spectrahas been studied for La12xSrxTiO3 (Fujimori, Hase,et al., 1992b; Aiura et al., 1996), R12xBaxTiO3 (R5Y,La, and Nd) (Robey et al., 1993), Nd12xSrxTiO3 (Robeyet al., 1995) and Y12xCaxTiO3 (Morikawa et al., 1996).These systems differ from each other in the magnitudeof W and hence of U/W . Figure 110 shows the photo-emission spectra of La12xSrxTiO3 (Fujimori, Hase, et al.,1992b). The n51 (x50) end member is a d1 Mott in-sulator and shows a broad peak centered at ;1.5 eVbelow EF , which is assigned to the lower Hubbard band.(The weak intensity at the Fermi edge is due to the me-tallicity of the LaTiO31d sample with excess oxygen
FIG. 110. Photoemission spectra of La12xSrxTiO3. From Fuji-mori et al., 1992b.
Rev. Mod. Phys., Vol. 70, No. 4, October 1998
studied in that work. Recent measurements on stoichio-metric samples yielded a vanishing intensity at EF .)With increasing x , i.e., with hole doping, the ;1.5 eVpeak loses its spectral weight without changing energyposition or line shape down to x;1, at which composi-tion the peak almost disappears. The lost spectral weightis transferred to above EF , as observed by O 1s x-rayabsorption and inverse photoemission spectroscopy. Inthe metallic region (0&x&1 for La12xSrxTiO3), a weakbut finite Fermi-edge intensity is found, indicating thatupon hole doping a small portion of the spectral weightis transferred from the lower Hubbard band to the qua-siparticle band crossing EF . Qualitatively the samespectral changes were observed for the otherR12xAxTiO3 systems, but the quasiparticle spectralweight decreases with the decrease in ionic radius of theA-site ion and hence with increasing U/W (Morikawaet al., 1996). The changes in spectral weight distributionas a function of both band filling n and interactionstrength U/W are schematically depicted in Fig. 111.
If we assume that the self-energy correction ((kW ,v) iskW independent and therefore that m* /nb;Z21 (whereZ is the quasiparticle spectral weight), the experimen-tally observed low quasiparticle weight in everyR12xAxTiO3 system is apparently incompatible with theelectronic specific heat, which implies m* ;mb exceptfor the vicinity of the Mott transition, where m* be-comes as large as ;5mb (Tokura, Taguchi, et al., 1993).This indicates the important role of nonlocal effects, i.e.,of the momentum dependence of the self-energy correc-tion, in the mass renormalization and enables us toevaluate not only m* 5mkmv /mb but also mk and mv
separately, as in the case of Ca12xSrxVO3 (see Sec.IV.A.5). In the present case, because such a decomposi-tion of the spectra into the coherent and incoherentparts is difficult owing to the weakness of the coherent
FIG. 111. Evolution of the single-particle density of states r(v)as a function of U/W and band filling n , derived from thephotoemission and inverse-photoemission studies of Ti and Vperovskite oxides. From Morikawa et al., 1996.

1171Imada, Fujimori, and Tokura: Metal-insulator transitions
part, the quasiparticle DOS at EF , N* (m), obtainedfrom the electronic specific-heat coefficient g, is utilizedto estimate Z , using the relationship Z5r(m)/N* (m)[Eq. (2.126)]. Because of the very low spectral intensityat EF , one obtains Z&0.01 and ;0.05, respectively, formetallic samples of Y12xCaxTiO3 and La12xSrxTiO3(Morikawa et al., 1996). Since mk /mb5r(m)/Nb(m)[Eq. (2.125)], the reduction of the spectral weight r(m)in going from La12xSrxTiO3 to Y12xCaxTiO3 means thatZ and mk decrease with U/W not only for n51(Ca12xSrxVO3) but also for 0,n,1.
The extremely low quasiparticle spectral weight ob-served in the photoemission study seems consistent withthe overwhelmingly incoherent response in s(v). Al-though the results of finite-size calculations using theHubbard model indicate a relatively sharp peak of largequasiparticle spectral weight (of order 0.1–1) for a real-istic U/W (or U/t) values (Dagotto et al., 1991; Bulut,Scalapino, and White, 1994a; Eskes et al., 1994; Ulmkeet al., 1996), the real coherent weight of the quasiparticlenear the Mott insulating phase could be only a tiny por-tion of this as discussed in Sec. II.F.2. This view seems tobe consistent with the above observation, at least for ametal near the Mott insulator. However, this does notexplain the low weight at small electron fillings. In orderto explain the strong reduction of the spectral weight atEF in the bandwidth control d1 Mott-Hubbard systemCa12xSrxVO3, Morikawa et al. (1995) proposed that itwas the effect of the long-range Coulomb interaction,which is neglected in the Hubbard model. The effect ofthe long-range Coulomb force could be one origin ofsmall Z even far away from the integer filling becausethe screening becomes progressively ineffective at lowelectron filling. Another origin of low Z could be disor-der. A recent dynamic mean-field approach has shownthat the typical quasiparticle weight can be reduced evenfar away from half filling if disorder and strong correla-tion coexist (Dobrosavljevic and Kotliar, 1997).
Some remarks should be made on the experimentalobservation that the ;1.5 eV peak of the photoemissionspectra persists in x;1 (n;0) samples, where the dband is nearly empty. This is an unexpected experimen-tal result by itself, since in the limit of small band filling,n!1, there should be only a small probability ofelectron-electron interaction. A similar peak was ob-served (but at somewhat lower binding energies of;1.2 eV) for oxygen-deficient SrTiO32y (Henrich andKurtz, 1981; Barman et al., 1996). In order to explainthis behavior, two different models were proposed. Onewas based on the potential disorder caused by the sub-stituted A-ion sites (Sarma, Barman, et al., 1996). Thesubstitution of La for Sr lowers the potential at neigh-boring Ti sites and, if the potential lowering is largeenough, produces a peak ;1 eV below EF even for asmall band filling (n!1). However, such a strong poten-tial disorder may cause a localization of electrons andhence seems difficult to explain the metallic conductivityobserved for the low n (especially for La12xSrxTiO3).On the other hand, Dobrosavljevic and Kotliar (1997)have shown, using dynamical mean-field theory, that
Rev. Mod. Phys., Vol. 70, No. 4, October 1998
metallic conductivity may remain finite up to a consid-erable degree of potential disorder. In the other model,one considers the interaction of doped electrons withthe lattice distortion through both short-range and long-range interactions, which are usually described by theHolstein and Frohlich Hamiltonians, respectively (Fuji-mori, Bocquet, et al., 1996). In this model, a doped elec-tron is self-trapped due to the polaronic effect with asmall binding energy (and hence a small transport acti-vation energy) but, when the electron is emitted in thephotoemission process, the lattice is left with a large ex-cess energy of ;1 eV, giving rise to the deep d-derivedphotoemission peak. This approach also has a problem,namely, that the observed metallic transport remains tobe explained using models with the tendency for self-trapping.
2. R12xAxVO3
La12xSrxVO3 has long been known as a FC-MIT sys-tem among the 3d transition-metal oxide perovskitesand was discussed in the earlier version of Mott’s textbook (Mott, 1990). The end compound RVO3, where Ris a trivalent rare-earth ion, possesses V31 ions with 3d2
configuration (S51). The crystalline lattice of RVO3 istetragonal for R5La and Ce, while for the others it is ofGdFeO3 type with orthorhombic distortion (Sakai, Ada-chi, and Shiokawa, 1977). Therefore the one-electronbandwidth (W) must decrease with decreasing radius ofthe R ion, as in the case of RTiO3 (Sec. IV.B.1). RVO3is typically a Mott-Hubbard insulator and undergoes anantiferromagnetic transition at 120–150 K. The antifer-romagnetic phase is accompanied by a spin canting, giv-ing rise to weak ferromagnetism.
The insulating nature of the parent RVO3 compoundsis again insufficiently explained by LSDA band-structure calculations. LaVO3 and YVO3 show C-typeand G-type antiferromagnetic ordering, respectively.They are also accompanied by a Jahn-Teller distortionas in RTiO3, but of the a type for LaVO3 and d type forYVO3. These phenomena were explained by Hartree-Fock (Mizokawa and Fujimori, 1996b) band-structurecalculations. For the ideal cubic lattice, the lowest-energy Hartree-Fock solution is the C-type antiferro-magnetic state in which two adjacent V atoms have(xy)1(yz)1 and (xy)1(zx)1 configurations, which favorsthe a-type Jahn-Teller distortion. Here, the occupationof the xy orbital at every site induces antiferromagneticcoupling within the ab plane, while the alternating oc-cupation of the yz and zx orbitals induces ferromag-netic coupling along the c axis. (One can ignore thespin-orbit interaction, unlike the case of LaTiO3, be-cause the Jahn-Teller distortion is substantial in theRVO3 compounds.) For the d-type Jahn-Teller distor-tion, either the yz or the zx orbitals are occupied alongthe c axis, resulting in antiferromagnetic coupling alongthe c direction and hence G-type antiferromagnetic or-dering. Generalized density gradient band-structure cal-culations also explained the C-type antiferromagnetism

1172 Imada, Fujimori, and Tokura: Metal-insulator transitions
of LaVO3 but failed to explain the G-type antiferromag-netism in YVO3 (Sawada et al., 1996).
With hole doping by partial substitution of divalentions (Sr or Ca) for the rare-earth ions, the insulatingantiferromagnetic phase eventually disappears, as shownin Fig. 112 for the case of La12xSrxVO3 (Mahajan et al.,1992; Inaba et al., 1995). As compared with the case ofV2O3 (Sec. IV.A.1), doping with more nominal holes isnecessary to produce the metallic state. In the case ofLa12xSrxVO3 the FC-MIT takes place around xc'0.2(Dougier and Casalot, 1970; Dougier and Hagenmuller,1975; Inaba et al., 1995), while in Y12xCaxVO3 it takesplace around xc'0.5 with smaller W (Kasuya et al.,1993).
FIG. 112. Phase diagram of La12xSrxVO3 (Mahajan et al.,1992; Inaba et al., 1995).
FIG. 113. Resistivity of La12xSrxVO3. From Inaba et al., 1995.
Rev. Mod. Phys., Vol. 70, No. 4, October 1998
Figure 113 presents the data for the temperature de-pendence of the resistivity in arc-melted polycrystals(which suffer less from grain boundary effects than ce-ramics samples) of La12xSrxVO3 (Inaba et al., 1995).The conductivity in the insulating region (x,0.15)shows a thermal activation type at relatively higher tem-peratures above the antiferromagnetic transition tem-perature TN (Fig. 112), and the thermal activation en-ergy, '0.15 eV for LaVO3, decreases steeply butcontinuously with x . Variation of the activation energyof La12xSrxVO3 is shown to follow (xc2x)1.8 (Dougierand Hagenmuller, 1975). Mott (1990) argued that thecritical variation in the form of (xc2x)z with z51.8 is incontradiction to the simple scenario, i.e., z51, of theAnderson localization and that some kind of mass en-hancement, such as a consequence of the formation ofspin polarons, must be taken into account. At lowertemperatures below TN in the region of 0.05,x,0.15,the compound shows a variable-range hopping type ofconduction. Again, Sayer et al. (1975) reported that thecritical exponent for the localization length is z50.6 in-stead of the expected value z51.
The FC-MIT and resultant change of the electronicstructure show up clearly in the optical spectra. Figure114 shows the low-energy part of the optical conductiv-ity spectra at room temperature for La12xSrxVO3 to-gether with the inset for a broader energy region (Inabaet al., 1995). In LaVO3 a Mott-Hubbard gap between thelower and upper Hubbard bands and a charge-transfer(CT) gap between the occupied O 2p band and the up-per Hubbard band are observed at 1.1 eV and 3.6 eV,respectively; these can be discerned as rises in the opti-cal conductivity in the inset of Fig. 114. With hole dop-ing by substitution of Sr (x), the CT gap shifts to lower
FIG. 114. Optical conductivity spectra at room temperaturefor La12xSrxVO3. From Inaba et al., 1995.

1173Imada, Fujimori, and Tokura: Metal-insulator transitions
energy mainly due to the shift in the 2p band, and theMott-Hubbard gap is closed. As for the doping-inducedchange in the low-energy region, the spectral weight isfirst increased in the gap region and eventually forms theinner-gap absorption band. In barely metallic samples (x50.20 and 0.22) at room temperature (see Fig. 113),the conductivity spectra show a non-Drude-like shape,indicating a dominant contribution from the incoherentmotion of the charge carriers. However, the spectra forx.0.3 are typical of a metal. In contrast with the case ofR12xAxTiO3 (Sec. IV.B.1), the spectral weight does notappear to be transferred from the gap excitation butfrom a higher-lying p-d interband transition, since noisosbetic point can be observed near the Mott-Hubbardgap energy. A similar feature of the evolution of theinner-gap excitation with doping is observed forY12xCaxVO3 (Kasuya et al., 1993) but at a higher dop-ing level, probably reflecting stronger electron correla-tion.
Figure 115 shows the resistivity of the compoundsnear the metal-insulator phase boundary as a function ofT1.5 (Inaba et al., 1995). Apart from the upturns at lowtemperatures (probably below TN), the temperature de-pendence of the resistivity (r) can be well expressed bythe relation r5r01AT1.5 in the metallic region. The in-set of Fig. 115 shows a magnification of the low-temperature region for the x50.28 sample, indicatingthat the above relation holds good at least down to 2.5K. The coefficient A critically increases as the metal-insulator phase boundary is approached from thehigher-x (metallic) region. Inaba et al. (1995) inter-preted this to mean that the enhanced T1.5 dependencewas due to antiferromagnetic spin fluctuations. The self-consistent renormalization (SCR) theory (Moriya, 1995;Ueda, 1977; see also Secs. II.E.1 and II.E.8) indicatesthat the low-temperature resistivity near the criticalboundary between the antiferromagnetic metal and nor-mal metal deviates from the normal T2 law and showsT1.5 dependence, as discussed in Sec. II.E.8. The T1.5
FIG. 115. Resistivity of La12xSrxVO3 near the MI phaseboundary as a function of T1.5. From Inaba et al., 1995.
Rev. Mod. Phys., Vol. 70, No. 4, October 1998
dependence of the resistivity can be interpreted in termsof the strong Curie-like enhancement of the spin suscep-tibility x(Q) as derived in Eq. (2.118). This T22T1.5
crossover has clearly been observed near the antiferro-magnetic metal-normal metal phase boundary, for ex-ample in the case of the BC-MIT system NiS22xSex , asdescribed in Sec. IV.B.2. In La12xSxVO3, however, it isnot yet clear whether the antiferromagnetic metallicstate is present around x'0.2. Furthermore, the mea-surement of the NMR relaxation rate T1
21 by Mahajanet al. (1992) shows a conventional Korringa behaviorand no indication of antiferromagnetic fluctuation, atleast for x>0.4. Detailed neutron-scattering and NMRmeasurements using single-crystalline La12xSrxVO3samples in the immediate vicinity (x'0.2) of the MITare obviously needed to detect and characterize possiblyanomalous magnetic fluctuations near the FC-MIT.
The evolution of electronic states in the R12xAxVO3system with x should be different from that inR12xAxTiO3 in that the parent insulator RVO3 is a Mottinsulator with d2 configuration, where there is a Hund’srule coupling between the d electrons, and the x→1(100% hole doping) limit still has one d electron per Vsite. The photoemission and oxygen 1s x-ray absorptionspectra of RVO3 (R5La,Y) revealed lower and upperHubbard bands, respectively, corresponding to the d2
→d1 and d2→d3 spectral weight (Edgell et al., 1984; Ei-saki, 1991; Pen et al., 1998). Upon hole doping, newspectral weight grows rapidly just above EF , which cor-responds to the d1→d2 spectral weight induced by holedoping, as in the high-Tc cuprates. At the same time thelower Hubbard band loses its spectral weight. As thesystem becomes metallic (x.0.5 for R5Y and x.0.2for R5La), a Fermi edge is developed in the photoemis-sion spectra. If one starts from the x51 (d1) limit of thesystem La12xSrxVO3 and increases the band filling, theremnant of the lower Hubbard band increases its inten-sity while the quasiparticle band in the photoemissionand inverse photoemission spectra loses its intensity(Tsujioka et al., 1997). The decrease of the quasiparticleweight as the system deviates from integer filling is op-posite to what has been theoretically predicted for afixed U/W (Kotliar and Kajueter, 1996; Rozenberget al., 1996), and would be attributed to the increase inU/W with decreasing x . Here it should be noted that inR12xAxVO3 not only does the band filling n ([22x)decrease but also U/W decreases with x , since U/W,1 in the metallic AVO3 while U/W.1 in the insulat-ing RVO3.
C. High-Tc cuprates
1. La22xSrxCuO4
The discovery of high-Tc cuprate superconductorswas brought about by the observation of a supercon-ducting transition for the compound La22xMxCuO4 withM5Ba by Bednorz and Muller (1986). The lattice struc-ture of this compound was soon identified as the K2NiF4type, namely, the layered perovskite structure shown inFig. 116 (Takagi, Uchida, Kitazawa, and Tanaka, 1987).

1174 Imada, Fujimori, and Tokura: Metal-insulator transitions
Although a large number of compounds have been dis-covered as high-Tc cuprate superconductors since then,they all have a common structure of stacking of CuO2layers sandwiched by block layers, as shown schemati-cally in Fig. 117. The superconductivity itself has beenan attractive and extensively studied subject. The sym-metry of the pairing order parameter of the high-Tc cu-prates now appears to be settled as the dx22y2 symmetryafter enormous combined effort involving magneticresonance experiments, Josephson junctions, etc. (see
FIG. 116. The layered perovskite structure of La22xMxCuO4;large open circles, La(M); small open circle, Cu; large filledcircle, O.
FIG. 117. Conceptual illustration of stacking of CuO2 layerssandwiched by block layers.
Rev. Mod. Phys., Vol. 70, No. 4, October 1998
for a review Scalapino, 1995; Annett et al., 1996). How-ever, in this review article, we focus on the unusualnormal-state properties of high-Tc compounds; proper-ties in the superconducting state are beyond the scope ofthis article.
Before going into a detailed discussion of experimen-tal data, we first outline the basic electronic structureand the phase diagram in the plane of doping concentra-tion x and temperature T . Because of the two-dimensional anisotropy of this lattice structure, CuO6octahedra are slightly elongated along the direction per-pendicular to the CuO2 layer. This means that the dis-tance from Cu to the apex oxygen is slightly longer thanthe distance to the in-plane oxygen, which may beviewed as a Jahn-Teller-type distortion. This distortionlifts the degeneracy of the eg orbitals of Cu 3d electronsto the lower-lying dz22r2 and higher-lying dx22y2 orbit-als. Because the parent compound La2CuO4 has the va-lence of Cu21, and hence as the nominal d9 state theabove crystal-field splitting leads to fully occupied t2gorbitals and d3z22r2 orbital, while the dx22y2 orbital re-mains half-filled, the Fermi level lies in a band con-structed mainly from the dx22y2 orbital, relatively closeto the level of the 2ps oxygen orbital, compared withother transition-metal oxides. In La2CuO4, since the 2ps
band lies within the Mott-Hubbard gap, it is a charge-transfer (CT) insulator, as discussed in Secs. II.A andIII.A. La2CuO4 is a typical insulator with antiferromag-netic long-range order. Up to the present time, all thecuprate superconductors with high critical temperaturesare known to be located near the antiferromagneticMott insulating phase. La2CuO4 is, in fact, a Mott insu-lator with the Neel temperature TN;300 K. Becausethe dx22y2 band is half-filled, it is clear that the insulat-ing behavior experimentally observed even far above TNis due to strong correlation effects.
La22xMxCuO4 with M5Sr and Ba provides a typicalexample, with a wide range of controllability of carrierconcentration, from the antiferromagnetic Mott insulat-ing phase to overdoped good metals, by the doping ofSr, Ba, or Ca. Therefore La22xMxCuO4 is a good ex-ample of an FC-MIT system with 2D anisotropy. Thebasic electronic structure of the cuprate superconductorsin all regions, from insulator to metal, is believed to bedescribed by the d-p model defined in Eqs. (2.11a)–(2.11d). The parameters deduced from photoemission(Shen et al., 1987; Fujimori, Takekawa, et al., 1989),LDA calculations (Park et al., 1988; Stechel and Jenni-son, 1988; Hybersten, Schluter, and Christensen, 1989;McMahan, Martin, and Satpathy, 1989), and s(v) giveoverall consistency with Udd.6 –10 eV, tpd.1 –1.5 eV,D.1 –3 eV, Upp.1 eV, and Vpd;1 –1.5 eV. The de-tails of methods for determining the model parametersare given in Sec. III.B.
With increasing x , La22xSrxCuO4 very quickly under-goes a transition from an antiferromagnetic insulator toa paramagnetic metal with a superconducting phase atlow temperatures. The phase diagram of La22xSrCuO4is shown in Fig. 118. At sufficiently low temperatures, itis believed that the MIT with x is actually a

1175Imada, Fujimori, and Tokura: Metal-insulator transitions
superconductor-insulator transition. Above the super-conducting transition temperature, the normal metallicphase shows various unusual properties which are farfrom the standard Fermi-liquid behavior, especially forsmall x . These anomalous aspects will be described indetail below. The superconducting transition tempera-ture Tc has the maximum Tc;40 K around x;0.15 forLa22xSrxCuO4 and decreases with further doping. Thedoping concentration x5xm which shows the maximumTc is frequently called the optimum concentration whilethe region x,xm is called the underdoped region andx.xm the overdoped region. Anomalous metallic be-havior observed in the underdoped region graduallycrosses over to more or less standard Fermi-liquid be-havior in the overdoped region. Another point to bediscussed in the global phase diagram is the existence ofstructural phase transitions between the tetragonalstructure at high temperatures and the orthorhombicone at low temperatures, as illustrated in Fig. 118. Atx50, the transition occurs at around 560 K and itquickly decreases with increasing x . In the orthorhombicphase, the unit of octahedron CuO6 is slightly tilted in astaggered way. In the overdoped region, x.xm , Tc de-creases continuously at least up to x50.20 (see thephase diagram). On the other hand, the possibility ofphase separation and a discontinuity between under-doped and heavily doped regions around x50.20 on a
FIG. 118. The phase diagram of La22xSrxCuO4 in the plane ofthe doping concentration x and temperature T . The Neel tem-perature TN , superconducting transition temperature Tc ,transition temperature between high-temperature tetragonal(HTT) and low-temperature orthorhombic (LTO) structures,TTO , and spin-glass transition temperature Ts-glass are plottedfrom various experimental data (by courtesy of T. Sasagawaand K. Kishio).
Rev. Mod. Phys., Vol. 70, No. 4, October 1998
microscopic level was discussed by Fukuzumi et al.,(1996).
Below we discuss physical properties in the plane of xand T in more detail. The existence of antiferromagneticlong-range order below TN;300 K at x;0 is clearly ob-served in neutron-scattering experiments as well as inmagnetic susceptibility measurements. Other quantitiessuch as NMR and Raman scattering also show anoma-lies. The structure of the antiferromagnetic order wasdetermined by neutron-scattering experiments, as shownin Fig. 119. The driving force of the antiferromagneticorder is of course the superexchange interaction ofneighboring Cu spins mediated by intermediate states ofthe bridging 2ps orbital. The localized spins at the Cusite have a moment ;0.4mB , which is a consequence ofthe reduction due to a strong quantum effect and strongcovalency. The ordered spins are primarily aligned inthe basal CuO2 plane (Vaknin et al., 1987; Yamadaet al., 1987). To understand the detailed structure of theordering vector, however, we need to consider small tilt-ing of the CuO6 octahedron as well as the spin-orbitinteraction to generate a small Dzyaloshinski-Moriya in-teraction, which leads to an anisotropic interaction forthe ordering vector. This leads to a slight canting of thespin vector out of the CuO2 plane with a small ferromag-netic moment. (Fukuda et al., 1988; Kastner et al., 1988;Thio et al., 1988; Yamada et al., 1989; Koshibae, Ohta,and Maekawa, 1993, 1994).
Aside from this slight anisotropy, the basic magneticinteraction in the Mott insulating phase is well describedwithin the framework of the spin-1/2 Heisenberg model.The antiferromagnetic exchange interaction J deter-mined from two-magnon Raman scattering is J;1100 cm2151600 K (Lyons, Fleury, Remeika, Coo-per, and Negran, 1988; Cooper et al., 1990b; Tokura, Ko-shihara, et al., 1990), while J5135 meV, equivalent to1570 K, is identified from the dispersion in the neutron-scattering data (Aeppli et al., 1989), which has one of thelargest antiferromagnetic exchanges among d-electronsystems. There are two reasons for the large J . One isthat the transfer between the neighboring Cu dx22y2 or-
FIG. 119. The structure of the antiferromagnetic order inLa22xSrxCuO4. From Yamada et al., 1989.

1176 Imada, Fujimori, and Tokura: Metal-insulator transitions
bital and O2ps orbital tpd is large, ;1 eV because of thelarge overlap of these two orbitals. The second is thatthe level splitting D5u«d2«pu is relatively small,;1 –3 eV, as shown in Eqs. (2.11a)–(2.11d) and theparagraph below these equations. Then in the fourth-order perturbation, J may be large because it is propor-tional to tpd
4 /u«d2«pu3 when the Coulomb interaction atthe oxygen site, Upp , and the intersite Coulomb inter-action Vpd are neglected while Udd is taken largeenough. The Neel temperature TN is much smaller thanJ because of the strong two-dimensionality and resultingquantum fluctuation effects. In fact, in single-layer 2Dsystems, TN is theoretically expected to be zero, whilesmall interlayer exchange coupling drives TN to a finitetemperature. Short-ranged antiferromagnetic correla-tions are developed even well above TN , as observed inneutron-scattering experiments and NMR measure-ments. The growth of antiferromagnetic correlationswith decreasing temperature is qualitatively describedboth by a renormalization-group study of the nonlinearsigma model (Chakravarty, Halperin, and Nelson, 1989)and by a modified spin-wave theory (Takahashi, 1989) asdiscussed in the neutron-scattering results (Aeppli et al.,1989; Yamada et al., 1989; Keimer et al., 1992). (Theprefactor of the exponential dependence is not repro-duced by the spin-wave theory). At low temperaturesabove TN , as discussed in Sec. II.E.4, the antiferromag-netic correlation length is expected to grow as
j;0.27\c
2prsexpS 2prs
T D S 12T
4prs1¯ D (4.7)
with the spin stiffness constant rs.1.15J (Chakraverty,Halperin, and Nelson, 1989; Hasenfratz and Nieder-mayer, 1991, 1993). The experimentally observed tem-perature dependence of j appears to agree with theabove prediction of the nonlinear sigma model in therenormalized classical regime (Keimer et al., 1992; Bir-geneau et al., 1995). The energy dispersion of spin exci-tations determined by high-energy inelastic neutron-scattering experiments shows overall agreement with the
FIG. 120. Doping concentration dependence of antiferromag-netic correlation length j suggested by neutron scattering ofLa22xSrxCuO4 (Birgeneau et al., 1988). j appears to follow themean hole distance 3.8 Å/Ax .
Rev. Mod. Phys., Vol. 70, No. 4, October 1998
spin-wave theory of the Heisenberg model (Haydenet al., 1991b; S. Itoh et al., 1994).
When Sr, Ba, or Ca are substituted for La, as inLa22xAxCuO4 with A5Sr or Ba, holes are doped intoCuO2 planes. A remarkable feature of the hole doping isthat it causes a quick collapse of the antiferromagneticorder and a MIT. When the doping concentration is lowenough, the system is still insulating for x<0.05, as illus-trated in the phase diagram Fig. 118, while antiferro-magnetic long-range order is destroyed around x50.02, where the localization effect due to disorder isserious. For 0.02,x,0.05, the spin-glass state is realizedat low temperatures (see, for example, Chou et al.,1995). In any case, antiferromagnetic long-range order isabsent in the metallic region, x.0.05. The antiferromag-netic correlation length j becomes progressively shorterand shorter when the doping concentration is increased.In the early stage of neutron studies on La22xSrxCuO4,it was shown that j is approximately given by j;a/Ax ,where a is the lattice constant, and hence j is nothingbut the mean hole distance, as shown in Fig. 120 (Birge-neau et al., 1988).
In the metallic region x.0.05, the periodicity ofshort-ranged antiferromagnetic correlations is known to
FIG. 121. Short-ranged incommensurate spin correlation ob-served by neutron-scattering experiments for Im x(q,v) inLa22xSrxCuO4 above Tc at v53 meV taken from the scan Aillustrated in the top panel. The closed circles in the top paneldenote the peak positions of the incommensurate structure.The incommensurate peak observed above Tc (top panel) be-comes invisible below Tc (lower panel) at this energy v53 meV. From Yamada et al., 1995.

1177Imada, Fujimori, and Tokura: Metal-insulator transitions
shift from (p,p) to fourfold-incommensurate wave vec-tors @p(16d),p# and @p ,p(16d)# , as can be seen inFig. 121 (Yoshizawa et al., 1988; Thurston et al., 1989,1992; Cheong et al., 1991; Yamada, Endoh, et al., 1995;Yamada, Wakimoto, et al., 1995). The hole dopingquickly increases d at x.0.05 upon metallization; itseems that d approaches the value d5x at 0.05<x<0.1, as can be seen in Fig. 122 (Yamada et al., 1998).At x50.15 and 0.075, inelastic neutron-scattering ex-periments show that the width D, the peak heightS(Q ,v), and the intensity *dq S(q ,v) around the in-commensurate peak depend on temperature for the en-ergy v,4 meV, that is, the peak grows and is sharpenedwith lowering temperature when measured at T,100 K, while the incommensurate peak structure ismore or less independent of temperature for v>4 meV (Cheong et al., 1991; Thurston et al., 1992; Ya-mada, Wakimoto, et al., 1995) above Tc . This suggeststhat rather sharp incommensurate peaks grow only inthe low-energy range v,4 meV at x;0.15 due presum-ably to a Fermi-surface effect combined with imperfectbut finite nesting effects of the Fermi surface. Thisgrowth of incommensurate peaks may be ascribed to thegrowth of the coherent part of the magnetic response, asdiscussed in Secs. II.E.4 and II.F.10. Recent studies us-ing high-quality samples show that the incommensuratepeak decreases and disappears with decreasing tempera-tures below Tc at low energies (Mason et al., 1992, 1993;Yamada, Wakimoto, et al., 1995). This is consistent withthe opening of a superconducting gap at the incommen-surate wave number. The wave-number dependence ap-pears to be consistent with dx22y2 symmetry of the su-perconducting gap. Another remarkable feature belowTc is that the incommensurate peak grows and becomesmore prominent and sharpened on the high-energy side(*7 meV) with very long correlation length (.50 Å;Mason et al., 1996). This may be related to the compat-ibility of antiferromagnetic correlation, especially in thed-wave superconductor (see, for example, Assaad,Imada, and Scalapino, 1997; Assaad and Imada, 1997).
FIG. 122. The doping concentration (x) dependence of theincommensurability d [deviation of the peak position from(p,p)] in spin correlations observed in neutron-scattering ex-periments for La22xSrxCuO4 (Yamada et al., 1998). Incom-mensurability appears in the metallic phase. The inset showsthe half width at half-maximum G.
Rev. Mod. Phys., Vol. 70, No. 4, October 1998
An overall feature of Imx(q ,v) for La2CuO4 andLa1.85Sr0.15CuO4 up to high energies was measured byhigh-energy pulsed neutron inelastic scattering (Ya-mada, Endoh, et al., 1995; Hayden et al., 1996). Themagnetic scattering intensities around (p,p) due to anti-ferromagnetic fluctuations were clearly observed up tov5120 meV. In addition, when the nonmagnetic com-ponent was subtracted, the magnetic signals remainedup to 300 meV.
Here, it should be noted that a careful analysis of theneutron and NMR data is required for interpretation ofspin fluctuations. As clarified in Secs. II.E.4 and II.F.10,the dynamic spin susceptibility is phenomenologicallygiven as the sum of coherent and incoherent contribu-tions. Although the coherent part may depend on tem-perature due to the Fermi-surface effect, the antiferro-magnetic correlation length j must be determined fromthe incoherent part, and it appears to be temperatureinsensitive, as discussed in Sec. II.E.4. The incoherentcontribution becomes more and more dominant over thecoherent contribution as the doping concentration islowered.
At low doping concentration, *Imx(q,v)dq follows asingle-parameter scaling
E Im x~q ,v!dq5g~bv!, (4.8)
with g(x);12e2x or tanh x as in Fig. 123 (Keimeret al., 1992; Hayden et al., 1991a). The same scaling wasalso observed in a YBa2Cu3O72y compound, as dis-cussed in Sec. IV.C.3. As discussed in Secs. II.E.4 andII.G.2, this scaling is consistent with both a marginalFermi liquid (see Sec. II.G.2; Varma et al., 1989) and aview in terms of a totally incoherent response as in Eqs.(2.294) and (2.362) (see Secs. II.F.10 and II.E.4; Imada,1994a; Jaklic and Prelovsek, 1995a). It should be notedthat this single-parameter scaling is experimentally notsatisfied at higher doping at low temperatures (Matsudaet al., 1994). A general tendency appears to be that the
FIG. 123. Single-parameter scaling of * Im x(q,v)dq for vari-ous choices of T and v for La1.96Sr0.04CuO4. From Keimeret al., 1992.

1178 Imada, Fujimori, and Tokura: Metal-insulator transitions
single-parameter scaling by bv is satisfied in the regionof incoherent charge dynamics at low doping or at hightemperatures, namely at T.Tcoh (see Fig. 34), which isconsistent with the region of incoherent charge and spindynamics discussed in the theoretical argument in Secs.II.E.4 and II.F.10. In addition, it is clear that this single-parameter scaling is not satisfied when the supercon-ducting gap (or pseudogap with nodes) is open, as isobserved by (Yamada, Wakimoto, et al., 1995). The scal-ing appears not to be satisfied in the pseudogap regionabove Tc in the Y compounds, as discussed in Sec.IV.C.3. However, the boundary of the region of single-parameter scaling by bv in the plane of x and T has notyet been completely clarified experimentally, although itis important to establish the correct interpretation andtheory.
When the doping concentration x is around 1/8,La22xBaxCuO4 and La22xSrxCuO4 are known to showanomalies in their transport properties. In particular,La22xBaxCuO4 with x;0.125 shows a marked decreasein Tc as compared with the other region, and it becomeseven insulating in the region close to x50.125. This maybe due to the charge ordering of doped holes accompa-nied by spin ordering, as observed by muon (Kumagaiet al., 1994), nuclear quadrupole resonance, andneutron-scattering measurements. The periodicity of thecharge ordering is commensurate to the CuO2 latticestructure. In particular, recent neutron measurementsfor La1.62xNd0.4SrxCuO4 at around x50.12 showed thata commensurate charge- and spin-ordered stripe phaseis stabilized (Tranquada, Sternlieb, et al., 1995).
Nuclear magnetic resonance provides us with anotherpowerful tool for investigating spin correlations inLa22xMxCuO4. The longitudinal relaxation time ofnuclear magnetization, T1 , is inversely proportional tothe dynamic spin susceptibility as
1T1
5gn
2kBT
2mB2 (
q(
a5x ,yuAq
au2Im xaa~q ,v0!
v0, (4.9)
where v0 is the frequency of the NMR field applied inthe z direction. The frequency v0 is usually very smalland it may be viewed as the limit v→0 for the magneticresponse in which we are interested. The shift of theNMR frequency due to the hyperfine interaction be-tween nuclei and electrons, called the Knight shift K , isgiven as the sum of the orbital part Korb and the spinpart Kspin . The spin part is given by
Kspin51
mBAq50Re x~q50,v50 !, (4.10)
where x(q50,v50) is the uniform magnetic suscepti-bility. Korb is usually assumed to be temperature inde-pendent. For the isolated Cu21 ion, anisotropy of thedx22y2 wave function causes very anisotropic Korb ,which well accounts for the experimental data (Taki-gawa et al., 1989). The nuclear form factor Aq is deter-mined from the hyperfine interaction. The anisotropybetween Aq50
c and Aq50ab is accounted for by considering
a transferred hyperfine interaction through the hybrid-
Rev. Mod. Phys., Vol. 70, No. 4, October 1998
ization of the 4s orbital and the Wannier orbital ofdx22y2 extended to the neighboring site, as proposed byMila and Rice (1989). The q dependence of the nuclearform factor Aq has a large weight around q5(p ,p) forthe Cu site, while the weight around q5(p ,p) is vanish-ing in the case of Aq at the in-plane O site. At the Cusite, the nuclear form factor is such that the antiferro-magnetic fluctuation around (p,p) is selectively pickedup in 1/T1 .
Comprehensive measurements of the NMR nuclearspin-lattice relaxation time T1 at the Cu site were per-formed in the range 0<x,0.15 and T<900 K, as shownin Fig. 124 (Imai et al., 1993). At the moment its inter-pretation is not unique. However, at least several pointsshould be noted concerning on the T1 results. For themother material La2CuO4, 1/T1 shows striking enhance-ment with decreasing temperature, in agreement withthe exponential growth of the antiferromagnetic corre-lation length j in the renormalized classical regime ofthe nonlinear sigma model. As doping proceeds, the en-hancement of 1/T1 is rapidly suppressed, giving way tomore or less temperature independent 1/T1 for T.100–200 K with gradual crossover to 1/(T1T);constat lower temperatures for x;0.1–0.15. This temperaturedependence has been interpreted from several differentviewpoints. One interpretation is that 1/(T1T) followsthe Curie-Weiss law 1/(T1T);C/(T1Q) [see Eq.(2.115)] which comes from a temperature-dependent an-tiferromagnetic correlation length j; 1/AT1Q , as dis-cussed in Secs. II.D.1 and II.D.8 and stressed by spin-fluctuation theories (Millis, Monien, and Pines, 1990;Moriya, Takahashi, and Ueda, 1990). Another is the in-terpretation from marginal Fermi-liquid theory (see Sec.II.G.2) where Im x;tanh bv is consistent with 1/T1;const for T.200 K at d;0.1–0.15. The NMR data arealso consistent with the discussion of the neutron dataabove when we take the limit v0→0. A completely dif-
FIG. 124. Temperature dependence of inverse of NMRnuclear spin-lattice relaxation time T1 at the Cu site forLa22xSrxCuO4: filled circle, x50; open circle, x50.04; opensquare, x50.075; filled square, x50.15. The inset shows thescaling in the insulating phase. From Imai, Slichter,Yoshimura, and Kosuge, 1993.

1179Imada, Fujimori, and Tokura: Metal-insulator transitions
ferent interpretation related to the marginal Fermi-liquid hypothesis is that the dynamic structure factorS(q,v) is basically temperature independent and thetemperature dependence of Im x(q,v)5(12e2bv)S(q,v)comes solely from the Bose factor 12e2bv, as suggestedfrom the temperature-independent j and the incoherentcharacter of spin correlations in numerical studies(Imada, 1994a; Jaklic and Prelovsek, 1995b). This view-point is discussed in Secs. II.E.4 and II.F.10. The cross-over from 1/T1;const to 1/(T1T);const has been at-tributed to the crossover from the incoherent charge andspin dynamics to coherent dynamics, which are sepa-rated by an anomalously suppressed coherence tempera-ture Tcoh as discussed in Sec. II.F.10. 1/T1 at site O doesnot show appreciable influence from antiferromagneticfluctuations because of the vanishing contribution fromthe part around (p,p), as is evident from the nuclearform factor of the oxygen site. This is more or less welldescribed by Korringa-type behavior 1/(T1T);constover a wide range of temperatures. However, a puzzleremains in the temperature dependence when the peakis at deeply incommensurate wave numbers, because theNMR at Cu and O sites both show a substantial contri-bution from those incommensurate wave numbers, whilethe temperature dependences of those sites are differ-ent.
The Gaussian decay rate 1/TG associated with thenuclear spin-spin relaxation time measures the real partof the static spin susceptibility x(q,v50). In particular,1/TG at the Cu site was measured in Tl2Ba2CuO61d ,YBa2Cu3O72y , and YBa2Cu4O8, which selectively picksup x(Q) with the staggered wave vector Q5(p ,p). Ex-cept for the pseudogap region discussed below, the scal-ing 1/(T1T)}x(Q);(1/TG)2 was suggested in a limitedtemperature range around 200 K (Y. Itoh et al., 1994b;Y. Itoh, 1994). This behavior again can be interpreted intwo ways. From the viewpoint of spin-fluctuation theo-ries, this scaling is due to Eqs. (2.114) and (2.115), wherex(Q)}(T1T)21 is satisfied in 2D. The other interpreta-tion is that both x(Q,v50) and Imx(q,v)/v are basi-cally scaled by the above-mentioned Bose factorlimv→0@(12e2bv)/v# , which leads to similar behaviorbetween x(Q) and Imx(Q,v). This is because the factorb also remains for Rex after the Kramers-Kronig trans-formation for T not much smaller than the frequencycutoff for the main contribution of Im x. Since TG andT1 do not seem to follow a universal relation over awide temperature range, the scaling does not uniquelydetermine the mechanism.
The uniform magnetic susceptibility x(q50,v50)can be measured by bulk magnetization measurementsas well as by the Knight shift. In an undoped compound,it has a pronounced peak at high temperatures >1000 Kand decreases with decreasing temperatures, in agree-ment with the behavior of the 2D Heisenberg model(Okabe and Kikuchi, 1988). When carriers are doped,the peak temperature Tx decreases (Tx;400–500 K atd;0.15). However the peak structure with a rather re-markable decrease at lower temperatures is retained, asshown in Fig. 125 (Johnston, 1989; Takagi, Ido, et al.,
Rev. Mod. Phys., Vol. 70, No. 4, October 1998
1989; Takagi, Uchida, and Tokura, 1989; Nakano et al.,1994). The peak structure and decrease at low tempera-tures appear to be more pronounced in the low-dopingregion d;0.1 than in the undoped case. The doping de-pendence of the peak temperature Tx is similar to thecrossover temperature TH where the Hall coefficientshows a sharp increase with decreasing temperature, asdiscussed below. As a possible interpretation, thisanomaly was analyzed as the effect of preformed singletpairing fluctuations or antiferromagnetic fluctuations(Imada, 1993a, 1994b) which start below Tx in the me-tallic region as is discussed in Sec. IV.C.3.
This ‘‘pseudogap’’ behavior is seen in other quantitiessuch as the specific heat g. From far above Tc , g andhence the electronic entropy itself are anomalously sup-pressed in the low-doping region as in Fig. 126. (Loramet al., 1997). The crossover temperature Tg is above 300K at low doping. This suppression of g at low tempera-tures T!Tg in the underdoped region was also pointed
FIG. 125. Temperature dependence of the uniform magneticsusceptibility of La22xSrxCuO4 for various x . From Nakanoet al., 1994.
FIG. 126. Temperature dependence of specific heat g forLa22xSrxCuO4. The numbers indicate the doping concentra-tion in % (Loram et al., 1997). The entropy is released athigher temperatures at lower dopings.

1180 Imada, Fujimori, and Tokura: Metal-insulator transitions
out by Wada, Nakamura and Kumagai (1991) and byNishikawa, Takeda, and Sato (1994). It is in striking con-trast with the critical enhancement of g for (La,Sr)TiO3discussed in Sec. IV.B.1. From the specific-heat data, alarge entropy remaining above Tg&Tx is suggested fromthe picture of a mass-diverging Mott transition at highertemperatures with crossover to vanishing carrier numberbelow Tg due to the formation of a pseudogap, as dis-cussed in Sec. II.F (Imada, 1993a, 1994b). This means acrossover of the scaling for the MIT between two differ-ent universality classes. We discuss the pseudogap be-havior and the significance of Tx and Tg in greater detailfor the case of Y compounds in Sec. IV.C.3.
The transport properties of this compound are alsounusual in terms of standard Fermi-liquid theory (see,for other reviews, Iye, 1990; Ong, 1990). One of the mostunusual properties is the temperature dependence of theresistivity. As we have discussed in Sec. II.D.1, standardFermi-liquid theory predicts that the temperature de-pendence of the resistivity r is given as r5r01AT2 [seeEq. (2.83)] with correlation effects contained in the T2
term. In contrast to this, this compound especiallyaround optimum doping x;0.15 shows robust T-linear
FIG. 127. Temperature dependence of the in-plane resistivityfor various doping concentrations of La22xSrxCuO4 for singleand poly crystals (Takagi et al., 1992a) T-linear resistivity isseen in a wide region.
Rev. Mod. Phys., Vol. 70, No. 4, October 1998
dependence, r;r01A8T , in a wide range from Tc to800 K, as shown in Fig. 127. The residual resistivity r0appears to vanish for samples of higher quality. ThisT-linear behavior is widely observed in other high-Tccuprates around optimum doping. In the overdoped re-gion, the resistivity roughly follows the form
r5r01A9Tp, (4.11)
with 2>p.1, where p increases with increasing doping(Takagi, Batlogg, et al., 1992a). In the underdoped re-gion, r has a feature around Tx , in which the linear lawr;r01A8T changes slope: A8 increases and r0 de-creases in going from the high-temperature region T.Tr.Tx to below Tr , as shown in Fig. 127. Recentmeasurements of r at low temperatures in the under-doped region revealed that r eventually shows insulatingbehavior (logarithimic T dependence) at sufficiently lowtemperatures if the superconductivity is suppressed(Ando et al., 1995).
Various mechanisms for this T-linear behavior havebeen proposed. We discuss here only some of these sug-gestions. Although the mechanism is not yet fully under-stood, it is useful to list some of the proposed ap-proaches to make connections with the recent extensivetheoretical efforts discussed in Sec. II.
From the Fermi-liquid point of view, the spin fluctua-tion theory discussed in Secs. II.D.1 and II.D.8 ascribesthis behavior to control of the carrier relaxation time tby the scattering of carriers (quasiparticles) by paramag-netic excitations. The T-linear resistivity in this ap-proach is obtained in Eq. (2.121) and, as discussed in thederivation of (2.121), is ascribed to the contribution ofantiferromagnetic excitations which follows the Curie-Weiss form (2.114) (Millis, Monien, and Pines, 1990;Moriya, Takahashi, and Ueda, 1990). Near the criticalpoint, Q;0, Im S and hence the inverse relaxation timeof the quasiparticles becomes proportional to T follow-ing the form of Eqs. (2.110), (2.111), and (2.114).
In the scenario of spin-charge separation, discussed inSec. II.D.7, the slave-boson approximation with cou-pling between spinons and holons treated by the gaugefield leads to the T-linear resistivity due to the incoher-ent character of the holons. (Ioffe and Wiegmann, 1990;Ioffe and Larkin, 1989; Lee and Nagaosa, 1992). TheT-linear resistivity is also obtained from marginalFermi-liquid theory, where Im S is indeed proportionalto T , as discussed in Sec. II.G.2.
As discussed in Sec. II.E.1, recent numerical results ofan exact diagonalization for the 2D t-J model by Jaklicand Prelovsek (1995a) succeeded in reproducing thisT-linear behavior; the prefactor A8 was in quantitativeagreement with the experimental data shown in Fig. 127,although the temperature achieved by the numericalmethod was at least a few hundred K. It was suggestedthat this T-linear resistivity could be due solely to inco-herent charge dynamics, which should be observedabove the coherence temperature of the carriers. Theconductivity is in fact consistent with incoherent chargedynamics of the form (2.274) with a broad C(v), of the

1181Imada, Fujimori, and Tokura: Metal-insulator transitions
order of an eV, which implies that the current-currentcorrelation decays very quickly over the time scaleeV21. Such anomalous suppressions of coherence areconsistent with the anomalous criticality of the Motttransition with the large dynamic exponent z54, as dis-cussed in Sec. II.E.9 (Imada, 1995b; see Sec. II.F.9).
The anisotropy of the resistivity shows another un-usual property. The resistivity in the CuO2 plane, rab , issmaller by a factor of 200 than that along the c axis(out-of-plane), rc , at optimum doping in the room-temperature region (Ito et al., 1991). The anisotropy in-creases for smaller x as well as for smaller T . Becausethe LDA calculation predicts a mass anisotropy of only28 (Allen, Pickett, and Krauer, 1987), this large anisot-ropy has to be ascribed to strong electron correlations.Even more remarkable is that, in the low-doping andlow-temperature region, there exists a region where rabshows metallic while rc shows insulating temperaturedependence. Roughly speaking this region is T,Tr . Wediscuss the anisotropy of r further in Sec. IV.C.3.
The Hall coefficient RH also shows anomalous char-acter in terms of standard Fermi-liquid theory. In thestandard theory of weakly correlated systems, RH is in-dependent of temperature, and the amplitude is given byRH;1/nec with carrier density n . However, at low tem-peratures, the observed RH in this compound is hole-like, that is, positive with large amplitude roughly scaledby 1/x for x,0.3, as shown in Fig. 128 (Ong et al., 1987;Takagi, Ido, et al., 1989). This contradicts a naive expec-tation from the Fermi-liquid picture because the carriernumber is given by 12x when the Luttinger theorem issatisfied and the carrier should be electronlike. The signof RH is determined from the average of the curvatureover the Fermi surface in the weak-correlation pictureand therefore the sign itself can be determined from asubtle balance of the electronic band structure. How-
FIG. 128. Doping concentration dependence of the Hall coef-ficient at low temperatures for La22xSrxCuO4 andNd22xCexCuO4. Shaded windows show the superconductingphase at low temperatures (Uchida et al., 1989). RH roughlyfollows 1/x in the underdoped region.
Rev. Mod. Phys., Vol. 70, No. 4, October 1998
ever, the large amplitude in the underdoped region ishard to explain from this approach. It has turned outthat the temperature dependence of RH is even morepeculiar because a large positive RH quickly decreasesabove a certain crossover temperature TH.Tx , asshown in Fig. 129 (Nishikawa, Takeda, and Sato, 1993,1994; Hwang et al., 1994). The crossover temperatureTH is close to Tx for the uniform susceptibility and bothshow similar x dependence. Above TH.Tx , RH decaysto a small amplitude consistent with the large Luttingervolume given by 12x . As discussed above, this cross-over at TH was predicted to occur due to the gradualformation and fluctuations of a preformed singlet pairbelow TH , as discussed in Sec. II.E.1 (Imada, 1993a,1994b, 1995b), although the interpretation of the ob-served behavior has not been uniquely established. Inother words, the crossover at TH reflects a change in thecharacter and the universality class of the Mott transi-tion at small x , as discussed above for the anomalies ofthe specific heat Tg and the susceptibility Tx . Anotherinterpretation of the existence of TH is the anomalousHall effect due to skew scattering arising from antiferro-magnetic fluctuations. The effect of nesting has been dis-cussed as the source of an anomalous contribution to RHthrough a process similar to the Aslamazov-Larkin pro-cess in superconducting fluctuations (Miyake andNarikiyo, 1994a).
The optical conductivity s(v) shows a spectacularchange with increasing doping concentration, as illus-trated in Fig. 130 (Uchida, et al., 1991). A charge-transfer gap of the order of 1.5–2 eV is clearly observedin La2CuO4, although it is accompanied by a tail up to;1 eV whose origin is not uniquely identified. Upondoping, the spectral weight is transferred from the re-gion above the CT gap to the lower-frequency region. Inthe low-doping region, it appears to develop a broadstructure around or below 0.5 eV, which is replaced by
FIG. 129. Temperature dependence of the Hall coefficient forLa22xSrxCuO4 (Nishikawa, Takeda, and Sato, 1994). The thinline represents the nominal value of 1/nec at n51 per Cu.Strong temperature dependence is seen in the underdoped re-gion.

1182 Imada, Fujimori, and Tokura: Metal-insulator transitions
an overall 1/v dependence upon further doping. To un-derstand the v dependence, two phenomenological ap-proaches have been attempted using extended Drudeanalyses (Thomas et al., 1988; Collins et al., 1989; see fora review Tajima, 1997). In the first approach, s(v) is fitwith a single-oscillator model, while in the other ap-proach a two-oscillator model has been employed. Theadvantage of the single-oscillator model is that theparameters—namely, the effective plasma frequencyvp* 54pne2/m* (v) and the relaxation time t(v)—areuniquely determined by assuming an v-dependent effec-tive mass m* and t, while the interpretation of the vdependence is not straightforward for doped samplesbecause of the mid-IR structure. On the other hand, thetwo-oscillator model fits the data better, while the pa-rameters are not uniquely determined. Because themid-IR peak is absent in an untwinned Y compound, thetwo-oscillator model probably needs to take account ofthe impurity localization effect and polaron effects(Thomas et al., 1991). In any case, the overall 1/v depen-dence and the 1/T dependence at v50 are consistentwith the form (2.274) and (2.275) with weak v and Tdependence for C(v). The consistency of this form withnumerical results is discussed in Sec. II.E.1. The connec-tion to the scaling theory of the Mott transition and themarginal Fermi-liquid theory are given in Secs. II.F.9and II.G.2, respectively. An important point is that ex-perimental data that are well described by the form(2.274) with weakly v-dependent C(v) should be theconsequence of incoherent charge dynamics with thecomplete lack of the true Drude weight. We discuss thisincoherence further in the case of Y compounds in Sec.IV.C.3. The out-of-plane conductivity sc(v) shows dif-ferent charge dynamics from the in-plane one. A chargegap is developed from T above Tc (Tamasaku, Naka-mura, and Uchida, 1992). Below Tc , it is rather difficultto observe the superconducting gap in the in-planesa ,b(v), because the reflectivity is almost 100% aroundthe gap energy, even in the absence of the superconduct-
FIG. 130. The in-plane optical conductivity s(v) at room tem-perature for various choices of x in La22xSrxCuO4. FromUchida et al., 1991.
Rev. Mod. Phys., Vol. 70, No. 4, October 1998
ing gap. Since the c-axis reflectivity is lower, it is easierto distinguish from the gap region with 100% reflectiv-ity. Because the cuprate superconductors can be viewedas layered superconductors of CuO2 sheets coupledweakly by Josephson tunneling through the interlayercoupling, the plasma frequency vp of this Josephson-coupled system may have a smaller value than the su-perconducting gap D if the Josephson coupling is weak.This situation, vp,D , is in sharp contrast with the usualcase where vp.0.5 eV@D is satisfied. Because vp is inthe gap region, the Josephson plasma oscillation hardlydecays. Various exotic electromagnetic phenomena dueto this low vp were predicted by Tachiki, Koyama, andTakahashi (1994).
Below we shall discuss the electronic structure studiedby first-principles calculations together with results ofspectroscopic measurements. This compound is one ofthe hardest cases for reproducing the correct electronicstates by band-structure calculation because of strong-correlation effects and strong p-d covalency. In order toexplain the antiferromagnetic insulating state of the par-ent compound La2CuO4, standard LDA calculations areinsufficient. The insulating state was correctly predictedby LDA1U calculations (Anisimov et al., 1992), self-interaction-corrected (SIC)-LDA calculations (Svaneand Gunnarsson, 1988a; Temmerman et al., 1993), andparametrized Hartree-Fock calculations (Grant and Mc-Mahan, 1991). The effect of hole doping on an antifer-romagnetic insulator, however, is usually beyond thescope of these band-structure calculations. The elec-tronic structure of La22xSrxCuO4 with static (self-trapped) holes was studied by Anisimov et al. (1992) us-ing the LDA1U method applied to supercellcalculations. They showed that, even without lattice dis-tortion, a hole is self-trapped within a small ferromag-netic region where antiferromagnetic order is destroyedby the doped hole. Then a localized state is split off fromthe top of the valence band into the band gap. In spite ofthe structural simplicity and the presence of a well-defined parent insulator, La22xSrxCuO4 is complicatedin that doped holes enter not only the px ,y-dx22y2 anti-bonding orbitals of the CuO2 plane but also the pz or-bitals of the apical oxygen hybridized with the Cu 3dz2
orbital, as suggested theoretically (Kamimura and Suwa,1993) and observed experimentally (Chen et al., 1992).
Experimentally, hole doping in La2CuO4 induces anew spectral weight (the so-called ‘‘in-gap spectralweight’’) within the charge-transfer gap, as first revealedby oxygen 1s core absorption spectroscopy (Romberget al., 1990; Chen, Sette, et al., 1991). The in-gap spectralweight is distributed mostly above EF , coming largelyfrom the doped holes themselves (as d9LI→d9 spectralweight) but is also transferred from the upper Hubbardband (d9→d10 spectral weight). A theoretical interpre-tation of the doping-induced spectral weight transferabove EF is beyond the framework of the t-J model,since the model has no upper Hubbard band. Spectralweight transfer has been studied using a strong-couplingtreatment (i.e., perturbation with respect to t/U) of theHubbard model (Eskes and Oles, 1994; Eskes et al.,

1183Imada, Fujimori, and Tokura: Metal-insulator transitions
1994) and using numerical simulations of Hubbard clus-ters (Dagotto et al., 1991; Li et al., 1991; Bulut et al.,1994a). Decrease of the spectral weight below EF occursin the Zhang-Rice singlet band @d9→d9LI (1A1g) spec-tral weight], which was regarded as the effective lowerHubbard band when the high-energy part of the originalp-d Hamiltonian is projected out and the Hubbardmodel or the t-J model is employed as the effective low-
FIG. 131. Density of states of La22xSrxCuO4 . (a) Photoemis-sion and inverse-photoemission spectra near the Fermi level(Ino et al., 1997c); (b) Schematic representation of the evolu-tion of spectral weight with hole doping.
Rev. Mod. Phys., Vol. 70, No. 4, October 1998
energy Hamiltonian. The decrease in the spectral weightof the Zhang-Rice singlet with hole doping is not easy todetect because of the overlapping intense oxygen 2pband. Figure 131(a) shows combined photoemission andinverse-photoemission spectra of La22xSrxCuO4 (Inoet al., 1997c). The doping-induced spectral weight is notconcentrated just above EF , as suggested by previousx-ray absorption studies, but is distributed over thewhole band-gap region with the DOS peak ;1.5 eVabove EF . Thus spectral weight transfer occurs over arelatively wide energy range, within a few eV of EF , andthe Fermi level is located at a broad minimum of theDOS, as schematically shown in Fig. 131(b). The spec-tral DOS at EF is much weaker than that given by LDAband-structure calculations even for optimally dopedand overdoped samples, indicating that the quasiparticleweight is very small: Z!1. In underdoped samples,there is even a pseudogap feature at EF , which evolvesinto the insulating gap at x50.
The EF or the electron chemical potential inLa12xSrxCuO4 deduced from the shifts of various corelevels exhibits an interesting behavior as a function of x(Ino et al., 1997a). The chemical potential is shifteddownward with hole doping as expected, but the shift isfast in the overdoped regime (x&0.15) and slow in theunderdoped regime (x*0.15), as shown in Fig. 132. Itappears that ]m/]x becomes vanishingly small within ex-perimental errors for small x , implying a divergence ofcharge compressibility/susceptibility towards x;0 aspredicted by Monte Carlo simulation studies of the 2D
FIG. 132. Chemical potential shift as a function of hole con-centration in La22xSrxCuO4 (Ino et al., 1997a). Shifts expectedfrom band-structure calculation and the gT term in specificheat (which is proportional to the quasiparticle DOS at EF)are also plotted in (b).

1184 Imada, Fujimori, and Tokura: Metal-insulator transitions
Hubbard model (Otsuka, 1990; Furukawa and Imada,1993). This is also consistent with the scaling theory withthe dynamic exponent z54 (see Sec. II.F). On the otherhand, the electronic specific-heat coefficient g is de-creased towards x;0 (Momono et al., 1994), meaningthat the effective mass of conduction electrons decreasesas discussed above. In the overdoped region, the resultsof the chemical potential shift and the electronic specificheat are consistently interpreted within Fermi-liquidtheory if the quasiparticle–quasiparticle repulsion is as-sumed to be Fs
0;7. In the underdoped region, Fs0 has to
be assumed small or even negative: Fs0→21 if ]m/]x
→0, invalidating the original Fermi-liquid assumption.Because the measurements were made in the normalstate, the results indicate that the normal state of theunderdoped cuprates is not a Fermi liquid but has a(charge) pseudogap at EF . This observation would beclosely related to other aspects of pseudogap behavior inthe underdoped region discussed above as well as inSecs. IV.C.3 and IV.C.4. In accord with other measure-ments of the pseudogap discussed in other part of Sec.IV.C, possible microscopic mechanisms for the observedbehavior may be (i) preformed Cooper pair fluctuationsabove Tc , (ii) spinon pairing in the resonating valencebond scenario, (iii) antiferromagnetic spin fluctuationsstrong enough to destroy Fermi-liquid behavior, and (iv)fluctuations of spin-charge stripes. Concerning of (iv),Zaanen and Oles (1996) argued that spin-charge stripespin the chemical potential for low hole concentrations ifthe stripes become static and may continue to do soeven if the stripes are dynamic.
2. Nd22xCexCuO4
Since the discovery of electron-doping-induced super-conductivity in R22xCexCuO4, where R may be Pr, Nd,Sm, or Eu (Tokura, Takagi, and Uchida, 1989), the ex-istence of high-Tc superconductivity for both hole andelectron doping has imposed a strong constraint on itsmechanism (Anderson, 1992). R22xCexCuO4 has the so-called T8 structure (Fig. 133) in which the single CuO2sheet without apical oxygen is sandwiched by fluorite-type (R ,Ce)2O2 block layers. The Ce ion in the fluorite-type block is tetravalent (41), and hence Ce doping (x)changes the band filling in the opposite direction to thatin the so-called hole-doped superconductors such asLa22xSrxCuO4. In other words, high-Tc superconductiv-ity emerges irrespective of the increase or decrease inband filling from the CuO2-based half-filled Mott insula-tor. Electron doping can only be performed for this typeof square CuO2 sheet without apical oxygens, while thepyramidal or octahedral CuO2 sheet with apical oxygensor halogens are mostly hole-dopable (Tokura andArima, 1990; Tokura 1992a, 1992b), probably due toelectrostatic reasons (i.e., Madelung-type energy originsfrom the valence change of Cu or O).
In spite of extensive studies on normal and supercon-ducting properties in these electron-doped supercon-ductors, much less physics has been clarified than in thecases of their hole-doped counterparts. This is simply
Rev. Mod. Phys., Vol. 70, No. 4, October 1998
because high-quality filling-controlled single crystals (inthe sense of oxygen stoichiometry and distribution) havebeen difficult to prepare. In particular, only minute oxy-gen nonstoichiometry is determinant not only for theappearance of superconductivity but for normal-statetransport and magnetic properties. For example, the 24–25-K superconductivity is known to show up around x50.15 for Nd22xCexCuO4 and Pr22xCexCuO4, onlywhen the compound is subject to a thermal annealingprocedure under reducing conditions (Takagi, Uchida,and Tokura, 1989). In these compounds, the oxygen sto-ichiometry corresponding to increase of Dy'0.01 is suf-ficient to quench superconductivity completely (Idemotoet al., 1990; Suzuki et al., 1990). This implies that minuteoxygen interstitials positioned on other than the in-planeO(2) sites (Fig. 133) may serve as very effective carrierscatterers or localization centers, in contrast with theother cases where slight oxygen offstoichiometry playsthe role of fine filling control (see Sec. IV.B). Accordingto single-crystal neutron-diffraction structural studies(Radaelli et al., 1994; Schultz et al., 1996), it is probablethat in as-grown crystals without a reducing procedureinterstitial oxygens may sit on the apical O(3) site imme-diately above the Cu site.
Keeping in mind the remarkable but still puzzling roleof minute oxygen interstitials, let us survey the MIT-related properties in R22xCexCuO4 (where R5Nd andPr). Figure 134 (Matsuda et al., 1992) shows the evolu-tion of 3D antiferromagnetic (AF) spin order (TN5160 K) for an as-grown Nd22xCexCuO4 (x50.15)crystal (nonsuperconducting) and its near disappearancefor the reduced crystal (24-K superconducting). The(1,0,1) Bragg-peak intensity is contributed to by both Cuand Nd moments and its decrease below 50 K is due tothe onset of the Nd spontaneous moment. By the de-composition procedure with the respective form factors,the saturation Cu moment at the lowest temperaturewas estimated as around 0.2mB or less (Matsuda et al.,
FIG. 133. Crystal structure of T8 phase.
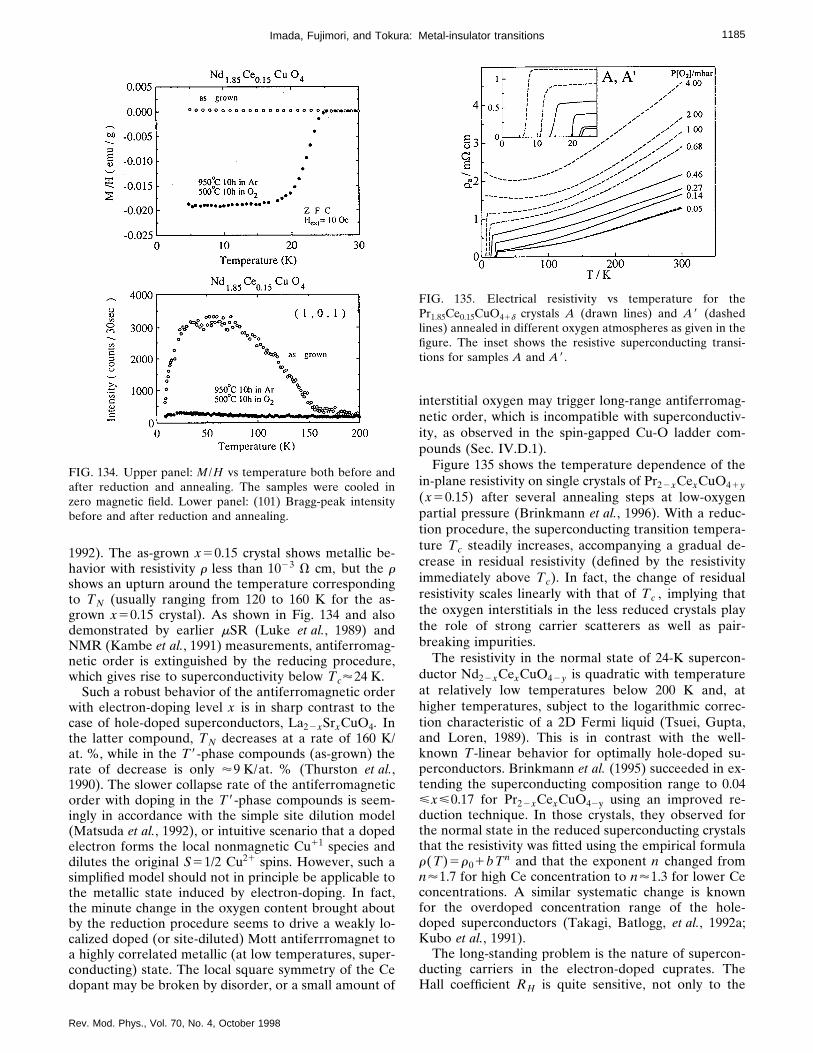
1185Imada, Fujimori, and Tokura: Metal-insulator transitions
1992). The as-grown x50.15 crystal shows metallic be-havior with resistivity r less than 1023 V cm, but the rshows an upturn around the temperature correspondingto TN (usually ranging from 120 to 160 K for the as-grown x50.15 crystal). As shown in Fig. 134 and alsodemonstrated by earlier mSR (Luke et al., 1989) andNMR (Kambe et al., 1991) measurements, antiferromag-netic order is extinguished by the reducing procedure,which gives rise to superconductivity below Tc'24 K.
Such a robust behavior of the antiferromagnetic orderwith electron-doping level x is in sharp contrast to thecase of hole-doped superconductors, La22xSrxCuO4. Inthe latter compound, TN decreases at a rate of 160 K/at. %, while in the T8-phase compounds (as-grown) therate of decrease is only '9 K/at. % (Thurston et al.,1990). The slower collapse rate of the antiferromagneticorder with doping in the T8-phase compounds is seem-ingly in accordance with the simple site dilution model(Matsuda et al., 1992), or intuitive scenario that a dopedelectron forms the local nonmagnetic Cu11 species anddilutes the original S51/2 Cu21 spins. However, such asimplified model should not in principle be applicable tothe metallic state induced by electron-doping. In fact,the minute change in the oxygen content brought aboutby the reduction procedure seems to drive a weakly lo-calized doped (or site-diluted) Mott antiferrromagnet toa highly correlated metallic (at low temperatures, super-conducting) state. The local square symmetry of the Cedopant may be broken by disorder, or a small amount of
FIG. 134. Upper panel: M/H vs temperature both before andafter reduction and annealing. The samples were cooled inzero magnetic field. Lower panel: (101) Bragg-peak intensitybefore and after reduction and annealing.
Rev. Mod. Phys., Vol. 70, No. 4, October 1998
interstitial oxygen may trigger long-range antiferromag-netic order, which is incompatible with superconductiv-ity, as observed in the spin-gapped Cu-O ladder com-pounds (Sec. IV.D.1).
Figure 135 shows the temperature dependence of thein-plane resistivity on single crystals of Pr22xCexCuO41y(x50.15) after several annealing steps at low-oxygenpartial pressure (Brinkmann et al., 1996). With a reduc-tion procedure, the superconducting transition tempera-ture Tc steadily increases, accompanying a gradual de-crease in residual resistivity (defined by the resistivityimmediately above Tc). In fact, the change of residualresistivity scales linearly with that of Tc , implying thatthe oxygen interstitials in the less reduced crystals playthe role of strong carrier scatterers as well as pair-breaking impurities.
The resistivity in the normal state of 24-K supercon-ductor Nd22xCexCuO42y is quadratic with temperatureat relatively low temperatures below 200 K and, athigher temperatures, subject to the logarithmic correc-tion characteristic of a 2D Fermi liquid (Tsuei, Gupta,and Loren, 1989). This is in contrast with the well-known T-linear behavior for optimally hole-doped su-perconductors. Brinkmann et al. (1995) succeeded in ex-tending the superconducting composition range to 0.04<x<0.17 for Pr22xCexCuO42y using an improved re-duction technique. In those crystals, they observed forthe normal state in the reduced superconducting crystalsthat the resistivity was fitted using the empirical formular(T)5r01bTn and that the exponent n changed fromn'1.7 for high Ce concentration to n'1.3 for lower Ceconcentrations. A similar systematic change is knownfor the overdoped concentration range of the hole-doped superconductors (Takagi, Batlogg, et al., 1992a;Kubo et al., 1991).
The long-standing problem is the nature of supercon-ducting carriers in the electron-doped cuprates. TheHall coefficient RH is quite sensitive, not only to the
FIG. 135. Electrical resistivity vs temperature for thePr1.85Ce0.15CuO41d crystals A (drawn lines) and A8 (dashedlines) annealed in different oxygen atmospheres as given in thefigure. The inset shows the resistive superconducting transi-tions for samples A and A8.

1186 Imada, Fujimori, and Tokura: Metal-insulator transitions
doping x as in the hole-doped superconductors, but alsoto the reduction procedure. In general, the RH is nega-tive and its absolute magnitude scales roughly with x inthe lightly doped region, whereas in the nonsupercon-ducting overdoped region x.0.17 the sign of RH is re-versed to positive (Takagi, Uchida, and Tokura, 1989).Apart from the opposite sign, the behavior is analogousto the case of La22xSrxCuO4 (Ong et al., 1987; Takagi,Ido, et al., 1989). However, it has been occasionally ob-served for superconducting R22xCexCuO42y (R5Nd orPr) crystals with x'0.15 that RH increases steeply topositive values with lowering temperature, say below 80K (Wang et al., 1991; Jiang et al., 1994). These were in-terpreted in terms of the two-band model in which bothholes and electrons participate in charge transport forthe superconducting phase.
Figure 136 displays the in-plane optical conductivityspectra (at room temperature) of Pr22xCexCuO4 with
FIG. 136. Optical conductivity spectra of Pr22xCexCuO42ywith light polarization perpendicular to the c axis (in-plane).
Rev. Mod. Phys., Vol. 70, No. 4, October 1998
and without reduction procedures (Arima, Tokura, andUchida, 1993). Spectroscopically, the reduction proce-dure appears to produce an effect similar to theelectron-doping x . With electron-doping, the spectralweight arising from the CT gap transition around 1.5 eVis transferred to the in-gap region (Cooper et al., 1990a),as observed in the hole-doping case, La22xSrxCuO4(Uchida et al., 1991). However, the broad infrared band(the so-called in-gap state absorption) is far from theconventional Drude spectrum and the charge dynamicsappears highly incoherent. The doping-induced changewas also observed in the O 2p-Cu 4s interband transi-tion region (Arima, Tokura, and Uchida, 1993). A singleband around 5.0 eV in the x50 parent compound is splitand the spectral weight is gradually shifted to the lower-lying band around 4.2 eV with doping. This was inter-preted in terms of the formation of an occupied in-gapstate below the Fermi level. Therefore the energy differ-ence between the upper edge of the occupied O 2p stateand the in-gap state is about 0.8 eV, nearly half of theoriginal CT band gap. This is contrary to the case of holedoping, in which the in-gap state is formed predomi-nantly above the Fermi level and hence is observable,e.g., in the O 1s absorption spectroscopy, as the unoc-cupied state (Chen et al., 1991).
Doping-induced changes in the single-particle DOS ofNd22xCexCuO4 are thus different from those inLa22xSrxCuO4 in that the in-gap spectral weight appearslargely below EF (Anderson et al., 1993). It is then ex-pected that the upper Hubbard band (d9→d10) loses itsspectral weight, although an increase of the spectralweight was indeed observed by oxygen 1s x-ray absorp-tion spectroscopy (Pellegrin et al., 1993). The position ofthe Fermi level of the doped sample with respect to theband gap of Nd2CuO4 has been a long-standing puzzle:It was pointed out that EF is located below the mid-gapof the parent compound if we consider the band gap of
FIG. 137. Fermi surface of Nd22xCexCuO4 determined by angle-resolved photoemission spectroscopy (King et al., 1993). Solidcurves are results of LDA band-structure calculations (Massida et al., 1989). G : (p,0); X : (p,p).

1187Imada, Fujimori, and Tokura: Metal-insulator transitions
Nd2CuO4 to be the optical gap of 2.0 eV (Allen et al.,1990; Namatame et al., 1990). This is obviously incom-patible with the common notion that the bottom of theconduction band is the affinity level of the parent insu-lator.
Angle-resolved photoemission studies ofNd1.85Ce0.15CuO4 revealed a dispersing band whichcrosses EF (Anderson et al., 1993; King et al., 1993). Asshown in Fig. 137, the Fermi surface thus determined isa hole-like one centered at the (p,p) point of the Bril-louin zone, in excellent agreement with band-structurecalculations for the nonmagnetic metallic state. The re-sults also show that the Fermi surface volume changesfollowing the Luttinger sum rule with varying dopinglevel. There is a saddle point, not in the band dispersionsnear EF , but a few hundred meV below it, unlike thehole-doped cuprate superconductors. The angle-resolved photoemission spectra show intense high-binding-energy tails and background, indicating that thespectral weight of the coherent quasiparticle Z is verysmall.
3. YBa2Cu3O72y
This compound has the same layered structure asLa22xSrxCuO4 in the sense that it has a stacking of theCuO2 planes and the block layers. The lattice structureis shown in Fig. 138. A complexity in this compound isthat it has a chain structure of Cu and O embedded inthe so-called block layer sandwiched by the CuO2planes. This Cu-O chain structure makes a minor contri-bution to the dc conductivity.
The insulating compound of YBa2Cu3O72y with y>0.6 has antiferromagnetic long-range order. The firstsignature of the antiferromagnetic order was detected bythe muon-spin-rotation measurements (Nishida et al.,
FIG. 138. Lattice structure of YBa2Cu3O7.
Rev. Mod. Phys., Vol. 70, No. 4, October 1998
1987). An ordered structure similar to the case ofLa2CuO4 was confirmed by subsequent neutron-diffraction measurements (Tranquada et al., 1988). Inthe region 0.6,y,1.0, holes are mainly doped into theCuO chain sites, where excess oxygen added to y51.0 isindeed introduced to the layers composed of separatedCuO chains. Therefore the doping concentration in theCuO2 plane changes little by basically retaining the Cu21
valence and thereby retaining the antiferromagnetic in-sulating phase. Below y50.6, holes start to be trans-ferred to the CuO2 plane, which immediately destroys
FIG. 139. Fermi surfaces of YBa2Cu3O6.9 determined by angle-resolved photoemission spectroscopy. (a) Results by Liu et al.,1992a. Open circles denote Fermi level crossings and shadedregions are calculated Fermi surfaces (Pickett et al., 1990). Thefinite width of the shaded regions represents finite kz disper-sion. The measurements on twinned samples have been donefor the half of the Brillouin zone shown here. X : (p,0), Y :(0,p), S : (p,p). (b) Another interpretation of the same data byShen and Dessau (1995).

1188 Imada, Fujimori, and Tokura: Metal-insulator transitions
the antiferromagnetic order and is accompanied by met-allization. The Neel temperature in the insulating phaseis as high as 400 K. Because the electronic structure cal-culation using the LDA shows the Fermi surface moreor less tilted by 45° from the case of La2CuO4, as illus-trated in Fig. 139 (Liu et al., 1992a), simple nesting con-dition is not satisfied in this case and thus strong corre-lation effects should be crucial in realizing theantiferromagnetic insulator. A pulsed high-energy neu-tron measurement performed up to 250 meV shows thatthe spin-wave theory of the Heisenberg model well de-scribes the spin-wave dispersion with the in-plane ex-change constant J i512565 meV and the inter-layer ex-change J'51162 meV (Hayden et al., 1996).
Around y50.6, the compound becomes metallic andthe hole concentration in the CuO2 layer increases withfurther decreasing y . This compound in the metallicphase shows a unique process of doping due to thetransfer of holes between the Cu-O chain site and theCuO2 layer (Tokura, Torrance, et al., 1988). In the re-gion 0.3<y<0.6, the hole concentration in the CuO2plane is kept low with relatively low superconductingtransition temperature Tc;60 K. Around y50.3 thehole concentration is increased quickly to the overdoped
FIG. 140. Antiferromagnetic correlation observed in peakstructures of Im x(q,v) by neutron scattering forYBa2Cu3O61x . From Rossat-Mignod et al., 1991a.
Rev. Mod. Phys., Vol. 70, No. 4, October 1998
or optimally doped region with Tc;90 K. Similarly tothe case of La22xSrxCuO4, short-range antiferromag-netic correlations survive in the metallic phase. This en-hancement of antiferromagnetic correlations is seen inthe diffuse neutron-scattering measurement around(p,p). However, in contrast to the case ofLa22xSrxCuO4, Imx(q,v) resulting from the neutrondata does not show clear incommensurate peaks in themetallic phase. Instead, it has a broad peak around(p,p), as is shown in Fig. 140 (Rossat-Mignod et al.,1991a; Sternlieb et al., 1994). The origin of this differ-ence in the peak structure between La and Y com-pounds was ascribed to the difference in the shape of theFermi surface (Furukawa and Imada, 1992; Si et al.,1993; Tanamoto, Kohno, and Fukuyama, 1993, 1994).However, a signature of incommensurate structure wasrecently detected also in Y compounds (Dai et al., 1998).
A single-parameter scaling by bv for *dq Imx(q,v),analogous to the case of La22xSrxCuO4 as discussed inSec. IV.D.1, is observed in the underdoped region(Sternlieb et al., 1993). However this single-parameterscaling seems to break down at lower energies below;12 meV at low temperatures. This may be related topseudogap formation, as discussed below.
Magnetic properties show rather different features be-tween the underdoped (0.6>y>0.3) and the optimallyor overdoped (0.3>y>0) samples. The Knight-shiftmeasurement in NMR clearly shows this difference. Inoverdoped samples with Tc;90 K, the Knight shift ismore or less constant at T.Tc , indicating that the uni-form magnetic susceptibility x(q5v50) follows theT-independent Pauli susceptibility of standard metals.On the other hand, in the underdoped material, 0.3,y,0.6, the uniform magnetic susceptibility derived fromthe spin part of the Knight shift shows a rapid decreasewith decreasing temperatures, as shown in Fig. 141(Takigawa et al., 1991). The observed decrease with low-ering temperatures is in fact much more pronouncedthan that seen in the 2D or 1D spin-1/2 Heisenbergmodel (Bonner and Fisher, 1964; Okabe and Kikuchi,1988; Makivic and Ding, 1991). This decrease appears tobe continuously and smoothly connected with the de-crease below Tc , as seen in Fig. 141. Therefore it isnatural to speculate that formation of the pseudogapstructure due to preformed singlet pairing fluctuationsbegins well above Tc . The peak structure of x(q5v50) at T5Tx;500 K is qualitatively similar to that forthe case of La22xSrxCuO4 in the underdoped region.
However, if we look at 1/T1 , we notice that the situ-ation is not so simple as naively expected from s-wavepreformed pairing. In overdoped or optimally dopedsamples with Tc;90 K, 1/T1T at the copper site is moreor less similar to the case of La1.85Sr0.15CuO4, althoughthe experimentally accessible temperature range is lim-ited to below 400–500 K because of the difficulty of con-trolling oxygen concentration above it. A gradual cross-over from 1/T1T;const to 1/T1;const appears to takeplace from low to high temperatures. The underdopedsamples with Tc;60 K show remarkably different be-havior, as shown in Fig. 142, where 1/T1T decreases be-

1189Imada, Fujimori, and Tokura: Metal-insulator transitions
FIG. 141. Temperature dependence of the Knight shift for YBa2Cu3O72y at y50 and y50.37. Various components of the Cu andO Knight shift are plotted with different vertical scales and origins. Anisotropy obtained from the direction of the appliedmagnetic field in ab , the ab-plane; c , c-axis; ax , the axial part; iso, the isotropic part (Takigawa et al., 1991). The Knight shiftstarts decreasing from much higher temperature than Tc .
low 150–200 K as if it were under the influence ofpseudogap formation (Yasuoka et al., 1989). In fact,these 1/T1T data were the first pioneering indication ofpseudogap behavior in the high-Tc cuprates well aboveTc . Similar pseudogap formation behavior is also ob-served in other underdoped compounds such asYBa2Cu4O8, and HgBa2CuO41d (Itoh et al., 1996). Sofar, in La22xSrxCuO4, this pseudogap behavior in 1/T1Tis not clearly visible. The possible effect of randomnesswas discussed for the suppression of the pseudogap in1/T1T . In any case, the anomaly in the underdoped Ycompound appears to show up below TR;200 K, whichis substantially lower than Tx in the uniform magneticsusceptibility but markedly higher than Tc . The sametype of anomaly has also been confirmed in neutron-scattering experiments (Rossat-Mignod et al., 1991a,1991b; Sternlieb et al., 1993), where Im x(q,v) showspseudogap behavior for q;(p ,p) below T;200 K forthe underdoped compound with Tc;60 K, as shown inFig. 143.
The origin of the difference between Tx in x(q5v50) and TR in 1/T1T is not clear enough at the momentand further studies are clearly necessary. Another puz-zling feature of the pseudogap behavior is that theGaussian decay rate 1/TG does not show a gaplike de-crease either at Tx or at TR (Itoh et al., 1992). This maybe related to the compatibility of antiferromagnetic cor-relations and superconductivity; see Assaad, Imada, andScalapino (1997), where the above two puzzling featuresare reproduced in a theoretical model.
Other indications of a pseudogap below T;200 Kwere also suggested from the anomaly of the B2u pho-non mode (Harashina et al., 1995) as well as fromanomalies in the Raman mode coupled to phonons
Rev. Mod. Phys., Vol. 70, No. 4, October 1998
FIG. 142. Temperature dependence of 1/T1T at the Cu site forseveral high-Tc compounds (by courtesy of H. Yasuoka, whoreplotted various available data). They show indications ofpseudogap behavior well above Tc . The data are taken fromMachi et al., 1991; T. Imai et al., 1989; Goto et al., 1996; War-ren et al., 1989; Takigawa et al., 1991; Y. Itoh et al., 1996.

1190 Imada, Fujimori, and Tokura: Metal-insulator transitions
(Litvinchuk, Thomsen, and Cardona, 1993), where con-sistency with coupling to d-wave pairing was proposedtheoretically (Normand, Kohno, and Fukuyama, 1995).The energy shift of the phonons due to coupling to thesuperconducting order parameter has been discussedfrom a more general point of view by Zeyer and Zwick-nagl (1988).
The origin of this pseudogap behavior is not fully un-derstood. Experimentally, however, it has been con-firmed in various cases, including the so-called single-layer compound HgBa2CuO41d . The formation of apseudogap has also been detected by photoemissionmeasurements for underdoped Bi and La compounds, asdiscussed in Secs. IV.C.1 and IV.C.4. Another importantindication of pseudogap behavior is a reduction of thespecific-heat coefficient g at low doping similar to thecase of La22xSrxCuO4 (Loram et al., 1994; Momonoet al., 1994; Liang et al., 1996).
Theoretically, several different explanations for thisunusual behavior have been proposed. The possibility ofpreformed pairing fluctuations above Tc as the origin ofpseudogap behavior has been examined from variousapproaches. This is a natural idea because the tempera-ture for singlet pairing may in general be higher than Tcitself when the MIT point is approached. Near a con-tinuous MIT point, the coherence temperature Tcoh hasto decrease to vanish, while the energy scale for the pair-ing energy may be independent of this reduction. Thisidea is supported by the small coherence length of theCooper pair observed experimentally in the high-Tc cu-prates. The short coherence length jcoh is easily deducedfrom a large critical magnetic field Hc2 and the relationjcoh51/A2pHc2. In YBa2Cu3O7, jcoh in the CuO2 planewas estimated as ;10–20 Å, that is, only a few latticespacings, even in the plane direction. It is known that
FIG. 143. Im x(q,v), in arbitrary units, as a function of v atq5(p ,p) for the underdoped compound YBa2Cu3O6.69. Thepseudogap structure is seen from the temperature above Tc .The inset shows the temperature dependence or fixed \v58meV. From Rossat-Mignod et al., 1991b.
Rev. Mod. Phys., Vol. 70, No. 4, October 1998
weak-coupling BCS superconductors may be continu-ously connected to a strong-coupling region where thepicture of Bose condensation by preformed pairs be-comes appropriate (Nozieres and Schmitt-Rink, 1985).When jcoh is small, the superconductivity is rather closeto the picture of the condensation of bosons. If this isthe case, the pairing temperature should be separatedfrom Tc itself. However, the naive picture of Bose con-densation is not appropriate because the preformed pairhas d-wave character accompanied by antiferromagneticcorrelations with strong momentum dependence.
One scenario for preformed singlet pair fluctuations isgiven by an unusual criticality near the Mott transition,as discussed in Sec. II.F. Because of unusual suppressionof the coherence of the single-particle transfer processdue to strong spin and charge fluctuations near the Motttransition point, we have to consider a higher-order pro-cess of the transfer. In the Mott insulating phase, thisindeed makes the superexchange interaction in the or-der of t2/U relevant. If the system is close to the Mottinsulator but in the metallic phase, other higher-orderprocesses of two-particle transfer contributes equally,while the single-particle process is still suppressed due toa large dynamical exponent z54 (Assaad, Imada, andScalapino, 1996). Near the Mott insulator this two-particle process can be more relevant than the single-particle process because of its small dynamical exponentz52 (Imada, 1994c, 1995b). This means that, in contrastto the single-particle process, the two-particle process isnot anomalously suppressed leading to a gain in the ki-netic energy. This necessarily yields a pairing effect. Animportant point here is a strong momentum dependenceof pairing fluctuations. The precursor of pairing startsaround (p,0) and (0,p) in the momentum space at highertemperatures. For more detailed discussion of thismechanism, see Sec. II.F.
There are several completely different ways of inter-preting pseudogap behavior as an effect of preformedpairing. Pairing through the magnetic polaron or con-ventional lattice polaron effect was studied as a bipo-laron mechanism (Micnas et al., 1990; Alexandrov, Brat-kovsky, and Mott, 1994; Alexandrov and Mott, 1994). Inthe cuprate superconductors, it is not likely that bipo-laronic mechanisms and local-pairing mechanisms canbe compatible with the principal features of strong-correlation effects. Fluctuating phase-separation effectsand dynamic charge-ordering effects (Emery and Kivel-son, 1995, 1996; Zaanen and Oles, 1996) were proposedas sources of preformed pairing. A more general argu-ment from the separation of the optimized Bose conden-sation temperature and the pairing energy, as well as acomparison of cuprate superconductors with other casessuch as heavy-fermion superconductors and C60 com-pounds, was stressed by Uemura et al. (1989, 1991).
Another interpretation of pseudogap behavior is thescenario assuming spin-charge separated excitations atthe low-energy level. Pseudogap formation is attributedto the pairing of spinons without Bose condensation ofholons in the picture of the slave-boson formalism dis-cussed in Sec. II.D.7 (Baskaran, Zou, and Anderson,

1191Imada, Fujimori, and Tokura: Metal-insulator transitions
1987; Kotliar and Liu, 1988; Suzumura, Hasegawa, andFukuyama, 1988; Tanamoto, Kohno, and Fukuyama,1994). The spinon pairing is basically due to singlet for-mation by the mean-field-type decoupling of the super-exchange interaction JSi•Sj . From the Fermi-liquid ap-proach the nesting condition has also been proposed asthe origin of pseudogap behavior (Miyake and Narikiyo,1994b).
In neutron scattering at higher energies, as shown inFig. 144, another unusual behavior has been observed inIm x(q,v), namely, a remarkable peak around v541meV with dramatic growth below Tc (Mook et al., 1993;Fong et al., 1995, 1997). The resonance energy decreasesmonotonically with decreasing doping concentration. Itis clear that this excitation is strongly coupled to thesuperconducting order parameter. Demler and Zhang(1995) have proposed that this peak is related to a spe-cial type of triplet pairing excitation, namely, the rota-tional mode connecting the antiferromagnetic order pa-rameter and the d-wave superconducting orderparameter under SO(5) symmetry (Zhang, 1997). Theenhancement of the resonance below Tc has some simi-larity to the result in La compounds above 7 meV. Theseall seem to indicate the compatibility of antiferromag-netic correlation in the superconducting state. Similarand consistent theoretical results were obtained in nu-merical studies attempting to account for the two-particle process explicitly (Assaad, Imada, and Scala-pino, 1997; Assaad and Imada, 1997). The peak appearsto be the remnant of the antiferromagnetic Bragg peakshifted to a finite frequency. In this context, thepseudogap formation widely observed appears to start athigh temperatures as undifferentiated signatures of anti-ferromagnetic and d-wave preformed pair fluctuations.
The transport properties of YBa2Cu3O72y show,roughly speaking, behaviors similar to that ofLa22xSrxCuO4 as described in Sec. IV.C.1 (Iye, 1990;Ong, 1990). The in-plane resistivity rab is approximatelyproportional to T near y50, that is, near the optimumdoping concentration, in the same way as inLa1.85Sr0.15CuO4. However, in the underdoped region itshows substantial deviation from T-linear behavior. This
FIG. 144. Im x(q,v), in arbitrary units, as a function of v atq5(p ,p) for the optimally doped compound YBa2Cu3O6.92(Rossat-Mignod et al., 1991b). A prominent 41-meV peak isobserved below Tc .
Rev. Mod. Phys., Vol. 70, No. 4, October 1998
deviation may be viewed as the reduction of r below thetemperature Tr , which increases with decreasing dopingconcentration as seen in Fig. 145 (Ito, Takenaka, andUchida, 1993; Takenaka et al., 1994). As compared toTx.Tr in the case of La22xSrxCuO4, Tr in the Y com-pounds appears to be low with weaker effects. Similarlyto the case of La22x SrxCuO4, the Hall coefficient showsa rather sharp increase with decreasing temperature be-low a similar temperature Tr or Tx (Ito et al., 1993;Takeda et al., 1993; Nishikawa, Takeda, and Sato, 1994).
The temperature dependence of the Hall angle de-fined by
cot QH5sxx
sxy(4.12)
was measured for YBa2Cu32pZnpO72y (Chien, Wang,and Ong, 1991; Ong et al., 1991). For p50 and d;0,cot QH appears to follow
cot QH.aT2. (4.13)
Anderson (1991a) introduced two different carrier re-laxation rates, t tr and tH , where t tr is the longitudinalrelaxation rate for motion perpendicular to the Fermisurface while tH is the transverse rate for the velocitycomponent parallel to the Fermi surface. In the usualFermi liquid, t tr5tH must hold, while the above experi-mental result together with r;T suggests t tr;1/T andtH;1/T2. Anderson interpreted this unusual tempera-ture dependence as coming from a singular interactionof two electrons located perpendicular to the Fermi sur-face, and also proposed that it could yield similar behav-ior to a 1D Tomonaga-Luttinger liquid.
Around y50, the c-axis transport is also metallic, in-dicating T-linear behavior of rc , although the absolutevalue is much larger than rab due to anisotropy. How-ever, it shows insulating temperature dependence in the
FIG. 145. Temperature dependence of in-plane resistivity forvarious choices of y for YBa2Cu3O72y , where the numbers inthe figure indicate 72y (Ito, Takenaka, and Uchida, 1993).The CuO2-plane contribution is obtained by subtracting thechain contribution deduced from the a- and b-axis resistivitiesshown in the inset.

1192 Imada, Fujimori, and Tokura: Metal-insulator transitions
low-doping region below certain temperatures. As tem-peratures are lowered, rc decreases, with minima at atemperature slightly higher but similar to Tr , and in-creases as an insulating behavior below Tr as in Fig. 146(Takenaka et al., 1994). It should be noted that thisanomaly occurs at a similar temperature to that for thedeviation of rab from T-linear behavior discussed aboveand is again similar to the case of La22xSrxCuO4. In thescenario of preformed singlet fluctuations, the reductionof rab below Tr can be ascribed to the increasing coher-ence of the fluctuating preformed pairs, while the chargeexcitation in the c direction has a pseudogap becauseinterlayer hopping has to break the pair once if the pair-ing originates from two-dimensionality, as in the sce-nario of pairing due to large dynamic exponent z of the2D Mott transition, discussed in Sec. II.F.9.
The effects of Zn doping on the anomalies below Tr
were examined (Mizuhashi, Takenaka, Fukuzumi, andUchida, 1995). There exists a range of Zn concentrationaround 2% where the metallic and pseudogap-type tem-perature dependence of the resistivity is retained while aCurie-like enhancement in the uniform magnetic suscep-tibility appears. This implies that the local spin momentappears despite the metallic conduction of carriers. Thiswas interpreted from the scenario of spin-charge separa-tion in the slave-boson formalism (Nagaosa and Ng,1995).
An alternative scenario is given by a non-Fermi-liquid
FIG. 146. Comparison of in-plane and c-axis resistivity vs tem-perature at several choices of doping concentrations 72y forYBa2Cu3O72y . From Takenaka et al., 1994.
Rev. Mod. Phys., Vol. 70, No. 4, October 1998
state sandwiched between the Fermi liquid and theAnderson localized phases (see, for example, Dobrosav-ljevic and Kotliar, 1997). A key point to understand thisresult may lie in the strong wave-number dependence ofcarriers, which has been ignored in the above argu-ments. The preformed singlet pair fluctuations around(p,0) may to some extent contribute to the ‘‘metallic’’conduction, though they remain rather incoherent wellabove Tc . This small ‘‘metallic’’ contribution may ex-plain the small reduction in the resistivity uponpseudogap formation. While the single-particle excita-tions may easily be localized by Zn substitution or in-duce the local moment, the Anderson localization maytake place predominantly in the single-particle excita-tions because of the underlying large dynamic exponentof the MIT.
The residual resistivity r0 by Zn doping in the unitar-ity limit depends on the carrier density n and the carriercharge e as r0}1/(ne2). Therefore one might think thatone could distinguish the following three cases: The firstis the usual Fermi-liquid conduction with charge e andn512x , the second is a complicated situation in whichthe preformed pair with n5x/2 and charge 2e makes aminor contribution to the transport while the major con-tribution is from the part around (6p/2,6p/2). The thirdis the spin charge separation scenario where the holonconduction gives the charge e with n5x (Nagaosa andLee, 1997). Experimentally, the increase of r0 is large inthe underdoped region and roughly scaled by 1/n51/x(Fukuzumi et al., 1996). However, a complexity existsbecause of the strong wave-number dependence of car-riers in the underdoped region. Carriers in a regionaround (p/2,p/2) remain unpaired, while carriers around(6p ,0) and (0,6p) stay strongly damped due to z54with instability to gradual pseudogap formation. If thetransport is still dominated by single-particle transportmainly coming from a small region around (p/2,p/2)over other transport channels, the residual resistivity canbe large because the effective carrier number is given bythat small region around (6p/2,6p/2) as if the Fermivolume were small. [This is clearly different from thescenario of small-pocket formation around (6p/2,6p/2)]. This may account for the experimental result. Evenwhen we consider this complexity, the experimentallyobserved large residual resistivity induced by Zn dopingdoes not seem to be compatible with the first case, whileit seems to be hard to judge the superiority of one to theother in the latter two cases.
The optical conductivity s(v) of untwinned crystalsshows a broad tail roughly proportional to 1/v , as in Fig.147 (Schlesinger et al., 1990; Azrak et al., 1994). At theoptimum doping concentration y;0, s(v) basically fol-lows the scaling s(v);s0(12e2bv)/v with a constants0 indicating the absence of coherent charge dynamics,as already discussed in Secs. II.E.1, II.F.9, and II.G.2from the theoretical point of view. In untwinnedsamples, the broad mid-IR peak structure observed inLa compounds is not visible, implying that the peakstructure itself is not an intrinsic property of the high-Tccuprates. The significance of the absence of the true

1193Imada, Fujimori, and Tokura: Metal-insulator transitions
Drude weight, common to all the cuprate superconduct-ors, is also discussed in Sec. IV.C.1. The extended Drudeanalysis of the Y compound also supports the consis-tency of Eq. (2.274) with weakly v-dependent andT-dependent C(v) (Thomas et al., 1988; Schlesingeret al., 1990; El Azrak et al., 1994).
A remarkable feature in the c-axis conductivity sc(v)is also seen at low doping concentration. Correspondingto the insulating temperature dependence of rc belowTr , a pseudogap structure grows in sc(v) in the regionv,600 cm21, as shown in Fig. 148 (Homes et al., 1993;Tajima et al., 1995; see also the review by Tajima, 1997).Even in the ab plane, the pseudogap structure was de-tected well above Tc , as shown in Fig. 149 (Orensteinet al., 1990; Rotter et al., 1991; Schlesinger et al., 1994;Basov et al., 1996; Puchkov et al., 1996). The pseudogapstructure seems to be continuously connected with thesuperconducting gap observed below Tc . It may be as-sociated with the pseudogap observed in angle-resolvedphotoemission spectra as discussed in Sec. IV.C.4. Thispseudogap in the ab plane manifests itself as the spec-tral weight transfer from the incoherent part roughlyscaled by 1/v to the coherent part. If we considered theoptical spectra only for the coherent part (though it isactually absent, as discussed above), it would be difficultto identify this pseudogap structure because the gap en-ergy is above the anticipated scale of inverse relaxationtime of charge dynamics (;T) as represented by theconventional clean-limit theory. On the other hand, ifwe take the incoherent response as the intrinsic anddominant part of this ‘‘incoherent metal,’’ in contrast tothe conventional Drude theory, the pseudogap is indeed
FIG. 147. Optical conductivity s(v) for several different un-twinned film samples (denoted as A,B,D,E,F) of YBa2Cu3O7by Azrak et al. (1994). Solid lines are fitting curves in the formof v2a. Cross-square points are sa by Schlesinger et al. (1990).They roughly follow the scaling 1/v .
Rev. Mod. Phys., Vol. 70, No. 4, October 1998
observable in this metallic response, as analyzed by Rot-ter et al. (1991), Schlesinger et al. (1994), Basov et al.(1996), and Puchkov et al. (1996).
When the preformed pair is formed by a mechanismof in-plane origin below the pseudogap temperature, it isexpected that in-plane transport will become more co-herent, as is discussed by Tsunetsugu and Imada (1997),while the c-axis resistivity should increase because theinterplane transport has to break preformed pairs unlessJosephson tunneling of pairs becomes possible in thesuperconducting state. Therefore the pseudogap in s(v)has the opposite effect. The in-plane spectra shouldshow spectral weight transfer from the incoherent to co-herent part and thus a decrease in dc resistivity while thec-axis spectra may show transfer to a higher-energy partand thus an increase in dc resistivity. This is consistentwith the observed results. The reduction of the in-planeresistivity below Tr is gradual. In this context, we notethe complexity due to strong momentum dependencebetween two regions, namely, around (p,0) and (p/2,p/2) as described above.
In YBa2Cu4O8, it was observed that even the c-axisconductivity sc has a metallic temperature dependencein the pseudogap region (Hussey et al., 1997, 1998). Thisappears to be associated with extremely good conduc-tion in the double-chain structure specific to this com-pound. However, the origin of this exceptional behavioris not clear enough at the moment.
The unusual normal-state properties of YBa2Cu3O72y
FIG. 148. Pseudogap observed in c-axis s(v) of YBa2Cu3O72y
for y50.3. The upper panel (a) shows the data with thephonons, while the lower panel shows the data of the elec-tronic part by subtracting the phonon contribution. The insetin the lower panel shows the conductivity at 50 cm21 normal-ized by the room-temperature conductivity (open circles) andthe normalized Knight shift for Cu(2) (solid line) at y50.37.From Homes et al., 1993.

1194 Imada, Fujimori, and Tokura: Metal-insulator transitions
have many aspects in common with La22xSrxCuO4.These common properties may be summarized as thesuppressed coherence and the pseudogap behavior. Sup-pression of the coherence is typically observed in theT-linear resistivity and the 1/v dependence in s(v). Thepseudogap behavior is observed at low doping belowcertain temperatures, namely, Tx in the uniform suscep-tibility x and Tg in the specific heat. The anomalies inthe Hall coefficient observed below TH , and Tr in theresistivity, as well as in sab(v) and sc(v), also appearto be related. The NMR relaxation rate 1/T1 showspseudogap behavior below TR in the Y compounds, aswell as in some other compounds, though it is not ob-served in La22xSrxCuO4. These crossover temperaturesTx , TH , Tr , TR , and Tg have quantitatively differentvalues and they are slightly different from compound tocompound. However, dependence on doping concentra-tion is similar in all, in the sense that it is more pro-nounced and enhanced in the underdoped region. Theoverall tendency towards pseudogap formation aboveTc in the underdoped region is clear. We summarize thisbasic tendency in a schematic phase diagram with twotypical crossover temperatures Tx and TR in Fig. 150.
The doping dependence of the electronic structure ofYBa2Cu3O72y is more complicated than that of theother high-Tc materials because of the presence of theCu-O chains, which make the number of holes in theCuO2 plane somewhat ambiguous. Electron-energy-lossmeasurements from the oxygen 1s core level were inter-preted as indicating that holes doped in the CuO2 planehaving px ,y symmetry become itinerant carriers (Nuckeret al., 1989).
FIG. 149. Pseudogap observed in in-plane s(v) ofYBa2Cu3O72y : (a) Tc593 K at, from top to bottom, T5120,100, 90, 80, 70, and 30 K; (b) Tc582 K at T5150, 120, 90, 80,70, and 20 K; (c) Tc556 K at T5200, 150, 120, 100, 80, 60, 50,and 20 K. From Rotter et al., 1991.
Rev. Mod. Phys., Vol. 70, No. 4, October 1998
Fermi surfaces of YBa2Cu3O72y (0.1,y,0.65) werestudied by angle-resolved photoemission spectroscopyand generally good agreement with LDA band-structurecalculations was obtained for optimally doped (y.0.1)samples, as shown in Fig. 139 (Campuzano et al., 1990;Liu et al., 1992a, 1992b; Tobin et al., 1992): The spectrawere interpreted as indicating two hole-like Fermi sur-faces centered at (p,p) (Liu et al., 1992a), as shown inFig. 139(a), or reinterpreted as indicating ‘‘universal’’Fermi surfaces similar to those of Bi2Sr2CaCu2O8 (Shenand Dessau, 1995). The observed band dispersions nearEF are weaker by a factor of ;2 than the LDA bandstructure, indicating a moderate mass enhancement:m* /mb;2. Each spectrum shows an intense high-binding-energy tail and background, indicating that thespectral weight of the quasi-particle peak is small: Z!1. From these observations, it follows using Eqs.(2.125) and (2.126) that mk /mb!1, meaning that theenergy bands crossing EF are strongly renormalized by ak-dependent self-energy correction. The importance ofthe k-dependent self-energy is discussed in Sec. II.F.11.
In going from y50.1 (Tc;90 K) to y50.5 (Tc;50 K), the dispersions and the Fermi surfaces essen-tially do not change. However, while bands crossing EFalong the (p,p) direction remain unchanged, thosecrossing EF along the (p,0) direction lose their spectralweight significantly [see Fig. 151(a) and 151(b)]. For aninsulating y50.65 sample, whose composition is in thevicinity of the MIT, bands do not cross EF and somebands become less dispersive, whereas dispersions ofother bands remain similar to those of the y50.1samples. Interestingly, bands dispersing toward EF andcrossing it along the (0,0)-(p,p) line remain in the insu-lating sample, although their peaks have becomebroader, as if the Fermi surface remains along this line,as shown in Fig. 151(c).
A closely related superconductor, YBa2Cu4O8, withdouble chains was studied by angle-resolved photoemis-sion spectroscopy in which band dispersions and Fermisurfaces are clarified as shown in Fig. 152 (Gofron et al.,1994). Notably, a saddle-point behavior was foundaround the (p,0) point of the Brillouin zone, located
FIG. 150. Schematic phase diagram of pseudogap structure inthe plane of temperature and the doping concentration in thehigh-Tc cuprates. Below Tx or TR , various indications ofpseudogap formation are seen.

1195Imada, Fujimori, and Tokura: Metal-insulator transitions
FIG. 151. Angle-resolved photoemission spectra of YBa2Cu3O72y (Liu et al., 1992a): (a) y50.1 (Tc;90 K); (b) y50.5 (Tc
;50 K); (c) comparison between y50.5 and y50.65 (insulator).
;19 meV below EF , as in Bi2Sr2CaCu2O8 and Sr2RuO4.The same behavior was found for YBa2Cu3O72y (Tobinet al., 1992; Liu et al., 1992a). The experimental banddispersions are again weaker than calculated by a factorof ;2. A more remarkable discrepancy from the band-structure calculation is the very flat dispersion along the(0,0)-(p,0) direction, compared to the calculated qua-dratic dispersion. A similar structure is discussed in Sec.IV.C.4. Theoretical aspects of this flat dispersion, whichappears near the MIT point in 2D systems, are consid-ered in Sec. II.F.11, and its importance is discussed inSec. II.F.11 in terms of the scaling theory. The flatness isqualitatively different from the usual Van Hove singu-larity because the dispersion changes to a k4 law consis-tent with a scaling theory that has a large dynamic ex-ponent z54. Because the chemical potential (5EF) isdetermined from the level of the preformed pair, single-particle flat dispersion should be separated from thispair level by a distance equal to the binding energy ofthe pair. This is why the flat dispersion is shifted from
Rev. Mod. Phys., Vol. 70, No. 4, October 1998
EF (which is 19 meV for YBa2Cu4O8). The k4 dispersionfor the single-particle excitation is transformed to a k2
dispersion for a pair excitation with a finite binding en-ergy at the MIT edge.
4. Bi2Sr2CaCu2O81d
Bi2Sr2CaCu2O8 and its derivatives have the strongestanisotropy in their transport properties between in-plane and out-of-plane behaviors (Ito et al., 1991) andtherefore are the best 2D conductors among the high-Tccuprates. The idealized crystal structure ofBi2Sr2CaCu2O8 is shown in Fig. 153. It should be noted,however, that excess oxygen atoms are incorporated inthe BiO plane, resulting in remarkable superstructuremodulations (Yamamoto et al., 1990). The Tc ofBi2Sr2CaCu2O8 can be controlled by changing the oxy-gen stoichiometry (annealing in oxygen or in a vacuum)or by substituting Y or other rare-earth elements for Ca.As-grown Bi2Sr2CaCu2O81d samples are close to the op-

1196 Imada, Fujimori, and Tokura: Metal-insulator transitions
timum doping (Tc;90 K), while oxygen-annealed onesare overdoped and have lower Tc . Holes are depleted in
FIG. 152. Angle-resolved photoemission spectra ofYBa2Cu4O8 (a) along the G-Y [(0,0)-(0,p)] lines; (b) along theS-Y [(p,p)-(0,p)] lines; (c) band dispersions around the (0,p)point. From Gofron et al., 1994.
Rev. Mod. Phys., Vol. 70, No. 4, October 1998
the Y-substituted samples Bi2Sr2Ca12xYxCu2O81d andthey become semiconducting (Tc50) at x;0.5.
The electronic structure of Bi2Sr2CaCu2O81d has beenextensively studied by various electron spectroscopictechniques, including angle-resolved photoemissionspectroscopy (Takahashi et al., 1989) because of the highquality and stability of cleaved surfaces. According tooxygen 1s electron-energy-loss studies, doped holes inthe CuO2 plane have px ,y symmetry and occupy thep-ds antibonding band of the CuO2 plane (Nuckeret al., 1989).
Angle-resolved photoemission studies of optimallydoped and overdoped samples show band dispersionsand Fermi surfaces similar to those given by band-structure calculations if the energy bands derived fromthe Bi-O plane are removed from EF . Angle-resolvedphotoemission spectra along various cuts in the Brillouinzone are shown in Fig. 154 (Dessau et al., 1993). Theclearest quasiparticle peak is observed along the (0,0)-(p,p) line. The quasiparticle peak disappears approxi-mately at (p/2,p/2), unambiguously indicating a Fermi-level crossing. Along the (0,0)-(p,0) line, on the otherhand, the quasiparticle peak disperses towards EF butnever crosses it; it crosses EF along the (p,0)-(p,p) line.Thus the band shows a saddle point at (p,0) and a veryflat dispersion around that point, which is occasionallycalled an extended saddle point or extended Van Hovesingularity, although it is much flatter than the usualVan Hove singularity. The flat band is located within;50 meV of EF over a large portion of the Brillouinzone around the (p,0) points. The resulting Fermi sur-
FIG. 153. Idealized cystal structure of Bi2Sr2CaCu2O8.

1197Imada, Fujimori, and Tokura: Metal-insulator transitions
FIG. 154. Angle-resolved photoemission spectra of Bi2Sr2CaCu2O8 taken above 100 K (.Tc585 K). M : (p,0), X : (p,p). FromShen and Dessau, 1995.
faces are shown in Fig. 155, which shows, in addition tothe hole-like Fermi surface centered at the (p,p) point,an electronlike Fermi surface centered at (0,0). Thepresence of the latter electronlike Fermi surface hasbeen controversial. Ding et al. (1996a) reported only thehole Fermi surfaces and attributed other features to thesuperstructure modulation of the Bi-O plane or to‘‘shadow bands,’’ as discussed below. The presence ofthe flat band is in agreement with numerical studies ofthe Hubbard and t-J models (see Sec. II.E.2). The flatdispersion may constitute a microscopic basis for scalingtheory with a large dynamic exponent z (Sec. II.F.11).The fact that the Fermi level lies slightly away from theflat band (;50 meV) is interpreted as coming from the
FIG. 155. Fermi surfaces of Bi2Sr2CaCu2O8 measured byangle-resolved photoemission spectroscopy (Dessau et al.,1993): Filled circles, Fermi surface crossings; striped circles,locations where the band energy is indistinguishable from EF .
Rev. Mod. Phys., Vol. 70, No. 4, October 1998
formation of a pseudogap due to spin fluctuations or tothe preformed pair of binding energy ;50 meV. In thelatter scenario, the single-particle excitation needs a fi-nite energy from the chemical potential around (p,0)because of the two-particle bound-state formation.
The line shape of the angle-resolved photoemissionspectra is unusual as in the other cuprates in that thehigh-binding-energy tail is intense, the background in-tensity is high, and consequently the quasiparticleweight is anomalously small. The unusually high back-ground is not due to inelastically scattered secondaryelectrons, but must be an intrinsically incoherent part ofthe spectral function (Liu et al., 1991). Indeed, angle-resolved photoemission spectra of a conventional 2D(semi)metal TiTe2 show negligibly small background in-tensities (Claessen et al., 1992). The large incoherentspectral weight means that the motion of the conductionelectrons in the high-Tc cuprates is highly dressed byelectron correlations. Even when the quasiparticle peakis located very close to EF , it does not become a delta-function-like peak as predicted for a Landau Fermi liq-uid, but retains a highly asymmetric peak. In order todescribe the unusual photoemission line shape, Varmaet al. (1989) proposed the marginal Fermi-liquid phe-nomenology (see Sec. II.G2). Whether the quasiparticlespectral weight Z vanishes at EF or not and whether thequasiparticle lifetime width is proportional to the energyfrom EF (1/t}uv2mu) as in a marginal Fermi liquid arevery subtle problems to be settled experimentally be-cause of the limited energy and momentum resolution ofphotoemission spectroscopy. Nevertheless, the analysisby Olson et al. (1990) using a Lorentzian function with aFermi cutoff favors a lifetime width that varies linearlyin energy over a relatively large energy scale of a few100 meV. Although the distinction between Fermi liquidand marginal Fermi liquid can in principle be made onlyin the low-energy limit, the high Tc’s of ;100 K practi-cally make it meaningless to discuss energies lower than;30 meV; the unusual lifetime behavior and large inco-herent spectral weight seen on the latter energy scale (ofthe order of the resolution of photoemission) are suffi-

1198 Imada, Fujimori, and Tokura: Metal-insulator transitions
cient to answer the above questions. Recently, the broadtail was interpreted as the 1/Av dependence. This phe-nomenological result is derived from the real part of theself-energy proportional to Av , which results from theenhanced antiferromagnetic susceptibility in theintermediate-energy region (Chubukov and Schmalian,1997; for experimental results, see Norman et al., 1998).The incoherent character of angle-resolved photoemis-sion spectroscopy may be related to the suppression ofcoherence due to the large dynamic exponent z54 ofthe MIT, as discussed in Sec. II.F.9.
The question of why antiferromagnetic fluctuationsare strong in the superconducting cuprates has been fre-quently asked in the context of magnetic mechanisms ofsuperconductivity. Kampf and Schrieffer (1990) pre-dicted that antiferromagnetic fluctuations in the para-magnetic metallic state would induce scattering of elec-trons by the antiferromagnetic wave vector Q [5(p,p)for the CuO2 plane] and produce a ‘‘shadow band,’’which is shifted by Q from the original band. Aebi et al.(1994) observed ‘‘shadow Fermi surfaces’’ in optimallydoped Bi2Sr2CaCu2O81d in the angular distribution ofphotoelectron intensities with a fixed energy (EF), asshown in Fig. 156. According to that study, the originalFermi surface is centered at the (p,p) point and theshadow Fermi surface is centered at (0,0). Ding et al.(1996a) observed corresponding shadow bands in thestandard angle-resolved photoemission mode, but alsopointed out the possibility that the extra bands are dueto superstructure modulation of the Bi-O planes. Theo-retically the existence of the shadow bands and shadowFermi surfaces has been quite controversial. Calcula-tions using the ‘‘fluctuation exchange approximation’’showed that the correlation length of antiferromagneticfluctuation necessary to produce the shadow bands andshadow Fermi surfaces is only a few lattice spacings(Langer et al., 1995). On the other hand, shadow Fermisurfaces are not visible in numerical studies of the t2Jand Hubbard models although shadow bands have beenidentified in the underdoped regime (Haas et al., 1995;Moreo et al., 1995; Preuss et al., 1995).
The photoemission spectra of the antiferromagneticinsulator Sr2CuCl2O2 shown in Fig. 157 clearly indicate
FIG. 156. (a) Angular distribution of photoelectrons fromwithin 10 meV of the Fermi level in Bi2Sr2CaCu2O8 (Aebiet al., 1994); (b) outline of (a), emphasizing the stronger andweaker lines.
Rev. Mod. Phys., Vol. 70, No. 4, October 1998
the shadow band (Wells et al., 1995; see also Fig. 24):Here, the antiferromagnetic Brillouin zone lies along the(p,0)-(0,p) line, and therefore the band disperses backbeyond the (p/2,p/2) point. If the angle-resolved photo-emission spectra of Sr2CuCl2O2 are compared with thoseof Bi2Sr2CaCu2O8 along the same (0,0)-(p,p) line (Fig.154), a strong similarity between the antiferromagneticinsulator and the metal/superconductor is noted. Theflat band around (p,0) in the metallic samples, on theother hand, is shifted well below (;0.3 eV) the valence-band maximum at (p/2,p/2) (see also Sec. II.E.2). Theevolution of the electronic structure from insulator tometal/superconductor has been systematically studiedfor underdoped Bi2Sr2CaCu2O81d in which a rare-earthelement is substituted for Ca or oxygen is reduced(Loeser et al., 1996; Marshall et al., 1996). In under-doped samples, the energy band around the (p,0) pointis shifted away from EF even above Tc , and the Fermi-level crossing along the (0,0)-(p,0) line disappears, asshown in Fig. 158(a). That is, a ‘‘normal-state gap’’opens around (p,0) while the Fermi-level crossing nearthe (p/2,p/2) point is not affected. The resulting bandstructure resembles that of a hole-doped antiferromag-netic insulator with a small Fermi surface at the (p/2,p/2) point, although the inner half of the small Fermisurface is missing [Fig. 158(b)]. The latter observationcontradicts the appearance of the shadow bands as aresult of short-range antiferromagnetic correlation, sincethe correlation should be more significant in the under-doped regime and the whole small Fermi surface shouldbe clearly visible. The normal-state gap which opensalong the (p,0) direction but not along the (p,p) direc-tion has the same anisotropy as that of the supercon-
FIG. 157. Angle resolved photoemission spectra along the(0,0)-(p,p) line. Left panel, angle-resolved photoemissionspectra of Sr2CuCl2O2 (Wells et al., 1995); right panel, corre-sponding spectra of Bi2Sr2CaCu2O8 (Dessau et al., 1993).

1199Imada, Fujimori, and Tokura: Metal-insulator transitions
ducting gap below Tc . The temperature dependence ofthe normal-state gap was studied by Ding et al. (1996b),as shown in Fig. 159. The gap closes at a characteristictemperature T* , which is well above Tc for underdopedsamples and increases with decreasing hole concentra-tion. The doping dependence of T* seems to roughlyfollow the temperature TR below which the Cu NMRrelaxation rate shows a spin-gap behavior inYBa2Cu3O72y . Recent tunneling measurements on un-derdoped Bi2Sr2CaCu2O81d suggest an opening of thepseudogap at temperatures even higher than that ob-served in the photoemission (Renner et al., 1998).
The origin of the normal-state gap has been discussedfrom different points of view, including antiferromag-netic correlation (for example, Preuss et al., 1997),spinon pairing (Tanamoto et al., 1992), and preformedCooper pairs (Imada, 1993a, 1994b; see also Sec.IV.F.11). Ding et al. (1997) found that in underdopedBi2Sr2CaCu2O81d , the minimum gap locus below T*coincides with the locus of gapless excitations above T*and resembles the large Fermi surface of optimallydoped and overdoped samples. The same scenario hasbeen considered as an alternative to interpret the Fermisurface of Fig. 158(b) (Marshall et al., 1996). This sug-gests that the normal-state gap is due to precursors ofsinglet pairs (including spinon pairing scenario) aboveTc and not due to antiferromagnetic correlation, since
FIG. 158. Photoemission results of Bi2Sr2CaCu2O8. (a) Banddispersions of optimally doped and underdoped samples (Mar-shall et al., 1996); (b) Fermi surfaces of slightly overdoped andunderdoped samples.
Rev. Mod. Phys., Vol. 70, No. 4, October 1998
the latter correlation would alter the Fermi surface con-siderably. The appearance of a normal-state gap con-spicuous around (p,0) above Tc is consistent with a pair-ing mechanism due to instability of the flat andincoherent dispersion around (p,0) characterized by thez54 universality class, as is discussed in Sec. II.F.9. Theflat dispersion of single-particle process around (p,0),generated from strong-correlation effects near the Mottinsulator and characterized by a large dynamic exponentz54, may be destabilized, leading to preformed pairswith k2 dispersion with a binding energy indicated bythe pseudogap, while the part around (p/2,p/2) forms amore or less usual (but patchy) Fermi surface. There-fore, in the underdoped region with a pseudogap, theholes are predominantly doped into the (p,0) region be-cause of the flat dispersion and they are subject to bind-ing to incoherent preformed pairs in this region.
The shift of the chemical potential with hole dopinghas been studied from the shifts of core levels and thevalence band for Bi2Sr2Ca12xYxCu2O81d (vanVeenendaal et al., 1994) and from oxygen-controlledBi2Sr2CaCu2O81d (Shen et al., 1991a). The resultsshowed a shift of ;1 eV/hole in metallic superconduct-ing samples as in the overdoped region ofLa22xSrxCuO4, whereas the shift is much larger (;8 eV/hole) in Y-rich semiconducting samples. The large shiftin the semiconducting samples may be due to a finiteDOS of Anderson-localized states within the band gapof the parent insulator.
D. Quasi-one-dimensional systems
1. Cu-O chain and ladder compounds
The 1D analog of the hole-doped cuprates may bevery important, not only because the compounds can be
FIG. 159. The temperature dependence of angle-resolved pho-toemission spectra at Fermi surface crossings along the(p,0)-(p,p) line in oxygen-controlled Bi2Sr2CaCu2O81d (Dinget al., 1996b): (a) Tc583 K sample; (b) Tc510 K sample. Spec-tra at the (0,0)-(p,p) Fermi-surface crossing are also shown.Broken lines are reference Pt spectra.
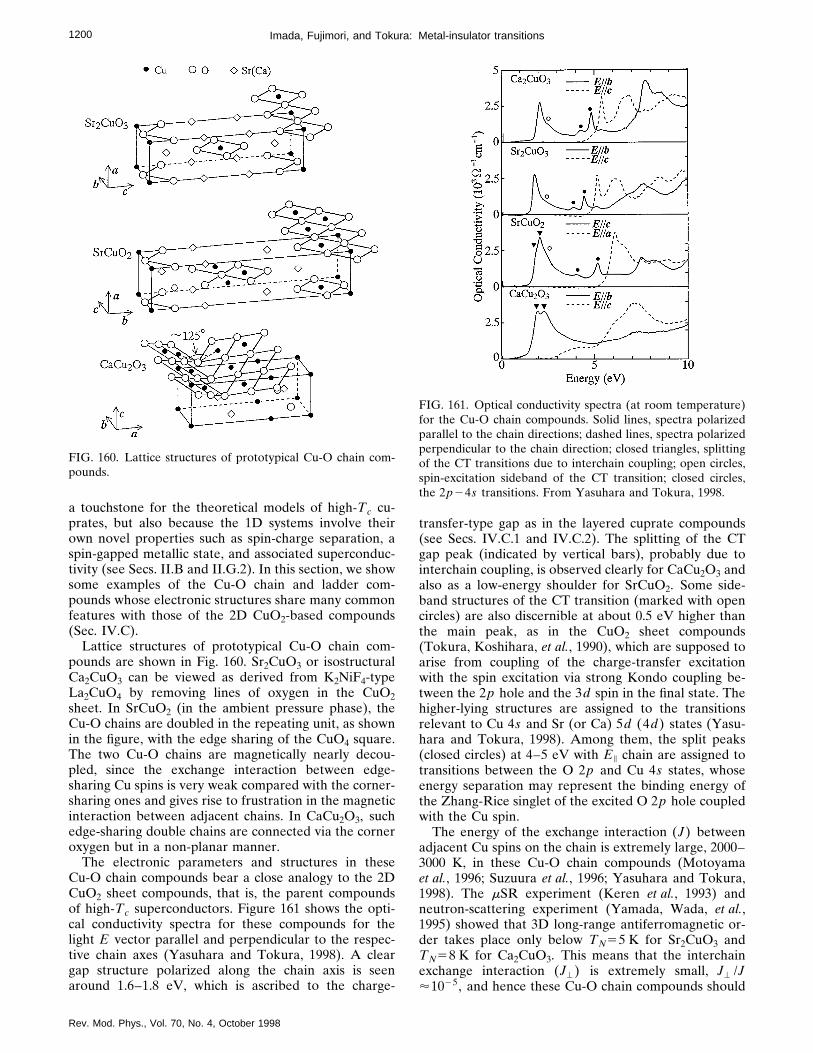
1200 Imada, Fujimori, and Tokura: Metal-insulator transitions
a touchstone for the theoretical models of high-Tc cu-prates, but also because the 1D systems involve theirown novel properties such as spin-charge separation, aspin-gapped metallic state, and associated superconduc-tivity (see Secs. II.B and II.G.2). In this section, we showsome examples of the Cu-O chain and ladder com-pounds whose electronic structures share many commonfeatures with those of the 2D CuO2-based compounds(Sec. IV.C).
Lattice structures of prototypical Cu-O chain com-pounds are shown in Fig. 160. Sr2CuO3 or isostructuralCa2CuO3 can be viewed as derived from K2NiF4-typeLa2CuO4 by removing lines of oxygen in the CuO2sheet. In SrCuO2 (in the ambient pressure phase), theCu-O chains are doubled in the repeating unit, as shownin the figure, with the edge sharing of the CuO4 square.The two Cu-O chains are magnetically nearly decou-pled, since the exchange interaction between edge-sharing Cu spins is very weak compared with the corner-sharing ones and gives rise to frustration in the magneticinteraction between adjacent chains. In CaCu2O3, suchedge-sharing double chains are connected via the corneroxygen but in a non-planar manner.
The electronic parameters and structures in theseCu-O chain compounds bear a close analogy to the 2DCuO2 sheet compounds, that is, the parent compoundsof high-Tc superconductors. Figure 161 shows the opti-cal conductivity spectra for these compounds for thelight E vector parallel and perpendicular to the respec-tive chain axes (Yasuhara and Tokura, 1998). A cleargap structure polarized along the chain axis is seenaround 1.6–1.8 eV, which is ascribed to the charge-
FIG. 160. Lattice structures of prototypical Cu-O chain com-pounds.
Rev. Mod. Phys., Vol. 70, No. 4, October 1998
transfer-type gap as in the layered cuprate compounds(see Secs. IV.C.1 and IV.C.2). The splitting of the CTgap peak (indicated by vertical bars), probably due tointerchain coupling, is observed clearly for CaCu2O3 andalso as a low-energy shoulder for SrCuO2. Some side-band structures of the CT transition (marked with opencircles) are also discernible at about 0.5 eV higher thanthe main peak, as in the CuO2 sheet compounds(Tokura, Koshihara, et al., 1990), which are supposed toarise from coupling of the charge-transfer excitationwith the spin excitation via strong Kondo coupling be-tween the 2p hole and the 3d spin in the final state. Thehigher-lying structures are assigned to the transitionsrelevant to Cu 4s and Sr (or Ca) 5d (4d) states (Yasu-hara and Tokura, 1998). Among them, the split peaks(closed circles) at 4–5 eV with E i chain are assigned totransitions between the O 2p and Cu 4s states, whoseenergy separation may represent the binding energy ofthe Zhang-Rice singlet of the excited O 2p hole coupledwith the Cu spin.
The energy of the exchange interaction (J) betweenadjacent Cu spins on the chain is extremely large, 2000–3000 K, in these Cu-O chain compounds (Motoyamaet al., 1996; Suzuura et al., 1996; Yasuhara and Tokura,1998). The mSR experiment (Keren et al., 1993) andneutron-scattering experiment (Yamada, Wada, et al.,1995) showed that 3D long-range antiferromagnetic or-der takes place only below TN55 K for Sr2CuO3 andTN58 K for Ca2CuO3. This means that the interchainexchange interaction (J') is extremely small, J' /J'1025, and hence these Cu-O chain compounds should
FIG. 161. Optical conductivity spectra (at room temperature)for the Cu-O chain compounds. Solid lines, spectra polarizedparallel to the chain directions; dashed lines, spectra polarizedperpendicular to the chain direction; closed triangles, splittingof the CT transitions due to interchain coupling; open circles,spin-excitation sideband of the CT transition; closed circles,the 2p24s transitions. From Yasuhara and Tokura, 1998.
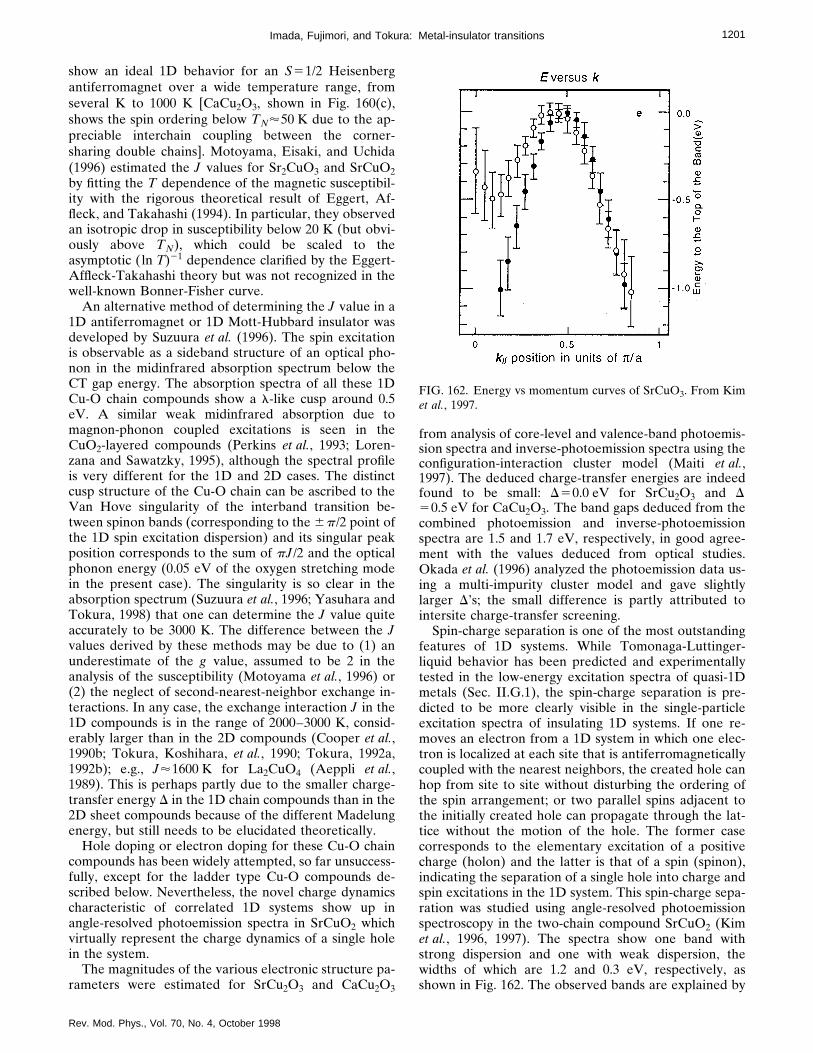
1201Imada, Fujimori, and Tokura: Metal-insulator transitions
show an ideal 1D behavior for an S51/2 Heisenbergantiferromagnet over a wide temperature range, fromseveral K to 1000 K [CaCu2O3, shown in Fig. 160(c),shows the spin ordering below TN'50 K due to the ap-preciable interchain coupling between the corner-sharing double chains]. Motoyama, Eisaki, and Uchida(1996) estimated the J values for Sr2CuO3 and SrCuO2by fitting the T dependence of the magnetic susceptibil-ity with the rigorous theoretical result of Eggert, Af-fleck, and Takahashi (1994). In particular, they observedan isotropic drop in susceptibility below 20 K (but obvi-ously above TN), which could be scaled to theasymptotic (ln T)21 dependence clarified by the Eggert-Affleck-Takahashi theory but was not recognized in thewell-known Bonner-Fisher curve.
An alternative method of determining the J value in a1D antiferromagnet or 1D Mott-Hubbard insulator wasdeveloped by Suzuura et al. (1996). The spin excitationis observable as a sideband structure of an optical pho-non in the midinfrared absorption spectrum below theCT gap energy. The absorption spectra of all these 1DCu-O chain compounds show a l-like cusp around 0.5eV. A similar weak midinfrared absorption due tomagnon-phonon coupled excitations is seen in theCuO2-layered compounds (Perkins et al., 1993; Loren-zana and Sawatzky, 1995), although the spectral profileis very different for the 1D and 2D cases. The distinctcusp structure of the Cu-O chain can be ascribed to theVan Hove singularity of the interband transition be-tween spinon bands (corresponding to the 6p/2 point ofthe 1D spin excitation dispersion) and its singular peakposition corresponds to the sum of pJ/2 and the opticalphonon energy (0.05 eV of the oxygen stretching modein the present case). The singularity is so clear in theabsorption spectrum (Suzuura et al., 1996; Yasuhara andTokura, 1998) that one can determine the J value quiteaccurately to be 3000 K. The difference between the Jvalues derived by these methods may be due to (1) anunderestimate of the g value, assumed to be 2 in theanalysis of the susceptibility (Motoyama et al., 1996) or(2) the neglect of second-nearest-neighbor exchange in-teractions. In any case, the exchange interaction J in the1D compounds is in the range of 2000–3000 K, consid-erably larger than in the 2D compounds (Cooper et al.,1990b; Tokura, Koshihara, et al., 1990; Tokura, 1992a,1992b); e.g., J'1600 K for La2CuO4 (Aeppli et al.,1989). This is perhaps partly due to the smaller charge-transfer energy D in the 1D chain compounds than in the2D sheet compounds because of the different Madelungenergy, but still needs to be elucidated theoretically.
Hole doping or electron doping for these Cu-O chaincompounds has been widely attempted, so far unsuccess-fully, except for the ladder type Cu-O compounds de-scribed below. Nevertheless, the novel charge dynamicscharacteristic of correlated 1D systems show up inangle-resolved photoemission spectra in SrCuO2 whichvirtually represent the charge dynamics of a single holein the system.
The magnitudes of the various electronic structure pa-rameters were estimated for SrCu2O3 and CaCu2O3
Rev. Mod. Phys., Vol. 70, No. 4, October 1998
from analysis of core-level and valence-band photoemis-sion spectra and inverse-photoemission spectra using theconfiguration-interaction cluster model (Maiti et al.,1997). The deduced charge-transfer energies are indeedfound to be small: D50.0 eV for SrCu2O3 and D50.5 eV for CaCu2O3. The band gaps deduced from thecombined photoemission and inverse-photoemissionspectra are 1.5 and 1.7 eV, respectively, in good agree-ment with the values deduced from optical studies.Okada et al. (1996) analyzed the photoemission data us-ing a multi-impurity cluster model and gave slightlylarger D’s; the small difference is partly attributed tointersite charge-transfer screening.
Spin-charge separation is one of the most outstandingfeatures of 1D systems. While Tomonaga-Luttinger-liquid behavior has been predicted and experimentallytested in the low-energy excitation spectra of quasi-1Dmetals (Sec. II.G.1), the spin-charge separation is pre-dicted to be more clearly visible in the single-particleexcitation spectra of insulating 1D systems. If one re-moves an electron from a 1D system in which one elec-tron is localized at each site that is antiferromagneticallycoupled with the nearest neighbors, the created hole canhop from site to site without disturbing the ordering ofthe spin arrangement; or two parallel spins adjacent tothe initially created hole can propagate through the lat-tice without the motion of the hole. The former casecorresponds to the elementary excitation of a positivecharge (holon) and the latter is that of a spin (spinon),indicating the separation of a single hole into charge andspin excitations in the 1D system. This spin-charge sepa-ration was studied using angle-resolved photoemissionspectroscopy in the two-chain compound SrCuO2 (Kimet al., 1996, 1997). The spectra show one band withstrong dispersion and one with weak dispersion, thewidths of which are 1.2 and 0.3 eV, respectively, asshown in Fig. 162. The observed bands are explained by
FIG. 162. Energy vs momentum curves of SrCuO3. From Kimet al., 1997.

1202 Imada, Fujimori, and Tokura: Metal-insulator transitions
peaks in the spectral function A(k ,v) of the 1D t2Jmodel calculated using exact diagonalization (with t;0.6 eV and J;0.15 eV). The peaks in A(k ,v) are as-signed to ‘‘holon’’ and ‘‘spinon’’ bands from comparisonwith the k- and v-dependent charge and spin suscepti-bilities: The energy scales of the holon and spinon bandsare set by t and J , respectively. [The coupling betweenthe two Cu-O chains in SrCuO2 is negligible forA(k ,v).] The result for the 1D insulator is contrastedwith that for the 2D insulator Sr2CuCl2O2, which showsonly a weakly dispersing feature whose width is of orderJ (Fig. 162). The different behaviors between the 1Dand 2D systems have been attributed to strong couplingbetween the spin and charge excitations in the 2D sys-tem. There is, however, some controversy as to whetherthere is a spin-charge separation in the single-particlespectra of the 1D system. Suzuura and Nagaosa (1997)have examined the problem using the slave-boson for-malism and found that the holon (boson) excitation andthe spinon (fermion) excitation are strongly coupledwith each other.
Let us turn to the Cu-O ladder compounds, which arenatural extensions of the Cu-O chain compounds to-wards the CuO2 sheet structure. Dagotto, Riera, andScalapino (1992) proposed an electronic mechanism forthe formation of spin gaps in the S51/2 antiferromag-netically coupled double chains, or two-leg ladders, andargued that the ground state upon hole doping should beeither superconducting or a charge-density wave. As dis-cussed in Sec. II.B for the category @I-2↔M-2# of theMIT and also in Sec. II.G.2, the mechanism of supercon-ductivity induced by doping of carriers into a spin-gapped Mott insulator is similar to that proposed in adimerized system (Imada, 1991, 1993c). The pairingmechanism proposed in doped ladders shares the sameorigin as the dimerized case because coupled laddersand coupled dimerized chains are continuously con-nected in the parameter space of the models (Katoh andImada, 1995). The most representative compounds tosubstantiate such an idea are a homologous series ofladder systems Srn21Cun11O2n (n5odd), as shown inFig. 67 (Sec. III.B) for n53 (SrCu2O3) and n55(Sr2Cu3O5). In Srn21Cun11O2n , Cun11O2n sheets alter-nate with Srn21 sheets along the c axes of their ortho-rhombic cells (Hiroi et al., 1991). In each ladder, strongantiferromagnetic interactions should occur through thelinear Cu-O-Cu bonds along the a and b axes. By con-trast, Cu-O-Cu bonds across the interface between lad-ders are formed with the right angle at the oxygen cor-ner of the Cu-O-Cu bond and hence the exchangeinteraction in these bonds must be much weaker and befrustrated at the interface.
Rice and co-workers (Rice et al., 1993; for a review,see also Dagotto and Rice, 1996) theoretically investi-gated the ground state of S51/2 multileg spin ladderslike Srn21Cun11O2n and concluded that the spin gap isopen or closed according to whether the leg number[5(n11)/2] is even or odd. They further predicted thatlight hole doping into the even-leg ladder keeps the spingap open and leads to singlet superconductivity.
Rev. Mod. Phys., Vol. 70, No. 4, October 1998
The temperature dependence of the magnetic suscep-tibility (x) of two-leg SrCu2O3 and three-leg Sr2Cu3O5 isshown in Fig. 163. The data after subtraction of the Cu-rie component, which is due to impurity phases, show aclear spin-gap behavior for SrCu2O3. The observed tem-perature dependence of x in SrCu2O3 follows the theo-retically predicted form for the two-leg ladder system(Troyer, Tsunetsugu, and Wurtz, 1994), x(T)5aT21/2exp(2Ds /T), with the spin-gap energy Ds5420 K and the prefactor (relating to the dispersion ofthe excitation) a5431023, as shown by a solid line inthe figure. By contrast, x remains with no spin gap forSr2Cu3O5 with a three-leg ladder structure, confirmingthe theoretical prediction.
The presence or absence of the spin gap depending onthe number of legs is also confirmed by measurements ofthe nuclear spin-lattice relaxation rate 1/T1 in NMR(Azuma et al., 1994). The Arrhenius plot of 1/T1 forSrCu2O3 at temperature T&D gave the spin-gap value680 K. An apparent difference between spin-gap valuesdeduced from the susceptibility (or Knight shift) and theNMR relaxation rate is due to the fact that the tempera-tures of the NMR data are too high to extract the true
FIG. 163. Temperature dependence of magnetic susceptibilityfor SrCu2O3 (upper panel) and Sr2Cu3O5 (lower panel): opencircles, observed; closed circles, corrected by subtraction of theCurie component from the raw data. The solid line in the up-per panel represents the calculated susceptibility assuming aspin gap of 420 K. From Azuma et al., 1994.

1203Imada, Fujimori, and Tokura: Metal-insulator transitions
gap by fitting for 1/T1 . When one takes the data at thelowest temperatures, the gap Ds extracted from 1/T1agrees well with Ds;420 K. Alternatively, the large gapDs deduced from 1/T1 at relatively high temperatureswas interpreted in terms of the Majorana Fermion ap-proach by Kishine and Fukuyama (1997), who clarifiedthat higher-energy excitations contribute to 1/T1 . Theo-retically the spin gap is calculated to be about J/2 pro-vided that the inter- and intra-chain exchange interac-tions are equal. Under the same assumption, J forSrCu2O3 is estimated to be about 840 K. However, thusdeduced, the value of J in the ladder is considerablysmaller than that of the Cu-O chain compounds de-scribed above, and even smaller than that for the CuO2sheet compounds. This is rather puzzling because the Jvalue of the ladders is expected to be between the chainand sheet compounds and rather close to the chain com-pounds due to similarity of the structures. One possibleorigin of this discrepancy is interladder coupling; an-other is a larger J for leg bonds than for rung bonds inthe ladder. In fact recent neutron results and susceptibil-ity measurements are rather consistent with J i;2000 Kfor legs and J';1000 K for rungs (Johnston, 1996; Ec-cleston et al., 1997; Hiroi et al., 1997). A theoretical ex-planation of this effective exchange was proposed basedon a correction due to next-nearest-neighbor and 4-spinexchange couplings (Nagaosa, 1997). In any case the re-duction of Ds drives the system towards the quantumcritical point of the antiferromagnetic transition. Thisproblem was discussed in the context of Zn substitutionfor Cu in SrCu2O3 by Imada and Iino (1997).
Carrier doping has proved to be very difficult in theSrn11Cun11O2n series, yet some other Cu-O laddercompounds are promising for the FC-MIT.La12xSrxCuO2.5 was the first system (Hiroi and Takano,1995) in which holes were successfully introduced intothe Cu-O ladder structures and the metallic state (x*0.15) emerged. However, superconductivity was notfound in this compound. The crystal structure ofLaCuO2.5 can be derived from the 3D perovskite struc-ture (e.g., LaCuO3) by regularly removing oxygens inrows, as shown in Fig. 164. The ground state of the par-ent compound LaCuO2.5 was suggested from susceptibil-ity measurements to be the singlet spin liquid. The NMR(Matsumoto et al., 1996) and mSR (Kadono et al., 1996)experiments have, however, shown that the ground stateis not the spin-gapped state but the antiferromagneti-cally ordered state below TN('110 K), probably due toappreciable interladder interaction.
The hole-doped compounds La12xSrxCuO2.5 exhibit areduction in electrical resistivity with x by several ordersof magnitude and become metallic for x>0.15. Thetransport properties in the metallic region are those ofconventional Fermi liquids (Nozawa et al., 1997): Theresistivity shows a T2 dependence; the Hall coefficient issmall and negative. As for the magnetic susceptibility,upon hole doping, it loses the spin-gap behavior and be-comes nearly temperature independent: x;1024 emu/mol for x>0.15 (apart from Curie contribu-tions from impurities). The electronic structure of
Rev. Mod. Phys., Vol. 70, No. 4, October 1998
La12xSrxCuO2.5 was studied by photoemission and x-rayabsorption (Mizokawa et al., 1997). The evolution of theelectronic structure with hole doping is qualitatively thesame as that in La22xSrxCuO4 (see, for example, Chenet al., 1991), but the doping-induced spectral weight justabove EF—monitored by oxygen 1s absorptionspectroscopy—is distributed at higher energies than inLa22xSrxCuO4, resulting in a lower spectral weight atEF . Photoemission spectra show that the DOS at EF issubstantially lower than that in the 2D La22xSrxCuO4,but still finite at EF in the metallic samples. The lowDOS at EF may be a characteristic feature of quasi-1Dmetals (Sec. II.G.2). According to an LDA band-structure calculation of LaCuO2.5 (Mattheiss, 1996a), thep-ds band of the Cu-O ladder shows a finite dispersionwidth of ;1 eV perpendicular to the ladder, comparedto the ;2 eV dispersion along the ladder. This results in^v i
2&/^v'2 &.16, which is substantially smaller than the
^v i2&/^v'
2 & value of .100 for the 2D system La2CuO4.Holes can be doped into another ladder compound
with misfit structure, (La, Sr, Ca)14Cu24O41 (McCarronet al., 1988; Siegrist et al., 1988). The compound, whosestructure is schematically shown in Fig. 165, is composedof Cu2O3 planes with two-leg ladders alternating up thec axis with planes containing CuO2 chains with edge-shared links of CuO4, as [(La,Sr,Ca)2Cu2O2]7[CuO2]10 .The Cu21-based compound La6Ca8Cu24O41 is viewed asthe parent Mott insulator, and holes can be doped bysubstitution of Sr for La, as in La62ySryCa8Cu24O41 .Carter et al. (1996) found that the y50 parent com-pound showed a temperature dependence of the suscep-tibility consistent with weakly interacting 10(60.5) Cu21
spins per formula unit, all contributed from the chainsite. The Cu21 spins on the ladder were virtually inertbelow 300 K due to the large spin gap. In fact, from theNMR measurement of 1/T1 and shift of 63Cu, Magishiet al. (1998) deduced the spin gap for the ladder unit asD ladder5619620 K and for the related compound ofSr14Cu24O41 as 510620 K. The D ladder for the above y50 compound is possibly even larger. Introduction ofone hole by substitution of Sr for La is observed to re-
FIG. 164. Perspective view of the crystal structure ofLaCuO2.5. From Hiroi and Takano, 1995.

1204 Imada, Fujimori, and Tokura: Metal-insulator transitions
move one Cu spin, which means that the doped hole(yÞ0) resides on the chain site, producing a nominalnonmagnetic Cu31 site or Zhang-Rice singlet.
A rather complicated hole count is needed in the caseof the solid solution Sr142xCaxCu24O41 , in which holesappear to be transferred into the ladder with increase ofx (Kato et al., 1996), although the average Cu valence is12.25 and unchanged with x . In the x50 compoundSr14Cu24O41 , most of the holes seem to reside on thechains, forming spin dimers. Below 240 K, the chain ap-pears to be subject to charge ordering (4kF CDW), andat lower temperatures (below '60 K) undergoes a sin-glet pairing of the spin sites (Carter et al., 1996; Matsudaet al., 1996). The singlet-triplet gap ('140 K) on thechain manifests itself in the temperature dependence ofthe x (Carter et al., 1996; Matsuda and Katsumata, 1996;McElfresh et al., 1989) as well as in the inelastic neutron-scattering spectra (Eccleston et al., 1998). As mentionedabove, the spin gap on the ladder for Sr14Cu24O41 ismuch larger; D ladder5619620 K (from the NMR rate1/T1) or 510620 K (from the NMR shift; Magishi et al.,1998).
With increasing Ca content x , the resistivity is muchreduced (Yamane, Miyazaki, and Hirai, 1990; Katoet al., 1994) yet remains semiconducting. The presence
FIG. 165. Crystallographic structure (upper) of(La,Y,Sr,Ca)14Cu24O41 (McCarron et al., 1988), in which (a)the CuO2 chain and (b) the Cu2O3 ladder stack along the baxis (vertical in this figure). The a axis is in the horizontaldirection in this figure, while the ladder and chain axes arealong the c axis.
Rev. Mod. Phys., Vol. 70, No. 4, October 1998
of mobile holes was confirmed by optical spectroscopywith single-crystalline samples of Sr142xCaxCu24O41 (Os-afune et al., 1997). In Fig. 166, the Eic (ladder axis) op-tical conductivity spectrum is shown for single crystals ofSr142xAxCu24O41 , where A is Ca or Y. The inset com-pares the Eic and Eia spectra for x(Ca)511. The Eicpolarized quasi-Drude absorption below 1 eV graduallyevolves with increase of x(Ca), indicating the quasim-etallic responses of the doped holes on the ladder site.The x(Y)53 crystal should show minimal holes amongthe crystals investigated in Fig. 166, and its conductivityspectrum shows a clear onset around 1.6 eV due to acharge-transfer-type gap. As expected from the afore-mentioned transport and magnetic features, the x50crystal shows only a small weight of innergap absorp-tion, ensuring a tiny fraction of holes on the ladder sitesat this composition. However, a strong absorption bandpeaking around 3 eV emerges with decrease of x(Y)and hence has been attributed to excitation of the holein the chain sites. Osafune et al. (1997) have furtherdone a hole count on the ladder and chain sites as afunction of Ca content x , by estimating the spectralweight in the inner gap region, using the assumption thatthe hole concentration is 1/2 on the chain site for the x50 (Sr14Cu24O41) compound. This assumption comesfrom the aforementioned fact that the CuO2 chains showcharge ordering perhaps at a rate of one hole per two Cusites (Carter et al., 1996; Matsuda et al., 1996). Accord-ing to such an estimate (Osafune et al., 1997), the holeconcentration increases up to '0.20 for the x(Ca)511compound. The dominant feature of s(v) in the metallicphase is similar to that of the high-Tc cuprates—a broadtail indicating a strongly incoherent contribution in thetransport. This feature is consistent with recent numeri-cal studies of ladder systems (Tsunetsugu and Imada,1997).
FIG. 166. The E'(ladder) optical conductivity at room tem-perature for single-crystalline samples of Sr142xAxCu24O41 ,A5Ca or Y. The anisotropic spectra with a and c polarizationare shown for Sr3Ca111Cu24O41 in the inset. From Osafuneet al., 1997.

1205Imada, Fujimori, and Tokura: Metal-insulator transitions
Uehara et al. (1996) found that the resistivity r in themost Ca-substituted compound (x513.6) still shows anupturn below 200 K but can be further reduced by theapplication of pressure. In fact, they discovered the oc-currence of superconductivity at 9–12 K in the limitedpressure range of 3–4.5 GPa. The quality of polycrystal-line samples prepared under high oxygen pressure is notadequate for a discussion of the charge dynamics in su-perconducting Sr142xCaxCu24O41 . The measurement ofthe anisotropic r in superconducting single crystals ofSr142xCaxCu24O41 under pressure is being attempted(Nagata, Uehara, et al., 1998).
It is important to clarify whether the observed super-conductivity in Sr142xCaxCu24O41 is truly relevant tosuch an exotic mechanism of carrier doping into thespin-gapped Mott insulator as was proposed by Imada(1991), Dagotto, Riera, and Scalapino (1992), and Riceet al. (1993). Kumagai et al. (1997) and Magishi et al.(1998) reported that the D ladder deduced from the NMRKnight shift was reduced with hole doping on the laddersite, from 510620 K for x(Ca)50 to 180610 K for x59. The tentative linear extrapolation of the two (forx50 and 9) experimental points appears to intersectzero around x'13. However, later NMR data for high-x('13) samples (Magishi et al., 1998) indicated a persis-tent spin gap in such a high-x region where supercon-ductivity was observed in the pressurized sample. Inelas-tic neutron scattering appears to show that the xdependence of the gap is weak (Nagata, Fujino, et al.,1998), while recent NMR data at x511.5 under a pres-sure of 29 kbar suggested collapse of the spin gap (May-affre et al., 1997). Much work will be needed to clarifythis intriguing new phenomenon in the spin-ladder com-pounds as well as its possible relevance to high-Tc su-perconductivity in the CuO2-layered compounds.
2. BaVS3
The crystal structure of BaVS3 (Fig. 167) is based onthe hexagonal NiAs type such as VS, from which 2/3 ofthe V atoms are removed or replaced by Ba atoms, re-
FIG. 167. Crystal structure of BaVS3. From Nakamura et al.,1994a.
Rev. Mod. Phys., Vol. 70, No. 4, October 1998
sulting in well-separated V chains running along the caxis: The V-V distance along the c axis is 2.84 Å whilethat between the chains is as long as 6.72 Å (Sayetatet al., 1982; Ghedira et al., 1986). The formal valence ofV is V41 and hence the d-band filling is n51. This com-pound has attracted much interest because it shows atemperature-dependent second-order phase transition at;74 K between a paramagnetic conducting phase onthe high-temperature side and a paramagnetic semicon-ducting phase on the low-temperature side. Below;35 K, antiferromagnetic ordering has been suggestedby NMR studies (Nishihara and Takano, 1981), neutronspin-flip scattering (Heidemann and Takano, 1980), andspecific-heat (Imai et al., 1996) studies, although therehas been so far no experimental evidence for long-rangeorder. Indeed, a recent NMR study has shown that theground state is nonmagnetic with possible orbital order-ing (Nakamura et al., 1997). As shown in Fig. 168, theresistivity in the high-temperature phase is relatively low(in the 1023 V cm range, which is high for a metal) andnearly temperature independent; it shows a minimum at;150 K, above which it behaves as metallic (dr/dT.0) (Takano et al., 1977; Massenet et al., 1979; Mats-uura et al., 1991; Graf et al., 1995). Below ;74 K, theresistivity rapidly increases by several orders of magni-tude down to the lowest temperature studied (the acti-vation energy being 100–300 K), with an inflection pointat ;50 K. The Seebeck coefficient is negative and showsmetallic temperature dependence above ;70 K. Below;70 K, it becomes positive and semiconductor-like, in-dicating that the 74-K transition is between a p-typesemiconductor and a metal (Matsuura et al., 1991). Thenegative Hall coefficient at 100 K corresponds to anelectron density of 2.531021 cm23 or ;0.3 electrons perV atom.
The magnetic susceptibility above ;74 K, displayedin Fig. 168, shows Curie-Weiss behavior with an effec-tive moment of 1.0–1.1 mB , which is smaller than thespin-only value of 1.73mB (for S51/2) or the free atomicvalue of 1.55mB (for J53/2); it also shows a positiveWeiss constant of 20–40 K (Kebler et al., 1980; Naka-mura et al., 1994a). This indicates that in going from
FIG. 168. Electrical resistivity and magnetic susceptibility ofBaVS3 (Graf et al., 1995). The circle in the inset shows wherethe structural transition occurs.

1206 Imada, Fujimori, and Tokura: Metal-insulator transitions
high to low temperatures, the spin correlation changesits character from ferromagnetic to antiferromagnetic.The peak at the transition point ;74 K is reminiscent ofan antiferromagnetic transition, but no magnetic orderhas been found down to ;35 K. Although the simulta-neous decrease of the magnetic susceptibility and theelectrical conductivity below ;74 K suggests a CDWformation or a spin Peierls transition, no correspondingpairing of V atoms has been detected in the structuralstudies. If the high-temperature conducting phase can beregarded as a metal, then the 74-K transition can bethought of as a genuine Mott transition in the sense thatit occurs between paramagnetic phases without involv-ing any long-range magnetic order or lowering of struc-tural symmetry, although the transition is not of firstorder. The extra (magnetic and electronic) entropy DSof conduction electrons in BaVS3 was obtained by sub-tracting the specific heat of BaTiS3 from that of BaVS3,as shown in Fig. 169. The figure shows that DS increasesfrom ;0 J K21 mol21 at ;40 K to ;4.5 J K21 mol21 at;74 K, and then reaches R ln 2 at ;170 K. The gradualincrease of the entropy above ;35 K implies that short-range dynamic order gradually develops above ;35 Kand even above ;74 K to a lesser extent. The increasein the resistivity with decreasing temperature above;74 K (between ;74 K and the resistivity minimum at;150 K) would be consistent with this picture, that is,with the fluctuation of the order parameter above thesecond-order phase transition: Such a fluctuation effectis characteristic of quasi-1D systems. The appearance of3D antiferromagnetism below ;35 K may be caused bya weak but finite interchain interaction, since purely 1Dsystems should not show long-range order. The unusualmagnetic behavior of BaVS3 below ;74 K was attrib-uted to frustrations due to the triangular arrangement ofthe V chains (Imai et al., 1996). In addition to the 74-Kand 35-K transitions, the magnetic susceptibility and thespecific heat show an anomaly at ;160 K: Below;160 K, the Curie constant slightly increases and theWeiss constant decreases from ;40 K to ;20 K, indi-
FIG. 169. Extra entropy DS due to conduction electrons inBaVS3 obtained by subtracting the specific heat of BaTiS3from that of BaTiS3. From Imai et al., 1996.
Rev. Mod. Phys., Vol. 70, No. 4, October 1998
cating that the magnetic correlation becomes less ferro-magnetic.
Apart from the electronic and magnetic phase transi-tions described above, BaVS3 shows a second-orderstructural phase transition from the high-temperaturehexagonal phase to the low-temperature orthorhombicphase at ;250 K, below which the linear V chains pro-gressively become zigzag ones (Sayetat et al., 1982;Ghedira et al., 1986). It is suggested that the zigzag dis-tortion remains as a dynamical fluctuation above;250 K due to a large thermal ellipsoid for the V atom.As shown in Fig. 170, the orthorhombic distortion fur-ther increases below ;74 K.
The 74-K phase transition is sensitive to structural de-fects such as S vacancies and Ti substitution for V. The74-K peak in the magnetic susceptibility disappears forS-deficient samples (typical compositions beingBaVS;2.97), which become ferromagnetic with Curietemperatures of 16–17 K (Massenet et al., 1978). Theelectrical resistivity is nearly constant, as in the stoichio-metric BaVS3, above ;150 K but gradually increaseswith decreasing temperature below it. As for Ti substi-tution for V, the 74-K peak in the magnetic susceptibil-ity disappears for such a small Ti concentration as;5%, while the resistivity above ;70 K gradually in-creases with Ti concentration and becomes semiconduc-
FIG. 170. Upper panel, orthorhombic lattice parameters ofBaVS3 as functions of temperature (Sayetat et al., 1982); lowerpanel: corresponding changes of the electronic structures (Na-kamura et al., 1994a). The densities of state for the dz2 anddxy2dx22y2 bands are shown by thin and thick solid lines, re-spectively.

1207Imada, Fujimori, and Tokura: Metal-insulator transitions
tive; in BaV0.8Ti0.2S3, the resistivity becomes 1–3 ordersof magnitude higher than that of BaVS3 over the wholetemperature range (Matsuura et al., 1991). Beyond thatcomposition, the resistivity decreases with Ti concentra-tion (Massenet et al., 1979). The origin of the increase inmagnetic susceptibility below ;20–30 K is not clear atpresent. Because its magnitude is sample dependent andits contribution is not detected in the specific heat, it islikely that it is due to a magnetic impurity phase such asferromagnetic BaVS32d (Graf et al., 1995). The 74-Ktransition is also sensitive to external pressure: The tran-sition temperature decreases under pressure and ap-pears to vanish around 20 kbar (Graf et al., 1995).
From the systematic chemical trends of the electronicstructure of transition-metal compounds, it is expectedthat the V 3d-S 3p hybridization will be extremelystrong (the charge-transfer energy being D;0). Indeed,LDA band-structure calculations have shown stronglyhybridized V 3d and S 3p bands. Mattheiss (1995) madeband-structure calculations on the low-temperatureorthorhombic phase as well as on the high-temperaturehexagonal phase without magnetic ordering and foundno band-gap opening. Itoh, Fujiwara, and Tanaka (1994)made calculations on the antiferromagnetic state butalso failed to open a band gap at EF . These results in-dicate that electron-electron interaction has to be takeninto account beyond the level of LDA or LSDA in orderto account for the low-temperature insulating state, as inthe cases of other Mott insulators. Apart from the elec-tronic structure near EF , which will be discussed below,the overall photoemission spectra are well described bythe DOS given by the band-structure calculations, asshown in Fig. 171 (Itti et al., 1991; Nakamura et al.,1994a). As shown in Fig. 170, the distortion of the VS6
FIG. 171. Valence-band photoemission spectrum of BaVS3(Nakamura et al., 1994b) compared with the DOS from aband-structure calculation (Itoh, Fujiwara, and Tanaka, 1994).The sharp Fermi edge is not observed in the photoemissionspectrum.
Rev. Mod. Phys., Vol. 70, No. 4, October 1998
octahedra along the hexagonal c axis splits the t2g levelinto high-lying dz2 and low-lying dxy and dx22y2 levels.With the orthorhombic distortion below ;250 K, thedegeneracy of the low-lying level is lifted, leading to apopulation imbalance between the split dxy2dx22y2 lev-els. (Here, the z axis is taken along the c direction.)Further increase in the orthorhombic distortion below;74 K may indicate that one of the split dxy2dx22y2
levels is fully occupied, resulting in a Mott insulatingstate. In this picture, the multiband situation in the me-tallic phase would favor ferromagnetic coupling betweenthe V atoms. According to the band-structure calcula-tions, near EF , the dxy and dx22y2 orbitals form narrowenergy bands while the dz2 orbitals form relatively wideenergy bands dispersing along the c axis. The Fermilevel is pinned by the dxy2dx22y2 bands.
Although quasi-1D metallic behavior of the dz2 elec-trons is expected from the crystal and electronic struc-tures, no anisotropic transport has been investigated sofar on single crystals. On the other hand, it has beentheoretically predicted that a 1D metal is not a Fermiliquid but behaves as a Tomonaga-Luttinger liquid. Thesingle-particle spectral function of such a 1D metalshould exhibit a characteristic non-Fermi-liquid behav-ior, as described above. Such an observation was re-cently made by high-resolution photoemission spectros-copy, as shown in Fig. 172 (Nakamura et al., 1994a): Asin other quasi-1D metals, the spectra exhibit an unusualsuppression of photoemission intensity at EF . Fromroom temperature to ;90 K, the spectral function nearEF can be fitted to a power law: r(v)}uv2muu [Eq.(2.376)] with u;0.8–0.9. This value is well above theupper limit of 0.125 for the exponent of the single-bandHubbard model (Kawakami and Yang, 1990), indicatingthat the short-range interaction assumed in the Hubbardmodel is not sufficient to model electron-electron inter-actions in BaVS3. According to Tomonaga-Luttingerliquid theory, the large exponent u means that the 4kF
FIG. 172. High-resolution photoemission spectrum of BaVS3near EF at various temperatures (Nakamura et al., 1994b). Thegap starts to open at ;90 K, somewhat above the transitiontemperature of ;74 K.

1208 Imada, Fujimori, and Tokura: Metal-insulator transitions
CDW correlation is the longest ranged and therefore a4kF CDW instability, i.e., localization of one electronper site, is most likely to occur in the real 3D material.This is consistent with the occurrence of the 74-K phasetransition in BaVS3, in which no antiferromagnetic or-der (2kF SDW) or Peierls distortion (2kF CDW) hasbeen detected. In the low-temperature phase, a gap of;50 meV is opened at EF in the photoemission spectra(Fig. 172). Interestingly, the gap starts to open at ;90 K,well above the transition temperature of ;74 K, prob-ably reflecting fluctuation effects above the transitionpoint. It should be noted, however, that the mass anisot-ropy given by the Fermi velocity ratio, ^v i
2&/^v'2 &, is only
;3.8, which is much smaller than ^v i2&/^v'
2 &;100 for the
FIG. 173. Crystal structure and charge order in Fe3O4. Leftpanel, the structure of Fe3O4; right panel, the ordered struc-ture of Fe21 and Fe31 at the B sites proposed by Verwey.From Tsuda et al., 1991.
Rev. Mod. Phys., Vol. 70, No. 4, October 1998
ideal 2D system La2CuO4 (Mattheiss, 1995). In spite ofthe small mass anisotropy, the photoemission spectrahave exhibited 1D-like characteristics presumably be-cause mass renormalization due to electron correlationis stronger for directions with a heavier band mass.
E. Charge-ordering systems
1. Fe3O4
Magnetite Fe3O4 forms in the spinel structure, inwhich one-third of the Fe ions are tetrahedrally coordi-nated with four oxygen ions and the remaining two-thirds are octahedrally coordinated with six oxygen ions,as shown in Fig. 173. The tetrahedral and octahedralsites are called A and B sites, respectively. In addition toits celebrated magnetic properties, which are utilized inpermanent magnets, Fe3O4 has attracted much interestfor its conductivity transition at TV.120 K, called theVerwey transition (Verwey, 1939). In going from thehigh-temperature phase to the low-temperature phase,the electrical resistivity increases by two orders of mag-nitude at TV , as shown in Fig. 174. The A-site Fe ionsare stable trivalent, while the B-site Fe ions are of mixedvalency with the ratio Fe21 : Fe3151 : 1. Here, the Fe21
and Fe31 ions have t2g↑3 t2g↓eg↑
2 (S52) and t2g↑3 eg↑
2 (S55/2) configurations, respectively. The electrical con-duction and the Verwey transition occur on the B-sitesublattice. The Fe21 and Fe31 ions at the B sites areordered below TV . Fe3O4 is ferrimagnetic below TC
FIG. 174. Electrical conductivity of Fe3O4. From Miles et al., 1957.
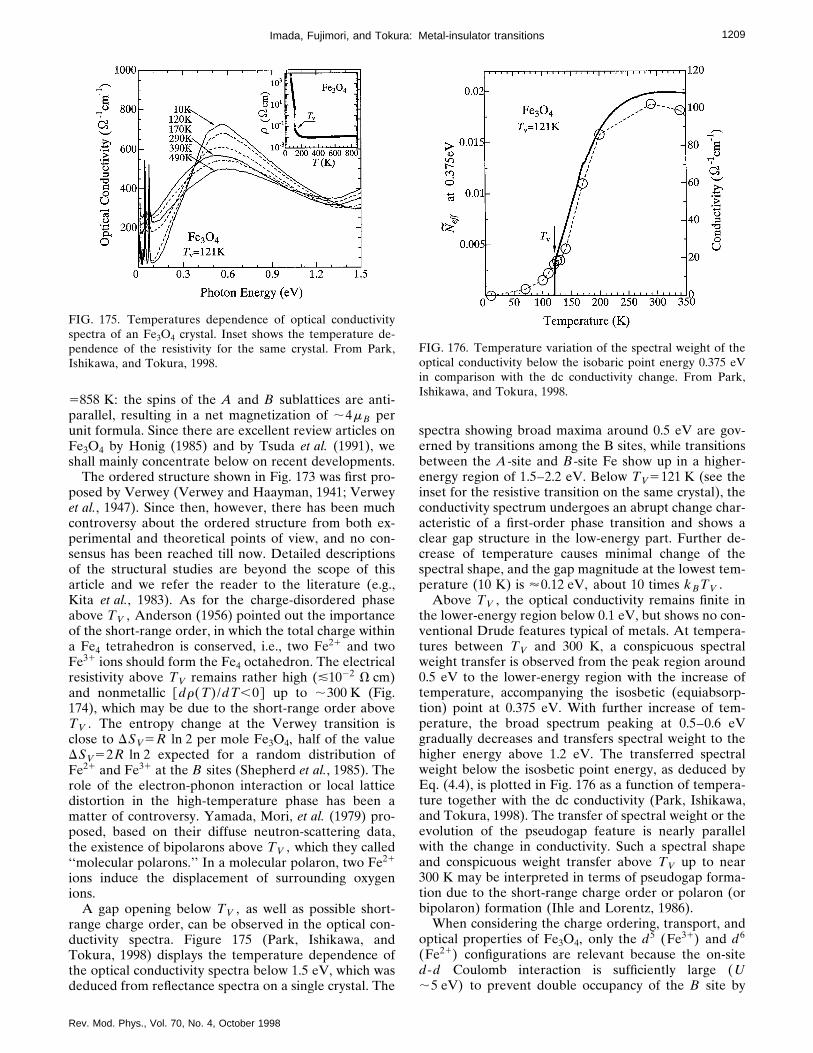
1209Imada, Fujimori, and Tokura: Metal-insulator transitions
5858 K: the spins of the A and B sublattices are anti-parallel, resulting in a net magnetization of ;4mB perunit formula. Since there are excellent review articles onFe3O4 by Honig (1985) and by Tsuda et al. (1991), weshall mainly concentrate below on recent developments.
The ordered structure shown in Fig. 173 was first pro-posed by Verwey (Verwey and Haayman, 1941; Verweyet al., 1947). Since then, however, there has been muchcontroversy about the ordered structure from both ex-perimental and theoretical points of view, and no con-sensus has been reached till now. Detailed descriptionsof the structural studies are beyond the scope of thisarticle and we refer the reader to the literature (e.g.,Kita et al., 1983). As for the charge-disordered phaseabove TV , Anderson (1956) pointed out the importanceof the short-range order, in which the total charge withina Fe4 tetrahedron is conserved, i.e., two Fe21 and twoFe31 ions should form the Fe4 octahedron. The electricalresistivity above TV remains rather high (&1022 V cm)and nonmetallic @dr(T)/dT,0# up to ;300 K (Fig.174), which may be due to the short-range order aboveTV . The entropy change at the Verwey transition isclose to DSV5R ln 2 per mole Fe3O4, half of the valueDSV52R ln 2 expected for a random distribution ofFe21 and Fe31 at the B sites (Shepherd et al., 1985). Therole of the electron-phonon interaction or local latticedistortion in the high-temperature phase has been amatter of controversy. Yamada, Mori, et al. (1979) pro-posed, based on their diffuse neutron-scattering data,the existence of bipolarons above TV , which they called‘‘molecular polarons.’’ In a molecular polaron, two Fe21
ions induce the displacement of surrounding oxygenions.
A gap opening below TV , as well as possible short-range charge order, can be observed in the optical con-ductivity spectra. Figure 175 (Park, Ishikawa, andTokura, 1998) displays the temperature dependence ofthe optical conductivity spectra below 1.5 eV, which wasdeduced from reflectance spectra on a single crystal. The
FIG. 175. Temperatures dependence of optical conductivityspectra of an Fe3O4 crystal. Inset shows the temperature de-pendence of the resistivity for the same crystal. From Park,Ishikawa, and Tokura, 1998.
Rev. Mod. Phys., Vol. 70, No. 4, October 1998
spectra showing broad maxima around 0.5 eV are gov-erned by transitions among the B sites, while transitionsbetween the A-site and B-site Fe show up in a higher-energy region of 1.5–2.2 eV. Below TV5121 K (see theinset for the resistive transition on the same crystal), theconductivity spectrum undergoes an abrupt change char-acteristic of a first-order phase transition and shows aclear gap structure in the low-energy part. Further de-crease of temperature causes minimal change of thespectral shape, and the gap magnitude at the lowest tem-perature (10 K) is '0.12 eV, about 10 times kBTV .
Above TV , the optical conductivity remains finite inthe lower-energy region below 0.1 eV, but shows no con-ventional Drude features typical of metals. At tempera-tures between TV and 300 K, a conspicuous spectralweight transfer is observed from the peak region around0.5 eV to the lower-energy region with the increase oftemperature, accompanying the isosbetic (equiabsorp-tion) point at 0.375 eV. With further increase of tem-perature, the broad spectrum peaking at 0.5–0.6 eVgradually decreases and transfers spectral weight to thehigher energy above 1.2 eV. The transferred spectralweight below the isosbetic point energy, as deduced byEq. (4.4), is plotted in Fig. 176 as a function of tempera-ture together with the dc conductivity (Park, Ishikawa,and Tokura, 1998). The transfer of spectral weight or theevolution of the pseudogap feature is nearly parallelwith the change in conductivity. Such a spectral shapeand conspicuous weight transfer above TV up to near300 K may be interpreted in terms of pseudogap forma-tion due to the short-range charge order or polaron (orbipolaron) formation (Ihle and Lorentz, 1986).
When considering the charge ordering, transport, andoptical properties of Fe3O4, only the d5 (Fe31) and d6
(Fe21) configurations are relevant because the on-sited-d Coulomb interaction is sufficiently large (U;5 eV) to prevent double occupancy of the B site by
FIG. 176. Temperature variation of the spectral weight of theoptical conductivity below the isobaric point energy 0.375 eVin comparison with the dc conductivity change. From Park,Ishikawa, and Tokura, 1998.

1210 Imada, Fujimori, and Tokura: Metal-insulator transitions
the extra electrons. Then the transport properties ofFe3O4 are governed by the intersite Coulomb interac-tion, which is orders of magnitude smaller than U . Be-cause the spins are fully polarized below TC5858 K, theextra electrons at the B site enter the t2g↓ level. There-fore a ‘‘spinless’’ Fermion model with intersite Coulombinteraction (Cullen and Callen, 1973; Ihle and Lorenz,1980) has often been employed:
H52t(i ,j&
ci†cj1
12 (
iÞjUijnjnj . (4.14)
Here Uij (!U) is the nearest-neighbor ([U1) or next-nearest-neighbor [[U2 (!U1)] Coulomb energy, andthe orbital degeneracy of the t2g level has been ne-glected for simplicity. The parameter region U1@U2with U1;0.1 eV is considered to be realistic for Fe3O4.The Hall coefficient (Siratori et al., 1988) and Seebeckcoefficient (Kuipers and Brabers, 1976) above TV arenegative, consistent with the small (1/6) filling of the t2g↓band.
Below TV , if U250, U1 determines only short-rangeorder of the Anderson type, and a large number of con-figurations are degenerate in the ground state (Ihle andLorenz, 1980). This degeneracy is lifted if U2.0, and theVerwey order is stabilized. A finite transfer t or contri-butions from electron-lattice coupling, which arises fromthe different sizes of Fe21 and Fe31 ions, can stabilizeother structures (Lorenz and Ihle, 1979, 1982). Recently,the relative stability of the Verwey structure and themore complicated ‘‘Mizoguchi structure’’ (Mizoguchi,1978), which was determined through analysis of NMRdata, has been studied by tight-binding band-structurecalculations (Mishra and Satpathy, 1993). This studyshowed that the inclusion of the kinetic energy (bandenergy or transfer energy) favors the Mizoguchi struc-ture, which has a higher second-neighbor Coulomb en-ergy. Below TV , if t is negligibly small, a gap of 2(U11U2) is opened between the occupied and empty Bsites (Ihle and Lorenz, 1980). Above TV , partial de-struction of the short-ranged order creates new states inthe middle of the gap and these states are partially filledby electrons. Ihle and Lorenz (1980) calculated the elec-trical conductivity using this model and obtained an ex-cellent fit to the experimental data (with t50 and U150.11 eV). The optical conductivity was calculated toshow a peak at v5U1 , which may qualitatively explainthe experimental data. The Seebeck coefficient aboveTV was temperature independent, consistent either withthe localized (t50) model or with strong correlation inHubbard-like models.
First-principles calculations of the electronic structureof Fe3O4 in the ferrimagnetic state were performed us-ing the LSDA (Zhang and Satpathy, 1991; Yanase andSiratori, 1984). Although the spin-polarized calculationswere able to explain the magnetic structure, it was notpossible to open a band gap within the t2g↓ band. Inorder to explain the insulating state of Fe3O4, LDA1Ucalculations were performed by Anisimov et al. (1996b).According to the LSDA calculation [Fig. 177(a)], the
Rev. Mod. Phys., Vol. 70, No. 4, October 1998
down-spin and up-spin bands from the A-site Fe arefully occupied and empty, respectively (corresponding tothe high-spin Fe31 ion), and the Fermi level is locatedwithin the t2g↓ band of the B-site Fe, resulting in themetallic state. In the LDA1U calculations, two sublat-tices for the B sites (B1 and B2 corresponding to theFe31 and Fe21 sites, respectively) were assumed in aVerwey-type charge ordering, and the resulting DOS isshown in Fig. 177(b). While the local DOS of the B1sublattice is similar to that of the A site (with the spindirections interchanged), the down-spin t2g band of theB2 sublattice is split into a nondegenerate occupiedband and a twofold degenerate unoccupied band due tothe on-site U , as in Mott insulators. Thus a small gap of0.34 eV is opened between the B2-site t2g↓ band belowEF and the B1-site t2g↓ band above EF . Although thelarge on-site Coulomb interaction is a necessary condi-tion for opening the gap in Fe3O4, the magnitude of thegap is determined by the smaller intersite d-d Coulombinteraction. The intersite Coulomb energy was estimatedusing the constrained LDA method to be 0.18 eV, whichis an order of magnitude smaller than the bare point-charge value. This reduction is due to p-d covalency anddielectric polarization of the constituent ions.
The overall line shape of the valence-band photoemis-sion spectra of Fe3O4 can be described as a superposi-tion of that of the Fe21 ion (at octahedral sites) andthose of the Fe31 ions (at both octahedral and tetrahe-dral sites) (Alvarado et al., 1976; Siratori et al., 1986; Ladand Henrich, 1989; Park et al., 1997a). To be more exact,each of the Fe21 and Fe31 spectra consists of the mainstructure, which arises primarily from the dnLI finalstate, and a high-binding energy satellite, which arisesprimarily from the dn21 final state, as described by theconfiguration-interaction cluster model (Sec. III.A.2;Fujimori, Saeki, et al., 1986; Fujimori, Kimizuka, et al.,1987). Here, n56 and 5 for the Fe21 and Fe31 compo-nents, respectively. According to this picture, the spec-tral feature just below EF comes from the removal of at2g↓ electron from the B2 site, which well corresponds tothe band picture presented above. Detailed electronicstructure near EF and its temperature dependence wereinvestigated by high-resolution photoemission studies.According to Park et al. (1997a), the spectra show nointensity at EF either above or below TV;120 K, butthe magnitude of the gap is reduced above TV . Theyinterpreted the result as an insulator-to-insulator transi-tion. The resistivity jump at TV is quantitatively ex-plained by a change in the magnitude of the gap. Chai-nani et al. (1995) reported that, above TV , the spectrashow a finite DOS at EF , as shown in Fig. 178, andconcluded that the transition is indeed a metal-insulatortransition. However, the broad peak at ;1 eV belowEF , which was assigned to the 6A1g (t2g↑
3 eg↑2 ) final state
at the Fe21 site in the low-temperature phase, survives inthe high-temperature phase. This implies that short-range order persists above TV . The photoemission in-tensity at EF is extremely weak and therefore, if thespectra are compared with the band DOS, an extremelysmall mk /mb!1 and hence Z!1 are implied (Sec.

1211Imada, Fujimori, and Tokura: Metal-insulator transitions
FIG. 177. Density of states of Fe3O4 in the ferrimagnetic state, calculated using (a) the LDA and (b) LDA1U methods (Anisimovet al., 1996). The Fermi level is at 0 eV.
II.D.1). This is consistent with the poor/incoherent me-tallic state implied by the transport and optical studies.
2. La12xSrxFeO3
A unique type of charge-ordering phenomenon is ob-served in La12xSrxFeO3 below about 210 K around x52/3, involving valence skipping of Fe sites as well asantiferromagnetic spin ordering (Takano and Takeda,1983; Battle et al., 1988, 1990). One end compoundLaFeO3 is an antiferromagnetic insulator with 3d5 (S55/2) configuration of Fe that is characterized by highNeel temperature (TN5738 K). The other end com-pound SrFeO3 is an antiferromagnetic metal with TN5134 K. In the solid solution system La12xSrxFeO3, theNeel temperature decreases monotonically with x (Park,Yamaguchi, and Tokura, 1998). (To be precise, the an-tiferromagnetic state shows spin canting with weak fer-romagnetism.) For x.0.1, the high-temperature para-magnetic phase above TN is semiconducting orconducting, while the resistivity shows a steep increaseat temperatures below TN and insulating behavior in theantiferromagnetic phase, at least for x&0.7. When thedoping level x is around 2/3 (0.67), the resistivity showsan abrupt increase at around 207 K with a narrow ther-mal hysteresis, as shown in Fig. 179, signaling the occur-rence of a first-order phase transition, that is, the charge-ordering (CO) phase transition with simultaneousantiferromagnetic spin ordering. This electronic phase
Rev. Mod. Phys., Vol. 70, No. 4, October 1998
change proved to be the simultaneous charge and spinordering in a superlattice structure depicted in Fig. 180(Battle et al., 1990).
The charge disproportionation in the sample withnear-x52/3 was first detected by Mossbauer spectros-
FIG. 178. Photoemission spectra of Fe3O4 near EF (Chainaniet al., 1995). The gap opens below the Verwey transition of121 K.

1212 Imada, Fujimori, and Tokura: Metal-insulator transitions
copy (Takano and Takeda, 1983). According to a profileanalysis of temperature-dependent Mossbauer spectra,two kinds of Fe-site species with nominal valences ofFe31 and Fe51 were identified with number ratio of 2:1.The Fe51 valence is unusually high and seldom realized.It is worth noting that Fe51 shows the full spin-up occu-pancy of t2g states, benefited by maximal Hund’s-rulecoupling energy without loss of crystal-field splitting (10Dq) energy. Such an anomalous valence state as well asthe real-space ordering of the valence-skipping sites wasconfirmed by neutron-scattering measurements (Battleet al., 1990). The disproportionated charges are con-densed within the (111) plane in the cubic perovskitesetting. From the magnitudes of the respective staggeredmoments on the Fe sites, estimated by neutron diffrac-tion, the Fe valence was estimated to be 13.4 and 14.2,respectively, perhaps corresponding to the Fe31 andFe51 species detected by Mossbauer spectroscopy. Thestructural change of the lattice upon the CO transition,perhaps associated with breathing-type distortions ofFeO6 octahedra, was revealed by electron diffractionmeasurements (Li et al., 1997), indicating a consistentsuperlattice structure, as shown in Fig. 180. The opticalspectra also show a distinct splitting of the optical pho-
FIG. 179. Temperature dependence of spontaneous magneti-zation (MS), resisitivity (r), and magnetic susceptibility (x) forLa12xSrxFeO3 with x50.67 (Park, Yamaguchi, and Tokura,1998). The small spontaneous magnetization observed in thecharge-ordered phase is due to the minimal spin canting in theessentially antiferromagnetic state.
Rev. Mod. Phys., Vol. 70, No. 4, October 1998
non modes due to folding of the phonon dispersionbranch, caused by lattice distortion at the CO transition,as well as the opening of a small (,0.1 eV) charge gap(Ishikawa et al., 1998).
The electronic structures of the end members,LaFeO3 and SrFeO3, are quite contrasting, as expectedfrom the opposite consequences of multiplet effects ind5 and d4 compounds predicted in Sec. III.A.4. LaFeO3is a rather ionic insulator with a large band gap. Dopedholes have relatively pure p-hole character, as demon-strated by O 1s x-ray absorption spectroscopy (Abbateet al., 1992). On the other hand, SrFeO3 is strongly co-valent and the band gap is closed (see Fig. 56): theground state is dominated by the d5LI configurationrather than the d4 configuration (Bocquet et al., 1992b).Therefore the net d-electron number is not much differ-ent in the nominally Fe31 and Fe41 (and probably Fe51)compounds. Because of this, the electrostatic energy ofthe system does not increase significantly with chargedisproportionation, which is nominally denoted byFe411Fe41→Fe311Fe51, compared to other com-pounds. More importantly, the small charge-transfer en-ergy D;0 and the resulting small ‘‘band gap’’ (Egap;0) for the Fe41 oxides would favor charge dispropor-tionation, as observed experimentally for La12xSrxFeO3with x;0.7 and for CaFeO3 (Takano and Takeda, 1983;Takano et al., 1991).
3. La22xSrxNiO4
Hole-doped La2NiO4 also shows cooperative orderingof holes and Ni spins below some critical temperature(Tco). The behavior of doped holes in a 2D antiferro-magnetic correlated insulator has been the subject ofvital theoretical investigations concerned with theanomalous normal-state properties of the high-temperature superconducting cuprates. The charge-ordering (CO) phenomena of doped nickelates are onesuch example and may be viewed as a prototype of the
FIG. 180. Schematic structure of the charge- and spin-orderedstate with charge disproportion in La12xSrxFeO3 (x50.67).
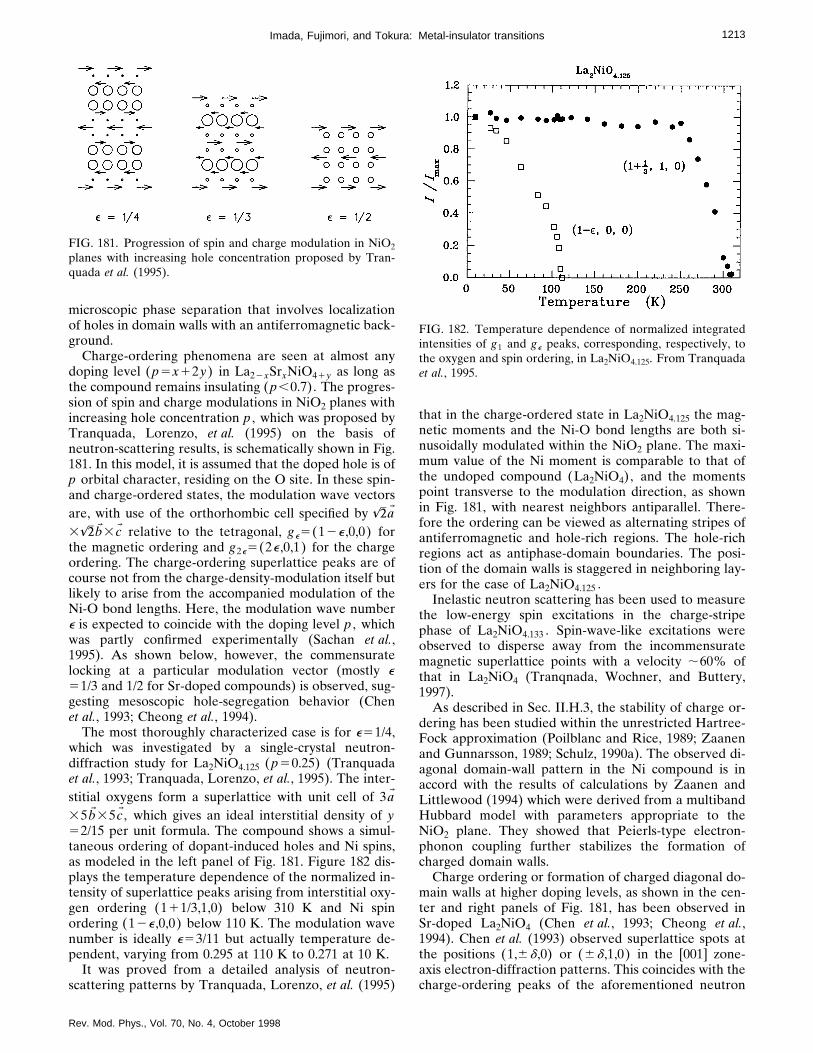
1213Imada, Fujimori, and Tokura: Metal-insulator transitions
microscopic phase separation that involves localizationof holes in domain walls with an antiferromagnetic back-ground.
Charge-ordering phenomena are seen at almost anydoping level (p5x12y) in La22xSrxNiO41y as long asthe compound remains insulating (p,0.7). The progres-sion of spin and charge modulations in NiO2 planes withincreasing hole concentration p , which was proposed byTranquada, Lorenzo, et al. (1995) on the basis ofneutron-scattering results, is schematically shown in Fig.181. In this model, it is assumed that the doped hole is ofp orbital character, residing on the O site. In these spin-and charge-ordered states, the modulation wave vectorsare, with use of the orthorhombic cell specified by &aW
3&bW 3cW relative to the tetragonal, ge5(12e ,0,0) forthe magnetic ordering and g2e5(2e ,0,1) for the chargeordering. The charge-ordering superlattice peaks are ofcourse not from the charge-density-modulation itself butlikely to arise from the accompanied modulation of theNi-O bond lengths. Here, the modulation wave numbere is expected to coincide with the doping level p , whichwas partly confirmed experimentally (Sachan et al.,1995). As shown below, however, the commensuratelocking at a particular modulation vector (mostly e51/3 and 1/2 for Sr-doped compounds) is observed, sug-gesting mesoscopic hole-segregation behavior (Chenet al., 1993; Cheong et al., 1994).
The most thoroughly characterized case is for e51/4,which was investigated by a single-crystal neutron-diffraction study for La2NiO4.125 (p50.25) (Tranquadaet al., 1993; Tranquada, Lorenzo, et al., 1995). The inter-stitial oxygens form a superlattice with unit cell of 3aW
35bW 35cW , which gives an ideal interstitial density of y52/15 per unit formula. The compound shows a simul-taneous ordering of dopant-induced holes and Ni spins,as modeled in the left panel of Fig. 181. Figure 182 dis-plays the temperature dependence of the normalized in-tensity of superlattice peaks arising from interstitial oxy-gen ordering (111/3,1,0) below 310 K and Ni spinordering (12e ,0,0) below 110 K. The modulation wavenumber is ideally e53/11 but actually temperature de-pendent, varying from 0.295 at 110 K to 0.271 at 10 K.
It was proved from a detailed analysis of neutron-scattering patterns by Tranquada, Lorenzo, et al. (1995)
FIG. 181. Progression of spin and charge modulation in NiO2planes with increasing hole concentration proposed by Tran-quada et al. (1995).
Rev. Mod. Phys., Vol. 70, No. 4, October 1998
that in the charge-ordered state in La2NiO4.125 the mag-netic moments and the Ni-O bond lengths are both si-nusoidally modulated within the NiO2 plane. The maxi-mum value of the Ni moment is comparable to that ofthe undoped compound (La2NiO4), and the momentspoint transverse to the modulation direction, as shownin Fig. 181, with nearest neighbors antiparallel. There-fore the ordering can be viewed as alternating stripes ofantiferromagnetic and hole-rich regions. The hole-richregions act as antiphase-domain boundaries. The posi-tion of the domain walls is staggered in neighboring lay-ers for the case of La2NiO4.125 .
Inelastic neutron scattering has been used to measurethe low-energy spin excitations in the charge-stripephase of La2NiO4.133 . Spin-wave-like excitations wereobserved to disperse away from the incommensuratemagnetic superlattice points with a velocity ;60% ofthat in La2NiO4 (Tranqnada, Wochner, and Buttery,1997).
As described in Sec. II.H.3, the stability of charge or-dering has been studied within the unrestricted Hartree-Fock approximation (Poilblanc and Rice, 1989; Zaanenand Gunnarsson, 1989; Schulz, 1990a). The observed di-agonal domain-wall pattern in the Ni compound is inaccord with the results of calculations by Zaanen andLittlewood (1994) which were derived from a multibandHubbard model with parameters appropriate to theNiO2 plane. They showed that Peierls-type electron-phonon coupling further stabilizes the formation ofcharged domain walls.
Charge ordering or formation of charged diagonal do-main walls at higher doping levels, as shown in the cen-ter and right panels of Fig. 181, has been observed inSr-doped La2NiO4 (Chen et al., 1993; Cheong et al.,1994). Chen et al. (1993) observed superlattice spots atthe positions (1,6d ,0) or (6d ,1,0) in the [001] zone-axis electron-diffraction patterns. This coincides with thecharge-ordering peaks of the aforementioned neutron
FIG. 182. Temperature dependence of normalized integratedintensities of g1 and ge peaks, corresponding, respectively, tothe oxygen and spin ordering, in La2NiO4.125. From Tranquadaet al., 1995.

1214 Imada, Fujimori, and Tokura: Metal-insulator transitions
diffraction in the (hk0) zone of the reciprocal space.(Note that, even with the different choices of modula-tion vector in the neutron and electron-diffraction stud-ies, the relation d12e51 still holds.) In measurementsof the [100] zone-axis electron-diffraction pattern, dif-fuse streaks are observed along the (00l) direction,peaked at l5odd with a coherence length <60 Å. Themodulation g is then (16d ,0,1) or equivalently (2e,0,1),which is in accordance with the charge-ordering peaks inthe neutron scattering for LaNiO4.125 .
The modulation wave vector e5(12d)/2 increasesgenerally as Sr doping increases (Chen et al., 1993). Thevalue of e was found to increase rapidly from '1/4 nearx50 to '1/3 for x.0.075. Near x50 the ordering isperhaps induced by excess oxygen, as typically seen forLa2NiO4.125 crystals. The modulation vector stays closeto e51/3 for a fairly wide x region of 0.075,x,0.4 andaround e51/2 between x50.5 and 0.6. However, thevalue of e is known to be sensitive to oxygen stoichiom-etry (Sachan et al., 1995).
The e51/2 (or d50) ordering is the most fundamentalone, where one hole is present for every other Ni atom(or on its surrounding oxygen sites; see the right panel ofFig. 181). Chen et al. (1993), observed that this e51/2CO is essentially two dimensional without any intensitymodulation of the (p,p) point superlattice peak alongthe c axis. This is perhaps because two breathing-typedistortions cannot sit right next to each other and thecoupling along the c axis is frustrated. In the picture ofholes residing on Ni sites, the e51/3 polaron lattice canbe derived from the e51/2 lattice by first removing holes(polarons) along the diagonal of the NiO2 square lattice(the x direction) and then repeating this process for ev-ery third polaron lattice unit cell along the y direction(Chen et al., 1993). In the case of the e51/2 state, intu-itively and theoretically (Zaanen and Littlewood, 1994),a ferromagnetic spin arrangement with alternating S51 and S51/2 spins is expected to occur in the NiO2plane. However, there is no sign of ferrimagnetism inthe observed magnetic susceptibility (Cheong et al.,1994). For La22xSxNiO4 (0.1,x,0.6), spin-glass-likebehavior and weak ferromagnetism were observed be-low 150 K, presumably due to antiferromagnetic (short-range) ordering. However, the susceptibility above 200K was field independent. Around x51/3, the susceptibil-ity decreased at 240 K, implying the onset of an elec-tronic phase transition, that is, a charge-ordering transi-tion.
A charge-ordering transition is clearly manifested inthe transport and optical properties of La22xSrxNiO4with x51/3 and 1/2. Figure 183 displays the temperaturedependence of the resistivity in polycrystalline samplesof La22xSrxNiO4 with the inset showing the temperaturederivative of the logarithmic resistivity (Cheong et al.,1994). The r(T) exhibits semiconducting behavior be-low room temperature and weak metallic behaviorabove 600 K for x between 0.2 and 0.5. For x50.3, r(T)increases abruptly at 240 K, indicative of a charge-ordering transition. The temperature derivative of thelogarithmic resistivity, plotted in the inset of Fig. 183,
Rev. Mod. Phys., Vol. 70, No. 4, October 1998
shows a sharp dip at 240 K. A weaker and much broaderfeature for x50.5 is also evident at 340 K, suggestingthat the e51/2 CO transition occurs around this tem-perature. The truly 2D nature of the e51/2 state is re-sponsible for the blurred nature of this transition.
In the following, let us focus on the e51/3 CO transi-tion in La22xSrxNiO4 (x50.33) and related compounds.The CO transition for e51/3 is robust against the choiceof divalent ions (Sr,Ba,Ca) (Cheong et al., 1994) and oftrivalent ions (La,Nd) (Katsufuji, Tanabe, and Tokura,1998), ensuring that the transition is stabilized by thecommensurate value of the hole number. Figure 184shows the change in the sound velocity (top panel) dueto the phase transition at 240 K, together with the spe-cific heat and temperature derivatives of resistivity andmagnetic susceptibility for La1.67Sr0.33NiO4 (Ramirezet al., 1996). The temperature dependence of the soundvelocity and the specific heat show a pronouncedanomaly at the same temperature as observed in theresistivity and the susceptibility. This CO phase transi-tion at 240 K is continuous in nature. The change in thesound velocity was observed to be insensitive to mag-netic fields up to 9T , not as in a typical antiferromagnet.This observation suggests that the CO transition for x50.33 at Tco5240 K does not involve long-range order-ing of the Ni spins. The entropy involved in the COtransition is obtained by subtracting a smooth back-ground from the specific-heat data. It is estimated to beDS[DS/R;0.25(ln 2)50.17. The observed value isconsiderably smaller than that for the configurational(real-space ordering) hole entropy (DS50.64) or for theS51 spin ordering (DS50.73), but obviously an orderof magnitude larger than that of the weak-coupling
FIG. 183. Temperature dependence of resistivity forLa22xSrxNiO4 with representative Sr concentrations (Cheonget al., 1994). The inset displays the temperature derivative ofthe logarithmic resistivity. Vertical arrows indicate features inthe derivative for x50.3 and 0.5, indicative of the charge-ordering phase transitions.

1215Imada, Fujimori, and Tokura: Metal-insulator transitions
CDW/SDW transition. Ramirez et al. (1996) argued thissprings from independent hole-spin ordering.
Composition-tuned (x50.33) single crystals have sub-sequently become available. According to recentneutron-scattering studies (Lee and Cheong, 1997;Kakeshita et al., 1998), the (static) charge and spin or-dering in an x(5e)50.33 crystal, which were probed bythe (422e ,0,1) and (31e ,0,1) superlattice peaks, takesplace below Tco5230 K and TN5180 K, respectively, asshown in Fig. 185. The temperature dependence of an-isotropic transport and optical conductivity spectra wereinvestigated by Katsufuji et al. (1996). The temperaturedependence of the in-plane (rab) and out-of-plane (rc)resistivity is displayed in Fig. 186 together with the insetfor the conductivity (inversed resistivity) on a linearscale. The resistivity of the x50.33 crystal shows a largeanisotropy (.102) between the in-plane and c-axis com-ponents, yet both show a simultaneously abrupt increaseat Tco , as indicated by arrows in Fig. 186. An importantpoint to be noticed is that the in-plane resistivity is me-tallic, i.e., drc /dT.0 above 500 K and then shows anupturn below 500 K, which is a much higher tempera-ture than Tco , while the c-axis resistivity is semicon-ducting or insulating, namely, drc /dT,0, over thewhole temperature region up to 800 K, as can be clearlyseen in the inset. The Hall coefficient above 300 K isnearly constant and takes a small positive value, corre-
FIG. 184. The normalized sound velocity Dn/n , specific heatcapacity (C), and temperature derivatives of resistivity (r) andmagnetic susceptibility (x) in La22xSrxNiO4, with x50.33From Ramirez et al., 1996.
Rev. Mod. Phys., Vol. 70, No. 4, October 1998
sponding to '1 hole carrier per Ni site. However, theHall coefficient decreases rapidly with cooling for tem-peratures (;300 K) near and above Tco and takes anegative value with a large absolute magnitude on en-tering the charge-ordered state below Tco (Tanabe et al.,1998). The hole-type carrier conduction well above Tcois characterized by a large Fermi surface. As the charge-ordered state is approached with decreasing tempera-ture, however, a small electron pocket is produced dueto charge-ordering fluctuations and subsequent static or-dering. For x&0.30, on the other hand, the Hall coeffi-
FIG. 185. Temperature dependence of normalized integratedintensities of ge (0.67,0,1) and g2e (3.33,0,1) peaks, correspond-ing, respectively, to spin and charge ordering, in La22xSrxNiO4(x50.33). From Kakeshita et al., 1997.
FIG. 186. Temperature dependence of in-plane and out-of-plane resistivity in single crystalline La22xSrxNiO4 (x50.33).From Katsufuji et al., 1996.

1216 Imada, Fujimori, and Tokura: Metal-insulator transitions
cient rises steeply as the temperature is lowered belowTCO , indicating the presence of a small hole pocket(Tanabe et al., 1998).
The CO instability crucially affects the electronicstructure over a fairly large energy scale, at least up to 2eV in the case of a La22xSrxNiO4 (x50.33) crystal. Thetemperature variation of the low-energy part of the in-plane optical conductivity spectra (obtained byKramers-Kronig analysis of the reflectivity spectra) isshown in Fig. 187 (Katsufuji et al., 1996). Below Tco , agradual opening of the charge gap as well as change inthe gap magnitude 2D with temperature is clearly ob-served. At the lowest temperature (510 K) shown here,2D is estimated to be about 0.26 eV by a linear extrapo-lation from the onset of conductivity as indicated by along-dashed line in the figure. There appears to be anappreciable amount of residual spectral weight belowthis estimated gap, which may arise from a slight devia-tion of the nominal hole concentration (p) from thecommensurate value (p51/3) or from a microscopic im-perfection of the charge-ordered lattice. The tempera-ture dependence of the gap 2D, shown in the inset, is inaccordance with a BCS-like function represented by asolid line. Examples include the charge-density-wave(CDW) or spin-density-wave (SDW) transitions, whichshow BCS-like behavior both in wave amplitude and inthe energy gap. However, the ratio of the energy gap atT50 K [2D(0)] to the transition temperature (kBTco) is;13 in this compound, which is significantly larger thanthe theoretical value for a conventional weak-couplingCDW/SDW transition, 2D(0)/kBTc;3.5. Such a largevalue of 2D(0)/Tco implies that the charge gap in thecharge-ordered state is affected by strong electron cor-relation effects or that the Tco is suppressed due to fluc-tuations arising from two dimensionality.
FIG. 187. Temperature-variation of the in-plane optical con-ductivity spectra in the gap region for La22xSrxNiO4 (x50.33) (Katsufuji et al., 1996). The inset shows the variation ofthe charge gap in the charge-ordered state.
Rev. Mod. Phys., Vol. 70, No. 4, October 1998
The optical conductivity spectra show considerabletemperature dependence even above Tco : As signaledby the presence of the isosbetic (equi-absorption) pointat 0.4 eV for the spectral change above Tco(5240 K),the spectral weight below 0.4 eV is transferred to ahigher-lying energy region (at least up to 2 eV, notshown here) with decreasing temperature, apparentlyproducing a pseudogap feature in the low-energy side(Katsufuji et al., 1996). This is contrasted with a nearlyrigid shift of the optical conductivity spectrum belowTco . This effect is rather surprising but in accordancewith the semiconducting behavior of the resistivity be-low 500 K. A charge-ordering fluctuation might be re-sponsible for the anomalous spectral change and weighttransfer above TCO .
4. La12xSr11xMnO4
The manganite system La12xSr11xMnO4 with an n51 layered perovskite (or K2NiF4-type) structure (seeFig. 66) also shows a charge-ordered state near x51/2.The composition x represents the nominal hole numberper Mn site, since the Mn31 valence state (LaSrMnO4;x50) is viewed as the parent Mott insulator. Figure 188displays the temperature dependence of the in-plane re-sistivity (rab) in La12xSr11xMnO4 crystals with x50 –0.7 (Moritomo et al., 1995). In the figure, the tem-perature dependence of the c-axis resistivity (rc , dottedcurves) is displayed for x50.3 and 0.5, showing highlyanisotropic charge dynamics. In contrast to the case ofthe pseudocubic and n52 layered perovskites (see Sec.IV.F), no ferromagnetic phase emerges, perhaps due tothe reduced double-exchange interaction. It is to benoted in Fig. 188 that both rab and rc curves for the x
FIG. 188. Temperature dependence of resistivity (r) for singlecrystals of La12xSr11xMnO4 with various hole concentrations(x) (Moritomo et al., 1995); Solid curves, in-plane (rab) com-ponents; dashed curves, out-of-plane (rc) components. Asteep increase in r as indicated by upward arrows is due to thecharge-ordering transitions.

1217Imada, Fujimori, and Tokura: Metal-insulator transitions
50.5 crystal increase steeply at 220 K, as shown by up-ward arrows. A similar resistivity anomaly is also dis-cernible for an x50.6 crystal around 260 K.
Corresponding to the anomalies in the resistivity aswell as in the magnetic susceptibility for x50.5,electron-diffraction studies (Moritomo et al., 1995; Bao,Chen, et al., 1996) revealed (1/4,1/4,0) and (3/4,3/4,0) su-perlattice peaks which are thought to arise from thecharge-ordered state. On the basis of the electron-diffraction patterns, Bao, Chen, et al. (1996) hypoth-esized the presence of diagonally ordered chargedstripes, as in the case of La2NiO4.125 (e51/4, Sec.IV.F.3), with modulation wave vector (1/4,1/4,0). Thisstate can be viewed as a stripe-type ordering of Mn21
(3dt2g3 eg
2 ; S55/2) and Mn41 (3dt2g3 ; S53/2). By con-
trast, Moritomo et al. (1995) assumed a much simpler(1/2,1/2,0) ordering (or e51/2), as in La22xSrxNiO4 [x50.5; see Fig. 181(c)], associated with the additionalfourfold periodic distortion perhaps due to orbital or-dering.
More recently, a single-crystalline neutron-scatteringstudy was performed by Sternlieb et al. (1996), in whichthe aforementioned e51/4 type scattering seen in theelectron-diffraction studies was not observed, though itis observed in x-ray scattering. Sternlieb et al. (1996)viewed the (1/4,1/4,l) peaks as spurious (tentatively at-tributing them to nonstoichiometry at the crystal sur-face) and presented the model of charge and spin orderin the MnO2 plane shown in Fig. 189. The temperaturedependence of the charge and spin order as measured bysuperlattice intensities is also shown in Fig. 190. Thecharge shows an alternating Mn31/Mn41 pattern withwave vector of (1/2,1/2,0), i.e., the e51/2 charge order-ing, below Tco5217 K. The onset of the charge ordering
FIG. 189. The MnO2 spin configuration in the charge-orderedstate in La12xSr11xMnO4 (x50.5). From Sternlieb et al., 1996.
Rev. Mod. Phys., Vol. 70, No. 4, October 1998
is in accordance with the steep increase in resistivityshown in Fig. 188. Below the Neel temperature, TN5110 K, the magnetic moments form an ordered struc-ture, shown in Fig. 189, with dimensions 2&a32&b32c , relative to the underlying tetragonal chemical cell.
It is worth noting that the MnO2 charge/spin ordermodel for this n51 layered perovskite is identical withthe (001) face projection of the well-known CE-typecharge/spin ordered pattern for pseudocubic (ortho-rhombic Pbnm) perovskite manganites, R1/2A1/2MnO3(Goodenough, 1955; Wollan and Kohler, 1955). CE-typecharge-ordering transitions and their modification undera magnetic field will be discussed in Sec.IV.F. Suffice itto say here that such a spin ordering must accompanyordering of the orbital. Apparently, the degeneracy ofthe eg orbital is lifted by the tetragonal crystal field in alayered perovskite. In fact, the x50 compoundLaSrMnO4 shows coherent elongation of the out-of-plane Mn-O(apical) bond length due to the Jahn-Tellereffect. However, near x51/2, the in-plane and out-of-plane Mn-O bond lengths are nearly equal ('1.9 Å),indicating a minimal static Jahn-Teller effect in heavilyhole-doped manganites, despite the layered structure.Orbital degrees of freedom should play an importantrole in producing a rather large magnetic unit cell, asshown in Fig. 189. In accordance with this expectation,the concomitant ordering of the orbital and charge witha charge-exchange-type projection onto the ab planewas recently demonstrated by Murakami et al. (1998)
FIG. 190. Temperature dependence of the (a) charge and (b)magnetic order observed in a neutron-scattering study (Stern-lieb et al., 1996). Inset in (a) shows the resitivity vs T .

1218 Imada, Fujimori, and Tokura: Metal-insulator transitions
FIG. 191. Electronic phase diagrams in the plane of the doping concentration x and temperature for representative distortedperovskites of R12xAxMnO3: (a) La12xSrxMnO3; (b) Nd12xSrxMnO3; (c) La12xCaxMnO3; and (d) Pr12xCaxMnO3. States de-noted by abbreviations: PI, paramagnetic insulating; PM, paramagnetic metallic; CI, spin-canted insulating; COI, charge-orderedinsulating; AFI, antiferromagnetic insulating (in the COI); CAFI, canted antiferromagnetic insulating (in the COI).
through x-ray resonant diffraction.
F. Double-exchange systems
1. R12xAxMnO3
Giant negative magnetoresistance (MR) in the perov-skite manganites near the Curie temperature (TC) wasfirst reported by Searle and Wang (1969) for a crystal ofLa12xPbxMnO3. Soon after, Kubo and Ohata (1972)gave an essential account of this phenomenon using thedouble-exchange Hamiltonian given in Eqs. (2.9a)–(2.9c). They calculated the magnetoresistance in theHartree-Fock approximation with additional consider-ation of the lifetime effect of the quasiparticles scatteredby spin fluctuations. This model contains the essentialingredient of the double-exchange mechanism elabo-rated by Zener (1951), Anderson and Hasegawa (1955),and de Gennes (1960).
A Mn31 ion shows the electronic configuration oft2g
3 eg1 . The eg-state electrons, hybridized strongly with
the O 2p state, are subject to the correlation effect butcan be itinerant when hole-doped, while the t2g elec-trons, less hybridized with 2p states and stabilized bycrystal-field splitting, are viewed as forming the localspin (S53/2). In Eqs. (2.9a)–(2.9c), t stands for thetransfer of eg electrons between nearest-neighbor pairs(i ,j) of sites, and JH the on-site ferromagnetic (Hund’s-rule) coupling between the eg electron spin (s) and thet2g local spin (s). According to estimates from photo-emission studies (Sarma, Shanthi, et al., 1996) and opti-cal spectroscopy (Arima and Tokura, 1995; Okimotoet al., 1995a), JH is about 2 eV and probably larger thanthe one-electron bandwidth W(52zt , where z is the co-ordination number).
In the limit of large JH /W , with classical treatment ofS , the absolute magnitude of the effective transfer de-pends on the relative angle u between neighboring t2gspins at sites i and j (Zener, 1951; Anderson and Hase-gawa, 1955; Millis et al., 1995),
teff5t cos~u/2!. (4.15)
Rev. Mod. Phys., Vol. 70, No. 4, October 1998
Thus the ferromagnetic metallic state is stabilized bymaximizing the kinetic energy of the conduction elec-trons for u50. As was discussed in Sec. II.H.1, this ef-fective transfer was treated using the average ^cos u/2&by the Hartree-Fock approach (Anderson and Hase-gawa, 1955).
To understand the important features observed ex-perimentally, we need to be aware of some factors thatare missing from the simplified double-exchange modelabove. In the following, we focus on some experimentalobservations that may be relevant to anomalous metallicfeatures, although the recent extensive research on theso-called ‘‘colossal’’ magnetoresistance has generated ahuge number of reports in the scientific and technologi-cal literature.
We show in Fig. 191 electronic phase diagrams in theplane of the doping concentration x and temperature forrepresentative distorted perovskites of R12xAxMnO3(Schhiffer et al., 1995; Tokura, Tomioka, et al., 1996b);these include (a) La12xSrxMnO3, (b) Nd12xSrxMnO3,(c) La12xCaxMnO3, and (d) Pr12xCaxMnO3. As the tol-erance factor or equivalently the average ionic radius ofthe perovskite A site decreases from (La,Sr) to (Pr,Ca)through (Nd,Sr) or (La,Ca), orthorhombic distortion ofthe GdFeO3 type increases, resulting in the decrease ofthe one-electron bandwidth W , as described in detail inSec. III.C.1. With reduced transfer t ij or W , other elec-tronic instabilities, such as Jahn-Teller-type electron-lattice coupling, charge/orbital-ordering, and antiferro-magnetic superexchange interactions, may becomeimportant and compete with the ferromagnetic double-exchange interaction. In fact, such a competition pro-duces a number of intriguing magnetoresistive and mag-netostructural phenomena, some of which will beintroduced later in this section.
The compound La12xSrxMnO3 is the most canonicaldouble-exchange system with the maximal one-electronbandwidth W . The parent compound LaMnO3, with thet2g
3 eg1 configuration of the Mn31 ion, shows the ordering
of the two eg orbitals, d3x22r2 and d3y22r2, alternatingfrom site to site on the (001) plane, in an ‘‘antiferro-
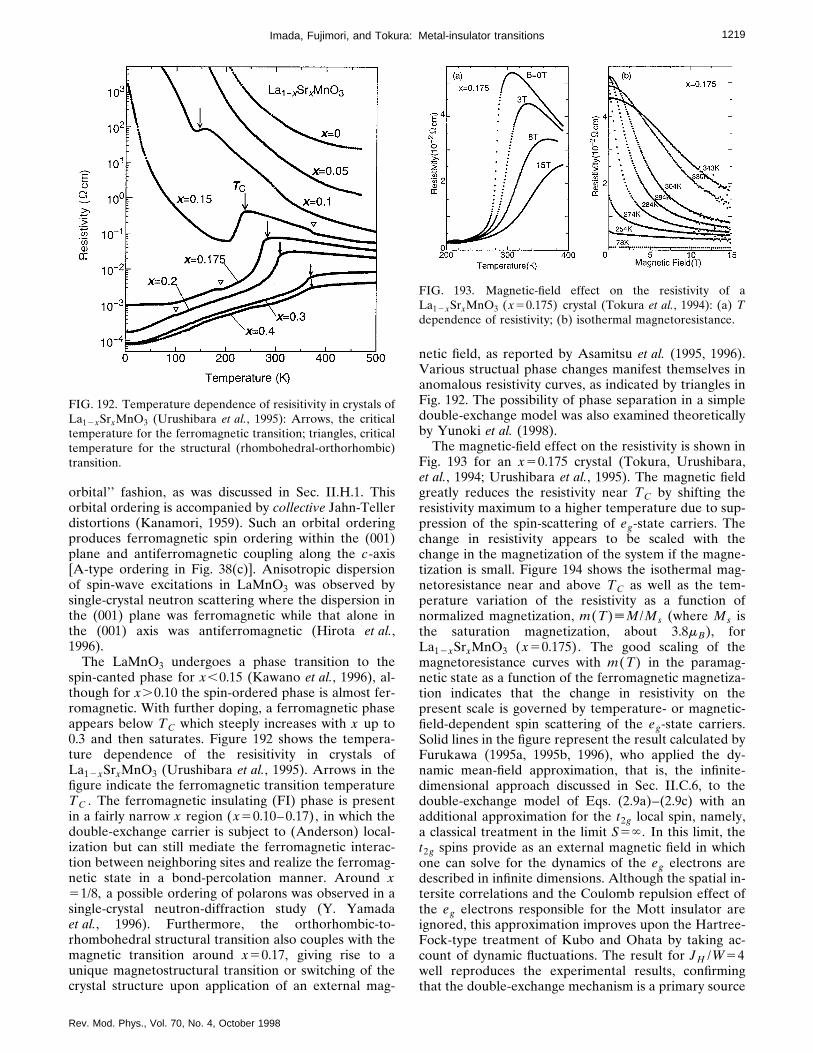
1219Imada, Fujimori, and Tokura: Metal-insulator transitions
orbital’’ fashion, as was discussed in Sec. II.H.1. Thisorbital ordering is accompanied by collective Jahn-Tellerdistortions (Kanamori, 1959). Such an orbital orderingproduces ferromagnetic spin ordering within the (001)plane and antiferromagnetic coupling along the c-axis[A-type ordering in Fig. 38(c)]. Anisotropic dispersionof spin-wave excitations in LaMnO3 was observed bysingle-crystal neutron scattering where the dispersion inthe (001) plane was ferromagnetic while that alone inthe (001) axis was antiferromagnetic (Hirota et al.,1996).
The LaMnO3 undergoes a phase transition to thespin-canted phase for x,0.15 (Kawano et al., 1996), al-though for x.0.10 the spin-ordered phase is almost fer-romagnetic. With further doping, a ferromagnetic phaseappears below TC which steeply increases with x up to0.3 and then saturates. Figure 192 shows the tempera-ture dependence of the resisitivity in crystals ofLa12xSrxMnO3 (Urushibara et al., 1995). Arrows in thefigure indicate the ferromagnetic transition temperatureTC . The ferromagnetic insulating (FI) phase is presentin a fairly narrow x region (x50.10–0.17), in which thedouble-exchange carrier is subject to (Anderson) local-ization but can still mediate the ferromagnetic interac-tion between neighboring sites and realize the ferromag-netic state in a bond-percolation manner. Around x51/8, a possible ordering of polarons was observed in asingle-crystal neutron-diffraction study (Y. Yamadaet al., 1996). Furthermore, the orthorhombic-to-rhombohedral structural transition also couples with themagnetic transition around x50.17, giving rise to aunique magnetostructural transition or switching of thecrystal structure upon application of an external mag-
FIG. 192. Temperature dependence of resisitivity in crystals ofLa12xSrxMnO3 (Urushibara et al., 1995): Arrows, the criticaltemperature for the ferromagnetic transition; triangles, criticaltemperature for the structural (rhombohedral-orthorhombic)transition.
Rev. Mod. Phys., Vol. 70, No. 4, October 1998
netic field, as reported by Asamitsu et al. (1995, 1996).Various structual phase changes manifest themselves inanomalous resistivity curves, as indicated by triangles inFig. 192. The possibility of phase separation in a simpledouble-exchange model was also examined theoreticallyby Yunoki et al. (1998).
The magnetic-field effect on the resistivity is shown inFig. 193 for an x50.175 crystal (Tokura, Urushibara,et al., 1994; Urushibara et al., 1995). The magnetic fieldgreatly reduces the resistivity near TC by shifting theresistivity maximum to a higher temperature due to sup-pression of the spin-scattering of eg-state carriers. Thechange in resistivity appears to be scaled with thechange in the magnetization of the system if the magne-tization is small. Figure 194 shows the isothermal mag-netoresistance near and above TC as well as the tem-perature variation of the resistivity as a function ofnormalized magnetization, m(T)[M/Ms (where Ms isthe saturation magnetization, about 3.8mB), forLa12xSrxMnO3 (x50.175). The good scaling of themagnetoresistance curves with m(T) in the paramag-netic state as a function of the ferromagnetic magnetiza-tion indicates that the change in resistivity on thepresent scale is governed by temperature- or magnetic-field-dependent spin scattering of the eg-state carriers.Solid lines in the figure represent the result calculated byFurukawa (1995a, 1995b, 1996), who applied the dy-namic mean-field approximation, that is, the infinite-dimensional approach discussed in Sec. II.C.6, to thedouble-exchange model of Eqs. (2.9a)–(2.9c) with anadditional approximation for the t2g local spin, namely,a classical treatment in the limit S5` . In this limit, thet2g spins provide as an external magnetic field in whichone can solve for the dynamics of the eg electrons aredescribed in infinite dimensions. Although the spatial in-tersite correlations and the Coulomb repulsion effect ofthe eg electrons responsible for the Mott insulator areignored, this approximation improves upon the Hartree-Fock-type treatment of Kubo and Ohata by taking ac-count of dynamic fluctuations. The result for JH /W54well reproduces the experimental results, confirmingthat the double-exchange mechanism is a primary source
FIG. 193. Magnetic-field effect on the resistivity of aLa12xSrxMnO3 (x50.175) crystal (Tokura et al., 1994): (a) Tdependence of resistivity; (b) isothermal magnetoresistance.

1220 Imada, Fujimori, and Tokura: Metal-insulator transitions
of the observed large negative magnetoresistance as wellas of the temperature dependence of the resistivityaround TC .
However, fluctuations around the Curie temperatureas well as the strongly incoherent character of the chargedynamics even at low temperatures, discussed below,cannot be well accounted for in the d5` approachwithin single-orbital and rigid lattice systems. A contro-versial issue is the semiconducting or insulating behaviorabove TC in the rather low-x region, e.g., x50.15–0.20for La12xSrxMnO3, as shown in Fig. 192, or in a wider xregion for narrower-W systems such as La12xCaxMnO3[see Fig. 191 where the ferromagnetic metallic phase isvery limited (Schiffer et al., 1995)]. In such a region of x ,the negative magnetoresistance effect is most pro-nounced around TC and hence the origin of the semi-conducting transport is of great interest. Millis et al.(1995) pointed out that the resistivity of the low-dopedcrystals above TC is too high to be interpreted in termsof the simple double-exchange model and ascribed itsorigin to a dynamic Jahn-Teller distortion. Static andcoherent Jahn-Teller distortions disappear above x50.1 in La12xSrxMnO3, judging from the crystal struc-tural phase changes between orthorhombic forms(Kawano et al., 1996). However, Jahn-Teller couplingenergy is large (of order 1 eV), and the distortion shouldremain finite when carrier itinerancy is reduced by dis-ordered spin configurations above TC . Therefore themean amplitude of the Jahn-Teller distortion is criticallyreduced as the temperature is lowered below TC . Thisidea was examined theoretically by Millis et al. (1996) ina classical approximation of a Jahn-Teller fluctuation.Millis et al. solved the double-exchange model with an
FIG. 194. Isothermal magnetoresistance near and above Tc aswell as temperature variation of resistivity as a function ofnormalized magnetization, m(T)[M/Ms (where Ms is thesaturation magnetization, about 3.8mB), for La12xSrxMnO3 atx50.175 (Tokura et al., 1994): solid line, calculated results bythe mean-field approach (Furukawa, 1995a); dashed line, theJ→0 (weak-coupling) limit. Here J is the Hund’s-rule couplingenergy normalized by the bandwidth.
Rev. Mod. Phys., Vol. 70, No. 4, October 1998
orbital degeneracy in the limit d5` by taking accountof the coupling to dynamic but classical local lattice dis-tortions. From this treatment an enhancement of the re-sistivity around TC with suppressions both above andbelow it is obtained, in agreement with the experimentalresults. In fact, the presence of a dynamic Jahn-Tellerdistortion has been supported indirectly in some experi-ments, in particular for the narrower-bandwith systemLa12xCaxMnO3 (Dai et al., 1996).
Another possible origin of the increased resistivitynear and above TC as well as of the effective suppres-sion of resistivity by an external magnetic field is Ander-son localization of the double-exchange carriers arisingfrom the random potential which is inevitably present inthe solid solution system (Varma, 1996), or to antiferro-magnetic fluctuations which compete with the double-exchange interaction (Kataoka, 1996). One of the im-portant issues relating to all these instabilities is how wetake into account the orbital degrees of freedom of theeg-state electrons and their possibly strong intersite cor-relation or coupling to the lattice degrees of freedom formetals near the Mott insulator phase. In the Mott insu-lating phase, antiferromagnetic order, orbital order, andJahn-Teller distortions are all present, while the primaryorigin of the insulating phase is the strong-correlationeffect due to a charge gap of the order of 1 eV. There-fore the metallic phase near this insulator is under thecritical fluctuation of the Mott transition even when thesaturated ferromagnetic moment appears. Strong fluc-tuations toward orbital, spin, and Jahn-Teller orderinghave to be considered. The importance of orbital degen-eracy was stressed in studies in infinite dimensions (Ro-zenberg, 1996b) and in the slave-boson approximation(Fresard and Kotliar, 1997). In particular, the formeremphasized the proximity of the Mott insulating phaseto the experimentally observed ferromagnetic metalphase within the treatment in d5` .
Strong on-site coupling betweeen the eg-electron spinand t2g local spin and the resultant critical dependenceof the electronic structure on spin polarization shows upin the temperature variation of the optical conductivityspectra (Okimoto et al., 1995a, 1997). We show in Fig.195 the temperature dependence of the optical conduc-tivity spectrum for a La12xSrxMnO3(x50.175) crystal(Okimoto et al., 1995a). At high temperatures near andabove TC , the spectrum is characterized by aninterband-like transition centered on 0.9 eV, while atlow enough temperatures it shows an intraband-liketransition. The spectral weight appears to be transferredfrom interband to intraband region with decrease oftemperature. This unconventional temperature depen-dence of the optical conductivity spectrum below about3 eV is ascribed to a change in the electronic structure ofthe eg electrons with the spin polarization. The eg con-duction band is split into two bands due to JH beinglarger than the bandwidth W (Furukawa, 1995a; Ha-mada et al., 1995; Pickett and Singh, 1995). Above TC ,in the absence of net spin polarization, the up-spin anddown-spin bands overlap, with identical density-of-statesprofiles and equal populations. For T!TC , however,
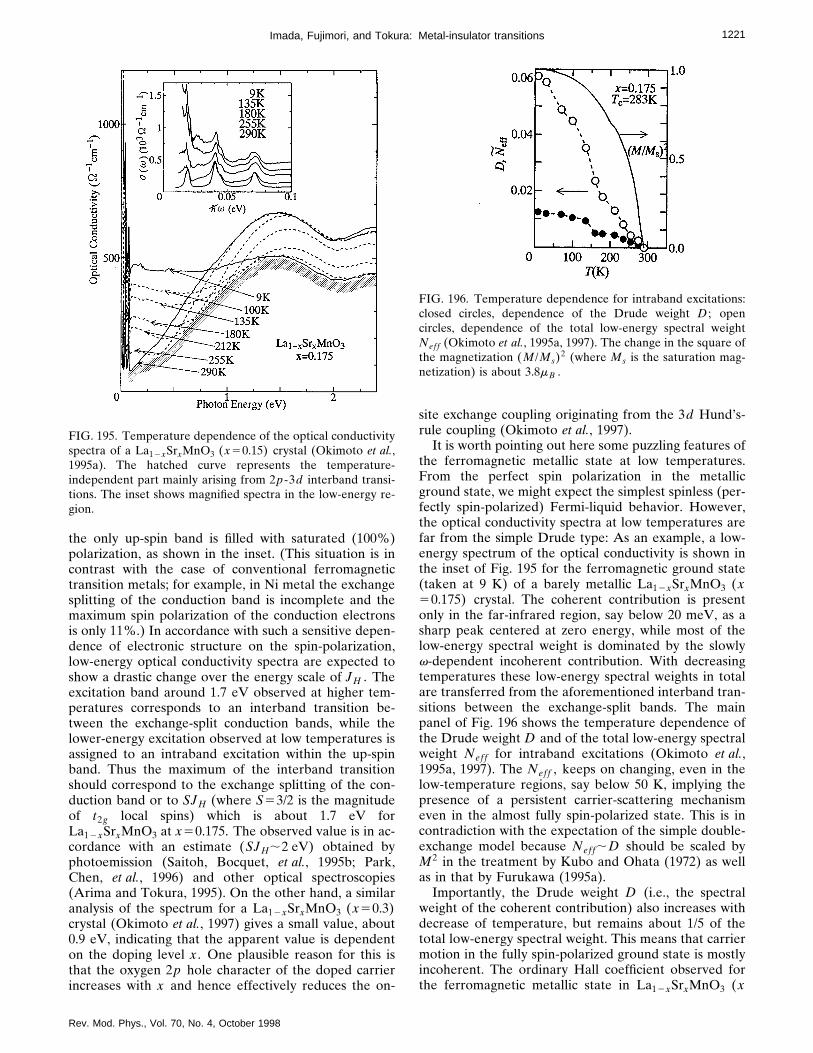
1221Imada, Fujimori, and Tokura: Metal-insulator transitions
the only up-spin band is filled with saturated (100%)polarization, as shown in the inset. (This situation is incontrast with the case of conventional ferromagnetictransition metals; for example, in Ni metal the exchangesplitting of the conduction band is incomplete and themaximum spin polarization of the conduction electronsis only 11%.) In accordance with such a sensitive depen-dence of electronic structure on the spin-polarization,low-energy optical conductivity spectra are expected toshow a drastic change over the energy scale of JH . Theexcitation band around 1.7 eV observed at higher tem-peratures corresponds to an interband transition be-tween the exchange-split conduction bands, while thelower-energy excitation observed at low temperatures isassigned to an intraband excitation within the up-spinband. Thus the maximum of the interband transitionshould correspond to the exchange splitting of the con-duction band or to SJH (where S53/2 is the magnitudeof t2g local spins) which is about 1.7 eV forLa12xSrxMnO3 at x50.175. The observed value is in ac-cordance with an estimate (SJH;2 eV) obtained byphotoemission (Saitoh, Bocquet, et al., 1995b; Park,Chen, et al., 1996) and other optical spectroscopies(Arima and Tokura, 1995). On the other hand, a similaranalysis of the spectrum for a La12xSrxMnO3 (x50.3)crystal (Okimoto et al., 1997) gives a small value, about0.9 eV, indicating that the apparent value is dependenton the doping level x . One plausible reason for this isthat the oxygen 2p hole character of the doped carrierincreases with x and hence effectively reduces the on-
FIG. 195. Temperature dependence of the optical conductivityspectra of a La12xSrxMnO3 (x50.15) crystal (Okimoto et al.,1995a). The hatched curve represents the temperature-independent part mainly arising from 2p-3d interband transi-tions. The inset shows magnified spectra in the low-energy re-gion.
Rev. Mod. Phys., Vol. 70, No. 4, October 1998
site exchange coupling originating from the 3d Hund’s-rule coupling (Okimoto et al., 1997).
It is worth pointing out here some puzzling features ofthe ferromagnetic metallic state at low temperatures.From the perfect spin polarization in the metallicground state, we might expect the simplest spinless (per-fectly spin-polarized) Fermi-liquid behavior. However,the optical conductivity spectra at low temperatures arefar from the simple Drude type: As an example, a low-energy spectrum of the optical conductivity is shown inthe inset of Fig. 195 for the ferromagnetic ground state(taken at 9 K) of a barely metallic La12xSrxMnO3 (x50.175) crystal. The coherent contribution is presentonly in the far-infrared region, say below 20 meV, as asharp peak centered at zero energy, while most of thelow-energy spectral weight is dominated by the slowlyv-dependent incoherent contribution. With decreasingtemperatures these low-energy spectral weights in totalare transferred from the aforementioned interband tran-sitions between the exchange-split bands. The mainpanel of Fig. 196 shows the temperature dependence ofthe Drude weight D and of the total low-energy spectralweight Neff for intraband excitations (Okimoto et al.,1995a, 1997). The Neff , keeps on changing, even in thelow-temperature regions, say below 50 K, implying thepresence of a persistent carrier-scattering mechanismeven in the almost fully spin-polarized state. This is incontradiction with the expectation of the simple double-exchange model because Neff;D should be scaled byM2 in the treatment by Kubo and Ohata (1972) as wellas in that by Furukawa (1995a).
Importantly, the Drude weight D (i.e., the spectralweight of the coherent contribution) also increases withdecrease of temperature, but remains about 1/5 of thetotal low-energy spectral weight. This means that carriermotion in the fully spin-polarized ground state is mostlyincoherent. The ordinary Hall coefficient observed forthe ferromagnetic metallic state in La12xSrxMnO3 (x
FIG. 196. Temperature dependence for intraband excitations:closed circles, dependence of the Drude weight D ; opencircles, dependence of the total low-energy spectral weightNeff (Okimoto et al., 1995a, 1997). The change in the square ofthe magnetization (M/Ms)
2 (where Ms is the saturation mag-netization) is about 3.8mB .
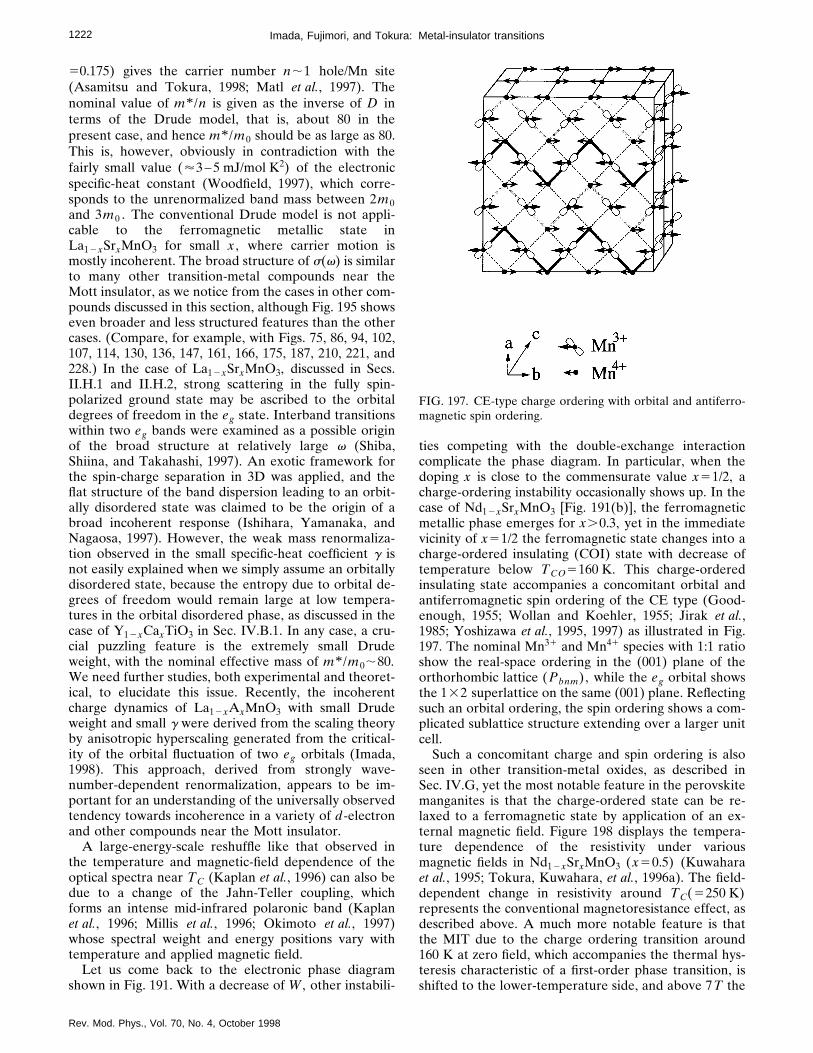
1222 Imada, Fujimori, and Tokura: Metal-insulator transitions
50.175) gives the carrier number n;1 hole/Mn site(Asamitsu and Tokura, 1998; Matl et al., 1997). Thenominal value of m* /n is given as the inverse of D interms of the Drude model, that is, about 80 in thepresent case, and hence m* /m0 should be as large as 80.This is, however, obviously in contradiction with thefairly small value ('3 –5 mJ/mol K2) of the electronicspecific-heat constant (Woodfield, 1997), which corre-sponds to the unrenormalized band mass between 2m0and 3m0 . The conventional Drude model is not appli-cable to the ferromagnetic metallic state inLa12xSrxMnO3 for small x , where carrier motion ismostly incoherent. The broad structure of s(v) is similarto many other transition-metal compounds near theMott insulator, as we notice from the cases in other com-pounds discussed in this section, although Fig. 195 showseven broader and less structured features than the othercases. (Compare, for example, with Figs. 75, 86, 94, 102,107, 114, 130, 136, 147, 161, 166, 175, 187, 210, 221, and228.) In the case of La12xSrxMnO3, discussed in Secs.II.H.1 and II.H.2, strong scattering in the fully spin-polarized ground state may be ascribed to the orbitaldegrees of freedom in the eg state. Interband transitionswithin two eg bands were examined as a possible originof the broad structure at relatively large v (Shiba,Shiina, and Takahashi, 1997). An exotic framework forthe spin-charge separation in 3D was applied, and theflat structure of the band dispersion leading to an orbit-ally disordered state was claimed to be the origin of abroad incoherent response (Ishihara, Yamanaka, andNagaosa, 1997). However, the weak mass renormaliza-tion observed in the small specific-heat coefficient g isnot easily explained when we simply assume an orbitallydisordered state, because the entropy due to orbital de-grees of freedom would remain large at low tempera-tures in the orbital disordered phase, as discussed in thecase of Y12xCaxTiO3 in Sec. IV.B.1. In any case, a cru-cial puzzling feature is the extremely small Drudeweight, with the nominal effective mass of m* /m0;80.We need further studies, both experimental and theoret-ical, to elucidate this issue. Recently, the incoherentcharge dynamics of La12xAxMnO3 with small Drudeweight and small g were derived from the scaling theoryby anisotropic hyperscaling generated from the critical-ity of the orbital fluctuation of two eg orbitals (Imada,1998). This approach, derived from strongly wave-number-dependent renormalization, appears to be im-portant for an understanding of the universally observedtendency towards incoherence in a variety of d-electronand other compounds near the Mott insulator.
A large-energy-scale reshuffle like that observed inthe temperature and magnetic-field dependence of theoptical spectra near TC (Kaplan et al., 1996) can also bedue to a change of the Jahn-Teller coupling, whichforms an intense mid-infrared polaronic band (Kaplanet al., 1996; Millis et al., 1996; Okimoto et al., 1997)whose spectral weight and energy positions vary withtemperature and applied magnetic field.
Let us come back to the electronic phase diagramshown in Fig. 191. With a decrease of W , other instabili-
Rev. Mod. Phys., Vol. 70, No. 4, October 1998
ties competing with the double-exchange interactioncomplicate the phase diagram. In particular, when thedoping x is close to the commensurate value x51/2, acharge-ordering instability occasionally shows up. In thecase of Nd12xSrxMnO3 [Fig. 191(b)], the ferromagneticmetallic phase emerges for x.0.3, yet in the immediatevicinity of x51/2 the ferromagnetic state changes into acharge-ordered insulating (COI) state with decrease oftemperature below TCO5160 K. This charge-orderedinsulating state accompanies a concomitant orbital andantiferromagnetic spin ordering of the CE type (Good-enough, 1955; Wollan and Koehler, 1955; Jirak et al.,1985; Yoshizawa et al., 1995, 1997) as illustrated in Fig.197. The nominal Mn31 and Mn41 species with 1:1 ratioshow the real-space ordering in the (001) plane of theorthorhombic lattice (Pbnm), while the eg orbital showsthe 132 superlattice on the same (001) plane. Reflectingsuch an orbital ordering, the spin ordering shows a com-plicated sublattice structure extending over a larger unitcell.
Such a concomitant charge and spin ordering is alsoseen in other transition-metal oxides, as described inSec. IV.G, yet the most notable feature in the perovskitemanganites is that the charge-ordered state can be re-laxed to a ferromagnetic state by application of an ex-ternal magnetic field. Figure 198 displays the tempera-ture dependence of the resistivity under variousmagnetic fields in Nd12xSrxMnO3 (x50.5) (Kuwaharaet al., 1995; Tokura, Kuwahara, et al., 1996a). The field-dependent change in resistivity around TC(5250 K)represents the conventional magnetoresistance effect, asdescribed above. A much more notable feature is thatthe MIT due to the charge ordering transition around160 K at zero field, which accompanies the thermal hys-teresis characteristic of a first-order phase transition, isshifted to the lower-temperature side, and above 7T the
FIG. 197. CE-type charge ordering with orbital and antiferro-magnetic spin ordering.

1223Imada, Fujimori, and Tokura: Metal-insulator transitions
crystal eventually remains metallic down to the lowesttemperature without a trace of a charge-ordered phase.The metal-insulator phase diagram derived in the planeof H (magnetic field) and T (temperature) shows a largehysteretic region arising from the metastability of theferromagnetic metal and charge-ordered insulatingstates at low temperatures in the course of the first-orderphase transition (Kuwahara et al., 1995; Tokura, Kuwa-hara, et al., 1996a). A quite similar behavior was ob-served for La12xCaxMnO3 with x;0.5 (Schiffer et al.,1995).
Increasing x beyond 0.5 for R12xSrxMnO3 (R5La,Pr, and Nd; x50.5–0.6) seems to produce a unique fer-romagnetic state, which is an A-type layered antiferro-magnet like LaMnO3 but is conducting within the ferro-magnetic basal plane (Kawano et al., 1997). Theresultant confinement of the spin-polarized carrierswithin the ferromagnetic sheets gives rise to large an-isotropy in the resistivity, in spite of the nearly cubiclattice structure (Kuwahara et al., 1998). When x is in-creased further above 0.6, e.g., in La12xCaxMnO3, a newpattern of charge ordering different from the CE type isobserved (Chen, Cheong, and Hwang, 1997).
The charge-ordered insulating state appears to be ex-tended over a wider doping region (x) when W is fur-ther narrowed, as can be seen for x.0.3 in the case ofPr12xCaxMnO3 [Fig. 191(c); Jirak et al., 1980, 1985]. Thecharge and orbital ordering take place at first in thesame commensurate pattern, as shown in Fig. 197 belowTCO5220–250 K when x.0.3. The onset of spin order-ing emerges at a lower temperature than charge order-ing. The crystal at x50.5 undergoes a spin-collinear an-tiferromagnetic transition of the CE type at 160 K. Withdeviation of x from 0.5, the coupling of the spins alongthe c axis becomes ferromagnetic in the antiferromag-netically ordered state, and then the spin-canted phasearises in the lower temperature region. The spin-cantingtransition temperature (TCA) and the spin-canting angletend to increase with deviation of x from 0.5 (see Fig.
FIG. 198. Temperature dependence of the resistivity undervarious magnetic fields in Nd12xSrxMnO3 (x50.5). From Ku-wahara et al., 1995, 1997.
Rev. Mod. Phys., Vol. 70, No. 4, October 1998
191). These features were interpreted in terms of therole of the double-exchange electrons extending alongthe c-axis direction, i.e., the charged-stripe direction(Jirak et al., 1985).
The metal-insulator phase diagram forPr12xCaxMnO3 (x50.3–0.5) is shown in Fig. 199 in theH-T plane (Tomioka et al., 1996; Tokunaga et al., 1998).The ferromagnetic metal/charge-ordered insulator phaseboundaries, accompanied by a metamagnetic change inthe magnetization, were determined by studies of iso-thermal magnetoresistance in which a change in resistiv-ity of several orders of magnitude was observed (To-mioka et al. 1995, 1996). A larger external field is neededto destroy the charge-ordered insulating state inPa12xCaxMnO3 (x50.5) crystals than in the corre-sponding Nd-Sr compound (see Fig. 198) with a largerW . The field hysteresis (hatched region) expands at lowtemperatures, which represents the supercooling (super-heating) phenomena characteristic of a first-order phasetransition. With deviation of x from 0.5, however, theferromagnetic metal/charge-ordered insulator phaseboundary is shifted to the low-magnetic-field side, inparticular at low temperatures, reflecting perhaps a spin-canting tendency. The reentrant behavior of the charge-ordered transition, e.g., in the field-cooled run at x,0.5, may arise from large entropy in the discommen-surate charge-ordered state. In particular, for x50.3 thefield-induced transition from ferromagnetic metal tocharge-ordered insulator in the isothermal process be-
FIG. 199. MI phase diagrams for Pr12xCaxMnO3 (x50.3–0.5) in the H-T plane (Tomioka et al., 1996, Tokunagaet al., 1997).

1224 Imada, Fujimori, and Tokura: Metal-insulator transitions
comes irreversible below 40 K, accompanying a persis-tent change of resistivity by more than 10 orders of mag-nitude.
It is worth noting that the irreversible transition of themetastable charge-ordered insulator state inPr12xCaxMnO3 (x50.3) crystals can be triggered notonly by an external magnetic field or pressure (Tokura,Tomioka, et al., 1996b; Moritomo et al., 1997) but alsoby x-ray (Kiryukhin et al., 1997) and light irradiations(Miyano et al., 1997) and by an electric field (Asamitsu,Tomioka, et al., 1997). These field- or photo-inducedtransitions have potential applications in new magneto-electronic devices.
The electronic structure parameters for RMnO3 andAMnO3 have been derived from configuration-interaction cluster-model analysis of photoemissionspectra (Saitoh, Bocquet, et al., 1995b; Chainani,Mathew, and Sarma, 1993) and from first-principlesband-structure calculations (Satpathy, Popovic, andVukajlovic, 1996). The deduced values for LaMnO3 areU;7 eV and D;4.5 eV, which characterize RMnO3 asa charge-transfer-type insulator and hence mean thatdoped holes enter primarily oxygen p-like orbitals. Thedoped p hole is coupled with the high-spin (S52) Mnd4 (t2g↑
3 eg↑) configuration antiferromagnetically to forma d4LI (S53/2) object (Saitoh, Bocquet, et al., 1995b),analogously to the Zhang-Rice singlet (d9LI with S50)in the high-Tc cuprates. The p hole has eg symmetrywith respect to the Mn site, and therefore the orbital andspin symmetry of the d4LI state is identical to the high-spin Mn d3 (t2g↑
3 ) configuration. This justifies the use ofan effective degenerate Hubbard model for the Mn egbands (Ishihara, Inoue, and Maekawa, 1997) instead ofthe full d-p multiband Hubbard model (Mizokawa andFujimori, 1995), as long as values for the effective pa-rameters are properly chosen. The exchange interactionbetween the localized t2g↑
3 spin and the itinerant eg elec-tron is estimated to be JH
eff;1 eV. The Jahn-Teller split-ting of the eg orbital is rather difficult to estimate em-pirically because not only the change in the p-d transferintegrals but also the change in the Madelung potentialcaused by lattice distortion contributes to this splitting.The crystal-field splitting is large enough to open a bandgap in the LSDA calculation. In SrMnO3, the eg↑ band isempty and the highest occupied states are t2g↑-like.
Jahn-Teller distortion and orbital ordering, which playessential roles in the physical properties ofR12xAxMnO3, are well described by Hartree-Fockband-structure calculations on the d-p multiband Hub-bard model, where the parameters derived from photo-emission studies are used (Mizokawa and Fujimori,1995). The LDA1U method is also successful becausethe self-interaction has been eliminated by applyingHartree-Fock-type corrections to the LDA potential(Satpathy, Popovic, and Vukajlovic, 1996). The LSDA issuccessful in predicting the insulating nature of LaMnO3if the Jahn-Teller distortion is taken into account (So-lovyev, Hamada, and Terakura, 1996a). In the LSDAcalculations, however, the band gap is underestimated,whereas in the Hartree-Fock and LDA1U calculations
Rev. Mod. Phys., Vol. 70, No. 4, October 1998
the band gap already exists in a hypothetically cubicLaMnO3. Starting from the Hartree-Fock or LDA1Uband structure, inclusion of correlation effects throughthe self-energy correction reduces the band gap, result-ing in better agreement with experiment (Mizokawa andFujimori, 1996b). The charge-ordering phenomena inR12xAxMnO3 have been studied theoretically using theLAD1U and Hartree-Fock methods. The correct CE-type magnetic structure with charge ordering, observedfor Pr0.5Ca0.5MnO3, can indeed be reproduced in thesecalculations in the presence of Jahn-Teller distortion(Anisimov et al., 1997; Mizokawa and Fujimori, 1997).However, different types of ordered structures (CE-type, antiferromagnetic, A-type antiferromagnetic, andferromagnetic) are nearly degenerate in energy, andtherefore it is a subtle problem which of these structuresis realized under which conditions. There has also beencontroversy as to whether the Jahn-Teller distortion isnecessary for the correct prediction of magnetically andorbitally ordered structures. Although band-structurecalculations have shown that the Jahn-Teller distortionis necessary, mean-field solutions (Ishihara, Inoue, andMaekawa, 1997; Maezono et al., 1998; Shiina, Nishitani,and Shiba, 1997) as well as exact diagonalization studiesof small clusters (with 23232 Mn ions; Koshibae et al.,1997) have also shown that correct spin-orbital struc-tures can be obtained by including correlation effectswithout the lattice distortion for a certain parameterrange.
The changes in electronic structure with compositionin the La12xSrxMnO3 systems can be seen in Fig. 200.As holes are doped into LaMnO3, spectral weight trans-fer occurs from the occupied eg↑ band, whose peak islocated ;1.5 eV below EF , to the unoccupied eg↑ band.The spectral intensity at EF remains low for all x , how-ever. Therefore it can be said that the overall eg↑ spec-tral distribution exhibits a wide (;1 eV) pseudogap atEF . The intensity at EF is an order of magnitudesmaller than in another ferromagnetic metal,La12xSrxCoO3, indicating an unusually small quasiparti-cle spectral weight Z . This nonrigid band behavior isqualitatively similar to that of R12xAxTiO3, althoughthe spectral intensity at EF is much weaker in the Mncompounds. Even more unusual is the strong tempera-ture dependence of the intensity at EF (Sarma, Shanthi,et al., 1996), as shown in Fig. 201, a behavior that has notbeen seen in any other metals so far. The EF intensitydecreases with temperature and almost disappearssomewhat below TC . Essentially the same behavior wasobserved for La12xCaxMnO3 (Park, Chen, et al., 1996).The extremely low intensity at EF (mk /mb!1 andhence Z!1 because the effective mass m* is not sogreat) may correspond to the extremely small Drudeweight (Okimoto et al., 1997). The strong deviation ofthe spectral function from that of the Hubbard model,for which hole doping creates a rather intense peakaround EF , indicates that interactions neglected in theHubbard model are probably important. A possible ori-gin is the electron-phonon interaction associated withthe local, dynamic Jahn-Teller distortion in doped com-

1225Imada, Fujimori, and Tokura: Metal-insulator transitions
pounds discussed above (Millis, 1996). Alternatively, an-other type of atomic displacement that is symmetricaround the electron, as discussed for lightly doped d0
systems such as La12xSrxTiO3 with x;1 (Sec. IV.B.1),may produce a pseudogap over an energy range of;1 eV.
FIG. 200. Photoemission and oxygen 1s core-level x-ray ab-sorption spectra of La12xSrxMnO3 near EF as a function of x(Saitoh, Bocquet, et al., 1995b). The shaded area representsthe occupied part of the eg↑ component estimated as the dif-ference from SrMnO3.
FIG. 201. Photoemission spectra of La0.6Sr0.4MnO3 near EF atdifferent temperatures. From Sarma, Shanthi, et al., 1996.
Rev. Mod. Phys., Vol. 70, No. 4, October 1998
2. La222xSr112xMn2O7
The title compounds correspond to the n52 layeredperovskite structures (Ruddlesden-Popper series) (Fig.66) with the MnO2 bilayer in a repeated unit. Taking theMn31-based La2Sr1Mn2O7 (x50) as the parent Mott in-sulator, the composition x for La222xSr112xMn2O7stands for the nominal hole number per Mn site. Weshow in Fig. 202 the temperature dependence of the in-plane resistivity (rab) and the c-axis resistivity (rc) aswell as the inverse of the magnetization for an x50.3single crystal (Kimura et al., 1996). rc shows a sharpmaximum at Tmax
c ;100 K and a semiconducting behav-ior above Tmax
c , with metallic-like behavior belowTmax
c . Compared with the magnetization data, the steepdrop of rc below Tmax
c has an intimate connection to the3D spin ordering, where the weak antiferromagnetic in-terlayer coupling was confirmed by magnetization andneutron scattering studies (Kimura et al., 1997; Perringet al., 1998). By contrast, rab shows a broad maximum atTmax
ab ;270 K, where the slope of inverse magnetizationdeviates from the Curie-Weiss law (a dotted line in Fig.202). This implies that the in-plane 2D ferromagneticcorrelation occurs for temperatures below Tmax
ab , whichis far above Tmax
c . In between these two temperatures,the x50.3 compound shows a 2D ferromagnetic metalbehavior. This of course arises from the fact that theferromagnetic interaction is mediated by hole motion,which is strongly confined within the MnO2 bilayers.
The anisotropy of the resistivity rc /rab is already aslarge as ;103 at room temperature, and further in-creases with decrease of temperature, reaching as large avalue as ;104 at Tmax
c . Below TC , rc steeply decreaseswith decreasing temperature. Such a change of the inter-plane charge dynamics from incoherent to coherent hasrarely been encountered even among the highly aniso-
FIG. 202. Temperature dependence of in-plane resistivity(rab) and c-axis resistivity (rc) as well as inverse of the mag-netization for a La22xSr11xMn2O7 (x50.3) crystal. FromKimura et al. 1996.
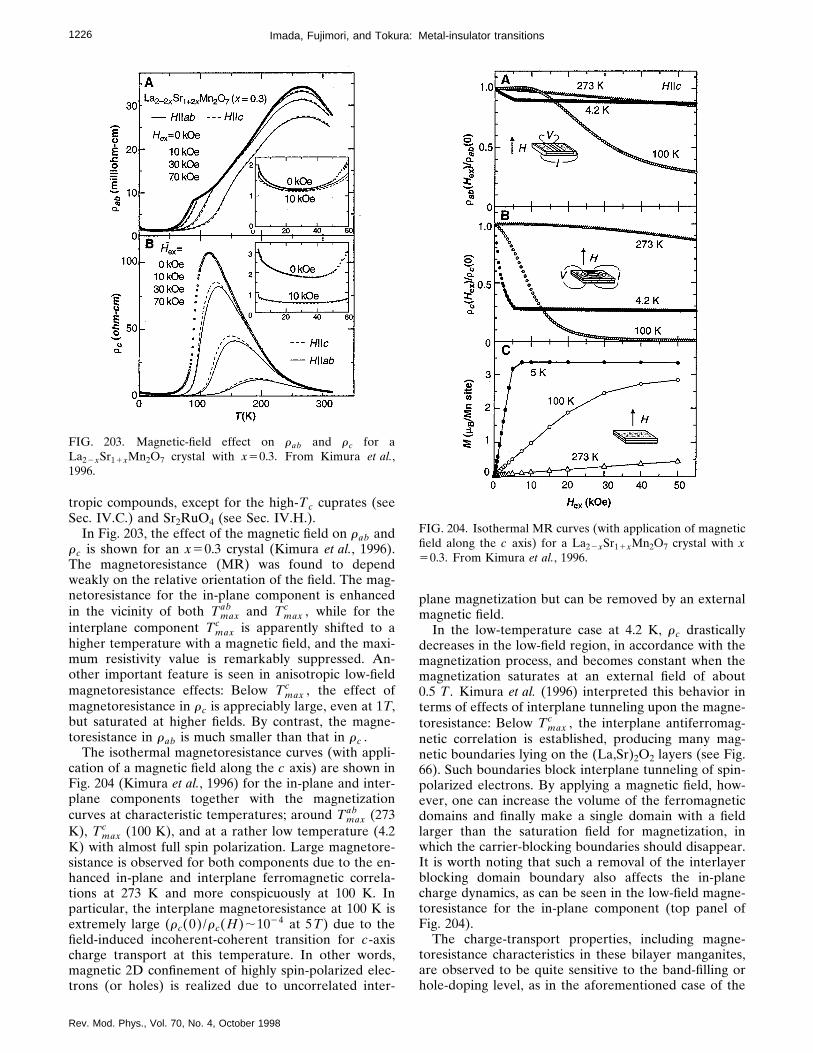
1226 Imada, Fujimori, and Tokura: Metal-insulator transitions
tropic compounds, except for the high-Tc cuprates (seeSec. IV.C.) and Sr2RuO4 (see Sec. IV.H.).
In Fig. 203, the effect of the magnetic field on rab andrc is shown for an x50.3 crystal (Kimura et al., 1996).The magnetoresistance (MR) was found to dependweakly on the relative orientation of the field. The mag-netoresistance for the in-plane component is enhancedin the vicinity of both Tmax
ab and Tmaxc , while for the
interplane component Tmaxc is apparently shifted to a
higher temperature with a magnetic field, and the maxi-mum resistivity value is remarkably suppressed. An-other important feature is seen in anisotropic low-fieldmagnetoresistance effects: Below Tmax
c , the effect ofmagnetoresistance in rc is appreciably large, even at 1T,but saturated at higher fields. By contrast, the magne-toresistance in rab is much smaller than that in rc .
The isothermal magnetoresistance curves (with appli-cation of a magnetic field along the c axis) are shown inFig. 204 (Kimura et al., 1996) for the in-plane and inter-plane components together with the magnetizationcurves at characteristic temperatures; around Tmax
ab (273K), Tmax
c (100 K), and at a rather low temperature (4.2K) with almost full spin polarization. Large magnetore-sistance is observed for both components due to the en-hanced in-plane and interplane ferromagnetic correla-tions at 273 K and more conspicuously at 100 K. Inparticular, the interplane magnetoresistance at 100 K isextremely large (rc(0)/rc(H);1024 at 5T) due to thefield-induced incoherent-coherent transition for c-axischarge transport at this temperature. In other words,magnetic 2D confinement of highly spin-polarized elec-trons (or holes) is realized due to uncorrelated inter-
FIG. 203. Magnetic-field effect on rab and rc for aLa22xSr11xMn2O7 crystal with x50.3. From Kimura et al.,1996.
Rev. Mod. Phys., Vol. 70, No. 4, October 1998
plane magnetization but can be removed by an externalmagnetic field.
In the low-temperature case at 4.2 K, rc drasticallydecreases in the low-field region, in accordance with themagnetization process, and becomes constant when themagnetization saturates at an external field of about0.5 T . Kimura et al. (1996) interpreted this behavior interms of effects of interplane tunneling upon the magne-toresistance: Below Tmax
c , the interplane antiferromag-netic correlation is established, producing many mag-netic boundaries lying on the (La,Sr)2O2 layers (see Fig.66). Such boundaries block interplane tunneling of spin-polarized electrons. By applying a magnetic field, how-ever, one can increase the volume of the ferromagneticdomains and finally make a single domain with a fieldlarger than the saturation field for magnetization, inwhich the carrier-blocking boundaries should disappear.It is worth noting that such a removal of the interlayerblocking domain boundary also affects the in-planecharge dynamics, as can be seen in the low-field magne-toresistance for the in-plane component (top panel ofFig. 204).
The charge-transport properties, including magne-toresistance characteristics in these bilayer manganites,are observed to be quite sensitive to the band-filling orhole-doping level, as in the aforementioned case of the
FIG. 204. Isothermal MR curves (with application of magneticfield along the c axis) for a La22xSr11xMn2O7 crystal with x50.3. From Kimura et al., 1996.

1227Imada, Fujimori, and Tokura: Metal-insulator transitions
pseudocubic perovskite manganites. Figure 205 showsthe temperature dependence of rab and rc forLa22xSr11xMn2O7 (x50.4) crystals under various mag-netic fields (applied perpendicular to the c axis; Mori-tomo et al., 1996). By contrast with the case of the x50.3 crystal, both the in-plane and interplane resistivi-ties show a semiconducting increase with decrease oftemperature down to TC(5126 K) and with activationenergy of 30–40 meV, though the anisotropy ratio of theresistivity is still as large as 102. At around TC(5126 K), both rab and rc show a steep decrease bymore than two orders of magnitude, showing a metallicbehavior below TC (but not below about 20 K due tosome localization effect). By application of magneticfields, the resistivity above TC is appreciably suppressed,putting the resistivity maximum towards higher tem-perature.
An inelastic neutron-scattering study was performed(Perring et al., 1997b) on an x50.4 crystal. Figure 206shows the temperature dependence of (a) the resistivity,(b) the integrated intensity of the (110) Bragg peak, (c)the ferromagnetic critical scattering, and (d) the antifer-romagnetic cluster scattering. Due to growth in the mag-netization below TC , the (110) Bragg peak, which is alsoa nuclear reflection, increases in intensity as in the con-ventional ferromagnet. In accord with this, the ferro-magnetic critical scattering displayed in Fig. 206, that is,the integrated intensity over an energy transfer rangefrom 25 meV to 10.5 meV and over a momentumtransfer range from 0.09 to 0.243(2p/a0) along [110], isenhanced around TC . This critical scattering disappearsagain below TC , as it should. In addition to the abovefeatures expected for a conventional ferromagnet, Per-ring et al. (1997) found diffuse magnetic scattering thatpeaked at the zone boundary point (1/2,0,0). From anextensive survey of reciprocal space to characterize this
FIG. 205. Temperature dependence of rab and rc for aLa22xSr11xMn2O7 (x50.4) crystal under various magneticfields (applied perpendicular to the c axis). From Moritomoet al., 1996.
Rev. Mod. Phys., Vol. 70, No. 4, October 1998
peak and to find others, as well as from an analysis ofmomentum and energy transfer profiles, they concludedthat this peak originated from the antiferromagneticspin cluster depicted in Fig. 206(d), with a correlationlength of about 9 Å and a lifetime of about 0.04 ps at 142K, just above TC . This diffuse scattering intensity, inte-grated over the energy-transfer range of 25 meV to15 meV and momentum-transfer range 0.30 to 0.63(2p/a0), as shown in Fig. 206, gradually increased withdecreasing temperature down to TC and then steeplydecreased below TC . The behavior was parallel to thatof the ferromagnetic critical scattering shown in Fig.206(c). Thus the paramagnetic state near TC and justabove it consisted of a slowly fluctuating mixture offerro- and antiferromagnetic microdomains. The insulat-ing behavior is perhaps due to the breaking of local sym-metry by this anisotropic antiferromagnetic spin clusterand to the resultant localization effect. The magneticfield obviously suppresses carrier scattering by such anantiferromagnetic spin fluctuation, giving rise to the ob-served negative magnetoresistance of colossal magni-tude (Fig. 205).
FIG. 206. Temperature dependence for a La22xSr11xMn2O7(x50.4) crystal of (a) resistivity; (b) the integrated intensity ofthe (110) Bragg peak; (c) ferromagnetic critical scattering; and(d) antiferromagnetic cluster scattering. From Perring et al.,1997a.

1228 Imada, Fujimori, and Tokura: Metal-insulator transitions
The above observation has significant implications forthe origin of the colossal magnetoresistance (CMR) ob-served generally for doped manganites. As mentioned inthe previous section, the scenario of local lattice distor-tions such as the dynamic Jahn-Teller distortion hasbeen a favored potential source of colossal magnetore-sistance in addition to the double-exchange mechanism.However, the orbital degree of freedom in the eg statemay give rise not only to Jahn-Teller electron-latticecoupling but also to strong and anisotropic antiferro-magnetic fluctuations: The latter can arise from the or-bital correlation between sites, as typically seen in thecharge-exchange type charge-ordered state (see Sec.IV.F.1), and can compete with the double-exchange in-teraction. The anisotropic antiferromagnetic clusterabove TC for a La22xSr11xMn2O7 (x50.4) crystal mayalso be a consequence of intersite orbital correlations. Infact, the static Jahn-Teller distortion, which is coherentalong the c axis for the x50 parent crystal, is minimal insuch a heavily doped crystal as x50.4: Typical bondlength ratios at 300 K are Mn-O(1)/Mn-O(3)'1.001 andMn-O(2)/Mn-O(3)'1.03, O(1),O(3),O(2), representingthe inner and outer apex and equatorial oxygen, respec-tively (Mitchell et al., 1997). However, the Jahn-Tellerdistortion was observed to increase in the low-temperature ferromagnetic-metallic phase (Mitchelet al., 1997), implying the onset of orbital ordering atTC .
The electronic structure of La22xSr11xMn2O7 wasstudied by angle-resolved photoemission spectroscopyby Dessau et al. (1998). Energy bands of d3z22r2 anddx22y2 character showed dispersions, consistent with theLDA band-structure calculation. Although the observeddispersions and Fermi-surface crossings were consistentwith band-structure calculations, the spectral intensitywas drastically reduced near EF and there was practi-cally no intensity as the bands crossed EF (for the me-tallic x50.4). Strong electron-phonon coupling (includ-ing Jahn-Teller-type coupling) was proposed as apossible origin of this very unusual behavior. The re-duced intensity at EF was also observed for 3D Mn ox-ides (Sec. IV.F.1), but was more dramatic here in thatthe spectral weight at EF was totally suppressed in spiteof the metallic conductivity.
G. Systems with transitions between metaland nonmagnetic insulators
1. FeSi
FeSi is a nonmagnetic insulator at low temperatures(T!500 K). With increasing temperature, however, itgradually becomes a Curie-Weiss paramagnet (Benoit,1955) with poor metallic conductivity at T.500 K(Wolfe et al., 1965). In spite of the ;500-K maximum inthe magnetic susceptibility, no evidence for antiferro-magnetic ordering has been found in neutron diffraction(Watanabe et al., 1963), NMR, and Mossbauer (Wer-theim et al., 1965) studies. Because of its unusual mag-netic and transport properties, FeSi has attracted muchinterest for many decades. Recently, Aeppli and Fisk
Rev. Mod. Phys., Vol. 70, No. 4, October 1998
(1992) pointed out the close similarity between the mag-netic and transport properties of FeSi and those ofKondo insulators with rare-earth 4f or actinide 5f elec-trons, reviving interest in FeSi. Since then there hasbeen controversy whether FeSi can be viewed as ad-electron Kondo insulator or not.
FeSi crystallizes in a complicated cubic structure,shown in Fig. 207, in which the unit cell contains fourmolecules. The magnetic susceptibility, shown in Fig.208, has been obtained and can be fitted with a Weisstemperature of 2(150–200) K and an effective momentof 2.660.1mB /Fe. The crystal is semiconducting below;300 K and weakly metallic above it, as shown in Fig.209 (Wolfe et al., 1965). These data can be fitted to anactivation law r(T)}exp(Dtr/2kT) at relatively hightemperatures (between ;100 K and ;150 K) with D tr.550–700 K, implying that the intrinsic gap is;50–60 meV. However, this temperature range may betoo small to justify the activation fit; at lower tempera-tures (below a few tens of K), the resistivity has beenfitted to power laws (see Fig. 209) or 3D variable-rangehopping within Anderson-localized states, r(T)}exp(T0 /T)1/4 (S. Takagi et al., 1981; Hunt et al., 1994).FeSi shows a gigantic thermoelectric power of positivesign below ;150 K (with a maximum of S;250–480 mV/K at ;50 K); it becomes negative above;150 K and then positive above ;300 K (Wolfe et al.,1965). Because the Hall coefficient is negative and in-creases with decreasing temperature (Kaidanov et al.,1968), the semiconducting charge carriers must be pre-dominantly n type. The different signs of the Hall coef-ficient and the Seebeck coefficient and the temperaturedependence of the latter imply two types of carriers:n-type and p-type.
Optical measurements by Schlesinger et al. (1993)showed a gap of ;60 meV, as shown in Fig. 210. Thegap is gradually filled with increasing temperature up to
FIG. 207. Crystal structure of FeSi. From Jaccarino et al.,1967.

1229Imada, Fujimori, and Tokura: Metal-insulator transitions
FIG. 208. Magnetic suceptibility of FeSi after subtraction ofthe low-temperature paramagnetic contribution by Jaccarinoet al. (1967). The curve has been calculated using the local-moment model with parameters S51/2, g53.92, and D5750 K (for definition, see text).
FIG. 209. Electrical resistivity of FeSi. From Wolfe et al., 1965.
Rev. Mod. Phys., Vol. 70, No. 4, October 1998
250 K. The v50 peak in the 250-K spectrum is verybroad and is that of a ‘‘poor metal’’ or a dirty metal, farfrom being a typical Drude peak. It was pointed out thatthe gap starts to be filled at temperatures far below thetemperature corresponding to the band gap (;600 K).Simulations assuming a rigid band and the Fermi-Diracdistribution failed to predict the complete filling of theoptical gap at high temperatures, indicating the unusualnature of the optical gap (Ohta et al., 1994). Then(v)/m* curves show that spectral weight integrated upto v52000 cm21 is not conserved between differenttemperatures, meaning that spectral weight transfer oc-curs up to much higher energies (of order 1 eV). Thispicture was questioned, however, by a more recent in-frared optical study (Degiorgi et al., 1994), according towhich the spectral weight sum rule is satisfied up to;3000 cm21. The latter study confirmed the Anderson-localized nature of carriers at low frequencies, v,10 cm21.
In order to explain the magnetic susceptibility of FeSiwithin the local-moment picture, Jaccarino et al. (1967)considered a model in which the nonmagnetic (S50)ground state and an S51/2 or 1 excited state were sepa-
FIG. 210. Optical reflectivity R , optical conductivity s(v), andeffective electron number n(v)/m* of FeSi (Schlesinger et al.,1993): solid curve, T520 K; dashed curve, T5100 K; dottedcurve, T5150 K; dot-dashed curve, T5200 K; solid curve, T5250 K. DC conductivity values are also shown at v50. Theinset shows the difference in n(v)/m* between T5250 and20 K.

1230 Imada, Fujimori, and Tokura: Metal-insulator transitions
rated by a spin gap D. The solid curve in Fig. 208 showsa best fit with S51/2, D5750 K, and a g factor of 3.92.The magnetic contribution to the specific heat, whichwas estimated as the difference between FeSi and CoSi,was also well fitted with the same model, although therewas a large ambiguity in the difference curve. Becausethe local-moment model is not compatible with thesemiconducting properties, Jaccarino et al. also exam-ined a band model in which conduction and valencebands of widths w were separated by a band gap of 2D.They had to assume, however, that 2w!2D (with 2D5760 K) in order to reproduce the magnetic susceptibil-ity. Such a narrow bandwidth is obviously unrealistic.
LDA band-structure calculations were performed byMattheiss and Hamann (1993) and more recently by Fuet al. (1994) and predicted a small indirect gap of;0.1 eV, which agrees with the experimental value of;0.05 eV rather well. The band structure consists ofwide bands of strongly hybridized Fe 3d-Si 3p character(extending from ;212 eV to ;10 eV with respect tothe Fermi level) and relatively narrow (;1 eV) bands ofpurely Fe 3d character. The ;1 eV widths of the energybands near EF is again inconsistent with the very narrow(!0.1 eV) bands proposed by Jaccarino et al. and re-
FIG. 211. Quasielastic magnetic scattering spectra of FeSi fordifferent q’s (Tajima et al., 1988). The reciprocal-lattice pointsare (11z ,11z ,0) in units of 2p/a . Solid curves are the resultof fitting using Eq. (4.16). 10M corresponds to 10 min countingtime at \v50.
Rev. Mod. Phys., Vol. 70, No. 4, October 1998
quires the inclusion of electron correlation effects forthe bands near EF . Takahashi and Moriya (1979) incor-porated correlation effects using spin-fluctuation theoryinto the above band structure (with some simplification)and explained the peculiar magnetic and thermal prop-erties of FeSi. They attributed the nonmagnetic groundstate and the temperature-induced paramagnetism to anegative mode-mode coupling, and predicted the satura-tion of the temperature-induced local moment at hightemperatures.
The question of whether local moments are inducedat high temperatures according to the prediction of spin-fluctuation theory was addressed by inelastic neutron-scattering experiments, but these studies failed to ob-serve paramagnetic moments (Kohgi and Ishikawa,1981). Tajima et al. (1988) made a polarized neutron-scattering study on single crystals and indeed detected atemperature-induced local moment. The results showparamagnetic (quasielastic) scattering as described by
S~q,v!5M2~q!\/kBT
12exp~2\/kBT !
1p
G~q!
G~q!21v2 ,
(4.16)
where M(q) is the q-dependent paramagnetic moment.The v;0 scattering intensity shows a sharp increase to-wards the reciprocal-lattice points, as shown in Fig. 211,indicating ferromagnetic correlation. The v;0 intensityas well as the integrated intensity show a temperaturedependence which closely follows that of the static mag-netic susceptibility, as shown in Fig. 212, a clear indica-tion of temperature-induced paramagnetism. Theunique feature of the scattering function of FeSi is thatthe v-integrated intensity is q independent, i.e., M(q) isq independent, while the v;0 intensity is q dependent,as can be seen from the simultaneous sharpening of thespectrum and the increase in the v;0 intensity as oneapproaches a reciprocal-lattice point. M(q) is found tobe as large as (3.562)mB
2 at 300 K.
FIG. 212. Temperature dependence in FeSi: Open circles, in-tegrated paramagnetic scattering intensity; closed circles, theparamagnetic moment M(0)2 (q50) determined by fittinganalysis using Eq. (4.16). The solild curve is 3kTx(0), wherex(0) is the uniform magnetic susceptibility. From Tajima et al.,1988.

1231Imada, Fujimori, and Tokura: Metal-insulator transitions
The prediction of temperature-induced paramagnet-ism was also tested by Fe core-level photoemission spec-troscopy (Oh et al., 1987). Fe 3s core-level spectra,which show an exchange splitting when the Fe atom hasa local moment, did not change between low and hightemperatures. Valence-band photoemission studies weremade by Kakizaki et al. (1982) and more recently by Sai-toh, Sekiyama, et al. (1995), Chainani et al. (1994) and C.H. Park et al. (1995) with improved energy resolution.Since the Fe 3d and Si 3sp states are strongly hybrid-ized and form wide bands, the configuration-interactioncluster model is certainly not a good starting point forFeSi. If one compared the band-theoretical DOS withthe DOS r(v) measured by photoemission, however,significant discrepancies would be found in the overallline shape, as shown in Fig. 213, as well as in the high-resolution spectra near EF , as shown in Fig. 214. There-fore a local self-energy model was introduced to incor-porate correlation effects in a phenomenological way:The model self-energy has the form S(v)[Sh(v)1S l(v), where Sh(v) is a self-energy correction of thetype g/(v1ig)2 and is effective on the large energyscale of 1–10 eV, while S l(v) is a self-energy correctionwhose absolute magnitude is small but has a significanteffect on the low-energy electronic structure on the scaleof 10–100 meV (Saitoh, Sekiyama, et al., 1995). S(v) isassumed to have the Fermi-liquid property (Im S(v)}2v2) in the v→0 limit. Figure 213 shows that the appli-cation of Sh(v) causes the narrowing of the Fe3d-derived DOS, the broadening of spectral features athigher binding energies, and the transfer of spectralweight towards higher binding energies. The same self-energy alone cannot reproduce the sharp rise of theband edge and the relatively flat line shape from theband edge to ;0.5 eV below it. The addition of S l(v),whose real part has a large negative slope near the bandedge, introduces further band narrowing near EF ;through the Kramers-Kronig relation, the uIm Sl(v)u rap-idly increases as one moves from EF , smearing out thestructures in r(v). The quasiparticle density of statesN* (v), calculated using Eq. (2.72), is also plotted in
FIG. 213. Photoemission spectrum of FeSi (Saitoh, Sekiyamaet al., 1995) compared with the band DOS calculated using theLDA (Mattheiss and Hamann, 1993) and that modified by theself-energy correction. The employed local self-energy S(v) isalso shown.
Rev. Mod. Phys., Vol. 70, No. 4, October 1998
Fig. 214. Because of the increase in the negative slope ofRe Sl(v) toward EF , the quasiparticle DOS N* (v) isenhanced near the band edge. The angle-resolved pho-toemission study by C. H. Park et al. (1995) has found asharp peak ;20 meV below EF for a certain part of theBrillouin zone. The peak disperses only very weakly,again indicating the narrow quasiparticle band at the topof the valence band.
Thus the presence of the narrow bands at the bandedges, originally suggested by Jaccarino et al. (1967),was corroborated by the microscopic experimentalprobe. The narrow bandwidths W* ;20 meV naturallyexplain the poor metallic behavior as seen in the opticalconductivity (Fig. 210), since charge transport should beincoherent at T@W* /kB . In the sense that the physicalproperties of f-electron Kondo insulators would havetheir origin in the presence of narrow f bands, whichwould be strongly renormalized, especially in the Kondolimit (Susaki et al., 1996), FeSi and the f-electron Kondoinsulators can be grouped in the same class of materials,although the underlying (high-energy) electronic struc-tures are very different.
As for the microscopic origin of temperature-inducedmagnetism, on the basis of first-principles electronic cal-culations, Anisimov, Ezhov, et al. (1996) predicted afirst-order nonmagnetic semiconductor-to-ferromagneticmetal transition as a function of magnetic field using theLDA1U method. The transition was predicted to occurif the d-d Coulomb repulsion U was large enough (.3.2eV). The ferromagnetic moment was predicted to be aslarge as 1mB per Fe. The magnetic and thermal proper-ties at finite temperatures were then calculated using asimplified model based on the first-principles results,yielding good agreement with experiment. This pictureappears quite different from the correlated narrow-bandpicture, but the proximity of the ferromagnetic state tothe ground state may be reflected in the ferromagnetic
FIG. 214. Photoemission spectrum of FeSi near EF comparedwith the band DOS calculated using the LDA (Mattheiss andHamann, 1993) and that modified by the self-energy correction(Saitoh, Sekiyama, et al., 1995): (a) Spectral function calculatedusing S(v) shown in the lower panel; (b) spectral function cal-culated using only the high-energy part Sh(v); (c) the LDAdensity of states; (d) density of quasiparticles.

1232 Imada, Fujimori, and Tokura: Metal-insulator transitions
correlations found in the neutron scattering study.Misawa and Tate (1996) explained the magnetic suscep-tibility of FeSi using a Fermi-liquid theory, according towhich a singular contribution from the Fermi level (fromthe band edge in the case of FeSi) causes the suscepti-bility maximum as well as metamagnetism and ferro-magnetic instability in other systems (Misawa, 1995).Recently, the transport properties of substituted com-pounds FeSi12xAlx have been studied and have beensuccessfully interpreted in the conventional doped semi-conductor picture (DiTusa et al., 1997). How the corre-lation effects manifest themselves in FeSi still remainsan open question, calling for further investigations.
2. VO2
Many of the vanadium oxides exhibit temperature-induced MITs, as observed in V2O3 (Sec. IV.B.1) andthe Magneli phases VnO2n21 (4<n<8). Among themVO2, with a 3d1 configuration, differs from others,showing the nonmagnetic ground state without an anti-ferromagnetic phase. The MIT in VO2 takes place ataround 340 K, accompanying the lattice structural tran-sition from a high-temperature rutile (TiO2-type) struc-ture (R phase) to a low-temperature monoclinic struc-ture (M1 phase), as illustrated in Fig. 215 (Marezio et al.,1972). V-V pairing occurs in the M1 phase together withtilting of the V-V pair.
FIG. 215. Comparison of V-V pairing in the three phases, R ,M1 , and M2 , in VO2. In M1 (open circles) all the vanadiumatoms both pair and twist from the rutile positions. In M2(filled circles) one-half of the vanadium atoms pair but do nottwist and the other half form unpaired zigzag chains. (The dis-tortions are exaggerated by a factor of 2 for clarity.) FromMarezio et al., 1972.
Rev. Mod. Phys., Vol. 70, No. 4, October 1998
The schematic electronic structures in metallic and in-sulating VO2, corresponding to Goodenough’s model(Goodenough, 1971), are shown in Fig. 216 (Shin et al.,1990), in which some gap energies were derived by spec-troscopic studies (Ladd and Paul, 1969; Shin et al., 1990).In the R phase, the t2g levels in the octahedral crystalfield are further split into d i and p* levels in the Rphase, comprising the electronic states near the Fermilevel of the metallic state. Here, the d i orbitals arerather nonbonding, while the p* orbitals are stronglyhybridized with the O 2pp state and hence lie higherthan the d i level. In the insulating M1 phase, the pairingof the V atoms along the cr axis (see Fig. 215) promotes3d-2p hybridization and upshifts the p* band off theFermi level, as well as causing bonding-antibondingsplitting of the d i band (Goodenough, 1971), as shownin the right panel of Fig. 216.
The importance of the electron correlation for thislattice-coupled MIT has long been disputed. The issue iswhether the essential nature of the insulating state isthat of a Peierls insulator with the character of an ordi-nary band insulator or otherwise a Mott-Hubbard insu-lator. Recently, Wentzcovitch et al. (1994) pointed outthat the LDA calculation can find a monoclinic distorted(M1 phase) ground state in agreement with experimentand an almost opening of gap in charge excitations. Al-though it is conceptually difficult to distinguish the bandand Mott insulators when there is a gap in the spin sec-tor, Wentzcovitch et al., (1994) concluded that VO2 maybe more bandlike than correlated.
Strong opposition to the band view (Rice et al., 1994)is based on observation of the Mott-Hubbard insulator,that is, the insulator with no gap in the spin sector, inV12xCrxO2 with very small x (>331023) (Pouget et al.,1974) or in pure VO2 when a small uniaxial pressure isapplied along the (110)r direction (Pouget et al., 1975).The T2x phase diagram for V12xCrxO2 (Marezio et al.,1972; Villeneuve, Drillon, and Hagenmuller, 1973) ispresented in Fig. 217. Two other distinct phases emerge,the insulating monoclinic M2 and the triclinic T phase,in addition to the aforementioned metallic R and insu-lating (nonmagnetic) M1 phases. Uniaxial pressure alsogives rise to the M2 and T phases and leads to a similarphase diagram (Pouget et al., 1975).
FIG. 216. Schematic energy diagram of the 3d bands aroundthe Fermi level for VO2. From Shin et al., 1990.

1233Imada, Fujimori, and Tokura: Metal-insulator transitions
The V-V pairing pattern for the M2 phase is alsoshown in Fig. 215, which is composed of two kinds of Vchains. In M2 one half of the V41 ions form equallyspaced V chains, and NMR and EPR experiments(Pouget et al., 1974) showed that they behave magneti-cally as S51/2 Heisenberg chains (J'300 K). Thus it isclear that these V chains in M2 are Mott-Hubbard insu-lators. The insulating triclinic phase can be viewed as aspin Peierls state of the M2 phase, although the transi-tion between M2 and T is weakly of the first order. Infact, further cooling leads to a continuous M2→M1 tran-sition through the intermediate T phase, where the pair-ing (or dimerization) on one set of V chains grows. TheMott-Hubbard insulating M2 phase is obviously a localminimum for VO2, since the M2 can be stabilized byminimal perturbations such as very light Cr-doping or asmall uniaxial pressure. Rice et al. (1994) stressed againthat all the insulating phases of VO2, M1 , M2 , and T ,are of the same type and should be classified as Mott-Hubbard and not band insulators.
The electron correlation effect should also show up inthe metallic state in VO2. The high-temperature metallicstate in the R phase (T>330 K) shows T-linear behav-ior up to 840 K (Allen et al., 1996). The mean free pathl (800 K)53.3 Å is too short when the Bloch-Boltzmaninterpretation is applied for a metal such as is describedby the LDA calculation. Allen et al. (1996) interpretedthis in terms of either a sample problem, such as crack-ing at the phase transition, or of an indication of anoma-lous behavior of the metal close to the Mott-Hubbardinsulator, which differs from the conventional Fermi liq-uid. To pursue the electron correlation effect in the me-tallic VO2, however, it is desirable to realize the barelymetallic state down to low enough temperatures, onwhich more detailed spectroscopic and transport inves-tigations are possible.
A clear gap opening below the MIT temperature hasbeen observed by photoemission spectroscopy (Sa-watzky et al., 1979; Shin et al., 1990), as shown in Fig.218. The results give some hint whether electron corre-
FIG. 217. The T2x phase diagram for V12xCrxO2 (Marezioet al., 1972; Villeneuve, Drillon, and Hagenmuller, 1973).
Rev. Mod. Phys., Vol. 70, No. 4, October 1998
lation plays an important role in the MIT or whether theone-electron band picture is sufficient. The V 3d bandspectrum in the metallic phase is obviously muchbroader than predicted by the band-structure calculationand even shows a sign of the remnant of the lower Hub-bard band, although weak, implying that electron corre-lation cannot be neglected in the metallic state (Fuji-mori, Hase, et al., 1992a). In going from the metallic tothe insulating state, the quasiparticle spectral weight dis-appears, and only the ‘‘lower Hubbard band’’ survives.Although no serious comparison has been made be-tween the spectra of the insulating phase and the densityof states of the LDA band (Wentzcovitch, Schulz, andAllen, 1994), it seems that the discrepancy between themeasured spectra and the band DOS is substantial andthat electron correlation is again important for realizingthe insulating phase of VO2.
3. Ti2O3
Corundum-type Ti2O3 undergoes a gradual metal-insulator transition around 400–600 K (for a review andcomprehensive guide to the literature before 1975, seeHonig and Van Zandt, 1975), as displayed in Fig. 219together with the temperature dependence of the resis-tivity for the V-doped compound (Chandrashekharet al., 1970). In contrast to the perovskite analogs (e.g.,LaTiO3) of the Ti31(3d1)-based oxide (Sec. IV.C.1) aswell as to V2O3 with a similar corundum-type structure(Sec. IV.B.1), Ti2O3 has a low-temperature insulatingstate that is nonmagnetic. In fact, the magnetic suscepti-bility increases to the paramagnetic value at tempera-tures nearly corresponding to the MIT (Pearson, 1958).The conventional explanation for the nonmagnetic insu-lating ground state (Van Zandt, Honig, and Good-enough, 1968) is based on the splitting of the lower-lyingt2g level, depicted in Fig. 220. In a corundum-type struc-
FIG. 218. Photoemission spectra of VO2 in the insulating andmetallic states (Shin et al., 1990). The solid curve was taken at298 K in the insulating phase and the dashed curve at 298 K inthe metallic phase. The dotted curves are spectra after decon-volution with instrumental resolution.
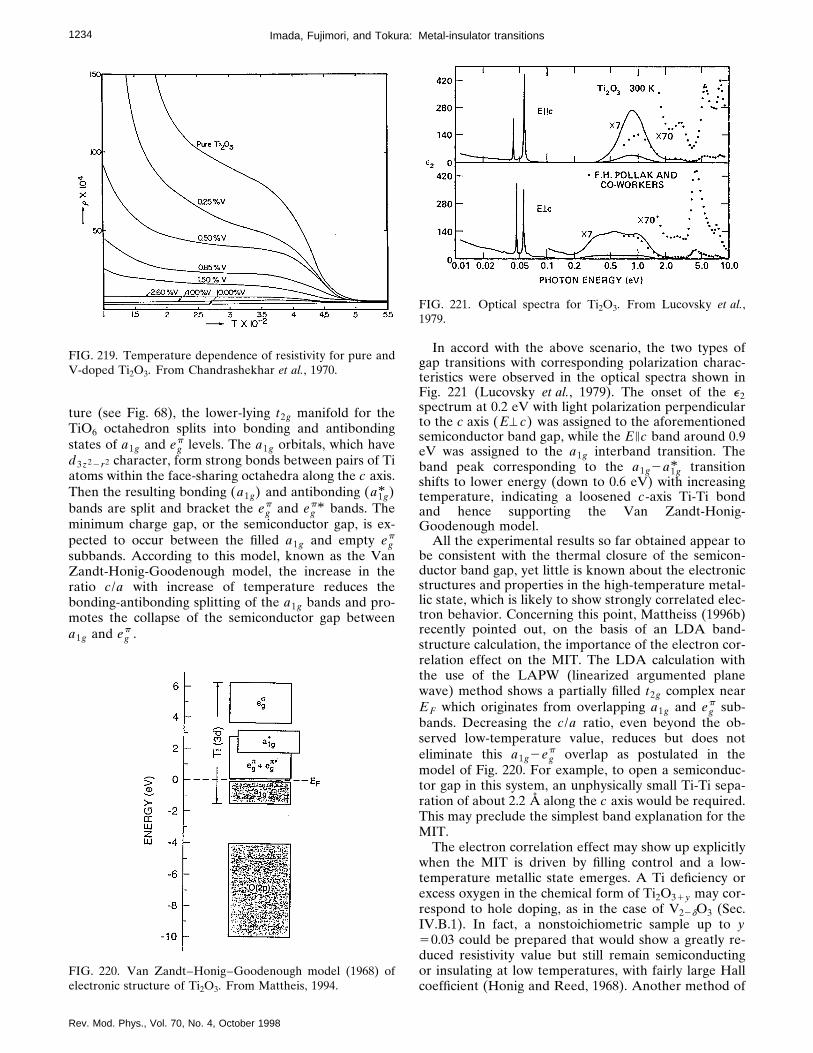
1234 Imada, Fujimori, and Tokura: Metal-insulator transitions
ture (see Fig. 68), the lower-lying t2g manifold for theTiO6 octahedron splits into bonding and antibondingstates of a1g and eg
p levels. The a1g orbitals, which haved3z22r2 character, form strong bonds between pairs of Tiatoms within the face-sharing octahedra along the c axis.Then the resulting bonding (a1g) and antibonding (a1g* )bands are split and bracket the eg
p and egp* bands. The
minimum charge gap, or the semiconductor gap, is ex-pected to occur between the filled a1g and empty eg
p
subbands. According to this model, known as the VanZandt-Honig-Goodenough model, the increase in theratio c/a with increase of temperature reduces thebonding-antibonding splitting of the a1g bands and pro-motes the collapse of the semiconductor gap betweena1g and eg
p .
FIG. 219. Temperature dependence of resistivity for pure andV-doped Ti2O3. From Chandrashekhar et al., 1970.
FIG. 220. Van Zandt–Honig–Goodenough model (1968) ofelectronic structure of Ti2O3. From Mattheis, 1994.
Rev. Mod. Phys., Vol. 70, No. 4, October 1998
In accord with the above scenario, the two types ofgap transitions with corresponding polarization charac-teristics were observed in the optical spectra shown inFig. 221 (Lucovsky et al., 1979). The onset of the e2spectrum at 0.2 eV with light polarization perpendicularto the c axis (E'c) was assigned to the aforementionedsemiconductor band gap, while the Eic band around 0.9eV was assigned to the a1g interband transition. Theband peak corresponding to the a1g2a1g* transitionshifts to lower energy (down to 0.6 eV) with increasingtemperature, indicating a loosened c-axis Ti-Ti bondand hence supporting the Van Zandt-Honig-Goodenough model.
All the experimental results so far obtained appear tobe consistent with the thermal closure of the semicon-ductor band gap, yet little is known about the electronicstructures and properties in the high-temperature metal-lic state, which is likely to show strongly correlated elec-tron behavior. Concerning this point, Mattheiss (1996b)recently pointed out, on the basis of an LDA band-structure calculation, the importance of the electron cor-relation effect on the MIT. The LDA calculation withthe use of the LAPW (linearized argumented planewave) method shows a partially filled t2g complex nearEF which originates from overlapping a1g and eg
p sub-bands. Decreasing the c/a ratio, even beyond the ob-served low-temperature value, reduces but does noteliminate this a1g2eg
p overlap as postulated in themodel of Fig. 220. For example, to open a semiconduc-tor gap in this system, an unphysically small Ti-Ti sepa-ration of about 2.2 Å along the c axis would be required.This may preclude the simplest band explanation for theMIT.
The electron correlation effect may show up explicitlywhen the MIT is driven by filling control and a low-temperature metallic state emerges. A Ti deficiency orexcess oxygen in the chemical form of Ti2O31y may cor-respond to hole doping, as in the case of V22dO3 (Sec.IV.B.1). In fact, a nonstoichiometric sample up to y50.03 could be prepared that would show a greatly re-duced resistivity value but still remain semiconductingor insulating at low temperatures, with fairly large Hallcoefficient (Honig and Reed, 1968). Another method of
FIG. 221. Optical spectra for Ti2O3. From Lucovsky et al.,1979.

1235Imada, Fujimori, and Tokura: Metal-insulator transitions
filling control is V doping, as exemplified in Fig. 219.The metal-site substitution may inherently contain com-plexity in assigning the effective valence of the dopedand host metal cations. Recalling the parallel behaviorof Ti doping with oxygen offstoichiometry in the case ofV2O3, one may consider the V-doped Ti2O3 as anelectron-doped system. As can be seen in Fig. 219, x*0.02 doping induces metallic conduction even at lowtemperatures (Chandrashekhar et al., 1970; Dumas andSchlenker, 1976, 1979). However, the Ti222xV2xO3 is aspin glass at low temperatures for above x50.005 (Du-mas and Schlenker, 1976, 1979; Dumas et al., 1979). Alarge T-linear term in the specific heat (50–80 mJ/molK) was observed for x50.02–0.10 samples (Sjostrandand Keesom, 1973). This was first interpreted as an in-dication of a narrow conduction bandwidth or correlatedelectron behavior, as in Ti-doped V2O3. However, thelarge T-linear term was later reinterpreted in terms ofthe high entropy of the spin-glass state (Dumas andSchlenker, 1976, 1979; Dumas et al., 1979). Nevertheless,correlated electron dynamics is evident in the enhancedtemperature-independent (Pauli-like) component of thesusceptibility, and some supplemental experimentalwork would be desirable for a more complete under-standing of the Mott transition.
4. LaCoO3
The thermally induced insulator-to-metal crossoverphenomenon in LaCoO3, as shown in the upper panel ofFig. 222, is quite unique because of its nonmagneticground state, distinguishing it from a conventional Mottinsulator. The ground state of LaCoO3 is a nonmagnetic
FIG. 222. Temperature dependence of resistivity (r, upperpanel) and magnetic susceptibility (x, lower panel) in LaCoO3and lightly hole-doped LaCoO3 (Tokura et al., 1997). A solidline in the lower panel represents the calculated curve basedon the low-spin (S50) and intermediate-spin (S51) transi-tion model (see text).
Rev. Mod. Phys., Vol. 70, No. 4, October 1998
insulator with a predominant configuration of 3d6 elec-trons of Co31 fully occupying the t2g level (Fig. 223),perhaps due to crystal-field splitting (10Dq), whichslightly exceeds the Hund’s-rule coupling energy. Withincrease of temperature, however, the compound under-goes a spin-state transition from a nonmagnetic (S50)to a paramagnetic state, as signaled by a steep increasein the magnetic susceptibility around 100 K, shown inthe lower panel of Fig. 222. Knight-shift measurements(Itoh et al., 1995) and polarized neutron scattering (Asaiet al., 1989) have confirmed such a spin-state transition,arising from a change in the electronic state of the Cosite. The nature of the high-temperature spin state, thatis, the problem of whether it arises from theintermediate-spin (S51) or the high-spin (S52) stateof the Co31 ion (see Fig. 223), has not yet been settled,although the intermediate-spin-state model appears tobe prevailing at the moment. Korotin et al. (1996) dem-onstrated, using the LDA1U method, the relative sta-bility of the S51 state rather than the S52 state, as aresult of strong p-d hybridization and orbital ordering incontrast to the behavior anticipated by the simple ionicmodel. Their proposed orbital ordering pattern is shownin Fig. 223. A recent finding of appreciable local latticedistortion during the spin-state transition (Yamaguchiet al., 1997) suggests the presence of Jahn-Teller distor-tions in the high-temperature spin state, supporting theintermediate-spin-state model. An example of the fittingprocedures for the magnetic susceptibility with the local-ized spin model (Yamaguchi et al., 1997) is shown in Fig.222. The Ising model molecular field calculation wasdone with assumption of a two-state model, i.e., S50and S51 states with an energy gap of D and the antifer-romagnetic exchange interaction J between thermallyexcited neighboring S51 spins. An appropriate choice(D5230 K and J59.7 K) gives a reasonable account ofthe temperature dependence, although the high-spinmodel shows similar reproducibility, for example, with a
FIG. 223. Possible spin states in LaCoO3: (a) low-spin (LS, S50); (b) intermediate-spin (IS, S51); (c) high-spin (HS, S52); (d) diagram of the eg orbital-ordered state in the IS state.From Korotin et al., 1996.

1236 Imada, Fujimori, and Tokura: Metal-insulator transitions
set of parameters, D5299 K and J526.7 K. Whichevermodel would be better, the spin-gap energy is 0.02–0.03eV, and above room temperature an intermediate orhigh spin density exceeds 80% of the Co sites.
As can be seen in the lower panel of Fig. 222, a smallamount of hole doping gives rise not only to a decreasein resistivity but also to a large Curie tail in the low-spinregion at low enough temperatures. By measurements ofthe magnetization and fitting with the modified Brillouinfunction, it was demonstrated (Yamaguchi et al., 1996a)that a doped single hole shows an extremely high spinnumber, S510–16. This means that a hole with O2p-state character causes a local spin-state transition(low-spin to intermediate-spin) over 10–16 Co sitesaround itself, perhaps due to strong 2ps-3deg hybrid-ization. Such a gigantic spin polaron can be a precursorstate for the ferromagnetic metallic state inLa12xSrxCoO3 (x*0.2; see Fig. 224, in which the ferro-magnetic transition is indicated by closed triangles).
The resistivity of LaCoO3 shows no anomaly aroundthis spin-state transition near 100 K, with a nearly con-stant activation energy of about 0.2 eV. However, alarge reduction in the resistivity takes place around 500K (upper panel of Fig. 222), where the spin-state transi-tion is almost complete. Furthermore, this continuousinsulator-to-metal change is least affected by a smallamount of hole-doping as shown in Fig. 222 and Fig. 224(Yamaguchi and Tokura, 1998).
In the upper panel of Fig. 225, we show the tempera-ture dependence of the optical conductivity spectra ofLaCoO3 in the range of 0–4 eV (Tokura, Okimoto,et al., 1998). With increasing temperature up to 800 Kthrough the metal-insulator crossover temperaturearound 500 K, the spectra show conspicuous changeover a large energy region up to several eV. Such a hugespectral change cannot be accounted for by a simpleband closing like that in a narrow-gap band insulator(semiconductor), in spite of the nonmagnetic nature ofthe insulating ground state. The optical conductivity
FIG. 224. Temperature dependence of La12xSrxCoO3 withvarious doping levels. Closed triangles represent the ferromag-netic transition temperature.
Rev. Mod. Phys., Vol. 70, No. 4, October 1998
spectrum shows a gap feature at low temperatures andundergoes minimal change even when temperature is in-creased up to 293 K and the spin-state transition is al-most completed. The gap energy estimated from the on-set of conductivity is more than 0.1 eV (Yamaguchiet al., 1996b), in accord with the transport data, althoughthe accurate determination of the gap energy is difficultbecause of the blurred onset of conductivity, perhapsdue to the indirect-gap nature (Sarma et al., 1995; Ha-mada, Sawada, and Terakura, 1995). With change oftemperature around 500 K, the spectral weight is ob-served to be rapidly transferred from the higher-lyinginterband transition region to the lower-energy region,accompanying the well-defined isosbetic (equal-absorption) point at 1.4 eV.
A surprisingly similar change in the conductivity spec-trum is observed for the case of hole doping, i.e., forLa12xSrxCoO3, when the doping level x is changed asshown in the lower panel of Fig. 225. Nominal hole dop-ing by partial substitution of La with Sr drives the FC-MIT as shown in Fig. 224. The optical conductivity spec-tra at 290 K (the lower panel of Fig. 224) show a similarspectral weight transfer with increase of x , accompany-ing the isosbetic point around 1.4 eV as well. Most of thelow-energy spectral weight is borne not by the conven-tional Drude component but by the incoherent part,both for the high-temperature LaCoO3 and forLa12xSrxCoO3. This nearly parallel behavior for tem-perature increasing and hole doping indicates that theelectronic structural change in both the insulator-metaltransitions is also nearly identical in nature.
Figure 226 displays the inverse-temperature depen-dence of the Hall coefficient (RH ; lower panel) togetherwith that of the resistivity coefficient in LaCoO3 and thelightly hole-doped compounds La12xSrxCo3 (x50.005
FIG. 225. Variations of optical conductivity spectra of LaCoO3with temperature (upper panel) and with doping x (by Sr sub-stitution; lower panel) at 290 K. From Tokura et al., 1997.

1237Imada, Fujimori, and Tokura: Metal-insulator transitions
and 0.01; Tokura, Okimoto, et al., 1998). The RH is posi-tive, indicating hole-type conduction, over the wholetemperature region and shows as steep a change as theresistivity with temperature. In particular, the carrierdensity n51/RH in LaCoO3 shows a rapid increase at400–600 K. This should be interpreted as a rapid de-crease in the gap energy itself, with increase of tempera-ture above 400 K, that is, after completion of the spin-state transition.
The light hole-doping effect manifests itself in thesaturation of the increase of the resistivity and Hall co-efficient below 400 K. The flat temperature dependenceof the RH in doped crystals implies the saturation behav-ior of impurity conduction. By contrast, the RH valueabove 400 K shows approximately common values andtemperature dependence irrespective of doping. Thefully conducting state, e.g., at 800 K, shows a small RHvalue corresponding to three holes per Co site. Thesefacts clearly indicate the presence of a large Fermi sur-face in the high-temperature conducting phase, which isleast affected by light doping as observed. Thus the ob-served insulator-metal crossover shows the essential fea-tures characteristic of a Mott transition at constant bandfilling.
The thermally induced MIT is also critically affectedby changes of the one-electron bandwidth (W). Thestandard method of bandwidth control (BC) is to utilizethe orthorhombic distortion of the perovskite, which de-pends on the A-site ionic radius, as described in detail inSec. III.B. In the present case, RCoO3 with R changingfrom La to Pr, Nd, Sm, Eu, and Gd causes an increase inthe Co-O-Co bond distortion in the GdFeO3-type ortho-rhombic lattice (apart from the rhombohedral LaCoO3)and hence a decrease of W in this order. Figure 227(Yamaguchi, Okimoto, and Tokura, 1996b) shows the T
FIG. 226. Inverse-temperature dependence of resistivity (r,upper panel) and Hall coefficient (RH , lower panel) inLaCoO3 and lightly hole-doped La12xSrxCoO3. From Tokuraet al., 1997.
Rev. Mod. Phys., Vol. 70, No. 4, October 1998
dependence of d log r/d(T21) in the above series ofRCoO3 crystals. This quantity, if constant, would repre-sent a thermal activation energy. The gradual MITshows up as a broad peak for the respective compounds,which systematically shifts to higher temperature withdecrease of the ionic radius of R or equivalently withdecrease of W . The nearly constant value ofdlog r/d(T21) at low temperatures represents the ther-mal activation energy, or half of the transport energygap Da , which also increases with decrease of W .
The variation of the charge gap is directly seen in theoptical conductivity spectra for the ground state (low-spin state, e.g., at 9 K) for RCoO3 shown in Fig. 228(Yamaguchi, Okimoto, and Tokura, 1996b). The con-
FIG. 227. Temperature (T) dependence of resistivity (r) andd log r/d(T21) for crystals of RCoO3 (R5La, Pr, Nd, Sm, Eu,and Gd). From Yamaguchi et al., 1996b).
FIG. 228. Optical conductivity spectra s(x) for RCoO3. Insetgives the overall features of NdCoO3. Spiky peaks below 0.1eV are due to optical phonons. Dashed lines are the best-fitresults with the model function for the indirect-gap plus direct-gap transitions. From Yamaguchi et al., 1996b.

1238 Imada, Fujimori, and Tokura: Metal-insulator transitions
ductivity shows a gradual onset at 1–1.5 eV perhaps dueto the indirect nature of the band gap (Sarma et al.,1995), while a residual broad tail is present at 0.1–1 eV.With R substitution from La to Gd, the spectral shapeand the onset shift as a whole to higher energy. Brokencurves in the figure represent the fitting using the modelfunctions for direct and indirect band-gap transitions.The lower-lying indirect gap is difficult to pinpoint dueto the blurred feature, while the shift of the direct gapwith R ions is quite clear.
Figure 229 (Yamaguchi, Okimoto, and Tokura,1996b) shows the observed gaps and insulator-metalcrossover temperature versus the tolerance factor (seeSec. III.B.1), which is related to the distortion of theperovskite lattice and hence the degree of p-d hybrid-ization or W . Solid circles represent the optical gap Eg ,dfor the direct transition (see Fig. 228), while solidsquares and open circles the transport gap (2Da) andthe metal-insulator crossover temperature kBTIM (aswell as 10kBTIM for reference), respectively, as derivedfrom Fig. 227. The energy scale of kBTIM is by farsmaller than 2Da for all the RCoO3 crystals, and thevariation of kBTIM with R or the tolerance factor is notso significant as that of 2Da or Eg ,d . The Eg ,d and 2Dashow nearly parallel behavior as a function of tolerancefactor. The change in the p-d transfer interaction tpdshould approximately scale with cos u, u being theCo-O-Co bond angle, as described in Sec. III.B.1. Thismeans that tpd changes almost linearly with the toler-ance factor in this region and by about 10% betweenR5La and Gd in RCoO3. The observed changes in boththe transport and the optical gap magnitudes is quite
FIG. 229. Characteristic energies vs the tolerance factor for aseries of RCoO3. Solid circles, gap energies for the optical(direct-gap) transition (Eg ,d); solid squares, gap energies forthe charge transport (2Da) in the low-temperature insulatingstate. Open circles indicate temperatures (kBTIM) for theinsulator-metal transition as well as their magnification(10kBTIM) for a better comparison. From Yamaguchi et al.,1996b.
Rev. Mod. Phys., Vol. 70, No. 4, October 1998
large compared with the change in tpd . Such a criticalchange in the charge gap with tpd , as well as an anoma-lously low TIM as compared with the charge-gap value,suggests again the important role of electron correlationin charge-gap formation below TIM as well as in theMIT itself.
The electronic structure of LaCoO3 has also beenstudied by photoemission spectroscopy and electronicstructure calculations. These studies have invariablyshown strong hybridization between Co 3d and O 2p .An LDA band-structure calculation gave a semimetallicband structure, in which the bottom of the conductionband and the top of the valence band overlap (Hamada,Sawada, and Terakura, 1995). This is due to a commontendency of the local density approximation to underes-timate band gaps; a finite gap was opened in a Hartree-Fock calculation of the multiband Hubbard model usingparameters derived from photoemission spectroscopy(Mizokawa and Fujimori, 1996b). The density of statesgiven by the LDA calculation and that from the photo-emission spectra are in good agreement with each other(Sarma et al., 1995), implying that LaCoO3 is an ordi-nary semiconductor. Nevertheless, the presence of aweak but clear charge-transfer satellite indicates thatelectron correlation is also important (Saitoh et al.,1997a). Indeed, the on-site d-d Coulomb energy isfound to be as large as U55 –7 eV from cluster-modelanalysis of the Co 2p core-level photoemission spectra(Chainani, Mathew, and Sarma, 1992; Saitoh et al.,1997a).
Concerning the phase transition from nonmagneticsemiconductor to paramagnetic semiconductor at;90 K, changes in the photoemission spectra in goingfrom below to above ;90 K are insignificant, ruling outthe possibility that the transition is a low-spin–to–high-spin transition. While within the ligand-field theory theintermediate-spin state should be higher than the low-spin and high-spin states for any parameter set, theintermediate-spin state is found to be close to and insome cases lower than the low-spin state according tothe cluster-model and band-structure calculations. Koro-tin et al. (1996) studied homogeneous solutions of theband model for LaCoO3, that is, solutions with all theCo atoms in the identical electronic state, using theLDA1U method. They found that, for an expanded lat-tice at high temperatures, the intermediate-spin state(2.11mB) could be stabilized while the high-spin state(3.16mB) always remained high in energy. Although theintermediate-spin state is an antiferromagnetic metal inthe homogeneous solution, Korotin et al. (1996) alsostudied inhomogeneous solutions and found indicationsthat orbital ordering with antiferromagnetism almostopens a gap and further lowers the energy. Hartree-Fock calculations (Mizokawa and Fujimori, 1996b)showed that the intermediate-spin state is ferromagneticwith antiferro-orbital ordering but a band gap is notopened. Since there is no long-range order in the high-temperature state, ferromagnetic correlation rather than

1239Imada, Fujimori, and Tokura: Metal-insulator transitions
ferromagnetic ordering is expected, in accordance withthe results of a neutron-scattering study by Asai et al.(1997).
Concerning the 500–600-K insulator-to-(poor) metaltransition, Abbate et al. (1993) observed a significantchange in the oxygen 1s x-ray absorption spectra acrossthe transition, as shown in Fig. 230, which is consistentwith the large change expected for a transition from thelow-spin ground state to the high-spin excited state butmay also be consistent with an insulator-to-metal transi-tion. According to both the LAD1U and Hartree-Fockcalculations, however, the high-spin state is an insulator.Korotin et al. (1996) suggested that, above ;600 K, or-bitals are disordered within the intermediate-spin state,driving the system metallic.
La12xSrxCoO3 is a unique filling-control system inthat doped holes not only act as metallic carriers butalso induce a ferromagnetic moment. The doping-induced changes in the photoemission spectra are rela-tively small and indicate that the system is in theintermediate-spin state (Saitoh et al., 1997b), unlike thehigh-spin La12xSrxMnO3.
5. La1.172xAxVS3.17
La1.172xAxVS3.17 , where A is the divalent Sr or Pbion, is a ‘‘misfit-layer’’ compound consisting of alternat-ing stacks of CdI2-type VS2 layers and rock-salt-typeLa12xAxS layers, as shown in Fig. 231:(La12yAyS)1.17VS2. In LaA0.17VS3.17 (x50.17), the Vatoms are trivalent and the compound is an insulator
FIG. 230. Temperature dependence of the oxygen 1s x-rayabsorption spectra of LaCoO3 (Abbate et al., 1993). The low-energy peak which appears above ;500 K may be assignedeither to the t2g band or to the coherent spectral weight of themetallic state.
Rev. Mod. Phys., Vol. 70, No. 4, October 1998
with the d2 configuration. The system becomes nonmag-netic below ;280 K, indicating a spin-singlet formationof some form at low temperatures (Yasui et al., 1995). Ifthe d2 configuration is localized, it should be in the high-spin (S51) state. Therefore the S51 spins shouldsomehow be coupled to form a singlet ground state. Amost likely scenario is the formation of S50 V3 trimersas in LiVO2 (Onoda, Naka, and Nagasawa, 1991); in-deed, a structural deformation is involved in the 280-Ktransition, as revealed by thermal dilatation and ultra-sound velocity measurements (Nishikawa et al., 1996). Ifthe d2 configuration is not localized but forms bandstates, then the spin-gap behavior may be simply be-cause the distorted LaA0.17VS3.17 is a band insulator. Inthe band-insulator–to–metal transition, the disappear-ance of the spin gap and the appearance of metallic be-havior should occur simultaneously. The latter possibil-ity cannot be excluded from the resistivity and magneticsusceptibility data alone because the electrical resistivityis relatively low above ;280 K and nearly temperatureindependent, as shown in Fig. 232 (Nishikawa, Yasui,
FIG. 231. Crystal structure of La1.172xAxVS3.17. From Nish-ikawa et al., 1996.
FIG. 232. Electrical resistivity of La1.172xSrxVS3.17 (Nishikawaet al., 1996). It becomes the largest for x50.17.

1240 Imada, Fujimori, and Tokura: Metal-insulator transitions
and Sato, 1994; Nishikawa et al., 1996).La1.172xAxVS3.17 is a unique filling-control system in
that it can be doped with either holes (x.0.17) or elec-trons (x,0.17). Its crystal structure implies that theelectronic properties are highly two dimensional as inthe cuprates. As shown in Fig. 232, the highest electricalresistivity indeed occurs at x;0.17 and the material be-comes more conductive with either decreasing or in-creasing x with respect to x;0.17. Thermoelectric poweris positive for x>0.17 and negative for x,0.17, and itsmagnitude decreases as x deviates from 0.l7, indicatingthat holes and electrons, respectively, are doped into theMott insulator LaSr0.17VS3.17 . Samples with the highestdoping (x;0 for n-type doping and x;0.35 for p-typedoping) still show a resistivity upturn at low tempera-tures, but the temperature dependence of the thermo-electric power (Fig. 233) indicates metallic behavior (S}T) below 50–100 K (Yasui et al., 1995). Thermoelectricpower, which is not influenced by intergrain transport,should reflect more intrinsic properties of the materials.It becomes semiconducting (dS/dT,0) above ;100 Kand again metallic above ;250 K with smaller slope.The Hall coefficient (Fig. 234) is positive at high tem-peratures for all doping concentrations x , but inelectron-doped samples it becomes negative at low tem-peratures (!100 K). Its strong temperature depen-dence, especially in lightly doped samples, is similar tothat found in the high-Tc cuprates.
The electronic specific heat decreases as x→0.17, thatis, with decreasing carrier concentration (Nishikawaet al., 1996), which means that the effective mass of theconduction electrons becomes lighter or the carriernumber decreases as the system approaches the un-doped insulator. This is analogous to the high-Tc cu-prates (Loram et al., 1989; Momono et al., 1994) but op-
FIG. 233. Seebeck coefficient of La1.172xSrxVS3.17 (Yasui et al.,1995). It is negative for x,0.17 while it becomes positive forx>0.17, indicating electron and hole doping, respectively.
Rev. Mod. Phys., Vol. 70, No. 4, October 1998
posite to the 3D Ti perovskite oxides (Tokura et al.,1993).
Band-structure calculations have not been performedon this system because of the incommensurate crystalstructure. The electronic structure of the VS2 layer canbe envisaged from the band structure of the layered ma-terial VS2 (Myron, 1980), according to which thepartially-filled V 3d band is located above the filled S 3pband and these bands are strongly hybridized with eachother. Photoemission studies confirmed this electronicstructure [Fig. 235(a); Ino et al., 1997b], meaning thatthecompound can be viewed as a Mott-Hubbard-typesystem (although it must be located near the boundarybetween the Mott-Hubbard and charge-transfer re-gimes). The doping dependence of the photoemissionspectra reveals an interesting behavior of the spectralweight redistribution and chemical potential shift asfunctions of band filling. As shown in Fig. 235(a), the V3d band (within ;1.5 eV of EF) is shifted toward EFwith electron doping and away from EF with hole dop-ing, but the shift is slower than that of the S 3p band(located 1.5–1.7 eV below EF). If the shift of the S 3pband reflects a chemical potential shift, the slower shiftof the V 3d band would be interpreted as due to therepulsion between quasiparticles of V 3d character, asdescribed in Sec. II.D.1. The shift of the chemical poten-tial ]m/]n , as reflected in the shift of the S 3p band, isslow for low hole/electron concentration and fast forhigh hole/electron concentration, as shown in Fig.235(b). The suppression of ]m/]n near the Mott insula-tor may imply that the effective mass is enhanced, whichexcludes the simplest band-insulator picture for the un-doped compound. The suppression of the chemical po-tential shift is apparently inconsistent with the decreas-ing electronic specific heat toward x50.17, if oneassumes the Fermi-liquid relations (2.74) and (2.75) withnonsingular behavior of the Landau parameters (Fu-rukawa and Imada, 1993). The observations ]m/]n→0and g→0 for x→0.17 can be reconciled with each otherif the metallic state is not a Fermi liquid or if there is apseudogap in the vicinity of the chemical potential. An-
FIG. 234. Temperature dependence of the Hall coefficient forLa1.172xSrxVS3.17. From Yasui et al., 1995.
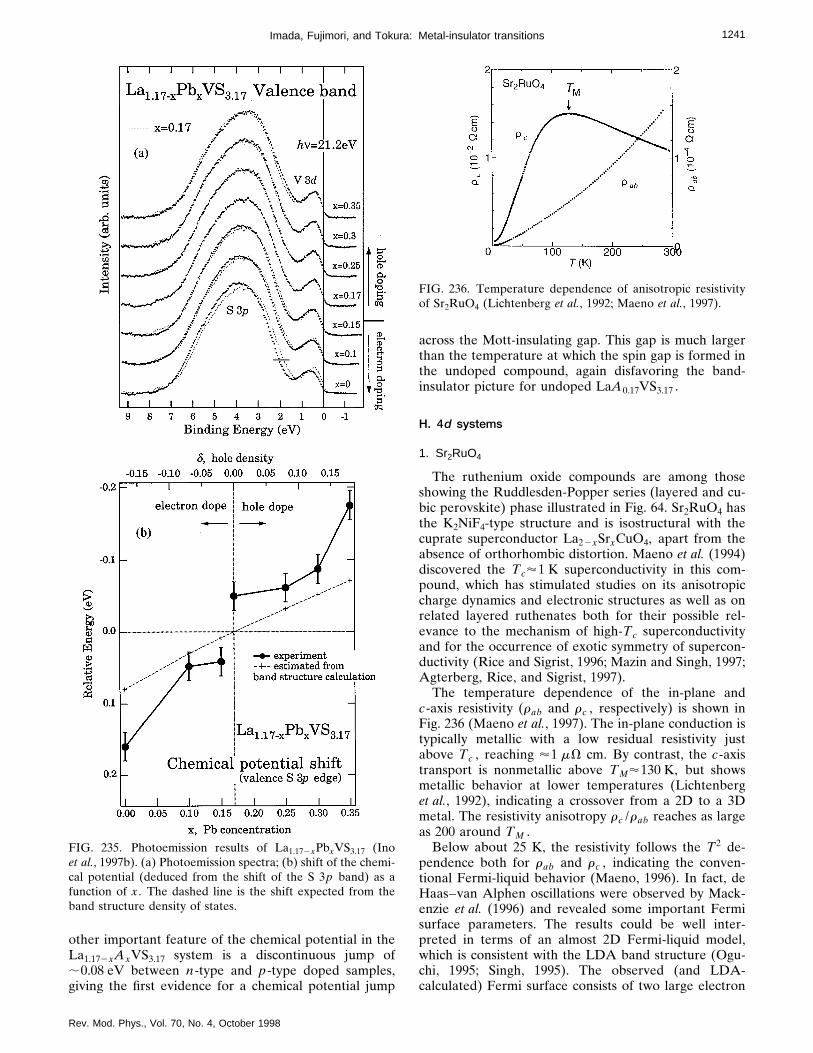
1241Imada, Fujimori, and Tokura: Metal-insulator transitions
other important feature of the chemical potential in theLa1.172xAxVS3.17 system is a discontinuous jump of;0.08 eV between n-type and p-type doped samples,giving the first evidence for a chemical potential jump
FIG. 235. Photoemission results of La1.172xPbxVS3.17 (Inoet al., 1997b). (a) Photoemission spectra; (b) shift of the chemi-cal potential (deduced from the shift of the S 3p band) as afunction of x . The dashed line is the shift expected from theband structure density of states.
Rev. Mod. Phys., Vol. 70, No. 4, October 1998
across the Mott-insulating gap. This gap is much largerthan the temperature at which the spin gap is formed inthe undoped compound, again disfavoring the band-insulator picture for undoped LaA0.17VS3.17 .
H. 4d systems
1. Sr2RuO4
The ruthenium oxide compounds are among thoseshowing the Ruddlesden-Popper series (layered and cu-bic perovskite) phase illustrated in Fig. 64. Sr2RuO4 hasthe K2NiF4-type structure and is isostructural with thecuprate superconductor La22xSrxCuO4, apart from theabsence of orthorhombic distortion. Maeno et al. (1994)discovered the Tc'1 K superconductivity in this com-pound, which has stimulated studies on its anisotropiccharge dynamics and electronic structures as well as onrelated layered ruthenates both for their possible rel-evance to the mechanism of high-Tc superconductivityand for the occurrence of exotic symmetry of supercon-ductivity (Rice and Sigrist, 1996; Mazin and Singh, 1997;Agterberg, Rice, and Sigrist, 1997).
The temperature dependence of the in-plane andc-axis resistivity (rab and rc , respectively) is shown inFig. 236 (Maeno et al., 1997). The in-plane conduction istypically metallic with a low residual resistivity justabove Tc , reaching '1 mV cm. By contrast, the c-axistransport is nonmetallic above TM'130 K, but showsmetallic behavior at lower temperatures (Lichtenberget al., 1992), indicating a crossover from a 2D to a 3Dmetal. The resistivity anisotropy rc /rab reaches as largeas 200 around TM .
Below about 25 K, the resistivity follows the T2 de-pendence both for rab and rc , indicating the conven-tional Fermi-liquid behavior (Maeno, 1996). In fact, deHaas–van Alphen oscillations were observed by Mack-enzie et al. (1996) and revealed some important Fermisurface parameters. The results could be well inter-preted in terms of an almost 2D Fermi-liquid model,which is consistent with the LDA band structure (Ogu-chi, 1995; Singh, 1995). The observed (and LDA-calculated) Fermi surface consists of two large electron
FIG. 236. Temperature dependence of anisotropic resistivityof Sr2RuO4 (Lichtenberg et al., 1992; Maeno et al., 1997).

1242 Imada, Fujimori, and Tokura: Metal-insulator transitions
cylinders (b and g) centered on the GZ line and onenarrow hole cylinder (a) running around the corner ofthe Brillouin zone (see dashed lines of Fig. 238 below).The metallic c-axis transport at low temperatures isdominated by b and g sheets, for which the c-axis meanfree path lc ('30 Å at 1 K) can be substantially longerthan the separation between adjacent RuO2 sheets, c/256.4 Å (Mackenzie et al., 1996).
The carrier electrons in Sr2RuO4 appear to be consid-erably renormalized due to the electron correlation. Theelectronic specific-heat coefficient (g) is 37.5 mJ/K2 mol(Maeno et al., 1997), which gives rise to a density ofstates at the Fermi level enhanced by a factor of 3.6 overthe LDA result. The Wilson ratio, RW5x/g , is 1.7–1.9,also typical of correlated metals.
A strong mass renormalization for the c-axis chargedynamics was observed in the strongly temperature-dependent c-axis spectra of the optical conductivity(Katsufuji, Kasai, and Tokura, 1996). In the c-axis spec-tra, the Drude band evolves below TM with an apparentplasma edge around 0.01 eV at T!TM . Figure 237 (Kat-sufuji, Kasai, and Tokura, 1996) shows the result of ananalysis of the c-axis spectra in terms of the extendedDrude model, in which the energy dependence of themass and relaxation time of the conduction carriers wastaken into account. Below TM'130 K, mc* for \v,0.02 eV is enhanced and reaches about 30 times theunrenormalized c-axis mass mc for \v,0.01 eV at 15 K.On the other hand, \/t is suppressed for \v,0.012 eVbut increases for \v.0.012 eV with a decrease in tem-perature. Such a conspicuous temperature dependenceis similar to that of a heavy-fermion compound, e.g.,
FIG. 237. Energy-dependent effective mass and scattering ratefor the c-axis conduction, derived by extended Drude analysisof c-axis polarized optical conductivity spectra. From Katsu-fuji, Kasai, and Tokura, 1996.
Rev. Mod. Phys., Vol. 70, No. 4, October 1998
URu2Si2 (Bonn, Garrett, and Timusk, 1988). By con-trast, mab* (v)/mab is nearly independent of \v, though asmall mass enhancement is observed in a T-dependentmanner below 0.3 eV. These results indicate that the 3Dmetallic conduction below TM'130 K is brought aboutby the onset of coherent motion of carriers for which themass and scattering rate along the c axis are stronglyrenormalized. Such anisotropic mass renormalizationmay be considered as a generic feature of quasi-2D met-als with strong electron correlation, but it is obviouslydistinct from the case of the cuprate superconductors.
The LDA band structure of Sr2RuO4 was calculatedby Oguchi (1995) and Singh (1995). Their calculationspredict that energy bands which cross the EF are derivedfrom the strong hybridization of the Ru 4dxy , 4dyz , and4dzx orbitals with the O 2p orbitals. The photoemissionspectra are generally consistent with this picture, but theobserved Ru 4d band feature is distributed over a widerenergy range than the calculation, as shown in Fig. 238(Inoue et al., 1996). This may be interpreted as due toelectron correlation effects within the Ru 4d band, as inthe case of the V and Ti oxides described above, that is,as due to a transfer of spectral weight from the coherentquasiparticle band to the incoherent part of the spectralfunction. Also, the spectral weight at EF is suppressedcompared to the band DOS as in the V and Ti oxides.Thus Sr2RuO4 may be viewed as one of the stronglycorrelated electron systems like the 3d transition-metaloxides, and any interpretation of its various physicalproperties should take into account electron correlation.
Dispersions of the Ru 4d-derived bands were investi-gated by angle-resolved photoemission studies (Yokoyaet al., 1996a, 1996b; Lu et al., 1996). In spite of the wideenergy distribution of the coherent plus incoherent spec-
FIG. 238. Photoemission spectrum of Sr2RuO4 (rexp(v); Inoueet al., 1996) compared with the DOS from a band-structurecalculation [D(v); Oguchi, 1995]. The solid curve representsthe DOS modified by the self-energy correction S(k,v)5gv@G/(v2iG)#@D/(v2iD)#1a«k , where g510.1, G50.102 eV, D50.246 eV, and a51.5.

1243Imada, Fujimori, and Tokura: Metal-insulator transitions
tral weight, the dispersions near EF (reflecting only thecoherent part) were generally weak compared with theband-structure calculations. In particular, they revealeda flat band with a saddle point, i.e., a so-called ‘‘ex-tended van Hove singularity’’ around the (p,0) point ofthe Brillouin zone, as in the high-Tc cuprates. The posi-tion of the flat band was ;20 meV below EF . The cal-culations predicted an electron-like Fermi surfacearound the G point and two hole-like Fermi surfacesaround the X [(p,p)] point. Although the mass is moreenhanced in the de Haas–van Alphen measurementthan the LDA result, the volumes of the calculatedFermi surfaces are in agreement with those derived fromthe de Haas-van Alphen measurements to within 1%(Mackenzie et al., 1996). On the other hand, the Fermisurfaces obtained by the angle-resolved photoemissionstudies are in disagreement with the band-structure cal-culations and the de Haas–van Alphen measurements,as shown in Fig. 239. It was found that the agreement isimproved if the EF is shifted upward by ;70 meV com-pared to the calculated band structure (Lu et al., 1996),although it is difficult to justify such a procedure. Sincethis is the only case where ARPES experiments andLDA calculations have given different Fermi surfacesfor a 2D metal, a more critical experimental checkshould be made in order to exclude, e.g., surface effects.
2. Ca12xSrxRuO3
SrRuO3 has a slightly distorted perovskite(GdFeO3-type) structure and is metallic. It shows ferro-magnetic order below TC.160 K (Callagan et al., 1966).The saturation magnetization is 1.1–1.3 mB /Ru, and aneutron-diffraction study gave the ordered moment of1.460.4 mB /Ru, which is the largest ordered magneticmoment among 4d transition-metal compounds (Longoet al., 1968). While those values are smaller than that(2mB) expected for the Ru41 ion in the low-spin state(t2g
4 , S51), the effective moment above TC , ;2.6mB ,is rather close to the low-spin value of 2AS(S11)
FIG. 239. Fermi surfaces of Sr2RuO4 measured by angle-resolved photoemission spectroscopy (Yokoya et al., 1996a).The filled circles denote electronlike Fermi surfaces and theopen and gray circles denote holelike Fermi surfaces. Fermisurfaces derived from band-structure calculations (Oguchi,1995) are given by the dashed lines.
Rev. Mod. Phys., Vol. 70, No. 4, October 1998
52.83mB (Callagan et al., 1966; Longo et al., 1968). TheRhodes-Wolfarth ratio is thus ;1.3, a value close to thatof the itinerant ferromagnet Ni metal, implying thatSrRuO3 is an ‘‘intermediately localized’’ ferromagnet(Fukunaga and Tsuda, 1994). The TC decreases underhydrostatic pressure at the rate of dTC /dP.2(6 –8) K•GPa21 (Neumeier et al., 1994; Shikano et al.,1994), as in other itinerant ferromagnets. The negativedTC /dP is contrasted with the positive dTN /dP inlocal-moment systems such as LaTiO3 (Okada et al.,1992) and the positive dTC /dP in double-exchange sys-tems such as La12xSrxMnO3 (Moritomo et al., 1995).
CaRuO3 is also metallic. The crystal structure ofCaRuO3 is more distorted than SrRuO3: the Ru-O-Rubond angle is reduced from ;165° to ;150°, in goingfrom SrRuO3 to CaRuO3 (Kobayashi et al., 1994). TheWeiss temperature is negative, indicating antiferromag-netic interaction between magnetic moments, but it re-mains paramagnetic down to the lowest temperature(Gibb et al., 1974). In the solid solution Ca12xSrxRuO3,the Curie temperature TC decreases with Ca contentand is completely suppressed at x.0.4 (Kanbayashi,1978) [while a recent study on single crystals showedthat TC remains finite up to x&1 (Cao et al., 1997)]. Thedecrease of TC with Ca substitution may appear consis-tent with the decrease of TC under pressure, in the sensethat the lattice constant shrinks in both cases. It shouldbe remembered, however, that the reduction in the Ru-O-Ru bond angle with Ca substitution would normallyreduce the d-band width and would therefore have aneffect opposite to that of increased pressure. More stud-ies are needed to explain both the pressure and Ca sub-stitution effects in a consistent way.
With Ca substitution, the effective moment peff in-creases and the Weiss temperature u decreases, asshown in Fig. 240 (Fukunaga and Tsuda, 1994): uchanges its sign at x.0.4. The x21-T plot in a widetemperature range (T,100 K) changes its slope above
FIG. 240. Effective moment peff and Weiss temperature Q ofCa12xSrxRuO3 (Fukunaga and Tsuda, 1994). The open andfilled symbols correspond to values deduced at high and lowtemperatures.

1244 Imada, Fujimori, and Tokura: Metal-insulator transitions
and below T;600 K for all x’s: In the low-temperatureregion, u is a little larger, indicating that ferromagneticcoupling increases at low temperatures, and peff issmaller, indicating that the magnetic electrons are moreitinerant at low temperatures. These observations meanthat metallic transport favors ferromagnetic coupling.The increased localized character at high temperaturesmay be a general property of narrow-band metals, inwhich there is no coherent transport above T;W* /3kB , where W* is the renormalized bandwidth.The resistivity value of ;231024 V cm at high tem-peratures (;300 K) indicates kFl;1, but no saturationis found up to 1000 K (Allen et al., 1996). This indicatesthe breakdown of conventional metallic transport; Kleinet al. (1996) attributed this to the ‘‘bad metallic behav-ior’’ discussed by Emery and Kivelson (1995). The opti-cal spectra of CaxSr12xRuO3 show great similarity tothose of the high-Tc cuprates (Bozovic et al., 1994).Nearly s(v);1/v behavior is found up to v;1 eV; theelectronic Raman scattering shows an energy-independent continuum up to ;1 eV. These optical be-haviors are characteristic of incoherent metals.
Coupling between the magnetic and transport proper-ties is an interesting issue in metallic ferromagnets.SrRuO3 shows negative magnetoresistance over thewhole temperature range (Gasusepohl et al., 1995; Izumiet al., 1997). The Hall coefficient changes its sign fromnegative to positive at ;50 K with increasing tempera-ture (Gausepohl et al., 1996), which implies that thereare both electronlike and hole-like Fermi surfaces andthat a large portion of the Fermi surfaces are very flat.Figure 241 shows that the resistivity drops at tempera-tures below TC due to the disappearance of scatteringfrom spin disorder. Above TC , the temperature depen-dence of the normalized resistivity is nearly identical forall x’s, probably because the same (spin-disorder) scat-
FIG. 241. Resistivity of Ca12xSrxRuO3 normalized at 300 K(Fukunaga and Tsuda, 1994). r0 is the residual resistivity andfor SrRuO3 ranges from r0;231025 V cm (Bouchard andGillson, 1972; Klein et al., 1996) to 2.331026 V cm (Izumiet al., 1997). Here r(300 K)52 –331024 V cm and a is a scal-ing parameter.
Rev. Mod. Phys., Vol. 70, No. 4, October 1998
tering mechanism dominates in the high-temperaturerange (Fukunaga and Tsuda, 1994). With Ca substitu-tion, the resistivity below TC increases as TC decreasestowards x;0.4, and with further substitution it de-creases again: In particular, CaRuO3 shows an unusualresistivity drop below ;50 K, which may indicate thedisappearance of scattering by magnetic fluctuations,possibly due to the opening of an excitation gap in themagnetic fluctuation spectrum. The critical behaviorsaround TC give insight into the coupling between mag-netic and transport properties. Anomalous critical trans-port behavior has been found, but is attributed to the‘‘bad metallic’’ behavior and not to the coupling be-tween the magnetic and transport properties, becausethe critical magnetic behavior is conventional (Kleinet al., 1996).
The band structure of ferromagnetic SrRuO3 was cal-culated within the LSDA (Singh, 1996; Allen et al.,1996). The results show very strong Ru 4d-O 2p hybrid-ization as in Sr2RuO4. Both electronlike and hole-likeFermi surfaces are indeed present. Flat bands cross EF ,giving rise to a high DOS at EF and hence a ferromag-netic ground state through the Stoner mechanism. Theobtained ordered moment of ;1.5 mB /Ru is in goodagreement with the experimental value of 1.460.4 mB /Ru. The overall line shape of the photoemis-sion spectra (Cox et al., 1983; Fujioka et al., 1997) agrees
FIG. 242. Photoemission and O 1s x-ray absorption spectra ofSrRuO3 compared with the band DOS in the ferromagneticstate (Fujioka et al., 1997). For the XAS spectra, the oxygen ppartial DOS is presented.

1245Imada, Fujimori, and Tokura: Metal-insulator transitions
well with the band DOS, as shown in Fig. 242. The Ru4d band, however, is spread over a wider energy rangethan the calculation, and the spectral weight at EF issuppressed compared to the band DOS, as in the case ofSr2RuO4. This may be interpreted as due to transfer ofspectral weight from the coherent part to the incoherentpart of the spectral function arising from electron corre-lation. From the reduced spectral intensity at EF , oneobtains mk /mb;0.3 (Sec. II.D.1). Combining this valuewith the mass enhancement factor of m* /mb53.7 de-duced from the electronic specific heat g and the band-structure calculation (Allen et al., 1996), one obtains thequasiparticle weight Z5(mk /mb)/(m* /mb)mb;0.1.Such a small weight should be related to the bad/incoherent metallic behavior discussed above.
Evolution of the spectral function in going from me-tallic to insulating Ru oxides was studied for various Ruoxides, including the Pauli-paramagnetic metalBi2Ru2O7, paramagnetic metal CaRuO3, ferromagneticmetal SrRuO3, and antiferromagnetic insulatorY2Ru2O7 (Cox et al., 1983). These oxides show qualita-tively similar behavior to that of the V and Ti oxideswith d1 configuration (Sec. I.A.5), in that there is atransfer of spectral weight from higher binding energies(the ‘‘incoherent part’’) to lower binding energies (the‘‘coherent part’’) with increasing U/W . From the shal-lower position of the incoherent peak, the Coulomb en-ergy U is estimated to be somewhat smaller (;3 eV)than that of the Ti and V oxides (;4 eV).
V. CONCLUDING REMARKS
Almost localized electrons near the metal-insulatortransitions are well described neither by a simple itiner-ant picture in momentum space nor by a localized pic-ture in real space. Theoretical and experimental effortsto make bridges between the itinerant and localized or,in other words, coherent and incoherent pictures havebeen made for years and have been fruitful, as we haveseen in this article. However, this is still a challengingsubject and many open questions have yet to be an-swered. Marginally retained metals near the metal-insulator transition have offered interesting and richphenomena for decades and will continue to do so in thefuture, presenting fundamental problems in condensedmatter physics as well as potential sources of applica-tions.
We first summarize the basic understanding of corre-lation effects of almost localized electrons near themetal-insulator transitions. In the Mott insulating state,a charge gap is formed and electrons are localized belowthe gap energy scale. Because of the local nature of theelectron wave function in the insulator, the internal de-grees of freedom (component degrees of freedom) suchas spin and orbital fluctuations give rise to degeneracy,which, along with the resultant residual entropy, is re-leased at low temperatures by intersite interactions suchas superexchange and orbital exchange. In the strong-correlation regime, these exchange interactions can bemuch smaller than the charge gap and the bare band-
Rev. Mod. Phys., Vol. 70, No. 4, October 1998
width. Therefore the entropy due to the component re-mains unreleased above such low energy scales. Whenthe system is slightly metallized, the coherent part is stillsmall and the entropy related to the dominant incoher-ent part is also not released above the temperature ofthe intersite exchange interactions. This provides thebackground for the anomalous behavior of metals at lowtemperatures near the Mott insulator.
With this underlying residual entropy, in the lightlydoped metallic region, more happens. At integer fillings,the states near the Fermi level for the noninteractingsystem are kicked out of the Mott gap region by strongCoulomb repulsion. The region reconstructed out of theMott gap forms a flat band as in Fig. 243, causing degen-eracy in momentum space, and constitutes another ori-gin of degeneracy. The mobile carriers under this flatdispersion further strongly couple to the component de-grees of freedom and disturb the process of entropy re-lease for the spin and orbital degrees of freedom, whenthe carrier motion destroys the ordering of spins andorbitals. As a counteraction, the spin and orbital corre-lations also disturb the coherent carrier motion to makea flatter band with strong damping in a self-consistentfashion. Then the coupling of charge dynamics to thecomponent destabilizes the charge coherence as well asthe component ordering and compresses the process ofresidual entropy release into a much lower energy scale.This combined effect is the main origin of the variousanomalous features of correlated metals near the metal-insulator transition that have been the main subject ofthis review article. As we have seen in various examples,the residual entropy and related fluctuations cause richphenomena which are quite different from those of stan-dard metals—for example, mass enhancement, unusualtemperature dependence of the resistivity and spin sus-ceptibility, obstinate incoherent responses in transport,optical, photoemission, and magnetic studies, and en-hanced spin and orbital fluctuations.
These anomalous features are most distinctly de-scribed by the quantum critical phenomena of the Motttransition. In particular, coupling to the component de-grees of freedom is able to cause a change even in theuniversality class of the metal-insulator transition, as inz54 in the 2D systems. In terms of the critical expo-
FIG. 243. The chemical potential m and the doping concentra-tion d to illustrate the width of the critical region. The dottedline is the m vs d for a noninteracting system and the solidcurve for an interacting system with the Mott insulating phase.

1246 Imada, Fujimori, and Tokura: Metal-insulator transitions
nents of the universality class, the degree of coherentcarrier motion is characterized by the dynamic exponentz , which represents the dispersion of the charge carriernear the metal-insulator transition. Coupling to a com-ponent with large quantum fluctuations drives the ordi-nary exponent z52 to a higher value, which qualita-tively changes the character of a metal to a moreincoherent liquid. Whether a metal can be described interms of quantum critical phenomena depends on thewidth of the critical region. If the region is narrow, it willnot influence experimental results. The critical region ofa metal-insulator transition for filling control is roughlyestimated from a simple argument. As discussed above,when the Mott gap Dc opens at an integer filling, thestates of the noninteracting counterpart containedwithin the gap are reconstructed and pushed out fromthe gap region to the outer gap edge E5Dc roughlywithin the energy range of the gap, namely Dc<E<2Dc . This energy range is transformed to the wave-number scale k;min(2p,2pDc /t), which determines thearea of flat dispersion due to many-body effects andcharacterizes the critical region (see Fig. 243). This isinterpreted as the critical region of the doping concen-tration extended up to d;min(1,Dc /t). In the strong-correlation regime, Dc could have the same order ofmagnitude as the bare bandwidth, which makes the criti-cal region of the doping concentration wide. This is whyMott phenomena in the strong-correlation regime havea wide critical region and why treatments in terms ofquantum critical phenomena are appropriate in experi-mentally observed metallic regions, in contrast to thecase of simple magnetic transitions.
There are several different views of each anomalousfeature of metals near the Mott insulator, in which dif-ferent and individual aspects can be emphasized. Theyinclude Anderson localization due to disorder, localiza-tion transitions due to coupling to the lattice (polaroneffects), instabilities to charge ordering and other localorders, as well as instabilities to superconductivity. Wefirst note that these additional aspects are both repercus-sion effects of the Mott transition and at the same timeinevitable products of it. When the Mott transition isapproached from the metallic side, anomalously sup-pressed coherence with the vanishing renormalizationfactor generates slower and slower charge dynamics,which leads to the high sensitivity of charged carriers tovarious external fluctuations, and the system becomessubject to instabilities to localization or some type ofsymmetry breaking. This sensitive region is illustrated inFig. 1 in the shaded area.
To understand the global features and the principaldriving force of the Mott transition, we first have to un-derstand its intrinsic nature. In this article, we havesketched various theoretical approaches for that pur-pose. In conjunction with experimental results, variousmean-field approaches have succeeded in explainingsome aspects of the anomalies. However, for unusualmetals with increasingly incoherent responses towardthe metal-insulator transition, it has been shown thattemporal as well as spatial fluctuations have to be prop-
Rev. Mod. Phys., Vol. 70, No. 4, October 1998
erly taken into account. In this context, the Fermi-liquidapproaches must include strong wave-number and fre-quency dependences in the self-energy correction be-yond the present level. It would be desirable for thisFermi-liquid framework to include a program for pre-dicting the breakdown of the Fermi liquid itself as theMott insulator is approached in a continuous fashion.The same requirement applies to first-principles calcula-tions and spin-fluctuation theories. When spatial fluctua-tions are ignored, temporal fluctuations are correctly ex-pressed by the dynamic mean-field theory, in contrast toother theoretical approaches such as the Gutzwiller,Hubbard, Hartree-Fock, and slave-particle approxima-tions. When both spatial and temporal fluctuations be-come important, a prescription in low dimensions is es-tablished by the scaling theory. Further understandingalong the lines of the scaling description, especially thesingular wave-number dependence of the renormaliza-tion that it implies, has to be pursued. The flat bandstructure around (p,0) in 2D relevant in the cupratesoffers a particular example. Numerical methods haveproven to be powerful when combined with an appro-priate low-energy description of the scaling behavior. Itwould be desirable to further improve the method toreduce the limitation of finite system size and also toallow the calculation of dynamical quantities in largesystems. The criticality of the Mott phenomena has beenrecognized as a subject to be studied in greater detail inreal materials. Systematic studies have only just begunrecently, and further experiments that fine-tune andcontrol the parameters will be needed.
As mentioned above, the appearance of the strongcorrelation effects in real materials is accompanied byvarious other degrees of freedom. These secondary ef-fects inevitably occur to some extent because of slowand incoherent charge dynamics generated by the Mottphenomena. Studies on these repercussion effects are allat a primitive stage of understanding at the moment andshould be elucidated in the future. The first issue isAnderson localization near the Mott insulator. It re-mains to be clarified how the disorder effects appear justbefore a mass-diverging Mott transition. This is clearlybeyond the presently available scenarios of the Ander-son localization. The second issue is the effect of po-larons, which may be particularly important when thelattice degrees of freedom are strongly coupled throughthe component, as in the case of dynamic Jahn-Tellerdistortion coupled to orbital fluctuations. Another sec-ondary effect is the instability of incoherent metal nearthe Mott insulator to charge, spin, or orbital order andcompetition between these types of order. Charge order-ing or stripe structure may happen more easily near theMott insulator due to the mass enhancement. In particu-lar, it has been proposed that the inherent instability ofincoherent metal to the superconducting state is drivenby the change in universality class connected with themechanism of high-Tc superconductivity. This idea de-serves elucidation in more detail.
For a better understanding of the d-electron systems,we need to study orbital degrees of freedom more sys-

1247Imada, Fujimori, and Tokura: Metal-insulator transitions
tematically. Mean-field phase diagrams have been stud-ied for the coupled spin and orbital systems and com-pared to the experimental results, but fluctuation effectsare not well studied at the moment.
Here, we briefly summarize the effort to determinethe overall electronic model parameters of correlatedmetals. The global electronic structure of 3d transition-metal compounds on the eV scale is now well under-stood from spectroscopic and first-principles studies.The electronic structure parameters such as the on-siteCoulomb energy U , the charge-transfer energy D, andthe transfer integrals T have been deduced and theirsystematic changes with chemical composition rangingfrom the Mott-Hubbard regime to the charge-transferregime have been clarified. The LDA1U method pro-vides a practical way to incorporate electron-electron in-teractions into first-principles band-structure calcula-tions on the Hartree-Fock level. However, in many casesthe U value has been determined not from first prin-ciples but empirically. That is, a true first-principles ap-proach to strongly correlated systems is lacking so far,even on the mean-field level. To understand the spectro-scopic properties, effects of interactions that are not in-cluded in the standard models such as the Hubbard andd-p models, namely, the long-range Coulomb interac-tion, electron-phonon interaction, impurity potentials,etc. need to be studied further in the future.
Experimentally, in this decade, many d-electron com-pounds have been studied with the idea of systematicallycontrolling the parameters to tune the distance from themetal-insulator transition. Filling control, bandwidthcontrol, and dimensionality control have been exten-sively studied. The compounds studied indeed show di-verse properties of transport, optical and magnetic re-sponses while theoretical analyses have provided usefulschemes for classifying the anomalous properties sur-veyed in this article. In the last decade, interesting andsurprising phenomena have been found in the regionwhere the metallic state is retained close to the Mottinsulator when instability to electron localization is sup-pressed. These include high-Tc superconductivity andcolossal magnetoresistance. In future experimental stud-ies, it is certainly hoped that metallic states as close aspossible to the Mott insulator can be further realized ina variety of materials and that various instabilities canbe controlled to obtain strongly nonlinear responses ofcharge, spin, orbital, and lattice properties, with the goalof developing useful devices for applications. Nonlinearresponses also offer a rich array of dynamic properties inboth equilibrium and nonequilibrium states, with meta-stabilities and slow relaxations as in the Mn perovskitecompounds. These show great promise for useful opticalor magnetic applications. It is certainly clear that ourknowledge on the controllability of carrier dynamicsclose to the Mott insulator is still at a primitive stagecompared to that in semiconductor devices. Correlatedelectron devices will have broad potential applicationswhen properly developed, because of the cooperativeand collective nature of electrons.
Rev. Mod. Phys., Vol. 70, No. 4, October 1998
ACKNOWLEDGMENTS
The authors thank G. Aeppli, P. W. Anderson, S. An-zai, A. Asamitsu, F. F. Assaad, A. E. Bocquet, E. Dag-otto, D. S. Dessau, H. Ding, N. Furukawa, J. M. Honig,I. H. Inoue, N. Katoh, T. Katsufuji, T. Kimura, K.Kishio, K. Kitazawa, G. Kotliar, Y. Kuramoto, H. Ku-wahara, K. Matho, M. Matoba, T. Mizokawa, T. Moriya,Y. Motome, Y. Okimoto, J.-H. Park, T. M. Rice, D. D.Sarma, T. Sasagawa, G. A. Sawatzky, H. Tabata, H.Takagi, Y. Tomioka, H. Tsunetsugu, J. Wilkins, and H.Yasuoka for their help at various stages in the writing ofthis article, including fruitful discussions and preparationof figures. The authors thank J. Wilkins for his encour-agement in writing this article. The authors are gratefulfor financial support by a Grant-in-Aid for Scientific Re-search on the Priority Area ‘‘Anomalous Metallic Statesnear the Mott Transition’’ from the Ministry of Educa-tion, Science and Culture, Japan, and are also indebtedto members of this project for valuable discussions. Theauthors also acknowledge support from Japan Societyfor Promotion of Science under the project JSPS-RFTP97P01103. The authors appreciate K. Fujii and N.Sasaki for their devotion and help during the prepara-tion of this article.
REFERENCES
Preprint numbers refer to the archives [email protected], M., F. M. F. de Groot, J. C. Fuggle, A. Fujimori, O.
Strebel, F. Lopez, M. Domke, G. Kaindl, G. A. Sawatzky, M.Takano, Y. Takeda, H. Eisaki, and S. Uchida, 1992, Phys.Rev. B 46, 4511.
Abbate, M., F. M. F. de Groot, J. C. Fuggle, A. Fujimori, Y.Tokura, Y. Fujishima, O. Strebel, M. Domke, G. Kaindl, J.van Elp, B. T. Thole, G. A. Sawatzky, M. Sacchi, and N.Tsuda, 1991, Phys. Rev. B 44, 5419.
Abbate, M., J. C. Fuggle, A. Fujimori, L. H. Tjeng, C. T. Chen,R. Potze, G. A. Sawatzky, H. Eisaki, and S. Uchida, 1993,Phys. Rev. B 47, 16124.
Abrahams, E., P. W. Anderson, D. C. Licciardello, and T. V.Ramakrishnan, 1979, Phys. Rev. Lett. 42, 673.
Abrahams, E., and P. A. Lee, 1986, Phys. Rev. B 33, 683.Aebi, P., J. Osterwalder, P. Schwaller, L. Schlapbach, M. Shi-
moda, T. Mochiku, and K. Kadowaki, 1994, Phys. Rev. Lett.72, 2757.
Aeppli, G., et al., 1988, Phys. Rev. Lett. 61, 203.Aeppli, G., and Z. Fisk, 1992, Comments Condens. Matter
Phys. 16, 155.Aeppli, G., S. M. Hayden, H. A. Mook, Z. Fisk, S-W. Cheong,
D. Rytz, J. P. Remeika, G. P. Espinosa, and A. S. Cooper,1989, Phys. Rev. Lett. 62, 2052.
Affleck, I. A., and J. B. Marston, 1988, Phys. Rev. B 37, 3774.Agterberg, D. F., T. M. Rice, and M. Sigrist, 1997, Phys. Rev.
Lett. 78, 3374.Aiura, Y., H. Bando, I. Hase, Y. Nishihara, Y. Haruyama, and
H. Suzuki, 1996, J. Electron Spectrosc. Relat. Phenom. 78,199.
Akimitsu et al., 1998, unpublished.Alexandrov, A. S., A. M. Bratkovsky, and N. F. Mott, 1994,
Phys. Rev. Lett. 72, 1734.

1248 Imada, Fujimori, and Tokura: Metal-insulator transitions
Alexandrov, A. S., and N. F. Mott, 1994, Rep. Prog. Phys. 57,1197.
Allen, P. B., H. Berger, O. Chauvet, L. Forro, T. Jarlborg, A.Junod, B. Revaz, and G. Santi, 1996, Phys. Rev. B 53, 4393.
Allen, J. W., S-J. Oh, L. E. Cox, W. P. Ellis, M. S. Wire, Z.Fisk, J. L. Smith, B. B. Pate, I. Lindau, and A. J. Arko, 1985,Phys. Rev. Lett. 54, 2635.
Allen, J. W., C. G. Olson, M. B. Maple, J.-S. Kang, L. Z. Liu,J.-H. Park, R. O. Anderson, W. P. Ellis, J. T. Markert, Y.Dalichaouch, and R. Liu, 1990, Phys. Rev. Lett. 64, 595.
Allen, P. B., W. E. Pickett, and H. Krakauer, 1987, Phys. Rev.B 36, 3926.
Alvarado, S. F., M. Erbudak, and P. Munz, 1976, Phys. Rev. B14, 2740.
An, G., and J. M. J. van Leeuwen, 1991, Phys. Rev. B 44, 9410.Anderson, P. W., 1952, Phys. Rev. 86, 694.Anderson, P. W., 1956, Phys. Rev. 102, 1008.Anderson, P. W., 1959, Phys. Rev. 115, 2.Anderson, P. W., 1963a, in Magnetism, edited by G. T. Rado
and H. Suhl (Academic, New York), Vol. I, p. 25.Anderson, P. W., 1963b, in Solid State Physics, edited by H.
Ehrenreich, F. Seitz, and D. Turnbull (Academic, NewYork), Vol. 14, p. 99.
Anderson, P. W., 1984, Basic Notions of Condensed MatterPhysics (Benjamin/Cummings, London).
Anderson, P. W., 1987, Science 235, 1196.Anderson, P. W., 1990, Phys. Rev. Lett. 64, 1839.Anderson, P. W., 1991a, Phys. Rev. Lett. 67, 2092.Anderson, P. W., 1991b, Phys. Rev. Lett. 67, 3844.Anderson, P. W., 1992, Science 256, 1526.Anderson, P. W., 1997, The Theory of Superconductivity in the
High-Tc Cuprate Superconductors (Princeton University,Princeton, New Jersey).
Anderson, P. W., and H. Hasegawa, 1955, Phys. Rev. 100, 675.Anderson, R. O., R. Claessen, J. W. Allen, C. G. Olson, C.
Janowitz, L. Z. Liu, J.-H. Park, M. B. Maple, Y. Dalichaouch,M. C. de Andrade, R. F. Jardim, E. A. Early, S.-J. Oh, and W.P. Ellis, 1993, Phys. Rev. Lett. 70, 3163.
Ando, Y., G. S. Boebinger, A. Passner, T. Kimura, and K.Kishio, 1995, Phys. Rev. Lett. 75, 4662.
Anisimov, V. I., I. S. Elfimov, N. Hamada, and K. Terakura,1996, Phys. Rev. 54, 4387.
Anisimov, V. I., I. S. Elfimov, M. A. Korotin, and K. Terakura,1997, Phys. Rev. B 55, 15494.
Anisimov, V. I., S. Yu. Ezhov, I. S. Elifimov, I. V. Solovyev,and T. M. Rice, 1996, Phys. Rev. Lett. 76, 1735.
Anisimov, V. I., M. A. Korotin, J. Zaanen, and O. K. Ander-sen, 1992, Phys. Rev. Lett. 68, 345.
Anisimov, V. I., A. I. Poteryaev, M. A. Korotin, A. O.Anokhin, and G. Kotliar, 1997, J. Phys.: Condens. Matter 9,7359.
Anisimov, V. I., J. Zaanen, and O. Andersen, 1991, Phys. Rev.B 44, 943.
Annett, J. F., N. Goldenfeld, and A. J. Leggett, 1996, J. LowTemp. Phys. 105, 473.
Anzai, S., T. Futami, and T. Sawa, 1981, J. Appl. Phys. 52,6270.
Anzai, S., M. Matoba, M. Hatori, and H. Sakamoto, 1986, J.Phys. Soc. Jpn. 55, 2531.
Anzai, S., and K. Ozawa, 1968, J. Phys. Soc. Jpn. 24, 271.Arima, T., and Y. Tokura, 1995, J. Phys. Soc. Jpn. 64, 2488.Arima, T., Y. Tokura, and J. B. Torrance, 1993, Phys. Rev. B
48, 17006.
Rev. Mod. Phys., Vol. 70, No. 4, October 1998
Arima, T., Y. Tokura, and S. Uchida, 1993, Phys. Rev. B 48,6597.
Arovas, D. P., and A. Auerbach, 1988, Phys. Rev. B 38, 316.Aryasetiawan, F., 1992, Phys. Rev. B 46, 13051.Aryasetiawan, F. A., and O. G. Gunnarsson, 1997,
cond-mat/9712013.Asai, K., P. Gehring, H. Chou, and G. Shirane, 1989, Phys.
Rev. B 40, 10982.Asai, K., O. Yokokura, N. Nishimori, H. Chou, J. M. Tran-
quada, G. Shirane, S. Higuchi, Y. Okajima, and K. Kohn,1994, Phys. Rev. B 50, 3025.
Asai, K., A. Yoneda, O. Yokokura, J. M. Tranquada, G.Shirane, and K. Kohn, 1997, unpublished.
Asamitsu, A., Y. Moritomo, R. Kumai, Y. Tomioka, and Y.Tokura, 1996, Phys. Rev. B 54, 1716.
Asamitsu, A., Y. Moritomo, Y. Tomioka, T. Arima, and Y.Tokura, 1995, Nature (London) 373, 407.
Asamitsu, A., and Y. Tokura, 1998, Phys. Rev. B 58, 47.Asamitsu, A., Y. Tomioka, H. Kuwahara, and Y. Tokura,
1997, Nature (London) 388, 50.Ashcroft, N. W., and N. D. Mermin, 1976, Solid State Physics
(Saunders, Philadelphia).Ashkenazi, J., and M. Weger, 1973, Adv. Phys. 22, 207.Assaad, F. F., and M. Imada, 1995, Phys. Rev. Lett. 74, 3868.Assaad, F. F., and M. Imada, 1996a, J. Phys. Soc. Jpn. 65, 189.Assaad, F. F., and M. Imada, 1996b, Phys. Rev. Lett. 76, 3176.Assaad, F. F., and M. Imada, 1998, Phys. Rev. B 58, 1845.Assaad, F. F., M. Imada, and D. Scalapino, 1996, Phys. Rev.
Lett. 77, 4592.Assaad, F. F., M. Imada, and D. Scalapino, 1997, Phys. Rev. B
56, 15001.Azrak, A. El, et al., 1994, Phys. Rev. B 49, 9846.Azuma, M., Z. Hiroi, M. Takano, K. Ishida, and Y. Kitaoka,
1994, Phys. Rev. Lett. 73, 3463.Bagno, P. G., O. Jepsen, and O. Gunnarsson, 1989, Phys. Rev.
B 40, 1997.Bao, W., C. Broholm, S. A. Carter, T. F. Rosenbaum, G. Aep-
pli, S. F. Trevino, P. Metcalf, J. M. Honig, and J. Spalek, 1993,Phys. Rev. Lett. 71, 766.
Bao, W., C. Broholm, J. M. Honig, P. Metcalf, and S. F. Tre-vino, 1996, Phys. Rev. B 54, R3726.
Bao, W., C. H. Chen, S-W. Cheong, and S. A. Carter, 1996,Solid State Commun. 98, 55.
Bao, W., et al., 1997, Phys. Rev. Lett. 78, 507.Barker, A. S., Jr., B. I. Halperin, and T. M. Rice, 1968, Phys.
Rev. Lett. 20, 384.Barker, A. S., Jr. and J. P. Remeika, 1974, Phys. Rev. B 10,
987.Barman, S. R., A. Chainani, and D. D. Sarma, 1994, Phys. Rev.
B 49, 8475.Barman, S. R., N. Shanti, and D. D. Sarma, 1996, Europhys.
Lett. 36, 307.Barnes, S. E., 1976, J. Phys. F 6, 1375.Barnes, S. E., 1977, J. Phys. F 7, 2637.Barthelemy, E., C. Chavant, G. Collin, and O. Gorochov, 1976,
J. Phys. (Paris) 37, C4-17.Barthelemy, E., O. Gorochov, and H. McKinzie, 1973, Mater.
Res. Bull. 8, 1401.Baskaran, G., Z. Zou, and P. W. Anderson, 1987, Solid State
Commun. 63, 973.Basov, D. N., et al., 1996, Phys. Rev. Lett. 77, 4090.Battle, P. D., T. C. Gibb, and P. Lightfoot, 1990, J. Solid State
Chem. 84, 271.

1249Imada, Fujimori, and Tokura: Metal-insulator transitions
Battle, P. D., T. C. Gibb, and S. Nixon, 1988, J. Solid StateChem. 77, 124.
Beard, B. B., and U.-J. Wiese, 1996, Preprint No.cond-mat/9602164.
Becke, A. D., 1988, Phys. Rev. A 38, 3098.Bednorz, J. G., and K. A. Muller, 1986, Z. Phys. B 64, 189.Belitz, D., and T. R. Kirkpatrick, 1994, Rev. Mod. Phys. 66,
261.Benoit, R., 1955, J. Chem. Phys. 52, 119.Bethe, H., 1928, Ann. Phys. (Leipzig) 87, 55.Bickers, N. E., and D. J. Scalapino, 1989, Ann. Phys. (N.Y.)
193, 206.Bickers, N. E., and S. R. White, 1991, Phys. Rev. B 43, 8044.Birgeneau, R. J., A. Aharony, N. R. Belk, F. C. Chou, Y. En-
doh, M. Greven, S. Hosoya, M. A. Kastner, C. H. Lee, Y. S.Lee, G. Shirane, S. Wakimoto, B. O. Wells, and K. Yamada,1995, J. Phys. Chem. Solids 56, 1913.
Birgeneau, R. J., D. R. Gabbe, H. P. Jenssen, M. A. Kastner,P. J. Picone, T. R. Thurston, G. Shirane, Y. Endoh, M. Sato,K. Yamada, Y. Hidaka, M. Oda, Y. Enomoto, M. Suzuki, andT. Murakami, 1988, Phys. Rev. B 38, 6614.
Bishop, D. J., E. G. Spencer, and R. C. Dynes, 1985, Solid-State Electron. 28, 73.
Blankenbecler, R., D. J. Scalapino, and R. L. Sugar, 1981,Phys. Rev. D 24, 2278.
Bloch, F., 1929, Z. Phys. 57, 545.Bocquet, A. E., A. Fujimori, T. Mizokawa, T. Saitoh, H.
Namatame, and A. Fujimori, 1992a, Phys. Rev. B 46, 3771.Bocquet, A. E., A. Fujimori, T. Mizokawa, T. Saitoh, H.
Namatame, S. Suga, N. Kimizuka, Y. Takeda, and M. Ta-kano, 1992b, Phys. Rev. B 45, 1561.
Bocquet, A. E., T. Mizokawa, K. Morikawa, A. Fujimori, S. R.Barman, K. B. Maiti, D. D. Sarma, Y. Tokura, and M.Onoda, 1996, Phys. Rev. B 53, 1161.
Bocquet, A. E., T. Saitoh, T. Mizokawa, and A. Fujimori,1992c, Solid State Commun. 83, 11.
Bonn, D. A., J. D. Garrett, and T. Timusk, 1988, Phys. Rev.Lett. 61, 1305.
Bonner, J. C., and M. E. Fisher, 1964, Phys. Rev. 135, A640.Bouchard, R. J., and Gillson, 1972, Mater. Res. Bull. 7, 873.Bouchard, R. J., et al., 1973, Mater. Res. Bull. 8, 489.Bozovic, I., J. H. Kim, J. S. Harris, Jr., C. B. Eom, J. M. Phil-
lips, and J. T. Cheung, 1994, Phys. Rev. Lett. 73, 1436.Brandow, B. H., 1977, Adv. Phys. 26, 651.Brandt, U., and C. Mielsch, 1989, Z. Phys. 75, 365 (Part I);
1990, 79, 295 (Part II).Brinkmann, M., T. Rex, H. Bach, and K. Westerholt, 1995,
Phys. Rev. Lett. 74, 4927.Brinkmann, M., T. Rex, M. Stief, H. Bach, and K. Westerholt,
1996, Physica C 269, 76.Brinkman, W. F., and T. M. Rice, 1970, Phys. Rev. B 2, 4302.Bruckner, W., H. Oppermann, W. Reichelt, J. I. Terukow, F.
A. Tschudnowski, and E. Wolf, 1983, VanadiumoxideDarstellung, Eigenschaften, Anwendung (Akademie, Berlin).
Brusetti, R., J. M. D. Coey, G. Czjzek, J. Fink, F. Gomp, andH. Schmidt, 1980, J. Phys. F 10, 33.
Bulut, N., D. J. Scalapino, and S. R. White, 1994a, Phys. Rev.Lett. 72, 705.
Bulut, N., D. J. Scalapino, and S. R. White, 1994b, Phys. Rev.B 50, 7215.
Buttrey, D. J., J. D. Sullivan, and A. L. Reingold, 1990, J. SolidState Chem. 88, 291.
Byers, N., and C. N. Yang, 1961, Phys. Rev. Lett. 7, 46.
Rev. Mod. Phys., Vol. 70, No. 4, October 1998
Caffarel, M., and W. Krauth, 1994, Phys. Rev. Lett. 72, 1545.Callagan, A., C. W. Moeller, and R. Ward, 1966, Inorg. Chem.
5 1573.Campuzano, J. C., G. Jennings, M. Faiz, L. Beaulaigue, B. W.
Veal, J. Z. Liu, A. P. Paulikas, K. Vandervoort, H. Claus, R.S. List, A. J. Arko, and R. J. Bartlett, 1990, Phys. Rev. Lett.64, 2308.
Canfield, P. C., J. D. Thompson, S-W. Cheong, and L. W.Rupp, 1993, Phys. Rev. B 47, 12357.
Cao, G., S. McCall, M. Shepard, J. E. Crow, and R. P. Guertin,1997, Phys. Rev. B 56, R5740.
Capellmann, H., 1974, J. Phys. F 4, 1466.Capellmann, H., 1979, Z. Phys. B 34, 29.Carter, S. A., B. Batlogg, R. J. Cava, J. J. Krajewski, W. F.
Peck Jr., and T. M. Rice, 1996, Phys. Rev. Lett. 77, 1378.Carter, S. A., T. F. Rosenbaum, J. M. Honig, and J. Spalek,
1991, Phys. Rev. Lett. 67, 3440.Carter, S. A., T. F. Rosenbaum, M. Lu, H. M. Jaeger, P. Met-
calf, J. M. Honig, and J. Spalek, 1994, Phys. Rev. B 49, 7898.Carter, S. A., T. F. Rosenbaum, P. Metcalf, J. M. Honig, and J.
Spalek, 1993, Phys. Rev. B 48, 16841.Castellani, C., C. Di Castro, and W. Metzner, 1992, Phys. Rev.
Lett. 69, 1703.Castellani, C., C. Di Castro, and W. Metzner, 1998, Adv. Phys.
47, 317.Castellani, C., C. R. Natoli, and J. Ranninnger, 1978a, Phys.
Rev. B 18, 4945.Castellani, C., C. R. Natoli, and J. Ranninnger, 1978b, Phys.
Rev. B 18, 4967.Castellani, C., C. R. Natoli, and J. Ranninnger, 1978c, Phys.
Rev. B 18, 5001.Cava, R. J., et al., 1990, Nature (London) 345, 602.Cava, R. J., et al., 1991, Phys. Rev. B 43, 1229.Ceperley, D. M., and B. J. Alder, 1980, Phys. Rev. Lett. 45,
566.Chainani, A., M. Mathew, and D. D. Sarma, 1992, Phys. Rev.
B 46, 9976.Chainani, A., M. Mathew, and D. D. Sarma, 1993, Phys. Rev.
B 47, 15397.Chainani, A., T. Yokoya, T. Morimoto, T. Takahashi, and S.
Todo, 1995, Phys. Rev. B 51, 17976.Chainani, A., T. Yokoya, T. Morimoto, T. Takahashi, S.
Yoshii, and M. Kasaya, 1994, Phys. Rev. B 50, 8915.Chakravarty, S., B. I. Halperin, and D. R. Nelson, 1989, Phys.
Rev. B 39, 2344.Chandrasekhar, Q. Won Choi, J. Moyo, and J. M. Honig, 1970,
Mater. Res. Bull. 5, 999.Chao, K. A., and M. C. Gutzwiller, 1971, J. Appl. Phys. 42,
1420.Chao, K. A., J. Spalek, and A. M. Oles, 1977, J. Phys. C 10,
L271.Chayes, J., L. Chayes, D. S. Fisher, and T. Spencer, 1986, Phys.
Rev. Lett. 57, 2999.Chen, C. H., S-W. Cheong, and A. S. Cooper, 1993, Phys. Rev.
Lett. 71, 2461.Chen, C. H., S-W. Cheong, and H. Y. Hwang, 1997, J. Appl.
Phys. 81, 4326.Chen, C. T., F. Sette, Y. Ma, M. S. Hybertsen, E. B. Stechel,
W. M. C. Foulkes, M. Schluter, S.-W. Cheong, A. S. Cooper,L. W. Rupp Jr., B. Batlogg, Y. L. Soo, Z. H. Ming, A. Krol,and Y. H. Kao, 1991, Phys. Rev. Lett. 66, 104.
Chen, C. T., L. H. Tjeng, J. Kwo, H. L. Kao, P. Rudolf, F.Sette, and R. M. Fleming, 1992, Phys. Rev. Lett. 68, 2543.

1250 Imada, Fujimori, and Tokura: Metal-insulator transitions
Cheong, S-W., et al., 1991, Phys. Rev. Lett. 67, 1791.Cheong, S-W., H. Y. Hwang, C. H. Chen, B. Batlogg, L. W.
Rupp, and S. A. Carter, 1994, Phys. Rev. B 49, 7088.Chien, T. R., Z. Z. Wang, and N. P. Ong, 1991, Phys. Rev.
Lett. 67, 2088.Cho, J. H., F. C. Chou, and D. C. Johnston, 1993, Phys. Rev.
Lett. 70, 222.Chou, F. C., N. R. Belk, M. A. Kastner, R. J. Birgeneau, and
A. Aharony, 1995, Phys. Rev. Lett. 75, 2204.Chou, F. C., F. Borsa, J. H. Cho, D. C. Johnston, A. Lascial-
fari, D. R. Torgeson, and J. Ziolo, 1993, Phys. Rev. Lett. 71,2323.
Chubukov, A. V., and J. Schmalian, 1998, Phys. Rev. B 57,R11085.
Claessen, R., R. O. Anderson, J. W. Allen, C. G. Olson, C.Janowitz, W. P. Ellis, S. Harm, M. Kalning, R. Manzke, andM. Skibowski, 1992, Phys. Rev. Lett. 69, 808.
Clarke, D. G., S. P. Strong, and P. W. Anderson, 1994, Phys.Rev. Lett. 72, 3218.
Coey, J. M. D., R. Brusetti, A. Kallel, J. Schweizer, and H.Fuss, 1974, Phys. Rev. Lett. 32, 1257.
Coey, J. M. D., and H. Roux-Buisson, 1979, Mater. Res. Bull.14, 711.
Coleman, P., 1984, Phys. Rev. B 29, 3035.Collins, R. T., et al., 1989, Phys. Rev. B 39, 6571.Coluzza, C., H. Berger, P. Almeras, F. Gozzo, G. Margari-
tondo, G. Indlekofer, L. Forro, and Y. Hwu, 1993, Phys. Rev.B 47, 6625.
Continentino, M. A., 1992, Phys. Rev. B 45, 11312.Continentino, M. A., 1994, Phys. Rep. 239, 179, and references
therein.Cooper, S. L., G. A. Thomas, J. Orenstein, D. H. Rapkine, A.
J. Millis, S-W. Cheong, A. S. Cooper, and Z. Fisk, 1990a,Phys. Rev. B 41, 11605.
Cooper, S. L., et al., 1990b, Phys. Rev. B 42, 10785.Cooper, S. L., et al., 1992, Phys. Rev. B 45, 2549.Cox, P. A., R. G. Edgell, J. B. Goodenough, A. Kamnett, and
C. C. Naishi, 1983, J. Phys. C 16, 6221.Crandles, D. A., T. Timusk, J. D. Garrett, and J. E. Greedan,
1994, Phys. Rev. B 49, 16207.Cullen, J. R., and E. R. Callen, 1973, Phys. Rev. B 7, 397.Czjzek, G., J. Fink, H. Schmidt, G. Krill, M. F. Lapierre, P.
Paissod, F. Gautier, and C. Robert, 1976, J. Magn. Magn.Mater. 3, 58.
Czyzyk, M. T., and G. A. Sawatzky, 1997, unpublished.Dagotto, E., 1994, Rev. Mod. Phys. 66, 763.Dagotto, E., A. Moreo, F. Ortolani, D. Poilblanc, and J. Riera,
1992, Phys. Rev. B 45, 10741.Dagotto, E., A. Moreo, F. Ortolani, J. Riera, and D. J. Scala-
pino, 1991, Phys. Rev. Lett. 67, 1918.Dagotto, E., A. Nazarenko, and M. Boninsegni, 1994, Phys.
Rev. Lett. 73, 728.Dagotto, E., and T. M. Rice, 1996, Science 271, 618.Dagotto, E., J. Riera, and D. J. Scalapino, 1992, Phys. Rev. B
45, 5744.Dai, P., H. A. Mook, and F. Dogan, 1998, Phys. Rev. Lett. 80,
1738.Dai, P., J. Zhang, H. A. Mook, S.-H. Liou, P. A. Dowben, and
E. W. Plummer, 1996, Phys. Rev. B 54, R3694.Dai, P., Y. Zhang, and M. P. Sarachik, 1992, Phys. Rev. B 45,
3984.Dardel, B., D. Malterre, M. Grioni, P. Weibel, Y. Baer, D.
Schlenker, and Y. Petroff, 1992a, Europhys. Lett. 19, 525.
Rev. Mod. Phys., Vol. 70, No. 4, October 1998
Dardel, B., D. Malterre, M. Grioni, P. Weibel, Y. Baer, J. Voit,and D. Jerome, 1992b, Europhys. Lett. 24, 687.
Dare, A.-M., Y. M. Vilk, and A.-M. S. Tremblay, 1996, Phys.Rev. B 53, 14236.
Davis, L. C., 1982, Phys. Rev. B 25, 2912.de Boer, J. H., and E. J. W. Verway, 1937, Proc. Phys. Soc.
London, Sect. A 49, 59.de Gennes, P. G., 1960, Phys. Rev. 118, 141.Degiorgi, L., M. B. Hunt, H. R. Ott, M. Dressel, B. J. Feentrra,
G. Gruner, Z. Fisk, and P. Canfield, 1994, Europhys. Lett. 28,341.
Deisz, J. J., D. W. Hess, and J. W. Serene, 1996, Phys. Rev.Lett. 76, 1312.
Demler, E., and S.-C. Zhang, 1995, Phys. Rev. Lett. 75, 4126.Dessau, D. S., C.-H. Park, T. Saitoh, Z.-X. Shen, P. Villela, N.
Hamada, Y. Moritomo, and Y. Tokura, 1998, Phys. Rev. Lett.81, 192.
Dessau, D. S., Z.-X. Shen, D. M. King, D. S. Marshall, L. W.Lombardo, P. H. Dickinson, J. DiCarlo, C.-H. Park, A. G.Loeser, A. Kapitulnik, and W. E. Spicer, 1993, Phys. Rev.Lett. 71, 2781.
Ding, H., A. F. Bellman, J. C. Campuzano, M. Randeria, M. R.Norman, T. Yokoya, T. Takahashi, H. Katayama-Yoshida, T.Mochiku, K. Kadowaki, G. Jennings, and G. P. Brivio, 1996a,Phys. Rev. Lett. 76, 1533.
Ding, H., M. R. Norman, T. Yokoya, T. Takeuchi, M. Rand-eria, J. C. Campuzano, T. Takahashi, T. Mochiku, and K.Kadowaki, 1997, Phys. Rev. Lett. 78, 2628.
Ding, H., T. Yokoya, J. C. Campuzano, T. Takahashi, M. Ran-deria, M. R. Norman, T. Mochiku, K. Kadowaki, and J. Gi-apintzakis, 1996b, Nature (London) 382, 51.
DiTusa, J. F., K. Friemelt, E. Bucher, G. Aeppli, and A. P.Ramirez, 1997, Phys. Rev. Lett. 78, 2831.
Dobrosavljevic, V., E. Abrahams, E. Miranda, and S. Chakra-varty, 1997, Phys. Rev. Lett. 79, 455.
Dobrosavljevic, V., and G. Kotliar, 1997, Phys. Rev. Lett. 78,3943.
Dopf, G., A. Muramatsu, and W. Hanke, 1992, Europhys. Lett.17, 559.
Dopf, G., J. Wagner, P. Dieterich, A. Muramatsu, and W.Hanke, 1992, Phys. Rev. Lett. 68, 2082.
Dougier, P., and A. Casalot, 1970, J. Solid State Chem. 2, 396.Dougier, P., J. C. C. Fan, and J. B. Goodenough, 1975, J. Solid
State Chem. 14, 247.Dougier, P., and P. Hagenmuller, 1975, J. Solid State Chem.
15, 158.Dumas, J., and C. Schlenker, 1976, J. Phys. (Paris), Colloq. 37,
C4-41.Dumas, J., and C. Schlenker, 1979, unpublished.Dumas, J., C. Schlenker, J. L. Tholence, and R. Tournier, 1979,
Phys. Rev. B 20, 3913.Eccleston, R., M. Uehara, J. Akimitsu, H. Eisaki, N. Mo-
toyama, and S. Uchida, 1998, Phys. Rev. Lett. 81, 1702.Edgell, R. G., M. R. Harrison, M. D. Hill, L. Porte, and G.
Wall, 1984, J. Phys. C 17, 2889.Edwards, P. P., and C. N. R. Rao, 1985, The Metallic and Non-
Metallic States of Matter (Taylor & Francis).Eggert, S., I. Affleck, and M. Takahashi, 1994, Phys. Rev. Lett.
73, 332.Eisaki, H., 1991, Ph.D. thesis (University of Tokyo).Emery, V. J., 1979, in Highly Conducting One-Dimensional
Solids, edited by J. T. Devreese et al. (Plenum, New York), p.327.

1251Imada, Fujimori, and Tokura: Metal-insulator transitions
Emery, V. J., 1987, Phys. Rev. Lett. 58, 2794.Emery, V. J., and S. A. Kivelson, 1995, Nature (London) 374,
434.Emery, V. J., and S. A. Kivelson, 1996, Physica C 263, 44, and
references therein.Emery, V. J., S. A. Kivelson, and H. Q. Lin, 1990, Phys. Rev.
Lett. 64, 475.Eskes, H., and A. Oles, 1994, Phys. Rev. Lett. 73, 1279.Eskes, H., A. Oles, M. B. Meinders, and W. Stephan, 1994,
Phys. Rev. B 50, 17980.Eskes, H., L. H. Tjeng, and G. A. Sawatzky, 1990, Phys. Rev. B
41, 288.Evertz, H. G., G. Lana, and M. Marcu, 1993, Phys. Rev. Lett.
70, 875.Evertz, H. G., and M. Marcu, 1993, Nucl. Phys. B (Proc.
Suppl.) 30, 277.Fabrizio, M., A. Parola, and E. Tosatti, 1992, Phys. Rev. B 46,
3159.Finkelstein, A. M., 1983, Zh. Eksp. Teor. Fiz. 84, 168 [Sov.
Phys. JETP 57, 97 (1983)].Finkelstein, A. M., 1984, Zh. Eksp. Teor. Fiz. 86, 367 [Sov.
Phys. JETP 86, 367 (1984)].Fisher, M. P. A., P. B. Weichman, G. Grinstein, and D. S.
Fisher, 1989, Phys. Rev. B 40, 546.Folkerts, W., G. A. Sawatzky, C. Haas, R. A. de Groot, and F.
U. Hillebrecht, 1987, J. Phys. C 20, 4135.Fong, H. F., B. Keimer, P. W. Anderson, D. Reznik, F. Dogan,
and I. A. Aksay, 1995, Phys. Rev. Lett. 75, 316.Fong, H. F., B. Keimer, D. L. Milius, and I. A. Aksay, 1997,
Phys. Rev. Lett. 78, 713.Fowler, R. H., 1933a, Proc. R. Soc. London, Ser. A 140, 505.Fowler, R. H., 1933b, Proc. R. Soc. London, Ser. A 141, 56.Frahm, H., and V. E. Korepin, 1990, Phys. Rev. B 42, 10553.Fresard, R., and G. Kotliar, 1997, Phys. Rev. B 56, 12909.Fu, C., M. P. C. M. Krijn, and S. Doniach, 1994, Phys. Rev. B
49, 2219.Fujimori, A., 1992, J. Phys. Chem. Solids 53, 1595.Fujimori, A., A. E. Bocquet, K. Morikawa, K. Kobayashi, T.
Saitoh, Y. Tokura, I. Hase, and M. Onoda, 1996, J. Phys.Chem. Solids 57, 1379.
Fujimori, A., A. E. Bocquet, T. Saitoh, and T. Mizokawa, 1993,J. Electron Spectrosc. Relat. Phenom. 62, 141.
Fujimori, A., I. Hase, H. Namatame, Y. Fujishima, Y. Tokura,H. Eisaki, S. Uchida, K. Takegahara, and F. M. F. de Groot,1992a, Phys. Rev. Lett. 69, 1796.
Fujimori, A., I. Hase, M. Nakamura, H. Namatame, Y.Fujishima, Y. Tokura, M. Abbate, F. M. F. de Groot, M. T.Czyzyk, J. C. Fuggle, O. Strebel, F. Lopez, M. Domke, and G.Kaindl, 1992b, Phys. Rev. B 46, 9841.
Fujimori, A., A. Ino, T. Mizokawa, C. Kim, Z.-X. Shen, T.Sasagawa, T. Kimura, K. Kishio, M. Takaba, K. Tamasaku,H. Eisaki, and S. Uchida, 1998, J. Phys. Chem. Solids, inpress.
Fujimori, A., K. Kawakami, and N. Tsuda, 1988, Phys. Rev. B38, 7889.
Fujimori, A., N. Kimizuka, T. Akahane, T. Chiba, S. Kimura,F. Minami, K. Siratori, M. Taniguchi, S. Ogawa, and S. Suga,1990, Phys. Rev. B 42, 7580.
Fujimori, A., N. Kimizuka, M. Taniguchi, and S. Suga, 1987,Phys. Rev. B 36, 6691.
Fujimori, A., K. Mamiya, T. Mizokawa, T. Miyadai, T. Sekigu-chi, H. Takahashi, N. Mori, and S. Suga, 1996, Phys. Rev. B54, 16329.
Rev. Mod. Phys., Vol. 70, No. 4, October 1998
Fujimori, A., and F. Minami, 1984, Phys. Rev. B 30, 957.Fujimori, A., F. Minami, and S. Sugano, 1984, Phys. Rev. B 29,
5225.Fujimori, A., M. Saeki, N. Kimizuka, M. Taniguchi, and S.
Suga, 1986, Phys. Rev. B 34, 7318.Fujimori, A., S. Takekawa, E. Takayama-Muromachi, Y.
Uchida, A. Ono, T. Takahashi, Y. Okabe, and H. Katayama-Yoshidda, 1989, Phys. Rev. B 39, 2255.
Fujimori, A., K. Terakura, M. Taniguchi, S. Ogawa, S. Suga,M. Matoba, and S. Anzai, 1988, Phys. Rev. B 37, 3109.
Fujioka, K., J. Okamoto, T. Mizokawa, A. Fujimori, I. Hase,M. Abbate, H. J. Lin, C. T. Chen, Y. Takeda, and M. Takano,1997, Phys. Rev. B 56, 6380.
Fukuda, K., S. Shamoto, M. Sato, and K. Oda, 1988, SolidState Commun. 65, 1323.
Fukunaga, F., and N. Tsuda, 1994, J. Phys. Soc. Jpn. 63, 3798.Fukushima, A., F. Iga, I. H. Inoue, K. Murata, and Y. Nishi-
hara, 1994, J. Phys. Soc. Jpn. 63, 409.Fukuzumi, Y., K. Mizuhashi, K. Takenaka, and S. Uchida,
1996, Phys. Rev. Lett. 76, 684.Furukawa, N., 1995a, J. Phys. Soc. Jpn. 64, 2734.Furukawa, N., 1995b, J. Phys. Soc. Jpn. 64, 2754.Furukawa, N., 1995c, J. Phys. Soc. Jpn. 64, 3164.Furukawa, N., 1996, J. Phys. Soc. Jpn. 65, 1174.Furukawa, N., and M. Imada, 1991a, J. Phys. Soc. Jpn. 60, 810.Furukawa, N., and M. Imada, 1991b, J. Phys. Soc. Jpn. 60,
3604.Furukawa, N., and M. Imada, 1991c, J. Phys. Soc. Jpn. 60, 3669.Furukawa, N., and M. Imada, 1992, J. Phys. Soc. Jpn. 61, 3331.Furukawa, N., and M. Imada, 1993, J. Phys. Soc. Jpn. 62, 2557.Futami, T., and S. Anzai, 1984, J. Appl. Phys. 56, 440.Fye, R. M., M. J. Martins, D. J. Scalapino, J. Wagner, and W.
Hanke, 1991, Phys. Rev. B 44, 6909.Gansepohl, S. C., M. Lee, K. Char, R. A. Rao, and C. B. Eom,
1995, Phys. Rev. B 52, 3495.Garcıa-Munoz, J. L., J. Rodriguez-Carvajal, and P. Lacorre,
1992, Europhys. Lett. 20, 241.Garcıa-Munoz, J. L., J. Rodrıguez-Carvajal, and P. Lacorre,
1994, Phys. Rev. B 50, 978.Georges, A., and G. Kotliar, 1992, Phys. Rev. B 45, 6479.Georges, A., G. Kotliar, W. Krauth, and M. J. Rozenberg,
1996, Rev. Mod. Phys. 68, 13.Georges, A., and W. Krauth, 1992, Phys. Rev. Lett. 69, 1240.Georges, A., and W. Krauth, 1993, Phys. Rev. B 48, 7167.Ghedira, M., M. Anne, J. Chenavas, and F. Sayetat, 1986, J.
Phys. C 19, 6489.Giamarchi, T., and C. Lhuillier, 1990, Phys. Rev. B 42, 10641.Gibb, T. C., R. Greatrex, N. N. Greenwood, D. C. Puxley, and
K. G. Snowdon, 1974, J. Solid State Chem. 11, 17.Gofron, K., J. C. Campuzano, A. A. Abrikosov, M. Lindroos,
A. Bansil, H. Ding, D. Koelling, and B. Dabrowski, 1994,Phys. Rev. Lett. 73, 3302.
Goodenough, J. B., 1955, Phys. Rev. 100, 564.Goodenough, J. B., 1971, J. Solid State Chem. 3, 490.Goral, J. P., J. E. Greedan, and D. A. MacLean, 1982, J. Solid
State Chem. 43, 244.Goto, A., H. Yasuoka, and Y. Ueda, 1996, J. Phys. Soc. Jpn.
65, 3043.Graf, T., D. Mandrus, J. M. Lawrence, J. D. Thompson, P. C.
Canfield, S.-W. Cheong, and L. W. Rupp, Jr., 1995, Phys.Rev. B 51, 2037.
Granados, X., J. Fontcuberta, X. Obradors, and J. B. Torrance,1992, Phys. Rev. B 46, 15683.

1252 Imada, Fujimori, and Tokura: Metal-insulator transitions
Grant, J. B., and A. K. McMahan, 1991, Phys. Rev. Lett. 66,488.
Greeff, C. W., H. R. Glyde, and B. E. Clements, 1992, Phys.Rev. B 45, 7951.
Greywall, D. S., 1990, Phys. Rev. B 41, 1842.Grilli, M., and G. Kotliar, 1990, Phys. Rev. Lett. 64, 1170.Gunnarsson, O., O. K. Andersen, O. Jepsen, and J. Zaanen,
1989, Phys. Rev. B 39, 1708.Gutzwiller, M. C., 1965, Phys. Rev. A 137, A1726.Haas, S., A. Moreo, and E. D. Dagotto, 1995, Phys. Rev. Lett.
74, 4281.Haldane, F. D. M., 1980, Phys. Rev. Lett. 45, 1358.Haldane, F. D. M., 1981, Phys. Rev. Lett. 47, 1840.Haldane, F. D. M., 1983a, Phys. Lett. A 93, 464.Haldane, F. D. M., 1983b, Phys. Rev. Lett. 50, 1153.Haldane, F. D. M., 1994, Proceedings of the International
School of Physics Enrico Fermi Course CXXI, edited by R.A. Broglia and J. R. Schrieffer (North Holland, Amsterdam).
Hamada, N., 1993, J. Phys. Chem. Solids 54, 1157.Hamada, N., H. Sawada, and K. Terakura, 1995, in Spectros-
copy of Mott Insulators and Correlated Metals, edited by A.Fujimori and Y. Tokura (Springer-Verlag, Berlin), p. 95.
Harashina, H., K. Kodama, S. Shamoto, M. Sato, K. Kakurai,and M. Nishi, 1995, J. Phys. Soc. Jpn. 64, 1462.
Harrison, W. A., 1989, Electronic Structure and the Propertiesof Solids (Dover, New York).
Hase, M., I. Terasaki, and K. Uchinokura, 1993, Phys. Rev.Lett. 70, 3651.
Hasegawa, H., 1997a, J. Phys. Soc. Jpn. 66, 1391.Hasegawa, H., 1997b, Phys. Rev. B 56, 1196.Hasenfratz, P., and F. Niedermayer, 1991, Phys. Lett. B 268,
231.Hasenfratz, P., and F. Niedermayer, 1993, Z. Phys. B 92, 91.Hatano, N., and M. Suzuki, 1993, in Quantum Monte Carlo
Methods in Condensed Matter Physics, edited by M. Suzuki(World Scientific, Singapore), p. 13.
Hayden, S. M., G. Aeppli, H. Mook, D. Rytz, M. F. Hundley,and Z. Fisk, 1991a, Phys. Rev. Lett. 66, 821.
Hayden, S. M., G. Aeppli, R. Osborn, A. D. Taylor, T. G.Perring, S-W. Cheong, and Z. Fisk, 1991b, Phys. Rev. Lett.67, 3622.
Hayden, S. M., G. Aeppli, T. G. Perring, H. A. Mook, and F.Dogan, 1996, unpublished.
Hayden, S. M., et al., 1996, Phys. Rev. Lett. 76, 1344.Hedin, L., and S. Lundqvist, 1969, Solid State Phys. 23, 1.Heidemann, A., and M. Takano, 1980, Phys. Status Solidi B
100, 343.Hellberg, C. S., and E. Manousakis, 1997, Phys. Rev. Lett. 78,
4609.Henrich, V. E., and R. L. Kurtz, 1981, J. Vac. Sci. Technol. 18,
416.Herring, C., 1952, Phys. Rev. 87, 60.Herring, C., 1963, in Magnetism, edited by G. T. Rado and H.
Suhl (Academic, New York), Vol. II.B, p. 2).Hertel, P., and J. Appel, 1986, Phys. Rev. B 33, 2098.Hertz, J. A., 1976, Phys. Rev. B 14, 1165.Hida, K., 1992, Phys. Rev. B 45, 2207.Hida, K., M. Imada, and M. Ishikawa, 1983, J. Phys. C 16, 4945.Hiroi, Z. et al., 1997, private communication.Hiroi, Z., M. Azuma, M. Takano, and Y. Bando, 1991, J. Solid
State Chem. 95, 230.Hiroi, Z., and M. Takano, 1995, Nature (London) 377, 41.
Rev. Mod. Phys., Vol. 70, No. 4, October 1998
Hirota, K., N. Kaneko, A. Nishizawa, and Y. Endoh, 1996, J.Phys. Soc. Jpn. 65, 3736.
Hirsch, J. E., 1983, Phys. Rev. B 28, 4059.Hirsch, J. E., 1985a, Phys. Rev. Lett. 54, 1317.Hirsch, J. E., 1985b, Phys. Rev. B 31, 4403.Hirsch, J. E., and R. M. Fye, 1986, Phys. Rev. Lett. 56, 2521.Hohenberg, P., and W. Kohn, 1964, Phys. Rev. 136, 864B.Homes, C. C., T. Timusk, R. Liang, D. A. Bonn, and W. N.
Hardy, 1993, Phys. Rev. Lett. 71, 1645.Honig, J., 1985, in Metallic and Non-Metallic States of Matter,
edited by P. P. Edwards and C. N. Rao (Taylor & Francis,London), p. 226.
Honig, J. M., and T. B. Reed, 1968, Phys. Rev. 174, 1020.Honig, J. M., and L. L. van Zandt, 1975, Annu. Rev. Mater.
Sci. 5, 225.Hubbard, J., 1963, Proc. R. Soc. London, Ser. A 276, 238.Hubbard, J., 1964a, Proc. R. Soc. London, Ser. A 277, 237.Hubbard, J., 1964b, Proc. R. Soc. London, Ser. A 281, 401.Hufner, S., 1985, Z. Phys. B 61, 135.Hufner, S., 1995, Photoelectron Spectroscopy: Principles and
Applications, Springer Series in Solid-State Sciences No. 82,2nd. Ed. (Springer, Berlin).
Hufner, S., T. Riesterer, and F. Hulliger, 1985, Solid StateCommun. 54, 689.
Hufner, S., and G. K. Wertheim, 1973, Phys. Lett. A 44, 133.Hunt, M. B., M. A. Chernikov, E. Felder, H. R. Ott, Z. Fisk,
and P. Canfield, 1994, Phys. Rev. B 50, 14933.Husmann, A., D. S. Jin, Y. V. Zastavker, T. F. Rosenbaum, X.
Yao, and J. M. Honig, 1996, Science 274, 1874.Hussey, N. E., M. Kibune, M. Nakagawa, N. Miura, Y. Iye, H.
Takagi, S. Adachi, and K. Tanabe, 1998, Phys. Rev. Lett. 80,2909.
Hussey, N. E., K. Nozawa, H. Takagi, S. Adachi, and K.Tanabe, 1997, Phys. Rev. B 56, R11423.
Hutchings, M. T., G. Parisot, and D. Tocchett, 1978, in Neu-tron Inelastic Scattering 1977 (IAEA, Vienna), Vol. II, p. 123.
Hwang, H. Y., et al., 1994, Phys. Rev. Lett. 72, 2636.Hybertsen, M. S., M. Schluter, and N. E. Christensen, 1989,
Phys. Rev. B 39, 9028.Hybertsen, M. S., E. B. Stechel, M. Schluter, and D. R. Jenni-
son, 1990, Phys. Rev. B 41, 11068.Idemoto, Y., K. Fueki, and T. Shinbo, 1990, Physica C 166,
513.Igarashi, J., 1983, J. Phys. Soc. Jpn. 52, 2827.Ihle, D., and B. Lorenz, 1980, Philos. Mag. B 42, 337.Ihle, D., and B. Lorenz, 1986, J. Phys. C 19, 5239.Iino, Y., and M. Imada, 1995, J. Phys. Soc. Jpn. 64, 4392.Imada, M., 1991, J. Phys. Soc. Jpn. 60, 1877.Imada, M., 1992, J. Phys. Soc. Jpn. 61, 423.Imada, M., 1993a, J. Phys. Soc. Jpn. 62, 1105.Imada, M., 1993b, J. Phys. Soc. Jpn. 62, 2557.Imada, M., 1993c, Phys. Rev. B 48, 550.Imada, M., 1993d, in Quantum Monte Carlo Methods in Con-
densed Matter Physics, edited by M. Suzuki (World Scientific,Singapore), p. 299.
Imada, M., 1994a, J. Phys. Soc. Jpn. 63, 851.Imada, M., 1994b, J. Phys. Soc. Jpn. 63, 3059.Imada, M., 1994c, J. Phys. Soc. Jpn. 63, 4294.Imada, M., 1995a, J. Low Temp. Phys. 99, 437.Imada, M., 1995b, J. Phys. Soc. Jpn. 64, 2954.Imada, M., 1995c, in Spectroscopy of Mott Insulators and Cor-
related Metals, edited by A. Fujimori and Y. Tokura(Springer-Verlag, Berlin), p. 3.

1253Imada, Fujimori, and Tokura: Metal-insulator transitions
Imada, M., 1995d, in Computational Physics as a New Frontierin Condensed Matter Research, edited by H. Takayama et al.(The Physical Society of Japan, Tokyo), p. 11.
Imada, M., 1998, J. Phys. Soc. Jpn. 67, 45.Imada, M., F. F. Assaad, H. Tsunetsugu, and Y. Motome, 1998,
cond-mat/9808040.Imada, M., N. Furukawa, and T. M. Rice, 1992, J. Phys. Soc.
Jpn. 61, 3861.Imada, M., and Y. Hatsugai, 1989, J. Phys. Soc. Jpn. 58, 3752.Imada, M., and Y. Iino, 1997, J. Phys. Soc. Jpn. 66, 568.Imada, M., and M. Takahashi, 1986, J. Phys. Soc. Jpn. 55, 3354.Imai, H., H. Wada, and M. Shiga, 1996, J. Phys. Soc. Jpn. 65,
3460.Imai, T., C. P. Slichter, K. Yoshimura, and K. Kosuge, 1993,
Phys. Rev. Lett. 70, 1002.Imai, T., H. Yasuoka, T. Shimizu, Y. Ueda, K. Yoshimura, and
K. Kosuge, 1989, Physica C 162-164, 169.Inaba, F., T. Arima, T. Ishikawa, T. Katsufuji, and Y. Tokura,
1995, Phys. Rev. B 52, R2221.Inagaki, S., and R. Kubo, 1973, Int. J. Magn. 4, 139.Inagaki, S., and R. Kubo, 1975, J. Phys. Soc. Jpn. 39, 596.Ino, A., T. Mizokawa, A. Fujimori, K. Tamasaku, H. Eisuki, S.
Uchida, T. Kimura, T. Sasagawa, and K. Kishio, 1997a, Phys.Rev. Lett. 79, 2101.
Ino, A., T. Mizokawa, A. Fujimori, Y. Yasui, T. Nishikawa,and M. Sato, 1997b, unpublished.
Ino, A., T. Mizokawa, K. Kobayashi, A. Fujimori, T. Sasa-gawa, T. Kimura, K. Kishio, K. Tamasaku, H. Eisaki, and S.Uchida, 1997c, unpublished.
Inoue, I. H., Y. Aiura, Y. Nishihara, Y. Haruama, S. Nishizaki,Y. Maeno, T. Fujita, J. G. Bednorz, and F. Lichtenberg, 1996,J. Electron Spectrosc. Relat. Phenom. 78, 175.
Inoue, I. H., I. Hase, Y. Aiura, A. Fujimori, Y. Haruyama, T.Maruyama, and Y. Nishihara, 1995, Phys. Rev. Lett. 74, 2539.
Inoue, I. H., H. Makino, I. Hase, M. Ishikawa, N. E. Hussey,and M. J. Rozenberg, 1997a, unpublished.
Inoue, I. H., et al., 1997b, Physica B 237-238, 61.Inoue, J., and S. Maekawa, 1990, J. Phys. Soc. Jpn. 59, 2110.Inui, M., and P. B. Littlewood, 1991, Phys. Rev. B 44, 4415.Ioffe, L. B., and G. Kotliar, 1990, Phys. Rev. B 42, 10348.Ioffe, L. B., and A. Larkin, 1989, Phys. Rev. B 39, 8988.Ioffe, L. B., and P. B. Wiegmann, 1990, Phys. Rev. Lett. 65,
653.Ishihara, S., J. Inoue, and S. Maekawa, 1997, Phys. Rev. B 55,
8280.Ishihara, S., Y. Yamanaka, and N. Nagaosa, 1997, Phys. Rev. B
56, 686.Ishikawa, T., S. K. Park, and Y. Tokura, 1998, Phys. Rev. B (in
press).Isobe, M., and Y. Ueda, 1996, J. Phys. Soc. Jpn. 65, 1178.Ito, T., H. Takagi, T. Ido, S. Ishibashi, and S. Uchida, 1991,
Nature (London) 350, 596.Ito, T., K. Takenaka, and S. Uchida, 1993, Phys. Rev. Lett. 70,
3995.Itoh, M., M. Sugahara, I. Natori, and K. Motoya, 1995, J. Phys.
Soc. Jpn. 64, 3967.Itoh, S., K. Yamada, M. Arai, Y. Endoh, Y. Hidaka, and S.
Hosoya, 1994, J. Phys. Soc. Jpn. 63, 4542.Itoh, T., T. Fujiwara, and S. Tanaka, 1994, unpublished.Itoh, Y., 1994, J. Phys. Soc. Jpn. 63, 3522.Itoh, Y., T. Machi, A. Fukuoka, K. Tanabe, and H. Yasuoka,
1996, J. Phys. Soc. Jpn. 65, 3751.
Rev. Mod. Phys., Vol. 70, No. 4, October 1998
Itoh, Y., H. Yasuoka, Y. Fujiwara, Y. Ueda, T. Machi, I.Tomeno, K. Tai, N. Koshizuka, and S. Tanaka, 1992, J. Phys.Soc. Jpn. 61, 1287.
Itoh, Y., H. Yasuoka, A. Hayashi, and Y. Ueda, 1994, J. Phys.Soc. Jpn. 63, 22.
Itti, R., T. Wada, K. Matsuura, T. Itoh, K. Ikeda, H. Yamauchi,N. Koshizuka, and S. Tanaka, 1991, Phys. Rev. B 44, 2306.
Iye, Y., 1990, in Properties of High-Temperature Superconduct-ors, edited by. P. M. Ginsberg (World Scientific, Singpore),Vol. 2, p. 459.
Izumi, M., K. Nakazawa, Y. Bando, Y. Yoneda, and H. Terau-chi, 1997, J. Phys. Soc. Jpn. 66, 3893.
Jaccarino, V., G. K. Wertheim, J. H. Wernich, L. R. Walker,and S. Arajs, 1967, Phys. Rev. 160, 476.
Jaklic, J., and P. Prelovsek, 1994, Phys. Rev. B 49, 5065.Jaklic, J., and P. Prelovsek, 1995a, Phys. Rev. B 52, 6903.Jaklic, J., and P. Prelovsek, 1995b, Phys. Rev. Lett. 74, 3411.Jaklic, J., and P. Prelovsek, 1996, Phys. Rev. Lett. 77, 892.Jarrell, M., 1992, Phys. Rev. Lett. 69, 168.Jarrell, M., H. Akhlaghpour, and T. Pruschke, 1993, Phys. Rev.
Lett. 70, 1670.Jarrell, M., J. K. Fredericks, and T. Pruschke, 1995, Phys. Rev.
B 51, 11704.Jarrell, M., and T. Pruschke, 1993, Z. Phys. B 90, 187.Jarrell, M., and T. Pruschke, 1994, Phys. Rev. B 49, 1458.Jarrett, H. S., et al., 1973, Mater. Res. Bull. 8, 877.Jiang, Wu, S. N. Mao, X. X. Xi, Xiuguang Jiang, J. L. Peng, T.
Venkatesan, C. J. Lobb, and R. L. Greene, 1994, Phys. Rev.Lett. 73, 1291.
Jichu, H., T. Matsuura, and Y. Kuroda, 1989, J. Phys. Soc. Jpn.58, 4280.
Jirak, Z., S. Krupicka, V. Nekvasild, E. Pollert, G. Villeneuve,and F. Zounova, 1980, J. Magn. Magn. Mater. 15-18, 519.
Jirak, Z., S. Krupicka, Z. Simsa, M. Dlouha, and Z. Vratislav,1985, J. Magn. Magn. Mater. 53, 153.
Johnston, D. C., 1989, Phys. Rev. Lett. 62, 957.Johnston, D. C., 1996, Phys. Rev. B 54, 13009.Kadono, R., H. Okajima, A. Yamashita, K. Ishii, T. Yokoo, J.
Akimitsu, N. Kobayashi, Z. Hiroi, M. Takano, and K. Naga-mine, 1996, Phys. Rev. B 54, R9628.
Kadowaki, K., and S. B. Woods, 1986, Solid State Commun.58, 507.
Kaidanov, V. I., V. A. Tselishchev, I. K. Iesalniek, L. D. Dud-kin, B. K. Voronov, and N. N. Trusova, 1968, Sov. Phys.Semicond. 2, 382.
Kajueter, H., and G. Kotliar, 1996, Preprint No.cond-mat/9609176.
Kajueter, H., and G. Kotliar, 1997, Int. J. Mod. Phys. B 11, 729.Kakeshita, T., R. Kajimoto, H. Yoshizawa, T. Tanabe, T. Kat-
sufuji, and Y. Tokura, 1998, unpublished.Kakizaki, A., H. Sugawara, I. Nagakura, Y. Ishikawa, T. Ko-
matsubara, and T. Ishii, 1982, J. Phys. Soc. Jpn. 51, 2597.Kakizaki, A., K. Sugeno, T. Ishii, H. Sugawara, I. Nagakura,
and S. Shin, 1983, Phys. Rev. B 28, 1026.Kambe, S., H. Yasuoka, H. Takagi, S. Uchida, and Y. Tokura,
1991, J. Phys. Soc. Jpn. 60, 400.Kamimura, H., and Y. Suwa, 1993, J. Phys. Soc. Jpn. 62, 3368.Kampf, A., and J. R. Schrieffer, 1990, Phys. Rev. B 41, 6399.Kanamori, J., 1959, J. Phys. Chem. Solids 10, 87.Kanamori, J., 1963, Prog. Theor. Phys. 30, 275.Kanbayashi, A., 1978, J. Phys. Soc. Jpn. 44, 108.Kanoda, K., 1997, Hyperfine Interact. 104, 235.

1254 Imada, Fujimori, and Tokura: Metal-insulator transitions
Kaplan, S. G., S. Wu, H.-T. S. Lihn, H. D. Drew, Q. Li, D. B.Fenner, J. M. Phillips, and S. Y. Hou, 1996, Phys. Rev. Lett.76, 696.
Karlsson, K., O. Gunnarsson, and O. Jepsen, 1992, J. Phys.:Condens. Matter 4, 895.
Kasowski, R. V., 1973, Phys. Rev. B 8, 1378.Kastner, M. A., R. J. Birgeneau, T. R. Thurston, P. J. Picone,
H. P. Jenssen, D. R. Gabbe, M. Sato, K. Fukuda, S. Shamoto,Y. Endoh, K. Yamada, and G. Shirane, 1988, Phys. Rev. B 38,6636.
Kasuya, H., Y. Tokura, T. Arima, H. Eisaki, and S. Uchida,1993, Phys. Rev. B 47, 6197.
Katano, S., J. A. Fernandez-Baca, S. Funahashi, N. Mori, Y.Ueda, and K. Koga, 1993, Physica C 214, 64.
Kataoka, M., 1996, Czech. J. Phys. 46, Suppl. F4.Katayama, M., S. Akimoto, and K. Asayama, 1977, J. Phys.
Soc. Jpn. 42, 97.Kato, M., H. Chizawa, Y. Koike, T. Toji, and Y. Saito, 1994,
Physica (Amsterdam) 235C-244C, 1327.Kato, M., K. Shiota, and Y. Koike, 1996, Physica C 258, 284.Kato, T., and M. Imada, 1998, J. Phys. Soc. Jpn. 67, 2828.Katoh, N., and M. Imada, 1993, J. Phys. Soc. Jpn. 62, 3728.Katoh, N., and M. Imada, 1994, J. Phys. Soc. Jpn. 63, 4529.Katoh, N., and M. Imada, 1995, J. Phys. Soc. Jpn. 64, 4105.Katoh, N., and M. Imada, 1998, J. Phys. Soc. Jpn. 67, 564.Katsufuji, T., M. Kasai, and Y. Tokura, 1996, Phys. Rev. Lett.
76, 126.Katsufuji, T., Y. Okimoto, T. Arima, Y. Tokura, and J. B.
Torrance, 1995, Phys. Rev. B 51, 4830.Katsufuji, T., Y. Okimoto, and Y. Tokura, 1995, Phys. Rev.
Lett. 75, 3497.Katsufuji, T., Y. Taguchi, and Y. Tokura, 1997, Phys. Rev. B
56, 10145.Katsufuji, T., T. Tanabe, T. Ishikawa, Y. Fukuda, T. Arima,
and Y. Tokura, 1996, Phys. Rev. B 54, R14230.Katsufuji, T., T. Tanabe, and Y. Tokura, 1998, unpublished.Katsufuji, T., and Y. Tokura, 1994, Phys. Rev. B 50, 2704.Kawabata, A., 1972, Prog. Theor. Phys. 48, 1793.Kawabata, A., 1975, Prog. Theor. Phys. 54, 45.Kawakami, N., and S.-K. Yang, 1990, Phys. Lett. A 148, 359.Kawakami, N., and S.-K. Yang, 1991, Phys. Rev. Lett. 67, 2493.Kawano, H., R. Kajimoto, M. Kubota, and H. Yoshizawa,
1996, Phys. Rev. B 53, R14709.Kawano, H., R. Kajimoto, H. Yoshizawa, Y. Tomioka, H. Ku-
wahara, and Y. Tokura, 1997, Phys. Rev. Lett. 78, 4253.Kebler, J., A. T. Aldred, G. H. Lander, M. H. Mueller, O.
Massenet, and G. D. Stucky, 1980, J. Solid State Chem. 351,351.
Keimer, B., N. Belk, R. J. Birgeneau, A. Cassanho, C. Y.Chen, M. Greven, M. A. Kastner, A. Aharony, Y. Endoh, R.W. Erwin, and G. Shirane, 1992, Phys. Rev. B 46, 14034.
Keren, A., L. P. Le, G. M. Luke, B. J. Sternlieb, W. D. Wu, Y.J. Uemura, S. Tajima, and S. Uchida, 1993, Phys. Rev. B 48,12926.
Kim, C., A. Y. Matsuura, Z.-X. Shen, N. Motoyama, H. Eisaki,S. Uchida, T. Tohyama, and S. Maekawa, 1996, Phys. Rev.Lett. 77, 4054.
Kim, C., Z.-X. Shen, N. Motoyama, H. Eisaki, S. Uchida, T.Tohyama, and S. Maekawa, 1997, Phys. Rev. B 56, 15589.
Kimura, T., Y. Tomioka, A. Asamitsu, and Y. Tokura, 1997,unpublished (submitted to Phys. Rev. Lett.).
Kimura, T., Y. Tomioka, H. Kuwahara, A. Asamitsu, M.Tamura, and Y. Tokura, 1996, Science 274, 1698.
Rev. Mod. Phys., Vol. 70, No. 4, October 1998
King, D. M., Z.-X. Shen, D. S. Dessau, B. O. Wells, W. E.Spicer, A. J. Arko, D. S. Marshall, J. DiCarlo, A. G. Loeser,C. H. Park, E. R. Ratner, J. L. Peng, Z. Y. Li, and R. L.Greene, 1993, Phys. Rev. Lett. 70, 3159.
Kirkpatrick, T. R., and D. Belitz, 1995, Phys. Rev. Lett. 73,862.
Kirkpatrick, T. R., and D. Belitz, 1997, cond-mat/9707001.Kiryukhin, V., D. Cax, J. P. Hill, B. Keimer, A. Vigliante, Y.
Tomioka, and Y. Tokura, 1997, Nature (London) 386, 813.Kishine, J., and H. Fukuyama, 1997, J. Phys. Soc. Jpn. 66, 26.Kita, E., Y. Tokuyama, A. Tasaki, and K. Siratori, 1983, J.
Magn. Magn. Mater. 31-34, 787.Kitaoka, Y., K. Ishida, S. Hiramatu, and K. Asayama, 1988, J.
Phys. Soc. Jpn. 57, 734.Kittel, C., 1968, in Solid State Physics 22 (Academic, New
York), p. 1.Klein, L., J. S. Dodge, C. H. Ahn, G. J. Snyder, T. H. Geball,
M. R. Beasley, and A. Kapitulnik, 1996, Phys. Rev. Lett. 77,2774.
Kobayashi, H., M. Nagata, R. Kanno, and Y. Kawamoto, 1994,Mater. Res. Bull. 29, 1271.
Koehler, R. F., Jr., and R. L. White, 1973, J. Appl. Phys. 44,1682.
Kohgi, M., and Y. Ishikawa, 1981, Solid State Commun. 37,833.
Kohn, W., 1964, Phys. Rev. A 133, 171.Kohn, W., and L. J. Sham, 1965, Phys. Rev. 140, A1133.Kohno, H., and K. Yamada, 1991, Prog. Theor. Phys. 85, 13.Kohno, M., 1997, Phys. Rev. B 55, 1435.Kopietz, P., V. Meden, and K. Schonhammer, 1995, Phys. Rev.
Lett. 74, 2997.Korenman, V., J. L. Murray, and R. E. Prange, 1977a, Phys.
Rev. B 16, 4032.Korenman, V., J. L. Murray, and R. E. Prange, 1977b, Phys.
Rev. B 16, 4048.Korenman, V., J. L. Murray, and R. E. Prange, 1977c, Phys.
Rev. B 16, 4058.Korotin, M. A., S. Yu. Ezhov, I. V. Solovyev, V. I. Anisimov,
D. I. Khomskii, and G. A. Sawatzky, 1996, Phys. Rev. B 54,5309.
Koshibae, W., Y. Kawamura, S. Ishihara, S. Okamoto, J. In-oue, and S. Maekawa, 1997, J. Phys. Soc. Jpn. 66, 957.
Koshibae, W., Y. Ohta, and S. Maekawa, 1993, Phys. Rev. B47, 3391.
Koshibae, W., Y. Ohta, and S. Maekawa, 1994, Phys. Rev. B50, 3767.
Kotani, T., 1997, cond-mat/9711062.Kotliar, G., 1993, in Correlated Electron Systems, edited by V.
J. Emery (World Scientific, Singapore), p. 118.Kotliar, G., and H. Kajueter, 1996, Phys. Rev. B 54, 14221.Kotliar, G., and J. Liu, 1988, Phys. Rev. B 38, 5142.Koyama, T., and M. Tachiki, 1986, Phys. Rev. B 34, 3272.Kramers, H. A., 1934, Physica (Amsterdam) 1, 1934.Kravchenko, S. V., W. E. Mason, G. E. Bowker, J. E. Fur-
neaux, V. M. Pudalov, and M. D’Iorio, 1995, Phys. Rev. B 51,7038.
Krill, G., and A. Amamou, 1980, J. Phys. Chem. Solids 41, 531.Kubert, C., and A. Muramatsu, 1996, Int. J. Mod. Phys. B 10,
3807.Kubo, K., and T. Kishi, 1988, Phys. Rev. Lett. 61, 2585, and
references therein.Kubo, K., and N. Ohata, 1972, J. Phys. Soc. Jpn. 33, 21.Kubo, R., 1952, Phys. Rev. 87, 568.

1255Imada, Fujimori, and Tokura: Metal-insulator transitions
Kubo, R., 1957, J. Phys. Soc. Jpn. 12, 570.Kubo, Y., Y. Shimakawa, T. Manako, and H. Igarashi, 1991,
Phys. Rev. B 43, 7875.Kugel, K. I., and D. I. Khomskii, 1973, Sov. Phys. JETP 37,
725.Kugel, K. I., and D. I. Khomskii, 1982, Sov. Phys. Usp. 25, 231.Kuipers, A. J. M., and V. A. M. Brabers, 1976, Phys. Rev. B 14,
1401.Kumagai, K., K. Kawano, I. Watanabe, K. Nishiyama, and K.
Nagamine, 1994, J. Supercond. 7, 63.Kumagai, K., H. Matoba, N. Wada, M. Okaji, and K. Nara,
1991, J. Phys. Soc. Jpn. 60, 1448.Kumagai, K. I., T. Suzuki, Y. Taguchi, Y. Okada, Y. Fujishima,
and Y. Tokura, 1993, Phys. Rev. B 48, 7636.Kumagai, K., S. Tsuji, M. Kato, and Y. Koike, 1997, Phys. Rev.
Lett. 78, 1992.Kuramoto, Y., 1985, in Theory of Heavy Fermions and Valence
Fluctuations, edited by T. Kasuya and T. Saso (Springer, Ber-lin), p. 152.
Kuramoto, Y., and N. Fukushima, 1998, J. Phys. Soc. Jpn. 67,583.
Kuramoto, Y., and K. Miyake, 1990, J. Phys. Soc. Jpn. 59, 2831.Kuramoto, Y., and T. Watanabe, 1987, Physica B 148, 80.Kuroki, K., T. Kimura, and H. Aoki, 1996, Phys. Rev. B 54,
R15641.Kuwahara, H., Y. Tomioka, A. Asamitsu, Y. Moritomo, and
Y. Tokura, 1995, Science 270, 961.Kuwahara, H., et al., 1998, unpublished.Kuwamoto, H., J. M. Honig, and J. Appel, 1980, Phys. Rev. B
22, 2626.Kwizera, P., M. S. Dresselhaus, and D. Adler, 1980, Phys. Rev.
B 21, 2328.Lad, R. J., and V. E. Henrich, 1989, Phys. Rev. B 39, 13478.Ladd, L., and W. Paul, 1969, Solid State Commun. 7, 425.Landau, L. D., 1957a, Sov. Phys. JETP 3, 920.Landau, L. D., 1957b, Sov. Phys. JETP 5, 101.Landau, L. D., 1958, Sov. Phys. JETP 8, 70.Langer, M., J. Schmalian, S. Grabowsky, and K. H. Benne-
mann, 1995, Phys. Rev. Lett. 75, 4508.Langreth, D. C., and M. J. Mehl, 1983, Phys. Rev. B 28, 1809.Lee, P. A., and N. Nagaosa, 1992, Phys. Rev. B 46, 5621.Lee, P. A., and T. V. Ramakrishnan, 1985, Rev. Mod. Phys. 57,
287.Lee, S.-H., and S-W. Cheong, 1997, Phys. Rev. Lett. 79, 2514.Li, E. K., K. H. Johnson, D. E. Eastman, and J. L. Freeouf,
1974, Phys. Rev. Lett. 32, 470.Li, J. Q., Y. Matsui, S. K. Park, and Y. Tokura, 1997, Phys.
Rev. Lett. 79, 297.Li, Q., J. Callaway, and L. Tan, 1991, Phys. Rev. B 44, 10256.Liang, W. Y., J. W. Loram, K. A. Mirza, N. Athanassopoulou,
and J. R. Cooper, 1996, Physica C 263, 277.Lichtenberg, F., A. Catana, J. Mannhart, and D. G. Schlom,
1992, Appl. Phys. Lett. 60, 1138.Liechtenstein, A. I., V. I. Anisimov, and J. Zaanen, 1995, Phys.
Rev. B 52, 5467.Litvinchuk, A. P., C. Thomsen, and M. Cardona, 1993, Solid
State Commun. 83, 343.Liu, L.-Z., R. O. Anderson, and J. W. Allen, 1991, J. Phys.
Chem. Solids 52, 1473.Liu, R., B. W. Veal, A. P. Paulikas, J. W. Downey, P. J. Kostic,
S. Fleshler, U. Welp, C. G. Olson, X. Wu, A. J. Arko, and J.J. Joyce, 1992a, Phys. Rev. B 46, 11056.
Rev. Mod. Phys., Vol. 70, No. 4, October 1998
Liu, R., B. W. Veal, A. P. Paulikas, J. W. Downey, H. Shi, C.G. Olson, C. Gu, A. J. Arko, and J. J. Joyce, 1992b, Phys.Rev. B 45, 5614.
Lloyd, P., and P. R. Best, 1975, J. Phys. C 8, 3752.Loeser, A., Z.-X. Shen, D. S. Dessau, D. S. Marshall, C.-H.
Park, P. Founier, and A. Kapitulnik, 1996, Science 273, 325.Loh, E. Y., Jr., J. E. Gubernatis, R. T. Scalettar, S. R. White,
D. J. Scalapino, and R. L. Sugar, 1990, Phys. Rev. B 41, 9301.Longo, J. M., P. M. Raccah, and J. B. Goodenough, 1968, J.
Appl. Phys. 39, 1327.Loram, J. W., K. A. Mirza, J. R. Cooper, N. Athamassopoulou,
and W. Y. Liang, 1997, unpublished.Loram, J. W., K. A. Mirza, J. R. Cooper, and W. Y. Liang,
1994, Physica C 235-240, 134.Loram, J. W., K. A. Mirza, W. Y. Liang, and J. Osborne, 1989,
Physica C 162-164, 498.Lorenz, B., and D. Ihle, 1979, Phys. Status Solidi B 96, 659.Lorenz, B., and D. Ihle, 1982, Phys. Status Solidi B 113, 601.Lorenzana, J., and G. A. Sawatzky, 1995, Phys. Rev. Lett. 74,
1867.Lu, D. H., M. Schmidt, T. R. Cummins, S. Schuppler, F. Lich-
tenberg, and J. G. Bednorz, 1996, Phys. Rev. Lett. 76, 4845.Lu, J. P., 1994, Phys. Rev. B 49, 5687.Lucovsky, G., J. W. Allen, and R. Allen, 1979, in Physics of
Semiconductors, Conference Series No. 43, edited by B. L. H.Wilson (Institute of Physics, London), p. 465.
Luke, G. M., B. Sternlieb, Y. J. Uemura, J. H. Brewer, R.Kadono, R. F. Kiefl, S. R. Kreitzman, T. M. Riseman, J. Go-palakrishman, A. W. Sleight, M. A. Subramanian, S. Uchida,H. Takagi, and Y. Tokura, 1989, Nature (London) 338, 49.
Lusher, C. P., B. P. Cowan, and J. Saunders, 1993, Phys. Rev.Lett. 67, 2497.
Luther, A., and V. J. Emery, 1974, Phys. Rev. Lett. 33, 589.Luttinger, J. M., 1963, J. Math. Phys. 4, 1154.Lyons, K. B., P. A. Fleury, J. P. Remeika, A. S. Cooper, and T.
J. Negran, 1988, Phys. Rev. B 37, 2353.Ma, S.-K., 1976, Modern Theory of Critical Phenomena, Fron-
tiers in Physics Series No. 46 (Addison-Wesley, Reading,MA).
Machi, T., I. Tomeno, T. Miyatake, N. Koshizuka, S. Tanaka,T. Imai, and H. Yasuoka, 1991, Physica C 173, 32.
Machida, K., 1989, Physica C 158, 192.Mackenzie, A. P., S. R. Julian, A. J. Diver, G. J. McMullan, M.
P. Ray, G. G. Lonzarich, Y. Maeno, S. Nishizaki, and T.Fujita, 1996, Phys. Rev. Lett. 76, 3786.
MacKinnon, A., and B. Kramer, 1993, Rep. Prog. Phys. 56,1469.
MacLean, D. A., Hok-Nam Ng, and J. E. Greedan, 1979, J.Solid State Chem. 30, 35.
Maeno, Y., 1996, in Advances in Superconductivity VIII, editedby H. Hayakawa and Y. Enomoto (Springer, Tokyo), p. 15.
Maeno, Y., H. Hashimoto, K. Yoshida, S. Nishizaki, T. Fujita,J. G. Bednorz, and F. Lichtenberg, 1994, Nature (London)372, 532.
Maeno, Y., K. Yoshida, H. Hashimoto, S. Nishizaki, S. Ikeda,M. Nohara, T. Fujita, A. P. Machenzie, N. E. Hussey, J. G.Bednorz, and F. Lichtenberg, 1997, J. Phys. Soc. Jpn. 66,1405.
Maezono, R., S. Ishihara, and N. Nagaosa, 1998, Phys. Rev. B57, R13993.
Magishi, K., S. Matsumoto, Y. Kitaoka, K. Ishida, K. Asayama,M. Uehara, T. Nagata, and J. Akimitsu, 1998, Phys. Rev. B57, 11533.

1256 Imada, Fujimori, and Tokura: Metal-insulator transitions
Mahadevan, P., N. Shanthi, and D. D. Sarma, 1996, Phys. Rev.B 54, 11199.
Mahajan, A. V., D. C. Johnston, P. R. Torgeson, and F. Borsa,1992, Phys. Rev. B 46, 10973.
Maiti, K., D. D. Sarma, T. Mizokawa, and A. Fujimori, 1997,Europhys. Lett. 37, 359.
Makivic, M. S., and H.-Q. Ding, 1991, Phys. Rev. B 43, 3562.Mamiya, K., T. Mizokawa, A. Fujimori, N. Chandrasekaran, S.
R. Krishnakumar, D. D. Sarma, T. Miyadai, H. Takahashi, N.Mori, and S. Suga, 1997a, Phys. Rev. B, in press.
Mamiya, K., T. Mizokawa, A. Fujimori, T. Miyadai, H. Taka-hashi, N. Mori, and S. Suga, 1997b, unpublished.
Marezio, M., D. B. McWhan, J. P. Remeika, and P. D.Dernier, 1972, Phys. Rev. B 5, 2541.
Marezio, M., J. P. Remeika, and P. D. Dernier, 1970, ActaCrystallogr., Sect. B: Struct. Crystallogr. Cryst. Chem. 26,2008.
Marshall, D. S., D. S. Dessau, A. G. Loeser, C.-H. Park, A. Y.Matsuura, J. N. Eckstein, I. Bozovic, P. Fournier, A. Kapit-ulnik, W. E. Spicer, and Z.-X. Shen, 1996, Phys. Rev. Lett. 76,4841.
Mason, T. E., G. Aeppli, and H. A. Mook, 1992, Phys. Rev.Lett. 68, 1414.
Mason, T. E., et al., 1993, Phys. Rev. Lett. 71, 919.Mason, T. E., A. Schroder, G. Aeppli, H. A. Mook, and S. M.
Hayden, 1996, Phys. Rev. Lett. 77, 1604.Massida, S., N. Hamada, J. Yu, and A. J. Freeman, 1989,
Physica C 157, 571.Massenet, O., R. Buder, J. J. Since, C. Schlenker, J. Mercier, J.
Kebler, and D. G. Stucky, 1978, Mater. Res. Bull. 13, 187.Massenet, O., J. J. Since, J. Mercier, M. Avignon, R. Buder, V.
D. Ngyuyen, and J. Kebler, 1979, Solid State Commun. 40,573.
Matl, P., Y. F. Yan, N. P. Ong, Y. Q. Li, D. Studebaker, T.Baum, and G. Doubinina, 1997, unpublished.
Matoba, M., and S. Anzai, 1987, J. Magn. Magn. Mater. 70,213.
Matoba, M., S. Anzai, and A. Fujimori, 1991, J. Phys. Soc. Jpn.60, 4230.
Matoba, M., S. Anzai, and A. Fujimori, 1994, J. Phys. Soc. Jpn.63, 1429.
Matsuda, M., Y. Endoh, Y. Yamada, K. Kojima, I. Tanaka, R.J. Birgeneau, M. A. Kastner, and G. Shirane, 1992, Phys. Rev.B 45, 12548.
Matsuda, M., and K. Katsumata, 1996, Phys. Rev. B 53, 12201.Matsuda, M., K. Katsumata, H. Eisaki, N. Motoyama, S.
Uchida, S. M. Shapiro, and G. Shirane, 1996, Phys. Rev. B 54,12199.
Matsuda, M., K. Yamada, Y. Endoh, T. R. Thurston, G.Shirane, R. J. Birgeneau, M. A. Kastner, I. Tanaka, and H.Kojima, 1994, Phys. Rev. B 49, 6958.
Matsumoto, S., Y. Kitaoka, K. Ishida, K. Asayama, Z. Hiroi,N. Kobayashi, and M. Takano, 1996, Phys. Rev. B 53,R11942.
Matsumoto, S., et al., 1997, unpublished.Matsuura, A. Y., Z.-X. Shen, D. S. Dessau, C.-H. Park, T.
Thio, J. W. Bennett, and O. Jepsen, 1996, Phys. Rev. B 53,R7584.
Matsuura, K., T. Wada, T. Nakamizo, H. Yamauchi, and S.Tanaka, 1991, Phys. Rev. B 43, 13118.
Mattheiss, L. F., 1972, Phys. Rev. B 5, 290 (Part I); 5, 306 (PartII).
Mattheiss, L. F., 1974, Phys. Rev. B 10, 995.
Rev. Mod. Phys., Vol. 70, No. 4, October 1998
Mattheiss, L. F., 1994, J. Phys.: Condens. Matter 6, 6477.Mattheiss, L. F., 1995, Solid State Commun. 93, 791.Mattheiss, L. F., 1996a, Solid State Commun. 97, 751.Mattheiss, L. F., 1996b, J. Phys.: Condens. Matter 8, 5987.Mattheiss, L. F., and D. R. Hamann, 1993, Phys. Rev. B 47,
13114.Mayaffre, H., P. Auban-Senzier, D. Jerome, D. Poilblanc, C.
Bourbonnais, U. Ammerrahl, G. Dhalenne, and A. Rev-colevschi, 1997, cond-mat/9710063.
Mazin, I. I., and D. J. Singh, 1997, Phys. Rev. Lett. 79, 733.McCarron, E. M., M. A. Subramanian, J. C. Calabrese, and R.
L. Harlow, 1988, Mater. Res. Bull. 23, 1355.McElfresh, M. W., J. M. D. Coey, P. Strobel, and S. von Mol-
nar, 1989, Phys. Rev. B 40, 825.McKane, A. J., and M. Stone, 1981, Ann. Phys. (N.Y.) 131, 36.McMahan, A. K., J. F. Annett, and R. M. Martin, 1990, Phys.
Rev. B 42, 6268.McMahan, A. K., R. M. Martin, and S. Satpathy, 1989, Phys.
Rev. B 38, 6650.McWhan, D. B., M. Marezio, J. P. Remeika, and P. D.
Dernier, 1972, Phys. Rev. B 5, 2552.McWhan, D. B., A. Menth, J. P. Remeika, W. F. Brinkman,
and T. M. Rice, 1973, Phys. Rev. B 7, 1920.McWhan, D. B., and J. P. Remeika, 1970, Phys. Rev. B 2, 3734.McWhan, D. B., J. P. Remeika, T. M. Rice, W. F. Brinkman, J.
P. Maita, and A. Menth, 1971, Phys. Rev. Lett. 27, 941.Meden, V., and K. Schonhammer, 1993a, Phys. Rev. B 46,
15753.Meden, V., and K. Schonhammer, 1993b, Phys. Rev. B 47,
16205.Metzner, W., and D. Vollhardt, 1989, Phys. Rev. Lett. 62, 324.Metzner, W., P. Schmit, and D. Vollhardt, 1992, Phys. Rev. B
45, 2237.Micnas, R., J. R. Ranninger, and S. Robaszkiewicz, 1990, Rev.
Mod. Phys. 62, 113.Mila, F., and T. M. Rice, 1989, Physica C 157, 561.Miles, P. A., W. B. Westphal, and A. von Hippel, 1957, Rev.
Mod. Phys. 29, 279.Millis, A. J., 1993, Phys. Rev. B 48, 7183.Millis, A. J., 1996, Phys. Rev. B 53, 8434.Millis, A. J., P. B. Littlewood, and B. I. Shraiman, 1995, Phys.
Rev. Lett. 74, 5144.Millis, A. J., H. Monien, and D. Pines, 1990, Phys. Rev. B 42,
167.Millis, A. J., B. I. Shraiman, and R. Mueller, 1996, Phys. Rev.
Lett. 77, 175.Mills, D. L., A. A. Maradudin, and E. Burstein, 1970, Ann.
Phys. (N.Y.) 56, 504.Misawa, S., 1995, Physica B 211, 158.Misawa, S., and A. Tate, 1996, J. Magn. Magn. Mater. 157-158,
617.Mishra, S. K., and S. Satpathy, 1993, Phys. Rev. B 47, 5564.Mitchell, J. F., D. N. Argyriou, J. D. Jorgensen, D. G. Hinks,
C. D. Potter, and S. D. Bader, 1997, Phys. Rev. B 55, 63.Miyadai, T., K. Kikuchi, and H. Ito, 1978, Phys. Lett. A 67, 61.Miyadai, T., S. Sudo, Y. Tazuke, N. Mori, and Y. Miyao, 1983,
J. Magn. Magn. Mater. 31-34, 337.Miyake, K., 1996, unpublished.Miyake, K., and O. Narikiyo, 1994a, J. Phys. Soc. Jpn. 63, 2042.Miyake, K., and O. Narikiyo, 1994b, J. Phys. Soc. Jpn. 63, 3821.Miyano, K., T. Tanaka, Y. Tomioka, and Y. Tokura, 1997,
Phys. Rev. Lett. 78, 4257.

1257Imada, Fujimori, and Tokura: Metal-insulator transitions
Miyasaka, S., H. Takagi, Y. Sekine, H. Takahashi, N. Mori,and R. J. Cava, 1998, Phys. Rev. B (in press).
Mizoguchi, M., 1978, J. Phys. Soc. Jpn. 44, 1512.Mizokawa, T., and A. Fujimori, 1995, Phys. Rev. B 51, 12880.Mizokawa, T., and A. Fujimori, 1996a, Phys. Rev. B 53, R4201.Mizokawa, T., and A. Fujimori, 1996b, Phys. Rev. B 54, 5368.Mizokawa, T., and A. Fujimori, 1997, Phys. Rev. B 56, R493.Mizokawa, T., A. Fujimori, T. Arima, Y. Tokura, N. Mori, and
J. Akimitsu, 1995, Phys. Rev. B 52, 13865.Mizokawa, T., A. Fujimori, H. Namatame, K. Akeyama, and
N. Kosugi, 1994, Phys. Rev. Lett. 49, 7193.Mizokawa, T., H. Namatame, A. Fujimori, K. Akeyama, H.
Kondoh, H. Kuroda, and N. Kosugi, 1991, Phys. Rev. Lett.67, 1638.
Mizokawa, T., K. Ootomo, T. Konishi, A. Fujimori, Z. Hiroi,N. Kobayashi, and M. Takano, 1997, Phys. Rev. B 55,R13373.
Mizuhashi, K., K. Takenaka, Y. Fukuzumi, and S. Uchida,1995, Phys. Rev. B 52, R3884.
Moeller, G., Q. Si, G. Kotliar, M. J. Rozenberg, and D. S.Fisher, 1995, Phys. Rev. Lett. 74, 2082.
Mohan Ram, R. A., L. Ganpathi, P. Ganguly, and C. N. Rao,1984, J. Solid State Chem. 63, 139.
Momono, N., M. Ido, T. Nakano, M. Oda, Y. Okajima, and K.Yamaya, 1994, Physica C 233, 395.
Momono, N., M. Ido, M. Oda, N. Yamada, and A. Onodera,1991, Physica C 183, 241.
Mook, H. A., M. Yethiraj, G. Aeppli, T. E. Mason, and T. A.Armstrong, 1993, Phys. Rev. Lett. 70, 3490.
Moreo, A., and E. Dagotto, 1990, Phys. Rev. B 42, 4786.Moreo, A., E. Dagotto, T. Jolicoeur, and J. Riera, 1990, Phys.
Rev. B 42, 6283.Moreo, A., S. Haas, A. W. Sandvik, and E. Dagotto, 1995,
Phys. Rev. B 51, 12045.Moreo, A., D. J. Scalapino, and E. Dagotto, 1991, Phys. Rev. B
43, 11442.Moreo, A., D. J. Scalapino, R. L. Sugar, S. R. White, and N. E.
Bickers, 1990, Phys. Rev. B 41, 2313.Mori, M., H. Fukuyama, and M. Imada, 1994, J. Phys. Soc. Jpn.
63, 1639.Morikawa, K., T. Mizokawa, A. Fujimori, Y. Taguchi, and Y.
Tokura, 1996, Phys. Rev. B 54, 8446.Morikawa, K., T. Mizokawa, K. Kobayashi, A. Fujimori, H.
Eisaki, S. Uchida, F. Iga, and Y. Nishihara, 1995, Phys. Rev.B 52, 13711.
Moritomo, Y., A. Asamitsu, H. Kuwahara, and Y. Tokura,1996, Nature (London) 380, 141.
Moritomo, Y., H. Kuwahara, Y. Tomioka, and Y. Tokura,1997, Phys. Rev. B 55, 7549.
Moritomo, Y., Y. Tomioka, A. Asamitsu, Y. Tokura, and Y.Matsui, 1995, Phys. Rev. B 51, 3297.
Moriya, T., 1979, J. Magn. Magn. Mater. 14, 1.Moriya, T., 1985, Spin Fluctuations in Itinerant Electron Mag-
netism, Springer Series in Solid-State Sciences No. 56(Springer, Berlin).
Moriya, T., 1995, in Spectroscopy of Mott Insulators and Cor-related Metals, edited by A. Fujimori and Y. Tokura(Springer, Berlin), p. 66.
Moriya, T., and H. Hasegawa, 1980, J. Phys. Soc. Jpn. 48, 1490.Moriya, T., Y. Takahashi, and K. Ueda, 1990, J. Phys. Soc. Jpn.
59, 2905.Motome, Y., and M. Imada, 1996, J. Phys. Soc. Jpn. 65, 2135.Motome, Y., and M. Imada, 1997, J. Phys. Soc. Jpn. 66, 1872.
Rev. Mod. Phys., Vol. 70, No. 4, October 1998
Motome, Y., and M. Imada, 1998, cond-mat/9808124.Motoyama, N., H. Eisaki, and S. Uchida, 1996, Phys. Rev. Lett.
76, 3212.Mott, N. F., 1937, Proc. Phys. Soc. London, Ser. A 49, 72.Mott, N. F., 1949, Proc. Phys. Soc. London, Ser. A 62, 416.Mott, N. F., 1956, Can. J. Phys. 34, 1356.Mott, N. F., 1961, Philos. Mag. 6, 287.Mott, N. F., 1990, Metal-Insulator Transitions (Taylor and
Francis, London/Philadelphia).Muller-Hartman, E., 1989, Z. Phys. B 74, 507.Murakami, Y., H. Kawada, H. Kawata, M. Tanaka, T. Arima,
Y. Moritomo, and Y. Tokura, 1998, Phys. Rev. Lett. 80, 1932.Muramoto, S., Y. Kitaoka, K. Magishi, K. Ishida, K. Asayama,
M. Uehara, T. Nagata, and J. Akimitsu, 1997, unpublished.Mutou, T., and D. S. Hirashima, 1996, Phys. Rev. B 54, 9058.Mutou, T., H. Takahashi, and D. S. Hirashima, 1997, J. Phys.
Soc. Jpn. 66, 2781.Myron, H. W., 1980, Physica B 99, 243.Nagano, T., Y. Tomioka, Y. Nakayama, K. Kishio, and K. Ki-
tazawa, 1993, Phys. Rev. B 48, 9689.Nagaoka, Y., 1966, Phys. Rev. 147, 392.Nagaosa, N., 1997, unpublished.Nagaosa, N., and P. A. Lee, 1990, Phys. Rev. Lett. 64, 2450.Nagaosa, N., and P. A. Lee, 1997, cond-mat/9702103.Nagaosa, N., and T-K. Ng, 1995, Phys. Rev. B 51, 15588.Nagata, T., H. Fujino, J. Akimitsu, M. Nishi, K. Kakurai, and
S. Katano, 1998, private communication.Nagata, T., M. Uehara, J. Goto, J. Akimitsu, N. Motoyama, H.
Eisaki, S. Uchida, H. Takahashi, T. Nakanishi, and N. Mori,1998, Phys. Rev. Lett. 81, 1090.
Nakamura, M., A. Sekiyama, H. Namatame, A. Fujimori, H.Yoshihara, T. Ohtani, A. Misu, and M. Takano, 1994a, Phys.Rev. B 49, 16191.
Nakamura, M., A. Sekiyama, H. Namatame, H. Kino, A. Fuji-mori, A. Misu, H. Ikoma, M. Matoba, and S. Anzai, 1994b,Phys. Rev. Lett. 73, 2891.
Nakamura, M., H. Imai, and M. Shiga, 1997, Phys. Rev. Lett.79, 3779.
Nakano, T., M. Oda, C. Manabe, N. Momono, Y. Miura, andM. Ido, 1994, Phys. Rev. B 49, 16000.
Namatame, H., A. Fujimori, Y. Tokura, M. Nakamura, K.Yamaguchi, A. Misu, H. Matsubara, S. Suga, H. Eisaki, T.Ito, H. Takagi, and S. Uchida, 1990, Phys. Rev. B 41, 7205.
Narikiyo, O., 1996, Physica C 267, 204.Narikiyo, O., 1997, unpublished.Narikiyo, O., and K. Miyake, 1994, J. Phys. Soc. Jpn. 63, 4169.Nazarenko, A., K. J. E. Vos, S. Haas, E. Dagotto, and R. J.
Gooding, 1995, Phys. Rev. B 51, 8676.Negele, J. W., and H. Orland, 1988, Quantum Many-Particle
Systems (Addison Wesley, Redwood City, CA).Nersesyan, A. A., A. Luther, and F. V. Kusmartsev, 1993,
Phys. Lett. A 176, 363.Neumeier, J. J., A. L. Cornelius, and S. Schilling, 1994, Physica
B 198, 324.Neves, E. J., and J. F. Perez, 1986, Phys. Lett. A 114, 331.Newns, D. M., and N. Read, 1987, Adv. Phys. 36, 799.Nimkar, S., D. D. Sarma, and H. R. Krishnamurthy, 1993,
Phys. Rev. B 47, 10927.Nishida, N., et al., 1987, Jpn. J. Appl. Phys., Part 2 26, L1856.Nishihara, H., and M. Takano, 1981, J. Phys. Soc. Jpn. 50, 426.Nishikawa, T., S. Shamoto, M. Sera, M. Sato, S. Ohsugi, Y.
Kitaoka, and K. Asayama, 1993, Physica C 209, 553.

1258 Imada, Fujimori, and Tokura: Metal-insulator transitions
Nishikawa, T., J. Takeda, and M. Sato, 1993, J. Phys. Soc. Jpn.62, 2568.
Nishikawa, T., J. Takeda, and M. Sato, 1994, J. Phys. Soc. Jpn.63, 1441.
Nishikawa, T., Y. Yasui, Y. Kobayashi, and M. Sato, 1996, J.Phys. Soc. Jpn. 65, 2543.
Nishikawa, T., Y. Yasui, and M. Sato, 1994, J. Phys. Soc. Jpn.63, 3218.
Noack, R. M., N. Bulut, D. J. Scalapino, and M. G. Zacher,1997, Phys. Rev. B 56, 7162.
Norman, M. R., et al., 1997, cond-mat/9710163.Normand, B., H. Kohno, and H. Fukuyama, 1995, J. Phys. Soc.
Jpn. 64, 3903.Nozaki, A., H. Yoshikawa, T. Wada, H. Yamauchi, and S.
Tanaka, 1991, Phys. Rev. B 43, 181.Nozawa, K., M. Nohara, H. Takagi, Z. Hiroi, and M. Takano,
1997, in Advances in Superconductivity IX, edited by S. Na-kajima and M. Murakami (Springer-Verlag, Tokyo, 1997), p.69.
Nozieres, P., and S. Schmitt-Rink, 1985, J. Low Temp. Phys.59, 195.
Nucker, N., H. Romberg, X. X. Xi, J. Fink, B. Gegenheimer,and Z.-X. Zhao, 1989, Phys. Rev. B 39, 6619.
Obradors, X., L. M. Paulius, B. Maples, J. B. Torrance, A. I.Nazzal, J. Fontcuberta, and Y. Granados, 1993, Phys. Rev. B47, 12353.
Ogata, M., M. U. Luchini, and T. M. Rice, 1991, Phys. Rev. B44, 12083.
Ogata, M., and H. Shiba, 1990, Phys. Rev. B 41, 2326.Ogawa, S., 1979, J. Appl. Phys. 50, 2308.Ogawa, S., et al., 1974, Int. J. Magn. 5, 349.Oguchi, T., 1995, Phys. Rev. B 51, 1385.Oh, S.-J., J. W. Allen, and J. M. Lawrence, 1987, Phys. Rev. B
35, 2267.Oh, S.-J., J. W. Allen, I. Lindau, and J. C. Mikkelsen, 1982,
Phys. Rev. B 26, 4845.Ohata, N., and R. Kubo, 1970, J. Phys. Soc. Jpn. 28, 1402.Ohta, H., S. Kimura, E. Kulatov, S. V. Halilov, T. Nanba, M.
Motokawa, M. Sato, and K. Nagasaka, 1994, J. Phys. Soc. Jpn.63, 4206.
Ohta, Y., T. Tohyama, and S. Maekawa, 1991a, Phys. Rev. B43, 2968.
Ohta, Y., T. Tohyama, and S. Maekawa, 1991b, Phys. Rev.Lett. 66, 1228.
Ohtani, T., 1974, J. Phys. Soc. Jpn. 37, 701.Ohtani, T., K. Kosuge, and S. Kachi, 1970, J. Phys. Soc. Jpn.
28, 1588 (Part I); 29, 521 (Part II).Okabe, Y., and M. Kikuchi, 1988, J. Phys. Soc. Jpn. 57, 4351.Okada, K., A. Kotani, K. Maiti, and D. D. Sarma, 1996, J.
Phys. Soc. Jpn. 65, 1844.Okada, K., A. Kotani, and B. T. Thole, 1992, J. Electron Spec-
trosc. Relat. Phenom. 58, 325.Okada, K., T. Uozumi, and A. Kotani, 1994, J. Phys. Soc. Jpn.
63, 3176.Okimoto, Y., T. Katsufuji, T. Ishikawa, T. Arima, and Y.
Tokura, 1997, Phys. Rev. B 55, 4206.Okimoto, Y., T. Katsufuji, T. Ishikawa, A. Urushibara, T.
Arima, and Y. Tokura, 1995a, Phys. Rev. Lett. 75, 109.Okimoto, Y., T. Katsufuji, Y. Okada, T. Arima, and Y.
Tokura, 1995b, Phys. Rev. B 51, 9581.Okuno, Y., O. Narikiyo, and K. Miyake, 1997, J. Phys. Soc.
Jpn. 66, 2389.
Rev. Mod. Phys., Vol. 70, No. 4, October 1998
Olson, C. G., R. Liu, D. W. Lynch, R. S. List, A. J. Arko, B. W.Veal, Y. C. Chang, P. Z. Jiang, and A. P. Paulikas, 1990, Phys.Rev. B 42, 381.
Olson, C. G., R. Liu, A.-B. Yang, D. W. Lynch, A. J. Arko, R.S. List, B. W. Veal, Y. C. Chang, P. Z. Jiang, and A. P. Pau-likas, 1989, Science 245, 731.
Ong, N. P., 1990, in Properties of the High Temperature Super-conductors, edited by D. M. Ginsberg (World Scientific, Sin-gapore), Vol. 2, p. 459.
Ong, N. P., T. W. Jing, T. R. Chien, Z. Z. Wang, T. V. Ra-makrishnan, J. M. Tarascon, and K. Remschnig, 1991, PhysicaC 185-189, 34.
Ong, N. P., Z. Z. Wang, J. Clayhold, J. M. Tarascon, L. H.Greene, and W. R. McKinnon, 1987, Phys. Rev. B 35, 8807.
Onoda, M., T. Naka, and H. Nagasawa, 1991, J. Phys. Soc. Jpn.60, 2550.
Onoda, M., H. Ohta, and H. Nagasawa, 1991, Solid State Com-mun. 79, 281.
Orenstein, J., G. A. Thomas, A. J. Millis, S. L. Cooper, D. H.Rapkine, T. Timusk, L. F. Schneemeyer, and J. V. Waszczak,1990, Phys. Rev. B 42, 6342.
Osafune, T., N. Motoyama, H. Eisaki, and S. Uchida, 1997,Phys. Rev. Lett. 78, 1980.
Otsuka, H., 1990, J. Phys. Soc. Jpn. 59, 2916.Overhauser, A. W., 1962, Phys. Rev. 128, 1437.Panissod, P., G. Krill, C. Vettier, and R. Madar, 1979, Solid
State Commun. 29, 67.Park, C.-H., Z.-X. Shen, A. G. Loeser, D. S. Dessau, D. G.
Mandrus, A. Migliori, J. Sarrao, and Z. K. Fisk, 1995, Phys.Rev. B 52, R16981.
Park, J.-H., and J. W. Allen, 1997, unpublished.Park, J.-H., C. T. Chen, S.-W. Cheong, W. Bao, G. Meigs, V.
Chakarian, and Y. U. Idzerda, 1996, Phys. Rev. Lett. 76, 4215.Park, J.-H., L. H. Tjeng, J. W. Allen, P. Metcalf, and C. T.
Chen, 1997a, Phys. Rev. B 55, 12813.Park, J.-H., L. H. Tjeng, J. W. Allen, P. Metcalf, C. T. Chen, F.
M. F. de Groot, and G. A. Sawatzky, 1997b, unpublished.Park, K. T., K. Terakura, T. Oguchi, A. Yanase, and M. Ikeda,
1988, J. Phys. Soc. Jpn. 57, 3445.Park, S. K., T. Ishikawa, and Y. Tokura, 1998, Phys. Rev. B 58,
3717.Park, S. K., S. Yamaguchi, and Y. Tokura, 1998, unpublished.Pearson, A. D., 1958, J. Phys. Chem. Solids 5, 316.Peierls, R., 1937, Proc. Phys. Soc. London, Ser. A 49, 72.Pellegrin, E., N. Nucker, J. Fink, S. L. Molodtsov, A. Gutier-
rez, E. Navas, O. Strebel, Z. Hu, M. Domke, G. Kaindl, S.Uchida, Y. Nakamura, J. Markl, M. Klauda, G. Saemann-Ischenko, A. Krol, J. L. Peng, Z. Y. Li, and R. L. Greene,1993, Phys. Rev. B 47, 3354.
Pen, H. F., M. Abbate, A. Fujimori, Y. Tokura, H. Eisaki, S.Uchida, and G. A. Sawatzky, 1998 (unpublished).
Penn, D., 1966, Phys. Rev. 142, 350.Perdew, J. P., 1986, Phys. Rev. B 33, 8822.Perdew, J. P., and Y. Wang, 1986, Phys. Rev. B 33, 8800.Perdew, J. P., and A. Zunger, 1981, Phys. Rev. B 23, 5048.Perkins, J. D., J. M. Graybeal, M. A. Kastner, R. J. Birgeneau,
J. P. Falck, and M. Greven, 1993, Phys. Rev. Lett. 71, 1621.Perring, T., G. Aeppli, T. Kimura, and Y. Tokura, 1998, un-
published.Perring, T., G. Aeppli, Y. Moritomo, and Y. Tokura, 1998,
Phys. Rev. Lett. 78, 3197.Pethick, C. J., and G. M. Carneiro, 1973, Phys. Rev. A 7, 304.Pickett, W. E., 1989, Rev. Mod. Phys. 61, 433.

1259Imada, Fujimori, and Tokura: Metal-insulator transitions
Pickett, W. E., R. E. Cohen, and H. Krakauer, 1990, Phys.Rev. B 42, 8764.
Pickett, W. E., S. C. Erwin, and E. C. Ethridge, 1996, con-mat/9611225.
Pickett, W. E., and D. J. Singh, 1995, Europhys. Lett. 32, 759.Pines, D., and P. Nozieres, 1989, The Theory of Quantum Liq-
uids (Benjamin, New York).Poilblanc, D., and T. M. Rice, 1989, Phys. Rev. B 39, 9749.Pouget, J. P., H. Launois, J. P. D’Haenens, P. Merender, and
T. M. Rice, 1975, Phys. Rev. Lett. 35, 873.Pouget, J. P., H. Launois, T. M. Rice, P. Dernier, A. Gossard,
G. Villeneuve, and P. Hagenmuller, 1974, Phys. Rev. B 10,1801.
Preuss, R., W. Hanke, C. Grober, and H. G. Evertz, 1997,Phys. Rev. Lett. 79, 1122.
Preuss, R., W. Hanke, and W. von der Linden, 1995, Phys.Rev. Lett. 75, 1344.
Pruschke, Th., D. L. Cox, and M. Jarrell, 1993, Phys. Rev. B47, 3553.
Puchkov, A. V., P. Fournier, D. N. Basov, T. Timusk, A. Ka-pitulnik, and N. N. Kolesnikov, 1996, Phys. Rev. Lett. 77,3212.
Radaelli, P. G., D. G. Hinks, A. W. Mitchell, B. A. Hunter, J.L. Wagner, B. Dabrowski, K. G. Vandervoort, H. K.Viswanathan, and J. D. Jorgensen, 1994, Phys. Rev. B 49,4163.
Radaelli, P. G., J. D. Jorgensen, A. J. Schultz, J. L. Peng, andR. L. Greene, 1994, Phys. Rev. B 49, 15322.
Rado, G. T., and H. Suhl, 1963, Eds., Magnetism (Academic,New York) Vol. I, p. 25.
Ramirez, A. P., P. L. Gammel, S-W. Cheong, D. J. Bishop, andP. Chandra, 1996, Phys. Rev. Lett. 76, 447.
Reger, J. D., and A. P. Young, 1988, Phys. Rev. B 37, 5978.Renner, C., et al., 1998, Phys. Rev. Lett. 80, 149.Rice, T. M., 1995, in Spectroscopy of Mott Insulators and Cor-
rrelated Metals, edited by A. Fujimori and Y. Tokura(Springer, Berlin), p. 221.
Rice, T. M., and W. R. Brinkman, 1972, Phys. Rev. B 5, 4350.Rice, T. M., S. Gapalan, and M. Sigrist, 1993, Europhys. Lett.
23, 445.Rice, T. M., H. Launois, and J. P. Pouget, 1994, Phys. Rev.
Lett. 73, 3042.Rice, T. M., and M. Sigrist, 1996, J. Phys.: Condens. Matter 7,
L643.Rice, T. M., and F. C. Zhang, 1989, Phys. Rev. B 39, 815.Robey, S. W., V. E. Henrich, C. Eylem, and B. W. Eichhorn,
1995, Phys. Rev. B 52, 2395.Robey, S. W., L. T. Hudson, C. Eylem, and B. W. Eichorn,
1993, Phys. Rev. B 48, 562.Romberg, H., M. Alexander, N. Nucker, P. Adelmann, and J.
Fink, 1990, Phys. Rev. B 42, 8768.Rossat-Mignod, J., et al., 1991a, Physica B 169, 58.Rossat-Mignod, J., L. P. Regnault, C. Vettier, P. Bourges, P.
Burlet, J. Bossy, J. Y. Henry, and G. Lapertot, 1991b, PhysicaC 185-189, 86.
Roth, L. M., 1966, Phys. Rev. 149, 306.Roth, L. M., 1967, J. Appl. Phys. 38, 1065.Rotter, L. D., et al., 1991, Phys. Rev. Lett. 67, 2741.Rozenberg, M. J., 1996a, Phys. Rev. B 55, 4855.Rozenberg, M. J., 1996b, Preprint No. cond-mat/9612089.Rozenberg, M. J., I. H. Inoue, H. Makino, F. Iga, and Y. Nishi-
hara, 1996, Preprint No. cond-mat/9603051.
Rev. Mod. Phys., Vol. 70, No. 4, October 1998
Rozenberg, M. J., G. Kotliar, H. Kajueter, G. A. Thomas, D.H. Rapkine, J. M. Honig, and P. Metcalf, 1995, Phys. Rev.Lett. 75, 105.
Rozenberg, M. J., G. Kotliar, and X. Y. Zhang, 1994, Phys.Rev. B 49, 10181.
Rozenberg, M. J., X. Y. Zhang, and G. Kotliar, 1992, Phys.Rev. Lett. 69, 1236.
Sachan, V., D. J. Buttrey, J. M. Tranquada, J. E. Lorenzo, andG. Shirane, 1995, Phys. Rev. B 51, 12742.
Saitoh, T., A. E. Bocquet, T. Mizokawa, and A. Fujimori,1995a, Phys. Rev. B 52, 7934.
Saitoh, T., A. E. Bocquet, T. Mizokawa, H. Namatame, A.Fujimori, M. Abbate, Y. Takeda, and M. Takano, 1995b,Phys. Rev. B 51, 13942.
Saitoh, T., T. Mizokawa, A. Fujimori, M. Abbate, Y. Takeda,and M. Takano, 1997a, Phys. Rev. B 55, 4257.
Saitoh, T., T. Mizokawa, A. Fujimori, M. Abbate, Y. Takeda,and M. Takano, 1997b, Phys. Rev. B 56, 1290.
Saitoh, T., A. Sekiyama, T. Mizokawa, A. Fujimori, K. Ito, H.Nakamura, and M. Shiga, 1995, Solid State Commun. 95, 307.
Sakai, O., and Y. Kuramoto, 1994, Solid State Commun. 89,307.
Sakai, T., G. Adachi, and J. Shiokawa, 1977, J. Appl. Phys. 48,379.
Sarma, D. D., S. R. Barman, H. Kajueter, and G. Kotliar, 1996,Europhys. Lett. 36, 307.
Sarma, D. D., N. Shanthi, S. R. Barman, N. Hamada, H.Sawada, and K. Terakura, 1995, Phys. Rev. Lett. 75, 1126.
Sarma, D. D., N. Shanthi, S. R. Krishnakumar, T. Saitoh, T.Mizokawa, A. Sekiyama, K. Kobayashi, A. Fujimori, E. We-schke, R. Meier, G. Kaindl, Y. Takeda, and M. Takano, 1996,Phys. Rev. B 53, 6873.
Satpathy, S., Z. S. Popovic, and F. R. Vukajlovic, 1996, Phys.Rev. Lett. 76, 960.
Sawada, H., N. Hamada, K. Terakura, and T. Asada, 1996,Phys. Rev. B 53, 12742.
Sawatzky, G. A., and J. W. Allen, 1984, Phys. Rev. Lett. 53,2339.
Sawatzky, G. A., and D. Post, 1979, Phys. Rev. B 20, 1546.Sayer, M., R. Chen, R. Fletcher, and A. Mansingh, 1975, J.
Phys. C 8, 2053.Sayetat, F., M. Ghedira, J. Chenavas, and M. Marezio, 1982, J.
Phys. C 15, 1627.Scalapino, D. J., 1990, in High Temperature Superconductivity:
Proceedings—The Los Alamos Symposium 1989, edited byK. S. Bedell, D. Coffey, D. E. Meltzer, David Pines, and Rob-ert Schrieffer (Addison-Wesley, Redwood City, CA), p. 400.
Scalapino, D. J., 1994, in Proceedings of the InternationalSchool of Physics, Enrico Fermi, Course CXXI, edited by R.A. Broglia and J. R. Schrieffer (North-Holland, Amsterdam),p. 95.
Scalapino, D. J., 1995, Phys. Rep. 250, 329.Scalapino, D. J., S. R. White, and S. Zhang, 1993, Phys. Rev. B
47, 7995.Scalettar, R. T., D. J. Scalapino, R. L. Sugar, and D. Toussaint,
1989, Phys. Rev. B 39, 4711.Schiffer, P., A. P. Ramirez, W. Bao, and S.-W. Cheong, 1995,
Phys. Rev. Lett. 75, 3336.Schiller, A., and K. Ingersent, 1995, Phys. Rev. Lett. 75, 113.Schlesinger, Z., R. T. Collins, F. Holtzberg, C. Feild, S. H.
Blanton, U. Welp, G. W. Crabtree, Y. Fang, and J. Z. Liu,1990, Phys. Rev. Lett. 65, 801.

1260 Imada, Fujimori, and Tokura: Metal-insulator transitions
Schlesinger, Z., R. T. Collins, L. D. Rotter, F. Holtzberg, C.Feild, U. Welp, G. W. Crabtree, J. Z. Liu, Y. Fang, K. G.Vandervoort, and S. Fleshler, 1994, Physica C 235-240, 49.
Schlesinger, Z., Z. Fisk, H.-T. Zhang, M. B. Maple, J. F. Di-Tusa, and G. Aeppli, 1993, Phys. Rev. Lett. 71, 1748.
Schultz, A. J., J. D. Jorgensen, J. L. Peng, and R. L. Greene,1996, Phys. Rev. B 53, 5157.
Schulz, H. J., 1989, J. Phys. (Paris) 50, 2833.Schulz, H. J., 1990a, Phys. Rev. Lett. 64, 1445.Schulz, H. J., 1990b, Phys. Rev. Lett. 64, 2831.Schulz, H. J., 1990c, Phys. Rev. Lett. 65, 2462.Schulz, H. J., 1991, Int. J. Mod. Phys. B 5, 57.Searle, C. W., and S. T. Wang, 1969, Can. J. Phys. 47, 2703.Sega, I., and P. Prelovsek, 1990, Phys. Rev. B 42, 892.Sekiyama, A., A. Fujimori, S. Aonuma, H. Sawa, and R. Kato,
1995, Phys. Rev. B 51, 13899.Shastry, B. S., B. I. Shraiman, and R. R. P. Singh, 1993, Phys.
Rev. Lett. 70, 2004.Shastry, B. S., and B. Sutherland, 1990, Phys. Rev. Lett. 65,
243.Shen, Z.-X., J. W. Allen, J. J. Yeh, J.-S. Kang, W. Ellis, W.
Spicer, I. Lindau, M. B. Maple, Y. D. Dalichaouch, M. S.Torikachvili, J. Z. Sun, and T. H. Geballe, 1987, Phys. Rev. B36, 8414.
Shen, Z.-X., and D. S. Dessau, 1995, Phys. Rep. 253, 1.Shen, Z.-X., R. S. List, D. S. Dessau, B. O. Wells, O. Jepsen,
A. J. Arko, R. Barttlet, C. K. Shih, F. Parmigiani, J. C.Huang, and P. A. P. Lindberg, 1991a, Phys. Rev. B 44, 3604.
Shen, Z.-X., D. S. Dessau, B. O. Wells, C. G. Olson, D. B.Mitzi, L. Lombardo, R. S. List, and A. J. Arko, 1991b, Phys.Rev. B 44, 12098.
Shepherd, J. P., J. W. Koenitzer, R. Aragon, C. J. Sanberg, andJ. M. Honig, 1985, Phys. Rev. B 31, 1107.
Shiba, H., R. Shiina, and A. Takahashi, 1997, J. Phys. Soc. Jpn.66, 941.
Shiina, R., T. Nishitani, and H. Shiba, 1997, J. Phys. Soc. Jpn.66, 3159.
Shikano, M., T.-K. Huang, Y. Inaguma, M. Itoh, and T. Naka-mura, 1994, Solid State Commun. 90, 115.
Shin, S., S. Suga, M. Taniguchi, M. Fujisawa, H. Kanzaki, A.Fujimori, H. Daimon, Y. Ueda, K. Kosuge, and S. Kachi,1990, Phys. Rev. B 41, 4993.
Shin, S., Y. Tezuka, T. Kinoshita, T. Ishii, T. Kashiwakura, M.Takahashi, and Y. Suda, 1995, J. Phys. Soc. Jpn. 64, 1230.
Si, Q., and G. Kotliar, 1993, Phys. Rev. B 48, 13881.Si, Q., Y. Zha, K. Levin, and J. P. Lu, 1993, Phys. Rev. B 47,
9055.Siegrist, T., L. F. Schneemeyer, S. A. Sunshine, and J. V.
Waszczak, 1988, Mater. Res. Bull. 23, 1429.Singh, D. J., 1994, Phys. Rev. B 49, 1580.Singh, D. J., 1995, Phys. Rev. B 52, 1358.Singh, D. J., 1996, J. Appl. Phys. 79, 4818.Singh, D. J., and W. E. Pickett, 1991, Phys. Rev. B 44, 7715.Siratori, K., S. Suga, M. Taniguchi, K. Soda, S. Kimura, and A.
Yanase, 1986, J. Phys. Soc. Jpn. 55, 690.Siratori, K., S. Todo, and S. Kimura, 1988, J. Phys. Soc. Jpn. 57,
2093.Sjostrand, M. E., and P. H. Keesom, 1973, Phys. Rev. B 7,
3558.Slater, J. C., 1951, Phys. Rev. 82, 538.Slater, J. C., 1974, Quantum Theory of Molecules and Solids
(McGraw-Hill, New York).Smith, K. E., and V. E. Henrich, 1988, Phys. Rev. B 38, 5965.
Rev. Mod. Phys., Vol. 70, No. 4, October 1998
Smith, K. E., and V. E. Henrich, 1994, Phys. Rev. B 50, 1382.Solovyev, I., N. Hamada, and K. Terakura, 1996a, Phys. Rev.
Lett. 76, 4825.Solovyev, I., N. Hamada, and K. Terakura, 1996b, Phys. Rev.
B 53, 7158.Solyom, J., 1979, Adv. Phys. 28, 201.Sommerfeld, A., 1928, Z. Phys. 47, 1.Sorella, S., R. Car, S. Baroni, and M. Parrinello, 1989, Euro-
phys. Lett. 8, 663.So”rensen, E. S., M. Wallin, S. M. Girvin, and A. P. Young,
1992, Phys. Rev. Lett. 69, 828.Sparks, J. T., and T. Komoto, 1967, Phys. Lett. 25, 398.Sparks, J. T., and T. Komoto, 1968, Rev. Mod. Phys. 40, 752.Sreedhar, K., J. M. Honig, M. Darwin, M. McElfresh, P. M.
Shand, J. Xu, B. C. Crooker, and J. Spalek, 1992, Phys. Rev.B 46, 6382.
Stafford, C. A., and A. J. Millis, 1993, Phys. Rev. B 48, 1409.Stechel, E. B., and D. R. Jennison, 1998, Phys. Rev. B 38, 4632.Stephan, W., and P. Horsch, 1990, Phys. Rev. B 42, 8736.Stephan, W., and P. Horsch, 1991, Phys. Rev. Lett. 66, 2258.Stephan, W., and P. Horsch, 1992, Int. J. Mod. Phys. B 6, 589.Sternlieb, B. J., J. P. Hill, U. C. Wildgruber, G. M. Luke, B.
Nachumi, Y. Moritomo, and Y. Tokura, 1996, Phys. Rev.Lett. 76, 2169.
Sternlieb, B. J., G. Shirane, J. M. Tranquada, M. Sato, and S.Shamoto, 1993, Phys. Rev. B 47, 5320.
Sternlieb, B. J., J. M. Tranquada, G. Shirane, M. Sato, and S.Shamoto, 1994, Phys. Rev. B 50, 12915.
Sugano, S., Y. Tanabe, and H. Kamimura, 1970, Multiplets ofTransition-Metal Ions in Crystals (Academic, New York).
Susaki, T., A. Sekiyama, K. Kobayashi, T. Mizokawa, A. Fuji-mori, M. Tsunekawa, T. Muro, T. Matsushita, S. Suga, H.Ishii, T. Hanyu, A. Kimura, H. Namatame, M. Taniguchi, T.Miyahara, F. Iga, M. Kasaya, and H. Harima, 1996, Phys.Rev. Lett. 77, 4269.
Suzuki, K., K. Kishio, T. Hasegawa, and K. Kitazawa, 1990,Physica C 166, 357.
Suzuki, M., 1976, Prog. Theor. Phys. 56, 1454.Suzumura, Y., Y. Hasegawa, and H. Fukuyama, 1988, J. Phys.
Soc. Jpn. 57, 2768.Suzuura, H., and N. Nagaosa, 1997, Phys. Rev. B 56, 3548.Suzuura, H., H. Yasuhara, A. Furusaki, N. Nagaosa, and Y.
Tokura, 1996, Phys. Rev. Lett. 76, 2579.Svane, A., and O. Gunnarsson, 1988a, Europhys. Lett. 7, 171.Svane, A., and O. Gunnarsson, 1988b, Phys. Rev. B 37, 9919.Svane, A., and O. Gunnarsson, 1990, Phys. Rev. Lett. 65, 1148.Swendsen, R. H., and J. S. Wang, 1987, Phys. Rev. Lett. 58, 86.Tachiki, M., T. Koyama, and S. Takahashi, 1994, Phys. Rev. B
50, 7065.Taguchi, Y., Y. Tokura, T. Arima, and F. Inaba, 1993, Phys.
Rev. B 48, 511.Tajima, K., Y. Endoh, J. E. Fischer, and G. Shirane, 1988,
Phys. Rev. B 38, 6954.Tajima, S., 1997, Superconductivity Review (Gordon and
Breach Science Publishers, in press).Tajima, S., J. Schutzmann, and S. Miyamoto, 1995, Solid State
Commun. 95, 759.Takagi, H., B. Batlogg, H. L. Kao, J. Kwo, R. J. Cava, J. J.
Krajewski, and W. F. Peck, Jr., 1992a, Phys. Rev. Lett. 69,2975.
Takagi, H., R. J. Cava, M. Marezio, B. Batlogg, J. J. Krajewski,W. F. Peck, Jr., P. Bordet, and D. E. Cox, 1992b, Phys. Rev.Lett. 68, 3777.

1261Imada, Fujimori, and Tokura: Metal-insulator transitions
Takagi, H., H. Eisaki, S. Uchida, and R. J. Cava, 1995, in Spec-troscopy of Mott Insulator and Correlated Metals, edited byA. Fujimori and Y. Tokura (Springer, Berlin), p. 185.
Takagi, H., T. Ido, S. Ishibashi, M. Uota, S. Uchida, and Y.Tokura, 1989, Phys. Rev. B 40, 2254.
Takagi, H., S. Uchida, K. Kitazawa, and S. Tanaka, 1987, Jpn.J. Appl. Phys., Part 2 26, L123.
Takagi, H., S. Uchida, and Y. Tokura, 1989, Phys. Rev. Lett.62, 1197.
Takagi, S., H. Yasuoka, S. Ogawa, and J. H. Wernick, 1981, J.Phys. Soc. Jpn. 50, 2539.
Takahashi, M., 1972, Prog. Theor. Phys. 47, 69.Takahashi, M., 1989, Phys. Rev. B 40, 2494.Takahashi, M., and J. Igarashi, 1996, Ann. Phys. (N.Y.) 5, 247.Takahashi, M., and J. Kanamori, 1991, J. Phys. Soc. Jpn. 60,
3154.Takahashi, T., H. Matsuyama, H. Katayama-Yoshida, Y. Ok-
abe, S. Hosoya, K. Seki, H. Fujimoto, M. Sato, and H. Inoku-chi, 1989, Phys. Rev. B 39, 6636.
Takahashi, Y., and T. Moriya, 1979, J. Phys. Soc. Jpn. 46, 1452.Takano, M., H. Kosugi, N. Nakanishi, M. Shimada, T. Wada,
and M. Koizumi, 1977, J. Phys. Soc. Jpn. 43, 1101.Takano, M., S. Nasu, T. Abe, K. Yamamoto, S. Endo, Y.
Takeda, and J. B. Goodenough, 1991, Phys. Rev. Lett. 67,3267.
Takano, M., and Y. Takeda, 1983, Bull. Inst. Chem. Res.,Kyoto Univ. 61, 406.
Takeda, J., T. Nishikawa, and M. Sato, 1993, J. Phys. Soc. Jpn.62, 2571.
Takeda, J., et al., 1994, J. Phys. Soc. Jpn. 63, 3564.Takegahara, K., 1994, J. Electron Spectrosc. Relat. Phenom.
66, 303.Takenaka, K., K. Mizuhashi, H. Takagi, and S. Uchida, 1994,
Phys. Rev. B 50, 6534.Takigawa, M., E. T. Ahrens, and Y. Ueda, 1996, Phys. Rev.
Lett. 76, 283.Takigawa, M., P. C. Hammel, R. H. Heffner, Z. Fisk, J. L.
Smith, and R. B Schwarz, 1989, Phys. Rev. B 39, 300.Takigawa, M., and D. B. Mitzi, 1994, Phys. Rev. Lett. 73, 1287.Takigawa, M., A. P. Reyes, P. C. Hammel, J. D. Thompson, R.
H. Heffner, Z. Fisk, and K. C. Ott, 1991, Phys. Rev. B 43, 247.Tamasaku, K., Y. Nakamura, and S. Uchida, 1992, Phys. Rev.
Lett. 69, 1455.Tanabe, T., A. Katsufuji, and Y. Tokura, 1998, unpublished.Tanamoto, T., H. Kohno, and H. Fukuyama, 1992, J. Phys.
Soc. Jpn. 61, 1886.Tanamoto, T., H. Kohno, and H. Fukuyama, 1993, J. Phys.
Soc. Jpn. 62, 717.Tanamoto, T., H. Kohno, and H. Fukuyama, 1994, J. Phys.
Soc. Jpn. 63, 2739.Taniguchi, S., T. Nishikawa, Y. Yasui, Y. Kobayashi, M. Sato,
T. Nishioka, M. Kontani, and K. Sano, 1995, J. Phys. Soc. Jpn.64, 2758.
Temmerman, W. M., Z. Szotek, and H. Winter, 1993, Phys.Rev. B 47, 11533.
Terakura, K., 1987 (unpublished).Terakura, K., T. Oguchi, A. R. Williams, and J. Kubler, 1984,
Phys. Rev. B 30, 4734.Thio, T., and J. W. Bennett, 1994, Phys. Rev. B 50, 10574.Thio, T., T. R. Thurston, N. W. Preyer, P. J. Picone, M. A.
Kastner, H. P. Jenssen, D. R. Gabbe, C. Y. Chen, R. J. Bir-geneau, and A. Aharony, 1988, Phys. Rev. B 38, 905.
Rev. Mod. Phys., Vol. 70, No. 4, October 1998
Thomas, G. A., J. Orenstein, D. H. Rapkine, M. Capizzi, A. J.Millis, R. N. Bhatt, L. F. Schneemeyer, and J. V. Waszczak,1988, Phys. Rev. Lett. 61, 1313.
Thomas, G. A., D. H. Rapkine, S. A. Carter, A. J. Millis, T. F.Rosenbaum, P. Metcalf, and J. M. Honig, 1994, Phys. Rev.Lett. 73, 1529.
Thomas, G. A., D. H. Rapkine, S. L. Cooper, S-W. Cheong,and A. S. Cooper, 1991, Phys. Rev. Lett. 67, 2906.
Thouless, D. J., 1974, Phys. Rep., Phys. Lett. 13C, 94.Thuler, M. R., R. L. Benbow, and Z. Hurych, 1983, Phys. Rev.
B 27, 2082.Thurston, T. R., R. J. Birgeneau, M. A. Kastner, N. W. Preyer,
G. Shirane, Y. Fujii, K. Yamada, Y. Endoh, K. Kakurai, M.Matsuda, Y. Hidaka, and T. Murakami, 1989, Phys. Rev. B40, 4585.
Thurston, T. R., P. M. Gehring, G. Shirane, R. J. Birgeneau,M. A. Kastner, Y. Endoh, M. Matsuda, K. Yamada, H.Kojima, and I. Tanaka, 1992, Phys. Rev. B 46, 9128.
Thurston, T. R., M. Matsuda, K. Kakurai, K. Yamada, Y. En-doh, R. J. Birgeneau, P. M. Gehring, Y. Hidaka, M. A. Kast-ner, T. Murakami, and G. Shirane, 1990, Phys. Rev. Lett. 65,263.
Tobin, J. G., C. G. Olson, C. Gu, J. Z. Liu, F. R. Solal, M. J.Fluss, R. H. Howell, J. C. O’Brien, H. B. Radousky, and P. A.Sterne, 1992, Phys. Rev. B 45, 5563.
Tohyama, T., and S. Maekawa, 1992, Physica C 191, 193.Tokunaga, M., N. Miura, Y. Tomioka, and Y. Tokura, 1997,
Phys. Rev. B 57, 5259.Tokura, Y., 1992a, Jpn. J. Appl. Phys. Ser. 7, 14.Tokura, Y., 1992b, Comments Condens. Matter Phys. 16, 69.Tokura, Y., 1994, Physica C 235-240, 138.Tokura, Y., 1997, unpublished.Tokura, Y., and T. Arima, 1990, Jpn. J. Appl. Phys., Part 2 29,
2388.Tokura, Y., S. Koshihara, T. Arima, H. Takagi, S. Ishibashi, T.
Ido, and S. Uchida, 1990, Phys. Rev. B 41, 11657.Tokura, Y., H. Kuwahara, Y. Moritomo, Y. Tomioka, and A.
Asamitsu, 1996a, Phys. Rev. Lett. 76, 3184.Tokura, Y., Y. Okimoto, S. Yamaguchi, H. Taniguchi, T.
Kimura, and H. Takagi, 1998, Phys. Rev. B 58, R1699.Tokura, Y., Y. Taguchi, Y. Okada, Y. Fujishima, T. Arima, K.
Kumagai, and Y. Iye, 1993, Phys. Rev. Lett. 70, 2126.Tokura, Y., H. Takagi, and S. Uchida, 1989, Nature (London)
337, 345.Tokura, Y., Y. Tomioka, H. Kuwahara, A. Asamitsu, Y. Mori-
tomo, and M. Kasai, 1996b, J. Appl. Phys. 79, 5288.Tokura, Y., J. B. Torrance, T. C. Huang, and A. I. Nazzal,
1988, Phys. Rev. B 38, 7156.Tokura, Y., A. Urushibara, Y. Moritomo, T. Arima, A.
Asamitsu, G. Kido, and N. Furukawa, 1994, J. Phys. Soc. Jpn.63, 3931.
Tomioka, Y., A. Asamitsu, H. Kuwahara, Y. Moritomo, andY. Tokura, 1996, Phys. Rev. B 53, R1689.
Tomioka, Y., A. Asamitsu, Y. Moritomo, and Y. Tokura, 1995,J. Phys. Soc. Jpn. 64, 3626.
Tomonaga, S., 1950, Prog. Theor. Phys. 5, 349.Torrance, J. B., P. Lacorre, C. Asavaroengchai, and R. M.
Metzger, 1991, Physica C 182, 351.Torrance, J. B., P. Lacorre, A. I. Nazzal, E. J. Ansaldo, and C.
Niedermayer, 1992, Phys. Rev. B 45, 8209.Tranquada, J. M., et al., 1988, Phys. Rev. Lett. 60, 156.Tranquada, J. M., D. J. Buttrey, V. Sachan, and J. E. Lorenzo,
1993, Phys. Rev. Lett. 73, 1003.

1262 Imada, Fujimori, and Tokura: Metal-insulator transitions
Tranquada, J. M., J. E. Lorenzo, D. J. Buttrey, and V. Sachan,1995, Phys. Rev. B 52, 3581.
Tranquada, J. M., B. J. Sternlieb, J. D. Axe, Y. Nakamura, andS. Uchida, 1995, Nature (London) 375, 561.
Tranquada, J. M., P. Wochner, and D. J. Buttrey, 1997, Phys.Rev. Lett. 79, 2133.
Trotter, H. F., 1959, Proc. Am. Math. Soc. 10, 545.Troyer, M., H. Tsunetsugu, and D. Wurtz, 1994, Phys. Rev. B
50, 13515.Tsuda, N., K. Nasu, A. Yanase, and K. Siratori, 1991, Elec-
tronic Conduction in Oxides (Springer, Berlin).Tsuei, C. C., A. Gupta, and G. Koren, 1989, Physica C 161,
415.Tsujioka, T., T. Mizokawa, A. Fujimori, and Y. Tokura, 1997,
unpublished.Tsunetsugu, H., and M. Imada, 1997, J. Phys. Soc. Jpn. 66,
1876.Tsunetsugu, H., and M. Imada, 1998, J. Phys. Soc. Jpn. 67,
1864.Tsunetsugu, H., M. Troyer, and T. M. Rice, 1994, Phys. Rev. B
49, 16078.Tyler, J. M., and J. L. Fry, 1971, Phys. Rev. B 1, 4601.Uchida, S., T. Ido, H. Takagi, T. Arima, Y. Tokura, and S.
Tajima, 1991, Phys. Rev. B 43, 7942.Uchida, S., H. Takagi, Y. Tokura, N. Koshihara, and T. Arima,
1989, in Strong Correlation and Superconductivity, edited byH. Fukuyama, S. Maekawa, and A. P. M. Malozemoff(Springer, Berlin), p. 194.
Ueda, K., 1977, J. Phys. Soc. Jpn. 43, 1497.Ueda, Y., K. Kosuge, and S. Kachi, 1980, J. Solid State Chem.
31, 171.Ueda, Y., K. Kosuge, S. Kachi, and T. Takada, 1979, J. Phys.
(Paris), Colloq. C2, 275.Uehara, M., T. Nagata, J. Akimitsu, E. Iiseki, N. Motoyama, S.
Uchida, and R. Eccleston, 1997, unpublished.Uehara, M., T. Nagata, J. Akimitsu, H. Takahashi, N. Mori,
and K. Kinoshita, 1996, J. Phys. Soc. Jpn. 65, 2764.Uemura, Y. J., et al., 1989, Phys. Rev. Lett. 62, 2317.Uemura, Y. J., et al., 1991, Phys. Rev. Lett. 66, 2665.Ulmke, M., R. T. Scalettar, A. Nazarenko, and E. Dagotto,
1996, Phys. Rev. B 54, 16523.Uozumi, T., K. Okada, and A. Kotani, 1993, J. Phys. Soc. Jpn.
62, 2595.Uozumi, T., K. Okada, A. Kotani, Y. Tezuka, and S. Shin,
1996, J. Phys. Soc. Jpn. 65, 1150.Uozumi, T., K. Okada, A. Kotani, R. Zimmermann, P. Steiner,
S. Hufner, Y. Tezuka, and S. Shin, 1997, J. Electron Spec-trosc. Relat. Phenom. 83, 9.
Urushibara, A., Y. Moritomo, T. Arima, A. Asamitsu, G.Kido, and Y. Tokura, 1995, Phys. Rev. B 51, 14103.
Usuki, T., N. Kawakami, and A. Okiji, 1989, Phys. Lett. A 135,476.
Vaknin, D., S. K. Sinha, D. E. Moncton, D. C. Johnston, J. M.Newsam, C. R. Safinya, and H. E. King, Jr., 1987, Phys. Rev.Lett. 58, 2802.
van der Heide, H., R. Hemmel, C. F. van Bruggen, and C.Haas, 1980, J. Solid State Chem. 33, 17.
van der Laan, G., C. Westra, and G. A. Sawatzky, 1981, Phys.Rev. B 23, 4369.
van Dongen, P. G. J., 1991, Mod. Phys. Lett. B 5, 861.van Elp, J., R. H. Potze, H. Eskes, R. Berger, and G. A. Sa-
watzky, 1991, Phys. Rev. B 44, 1530.
Rev. Mod. Phys., Vol. 70, No. 4, October 1998
van Santen, J. H., and G. H. Jonker, 1950, Physica (Amster-dam) 16, 337; 16, 599.
van Veenendaal, M. A., G. A. Sawatzky, and W. A. Groen,1994, Phys. Rev. B 49, 1407.
Van Zandt, L. L., J. M. Honig, and J. B. Goodenough, 1968, J.Appl. Phys. 39, 594.
Varma, C. M., 1996a, Phys. Rev. B 54, 7328.Varma, C. M., 1996b, Preprint No. cond-mat/9606086.Varma, C. M., P. B. Littlewood, S. Schmitt-Rink, E. Abra-
hams, and A. E. Ruckenstein, 1989, Phys. Rev. Lett. 63, 1996;64, 497(E).
Varma, C. M., S. Schmitt-Rink, and E. Abrahams, 1987, SolidState Commun. 62, 681.
Vasanthacharya, N. Y., P. Ganguly, J. B. Goodenough, and C.N. R. Rao, 1984, J. Phys. C 17, 2745.
Verges, J. A., E. Louis, P. S. Lomdahl, F. Guinea, and A. R.Bishop, 1991, Phys. Rev. B 43, 6099.
Verwey, E. J. W., 1939, Nature (London) 144, 327.Verwey, E. J. W., and P. W. Haaymann, 1941, Physica (Am-
sterdam) 8, 979.Verwey, E. J. W., P. W. Haaymann, and F. C. Romeijn, 1947,
J. Chem. Phys. 15, 174, 181.Vilk, Y. M., L. Chen, and A.-M. S. Tremblay, 1994, Phys. Rev.
B 49, 13267.Villeneuve, G., M. Drillon, and P. Hagenmuller, 1973, Mater.
Res. Bull. 8, 1111.Virosztek, A., and J. Ruvalds, 1990, Phys. Rev. B 42, 4064.Visscher, P. B., 1974, Phys. Rev. B 10, 943.Voit, J., 1993, J. Phys.: Condens. Matter 5, 8305.Vojta, T., D. Belitz, R. Narayanan, and T. R. Kirkpatrick,
1996, Europhys. Lett. 36, 191.Vollhardt, D., 1984, Rev. Mod. Phys. 56, 99.von Barth, U., and L. Hedin, 1972, J. Phys. C 5, 1629.von der Linden, W., 1992, Phys. Rep. 220, 53.von Lohneysen, H., 1996, J. Phys.: Condens. Matter 8, 9689.Wada, H., G. Mori, H. Imai, and M. Shiga, 1997, Physica B
237-238, 146.Wada, N., Y. Nakamura, and K. Kumagai, 1991, Physica C
185-189, 1177.Wagner, J., W. Hanke, and D. J. Scalapino, 1991, Phys. Rev. B
43, 10517.Wallin, M., E. S. Sorensen, S. M. Girvin, and A. P. Young,
1994, Phys. Rev. B 49, 12115.Wang, Z. Z., T. R. Chien, N. P. Ong, J. M. Tarascon, and E.
Wang, 1991, Phys. Rev. B 43, 3020.Warren, W. W., Jr., R. E. Walstedt, G. F. Brennert, R. J. Cava,
R. Tycko, R. F. Bell, and G. Dabbagh, 1989, Phys. Rev. Lett.62, 1193.
Watanabe, H., H. Yamamoto, and K. Ito, 1963, J. Phys. Soc.Jpn. 18, 995.
Watanabe, I., K. Kumagai, Y. Nakamura, and H. Nakajima,1990, J. Phys. Soc. Jpn. 59, 1932.
Watanabe, T., N. Mori, and T. Mitsui, 1976, Solid State Com-mun. 19, 837.
Wegner, F., 1976, Z. Phys. B 25, 327.Wegner, F., 1979, Z. Phys. B 35, 207.Wells, B. O., Z.-X. Shen, A. Matsuura, D. M. King, M. A.
Kastner, M. Greven, and R. J. Birgeneau, 1995, Phys. Rev.Lett. 74, 964.
Wen, X.-G., and P. A. Lee, 1996, Phys. Rev. Lett. 76, 503.Wentzcovitch, R. M., W. W. Schulz, and P. B. Allen, 1994,
Phys. Rev. Lett. 72, 3389.Werfel, F., G. Drager, and U. Berg, 1981, Cryst. Res. Technol.
16, 119.

1263Imada, Fujimori, and Tokura: Metal-insulator transitions
Werthheim, G. K., V. A. Jaccarino, J. H. Wernick, J. A.Seitchik, H. J. WIlliams, and R. C. Sherwood, 1965, Phys.Lett. 18, 89.
Wheatley, J. M., T. C. Hsu, and P. W. Anderson, 1988, Phys.Rev. B 37, 5897.
White, R. M., and N. F. Mott, 1971, Philos. Mag. 24, 845.White, S. R., 1992, Phys. Rev. B 46, 5678.White, S. R., 1993, Phys. Rev. B 48, 10345.White, S. R., and D. J. Scalapino, 1996, Preprint No.
cond-mat/9605143.White, S. R., D. J. Scalapino, R. L. Sugar, E. Y. Loh Jr., J. E.
Gubernatis, and R. T. Scalettar, 1989, Phys. Rev. B 40, 506.Wilson, A. H., 1931a, Proc. R. Soc. London, Ser. A 133, 458.Wilson, A. H., 1931b, Proc. R. Soc. London, Ser. A 134, 277.Wilson, J. A., 1985, in The Metallic and Nonmetallic States of
Matter, edited by P. P. Edwards and C. N. R. Rao (Taylor andFrancis, London), p. 215.
Wilson, J. A., and G. D. Pitt, 1971, Philos. Mag. 23, 1297.Wilson, K. G., 1975, Rev. Mod. Phys. 47, 773.Wolfe, R., J. H. Wernick, and S. E. Haszko, 1965, Phys. Lett.
19, 449.Wollan, E. O., and W. C. Koehlar, 1955, Phys. Rev. 100, 545.Woodfield, B. F., M. L. Wilson, and J. M. Byers, 1997, Phys.
Rev. Lett. 78, 3201.Xu, X. Q., J. L. Peng, Z. Y. Li, H. L. Ju, and R. L. Greene,
1993, Phys. Rev. B 48, 1112.Yamada, K., et al., 1987, Solid State Commun. 64, 753.Yamada, K., et al., 1998, Phys. Rev. B 57, 6165.Yamada, K., Y. Endoh, C.-H. Lee, S. Wakimoto, M. Arai, K.
Ubukata, M. Fujita, S. Hosoya, and S. M. Bennington, 1995,J. Phys. Soc. Jpn. 64, 2742.
Yamada, K., K. Kakurai, Y. Endoh, T. R. Thurston, M. A.Kastner, R. J. Birgeneau, G. Shirane, Y. Hidaka, and T. Mu-rakami, 1989, Phys. Rev. B 40, 4557.
Yamada, K., J. Wada, Y. Endoh, S. Hosoya, S. Noguchi, S.Kawamata, and K. Okuda, 1995, Physica C 253, 135.
Yamada, K., S. Wakimoto, G. Shirane, C. H. Lee, M. A. Kast-ner, S. Hosoya, M. Greven, Y. Endoh, and R. J. Birgeneau,1995, Phys. Rev. Lett. 75, 1626.
Yamada, K., and K. Yosida, 1986, Prog. Theor. Phys. 76, 621.Yamada, Y., O. Hino, S. Nohdo, R. Kanao, T. Inami, and S.
Katano, 1996, Phys. Rev. Lett. 77, 904.Yamada, Y., M. Mori, Y. Noda, and M. Izumi, 1979, Solid
State Commun. 32, 827.Yamaguchi, S., Y. Okimoto, H. Taniguchi, and Y. Tokura,
1996a, Phys. Rev. B 53, 2926.Yamaguchi, S., Y. Okimoto, and Y. Tokura, 1996b, Phys. Rev.
B 54, R11022.Yamaguchi, S., Y. Okimoto, and Y. Tokura, 1997, Phys. Rev.
B 55, R8666.Yamaguchi, S., and Y. Tokura, 1998, unpublished.
Rev. Mod. Phys., Vol. 70, No. 4, October 1998
Yamaji, K., and Y. Shimoi, 1994, Physica C 222, 349.Yamamoto, A., M. Onoda, E. Takayama-Muromachi, F.
Izumi, T. Ishigaki, and H. Asano, 1990, Phys. Rev. B 42, 4228.Yamane, H., Y. Miyazaki, and H. Hirai, 1990, J. Ceram. Soc.
Jpn. 98, 105.Yanase, A., and K. Siratori, 1984, J. Phys. Soc. Jpn. 53, 312.Yasuhara, H., and Y. Tokura, 1998, unpublished.Yasui, Y., T. Nishikawa, Y. Kobayashi, M. Sato, T. Nishioka,
and M. Kontani, 1995, J. Phys. Soc. Jpn. 64, 3890.Yasuoka, H., T. Imai, and T. Shimizu, 1989, in Strong Corre-
lation and Superconductivity, edited by H. Fukuyama, S.Maekawa, and A. P. Malozemoff (Springer, Berlin), 1989, p.254.
Yokoya, T., A. Chainani, T. Takahashi, H. Ding, J. C. Campu-zano, H. Katayama-Yoshida, M. Kasai, and Y. Tokura, 1996a,Phys. Rev. B 54, 13311.
Yokoya, T., A. Chainani, T. Takahashi, H. Katayama-Yoshida,M. Kasai, and Y. Tokura, 1996b, Phys. Rev. Lett. 76, 3009.
Yokoyama, H., and H. Shiba, 1987a, J. Phys. Soc. Jpn. 56,1490.
Yokoyama, H., and H. Shiba, 1987b, J. Phys. Soc. Jpn. 56,3582.
Yoshioka, D., 1989a, J. Phys. Soc. Jpn. 58, 32.Yoshioka, D., 1989b, J. Phys. Soc. Jpn. 58, 1516.Yoshizawa, H., H. Kawano, Y. Tomioka, and Y. Tokura, 1995,
Phys. Rev. B 52, R13145.Yoshizawa, H., S. Mitsuda, H. Kitazawa, and K. Tatsumata,
1988, J. Phys. Soc. Jpn. 57, 3686.Yoshizawa, H., et al., 1998, unpublished.Yunoki, S., J. Hu, A. L. Malvezzi, A. Moreo, N. Furukawa,
and E. Dagotto, 1998, Phys. Rev. Lett. 80, 845.Zaanen, J., and O. Gunnarsson, 1989, Phys. Rev. B 40, 7391.Zaanen, J., and P. B. Littlewood, 1994, Phys. Rev. B 50, 7222.Zaanen, J., and A. M. Oles, 1996, Ann. Phys. (Leipzig) 5, 224.Zaanen, J., and G. A. Sawatzky, 1990, J. Phys. Chem. Solids
88, 8.Zaanen, J., G. A. Sawatzky, and J. W. Allen, 1985, Phys. Rev.
Lett. 55, 418.Zener, C., 1951, Phys. Rev. 82, 403.Zeyer, R., and G. Zwicknagl, 1988, Solid State Commun. 66,
617.Zhang, F. C., and T. M. Rice, 1988, Phys. Rev. B 37, 3759.Zhang, S. C., 1997, Science 275, 4126.Zhang, S., J. Carlson, and J. E. Gubernatis, 1997, Phys. Rev. B
55, 7464.Zhang, S., N. Kawashima, J. Carlson, and J. E. Gubernatis,
1995, Phys. Rev. Lett. 74, 1500.Zhang, X. Y., M. J. Rozenberg, and G. Kotliar, 1993, Phys.
Rev. Lett. 70, 1666.Zhang, Z., and S. Satpathy, 1991, Phys. Rev. B 44, 13319.Zotos, X., and P. Prelovsek, 1996, Phys. Rev. B 53, 983.