metric and process benchmarking for utility · pdf filemetric and process benchmarking for...
TRANSCRIPT
© WRc plc 2006
Metric and ProcessBenchmarking for Utility
OptimisationDavid Milnes
Water Research Centre
© WRc plc 2006
Content
• First, an overview of metric and process benchmarking
• Second, a description of regulatory benchmarking inEngland and Wales
© WRc plc 2006
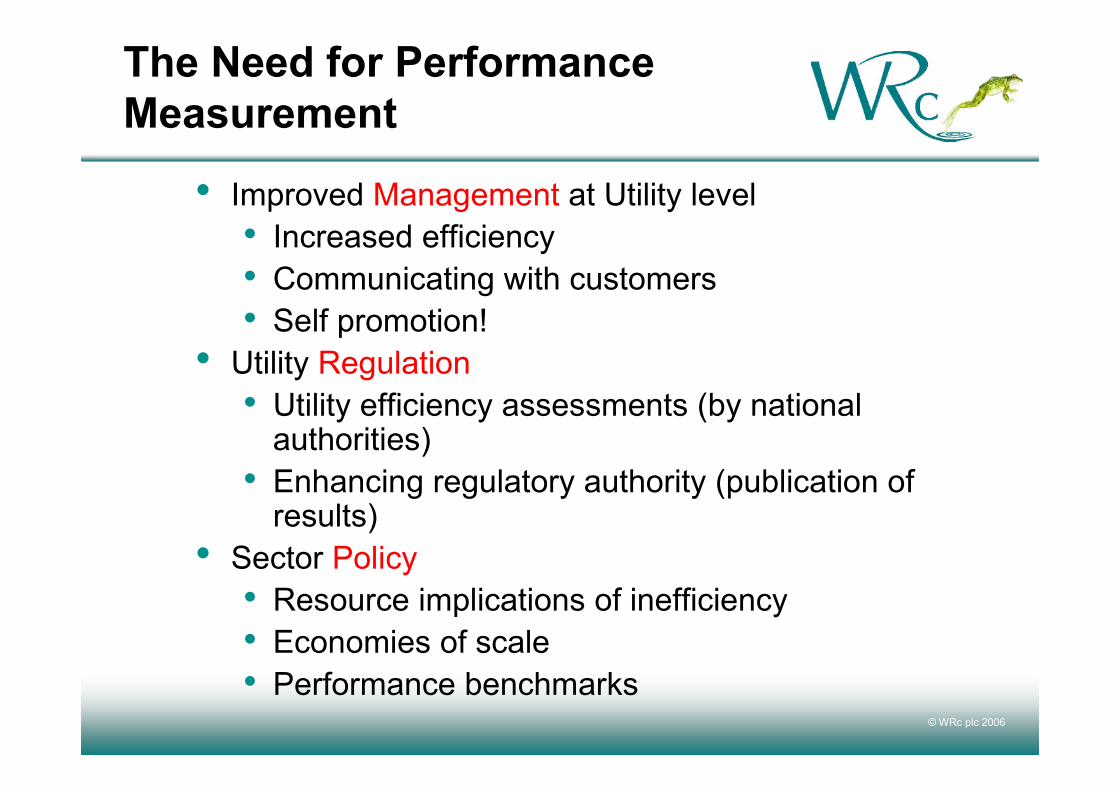
The Need for PerformanceMeasurement
• Improved Management at Utility level• Increased efficiency• Communicating with customers• Self promotion!
• Utility Regulation• Utility efficiency assessments (by national
authorities)• Enhancing regulatory authority (publication of
results)• Sector Policy
• Resource implications of inefficiency• Economies of scale• Performance benchmarks

© WRc plc 2006
What Types of BenchmarkingExist?• Metric Benchmarking;
• numerical measurement of performance levels andcomparison with other water undertakings to identifyareas needing improvement (e.g. staffingnumbers/connection, % leakage level, % supply coverage, etc)
• Process Benchmarking• identification of failing key processes and comparison
with best-in-class organisations to learn best practice.Direct and open relationships with other selectedpartner companies. (billing and collection process,management of mains maintenance, etc)
© WRc plc 2006
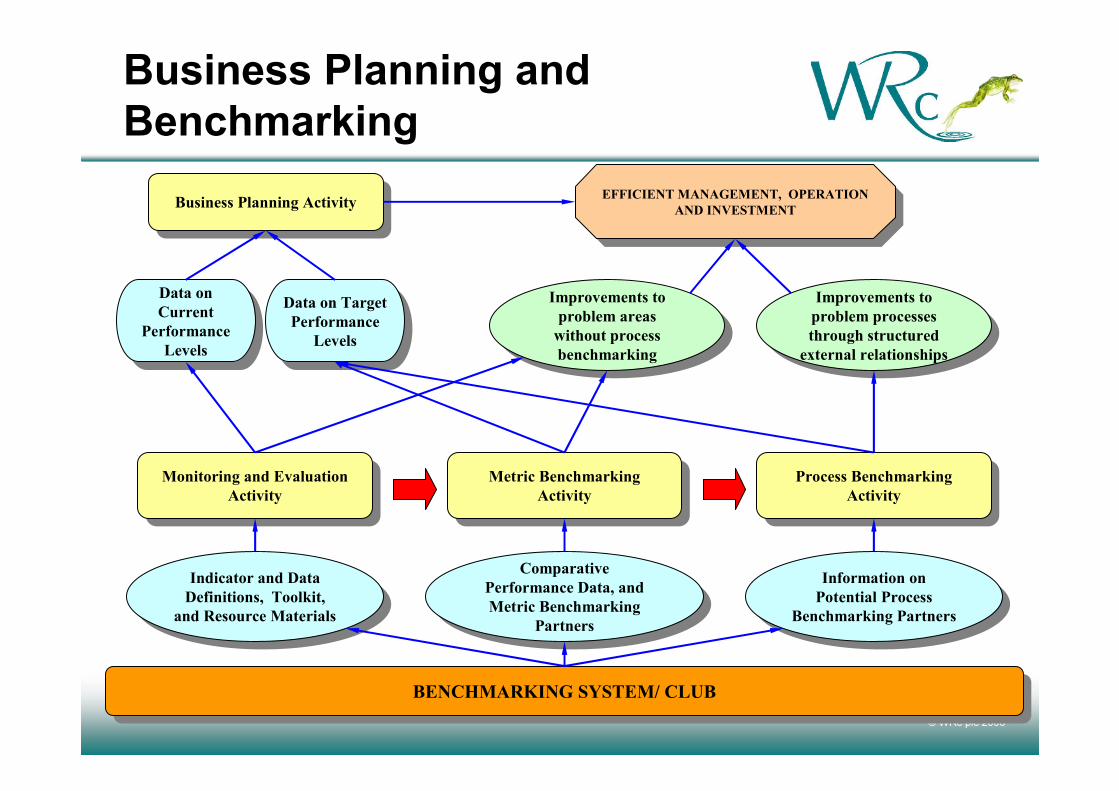
Business Planning andBenchmarking
BENCHMARKING SYSTEM/ CLUBBENCHMARKING SYSTEM/ CLUB
ComparativePerformance Data, andMetric Benchmarking
Partners
ComparativePerformance Data, andMetric Benchmarking
Partners
Improvements toproblem processesthrough structured
external relationships
Improvements toproblem processesthrough structured
external relationships
Information onPotential Process
Benchmarking Partners
Information onPotential Process
Benchmarking Partners
Metric BenchmarkingActivity
Metric BenchmarkingActivityMonitoring and Evaluation
ActivityMonitoring and Evaluation
Activity Process BenchmarkingActivity
Process BenchmarkingActivity
Indicator and DataDefinitions, Toolkit,
and Resource Materials
Indicator and DataDefinitions, Toolkit,
and Resource Materials
Improvements toproblem areas
without processbenchmarking
Improvements toproblem areas
without processbenchmarking
EFFICIENT MANAGEMENT, OPERATIONAND INVESTMENT
EFFICIENT MANAGEMENT, OPERATIONAND INVESTMENTBusiness Planning ActivityBusiness Planning Activity
Data onCurrent
PerformanceLevels
Data onCurrent
PerformanceLevels
Data on TargetPerformance
Levels
Data on TargetPerformance
Levels

© WRc plc 2006
How is benchmarkingorganised?
• By utilities and utility associations• By regulators• By International Funding Agencies
• Public schemes or private benchmarking clubs• Sub-national, national, international membership
• One-off projects or long-term arrangements
© WRc plc 2006
Metric Benchmarking
Metric benchmarking provides:
• Identification of those areas where there is an apparentperformance gap
• An understanding of explanatory factors, such as physicalcharacteristics, geography, weather, population, all key tounderstanding the apparent performance gap, and mayadd to or diminish that gap, generating a real performancegap.
• All metric benchmarking data should therefore be treatedwith a degree of caution and not necessarily taken at facevalue.
© WRc plc 2006
What performance indicators areused (IWA, IBNET, and bespoke)?
• Service Coverage• Water Production and
Consumption• Non-Revenue Water• Metering• Network Performance• Operating Costs and Staff
• Quality of Service• Affordability• Billings and Collections• Financial Performance• Process Indicators• Assets
© WRc plc 2006
Plenty of metric benchmarkinginitiatives in Europe
• Baltics• England & Wales – performance comparison part of
regulatory process• Scotland – integrated into the new regulatory regime
and providing the targets for improvement• Portugal – being integrated into regulatory regime• EU – national schemes in Netherlands, Denmark,
Sweden; specific projects in Austria, Czech Rep,France, Germany
• Lithuania – improving regulatory understanding andcapacity
© WRc plc 2006
And plenty of benchmarkinginitiatives around world
• South America – ADERESA Initiatives• Canada/USA – Water Benchmarking Initiatives• Australia – WSSA regulatory process• Africa – SPBNET from Water Utilities Partnership• South Asia – WSPSA development• Philippines –Small Towns benchmarking• Indonesia – PERPAMSI initiative• Vietnam – joint World Bank/VWSA initiative• South Pacific – joint energy/water benchmarking• SEAWUN – regional initiative• IBNET – world-wide
© WRc plc 2006
Process benchmarking
• Examines identified weak processes in conjunction withprocess benchmarking partners, and seeks improvement.
• Partners may be outside of water industry.• Best performance for own organisation may not be equal to
best performance as determined by metric benchmarkingof your peer, but rather the best that can be achieved theparticular circumstances and constraints that exist for you.
© WRc plc 2006
Examples of Processes
• Customer service• Revenue Collection• Debt Management• Capital procurement• Sewage treatment plants• Renovation of sewers
• Maintenance• Laboratories• R&D• Information Systems• Energy Management• Asset management
© WRc plc 2006
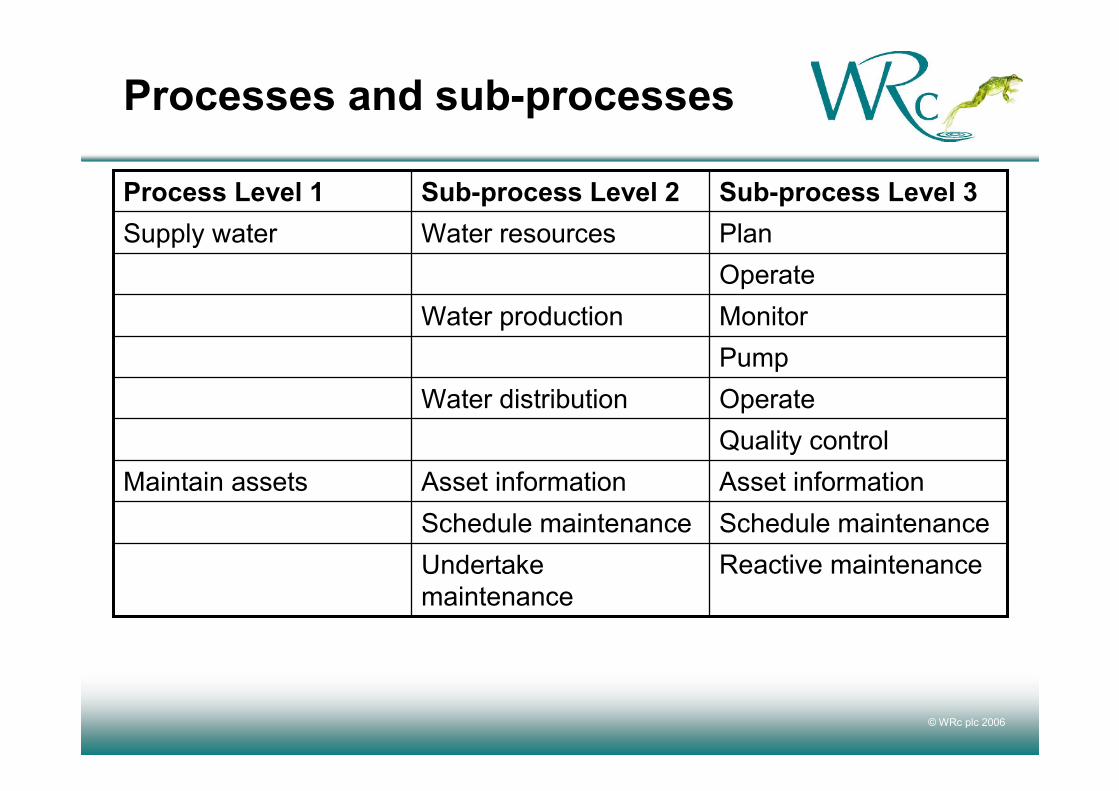
Processes and sub-processes
Reactive maintenanceUndertakemaintenance
Schedule maintenanceSchedule maintenanceAsset informationAsset informationMaintain assetsQuality controlOperateWater distributionPumpMonitorWater productionOperatePlanWater resourcesSupply waterSub-process Level 3Sub-process Level 2Process Level 1
© WRc plc 2006
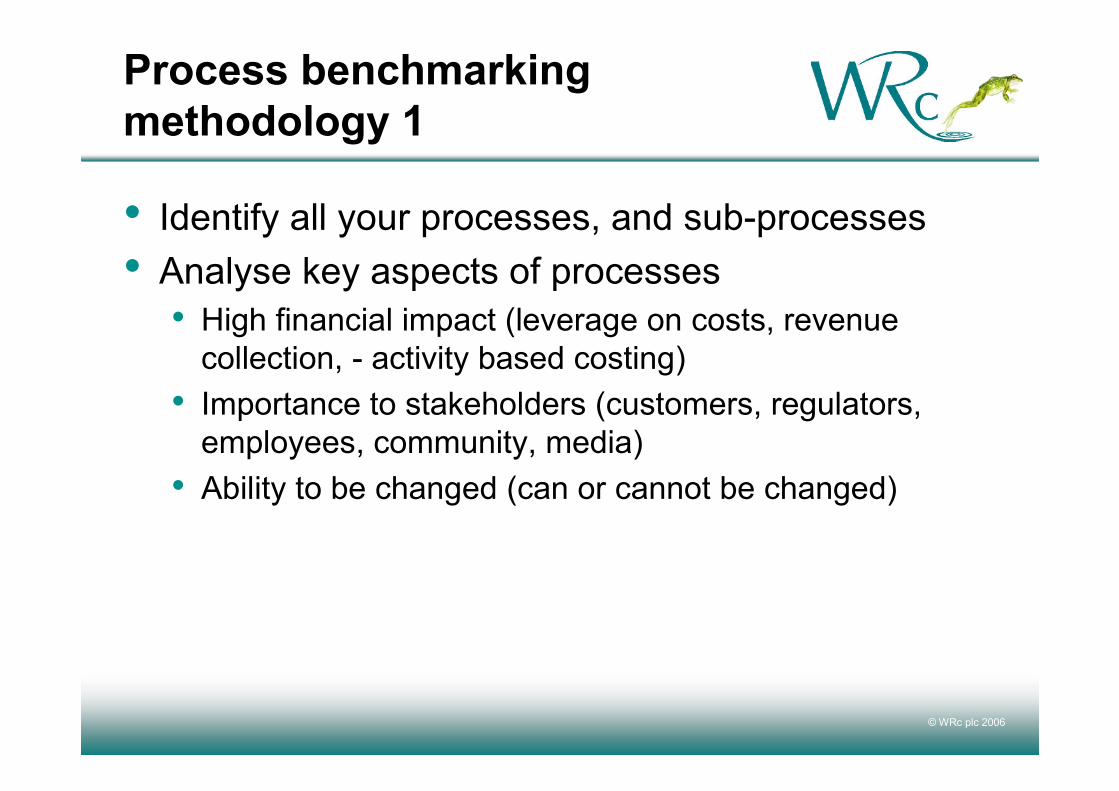
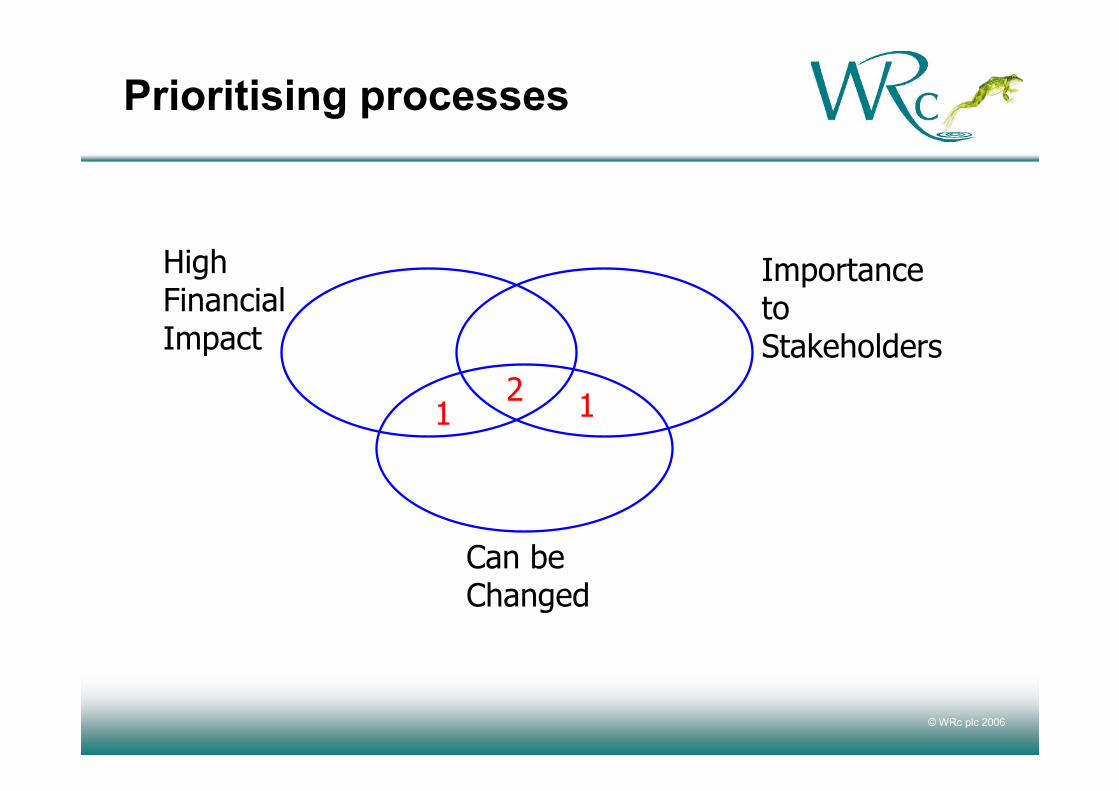
Process benchmarkingmethodology 1• Identify all your processes, and sub-processes• Analyse key aspects of processes
• High financial impact (leverage on costs, revenuecollection, - activity based costing)
• Importance to stakeholders (customers, regulators,employees, community, media)
• Ability to be changed (can or cannot be changed)
© WRc plc 2006
Prioritising processes
HighFinancialImpact
Can beChanged
ImportancetoStakeholders
1 12
© WRc plc 2006
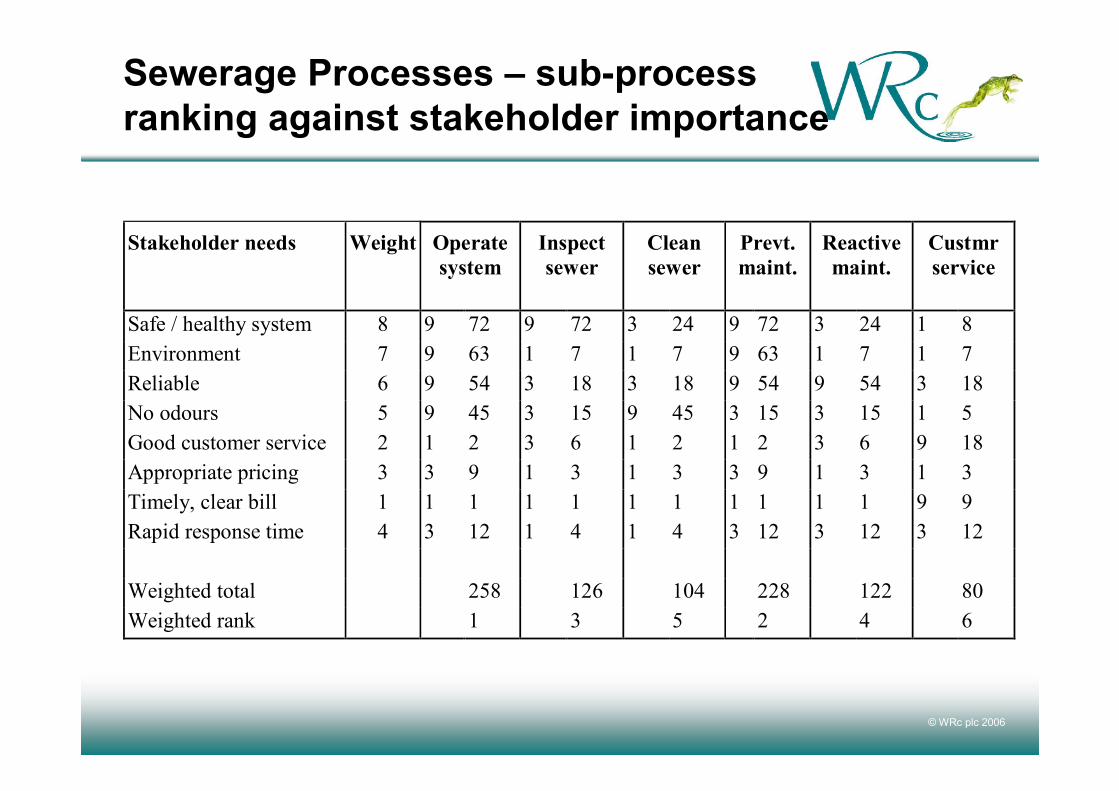
Sewerage Processes – sub-processranking against stakeholder importance
Stakeholder needs Weight Operatesystem
Inspectsewer
Cleansewer
Prevt.maint.
Reactivemaint.
Custmrservice
Safe / healthy system 8 9 72 9 72 3 24 9 72 3 24 1 8Environment 7 9 63 1 7 1 7 9 63 1 7 1 7Reliable 6 9 54 3 18 3 18 9 54 9 54 3 18No odours 5 9 45 3 15 9 45 3 15 3 15 1 5Good customer service 2 1 2 3 6 1 2 1 2 3 6 9 18Appropriate pricing 3 3 9 1 3 1 3 3 9 1 3 1 3Timely, clear bill 1 1 1 1 1 1 1 1 1 1 1 9 9Rapid response time 4 3 12 1 4 1 4 3 12 3 12 3 12
Weighted total 258 126 104 228 122 80Weighted rank 1 3 5 2 4 6
© WRc plc 2006
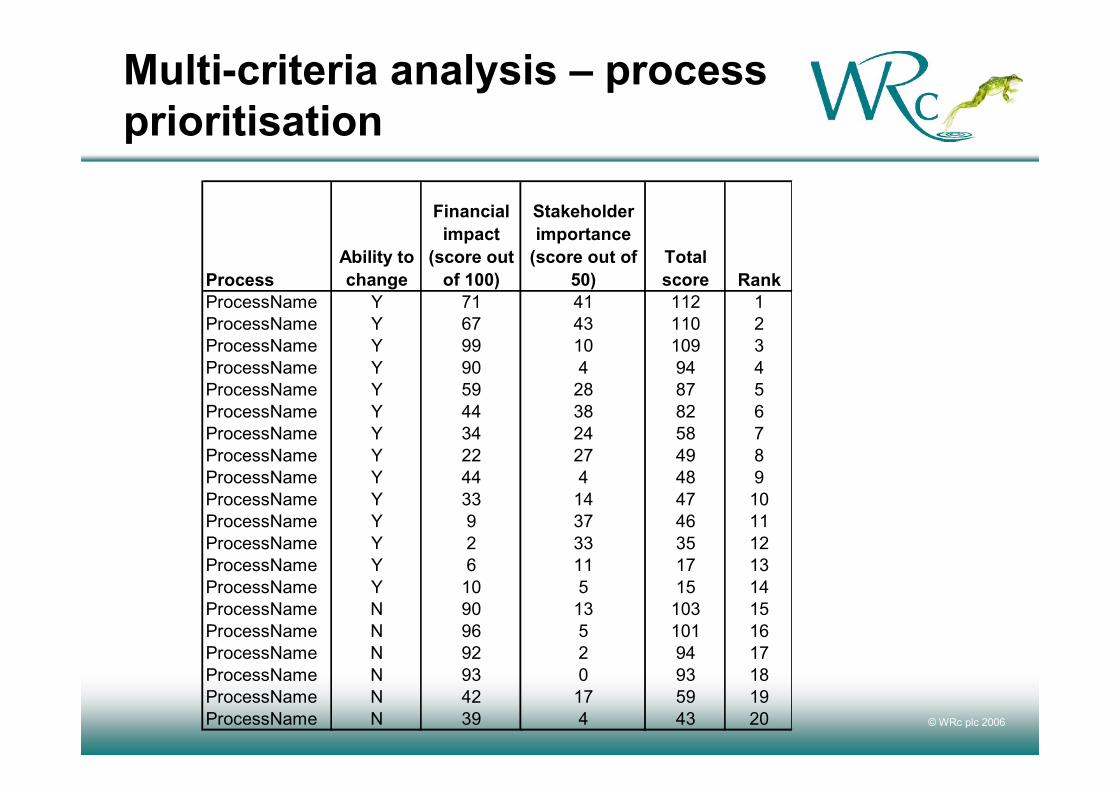
Multi-criteria analysis – processprioritisation
ProcessAbility tochange
Financialimpact
(score outof 100)
Stakeholderimportance
(score out of50)
Totalscore Rank
ProcessName Y 71 41 112 1ProcessName Y 67 43 110 2ProcessName Y 99 10 109 3ProcessName Y 90 4 94 4ProcessName Y 59 28 87 5ProcessName Y 44 38 82 6ProcessName Y 34 24 58 7ProcessName Y 22 27 49 8ProcessName Y 44 4 48 9ProcessName Y 33 14 47 10ProcessName Y 9 37 46 11ProcessName Y 2 33 35 12ProcessName Y 6 11 17 13ProcessName Y 10 5 15 14ProcessName N 90 13 103 15ProcessName N 96 5 101 16ProcessName N 92 2 94 17ProcessName N 93 0 93 18ProcessName N 42 17 59 19ProcessName N 39 4 43 20
© WRc plc 2006
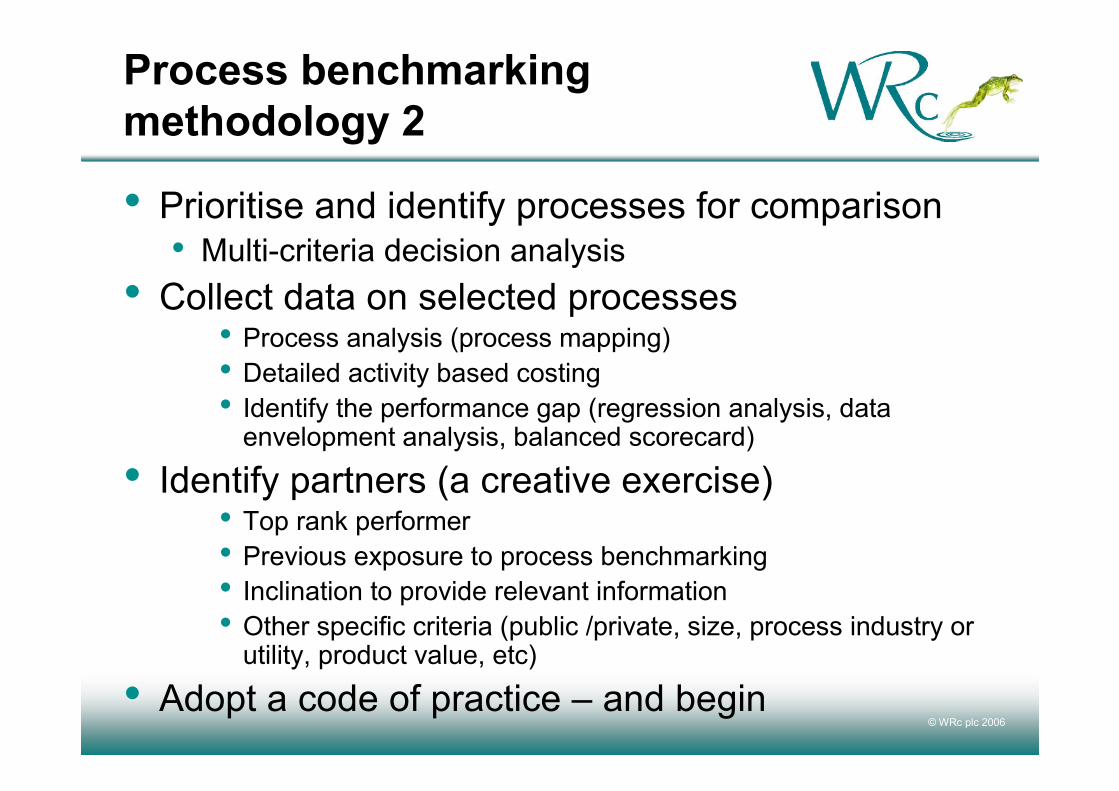
Process benchmarkingmethodology 2• Prioritise and identify processes for comparison
• Multi-criteria decision analysis• Collect data on selected processes
• Process analysis (process mapping)• Detailed activity based costing• Identify the performance gap (regression analysis, data
envelopment analysis, balanced scorecard)• Identify partners (a creative exercise)• Top rank performer• Previous exposure to process benchmarking• Inclination to provide relevant information• Other specific criteria (public /private, size, process industry or
utility, product value, etc)• Adopt a code of practice – and begin
© WRc plc 2006
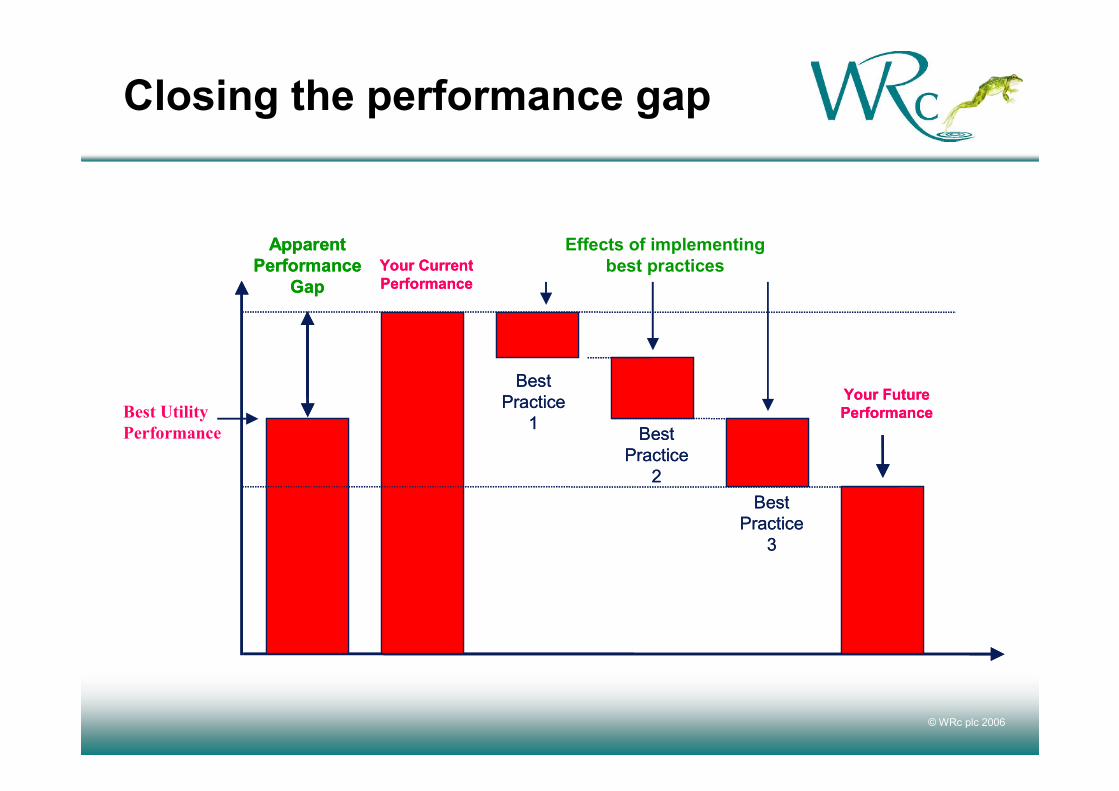
Closing the performance gap
ApparentPerformance
GapYour CurrentPerformance
BestPractice
1
BestPractice
3
BestPractice
2
Your FuturePerformance
ApparentPerformance
GapYour CurrentPerformance
BestPractice
1
BestPractice
3
BestPractice
2
Your FuturePerformanceBest Utility
Performance
Effects of implementingbest practices
© WRc plc 2006
Example – A US Water Utility
Problem Area:• To improve the process used to track the status of
customer complaints relating to non-emergency waterleaks.
Difficulties with:• Multiple work orders relating to the same complaint.• Work orders getting misplaced or misdirected during the
hand-over from one unit to another.
© WRc plc 2006
Partners
• A Hospital - system and procedures utilised to trackand maintain up-to-date patient records.
• A Cable TV Company – management of customercalls related to service failures.
• A Sanitary Commission - combined customer callcentre/crew dispatch/work order tracking system.
© WRc plc 2006
Outcome
• Improvement of procedures at the customer callcentre.
• Development of a centralised customer databasesystem and work-order tracking system.
• Re-engineering of distribution to facilitate a district-specific case management programme.
• Reduced the number of duplicate work-orders.• Reduced costs associated with unnecessary
inspections.
© WRc plc 2006
Example – A UK Water Utility
Problem Area:
• Overall asset maintenance methodologies
© WRc plc 2006
The Partners
• Two petrol retail companies• An engineering contractor• An oil & gas company• Two UK water supply companies
© WRc plc 2006
Outcome
Scope for improvement was identified in:
• Maintenance strategy development• Pump maintenance• Reliability improvement• Asset life extension• Proactive maintenance• Life cycle supply and service contracts
© WRc plc 2006
Regulatory Benchmarking inEngland and Wales• Current structure introduced in England & Wales in
1989 with privatisation• 22 Water Companies (10 water and sewerage
companies - service pops 1.2 to 7.4 million, 14 wateronly companies - service pops 92k to 2.4 million)
• Licensed companies – 25 years• They own and operate assets• Make profit and pay dividends to shareholders• Regulated by three regulators (economic (Ofwat),
environment (EA) and water quality (DWI))• Price setting - price cap, incentive based• A 5 year tariff setting cycle

© WRc plc 2006
Comparative Competition• “Normal” market competitor pressure helps to keep prices
as low as possible• “Monopoly” market for water:
• competition is developing (slowly and not effectively)• shareholder pressure is to reduce costs
• Ofwat developed indicators to assess:• unit operating & capital costs/regional/company-
specific factors• standards of service achieved (technical and
customer)
© WRc plc 2006
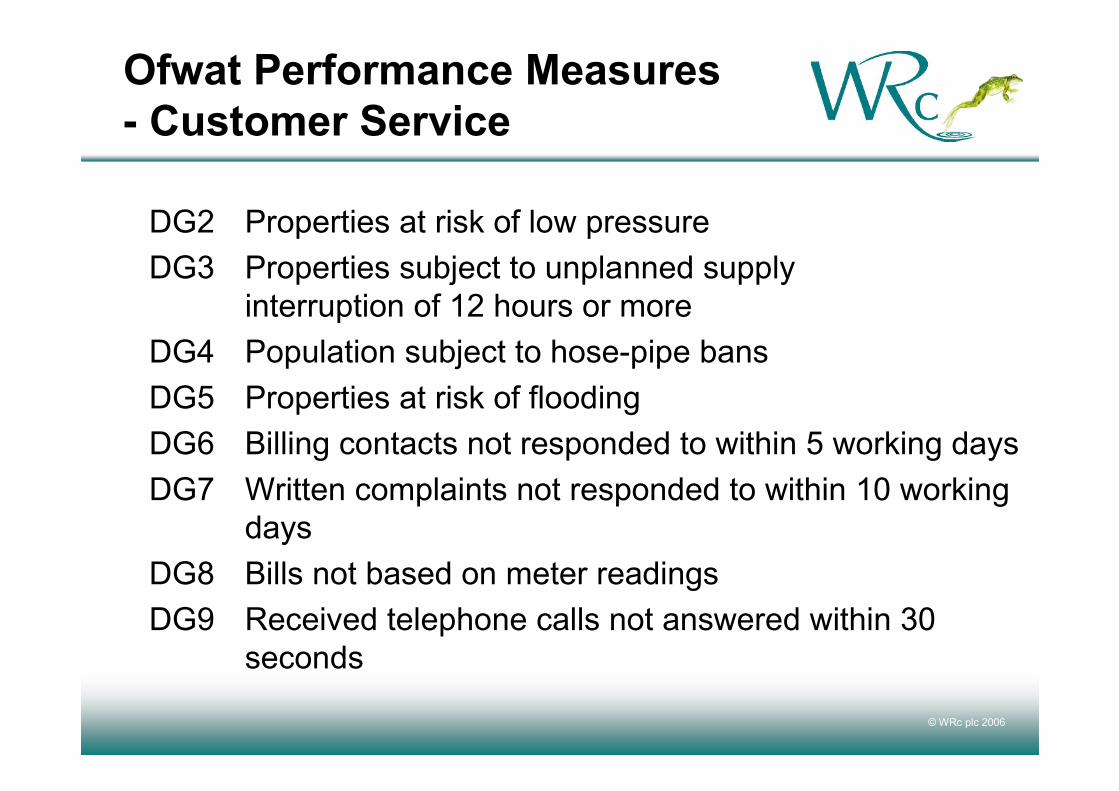
Ofwat Performance Measures- Customer Service
DG2 Properties at risk of low pressureDG3 Properties subject to unplanned supply
interruption of 12 hours or moreDG4 Population subject to hose-pipe bansDG5 Properties at risk of floodingDG6 Billing contacts not responded to within 5 working daysDG7 Written complaints not responded to within 10 working
daysDG8 Bills not based on meter readingsDG9 Received telephone calls not answered within 30
seconds

© WRc plc 2006
Overall performance assessment(OPA)• Covers water supply, sewerage, customer service and
environmental performance• Informs stakeholders about overall company performance• Will be used for future price reviews• Allows weighting of the various performance areas to
produce the OPA.

© WRc plc 2006
Ofwat performance assessment• Water Supply (weight 3)
• DG2 - Risk of low pressure• DG3 - Unplanned interruptions• DG4 - Water restrictions• Potable water quality• Sewerage Service (weight
1.5)• DG5 - Sewer flooding incidents
(capacity)• DG5 - Sewer flooding incidents
(other causes)• DG5 - Properties at risk of
flooding more than once in 10years
• Customer service (weight1.5)• DGs 6/7/8/9 - Company
contact• Other customer service• Environmental
performance (weight 2.75)• Category 1, 2, and 3
pollution incidents (sewage)• Sludge disposal• Population served by STWs
in breach of their consent• Category 1 and 2 pollution
incidents (water)• Leakage
© WRc plc 2006
Use of BenchmarkingInformation• Cost and performance information used by OFWAT in
Periodic Reviews (price setting)• Cost and performance information publicly available
to provide indirect pressure:- inform shareholders/analysts- apply peer pressure- inform customers
• “naming and shaming” - strong incentive
© WRc plc 2006
Benchmarking Trends
• Countries/new regulators are introducing metricbenchmarking for the first time
• Increasing public utility interest• Ongoing formation of syndicates• Out-of-industry process benchmarking mainly
undertaken by individual companies• International bodies are starting to promote
global/regional benchmarking activity