planning tools: utility data, management, and benchmarking · pdf file ·...
TRANSCRIPT

2_Title Slide
Planning Tools: Utility Data, Management, and Benchmarking
Better Buildings Summit May 10, 2016 9:45-11:00 AM

Today’s Presenters
Jon Braman Bright Power
Ellen Sargent Chicago Housing Authority

Data Jamming at the Chicago Housing Authority Ellen Sargent

A case study for energy benchmarking, reporting and strategic capital planning
Ellen Sargent Director of Sustainable Initiatives and Projects, Property Office Chicago Housing Authority

Third largest PHA in the U.S.
19,500 traditional housing units categorized into:
- Senior high rise buildings
- Family property row houses or mid-rise buildings
- Scattered site single family homes and various 2-6 unit
buildings
Administers over 36,000 housing choice vouchers for apartments in privately owned buildings
1

2
Minneapolis, MN: • Passed 2/2013 • Municipal, Commercial • Public Disclosure Washington, DC:
• Passed 7/2008 • Municipal, Commercial,
Multi-family • Public Disclosure
Philadelphia, PA: • Passed 6/2012 • Commercial only • Public & Transactional disclosure
Seattle, WA: • Passed 1/2010 • Municipal, Commercial, Multi-
family • Tenant & Transactional
Disclosure Only
San Francisco, CA: • Passed 2/2011 • Municipal, Commercial • Public & Transactional Disclosure • Mandatory Audits
Austin, TX: • Passed 11/2008 • Municipal, Commercial, Multi-family • Transactional disclosure • Mandatory audits for multifamily
New York, NY: • Passed 12/2009 • Municipal, Commercial, Multi-family
• Public Disclosure • Mandatory Audits, Retro-
commissioning, Lighting upgrades
Boston, MA: • Passed 5/2013 • Municipal, commercial, multi-family
• Public Disclosure • Mandatory Audits
Chicago, IL: • Passed 9/2013 • Municipal, Commercial,
Multi-family • Public Disclosure • Data verification
Cambridge, MA: • Passed 7/2014 • Municipal, Commercial, Multi-family
• Public Disclosure
Berkley, CA: • Passed 3/2015 • Municipal, Commercial, Multi-
family • Public Disclosure • Single Family Homes – at Time
of Sale (w Audits)
Portland, OR: • Passed 4/2015 • Municipal, Commercial, Multi-family • Disclosure
Atlanta, GA: • Passed 4/2015 • Municipal,
Commercial, Multi-family
• Public Disclosure
Kansas City, MO: • Passed 6/2015 • Municipal, Commercial,
Multi-family • Public Disclosure

1.) Energy Benchmarking
• Non-industrial buildings greater than 50,000 ft2 track their energy consumption annually
• This involves entering basic building info (address, size, space use, occupancy, etc.) and energy use data (kWh, cubic feet gas) into free, web-based software
• There are exemptions for financial hardship, low occupancy, and new buildings
2.) Data Verification
• In the first and every third year after, buildings have their energy usage data verified by in-house or 3rd party architect, engineer, or other trained professional
• Verification improves data quality and allows for direct comparisons of similar covered buildings
• There are also no-cost and low-cost verification options and waivers for financially-strained buildings.
3.) Reporting & Disclosure
• Buildings report energy use annually using the automated software tool
• The City reports annually on our broader efficiency trends
• The City is authorized to make energy scores public after 2.5 - 4.5 years
• The City does not disclose the energy data from the first year.
• Initial exemptions for buildings with TV studios, trading floors, or data centers representing 10%+ of square footage
The Ordinance is information (not investment) focused: The ordinance is focused explicitly on improving information on overall efficiency. There is no requirement to invest capital in energy efficiency, to retrofit, or to audit the building.
3

4

Portfolio Manager Homepage
Building Homepage
Information needed to Benchmark: property info (building owner, type, address); base building data (gross area, use details, utility details); energy consumption data; plans for data analysis
5
Chicago Housing Authority Data Jam
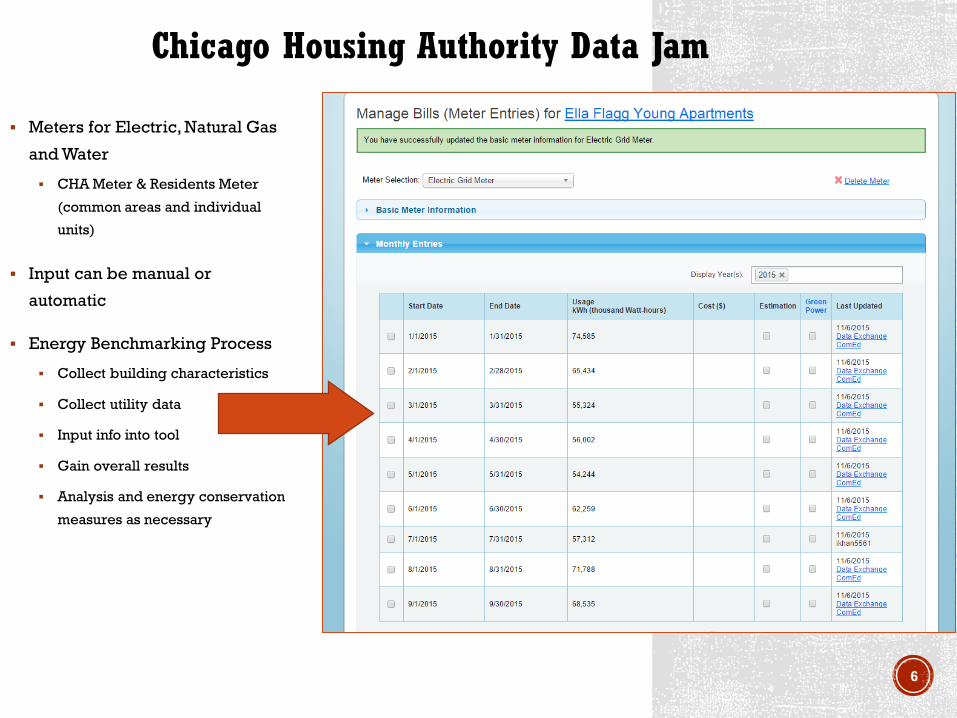
Meters for Electric, Natural Gas
and Water
CHA Meter & Residents Meter
(common areas and individual
units)
Input can be manual or
automatic
Energy Benchmarking Process
Collect building characteristics
Collect utility data
Input info into tool
Gain overall results
Analysis and energy conservation
measures as necessary
6
Chicago Housing Authority Data Jam

7

Continued reporting, pursue voluntary benchmarking
Use energy utilization data for property manager performance incentives
Improve and monitor preventative maintenance programs
Enhance Operations Budget Forecasting
Generate standardized energy usage expectations for new acquisitions
Implement Strategic Capital planning Attain Energy Star certification Ensure capital investment projects are need based Establish ROI documentation using in house staff and data
8

City of Chicago Energy Benchmarking homepage and 2015 report:
www.cityofchicago.org/city/en/progs/env/building-energy-benchmarking---transparency.html
www.cityofchicago.org/content/dam/city/progs/env/EnergyBenchmark/
2015_Chicago_Benchmarking_Report_Web_16DEC2015.pdf
• EPA Portfolio Manager home page: www.energystar.gov
• Chicago Housing Authority homepage: www.thecha.org
9

Energy and Water Benchmarking in Multifamily Buildings Jon Braman
Energy and Water Benchmarking in Multifamily Buildings
2016 Successes
vs. Ongoing challenges
www.brightpower.com
Jon Braman VP Strategic Initiatives

Energy Management Process
Benchmarking
Benchmarking
Not benchmarking

Takeaways 1. Benchmarking works (i.e. really does help save) 2. Benchmarking is useless (by itself) 3. Sometimes it’s hard just to get (good) data 4. Gradually, the situation is improving
www.brightpower.com

1. Benchmarking works (i.e. really does help save energy and water)
www.brightpower.com
EnergyScoreCards Minnesota:

First experimental multifamily benchmarking impact study at scale.
Results from 550+ building sample in Minnesota (with third-party analysis review from CEE):
www.brightpower.com

Benchmarking working as first step to reach portfolio goals
www.brightpower.com
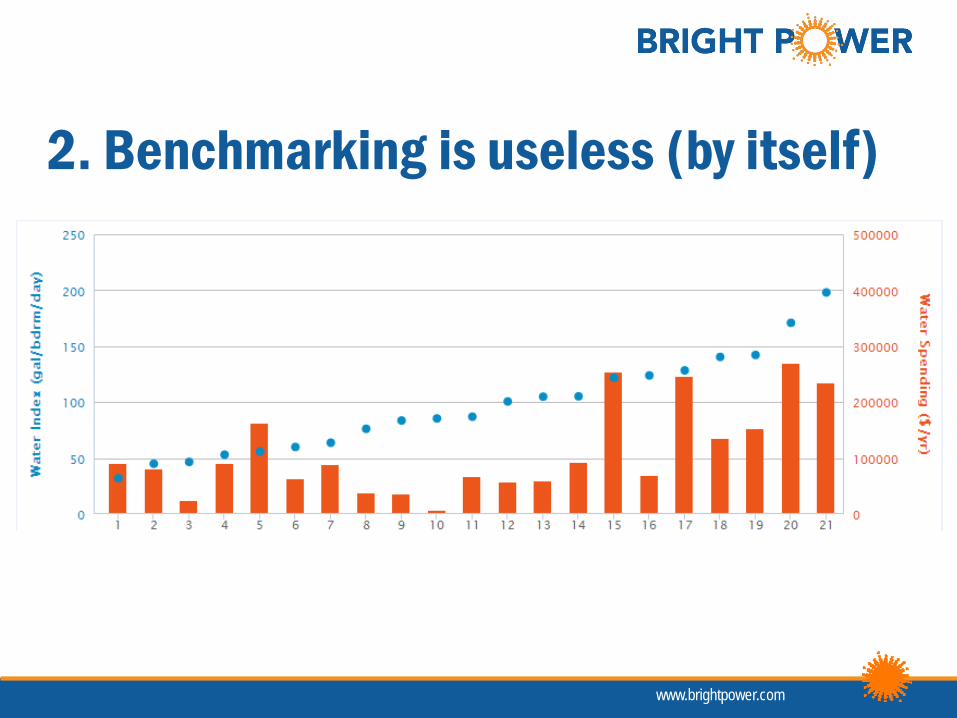
2. Benchmarking is useless (by itself)
www.brightpower.com

Where will you take action?
www.brightpower.com
Property Names

Take action.

Watch results.

www.brightpower.com
Keep watching.
Uh oh.
So what do I do next?

Can you spot the problem?
www.brightpower.com

Can you see it now?
www.brightpower.com

Can you figure it out over the phone?
www.brightpower.com

More granular data helps.
www.brightpower.com

www.brightpower.com
But sometimes it takes a midnight detective trip….

Keep watching.
www.brightpower.com

Are there other ways to ‘watch’ your buildings?
www.brightpower.com

3. But sometimes it’s hard to get (good) data
www.brightpower.com
Data collection pain not (always) correlated with value Data collection pain varies a lot between
properties/ portfolios Let’s start using the easier-to-get data now!
But keep working on the hard-to-get data

Easy to get: large, master-metered
www.brightpower.com

All that consumption, 4 accounts!
www.brightpower.com

Hard to get: lots of accounts, tenant paid
www.brightpower.com

65 utility accounts
www.brightpower.com

www.brightpower.com

www.brightpower.com

And that was just the owner accounts
www.brightpower.com

4. Gradually, the situation is improving
www.brightpower.com
New benchmarking laws spur utility improvements
New tools (EPA and HUD) to find utilities with whole building data
Options for services to help collect data
Options for services to help curate, analyze, interpret data
Multifamily Portfolio Manager Score, water score in the works
City resources and reports online

What do you think? NEWHAB benchmarking survey! Last day to complete….
www.brightpower.com

Discussion