metsä board · pdf filemetsä group annual brochure 2016 metsä board annual...
TRANSCRIPT

METSÄ BOARDANNUAL REPORT 2016

FOCUS ON PREMIUM PAPERBOARDS
PUBLISHED BYMetsä Board Corporation, [email protected]
Metsä Board's annual report is published in Finnish and English. The publication is available in PDF format at www.metsaboard.com
A LEADING EUROPEAN PRODUCER OF FOLDING BOXBOARDS AND WHITE LINERBOARDS MADE FROM FRESH FIBRE
Metsä Board is a leading European producer of folding
boxboards and white linerboards made from fresh fibre. Its
lightweight paperboards are developed as the perfect fit for
consumer goods, retail-ready and food service packaging.
The pure fresh fibres Metsä Board uses are a renewable
resource, traceable to origin in northern forests.
The global sales network of Metsä Board supports custom-
ers worldwide, including brand owners, converters and
merchants. In 2016, the company's sales totalled EUR 1.7
billion, and it has approximately 2,500 employees. Metsä
Board, part of Metsä Group, is listed on the Nasdaq Helsinki.
Metsä Fibre Annual Review2016
Metsä Group Financial Statements2016
Metsä Group Annual Brochure2016
Metsä Board Annual Report2016
METSÄ FIBREANNUAL REVIEW 2016
METSÄ GROUPFINANCIAL STATEMENTS 2016
METSÄ GROUPANNUAL BROCHURE2016
METSÄ BOARDANNUAL REPORT 2016
Metsä Group Sustainability Report2016
METSÄ GROUPSUSTAINABILITYREPORT 2016

1
CONTENTS
2 CEO's review4 Year 2016 highlights6 Strategy8 Operating environment and markets10 Products and services12 Personnel14 Sustainability18 Financial statements
The Carta Integra folding boxboard used for the cover of this annual report is manufactured at Metsä Board’s Äänekoski mill. The surface layers of the three-layer folding boxboard are made from chemical pulp from Metsä Fibre’s Äänekoski pulp mill, and the high-yield pulp of the middle layer is manufactured at Metsä Board’s Joutseno and Kaskinen mills. Carta Integra is made from pure fresh fibre. It is a fully coated paperboard, suitable for packaging and graphical end uses.
p.4Start-up of the paperboard machine at Husum
p.16Success in CDP's programmes
KEY FIGURES 2016 2015
Sales, EUR million 1,720.3 2,007.5
EBITDA, comparable, EUR million 231.1 283.3
- % of sales 13.4 14.1
Operating result, comparable, EUR million 137.5 179.9
- % of sales 8.0 9.0
Result before taxes, comparable, EUR million 106.8 150.2
- % of sales 6.2 7.5
Result for the financial year, comparable, EUR million 93.6 120.2
Earnings per share, comparable, EUR 0.26 0.34
Shareholders’ equity per share, EUR 2.96 2.89
Dividend per share, EUR 0.191) 0.17
Gross investments, EUR million 162.4 177.8
Net cash flow from operations, EUR million 77.0 246.7
Interest-bearing net liabilities at the end of the period, EUR million 463.8 333.4
Interest-bearing net liabilities / EBITDA, comparable 2.0 1.2
Return on capital employed, comparable, % 8.1 11.3
Return on equity, comparable, % 9.0 12.9
Equity ratio at the end of the period, % 48.2 46.5
Net gearing ratio at the end of the period, % 44 32
Market capitalisation of shares on 31 Dec, EUR million 2,416 2,435
Personnel at the end of the period 2,466 2,601
Paperboard deliveries, 1,000 t 1,607 1,449
Market pulp deliveries, 1,000 t 500 549
1) The Board's proposal to the Annual General Meeting

2
CEO'S REVIEW
DEAR SHAREHOLDER,The year 2016 was a historically significant one for Metsä Board. We brought the restructuring work, which had lasted for several years, to a conclusion when the last reel of fine paper was produced at the Husum mill in Sweden in July. In addition, the loss-making wallpaper base business at the Kyro mill in Kyröskoski, Finland, was discontinued.
From now on, we will focus on premium fresh fibre paperboard used in consumer goods, retail-ready and food service packaging, in line with our strategy. Metsä Board's profitability will continue to be based upon cost-effectiveness and healthy pricing, as well as high levels of fibre know-how and self-sufficiency. We will seek growth with our new folding boxboard capacity. A new folding boxboard production line started up at Husum at the beginning of the year. The 400,000-tonne annual capacity of this line will be marketed primarily to the Americas and for food service packaging globally. The demand for our lightweight paperboard made from fresh fibres has been strong in recent years, and with the new capacity we are able to meet this demand.
NEW FOLDING BOXBOARD PRODUCTION LINE STARTED UP
In 2016, Metsä Board's paperboard deliveries grew by 12 per cent from the previous year, which corresponds to our average annual growth target. Global demand for packaging materials made from fresh fibre is growing by approximately 3–4 per cent a year, meaning that our growth is clearly above the average market growth.
GROWTH IN METSÄ BOARD'S PAPERBOARD DELIVERIES CLEARLY OUTPACED AVERAGE MARKET GROWTH.
A TRUE PAPERBOARD COMPANY

3
The rapid decline of the paper business was visible in our sales, and our profitability was burdened by the start-up of Husum's new produc-tion line for folding boxboard. By the end of the year, the average order price of the new folding boxboard was already at a good level. However, due to the long supply chain and time-consuming customer approvals, the positive impact on results was postponed. The profit development of the Finnish mills was stable overall.
The market prices of short- and long-fibre pulps fell compared to the previous year, but the overall impact of pulps on the company's result was still clearly positive. Large-scale investments and an increase in working capital turned our cash flow negative in the first half of the year. The situation nevertheless normalised in the second half of the year. Our balance sheet remained strong throughout the year.
CUSTOMER-DRIVEN PRODUCT AND SERVICE DEVELOPMENT
Metsä Board invests strongly in product development. Our goal is to produce even lighter paperboards, without compromising on their strength and printing qualities. We are also expanding our selection of paperboards. In 2016, we introduced PE-coated paperboards suitable for food service packaging to the market with the help of external part-ners. In 2017, we will have our own extrusion coating line for PE-coated products. We are also developing other barrier solutions against mois-ture and grease for food service packaging, and we will closely monitor their commercial feasibility in the future.
Over the decades, we have created long-term customer relationships based on trust and well-functioning cooperation. We develop our pro-ducts and services in cooperation with our customers – brand owners, converters and merchants – by providing them with sustainable and functional packaging solutions. Our services include product consulting related to end uses, technical support for paperboard conversion, as well as design and development related to packaging. Our objective is to support and promote the sales of our customers' products, to create new growth opportunities for them, and to reduce the costs and environme-ntal impact arising from packaging materials.
LEADING POSITION IN SUSTAINABILITY
Sustainability and environmental responsibility are integral parts of our daily operations. The production of lightweight paperboards consumes less energy, water and raw material. They also generate less waste. Our main raw material – pure and safe fresh fibre – is fully traceable and mostly certified.
In 2016, we were once again recognised by CDP for our responsible use of water, and our actions and strategy to combat climate change. We were also awarded Leadership status in Forest programme. These recognitions prove that the responsibility of our business operations is among the very best internationally.
Well-being at work and occupational safety are also key factors in our success. In 2016, we implemented a project to speed up the impro-vement of occupational safety and the harmonisation of occupational safety standards at our mills. Our long-term work is bearing fruit – our accident frequency rate has declined year by year. The objective of
supervisor coaching is to harmonise operating methods and to increase fair leadership that supports growth. Quality supervisory work and management culture play a central role in our pursuit of growth.
SETTING OUR SIGHTS ON THE FUTURE
Metsä Board's vision is to be the preferred supplier of premium paperboards, creating value for customers globally. We have successfully implemented years of restructuring work from a paper company to a paperboard company, and our new capacity meets the growing demand for paperboard made from fresh fibre globally. In 2017, our goal is to continue profitable growth with our new production capacity. At the same time, we are setting our sights on the future and continuously developing our operations to correspond with the demand and needs of the packaging market.
I would like to extend my warmest thanks to our customers, emplo-yees, shareholders and other stakeholders for the past year.
Mika JoukioCEO

4
YEAR 2016 HIGHLIGHTS
THE YEAR OF PAPERBOARD
THE NEW FOLDING BOXBOARD PRODUCTION LINE AT HUSUM STARTED UP
The 400,000-tonne annual volume of Metsä Board's new
folding boxboard machine will be targeted at the Americas
and globally for food service packaging, such as cups,
plates and trays.
THE ELEVATED DRINK BOX LAUNCHED IN THE EARLY SUMMER
The Elevated drink box (EDB) is an
example of Metsä Board's innova-
tive packaging design services.
IF DESIGN AWARD FOR MULTIPURPOSE KNIFE PACKAGING
In March, the multi-purpose knife
packaging designed by Metsä Board
won the prestigious iF Design award in
Germany.
SUCCESS AT THE PRO CARTON ECMA AWARDS
At the European-wide Pro Carton ECMA
Awards, a package made from Metsä
Board's paperboard was selected as the
Carton of the year. Metsä Board paper-
boards were also used by the winners in
the Food and Beauty & Cosmetics
categories.
STANDARD & POOR’S RATINGS SERVICES RAISED METSÄ BOARD'S CREDIT RATING
S&P's credit rating for Metsä Board rose
from BB to BB+. At the same time, the
company's outlook changed from stable to
positive.

5
PECOATED PAPERBOARDS ENTER THE MARKET
In summer 2016, Metsä Board launched
PE-coated paperboards that are ideal for
food service packaging.
RECOGNITION FROM CDP
Metsä Board was included on the
A List in CDP's Climate and Water
programmes. In addition, Metsä
Board received Leadership status in
CDP's Forest programme.
THE INSTALLATION OF THE MAIN EQUIPMENT FOR HUSUM'S EXTRUSION COATING LINE BEGAN
In November 2015, Metsä Board announced it is
investing EUR 38 million in a new paperboard
extrusion coating line and the related infrastructure
at the Husum mill. The line's installation work began
in autumn 2016, and it will be taken into use during
the first half of 2017.
THE PRODUCTION OF WALLPAPER BASE ENDED
Metsä Board ended the production of
wallpaper base at its Kyro mill in
Kyröskoski, Finland, in autumn 2016.
PAPER PRODUCTION ENDED
The production of uncoated fine paper
at the Husum mill in Sweden ended in
summer 2016. In future, Metsä Board
will produce only paperboard products.

6
TARGET 2016 2015 2014 2013
Return on capital employed, comparable, % a minimum of 12% starting from 2017 8.1 11.3 9.1 6.4
Net gearing ratio, % a maximum of 70% 44 32 51 70
Dividend/EPS, % at least 1/3 76 44 57 47
FINANCIAL TARGETS
STRATEGY IMPLEMENTATION IN 2016
Metsä Board has completed its large-scale restructuring. In 2016, the production of fine paper at Husum ended. In addition, the loss-making production of wallpaper base at Kyro mill in Kyröskoski, Finland was discon-tinued. In the future, Metsä Board will focus on the production of premium fresh fibre paperboard for consumer goods, retail-ready and food service packaging.
GROWING TOGETHER WITH CUSTOMERS
A significant portion of Husum's new folding boxboard production will be aimed at the Americas. In 2016, paperboard deliveries to the Americas increased by over 40,000 tonnes, a rise of 14 per cent from the previous year. Demand for Metsä Board's fresh fibre paper-boards is also strong in Europe – deliveries grew by 10 per cent from 2015.
Following the completion of the restructuring, Metsä Board now focuses on lightweight and ecological paperboards made from fresh fibres. Future growth is sought particularly in the Americas by utilising the new capacity. Profitability will continue to be based on cost-effectiveness, healthy pricing and solid technological know-how.
CONTINUOUS INVESTMENT IN INNOVATIVE PRODUCTS AND SERVICES
Metsä Board invests in product development to be able to offer its customers lightweight and high-quality paperboards made from fresh fibres. In 2016, the product range in food ser-vice packaging was expanded. This supports the company's strategic growth. In 2017, Metsä Board start its own extrusion coating line at the Husum mill for the addition of barrier properties to paperboard against mois-ture and grease.
SAFE AND COST-EFFICIENT PRODUCTION AND SUPPLY CHAIN
The productivity levels of Metsä Board's mills are some of the best in the industry. In 2016, productivity increased and reached nearly 1,850 tonnes per employee. During the last 10 years, productivity has improved on average by 5 per cent annually. In 2016, Metsä Board initiated an efficiency programme at Husum aiming for cost savings of EUR 10 million a year.
FAIR LEADERSHIP THAT SUPPORTS GROWTH
Ensuring the competence of personnel is of utmost importance in a rapidly changing oper-ating environment. At Metsä Board, leadership works towards a corporate culture that sup-ports the company's growth. Read more about measures involving personnel development on pages 12–13.
STRATEGY
PRODUCTIVITY DEVELOPMENTCAPACITY (t)/ PERSON
2,000
1,800
1,600
1,400
1,200
1,0001207 1308 1409 1510 1611

7
FOCUS
We focus on premium fresh fibre paperboards for con-sumer goods, retail-ready and food service packaging.
PROFITABILITY
Our profitability is based on superior cost efficiency and healthy sales prices driven by high-quality pulps and unique technical know-how.
GROWTH
We grow profitably together with brand owner, converter and merchant customers globally in businesses that benefit from our safe and sustainable paperboards.
STRATEGIC CORNERSTONES Metsä Board's strategic cornerstones form the foundation of the company's operations.
VISION
Metsä Board's vision is to be the preferred supplier of premium paperboards, creating value for customers globally.

8
GROWTH IN THE AMERICAS IN THE COMING YEARS
• The most rapid growth is sought in the Americas, where most of the new capacity in folding box-board is targeted.
• The growth drivers are the limited local availability of premium, lightweight folding boxboard, and growing demand for food service packaging made from fresh fibre paperboard.
• Sales will be targeted particularly at converters without their own paperboard production.
AMERICAS
SHARE OF SALES
17 %
METSÄ BOARD'S DELIVERIES TO THE AMERICAS GREW BY
14 %(2016 vs. 2015)
ANNUAL GROWTH IN GLOBAL DEMAND FOR FOLDING BOXBOARD AND WHITE FRESH FIBRE LINERBOARDS
3−4 %
PROFITABLE GROWTH ON A GLOBAL SCALE
OPERATING ENVIRONMENT AND MARKETS
The megatrends in the global packaging market offer signifi-cant opportunities for Metsä Board. The strategic goal is to continue profitable growth that exceeds average market growth by utilising the new capacity.
GLOBALISATIONAs the role of retail grows, the brand harmoni-sation will continue. More and more consum-ers expect the same brand experience when buying a product, regardless of the sales chan-nel or the geographical location of the pur-chase. Metsä Board responds to this develop-ment with globally available paperboards of a high and consistent quality.
TECHNOLOGY
Innovations make use of fully renewable raw materials or can replace some oil-based materi-als, for example, with renewable fibre. Metsä Board continuously investigates new possibili-ties to utilise fresh fibre and to develop the operations of its mills and its supply chain on the basis of the best available technology.
SUSTAINABILITY
The importance of resource efficiency is increasing, which is reflected in lifecycle and circular economy thinking. Regulation increases obligations and the requirements imposed on product safety are increasing. Metsä Board supports sustainability by using less raw materials, water and energy in its pro-duction. Metsä Board's product safety relies on using pure fresh fibre from sustainably man-aged forests.
CONSUMPTIONConsumption is increasing globally. Consumers' quality demands and the demand for sustainably produced pack-aging materials are growing. Developing packages that are as appealing as possi-ble helps brand owners stand out from the competition. Metsä Board's paper-boards are made to promote the sales of brand owners and to raise the consum-er's interest in a product.

9
MAINTAINING A STRONG MARKET POSITION IN EUROPE
• The goal is to remain Europe's big-gest producer of folding boxboard and white fresh fibre linerboards.
• The company's strengths are based on long-term customer relationships and a broad customer base.
• Steady growth above the market growth is sought with a diverse selec-tion of products and services focused on customers' needs.
FOCUS ON PREMIUM SEGMENTS IN THE ASIAPACIFIC REGION
• Aiming at moderate growth, primar-ily in cooperation with brand owners.
• The competitive edge of Metsä Board's premium paperboard is based on consistent quality, tracea-ble raw materials and responsible production.
APAC
SHARE OF SALES
8 %
EMEA
SHARE OF SALES
75 %
GLOBAL DEMAND FOR FOLDING BOXBOARD AND FOOD SERVICE PACKAGING APPROXIMATELY
GLOBAL DEMAND FOR WHITE FRESH FIBRE LINERBOARDS APPROXIMATELY
13 million t/year
4 million t/year
0 600 1,200300 900 1,500
Metsä Board
Stora Enso
Kotkamills
Mayr-Melnhof
International Paper
Other
Metsä Board
Smurfit Kappa
Mondi
BillerudKorsnäs
SCA
Other
EUROPE'S BIGGEST PRODUCERS OF WHITE FRESH FIBRE LINERBOARDSTOTAL CAPACITY 2.2 million t/year
EUROPE'S BIGGEST PRODUCERS OF FOLDING BOXBOARDTOTAL CAPACITY 3.6 million t/year
METSÄ BOARD'S REGIONAL GOALS AND OPERATING MODEL
CAPACITY 1,000 t/year CAPACITY 1,000 t/year
Sources: Metsä Board, Pöyry Management Consulting Oy
0 200 400 600 800

10
PRODUCTS AND SERVICES
SOLUTIONS TO CUSTOMERS' NEEDS
Metsä Board's lightweight folding boxboards and linerboards made from fresh fibres are used in food, cosmetics, pharmaceutical and electronics packaging as well as in various retail displays and packages. Food service boards, on other hand, are a perfect fit for cups, plates and trays.
In summer 2016, Metsä Board introduced to the market PE-coated paperboards suitable for food service packaging with the help of external partners. The company is set to start-up its own extrusion coating line for PE-coated products at the Husum mill in the first half of 2017. PE – i.e. polyethylene – is the most common barrier material used against moisture and grease in food and food service packaging. Metsä Board also continues to develop new barrier solutions, and is study-ing, among other things, the use of bio-based materials in this respect. The company is in a position to provide new barrier solutions, pro-vided that there will be a profitable market for them.
Lightness is the core property of Metsä Board's premium fresh fibre paperboards. Metsä Board is researching and developing several technologies to make paperboards even lighter in weight. The lightness of paperboards provides a significant competitive edge par-ticularly in North America, where the supply in folding boxboard is scarce. In-house fibre know-how, particularly in high-yield pulp, and fibre self-sufficiency provide a solid basis for such work. The production of lightweight paperboards also saves energy, water and raw materials.
INNOVATIVE SERVICESMetsä Board supports and promotes the sales of its customers and seeks to create new growth opportunities for them with the help of both products and services that complement those products. The services include product consulting related to end uses, technical sup-port for paperboard conversion, as well as design and development related to packaging.
Metsä Board brought PE-coated paperboards to the market in summer 2016. Research and develop-ment activities focus on the development of new products for food service packaging and the production of increasingly lightweight paperboards.
One example of Metsä Board's innovative packaging design services is the new Elevated drink box (EDB) concept with an elevated base structure, introduced in summer 2016. Thanks to this, a drink box no longer needs to be placed at the edge of a table.
Year 2016 was successful for packages
made from Metsä Board's paper-
boards. In March, the multi-purpose
knife packaging designed by Metsä
Board won the renowned iF Design
award in Germany.
In the European-wide Pro Carton
ECMA Awards held in the autumn of
2016, a package made from Metsä
Board's paperboard was selected as
the Carton of the year. Metsä Board
paperboards were also used by the
winners in the Food and Beauty &
Cosmetics categories.
In the autumn of 2016, the Ele-
vated drink box patented by Metsä
Board and made from white fresh fibre
linerboard won the Brand Packaging
2016 Editor's Choice Award in the
United States.
At the Hong Kong Print Awards in
December, the fruit-shaped packages
designed by Metsä Board received a
Merit Award.
SUCCESS IN PACKAGING COMPETITIONS

11
CHEMICAL AND HIGH-YIELD PULP CAPACITY
1.4million t/year
FOLDING BOXBOARD AND WHITE FRESH FIBRE LINERBOARD CAPACITY
OVER 2million t/year
METSÄ BOARD'S PRODUCTION CAPACITIES (1,000 t/year)
MILL MachinesFolding
boxboard LinerboardChemical
pulpHigh-yield
pulp
Husum 2 400 270 730
Kemi 1 410
Kyro (Kyröskoski) 1 190
Simpele 1 280
Tako (Tampere) 2 210
Äänekoski 1 240
Joutseno 320
Kaskinen 340
TOTAL 8 1,320 680 730 660

12
PERSONNEL
GROWTH BASED ON PERSONNEL
The new folding boxboard production line that started up at Husum mill in Sweden in February 2016 also meant that the mill's new organisation came into force. The start-up of the new machine required various procedures, due to which part of the personnel were trained for new tasks; in addition, the start-up of the machine was supported by resources from the company's other mills.
INCREASED OPERATIVE EFFICIENCY AT MILLS
Paper production at Metsä Board ended at the beginning of the second half of the year. Alongside this change, some of the personnel at the Husum mill moved from paper produc-tion to paperboard production and the tasks that support it. Sales and customer service operations were likewise reorganised to corre-spond with the new situation.
FOCUS ON OCCUPATIONAL SAFETYIn 2016, Metsä Board launched a project
to speed up the improvement of occupa-
tional safety at the mills. “We have harmo-
nised the use of personal protective
equipment at the mills. In addition, we've
adopted a policy of using helmets or hard
hats whenever people are in production
facilities. We've also defined standards for
personal protective equipment,” says
Markku Saarilahti, Regional Safety
Manager at Metsä Board. The project has
also included closer safety cooperation
and information flows between mills.
Information about accidents, hazardous
situations and proven safety practices are
distributed at the mills via safety briefings
and info screens. Based on internal safety
audits, safe operating methods are given
priority at Metsä Board's mills.
In 2016, one of the sheet cutters at the Simpele mill in Finland was closed down and the mill's operating model was renewed at the same time. In addition, the production of wall-paper base at the Kyro mill in Kyröskoski, Finland ended during the second half of the year, due to which the operations of the entire mill were adjusted.
FAIR LEADERSHIP AND ENSURING COMPETENCE DEVELOPMENT
Fair leadership that supports growth is an essential aspect of Metsä Board's strategy. Dur-ing the operating year, Metsä Board continued training supervisors with the aim of develop-ing and harmonising leadership, in accordance with the strategy.
Metsä Board anticipates future resource needs by preparing retirement forecasts, assess-ing the competencies required in the future, and developing its personnel through voca-tional training and by making use of job rota-tion, among other things. Taking care of the personnel's well-being and working capacity is methodical and important at Metsä Board; possible risks are anticipated on the basis of discussions between supervisors and employ-ees on the subject of early support, for exam-ple.
Together with Metsä Group, Metsä Board seeks to promote cooperation with various educational institutes. This cooperation aims at increasing knowledge about the forest industry and ensure that there are professional resources for a long time to come.
In 2016, Metsä Board discontinued paper production and, at the same time, increased the efficiency of operations. Both of these measures had an impact on personnel resources. Metsä Board continued its work to advance unified operations and management.
OCCUPATIONAL SAFETY AND WELLBEING AT WORK 2016 2015 2014 2013 2012
Sickness absences, % 1) 4.1 4.2 3.8 3.9 3.9
Absences due to lost-time accidents, % 0.2 0.2 0.3 0.3 0.2
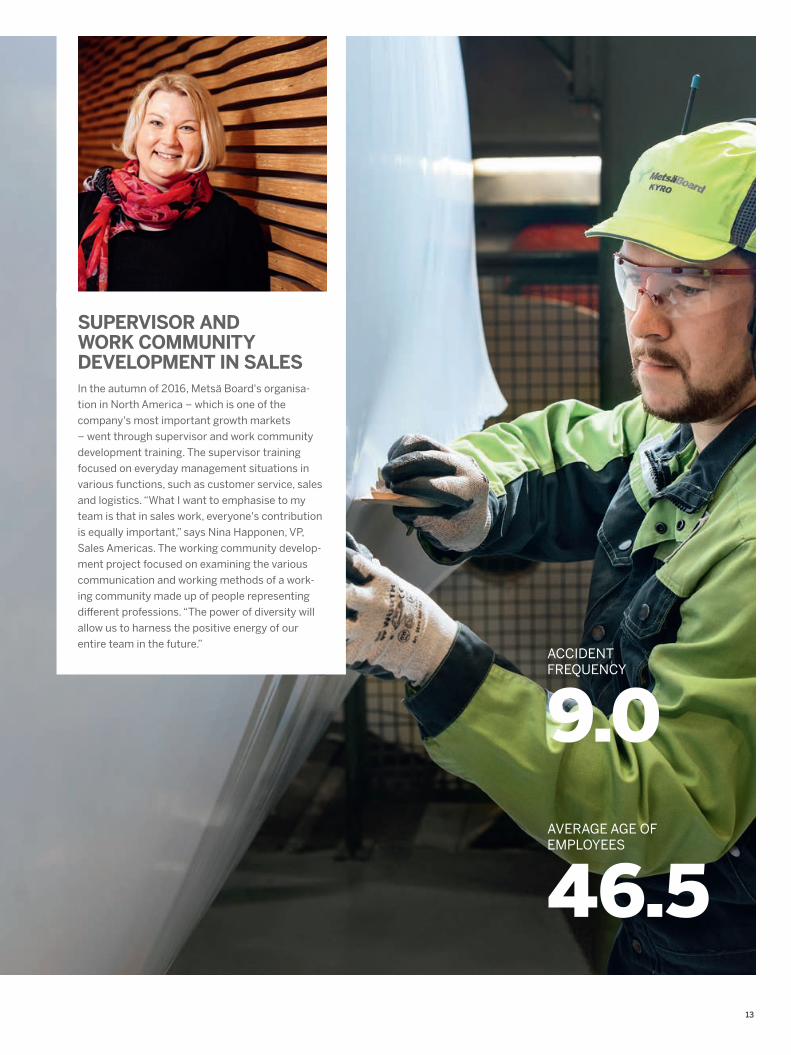
Lost-time accident frequency (per million hours worked) 9.0 11.1 12.0 12.2 13.2
1) Percentage of theoretical work time
13
SUPERVISOR AND WORK COMMUNITY DEVELOPMENT IN SALESIn the autumn of 2016, Metsä Board's organisa-
tion in North America – which is one of the
company's most important growth markets
– went through supervisor and work community
development training. The supervisor training
focused on everyday management situations in
various functions, such as customer service, sales
and logistics. “What I want to emphasise to my
team is that in sales work, everyone's contribution
is equally important,” says Nina Happonen, VP,
Sales Americas. The working community develop-
ment project focused on examining the various
communication and working methods of a work-
ing community made up of people representing
different professions. “The power of diversity will
allow us to harness the positive energy of our
entire team in the future.” ACCIDENT FREQUENCY
9.0
AVERAGE AGE OF EMPLOYEES
46.5

14
The United Nations Sustainable Development Goals (SDGs) represent a large-scale global commitment. The SDGs transformed the wide sustainability agenda into concrete targets. Metsä Group’s activities support reaching the SDGs. Metsä Group is also committed to the UN Global Compact.
OUR SUSTAINABILITY THEMES
WE OFFER SUSTAINABLE CHOICES
PRODUCTS AND SERVICES
• Sustainable, safe and recyclable products from renewable wood
• Customer-focused services and solutions
• Innovations and renewal
WE BRING THE FOREST TO YOU
RAW MATERIALS AND SUPPLY CHAIN
• Sustainable forest management, certification and diversity of forest nature
• Sustainability in the value chain• Traceability
WOODMaintain the share of certified wood:
81% Performance 2016
Target
>80%
LOGISTICSEnsure sustainability of main logistics flows 2016–2017:
Target
100 %
Status 2016 Evaluation of service providers will be finalised in 2017.
Read more: Metsä Group’s Sustainablity Report 2016

15
WE CREATE WELLBEING
STAKEHOLDER ENGAGEMENT
• Ethical business practices• Safety at work• Responsible management• Local livelihoods
and society
WE WORK FOR A BETTER CLIMATE AND ENVIRONMENT
RESOURCE EFFICIENCY AND EMISSIONS
• Efficient use of raw materials, energy and water
• Value of side streams• Share of bioenergy• Emissions to water and air
CLIMATEFossil CO2 emissions per product tonne 2009–2020:
ETHICAL BUSINESSCoverage of code of conduct training:
SAFETY AT WORKLost-time accidents frequency annually (LTA1: 9):
ENERGYEnergy efficiency improvement2009–2020:
RESOURCE EFFICIENCYProcess water use per product tonne 2010–2020:
WELLBEINGSickness absenteeism:
14% Performance 2016
4.1% Performance 2016
45% Performance 2016
81% Performance 2016
7.8% Performance 2016
18.9% Performance 2016
Target
-30%
Target
100%
Target
12%
Target
-10%
Target
-17%
Target
<3%

12 1213 1314 1415 1516 16
250
200
150
100
50
0
25
20
15
10
5
0
16
SUSTAINABILITY
SUSTAINABLY INTO THE FUTUREMetsä Board's products are made from renewable fresh fibres. The company reduces its carbon footprint and improves its resource efficiency on a continuous basis. As a demonstration of its productive work, Metsä Board received several note-worthy recognitions in 2016, including from CDP.
The environmental and social responsibility of its business operations is important to Metsä Board and its customers. Due to Metsä Board's systematic development of its opera-tions, the energy efficiency has improved, and the company has reduced its CO2 emissions and water consumption to a significant degree. These measures also enhance production and improve cost-effectiveness. Metsä Board’s commitment to sustainable business is widely recognised.
METSÄ BOARD ON CDP'S A LISTS
The company has been recognised by CDP, to which it has been reporting since 2010. Metsä Board was included on the A List in CDP's Climate and Water programmes. In addition, Metsä Board received Leadership status in CDP's Forest programme.
Inclusion on the Climate A List from among the thousands of companies reporting to CDP has required the commitment of the company's management, the establishment of clear goals and the monitoring of those goals. In 2009–2016 Metsä Board has reduced its fossil CO2 emissions by 45 per cent. The con-sumption of biobased fuels of the total fuel use was 83 per cent in 2016.
For the second time, Metsä Board was also the only forest industry company to be included on the A List for Water. Only 4 per cent of the 607 companies reporting to the Water programme were included on the A List. This is a considerable recognition of Metsä Board's responsible use of water and water-related risk management. The efficiency measures relating to the use of energy and water support one another.
Numerous development projects aiming to reduce the mill's water and energy
consumption were started at Metsä Board's Simpele mill in 2016.
Among other things, the heat recovery of the mill's paperboard machine was
improved, which allows for a reduction in the use of steam. At Simpele, Metsä
Board has also invested in the water management process to enhance the
removal of water in the press section, which reduces the volume of steam needed
for the drying of the paperboard line. A rise of one percentage point in the dry
solids after the press section reduces the need for steam for drying by approxi-
mately four percentage points.
The volume of waste water from the mill can also be reduced in comparison to
current levels by renewing automation and the pumping technology. Simpele is
also planning a frequency reserve function that will enable the adjustment of pulp
grinder loads, helping to level out peak loads in the electricity grid.
ENERGY AND WATER CONSERVATION AT SIMPELE MILL
BARILLA TRUSTS METSÄ BOARDMade from fresh fibre, Metsä Board’s
clean and strong paperboards are
particularly well suited for food
packaging.
An essential part of Italian pasta
maker Barilla’s sustainability princi-
ples is to use recyclable packages for
its products, as well as packaging
materials that use raw material from
sustainably managed forests.
Metsä Board’s lightweight fresh
fibre paperboards support Barilla’s
sustainability principles thanks to the
improved Life Cycle profile of its
lighter paperboards.
Metsä Board's mills use only surface water in their processes. The production is located in Finland and Sweden, both of which have ample reserves of fresh water and no need to compete over water resources with agriculture. In these countries, forests are growing faster than they are felled, in addition to which they play an important role in the hydrological cycle. In Forest reporting, Metsä Board also made it onto the Forest Leadership list. Some 81 per cent of the wood raw material the com-pany uses originates from certified forests.
Together with its customers, Metsä Board is also involved in CDP's Supply Chain pro-gramme.
CDP is an international, not-for-profit organisation that offers companies and munic-ipal authorities a worldwide system for meas-uring, publishing, managing and distributing information about their environmental impact.
WATER USEm3/t
FOSSIL CO2 EMISSIONSCO2 kg / t

17
2016 2015
DISCHARGES INTO WATER, t
Waste water, 1,000 m3 69,533 68,702
Chemical oxygen demand (COD) 11,557 10,673
Biological oxygen demand (BOD) 5342) 5682)
Total suspended solids 1,925 2,082
WASTE, t
Recycled waste 134,553 159,953
Recycled waste, % 98 98
Landfill waste 2,164 2,718
Hazardous waste 662 7362) Not measured at Husum mill
2016 2015
EMISSIONS INTO AIR, t
Fossil-fuel carbon dioxide (CO2) 278,725 317,441
Sulphur dioxide (as SO2) 477 671
Nitrogen oxides (as NO2) 1,792 1,649
Particles 139 110
2016 2015
RAW MATERIALS
Metsä Board's wood purchases, 1,000 m3 4,572 4,939
Chemical and high-yield pulp used by Metsä Board, 1,000 t 1,236 1,388
OTHER RAW MATERIALS, 1,000 t
Pigments 340 340
Adhesives 68 75
WATER INTAKE, 1,000 m3 103,801 105,124
Process water 70,357 68,943
Cooling water 53,446 54,141
2016 2015
PRODUCTION, 1,000 t
Paperboard 1,7311) 1,911
Chemical and high-yield pulp 1,236 1,2061) Includes paper production that was ended during 2016
THE CIRCULAR ECONOMY OF A DURABLE AND SAFE PACKAGE
Fresh fibre is a pure and safe, renewable raw material.
We use only carefully selected and safe raw materials in our products.
We follow good manufacturing practices (GMP) and our production process is hygienic and safe.
All of our products meet the requirements of relevant international legislation. The tests concerning their suitability for food contact is always conducted by an external party.
A carefully selected trans-portation package protects our paperboard from being damaged during the delivery chain.
A package made from our durable paperboard retains its shape throughout transportation and protects the packaged product effectively.
Our pure paperboard helps to store the packaged product safely all the way to the end user.
All of our paperboards are recyclable and biodegradable, or they can be used for energy production.

12 12 121213 13 131314 14 141415 15 151516 16 1616
250
200
150
100
50
0
-50
200
150
100
50
0
200 12
150 9
100 6
50 3
0 0
18
Metsä Board's paperboard deliveries grew by 12 per cent in 2016. Sales declined as planned due to the reduced paper business. Compa-rable operating result weakened compared to the previous year and was EUR 137 million. Operating result was burdened by the start-up of Husum's new folding boxboard production line, the technical challenges in the new production line and the pulp mill, as well as the lower price level of the start-up volumes of the new folding boxboard. The decline in the pulp market price also had a negative impact on the result.
FINANCIAL STATEMENTS
2016
EMEA ..................................75 Americas ............................ 17 APAC .....................................8
Folding boxboard ...............50 Linerboard ..........................25 Market pulp ........................15 Others .................................10
OPERATING RESULT, COMPARABLEEUR MILLION EBIT-%
INVESTMENTSEUR MILLION
CASH FLOW FROM OPERATIONSEUR MILLION
SALES SPLIT%
SALES BY MARKET AREA%
SALESEUR MILLION
2,500
2,000
1,500
1,000
500
0

100
80
60
40
20
0
800
600
400
200
0
180
150
120
90
60
30
0
14
12
10
8
6
4
2
0
50
40
30
20
10
0121212 12 12 12131313 13 13 13141414 14 14 14151515 15 15 15161616 16 16 16
19
CONTENTS GROUP 20 Report of the Board of Directors 2016 27 Consolidated statement
of comprehensive income 28 Consolidated balance sheet 29 Statement of changes
in shareholders' equity 30 Consolidated cash flow statement 31 Notes to the consolidated financial
statements 83 Shares and shareholders 87 Calculation of key ratios
PARENT COMPANY 88 Parent company accounts – Income
statement 89 Parent company accounts – Balance
sheet 90 Parent company accounts – Cash flow
statement 91 Parent company accounting policies 92 Notes to the parent company financial
statements 98 The Board's proposal for the distribution
of profits 99 Auditor's report
GOVERNANCE 102 Corporate governance statement 109 Salary and remuneration report 112 Metsä Board Corporation's Board of
Directors 114 Metsä Board Corporation's Corporate
Management Team
116 Quarterly data 117 Production capacities 118 Ten years in figures 119 Investor relations and investor information
RETURN ON CAPITAL EMPLOYED, COMPARABLE%
NET GEARING RATIO%
EQUITY RATIO%
RESULT BEFORE TAXES, COMPARABLEEUR MILLION
INTEREST-BEARING NET LIABILITIESEUR MILLION
PERSONNEL
Target a minimum of 12% starting from 2017
Target a maximum of 70%
4,000
3,000
2,000
1,000
0

20 FINANCIAL STATEMENTS 2016 – REPORT OF THE BOARD OF DIRECTORS 2016
MARKET SITUATION IN 2016
Demand for Metsä Board’s lightweight, recyclable and ecological fresh fibre paperboard remained good in all of the company’s main market areas in 2016. Total paperboard deliveries grew by 12 per cent com-pared to the previous year. In terms of market areas, deliveries to EMEA grew by 10 per cent, while deliveries to the Americas and APAC grew by 14 per cent and 24 per cent, respectively.
Metsä Board’s folding boxboard deliveries grew by 14 per cent compared to the previous year. Deliveries by European folding box-board producers grew by 3 per cent. Metsä Board’s share of the total deliveries of European folding boxboard producers was 38 per cent and, of exports outside Europe, 68 per cent. Metsä Board’s deliveries of white fresh fibre linerboard grew by 8 per cent. Deliveries by European producers of white fresh fibre linerboard grew by 6 per cent. The price levels of folding boxboard and fresh fibre linerboards remained fairly stable.
The investment programme at Husum increased Metsä Board’s folding boxboard capacity by a total of 400,000 tonnes and its fresh fibre linerboard capacity by almost 150,000 tonnes in 2016. The company is selling the new folding boxboard primarily to the Americas and for food service packaging globally. At the end of the year, the total production capacity of European folding boxboard producers was approximately 3.7 million tonnes, of which Metsä Board’s share was 36 per cent. Correspondingly, at the end of the year, the total production capacity of European producers of white fresh fibre linerboard was approximately 2.2 million tonnes, of which Metsä Board’s share was 31 per cent.
The balance between the supply and demand for market pulp in 2016 was 91 per cent (2015: 92 per cent). The euro- and dollar-denom-inated market prices of long-fibre pulp in Europe declined by approxi-mately 6 per cent compared to the previous year. Correspondingly,
REPORT OF THE BOARD OF DIRECTORS 2016
KEY FIGURES
2016 2015 2014
Sales, EUR million 1,720.3 2,007.5 2,008.4
EBITDA, EUR million 234.6 302.5 242.2
comparable, EUR million 231.1 283.3 236.2
EBITDA, % of sales 13.6 15.1 12.1
comparable, % of sales 13.4 14.1 11.8
Operating result, EUR million 132.3 199.0 116.5
comparable, EUR million 137.5 179.9 136.5
Operating result, % of sales 7.7 9.9 5.8
comparable, % of sales 8.0 9.0 6.8
Result before taxes, EUR million 101.6 167.1 77.6
comparable, EUR million 106.8 150.2 99.7
Result for the period, EUR million 90.4 137.3 68.5
comparable, EUR million 93.6 120.2 88.1
Earnings per share, EUR 0.25 0.39 0.20
comparable, EUR 0.26 0.34 0.26
Return on equity, % 8.7 14.7 8.1
comparable, % 9.0 12.9 10.4
Return on capital employed, % 7.8 12.5 7.7
comparable, % 8.1 11.3 9.1
Equity ratio at the end of the period, % 48 46 39
Net gearing ratio at the end of the period, % 44 32 51
Interest-bearing net liabilities / EBITDA 1) 2.0 1.2 1.8
Shareholders’ equity per share at the end of the period, EUR 2.96 2.89 2.49
Interest-bearing net liabilities at the end of the period, EUR million 463.8 333.4 426.7
Gross investments, EUR million 162.4 177.8 44.2
Net cash flow from operations, EUR million 77.0 246.7 198.2
Average number of personnel in the period 2,588 2,851 3,200
Salaries and remuneration, EUR million 132.3 154.6 166.1
1) The ratio of the interest-bearing net liabilities to the comparable EBITDA of the previous 12 months at the end of the period.

REPORT OF THE BOARD OF DIRECTORS 2016 – FINANCIAL STATEMENTS 2016 21
the euro- and dollar-denominated market prices of short-fibre pulp in Europe declined by approximately 11 per cent.
In 2016, the euro’s average exchange rate in relation to the US dollar remained roughly on par with the previous years. In relation to the British pound and the Swedish krona, the average exchange rate of the euro strengthened by 13 per cent and 1 per cent, respectively.
PERFORMANCE IN FINANCIAL PERIOD 2016 (2015)
Metsä Board’s sales amounted to EUR 1,720.3 million (2,007.5). Sales declined due to a considerable decrease in paper deliveries. The operating result was EUR 132.3 million (199.0), and the comparable operating result was EUR 137.5 million (179.9). Items affecting comparability were EUR -5.2 million net and related primarily to the discontinuation of the wallpaper base business.
The operating result was weakened by the commissioning of the new folding boxboard machine at Husum, which had an effect on the production volumes of pulp and paperboard, especially during the first half of the year. A leak in the pulp mill’s recovery boiler and techni-cal challenges in the new folding boxboard production line delayed customer deliveries in the second and third quarters. The result for the financial period was also negatively impacted by the clearly lower price of the start-up volumes of folding boxboard from Husum and the fall in market pulp prices in comparison to the previous year. All in all, the profit development of Metsä Board’s Finnish mills was stable. Five Finnish mills set new records in terms of annual production. Exchange rate fluctuations after hedging had a clearly positive total impact on the operating result of the financial period.
The production costs of paperboards declined slightly from the previous year.
The total delivery volume of Metsä Board’s folding boxboard and white linerboards made from fresh fibre totalled 1,568,000 tonnes (1,404,000) in January–December. The delivery volume of papers amounted to 35,000 tonnes (478,000). Deliveries of market pulp amounted to 500,000 tonnes (549,000). The volume of pulp deliveries
declined due to the downtime attributable to the investment pro-gramme at Husum and the discontinued trading activity with Sappi.
The average prices of paperboards manufactured at Metsä Board’s mills in Finland decreased slightly in 2016. The euro- and dollar-denominated market prices of long-fibre and particularly short-fibre pulps decreased.
The net cash flow of the operations was EUR 77.0 million (246.7). Cash flow was impacted by the weaker result and the increase in work-ing capital due to the investment programme at Husum.
Financial income and expenses totalled EUR -30.7 million (-32.0), including foreign exchange rate differences from trade receivables, trade payables, financial items and the valuation of currency hedging instru-ments; totalling EUR -4.9 million (-3.4).
The result for the period before taxes was EUR 101.6 million (167.1). The comparable result before taxes was EUR 106.8 million (150.2). Income taxes amounted to EUR -11.3 million (-29.8). Income taxes of approximately EUR 9.6 million unrecognised in the previous year were recognised in the comparison period.
Earnings per share were EUR 0.25 (0.39). Comparable earnings per share were EUR 0.26 (0.34). The return on equity was 8.7 per cent (14.7), and the comparable return on equity was 9.0 per cent (12.9). The return on capital employed was 7.8 per cent (12.5), and the com-parable return on capital employed was 8.1 per cent (11.3).
INVESTMENTS
Gross investments in 2016 totalled EUR 162.4 million (177.8), primarily concerning the investment programme at Husum. These also include Metsä Board’s EUR 24.9 million investment in Metsä Fibre’s new bioproduct mill.
FINANCING
Metsä Board’s equity ratio at the end of 2016 was 48.2 per cent (31 December 2015: 46.5) and net gearing ratio was 44 per cent (31 December 2015: 32). The ratio of interest-bearing net liabilities to the
DELIVERY AND PRODUCTION VOLUMES
1,000 t 2016 2015 2014
Delivery volumes
Paperboards 1) 1,607 1,449 1,311
Papers 35 478 636
Market pulp 500 549 611
Production volumes
Paperboards 1) 1,708 1,481 1,370
Papers 23 430 629
Metsä Fibre’s pulp 2) 577 586 562
Metsä Board’s pulp 1,236 1,206 1,294
1) Includes wallpaper base.2) Equal to Metsä Board’s 24.9 per cent holding in Metsä Fibre.

22 FINANCIAL STATEMENTS 2016 – REPORT OF THE BOARD OF DIRECTORS 2016
comparable EBITDA of the previous 12 months was 2.0 at the end of the financial period (31 December 2015: 1.2).
The fair value of investments available for sale was EUR 195.9 million at the end of the financial period (31 December 2015: 210.2 million). The change in fair value from the beginning of the financial period, EUR -14.2 million, related to the decrease in the fair value of the shares in Pohjolan Voima Oy.
At the end of 2016, net interest-bearing liabilities amounted to EUR 463.8 million (31 December 2015: 333.4 million). Foreign currency-denominated loans accounted for 1.1 per cent of loans and floating-rate loans for 39 per cent, with the rest being fixed-rate loans. At the end of the year, the average interest rate on loans was 3.3 per cent (31 December 2015: 3.8), and the average maturity of long-term loans was 2.2 years (31 December 2015: 2.6). The interest rate maturity of loans was 14.9 months at the end of the year (31 December 2015: 20.6). During the period, the interest rate maturity varied between 14 and 21 months.
Net cash flow from operations in January–December was EUR 77.0 million (1–2/2015: 246.7). Working capital increased by EUR 74.5 million in January–December (1–2/2015: -72.2). Working capital grew as a result of the increase in the finished products inventory of folding boxboard and reduced trade payables related to the investment programme at Husum.
At the end of the financial period, an average of 6.4 months of the net foreign currency exposure was hedged, including the hedging of the balance sheet position. The degree of hedging during the period varied between three and seven months, on average. After the financial period, the company has decided to change the normal level of hedging in such a way that half of the projected annual net foreign currency flow, instead of the previous quarter, will be hedged in addition to the bal-ance sheet position. The amount of the hedging may deviate from the norm by 40 per cent in either direction. When hedging is at the normal level, the aim is to allocate it primarily to the following two quarters.
The financing agreement includes financial covenants concerning the Group’s financial performance and capital structure. The company has considerable headroom in relation to covenants set in the credit agreements.
Metsä Board’s liquidity has remained strong. At the end of the financial period, the available liquidity was EUR 422.6 million (31 December 2015: 486.5), consisting of the following items: liquid assets and investments of EUR 220.6 million, a syndicated credit facility of EUR 100.0 million, and undrawn pension premium (TyEL) funds of EUR 102.0 million. Of the liquid assets, EUR 215.5 million consisted of short-term deposits with Metsä Group Treasury, and EUR 5.1 million were cash funds and investments. Other interest-bearing receivables amounted to EUR 3.7 million. In addition, Metsä Board’s liquidity reserve is complemented by Metsä Group’s internal undrawn short-term credit facility of EUR 150.0 million.
In February, Standard & Poor’s Ratings Services raised Metsä Board’s credit rating by one notch from BB to BB+. The rating outlook was raised from stable to positive. The upgrade of the ratings has had no impact on Metsä Board’s current financing costs.
In June, Metsä Board agreed on extending its current syndicated credit agreement by two years. Following the extension, the facility, which consists of a loan facility of EUR 150 million and a revolving credit facility of EUR 100 million, will mature in March 2020.
In 2017, Metsä Board plans to lower the amount of interest-bearing liabilities by at least EUR 100 million, to improve the effectiveness of the balance sheet.
BUSINESS DEVELOPMENT
Demand for Metsä Board’s lightweight, ecological and recyclable fresh fibre paperboards remained good in all of the company’s main market areas in 2016. By relying on Husum’s new folding boxboard capacity, Metsä Board has been increasingly well-positioned to meet the growing global demand for premium fresh fibre paperboards. Metsä Board’s total paperboard deliveries grew by 12 per cent from the previous year.
Husum’s investment programme was brought to a conclusion in 2016, and the new folding boxboard machine in Sweden started up in February, slightly behind the original schedule. A leak in the pulp mill’s recovery boiler and technical problems in the finishing area of the new folding boxboard production line during the second and third quarters delayed customer deliveries. Due to the repair work on the recovery boiler, the planned annual maintenance schedule of the Husum inte-grated mill was extended by a week during the fourth quarter. By the end of the year, technical problems in the folding boxboard production line had been solved, and the average price of the order intake was at a good level. The EUR 10 million efficiency improvement programme launched at the Husum integrated mill in May progressed according to plan.
The installation of the main equipment for the extrusion coating line began in Husum during the third quarter. The coating line will be commissioned in 2017, and its paperboard coating capacity will be approximately 100,000 tonnes per year. The investment is valued at EUR 38 million, allocated primarily to 2016. Metsä Board also evalu-ates the commercial potential of other barrier solutions. The company is in a position to provide new barrier solutions, provided that there will be a profitable market for them.
The production of Metsä Board’s uncoated fine paper at Husum came to an end in July, and the last paper deliveries were made in the fourth quarter of the year.
In September, the company discontinued the production of wallpa-per base at the Kyro mill in Kyröskoski, Finland.
In June, Metsä Board invested EUR 24.9 million in the new bio-product mill of its associated company, Metsä Fibre. The company has no other financial commitments in the project. The investment will increase Metsä Board’s annual pulp capacity by approximately 200,000 tonnes starting from 2018.
LEGAL PROCEEDINGS
In May 2014, Metsä Board petitioned the District Court of Helsinki to revoke the judgment issued by the Arbitral Tribunal on 11 February 2014 that orders Metsä Board to pay EUR 19.7 million in damages to UPM Kymmene Corporation. In a judgment issued in June 2015, the District Court rejected Metsä Board’s petition. Metsä Board appealed the decision of the District Court to the Court of Appeal. The Court of Appeal dismissed Metsä Board’s appeal on 21 October 2016. Metsä Board has applied for leave to appeal the matter to the Supreme Court.
In the autumn of 2015, the Finnish Tax Administration gave an opinion against the deductibility of certain losses in Metsä Board’s 2014 taxation. Metsä Board has appealed the decision issued by the Tax Administration, as the company believes the losses are deductible.
RESEARCH AND DEVELOPMENT
Metsä Board is seeking growth in packaging paperboards by developing current and new products to ensure that the impact on the environment is minimal. The central objectives of the R&D operations are produc-

REPORT OF THE BOARD OF DIRECTORS 2016 – FINANCIAL STATEMENTS 2016 23
ing increasingly lightweight folding boxboards and linerboards as well as developing new products for the food service packaging segment. In 2016, the company continued its research and development work by concentrating on these strategic focus areas. The work was carried out as development projects, which will continue in 2017.
In 2016, Metsä Board introduced to the market PE-coated paper-boards suitable for food service packaging with the help of external converters. The company’s own extrusion coating line for PE-coated products will start up in 2017. Metsä Board is also developing other barrier solutions, and is investigating, among other things, the utilisa-tion of dispersion coating and bio-based coatings, and their commercial potential.
Lightness is the core property of Metsä Board’s premium paper-boards made from fresh fibres. To produce increasingly light-weight paperboards, Metsä Board is researching and developing a number of technologies. In-house fibre know-how, particularly in relation to BCTMP fibre, and self-sufficiency provide a solid basis for such work. Several projects will progress to the mill testing phase in early 2017.
Product safety is given great significance in Metsä Board’s growth areas, particularly in the food service packaging segments in the United States and Asia. Several development projects that improve Metsä Board’s ability to serve customers in product safety issues were completed in 2016. Changing product safety legislation and increas-ingly strict hygiene requirements for products and mills have prompted Metsä Board to develop its operations continuously.
During the review period, Metsä Board adopted a new operating and decision-making model in the steering of product development operations. The HR and equipment resources of Metsä Board’s own research and development lab were strengthened.
In 2016, Metsä Board’s research and development expenses were approximately EUR 6.3 (8.4) million. The research and development expenses accounted for approximately 0.4 (0.4) per cent of sales.
SUSTAINABILITY
Metsä Board is committed to promoting sustainability, continuously improving its operations and conducting responsible business. In addition to its own operations, Metsä Board is committed to sustain-ability throughout the supply chain and supports sustainable forest management.
The wood fibre used is 100 per cent traceable and always comes from sustainably managed forests. In 2016, Metsä Board’s mills used 7.9 million cubic metres of wood (8.3) including wood consumption in accordance with its holding in Metsä Fibre as well as external pulp purchases. 81 per cent (75) of the pulp originated from certified forests.
In 2016, Metsä Board’s wood supply countries included Finland, Sweden, the Baltic countries, and the European part of Russia. The majority of wood used in Finland comes from forests owned by Metsäliitto Cooperative owner-members. The origin of wood is verified by means of the PEFC®- and FSC®-certified Chain of Custody tracing method managed by Metsä Group’s wood supply organisation.
Metsä Board aims to help mitigate climate change through its operations. Metsä Board’s energy efficiency has improved by 7.8 per cent in 2009–2016. In 2016, energy efficiency weakened compared to the previous year due to the start-up of Husum’s new folding box-board production line. The efficiency improvement measures include optimising equipment, processes and operating methods as well as making investments. Improving energy efficiency is an essential part of all investments related to the production process. Metsä Board is com-
mitted to improving energy efficiency at its mills by 4 per cent by 2020 compared to year 2015.
Wood-based bioenergy accounted for 51 per cent of Metsä Board’s total energy consumption in 2016. The majority of this bioenergy is produced using by-products such as bark and black liquor. The rest is produced from forest energy materials.
Metsä Board continuously looks for ways to make the usage of fresh water in its production more efficient by reusing water efficiently, among other things. In 2016, the consumption of water was 70.3 mil-lion cubic metres (68.9). The consumption of process water decreased by approximately 16 per cent in 2010–2016. In 2016, water consump-tion increased temporarily due to the start-up of Husum’s new folding boxboard production line.
In 2016, Metsä Board received three significant recognitions from CDP (formerly the Carbon Disclosure Project) for its activities con-cerning environmental matters and the related reporting. Metsä Board was included on CDP’s Climate Change A list for the transparency of environmental impact reporting and for its operations leading to a reduction in carbon dioxide emissions. For the second time, Metsä Board was also the only forest industry company to be included on CDP’s Water A list, in recognition of its responsible use of water. Metsä Board was also awarded Leadership status in the materials sector of CDP’s forest programme for the second time.
All of Metsä Board’s production units have an ISO 9001 quality sys-tem and ISO 14001 environmental system in place, as well as a Chain of Custody system, which provides a reliable method to verify the ori-gin of wood and the proportion of certified wood in the products. An ISO 22000 food safety management system and an ISO 50001 energy efficiency system are in place in all of Metsä Board’s production units, and the mills in Finland also have an OHSAS 18001 occupational and product safety system.
No significant deviations resulting in significant environmental effects occurred in Metsä Board’s production units during the year under review. Some short-term deviations from permit limits were nevertheless recorded.
Metsä Board has environmental liabilities related to former opera-tions at sites that have since been closed, sold or leased, as well as at decommissioned landfill sites. Financial provisions for the cost of land rehabilitation work have been made in cases where it has been possible to measure the company’s liability for land contamination.
Metsä Board’s environmental liabilities in 2016 totalled EUR 6.2 million (5.8) and the environmental expenses amounted to EUR 16.4 million (18.4). The environmental expenses consist mainly of expenses related to the use and maintenance of environmental protection equip-ment, expenses related to waste management and environmental insur-ance, and depreciation of capitalised environmental expenses.
PERSONNEL
At the end of 2016, Metsä Board’s employed 2,466 (2,601) people, of whom 1,442 (1,494) worked in Finland. In January–December, Metsä Board employed 2,588 (2,851) people on average. Personnel expenses in 2016 totalled EUR 211.0 million (234.5).
In 2016, a new folding boxboard production line was taken into use at the Husum mill, which also adopted the organisational model required by the new operations at the same time. The development of the personnel’s production competence continued, in addition to which the commissioning phase was also supported by expertise assis-tance received from other mills. In Finland, the wallpaper base produc-
24 FINANCIAL STATEMENTS 2016 – REPORT OF THE BOARD OF DIRECTORS 2016
tion at the Kyro mill was discontinued, and the sheeting capacity of the Simpele mill was reduced. The operations of both units also underwent adjustment and development, which also had an impact on personnel.
The coaching aimed at the company’s supervisors, which began in 2015, continued. The coaching aims to develop and harmonise the company’s management and leadership activities. Metsä Board’s own extrusion coating line will start up at Husum in 2017. In preparation for this, the personnel of the production line underwent training and training related to the new product was planned for the rest of the personnel.
Occupational safety is developed continuously by influencing attitudes and proactive thinking. In 2016, the company implemented a project to speed up the improvement of occupational safety and the harmonisation of occupational safety standards at mills.
Occupational safety developed positively: in 2016, the number of accidents at work resulting in an absence of at least one day was 9 (11.1) per million hours worked. The long-term goal concerning lost-time accidents is zero.
Metsä Board invests in the maintenance of working capacity, which stresses the importance of anticipating working capacity risks by way of early support discussions, for example. In 2016, the rate of absences due to illness was 4.1 per cent (4.2).
SIGNIFICANT RISKS AND UNCERTAINTIES
Metsä Board assesses its strategic, operative, financial and liability risks as part of its continuing operations. The risks are reported to the Board of Directors at least twice a year and, if needed, in interim reports and the financial statements bulletin published by the company. In addition, the company carries out risk assessments as part of the annual planning and strategy process. The risk assessment carried out in the annual planning process focuses on identifying sales and cost risks, and the risk assessment in the strategy process reviews risks related to the implemen-tation of the company’s business strategy. The company’s management team reviews the company’s most significant risks regularly as part of its management work. The risk assessments carried out in 2016 identified the following risks and uncertainties that may have an impact on Metsä Board’s financial performance and ability to operate.
UNCERTAINTY IN THE DEVELOPMENT OF THE ECONOMY
Considerable uncertainties still exist in the global and, particularly, European economies. If realised, they may result in weakened demand and reduced prices for end products. Central uncertainties include the development of economic policies in the aftermath of the US presi-dential election and the uncertainty that the United Kingdom’s Brexit negotiations are creating in Europe. The slowdown and structural change in the Chinese economy may also have an effect on demand for Metsä Board’s products and on the growth outlooks for the markets.
CHANGES IN THE OPERATING ENVIRONMENT
Metsä Board operates in an industry where the balance between supply and demand has a significant impact on the demand for and prices of end products. New operators’ entry to the market, alternative products or changes in consumer behaviour may have a negative impact on demand for Metsä Board’s paperboards. An increase in competitors’ capacities or the expansion of product ranges may lower the price levels of end products and have a negative effect on Metsä Board’s profit-
ability. On the other hand, potential capacity closures in the industry or consolidation of the industry may result in increased prices.
Changes in regulations, such as the EU’s climate and environmental policy and increasing new requirements to limit carbon dioxide, sul-phur or other emissions, may increase production costs and weaken the profitability of business.
Possible changes in the industrial and trade policies of leading indus-trialised countries may lead to increased trade restrictions and subdue growth in the world economy. Increased protectionism and negative developments in international free trade would, if realised, have a weak-ening impact on Metsä Board’s result.
CENTRALISATION OF OPERATIONS IN A LIMITED GEOGRAPHICAL AREA
Seven of Metsä Board’s eight production units are located in Finland, and one of them is located in Sweden. Finland has a history of labour disputes in both the forest industry and the distribution chain of forest industry products. Such labour disputes may have a negative effect on production volumes and customer deliveries. This may impair the company’s competitiveness and profitability. Labour disputes in Sweden may also negatively affect Metsä Board’s production and cus-tomer deliveries and have a negative impact on the company’s business operations.
CONTINUITY OF CUSTOMER RELATIONSHIPS
Long-term problems in production, the supply chain or in the quality of products may jeopardise the continuity of customer relationships. At its worst, this may lead to the permanent loss of customer relationships.
BUSINESS DEVELOPMENT
The development and growth of Metsä Board’s business requires strategic choices that involve risks. These uncertainties are related to investment decisions, product selection and the selection of customer segments, for example.
The company’s paperboard capacity grew considerably in 2016. Getting the new production to the markets in full is dependent on the successful growth of sales, particularly in the Americas. Increasing sales at the global level also involves cost and exchange rate risks.
In 2017, the company will take into use its own extrusion coating line, which will allow it to expand its paperboard selection for food service packaging. At the same time, the company is continuing to develop other barrier solutions. The commercialisation of new prod-ucts involves uncertainties that, should they be realised, could have a negative impact on the demand for Metsä Board’s products and the company’s profitability.
PRICE RISKS OF PRODUCTION AND LOGISTICS COSTS
A radical and unforeseen rise in the price of production inputs impor-tant for Metsä Board’s operations, such as wood, energy and chemicals, as well as transportation costs or problems with their availability, may reduce profitability and threaten the continuity of operations. Metsä Board works to hedge against this risk by entering into long-term deliv-ery agreements and goods-related derivative contracts.
In addition, a steep increase in transportation and other logistics costs, for example related to the EU’s emissions trading or other obliga-tions, may have an effect on Metsä Board’s profitability
REPORT OF THE BOARD OF DIRECTORS 2016 – FINANCIAL STATEMENTS 2016 25
LIABILITY RISKS
Metsä Board’s business operations involve various types of liability risks arising from damage to third parties, such as general operational liabil-ity risks, contract risks, environmental risks and product liability risks. These risks are mitigated by way of efficient business processes, agree-ment training, management practices, quality control and transparent operations. Some of the operational liability risks have been hedged with insurance policies.
BUSINESS INTERRUPTION RISKS
Large losses, major accidents, natural disasters, environmental damage, serious malfunctions in key information systems, labour disputes and delivery problems of the most important raw materials may interrupt Metsä Board’s business operations and, if prolonged, even cause loss of customers. The mills have drawn up continuity and recovery plans in preparation for the realisation of such risks. The property and interrup-tion risks of the production units are assessed regularly and these risks are mainly covered by insurance contracts.
PERSONNEL AVAILABILITY AND RETENTION
Metsä Board has paid special attention to ensuring the availability and retention of competent personnel by means of various personnel development programmes and successor plans, and by investing in its employer image. Metsä Board prepares for retirements and other per-sonnel risks also through the promotion of multiple skills and working capacity as well as through job rotation.
RISKS ASSOCIATED WITH THE AVAILABILITY OF FINANCING
Furthermore, as a result of increasing regulation in the financial market, the operations of credit and bond markets may become more difficult, which may impact the company’s ability to acquire long-term debt financing at a competitive price. The financial risks are managed in accordance with the treasury policy approved by Metsä Board’s Board of Directors. The purpose is to hedge against considerable financial risks, balance cash flow and give the business units enough time to adjust their operations according to the changing conditions.
The exchange rate of the euro in relation to, in particular, the US dollar, Swedish krona and the British pound impacts Metsä Board’s profitability. Metsä Board’s financial risks, related primarily to curren-cies, interest rates, liquidity, counterparty risks and the use of derivative instruments as well as the management thereof, are described in greater detail on pages 65–73 of this Annual Report.
CREDIT RISKS
The management of credit risks related to commercial operations is the responsibility of Metsä Board’s executive management and Metsä Group’s centralised credit control. Metsä Board’s management deter-mines the limits on credit extended to customers and the applicable terms of payment in cooperation with the centralised credit control. Nearly all credit risks are transferred further to credit insurance com-panies by means of credit insurance contracts. Metsä Board’s customer credit risk was at a normal level in 2016. Measures are taken to reduce the risk further by intensifying internal credit control and its processes. The main principles of credit control are defined in the credit guide-
lines of the risk management policy approved by the company’s Board of Directors.
PREPARING FOR RISKS
The identified risks are monitored and continuously assessed and prepared for in the manner most appropriate for the company. With regard to loss risks, Metsä Board works actively with insurance compa-nies in risk management, for example by regularly executing risk assess-ments in different areas of the business operations, such as at mills and in the export chain. The production units have prepared for potential disturbances to operations by drawing up continuity and recovery plans. The company’s crisis management plan directs crisis management in the production and operative units.
Some of the risks are borne by the company itself, whereas some of them are selectively transferred by means of, for example, insurance contracts, derivative contracts and other contract terms and conditions to be borne by insurance companies, banks and other counterparties. The most common loss risks are mainly covered by the following com-prehensive global insurance contracts:– property and business interruption insurance– general third-party and product liability insurance– liability insurance for Directors and Officers– credit insurance– carriage loss insurance.
SHARES
In January–December, the highest price for Metsä Board’s B share on the Nasdaq Helsinki was EUR 7.15, the lowest price was EUR 4.23, and the average price was EUR 5.34. At the end of the year, the price of the B share was EUR 6.80. In January–December, the highest price for Metsä Board’s A share was EUR 6.93, the lowest price was EUR 4.80, and the average price was EUR 5.85. At the end of the year, the price of the A share was EUR 6.75.
In 2016, the average daily trading volume of the B and A shares on the Nasdaq Helsinki was 734,042 shares and 3,070 shares, respectively. The total trading volume of the B and A shares was EUR 992.4 million and EUR 4.5 million, respectively. At the end of the year, the market value of all Metsä Board shares was EUR 2.4 billion, of which the market value of the B shares and the A shares accounted for EUR 2.2 billion and EUR 242 million, respectively.
In addition to the Nasdaq Helsinki, Metsä Board’s shares are traded on other marketplaces, such as Chi-X and BATS.
At the end of the year, Metsäliitto Cooperative owned 42 per cent of the shares, and the voting rights conferred by these shares amounted to 61 per cent. At the end of the year, international and nominee-registered investors held 15 per cent of the shares (31 December 2015: 20 per cent).
The company does not hold any treasury shares and the Board of Directors does not have any authorisation to acquire company’s own shares.
BOARD OF DIRECTORS’ PROPOSAL FOR DISTRIBUTION OF PROFIT
The distributable funds of the parent company on 31 December 2016 were EUR 491.1 million, of which the retained earnings for the finan-cial year are EUR 106.3 million.

26 FINANCIAL STATEMENTS 2016 – REPORT OF THE BOARD OF DIRECTORS 2016
The Board of Directors proposes to the Annual General Meeting to be held on 23 March 2017 that a dividend of EUR 0.19 per share, or a total of EUR 67.5 million, be paid for the 2016 financial period The proposed dividend is equal to 76 per cent of the earnings per share for 2016 and 73 per cent of the comparable earnings per share.
The dividend will be paid to shareholders who are registered in the company’s shareholders register held by Euroclear Finland Oy on the dividend payment record date of 27 March 2017. The Board of Directors proposes 3 April 2017 as the dividend payment date.
BOARD OF DIRECTORS AND AUDITORS
In March 2016, the Annual General Meeting confirmed the number of members of the Board of Directors as nine and re-elected the following individuals to the Board of Directors: Mikael Aminoff, Martti Asunta, Kari Jordan, Kirsi Komi, Kai Korhonen, Liisa Leino, Juha Niemelä, Veli Sundbäck and Erkki Varis. The Board members’ term of office expires at the end of the next Annual General Meeting.
At its constitutive meeting, the Board of Directors elected Kari Jordan as Chairman and Martti Asunta as Vice Chairman. The Board further resolved to organise the Board committees as follows: the members of the Audit Committee are Kirsi Komi, Kai Korhonen, Veli Sundbäck and Erkki Varis, and the members of the Nomination and Compensation Committee are Mikael Aminoff, Martti Asunta, Kari Jordan, Liisa Leino and Juha Niemelä.
Authorised Public Accountants KPMG Oy Ab was elected as the company’s auditor, with APA Raija-Leena Hankonen as the principal auditor. The term of office of the auditor expires at the end of the next Annual General Meeting.
A separate Corporate Governance Statement has been issued and published simultaneously with the financial statements and this Annual Report.
NEAR-TERM OUTLOOK
The growth in Metsä Board’s paperboard deliveries is expected to continue. The growth is supported by Husum’s new folding boxboard production, sold primarily to the Americas.
The profit development of Finnish mills is expected to remain sta-ble, and the production costs of paperboards in the first quarter of the year are expected to remain at the level of the fourth quarter in 2016.
Hardly any planned maintenance shutdowns are set to take place in the first quarter of the year; this will have a positive impact on the result of the first quarter in comparison to other quarters. The most notable planned maintenance shutdowns will take place at the Kemi integrated mill in the third quarter of the year and at the Husum integrated mill in the fourth quarter.
Demand for premium fresh fibre paperboards is expected to remain good in both Europe and the Americas. The market prices of folding boxboard and white fresh fibre linerboard are expected to remain stable. Global demand and supply for long-fibre and short-fibre pulp is expected to remain stable.

CONSOLIDATED STATEMENT OF COMPREHENSIVE INCOME – FINANCIAL STATEMENTS 2016 27
EUR million Note 1 JAN–31 DEC 2016 1 JAN–31 DEC 2015
SALES 3, 31 1,720.3 2,007.5
Change in stocks of finished goods and work in progress 6 38.5 -15.1
Other operating income 5, 31 40.2 47.7
Materials and services 6, 31 -1,249.5 -1,408.0
Employee costs 6 -211,0 -234.5
Share of result from associated company 13, 31 45,0 61.3
Depreciation, amortisation and impairment charges 3, 7 -102.3 -103.5
Other operating expenses 6, 31 -148.9 -156.4
OPERATING RESULT 132.3 199.0
Share of result from associated companies and joint ventures 13 0.1 0.1
Net exchange gains/losses 8 -4.9 -3.4
Other financial income 8, 31 0.8 1.1
Interest and other financial expenses 8, 31 -26.6 -29.7
RESULT BEFORE TAX 101.6 167.1
Income taxes 9 -11.3 -29.8
RESULT FOR THE PERIOD 90.4 137.3
OTHER COMPREHENSIVE INCOME
ITEMS THAT WILL NOT BE RECLASSIFIED TO PROFIT OR LOSS 20
Actuarial gains/losses on defined pension plans 1.3 6.3
Income tax relating to items that will not be reclassified 0.3 -2.7
Total 1.6 3.6
ITEMS THAT MAY BE RECLASSIFIED TO PROFIT OR LOSS 20
Cash flow hedges 27,0 -2.9
Available for sale investments -14.2 -23.0
Translation differences -12.3 7.0
Share of result from other comprehensive income of associated companies and joint ventures -5.6 0.3
Income tax relating to components of other comprehensive income -2.8 5.5
Total -7.9 -13.1
Other comprehensive income, net of tax -6.4 -9.5
TOTAL COMPREHENSIVE INCOME FOR THE PERIOD 84,0 127.8
RESULT FOR THE PERIOD ATTRIBUTABLE TO:
Shareholders of parent company 90.4 137.3
Non-controlling interest 0,0 0.0
90.4 137.3
TOTAL COMPREHENSIVE INCOME FOR THE PERIOD ATTRIBUTABLE TO:
Shareholders of parent company 84,0 127.8
Non-controlling interests 0,0 0.0
84,0 127.8
BASIC AND DILUTED EARNINGS PER SHARE FOR RESULT ATTRIBUTABLE TO SHAREHOLDERS OF PARENT COMPANY, EUR 10 0.25 0.39
CONSOLIDATED STATEMENT OF COMPREHENSIVE INCOME
The notes are an integral part of the financial statements.

28 FINANCIAL STATEMENTS 2016 – CONSOLIDATED BALANCE SHEET
31 DEC 2015EUR million Note 31 DEC 2016
ASSETS
NON-CURRENT ASSETS
Goodwill 11 12.4 12.4
Other intangible assets 11 14.7 13.7
Tangible assets 12, 32 829.8 812.3
Investments in associated companies and joint ventures 13 291.6 260.2
Available for sale investments 13, 14, 27 195.9 210.2
Other non-current financial assets 15, 27 16.3 14.6
Derivative financial instruments 26, 27 2.6 -
Deferred tax receivables 16 4.3 4.5
1,367.7 1,327.9
CURRENT ASSETS
Inventories 17 332.5 299.3
Accounts receivables and other receivables 18, 23, 27, 31 265.3 270.9
Current income tax receivables 5.2 0.0
Derivative financial instruments 26, 27 2.9 0.2
Cash and cash equivalent 19, 23, 27, 31 220.6 321.8
826.5 892.2
TOTAL ASSETS 2,194.2 2,220.1
SHAREHOLDERS’ EQUITY AND LIABILITIES
EQUITY ATTRIBUTABLE TO SHAREHOLDERS OF PARENT COMPANY 20
Share capital 557.9 557.9
Translation differences 3.2 14.2
Fair value and other reserves 114.7 111.7
Reserve for invested unrestricted equity 383.1 383.1
Retained earnings -6.4 -38.0
1,052.5 1,028.9
NON-CONTROLLING INTERESTS 0.0 0.0
TOTAL SHAREHOLDERS’ EQUITY 1,052.5 1,028.9
NON-CURRENT LIABILITIES
Deferred tax liabilities 16 74.7 80.2
Post employment benefit obligations 21 15.1 14.6
Provisions 22, 32 6.9 8.3
Borrowings 23, 26, 27 469.0 611.3
Other liabilities 24, 26, 27 0.1 0.2
Derivative financial instruments 26, 27 1.7 11.3
567.5 725.9
CURRENT LIABILITIES
Provisions 22, 32 3.0 13.8
Current borrowings 23, 26, 27,31 219.1 47.6
Accounts payable and other liabilities 25, 26, 27, 31 333.2 387.3
Current income tax liabilities 5.9 2.9
Derivative financial instruments 26, 27 13.0 13.7
574.2 465.3
TOTAL LIABILITIES 1,141.7 1,191.2
TOTAL SHAREHOLDERS’ EQUITY AND LIABILITIES 2,194.2 2,220.1
CONSOLIDATED BALANCE SHEET
The notes are an integral part of the financial statements.

STATEMENT OF CHANGES IN SHAREHOLDERS’ EQUITY – FINANCIAL STATEMENTS 2016 29
Equity attributable to shareholders of parent company
EUR million NoteShare
capitalTranslationdifferences
Fair value and other
reserves
Reserve for invested
unrestricted equity
Retainedearnings Total
Non- controlling
interest Total
Shareholders' equity, 1 Jan 2015 557.9 6.9 132.1 284.8 -140.3 841.4 0,0 841.4
Result for the period 137.3 137.3 0.0 137.3
Other comprehensive income net of tax 20 7.3 -20.4 3.6 -9.5 -9.5
COMPREHENSIVE INCOME TOTAL 7.3 -20.4 140.9 127.8 0.0 127.8
Share based payments 0.8 0.8 0.8
Related party transactions
Share issue net of transaction costs 98.3 98.3 98.3
Dividend distribution 4 -39.4 -39.4 -39.4
SHAREHOLDERS' EQUITY, 31 DEC 2015 557.9 14.2 111.7 383.1 -38.0 1,028.9 0.0 1,028.9
Shareholders' equity, 1 Jan 2016 557.9 14.2 111.7 383.1 -38.0 1,028.9 0.0 1,028.9
Result for the period 90.4 90.4 0.0 90.4
Other comprehensive income net of tax 20 -10.9 3.0 1.6 -6.4 -6.4
COMPREHENSIVE INCOME TOTAL -10.9 3.0 91.9 84.0 0.0 84.0
Share based payments 0.0 0.0 0.0
Related party transactions
Dividend distribution -60.4 -60.4 -60.4
SHAREHOLDERS' EQUITY, 31 DEC 2016 557.9 3.2 114.7 383.1 -6.4 1,052.5 0.0 1,052.5
STATEMENT OF CHANGES IN SHAREHOLDERS’ EQUITY
The notes are an integral part of the financial statements.

30 FINANCIAL STATEMENTS 2016 – CONSOLIDATED CASH FLOW STATEMENT
2015EUR million Note 2016
CASH FLOW FROM OPERATING ACTIVITIES
Profit for the period 90.4 137.3
Adjustments to the result, total 28 73.4 66.3
Interest received 0.2 0.6
Interest paid -22.3 -24.9
Dividends received 8, 13 33.0 25.0
Other financial items, net 2.7 -8.5
Income taxes paid -25.8 -21.3
Change in working capital 28 -74.5 72.2
NET CASH FLOW FROM OPERATING ACTIVITIES 77.0 246.7
CASH FLOW FROM INVESTING ACTIVITIES
Acquisition of associate company shares -24.9 -
Acquisition of other shares - -1.5
Capital expenditure -133.5 -175.0
Proceeds from disposal of shares in subsidiary, net of cash 4, 28 1.6 -38.2
Proceeds from disposal of other shares 0.1 1.1
Proceeds from sale of tangible and intangible assets 14.4 6.5
Proceeds from non-current receivables -0.8 0.0
NET CASH FLOW FROM INVESTING ACTIVITIES -143.2 -207.1
CASH FLOW FROM FINANCING ACTIVITIES
Share issue net of transaction costs - 97.9
Proceeds from non-current interest bearing liabilities 5.9 7.6
Payment of non-current interest bearing liabilities -44.1 -34.1
Proceeds from current liabilities, net 63.0 -1.1
Change in current interest bearing receivables, net 0.0 0.1
Change in non-current non-interest bearing liabilities, net -0.1 -0.2
Dividends paid -60.4 -39.4
NET CASH FLOW FROM FINANCING ACTIVITIES -35.7 30.8
CHANGE IN CASH AND CASH EQUIVALENTS -101.9 70.4
Cash and cash equivalents at beginning of period 321.8 250.4
Translation adjustments 0.7 1.0
Changes in cash and cash equivalents -101.9 70.4
CASH AND CASH EQUIVALENTS AT END OF PERIOD 19 220.6 321.8
CONSOLIDATED CASH FLOW STATEMENT
The notes are an integral part of the financial statements.

NOTE TO THE ACCOUNTS 1 – FINANCIAL STATEMENTS 2016 31
NOTES TO THE CONSOLIDATED FINANCIAL STATEMENTS
1. Accounting policies
The principal accounting policies adopted in the preparation of the consolidated financial statements are as follows.
MAIN OPERATIONS
Metsä Board Corporation and its subsidiaries comprise a forest indus-try group. After Metsä Board’s uncoated paper production ended in July 2016, the remaining business operations of the Group consist solely of folding boxboard, fresh fibre linerboard and market pulp businesses previously reported under Paperboard segment and complemented by the wallpaper base production at Kyro mill, which was discontinued in September 2016. As the paper business previously reported under Non-core operations segment has been fully discontinued, Metsä Board reports on its financial performance starting from third quarter of 2016 using only one reporting segment.
Metsä Board Corporation is Group’s parent company, which is domiciled in Helsinki. The registered address of the company is Revontulenpuisto 2, 02100 Espoo Finland. The parent company is listed on Nasdaq Helsinki Ltd. At the end of 2016 Metsäliitto Cooperative owned 41.8 per cent of the shares, and the voting rights conferred by these shares were 61.5 per cent.
The copy of the annual report can be obtained from Metsä Board’s website www.metsaboard.com or parent company’s head office at Revontulenpuisto 2, 02100 Espoo Finland.
The Group consolidated financial statements were authorised for issue by the Board of Directors on 2 February 2017.
According to Finnish Companies Act shareholders can accept or reject the financial statements in General Meeting of shareholders after date of publication. General Meeting of shareholders also have possibil-ity to decide to change financial statements.
ACCOUNTING POLICIES AND MEASUREMENT BASES
Metsä Board Corporation’s consolidated financial statements have been prepared in accordance with the International Financial Reporting Standards (IFRS), applying the IAS and IFRS standards and SIC and IFRIC interpretations that were effective and approved by the EU at the date of the financial statements 31 December 2016. International Financial Reporting Standards refer to the standards and their interpre-tations approved for use in the EU by the Finnish Accounting Act and the regulations set out pursuant to it in accordance with the procedure defined in the EU regulation (EC) no. 1606/2002. The notes to the consolidated financial statements also comply with the requirements of Finnish accounting and company legislation supplementing the IFRS regulations.
The consolidated financial statements are presented in millions of euros, unless otherwise noted.
These financial statements have been prepared based on original acquisition costs, excluding available-for-sale financial assets, financial assets to be recognised at fair value through profit and loss, hedged
items in fair value hedging, and share-based business operations settled by means of cash, which have been recognised at fair value.
GOING CONCERN
According to management assessment, the Group has sufficient resources to continue as a going concern in foreseeable future. Consequently, the group has prepared the financial statements on a going concern basis.
NEW AND AMENDED STANDARDS APPLIED
IN THE FINANCIAL YEAR ENDED
The Group has applied the same accounting policies in preparation of the consolidated financial statements as in the annual financial state-ments for 2015 except for the effect of changes required by the adop-tion of the following new standards, interpretations and amendments to existing standards and interpretations on 1 January 2016.
Amendment to IAS 1 Presentation of Financial Statements: Disclosure Initiative. The amendments clarify the guidance in IAS 1 in relation to applying the materiality concept, disaggregating line items in the balance sheet and in the income statement, presenting subtotals and to the structure and accounting policies in the financial statement. The amendments have not had a significant impact on Group’s consolidated financial statements.
Amendments to IFRS 11 Joint Arrangements – Accounting for Acquisitions of Interests in Joint operations: The amendments require business combination accounting to be applied to acquisitions of inter-ests in a joint operation that constitutes a business. The amendments have had no impact on Group’s consolidated financial statements.
Annual Improvements to IFRSs (2012–2014 cycle): The annual improvements process provides a mechanism for minor and non-urgent amendments to IFRSs to be grouped together and issued in one pack-age annually. The cycle contains amendments to four standards. Their impacts vary standard by standard but are not significant.
PRINCIPLES OF CONSOLIDATION
SUBSIDIARIES
Subsidiaries include all companies (including structured entities) in which the Group has the right to control the principles of finances and operations. The Group controls the entity when it is exposed, or has right, to variable returns from its involvement with the entity and has the ability to affect those returns through its power over the entity. Subsidiaries are consolidated in the consolidated financial statements in their entirety starting on the day on which the Group obtains control in them. Consolidation is terminated when control ceases. Business combinations are processed using the acquisition method. Consideration paid for the purchase of a subsidiary is determined as the fair value of paid assets, assumed liabilities and equity shares issued by the Group. The assigned consideration includes the fair value of an asset or liability arising as the result of a contingent consideration arrangement. Acquisition-related costs, excluding expenses incurred
NOTE TO THE ACCOUNTS 1

32 FINANCIAL STATEMENTS 2016 – NOTE TO THE ACCOUNTS 1
by the issuance of debt securities or equity securities, are recognised as expenses as they materialise. A paid consideration does not include transactions to be handled separately from the acquisition. The impact of these has been recognised though profit and loss in the acquisition. A possible contingent additional sales price has been measured at fair value at the time of acquisition and classified either as liability or equity. An additional sales price classified as liability is measured at fair value on the closing date of each reporting period and the resulting profit or loss is recognised through profit and loss. The additional sales price classified as equity is not measured again.
The amount, by which the sum of paid consideration, proportion of non-controlling shareholders in the acquisition target and previously owned proportion exceeds the Group’s proportion of the fair value of the acquired net assets, is reported in balance sheet as goodwill. If the total amount of consideration, proportion of non-controlling shareholders and previously owned portion is lower than fair value of acquired net assets, the difference is recognised in income statement.
Acquired subsidiaries are consolidated from the point of time at which the Group obtains control of them. Disposed subsidiaries are included in consolidated Group accounts until the time they are no longer under Group control.
The combined amount by which the sum of a consideration paid, the fair value of the proportion of non-controlling shareholders, and the fair value of the previously owned proportion of the target exceeds the fair value of identifiable net assets is reported on the balance sheet as goodwill. If the combined amount of the consideration paid, the fair value of the proportion of non-controlling shareholders, and the fair value of the previously owned proportion is smaller than the fair value of the acquired net assets of a subsidiary, the difference is recognised through profit and loss.
Business transactions, receivables and liabilities between the Group companies and unrealised profits are eliminated. Unrealised losses are not eliminated if the loss arises from impairment. The accounting principles followed by subsidiaries have been amended to correspond to the principles followed by the Group as necessary.
In an acquisition that is completed in stages, the previous holding is valued at fair value and the generated gain or loss is recognised through profit and loss. When the Group loses its control in a subsidiary, the remaining investment is measured at fair value on the date control is lost and the subsequent difference is recognised through profit and loss. Furthermore, when the Group loses its control, it handles all amounts recognised in other items of comprehensive income statement related to the subsidiary on the same basis as they should be handled if the Group had transferred the assets and liabilities in question directly. The acquisitions prior to 1 January 2010 have been accounted for according to the standards in effect during that time.
STRUCTURED ENTITY
Alrec Boiler Oy, which was established for the combustion of Metsä Board’s Kaskinen BCTMP mill’s own concentrate in 2009, has been consolidated as a subsidiary until 27 June 2016. The project was a fixed-term (seven years) product development project. Metsä Board Corporation acquired direct ownership of the combustion facility at Kaskinen and sold its shares in Alrec Boiler Oy to its partner company in accordance with the shareholder agreement between the parties on 27 June 2016.
TRANSACTIONS WITH NON-CONTROLLING INTERESTS
Business transactions with non-controlling interests are processed in the same way as those with Group shareholders. When shares are purchased from non-controlling interest, the difference between the consideration paid and the proportion of the net assets in the subsidi-ary purchased is recognised in equity. Also, profit or loss from sale of shares to non-controlling interest is recognised in equity.
JOINT OPERATIONS
A joint operation is a joint arrangement in which parties who have joint control in the arrangement have rights concerning the assets related to the arrangement and obligations concerning liabilities. “Joint control” means considering the control concerning the arrangement shared based on an agreement, and it prevails only when decisions concerning important operations require the unanimous approval of the parties sharing the control.
The Group consolidates in its financial statements its share of the assets, liabilities, income and expenses of the joint operation. The relevant assets, liabilities, income and expenses accounting items related to the Group’s share of the joint operation are treated in accordance with IFRS.
The Group recognises the gains or losses caused by assets sold to a joint operation only in the extent of the proportion of the other parties to the joint operation. When such business transactions provide evi-dence of a decreased net realisation value of assets to be sold to the joint operation or an impairment loss concerning these assets, the Group recognises these losses in full.
The Group does not recognise its proportion of the gains and losses of the joint operation generated by assets the Group purchased from the joint operation until it sells the said assets on to a third party. When such business transactions provide evidence of a decreased net realisa-tion value of assets to be purchased or an impairment loss concerning these assets, the Group recognises its proportion of these losses.
ASSOCIATED COMPANIES AND JOINT VENTURES
Associated companies include all companies in which the Group has significant influence but no control. Usually, significant influence is based on shareholding conferring 20–50 per cent of the voting rights. A joint venture is a joint arrangement whereby the parties that have joint control of the arrangement have rights to the net assets of the arrangement.
Investments in associated companies and joint ventures are pro-cessed using the equity method, and they are initially recognised at cost. The Group’s shares in associated companies and joint ventures also include the goodwill measured at the time of acquisition less any impairment.
The Group’s share of profits or losses of associated companies and joint ventures following the acquisition is recognised in the income statement, and its proportion of changes in equity after the acquisition is recognised in other items of other comprehensive income. The book value of the investment is adjusted for changes accumulated after the acquisition. If the Group’s share of an associated company’s or joint ventures’ losses is as large as or larger than its share of the associated company or joint venture including any other unsecured receivables, the Group will not recognise additional losses unless it has commit-ments concerning the associated company or joint venture and it has not made payments on behalf of it.

NOTE TO THE ACCOUNTS 1 – FINANCIAL STATEMENTS 2016 33
A proportion corresponding to the Group’s shareholding is elimi-nated from unrealised profits between the Group and its associated companies and joint ventures. Unrealised losses are also eliminated unless the transaction indicates an impairment of the value of the asset. The accounting principles followed by associated companies and joint ventures have been amended to correspond to the principles followed by the Group as necessary. Gains or losses due to the dilution effect when shareholding in associated company and joint venture invest-ments decreases are recognised in the income statement.
On the closing day of each reporting period, the Group assesses whether there are any indications of impairment of an investment made in an associated company or joint venture. If any such indications are detected, the Group tests the entire book value as one asset item by comparing the amount recoverable from it to its book value.
The Group’s share of the profits of associated companies and joint ventures is reported in income statement on a separate line “Share of profits from associated companies and joint ventures” in operating profit if the associated company or joint venture essentially is linked to Group’s business, otherwise below operating profit. The Group’s share of post-acquisition movements in other comprehensive income is recognised in other comprehensive income.
TRANSACTIONS IN FOREIGN CURRENCY
The figures concerning the profit and financial position of Group units are presented in the currency that is used in the primary operating envi-ronment of the unit in question. The consolidated financial statements are presented in euros, which is the parent company’s functional and presentation currency. Business transactions denominated in foreign currencies are recognised in the operating currency using the rate of the transaction date. Monetary items denominated in foreign currencies are translated into functional currency using the rate of the closing date. Non-monetary items in foreign currencies recognised at fair value have been translated into functional currency using the rate of the date on which the value was determined. Otherwise, non-monetary items have been recognised using the rate of the transaction date.
Any gains or losses resulting from transactions in foreign curren-cies, and from the translation of monetary items, are recognised under financial income and expenses with the exception of liabilities classified as hedges for net investment in a foreign entity, for which the currency gains and losses are recognised for the part of hedge proven effective in the translation differences in other comprehensive income. A change in the fair value of a derivative hedge (currency forward contracts) proven effective is recognised in other comprehensive income, and only after the realisation of the forecasted sales transaction is it recognised in income statement as an adjustment of the hedged sales.
More information about foreign currency hedging is provided under section “Derivative financial instruments and hedge accounting” of the accounting principles.
The income statements of Group companies whose functional currencies are other than euro are translated into euros using average exchange rates for the reporting period, and their balance sheets at the exchange rates prevailing at the balance sheet date. Translation differences arising on translation and on applying the purchase method of consolidation are recognised in other comprehensive income. In conjunction with divestments of subsidiaries, either by selling or by dis-solving, translation differences accumulated by the time of divestment are recognised in the income statement as part of the gain or loss from the divestment.
When making the transition to IFRS, translation differences that arose prior to 1 January 2004, which was the transition date to IFRS standards, were recorded in the Group’s retained earnings by applying the exemption under IFRS 1, and they are no longer entered in the income statement if the subsidiary is disposed of subsequently. Staring from transition date, translation differences have been presented in shareholders’ equity as separate item.
FINANCIAL ASSETS
Financial assets have been classified according to IAS 39 standard as follows:1) Financial assets at fair value through profit or loss,2) Held-to-maturity investments,3) Loans and other receivables, and4) Available-for-sale financial assets.
Categorisation depends on the purpose for which the assets were acquired and is made at the time they were originally recorded. Financial assets are initially recognised at fair value. Transaction costs are originally included in the carrying value, when the item is not measured at fair value through profit and loss. The transaction costs related to the items measured at fair value through profit and loss are recognised immediately to profit and loss. Financial assets are derecog-nised when the Group has lost the contractual right to receive cash flows or it has transferred substantially risks and rewards of ownership to outside the Group. Financial asset purchases and sales are recorded at the settlement date.
Financial assets at fair value through profit and loss are investments classified as held for trading. Held for trading financial assets are mainly derivatives, for which hedge accounting is not applied. The principles applied to accounting and valuation of these instruments are provided below under section “Derivative financial instruments and hedge accounting”.
Held-to-maturity investments include those investments with a maturity of more than six months which the Group has full intention and ability to retain until the date of their maturity. The Group has no held-to-maturity investments.
Loans and other receivables are non-derivative financial assets with fixed or determinable payments that are not quoted in an active market. Loans and other receivables comprise external and Metsä Group’s inter-nal accounts, loan and other receivables including accounts receivables. Financial assets designated in these categories are carried at amortised cost using the effective interest method.
Available-for-sale financial assets are publicly quoted and unquoted shares. They are valued at fair value, or if fair value cannot be reli-ably determined, at cost less impairment. The fair values of publicly quoted shares are based on the share price at the date of the financial statements. If there are no quoted prices for available-for-sale financial assets, the Group applies different types of valuation in their valuation, such as recent transactions and discounted cash flow. In this valuation, information received from the market is usually used, and factors speci-fied by the Group itself are used as little as possible. Changes in fair value are recognised under other comprehensive income and presented in fair value reserve, taking tax effect into account. Accumulated changes in fair value are transferred from equity to profit and loss as a correction of classification when the investment is divested or its value has been impaired so that an impairment loss is to be recognised for the investment.

34 FINANCIAL STATEMENTS 2016 – NOTE TO THE ACCOUNTS 1
Cash and cash equivalents consist of cash and other short-term, highly liquid investments which can be easily converted to an amount of cash known in advance and which carry a minimal risk of value changes. Metsä Board has classified short-term money market invest-ments as cash and cash equivalents.
The Group assesses at each balance sheet date whether there is objective evidence of impairment of a financial asset. Objective evi-dence of impairment of available-for-sale financial assets includes a sig-nificant or long-term decrease of the value of the investment under the acquisition cost. If the fair value of investments has moved substantially under acquisition cost for a period of time exceeding the period of time defined by the Group, there is indication that the value of the invest-ment is impaired. If there is evidence of impairment, the accumulated losses recognised in fair value reserve shall be transferred to profit and loss. Impairment losses of equity instruments classified as available for sale financial assets shall not be reversed through profit and loss.
The criteria for determining whether there is objective evidence of impairment of financial assets include:– significant financial problems of the issuer or debtor;– breach of contractual terms and conditions, such as defaults on
interest or capital payments;– concessions given by the Group to the debtor due to its financial
or legal reasons related to its financial problems that it would not otherwise contemplate giving
– probability of the debtor’s bankruptcy– financial asset in question no longer having an active market due to
financial problems.
Impairment testing of accounts receivables is described below in section “Accounts receivables”.
The amount of the impairment loss is determined as the difference between the carrying amount of the financial asset and the current value of the estimated cash flows of the financial asset discounted using the original effective interest rate (excluding any non-realised future credit losses). Impairment of financial assets has to be recorded if the carrying amount of the financial asset exceeds its recoverable amount. The carrying amount of the asset is decreased and the loss is recognised in the consolidated income statement. If the amount of the impairment loss decreases during a subsequent period and the decrease can be objec-tively linked to an event realised after the recording of the impairment (such as the debtor’s credit rating improving), the impairment loss is reversed in the income statement. Unless the assets classified as held for sale investments, for which the impairment loss is always reversed in the other comprehensive income.
FINANCIAL LIABILITIES
The Group has classified all financial liabilities under “Other liabilities” category. When a financial liability is first recognised in the accounts, it is measured at cost, which is equal to the fair value of the consideration received for it. Transaction costs are deducted from the original carry-ing amount of all financial liabilities. Subsequently, all financial liabili-ties are measured at amortised cost using the effective interest method. Derivative contracts, for which hedge accounting is not applied, are classified as ”Financial liabilities at fair value through profit or loss”.
Financial assets and liabilities are classified according to IAS 39 and fair values are presented in the Note 27.
DERIVATIVE FINANCIAL INSTRUMENTS AND HEDGE ACCOUNTING
Derivative financial instruments are initially recognised in the balance sheet at cost and thereafter during their term-to-maturity are revalued at their fair value at each reporting date. Gains and losses resulting from recognition at fair value are treated in accounting as required with regard to the intended use of the derivative in question. Derivatives are initially classified either as 1) Hedges of the exposure to changes in fair value of receivables, liabili-
ties or firm commitments, 2) Hedges of the cash flow from a highly probable forecast transaction,3) Hedges of a net investment in a foreign entity or 4) Derivatives to which it has been decided not to apply hedge
accounting.
Derivatives that do not qualify for hedge accounting are classified as financial assets or financial liabilities at fair value through profit or loss.
When applying hedge accounting, at the inception of a hedging relationship the Group has documented the relationship between the hedged item and the hedging instruments as well as the hedging strategy observed. To meet the requirements of hedge accounting, the Group has also continuously carried out effectiveness testing to verify that changes in the fair value of the hedging instrument for each hedg-ing relationship cover effectively enough, with respect to the hedged risk, any changes in the fair value of the hedged item.
Changes in the fair value of derivatives that meet the criteria for fair value hedging are recognised through profit and loss. Changes in the fair value of a hedged asset or liability item are presented similarly in terms of the hedged risk. Changes in the fair value of the effective por-tion of derivative instruments that meet the criteria for cash flow hedg-ing are recognised directly in fair value reserve in equity. The gains and losses recognised in equity are transferred to the income statement in the period in which the hedged item is recognised in the income state-ment. When the criteria for hedge accounting are no longer fulfilled, a hedging instrument matures or is sold the gain or loss accrued from hedging the cash flow remain in equity until the forecast transaction takes place. However, if the forecast hedged transaction is no longer expected to occur, the gain or loss accrued in equity is recognised immediately in the income statement.
The fair value of derivatives is disclosed in non-interest bearing receivables or liabilities. The fair values of derivatives classified in accordance with the applied accounting practice are presented in Notes to the accounts no. 27. The maturity analysis of cash flow hedge accounting is presented in Notes to the accounts no. 26.
CURRENCY HEDGING
The Group has applied cash flow hedge accounting in accordance with IAS 39 to some of its hedges of foreign exchange risk. A separately defined portion of the highly probable forecast cash flow of sales in USD, GBP and SEK is the object of hedge accounting. A change in the fair value of a derivative hedge (currency forward contracts) proven effective is recognised in other comprehensive income, and only after the realisation of the forecasted sales transaction is it recognised in the income statement as an adjustment of the hedged sales. Changes in the fair value of other currency derivatives to hedge foreign currency exposure are recognised under financial items in income statement. The fair values of forward foreign exchange contracts are based on forward prices prevailing at the balance sheet date, and currency options are

NOTE TO THE ACCOUNTS 1 – FINANCIAL STATEMENTS 2016 35
stated at market rates in accordance with fair valued determined with Black&Scholes model.
INTEREST HEDGING
To hedge the fair value of separately defined loans with interest rate swaps, the Group has applied hedge accounting in accordance with IAS 39 as so-called fair value hedge. Changes in the fair value of both loans designated to be hedged and derivative contracts, that meet the criteria for effective hedge accounting, are recognised in financial income and expenses through profit and loss. The fair value of loans is calculated with respect to interest rate risk element, but any changes in the com-pany’s credit risk premium have not been taken into account.
Moreover, to hedge its interest rate exposure, the Group applies as part of hedge accounting in accordance with IAS 39 to hedging of contractual cash flows of floating interest rates of loans as so-called cash flow hedge. A change in the fair value of derivative contracts (interest rate swaps) is recognised in other comprehensive income.
Interest rate derivatives, to which hedge accounting is not applied, are stated at their fair value, and changes in fair value are recognised under financial items in the income statement. The fair values of inter-est rate swaps and currency swaps are measured at the present value of future cash flows, with the calculation based on market interest rate yield curve.
COMMODITY RISK HEDGING
Metsä Board applies cash flow hedge accounting in accordance with IAS 39 to hedges on its electricity, propane and gasoil price risk expo-sure. A separately defined portion of highly probable cash flow of elec-tricity and propane purchases and logistics cost in Finland and Sweden is the object of hedge accounting. Additionally hedge accounting could be applied to pulp price risk hedging of Metsä Board as so-called cash flow hedge. A change in the fair value of a derivative hedge (forward electricity, propane and pulp contracts) proven effective is recognised in other comprehensive income, and only after the realisation of the forecast electricity and propane purchases or pulp sales is it recognised in income statement as an adjustment of the hedged purchases or sales. The ineffective part of derivatives classified to hedge accounting and other commodity derivatives hedging commodity price risk are recognised at market rates at the balance sheet date, and changes in fair value are recognised in income statement under “Other income and expenses”.
Embedded derivatives are valued at fair value, and changes in fair value are recognised under financial items in income statement. The amount of embedded derivatives at the Metsä Board Group is insignificant.
SEGMENT REPORTING
The Group’s operating segments are comprised of the Group’s business areas. The business areas produce different products and services, and they are managed as separate units.
The operating segments are reported uniformly with internal report-ing submitted to the chief operating decision-maker. The Corporate Management Team has been appointed as the chief operating decision-maker in charge of allocating resources to the operating segments and evaluating their performance.
The same accounting policies are applied in segment reporting as for the Group as a whole. After the discontinuation of the paper busi-ness in the third quarter of 2016, Metsä Board reports on its financial performance using only one reporting segment.
ITEMS AFFECTING COMPARABILITY
Exceptional and material items outside ordinary course of business are treated as items affecting comparability. Typical items affecting comparability include material gains and losses on disposals of assets, impairments and impairment reversals in accordance with IAS 36 Impairment of Assets, restructuring costs and their adjustments as well as items arising from legal proceedings.
NON-CURRENT ASSETS HELD FOR SALE
AND DISCONTINUED OPERATIONS
An asset item or operation is classified as held for sale when the amount corresponding to its carrying value is expected to be recovered primarily from sale of the asset item.
Classification as held for sale requires management to be committed to the plan to sell the asset and requires that the Group has initiated an active programme to complete the plan. The asset must be available immediate sale in its present condition and the sale should be expected within one year from the date of classification. Asset items classified as held for sale are measured at the lower of their carrying amount and fair value less costs to sell. Asset items classified as held for sale are not depreciated or amortised after the classification.
A discontinued operation is one which the Group has disposed of or that is classified as held for sale and represents a separate major line of business or geographical area of operations. The profit or loss from discontinued operations after tax is shown as a separate item in the consolidated income statement.
REVENUE RECOGNITION
Sales include income from the sale of goods and services as well as raw materials and supplies adjusted for indirect taxes, discounts and other sales adjustment items. Sale of goods is recognised as income when the risks and rewards associated with the ownership of the goods are trans-ferred to the buyer and the Group no longer has rights of possession or control on the goods. Usually, this refers to the moment at which the goods have been delivered to the customer in accordance with the agreed terms of delivery.
The Group’s terms of delivery are based on the Incoterms 2010 delivery terms, a compilation of definitions of delivery terms published by the International Chamber of Commerce. The Group’s most com-mon delivery terms concerning sales are:– D terms, according to which the Group has to deliver the products
to the agreed destination. The sale is concluded at the moment of delivery to the buyer at the agreed destination at the agreed time.
– C terms, according to which the seller arranges and pays for trans-port to the agreed destination and certain other expenses. However, the Group’s responsibility for the products ends after the products have been handed over to the carrier in accordance with the term used. The sale is concluded at the moment when the seller hands the goods over to the carrier for transport to the agreed destination.

36 FINANCIAL STATEMENTS 2016 – NOTE TO THE ACCOUNTS 1
– F terms, according to which the buyer arranges for the transport and is responsible for it. The sale is concluded when the products have been delivered to the buyer’s carrier.
If local rules result in invoicing that deviates from the rules specified above, the impact of such income has been calculated and adjusted.
Revenue from the sale of services is recorded when the services have been rendered. Dividend income is recognised when the right to receive a payment is established. Interest income is recognised by applying the effective interest rate method.
DELIVERY AND HANDLING COSTS
Costs arising from the delivery and handling of goods are recorded in materials and services in the income statement.
RESEARCH AND DEVELOPMENT EXPENDITURE
Research expenditure is recognised as an expense at the time it is incurred. Development expenditure is capitalised if it is probable that a development project will generate future economic benefit and the costs can be measured reliable. Capitalised development costs are amortised over their estimated useful lives. Metsä Board does not have capitalised development expenditure.
BORROWING COSTS
Borrowing costs are generally recognised as an expense in the period in which they are incurred. In a major and long-term investment project undertaken to produce an item of property, plant and equipment, the borrowing costs directly attributable to the acquisition, construction and production of the asset are included in the asset’s cost.
INCOME TAXES
Tax expense in the income statement is comprised of the current tax and deferred taxes. Current tax and deferred tax that relates to items that are recognised in comprehensive income shall be, respectively, recognised in comprehensive income. Income taxes are recorded on an accrual basis for the taxable income of each reporting unit, applying the tax rate in force in each country at that time. Taxes are adjusted for any taxes for previous periods.
Deferred tax assets and liabilities are calculated on all the temporary differences between the carrying amount and the tax base. Deferred tax liabilities are not recognised when the asset or liability in question is one that is originally recognised at the carrying amount and does not concern business combinations, and the recognition of such an asset or liability does not have an impact on the accounting result or taxable income at the date of the transaction. No deferred taxes are recognised for non-deductible goodwill, and no deferred taxes are recognised for undistributed profits of subsidiaries to the extent that the difference will not likely be realised in the foreseeable future.
The most significant temporary differences result from depreciation on property, plant and equipment, fair value of available-for-sale finan-cial assets and derivative instruments, defined benefit plans, unused tax loss carryforwards and measurement at fair value in connection with business combinations.
Deferred taxes have been calculated by applying the tax rates in force by the balance sheet date. Deferred tax assets are recognised to
the extent that it is probable that taxable profit will be available against which a deductible temporary difference can be utilised.
INTANGIBLE ASSETS
GOODWILL
Goodwill arising from the merging of business operations is recognised in the amount by which the sum of the consideration paid, the share of non-controlling interest in the company to be acquired and the previ-ous holding exceed the fair value of the acquired net assets. Goodwill arising from the acquisition of subsidiaries is included in intangible assets.
Goodwill is not amortised but it is tested for impairment annually or whenever indications of potential impairment have been identified. Goodwill is allocated to cash-generating units for impairment testing. Goodwill is allocated to those units or groups of units expected to ben-efit from the business combination in which the goodwill has arisen. Goodwill is recognised in balance sheet at cost less accumulated impair-ment losses. Impairment losses from goodwill are not reversed.
OTHER INTANGIBLE ASSETS
Intangible assets are originally valued to their acquisition cost in the Balance Sheet, in the case that acquisition cost can be determined reli-ably and it is probable, that the expected financial benefit from the asset will be to the benefit of the Group.
Those intangible assets, which have a limited financial useful life, are booked by straight line depreciation as expenses impacting profit, according to their known or estimated financial useful life. Intangible assets, which have unlimited financial useful lives, are not depreciated, but are tested yearly for decrease in value.
The residual value of an asset, the financial useful life and deprecia-tion method are checked at least once at the end of the financial year and when necessary, adjustments are made to reflect changes in the expected financial benefit of the asset.
Depreciation for non-tangible assets begins, when the asset is ready for use, e.g. when it is in such a state, that it is able to function as intended by management. Depreciation bookings end, when intangible asset is classified as held for sale or is included in a group of assets clas-sified as held for sale according to IFRS 5 standard Non-current Assets Held for Sale and Discontinued Operation.
COMPUTER SOFTWARE
Expenditure on developing and building significant new computer software programs are recognised in the balance sheet as an intangible asset and amortised by using the straight-line-method over its estimated useful life, which is not to exceed seven years. Direct expenses to be capitalised include consultancy and expert advisory fees paid to outside parties, software licences obtained for the application, staff costs to the extent that they can be allocated directly to the project as well as other direct costs. Maintenance and operating expenditure related to computer software and IT applications is recorded as an expense in the reporting period in which it has been incurred.

NOTE TO THE ACCOUNTS 1 – FINANCIAL STATEMENTS 2016 37
EMISSION ALLOWANCES
The Group has received emission allowances in accordance with the European Union Emissions Trading System. Allowances are treated as intangible assets and are measured at fair value. Since allowances from governments are received without consideration, their acquisition cost is zero. Emission allowances are used simultaneously with the carbon dioxide emissions generated during their validity period. Surplus emis-sion allowances are sold, and the earnings generated are recognised in other operating income.
If the emission allowances received free of charge are not sufficient to cover the amount of the emissions produced, the Group purchases additional allowances from the market. The allowances purchased are recognised in intangible rights at the fair value of the acquisition date. The provision to fulfil the obligation to return the emission allowances is recognised at the fair value on the closing date of the reporting period if the emission allowances received free of charge and purchased are not sufficient to cover the amount of the actual emissions.
OTHER
The cost of patents, licences and trademarks having a finite useful life is capitalised in the balance sheet under intangible assets and amortised on a straight-line basis over their estimated useful lives in 5–10 years.
The estimated useful lives of intangible assets are reviewed at each balance sheet date and if they differ significantly from previous esti-mates, the amortisation periods are altered accordingly.
PROPERTY, PLANT AND EQUIPMENT
Property, plant and equipment is measured at cost less accumulated depreciation and impairment.
Cost of property, plant and equipment includes all costs directly attributable to acquisition of an item of property, plant and equipment. Cost of self-constructed property, plant and equipment includes mate-rials, directly attributable employee benefit expenses and other direct expenses needed to bring the asset to the condition necessary for it to operate in its intended purpose. Borrowing cost arising from acquisi-tion, construction and production of a qualifying asset is included in its acquisition cost.
If an item of property, plant and equipment comprises several components with different useful lives, each component is treated as a separate asset. In this case, the cost of replacing such a component is recognised as a new asset with any remaining book value of the replaced asset is derecognised as expense.
Spare parts, spare equipment and maintenance supplies are recog-nised in property, plant and equipment when they are in accordance with the definition of property, plant and equipment. Otherwise, such commodities are classified as inventories.
Environmental expenditures are capitalised if they have been incurred to prevent or reduce future damage or conserve resources and bring future economic benefits.
Subsequent costs of an item of property, plant and equipment airs-ing from additions, partial replacement or maintenance, are included in the book value of the original asset only if it is probable that future economic benefits associated with the item will flow to the entity and the cost of the item can be measured reliably. Repair and maintenance expenditures are recognised in profit and loss as incurred.
Property, plant and equipment is depreciated on a straight-line basis over the useful life of the asset. Land and water are not depreciated. Estimated useful lives are as follows:
Buildings and constructions 20–40 yearsMachinery and equipment
Heavy power plant machinery 20–40 yearsOther heavy machinery 15–20 yearsLightweight machinery and equipment 5–15 years
Other tangible assets 5–20 years
The residual value of an asset, its useful life and depreciation method are verified at least once at the end of the financial year and when neces-sary, adjustments are made to reflect changes in the expected financial benefit of the asset.
Depreciation for tangible assets begins, when the asset is ready for use, in other words when it is in such a location and state, that it is able to function as intended by management. Depreciation is discontinued when a tangible asset of property, plant and equipment is classified as held for sale or when it is included in a group of assets classified as held for sale according to IFRS 5 standard Non-current Assets Held for Sale and Discontinued Operation.
Gains and losses arising from the sale and decommissioning of items of property, plant and equipment are recognised in income state-ment and reported as other operating income. Capital gain or loss is calculated as the difference between the net revenue obtained and the carrying amount of the disposed asset.
GOVERNMENT GRANTS
Government grants, such as government grants received related to acquisition of fixed assets, are booked as reductions to the book value of said fixed assets, when it is fairly certain, that the grants will be received and the group fulfils the requirements for receiving such grants. The grants are recognised as income in the form of lower depreciation during the useful life of the asset. Grants, which are received as com-pensation for already incurred expenses, are booked in Other operating income during the period, when the right to the grant emerges.
LEASES
Leases on property, plant and equipment for which the Group assumes substantially all the risks and rewards characteristic to ownership of the asset are classified as finance lease agreements. A finance lease agreement is recognised in the balance sheet at an amount equal at the inception of the lease to the fair value of the leased property or, if lower, at the present value of the minimum lease payments. The corresponding lease payment liability is recorded in interest-bearing liabilities under other non-current liabilities. An asset obtained on a finance lease is depreciated over the useful life of the asset or, if shorter, the lease term. Lease payments are split between financial expenses and reductions in lease liabilities over the lease term in such a manner, that in each period, the remaining liability balance receives the same fixed interest rate.
Lease agreements in which the risks and rewards incident to ownership remain with the lessor are treated as operating leases. Lease payments under an operating lease are recognised as an expense in the income statement on a straight-line basis over the lease term.

38 FINANCIAL STATEMENTS 2016 – NOTE TO THE ACCOUNTS 1
IMPAIRMENT OF ASSETS NOT INCLUDED IN FINANCIAL ASSETS
No depreciation or amortisation is recognised for assets with an indefi-nite useful life, such as goodwill; they are annually tested for impair-ment. Assets that are subject to depreciation or amortisation are always tested for impairment when events or changes in conditions indicate that it is possible that the carrying amount corresponding to the book value of the assets might not be recoverable.
The recoverable amount is the fair value of an asset less costs to sell or its value in use, whichever is higher. Value in use is determined based on the estimated future net cash flows, discounted to their present value, expected to be derived from the said asset or cash-generating unit. Both the cash flows and the discount rate are calculated after tax, meaning that the established discounted cash flows and values in use are before tax as set out in IAS 36. The discount rate used represents the market’s view of the time value of money and special risks associated with the asset.
Asset items are grouped for impairment assessment to the lowest levels on which the assets generate largely independent cash flows. An impairment loss is recognised if the carrying amount of the asset is higher than its recoverable amount. Any impairment loss on the assets of a cash-generating unit is first allocated to the goodwill of the cash-generating unit and thereafter on a pro rata basis to other assets of the unit. In connection with the recognition of the impairment loss, the useful life of the depreciated asset is re-evaluated. An impairment loss recognised for an asset other than goodwill is reversed if a change has taken place in the estimates used to determine the recoverable amount of the asset. However, the maximum reversal of an impairment loss amounts to no more than the carrying amount of the asset if no impairment loss had been recognised. An impairment loss recognised on goodwill is not reversed under any circumstances.
INVENTORIES
Inventories are measured at the lower of cost and net realisable value. The value of inventories is determined using the FIFO (first-in, first-out) method or, alternatively, the weighted average cost method depending on the nature of the inventories.
The cost of purchased inventories comprises all purchase cost including direct transport, handling and other expenses. The cost of finished and semi-finished goods includes raw materials, cost of direct labour, other direct cost as well as systematically allocated share of variable and fixed production overheads incurred at normal level of production activity. Cost of inventories does not include borrowing cost. Net realisable value is the estimated selling price that is obtainable less the costs of completion and the costs necessary to make the sale.
ACCOUNTS RECEIVABLES
Accounts receivables are measured at the expected net realisable value, which is the original invoicing value less estimated impairment allow-ances on the receivables. Impairment test is carried for all receivables at bankruptcy or overdue over 180 days, when there is a justifiable reason to assume that the Group will not receive payment for the invoiced amount according to the original terms.
PROVISIONS
A provision is recognised in the balance sheet when the Group has a legal or constructive obligation as a result of a past event and it is prob-
able that settlement of the obligation will require a financial payment or cause a financial loss, and a reliable estimate can be made of the amount of the obligation. Where the effect of the time value of money is mate-rial, the amount of a provision is the present value of the expenditures expected to be required to settle the obligation. If some or all of the expenditure required to settle a provision is expected to be reimbursed by another party, the reimbursement is recorded in the balance sheet as a separate asset, but only if it is virtually certain that reimbursement will be received.
RESTRUCTURING
A restructuring provision is recorded for the financial period when the Group has incurred a legal or constructive obligation to make a payment. Termination payments are recorded when a detailed plan has been made of the restructuring and the Group has raised valid expectations in those affected that it will carry out the restructuring by starting to implement that plan or announcing its main features to those affected by it.
ONEROUS CONTRACTS
A provision is recognised for an onerous contract, when the unavoid-able costs of meeting the obligations under the contract exceed the economic benefits expected to be received under it.
ENVIRONMENTAL OBLIGATIONS
Costs arising from environmental remediation which do not increase present or future revenue are recorded as annual expenses. Environmental liabilities are recorded in accordance with present envi-ronmental protection laws and regulations when it is probable that the obligation which has arisen and its amount can be estimated reasonably.
EMPLOYEE BENEFITS
PENSION OBLIGATIONS
The Group has several arrangements concerning benefits following the termination of employment, including both defined benefit pension plans and defined contribution pension plans.
A defined contribution plan is a pension arrangement in which fixed contributions are made to a separate unit, and the Group does not have legal or constructive obligations to make additional contributions if the fund has insufficient funds to pay all benefits based on the performance of the current and previous financial years to all employees. All arrange-ments that do not meet these requirements are considered defined benefit plans.
A defined benefit plan usually defines the pension benefit that the employee will receive upon retiring and the benefit amount, which usually depends on one or more factors, including the employee’s age, service years and salary level.
With the defined benefit plans, the current value on the end date of the obligations reporting period, less the fair value of the assets included in the arrangement, is recognised in the balance sheet as a liability. The amount of the obligation arising from the defined benefit plan is based on annual calculations by independent actuaries using the Projected Unit Credit Method. The current value of the obligation is determined using the interest rate equalling the interest of high-quality bonds issued by the companies as the discount rate for the estimated

NOTE TO THE ACCOUNTS 1 – FINANCIAL STATEMENTS 2016 39
future cash flows. The bonds used in determining the interest rate have been issued in the same currency as the benefits to be paid, and their maturity is approximately the same as that of the corresponding pen-sion obligation.
Actuarial gains and losses from experience verifications and changes in actuarial assumptions are recognised through items in other compre-hensive income as a reimbursement or charge in equity for the period during which they have incurred.
Past service costs are recognised immediately through profit and loss.
In defined contribution plans, the Group pays contributions to publicly or privately administered pension insurance plans that are mandatory, contractual or voluntary. Apart from these contributions, the Group does not have any other payment obligations. The contribu-tions paid are recognised as personnel expenses when they fall due. Prepaid contributions are recognised in assets in the balance sheet to the extent that they can be recovered as reimbursements or deductions of future payments.
BENEFITS RELATED TO THE TERMINATION OF EMPLOYMENT
Benefits related to the termination of employment are paid when the Group terminates a person’s employment contract before the regular retirement age or when a person agrees to resign voluntarily against such benefits. Benefits related to the termination of employment will be recognised at the earlier of the following points in time: (a) when the Group can no longer revoke its offer concerning said benefits, and (b) when it recognises the expense on a restructuring within the scope of IAS 37, which contains the payment of benefits related to the termina-tion of employment. In the case of an offer made to promote voluntary resignation, the benefits related to the termination of employment are defined based on the number of persons expected to accept the offer. Benefits which fall due in more than 12 months after the end of the reporting period will be discounted at the current value.
PROFIT SHARING AND BONUS ARRANGEMENTS
A liability and expense to be recognised on profit sharing and bonus arrangements is based on the conditions of the profit sharing and bonus arrangements. A liability is recognised when the Group has an obliga-tion based on an agreement or a constructive obligation has arisen on the basis of past practices.
SHARE-BASED PAYMENT
A share-based incentive programme, in which payments are made with equity instruments and cash, has been established for company’s top executives. Incentives granted in equity instruments are valued at fair value on grant date and recognised as expense in income statement and equity on straight-line basis over the vesting term. Incentives granted in cash are valued at fair value on each closing date and recognised as expense in income statement and liability in balance sheet over the vesting term. The effect on profit of incentive programmes is presented under employee costs.
EARNINGS PER SHARE
Undiluted earnings per share are calculated using the weighted average number of shares during the reporting period. In calculating earnings
per share adjusted for the effect of dilution, the average number of shares is adjusted for the dilution effect of any equity instruments that have been issued. In calculating earnings per share, earnings are taken to be the reported earnings attributable to the parent company’s shareholders. Earnings, both undiluted and adjusted for the effect of dilution, are calculated separately for continuing and discontinued operations.
DIVIDENDS PAYABLE
Dividends payable by the company are recorded as a decrease in equity in the period during which shareholders, in a general meeting, have approved the dividend for payment
COMPARATIVE FIGURES
Where necessary, comparative figures have been recalculated to con-form to changes in presentation in the current year.
ADOPTION OF NEW AMENDED STANDARDS AND INTERPRETATIONS
APPLICABLE IN THE FUTURE FINANCIAL PERIODS
The Group has not yet adopted the following new and amended standards and interpretations already issued by the IASB. The Group will adopt them as of the effective date or, if the date is other than the first day of the financial year, from the beginning of the subsequent financial year. (* = not yet endorsed for use by the European Union as of 31 December 2016)
IFRS 15 Revenue from Contracts with Customers (effective for financial years beginning on or after 1 January 2018): The new stand-ard replaces current IAS 18 and IAS 11 standards and related interpre-tations. In IFRS 15 a five-step model is applied to determine when to recognise revenue, and at what amount. Revenue is recognised when (or as) a company transfers control of goods or services to a customer either over time or at a point in time. The standard introduces also extensive new disclosure requirements.
The Group has assessed the impact on the revenue recogni-tion amount and timing of IFRS 15 Revenue from Contracts with Customers standard in a dedicated project during the financial year. The project reviewed material product and customer groups identified in Group’s goods and services sales. The main principles of the standard and their effects on the Group are explained below:
Identifying performance obligation: The standard requires iden-tification of the performance obligations included in a sales contract and the allocation of contractual transaction price to these obligations. Performance obligations arising from the Group’s sales contracts are mainly order driven customer deliveries related to sale of goods. Services have mostly an ancillary role in the Group’s business, or they complement deliveries of goods. The changes to identification of per-formance obligations prescribed in the standard do not have an effect on the current accounting policies applied to performance obligation identification by the Group.
Determining and allocating the transaction price: Transaction price is the amount the Group expects to receive in exchange for a fulfilled performance obligation. From this amount, the Group deducts the collected Value Added Taxes and Sales taxes. The prices received by the Group are divided into a fixed and a variable part, and they do not include a financial component. The variable part comprises different discounts based on, among other things, payment terms and purchased

40 FINANCIAL STATEMENTS 2016 – NOTE TO THE ACCOUNTS 1
quantities, and is allocated by the Group as deductions from sales rev-enue in line with estimates of the extent of the discount the customer is deemed entitled to. During a financial year, the presentation of the effect of a variable price component can be based on management’s judgement of discount drivers, e.g. the sales quantity reached with a given customer during the year. The Group’s sales contracts contain mostly obligations solely related to deliveries of goods, to which the allocation of the transaction price is uncomplicated. IFRS 15 does not change the principles applied by the Group to the determination or allocation of the transaction price.
Revenue recognition: According to the standard, revenue is recog-nized in the period, during which the customer assumes control of the delivered goods. Of the criteria for transfer of control provided in the standard, the transfer of risks and rewards related to the sold goods applies best to the Group’s business operations concentrating on sale of goods. Consequently, the delivery terms applied by the Group in its sales contracts determine the point of time, at which the contractual goods are deemed to have been transferred to the customer. The revenue recognition principles and delivery terms applied by the Group are described in more detail above under section Revenue recognition, and the adoption of IFRS 15 does not give rise to changes to them.
The Group will adopt IFRS 15 Revenue from Contracts with Customers in the financial year commencing on 1 January 2018. The adoption will have no impact on the principles applied by the Group to the amount and timing of revenue recognition.
Amendments to IFRS 15 - Clarifications to IFRS 15 Revenue from Contracts with Customers* (effective for financial years beginning on or after 1 January 2018). The impact assessment of the clarifications has been included in the IFRS 15 impact assessment provided above.
IFRS 9 Financial Instruments* (effective for financial years begin-ning on or after 1 January 2018): IFRS 9 replaces the existing guidance in IAS 39. The new standard includes revised guidance on the clas-sification and measurement of financial instruments, including a new expected credit loss model for calculating impairment on financial assets, and the new general hedge accounting requirements. It also car-ries forward the guidance on recognition and derecognition of financial instruments from IAS 39. Classfication and valuation of Group’s financial instruments will change, but changes are assessed not to have a material impact on consolidated financial statements. Measurement of impairments will also change, but the change is not deemed to have a significant effect on measurement of accounts receivables and other financial assets. Changes in hedge accounting require revisions in documentation, but they will ease the application of hedge accounting to some extent.
IFRS 16 Leases* (effective for financial years beginning on or after 1 January 2019): The new standard replaces the current IAS 17 standard and related interpretations. IFRS 16 requires the lessees to recognise the lease agreements on the balance sheet as a right-of-use assets and lease liabilities. The accounting model is similar to current finance lease accounting according to IAS 17. There are two exceptions available, these relate to either short term contacts in which the lease term is 12
months or less, or to low value items i.e. assets of value USD 5 000 or less. The lessor accounting remains mostly similar to current IAS 17 accounting. The Group has started a project to assess the impact of the standard.
Amendments to IAS 7 Statement of Cash Flows – Disclosure Initiative* (effective for financial years beginning on or after 1 January 2017). The changes were made to enable users of financial statements to evaluate changes in liabilities arising from financing activities, including both changes arising from cash flow and non-cash changes. The amendments have an impact on the disclosures in consolidated financial statements.
Amendments to IAS 12 Income Taxes - Recognition of Deferred Tax Assets for Unrealised Losses*(effective for financial years beginning on or after 1 January 2017). The amendments clarify that the existence of a deductible temporary difference depends solely on a comparison of the carrying amount of an asset and its tax base at the end of the reporting period, and is not affected by possible future changes in the carrying amount or expected manner of recovery of the asset. The amendments have no significant impact on Group’s consolidated finan-cial statements.
Amendments to IFRS 2 Sharebased payments - Clarification and Measurement of Sharebased Payment Transactions* (effective for financial years beginning on or after 1 January 2018). The amend-ments clarify the accounting for certain types of arrangements. Three accounting areas are covered: measurement of cash-settled share-based payments; classification of share-based payments settled net of tax with-holdings; and accounting for a modification of a share-based payment from cash-settled to equity-settled. It is not yet possible to estimate the effect of the amendments on consolidated financial statements.
IFRIC 22 Interpretation Foreign Currency Transactions and Advance Consideration* (effective for financial years beginning on or after 1 January 2018). When foreign currency consideration is paid or received in advance of the item it relates to – which may be an asset, an expense or income – IAS 21 The Effects of Changes in Foreign Exchange Rates is not clear on how to determine the transaction date for translating the related item. The interpretation clarifies that the transaction date is the date on which the company initially recognises the prepayment or deferred income arising from the advance considera-tion. For transactions involving multiple payments or receipts, each payment or receipt gives rise to a separate transaction date. The inter-pretation has no significant impact on Group’s consolidated financial statements.
Annual Improvements to IFRSs (2014-2016 cycle)* (effective for financial years beginning on or after 1 January 2017 for IFRS 12 and on or after 1 January 2018 for IFRS 1 and IAS 28). The annual improvements process provides a mechanism for minor and non-urgent amendments to IFRSs to be grouped together and issued in one pack-age annually. The cycle contains amendments to three standards. Their impacts vary standard by standard but are not significant.
Other new or amended standards or interpretations are not assessed to have an impact on consolidated financial statements.

NOTE TO THE ACCOUNTS 1 – FINANCIAL STATEMENTS 2016 41
2. Key accounting estimates applied in the financial statements and judgements used in the accounting principles
Preparing IFRS-compliant financial statements requires the use of certain key accounting estimates. In addition, it requires the manage-ment to use its judgement in applying the accounting principles. The estimates made and judgement-based decisions are continuously evalu-ated, and they are based on prior experience and other factors, such as expectations concerning future events. The expectations are considered to be reasonable, taking the circumstances into account. The topics that are associated with key assumptions and estimates in terms of consoli-dated financial statements and areas that require significant discretion are described below.
IMPAIRMENT TESTING
The Group annually tests the goodwill and intangible assets not ready to use for impairment. Testing for impairment is carried out for other long-term assets if there are indications that the value of the assets might be impaired. The recoverable amounts of cash-generating units are based on calculations of value in use. These calculations require that estimates are made. No impairments were recognised in 2016 due to impairment testing.
FINANCIAL INSTRUMENTS AT FAIR VALUE
A fair value is determined for financial instruments not traded on an open market using valuation methods. Discretion is used in selecting the various methods and making assumptions based primarily on the market conditions prevailing at the end date of each reporting period. The greatest item at fair value not traded on an open market is the investment in Pohjolan Voima shares, reported under available-for-sale financial assets. Their price is determined based on realised transac-tions and an analysis of discounted cash flows. The carrying amount of Pohjolan Voima shares on 31 December 2015 amounted to EUR 191.8 million. The carrying amount of Pohjolan Voima Oy shares as of 31 December 2016 is estimated to change by EUR 5.7 million should the rate used for discounting the cash flows change by 10 percent from the rate estimated by management. The carrying amount of shares is esti-mated to change by EUR 35.4 million should the energy prices used for calculating the fair value differ by 10 percent from the prices estimated by management. Available-for-sale assets are presented in Note 14.
IMPAIRMENT OF EQUITY INVESTMENTS CLASSIFIED
AS AVAILABLE-FOR-SALE FINANCIAL ASSETS
The question when the value of available-for-sale equity investments is impaired is solved according to the guidelines of IAS 39. This requires the use of significant judgement, e.g., in terms of for how long and to what extent the fair value of the investment has been lower than the acquisition cost. In addition, it is necessary to estimate the financial position of the investment object regarding the near-future outlook of the business operations, such as the profitability of the industry and sector, to find out whether there is objective proof of impairment. If the fair value of Pohjolan Voima Oy shares was deemed to have
significantly and non-temporarily decreased below the acquisition cost, an additional after tax loss with maximum amount of EUR 31 million would have been recognised in the financial statements of 2016. Additionally, there would have been a EUR 122.2 million net of deferred tax reduction in fair value reserve recognised in other comprehensive income and arising from reversal of cumulative positive fair value adjustments to Pohjolan Voima Oy shares recognised in the period ended as well as prior periods.
INVENTORIES
The Group regularly reviews its inventories for situations where the inventories exceed their real value, contain downgraded items or their market value falls below the acquisition cost, and records a deduction item that reduces the carrying amount of the inventories in the case of such deductions. For the purpose of this review, the management must make estimates of the selling prices from which the estimated cost of completion and the costs necessary to make the sale have been deducted. Any changes in these estimates might lead to an adjustment in the carrying amount of the inventories in future periods. Metsä Board’s balance sheet included inventories amounting to EUR 332.5 million on 31 December 2016. Inventories are presented in Note 17.
ACCOUNTS RECEIVABLES
Accounts receivables are recognised according to the original invoiced amount less any impairment and refunds due to returns. Impairment losses are recognised on a case-by-case basis and based on previous experience when there is objective proof that the receivable cannot be collected in full. If the customers’ financial position weakens so that it affects their solvency, further impairment losses might need to be rec-ognised for future periods. Metsä Board’s balance sheet at 31 December 2016 included accounts receivables amounting to EUR 217.7 million and new impairment losses for trade receivables amounting to EUR 0.4 million were recognised in the financial year. Accounts receivables are presented in Note 18.
PENSION PLANS
The present value of the pension obligations depends on various factors that are determined using various actuarial assumptions. The discount rate is also included in the assumptions used in determining the net expenditure (or income) arising from pension plans. Changes in these assumptions have an effect on the carrying amount of the pension obligations.
The appropriate discount rate is determined at the end of each year. This is a rate that is used in determining the current value of the future cash flows estimated to be required to fulfil the pension obligations. In determining the appropriate discount rate, the interest rates of long-term treasury notes or similar instruments are taken into consideration. Other key assumptions concerning pension obligations are based on the current market conditions. Pension plans are presented in Note 21.

42 FINANCIAL STATEMENTS 2016 – NOTE TO THE ACCOUNTS 3
PROVISIONS
A provision is recorded when the Group has a legal or constructive obligation as a result of a previous event and it is probable that the liability for payment will realise. The provisions are determined based on previous experience. A restructuring provision is recorded for the financial period when the Group has incurred a legal or constructive obligation to make a payment. Termination payments are recorded when a detailed plan has been made of the restructuring and the Group has raised valid expectations in those affected that it will carry out the restructuring by starting to implement that plan or announcing its main features to those affected by it. A recorded provision illustrates the management’s best estimate of the current value of future expenses, but actual expenditure may differ from the estimate. Provisions amounted to EUR 10.0 million on Metsä Board’s balance sheet at 31 December 2016. Provisions are presented in Note 22.
INCOME TAXES
The management’s judgement is required for determining the taxes based on the result for the period, deferred tax assets and liabilities and the extent to which deferred tax assets are recorded. The Group’s balance sheet at 31 December 2016 included EUR 8.2 million deferred tax assets recognised for tax loss carry-forwards. The Group is subject to income taxation in several countries. Estimating the total amount of income taxes at the level of the entire Group requires significant judge-ment. The final amount of tax is uncertain in terms of several business operations and calculations. The Group forecasts future tax audits and recognises liabilities based on estimates on whether further taxes will need to be paid. If the associated final tax differs from the originally recorded amounts, the difference has an effect on both the tax assets and liabilities based on the taxable income for the period and deferred tax assets and liabilities in the period during which they are observed. Income taxes are presented in Note 9 and deferred taxes in Note 16.
CONTINGENT LIABILITIES FROM LEGAL DISPUTES AND CLAIMS
The management’s assessment is required in measuring and recognis-ing the provisions related to ongoing legal proceedings. A provision is recognised when, as a result of an earlier event, the Group has a legal or actual obligation, the realisation of a payment obligation is likely, and the amount of the obligation can be reliably estimated. Due to the course of legal proceedings being difficult to foresee, the actual cost of the proceedings may differ considerably from the original estimate. Contingent liabilities arising from legal disputes and claims are pre-sented in Note 29.
3. Segment information
The Corporate Management Team is the chief operating decision-maker.
After Metsä Board’s uncoated paper production ended in July 2016, the remaining business operations of the Group consist solely of folding boxboard, fresh fibre linerboard and market pulp businesses previously reported under Paperboard segment and complemented by the wallpa-per base production at Kyro mill, which was discontinued in September 2016.
As the paper business previously reported under Non-core opera-tions segment has been fully discontinued, Metsä Board reports on its financial performance starting from third quarter of 2016 using only one reporting segment.
NOTE TO THE ACCOUNTS 3

NOTE TO THE ACCOUNTS 3 – FINANCIAL STATEMENTS 2016 43
In the following tables are presented information of sales, assets and investments by geographical areas. Geographical sales are reported based on the location of the customer and assets and capital expenditure based on the location of the assets.
GEOGRAPHICAL AREAS
External sales by location of customer
Total non-current assets by country
Capital expenditure by country
EUR million 2016 2015 2016 2015 2016 2015
Germany 164.5 258.1 3.3 3.3 0.0 0.4
Italy 119.2 131.0 0.0 0.0 - 0.0
Finland 116.1 173.6 923.7 938.5 54.2 23.0
United Kingdom 103.2 194.5 9.3 8.8 - -
Russia 95.3 89.4 0.1 0.0 0.0 0.0
Sweden 92.2 116.2 422.9 371.8 107.5 154.3
Spain 66.1 60.5 0.0 0.0 - -
France 65.6 98.0 0.0 0.0 - 0.0
Poland 60.4 64.6 0.0 0.0 - -
The Netherlands 42.9 34.1 - 0.0 - -
Belgium 22.9 36.0 0.6 0.2 0.6 -
Austria 19.7 48.9 - - - -
Switzerland 13.1 14.7 0.0 0.0 - -
Other Europe 148.7 121.3 0.0 0.4 - 0.0
USA 222.3 223.4 0.4 0.3 0.1 0.1
Canada 30.0 32.6 - - - -
Asia 236.9 207.3 0.4 0.1 0.0 0.0
Other countries 101.2 103.3 - 0.0 - -
Total 1,720.3 2,007.5 1,360.7 1,323.4 162.4 177.8
Non-current assets include other assets but finacial instruments and deferred tax assets.
PERSONNEL AT YEAR END BY COUNTRY
2016 2015
Finland 1,442 1,494
Sweden 738 810
Germany 56 61
Belgium 58 49
USA 43 37
China 38 33
Other countries 91 117
Total 2,466 2,601
AVERAGE PERSONNEL BY COUNTRY
2016 2015
Finland 1,552 1,538
Sweden 753 855
Germany 55 230
Belgium 53 49
USA 40 32
China 35 35
Other countries 100 112
Total 2,588 2,851
There were no customers with revenue exceeding 10 per cent of total Group revenue in 2016. In 2015, revenue from one customer amounted to EUR 261 million or 13 per cent of total revenue.

44 FINANCIAL STATEMENTS 2016 – NOTE TO THE ACCOUNTS 4
4. Disposed and discontinued operations and non-current assets held for sale
There were no acquisitions in 2016 or 2015.Metsä Board sold its share (25.0 per cent) in a structured entity
Alrec Boiler Oy consolidated as a subsidiary to group accounts in June 2016 to its partner company Rinheat Oy at a price determined in accordance with the shareholder and option agreements in force between the parties. Cash balance of the sold company at the time of the sale was EUR 7.6 million. The disposal had a total cash flow effect of EUR -5.5 million, of which EUR -2.7 million was presented in net cash flow from financing activities. A disposal loss affecting comparabil-ity of EUR -1.1 million was recognized for the divestment.
In September 2011, Metsä Board divested the 100.0 per cent hold-ing in its Austrian subsidiary M-real Hallein GmbH. The company was paid a EUR 4.4 million earn-out for the sale of subsidiary receivables in connection with the divestment in November 2016. The received earn-out was presented as proceeds from sale of subsidiaries in the consoli-dated statement of cash flows. The earn-out resulted in the reporting of a EUR 4.4 million partial reversal of previously recognized divestment loss as an item affecting comparability.
ALREC BOILER OY, DISPOSED ASSETS
EUR million 2016
Accounts receivables and other receivables, non-interest bearing 0.0
Cash and cash equivalents 7.6
Total assets 7.6
Non-current borrowings 2.7
Accounts payable and other liabilities 1.7
Total liabilities 4.4
Net assets 3.2
Total 3.2
Divestment proceeds received 2.1
Disposal loss before tax -1.1
Income taxes -
Disposal loss after tax -1.1
Disposal loss -1.1
Divestment proceeds received 2.1
Cash and cash equivalents of disposed subsidiary -7.6
Repayment of non-current financial liabilities -2.7
Proceeds from disposal of shares in subsidiary, net of cash -2.8
Metsä Board divested its 100.0 per cent holding in Metsä Board Zanders GmbH, the subsidiary owning the mill in Gohrsmühle, to a company wholly owned by German mutares AG and to its partner company. Cash balance of the divested company amounted to EUR 35.8 million, including cash equivalent funds in immediately available deposits. The disposal had a cash flow effect of EUR -38.2 million and resulted in a recognised divestment gain affecting comparability of EUR 17.5 million.
NOTE TO THE ACCOUNTS 4
METSÄ BOARD ZANDERS GMBH, DISPOSED ASSETS
EUR million 2015
Other intangible assets 0.0
Tangible assets 5.5
Deferred tax receivables 10.9
Inventories 30.7
Accounts receivables and other receivables, interest bearing 0.3
Accounts receivables and other receivables, non-interest bearing 16.5
Cash and cash equivalents 35.8
Total assets 99.7
Non-controlling interest 0.0
Post employment benefit obligations 93.6
Provisions 2.1
Current borrowings 0.0
Accounts payable and other liabilities 23.8
Total liabilities 119.5
Net assets -19.8
Transaction fees paid for professional services 1.2
Total -18.6
Divestment proceeds received -1.1
Disposal gain 17.5
Income taxes -
Disposal gain after tax 17.5
Disposal gain 17.5
Divestment proceeds received -1.1
Transaction fees paid for professional services -1.2
Cash and cash equivalents of disposed subsidiary -35.8
Proceeds from disposal of shares in subsidiary, net of cash -38.2
DISPOSAL OF NON-CONTROLLING INTEREST
Metsä Board Zanders GmbH owned 90 per cent of BGE Eisenbahn Güterverkehr GmbH’s shares. As part of divestment transaction completed in May 2015, non-controlling interest in Metsä Board’s consolidated balance sheet was reduced by EUR 0.03 million.

NOTES TO THE ACCOUNTS 5–6 – FINANCIAL STATEMENTS 2016 45
5. Other operating income
EUR million 2016 2015
Gains on disposal 16.3 25.7
Rental income 1.0 1.2
Service revenue 7.0 8.0
Government grants and allowances 0.3 1.8
Scrap and waste sale 0.1 2.1
Other operating income 15.5 8.8
Total 40.2 47.7
Gains on disposal for 2016 include EUR 7.7 million gains on asset sales and EUR 2.6 million gain on sale of emission rights. The remaining disposal gains comprise EUR 1.6 million income from Metsä Board Sverige’s electricity certificates and EUR 4.4 million earn-out received for sale of subsidiary receivables from M-real Hallein GmbH.
Disposal gains of 2015 include EUR 17.5 million gain from sale of Metsä Board Zanders GmbH shares to a company owned by mutares AG and its partner company in May 2015, EUR 3.4 million gain on sales of property mostly in Finland, EUR 2.0 million from sale of emis-sion rights and EUR 1.9 million from electricity certificates of Metsä Board Sverige. The remaining disposal gains of EUR 1.0 million arose mainly from sale of non-current shareholdings.
Government grants include subsidies for training, healthcare and R&D expenses as well as energy subsidies.
6. Operating expenses
EUR million 2016 2015
Change in stocks of finished goods and work in progress 38.5 -15.1
MATERIALS AND SERVICES
Raw materials and consumables 973.2 1,110.0
Change in inventories 1.7 -2.8
External services
Logistics expenses 229.0 246.5
Other external services 45.6 54.3
1,249.5 1,408.0
EMPLOYEE COSTS
Wages and salaries 131.5 151.7
Share-based payments (note 30) 0.8 2.9
Social security costs
Pension costs
Defined benefit plans 0.4 0.9
Defined contribution plans 23.6 22.8
Social security costs 54.7 56.2
78.7 79.9
Employee costs, total 211.0 234.5
OTHER OPERATING EXPENSES
Rents and other real estate expenses 9.0 11.6
Purchased services 69.0 73.3
Losses on sale of non-current assets 1.9 0.1
Other operating expenses 69.1 71.4
Total 148.9 156.4
External services include production related services and logistics costs of sold goods. Other operating expenses include among other things non-production related services, energy costs, real estate costs and administration costs.
Share based payments are presented in Note 30 and the compensa-tions paid to the key management are presented in Note 31.
Losses on sale of non-current assets include EUR 1.1 million loss on sale of Alrec Boiler Oy shares in 2016 and EUR 0.6 million losses on sales of other tangible assets.
Other operating expenses were reduced by EUR 2.6 million in 2015 due to reversal of unused provisions and accruals related to the closed Alizay mill in France.
Research and development costs during the financial year 2016 were EUR 6.3 million and in 2015 EUR 8.4 million including a tangible fixed asset investment of EUR 2.1 million.
PRINCIPAL AUDITOR FEES
The independent principal auditor was KPMG Oy in 2016. The audit fees are paid for the audit of the annual and quarterly financial state-ments for the group reporting purposes as well as for the audit of the local statutory financial statements. Tax consultancy fees are fees paid for tax consultancy and planning services.
PRINCIPAL AUDITOR FEES AND SERVICES
EUR million 2016 2015
Audit fees 0.4 0.4
Tax consultancy 0.0 0.0
Other fees 0.0 0.0
Total 0.4 0.4
In 2016 fees paid to other auditors than KPMG were EUR 0.02 mil-lion. In 2015 fees paid to other auditors were EUR 0.05 million.
NOTES TO THE ACCOUNTS 5–6

46 FINANCIAL STATEMENTS 2016 – NOTE TO THE ACCOUNTS 7
7. Depreciation, amortisation and impairment charges
EUR million 2016 2015
DEPRECIATION AND AMORTISATION
Other intangible assets 3.2 3.7
Buildings 6.8 8.4
Machinery and equipment 84.8 90.0
Other tangible assets 1.0 1.3
Total 95.8 103.4
IMPAIRMENT CHARGES AND REVERSED IMPAIRMENT CHARGES
Goodwill - 0.4
Buildings 2.1
Machinery and equipment 4.5 -0.3
Total 6.6 0.1
Depreciation, amortisation and impairment charges, total 102.3 103.5
Impairment charges for the financial year 2016 include EUR 8.5 mil-lion impairments of tangible assets used in discontinued wallpaper base production at Kyro mill and a EUR 2.0 million reversal of previously recognized impairment on a paper machine sold by Husum mill.
Impairments reported in 2015 included an impairment loss of EUR 0.4 million related to goodwill of a closed sales company and a reversal of previous impairment of EUR 0.3 million arising from the disposal of an old paper machine at Simpele mill.
IMPAIRMENT OF ASSETS
Metsä Board carries out a full impairment test at least once a year, during the last quarter based on the situation of 30 September. In addition, a sensitivity analysis is performed each quarter. Should the sensitivity analysis indicate impairment, a full test will be initiated. Audit Committee reviews the sensitivity analyses or impairment testing results quarterly.
TESTING PRINCIPLES
The carrying values of asset items or cash generating units are evaluated for possible impairment. Cash-generating units are operating segments or smaller units for which a recoverable amount can be determined. In 2016 testing, the cash-generating units are Folding boxboard, Liner, and Market Pulp. The cash generating units are the same as in 2015 testing, with the exception of Kyro Paper which was closed at the end of September 2016.
If there are indications of impairment of an asset item or cash-generating unit, or if the unit’s carrying amount includes or it has been allocated goodwill, the recoverable amount of the asset or cash-generating unit is measured. The recoverable amount of the asset or cash-generating unit is the value in use based on future cash flows, or fair value less cost to sell. In 2016 testing, all recoverable amounts are based on the value in use of cash-generating units.
The recoverable cash flows for the cash-generating units under test-ing are based on five-year forecasts with subsequent cash flows expected to grow at a constant rate.
The key testing assumptions are Metsä Board management’s esti-mates and projections as well as third party forecasts. The key factors affecting the projections are development of average paper and board prices, delivery volumes, foreign exchange rates, and capacity utilisation rates, cost development of key raw materials such as wood, pulp, chemi-cals and energy, the development of personnel costs and other fixed costs as well as the discount rate. The key factors affecting estimates are similar to those used in 2015 testing.
Metsä Board’s share of Metsä Fibre’s recoverable amounts, carrying amount and goodwill included in “Investment in associated companies and joint ventures” (EUR 45.2 million) is allocated to Cash generating units in the proportion of their pulp purchases.
For the situation on 30 September 2016 and for previous goodwill impairment tests, the cash flows subsequent to the 5-year projected cash flows are based on a 2 per cent fixed annual growth rate. Average values for the key assumptions (price, volume, variable costs) during the projection period have been used as initial point for the cash flows following the forecast period. The fixed costs are based on the projected costs for the fifth year.
The discount rate used is Metsä Board’s Weighted Average Cost of Capital (WACC). When calculating WACC, the cost of debt takes into account market based view on Metsä Board’s risk premium. Both the cash flows and the discount rate are calculated after tax, which means that the established discounted cash flows and values in use are before tax as set out in IAS 36. For testing carried out concerning situation 30 September 2016, the WACC after taxes was 5.38 per cent
NOTE TO THE ACCOUNTS 7

NOTE TO THE ACCOUNTS 8 – FINANCIAL STATEMENTS 2016 47
8. Financial income and expenses
EUR million 2016 2015
EXCHANGE DIFFERENCES
Commercial items 2.1 7.2
Hedging / hedge accounting not applied -7.5 -10.4
Other items 0.4 -0.2
Total -4.9 -3.4
OTHER FINANCIAL INCOME
Interest income on loans, other receivables and cash and cash equivalents 0.7 1.0
Divided income 0.1 0.1
Other financial income total 0.8 1.1
VALUATION OF FINANCIAL ASSETS AND LIABILITIES
Impairment charges from financial assets - -2.2
Gains and losses on derivatives / hedge accounting not applied -0.3 -
Gains and losses on hedging instrument in fair value hedges - -1.0
Gains and losses on hedged item in fair value hedges - 0.9
Valuation total -0.3 -2.3
Interest expenses from financial liabilities carried at amortised cost using the effect interest rate method -25.4 -26.1
Other financial expenses -0.9 -1.3
Interest and other financial expenses, total -26.3 -27.4
Valuation of financial assets and liabilities and interest and other financial expenses, total -26.6 -29.7
Impairment charges from financial assets in 2015 included EUR 2.2 million write-off of shareholder loan to Pohjolan Voima Oy for OL4 project.
(2015: 5.09) and for Metsä Fibre 5.59 per cent (5.31). Management’s view is that the risk factors regarding future cash flows do not differ materially from one cash-generating unit to another.
The goodwill impairment test results are evaluated by comparing the recoverable amount (V) with the carrying amount of the cash-generating unit (B) as follows:
Ratio
V < B
V 0–5% > B
V 5–10% > B
V 10–15% > B
V 15–20% > B
V 20–50% > B
V 50% > B
The most important cash-generating units of Metsä Board Group, the goodwill allocated to them as of 30 September 2016 as well astheir testing result as of 30 September 2016:
Goodwill Test result (V-B)/B
Folding boxboard 1) 30.2 over 50%
Liner 1) 27.3 over 50%
Market pulp 1) no allocation over 50%
Metsä Board Group total 57.6
1) The amount includes the goodwill from Metsä Board’s holding in Metsä Fibre, which is shown under “Investments in associated companies and joint ventures” in the balance sheet.
NOTE TO THE ACCOUNTS 8

48 FINANCIAL STATEMENTS 2016 – NOTES TO THE ACCOUNTS 9–10
9. Income taxes
EUR million 2016 2015
Income taxes for the financial period 17.0 14.4
Income taxes from previous periods -0.6 9.6
Change in deferred taxes -5.1 5.7
Other taxes 0.0 0.1
Total 11.3 29.8
INCOME TAX RECONCILIATION
Result before taxes 101.6 167.1
Calculated tax at Finnish statutory rate of 20.0% 20.3 33.4
Effect of difference between Finnish and non-Finnish tax rates -0.5 -4.4
Tax exempt income -0.9 -3.9
Non-deductible expenses 0.3 4.5
Previous years tax losses used during period 0.0 0.0
Adjustments to previously recognised deferred taxes 1.7 -0.4
Losses from subsidiaries, of which no deferred tax asset have been recognised 0.1 3.2
Share of result from associated companies and joint ventures -9.0 -12.3
Income taxes from previous periods -0.6 9.6
Other 0.0 0.1
Income tax expense 11.3 29.8
Effective tax rate, % 11.1 17.8
In the autumn of 2015, the Finnish Tax Administration took a stand against the deductibility of certain losses in Metsä Board’s 2014 taxa-tion. The company recognised EUR 9.6 million of previous periods’ taxes in its tax expense of 2015. Metsä Board has appealed against the decision issued by the Tax Administration, as the company believes the losses are deductible.
THE INCOME TAX RELATED TO COMPONENTS OF OTHER COMPREHENSIVE INCOME 2016
EUR million Before taxes Taxes After taxes
Items that will not be reclassified to profit or loss
Actuarial gains/losses on defined pension plans 1.3 0.3 1.6
Items that may be reclassified to profit or loss
Cash flow hedges 27.0 -5.7 21.3
Available for sale investments -14.2 2.8 -11.4
Share of other comprehensive income of associated companies -6.9 - -6.9
Translation differences -12.3 - -12.3
Share of other comprehensive income of associated companies, translation differences 1.3 - 1.3
Total -5.1 -2.8 -7.9
THE INCOME TAX RELATED TO COMPONENTS OF OTHER COMPREHENSIVE INCOME 2015
EUR million Before taxes Taxes After taxes
Items that will not be reclassified to profit or loss
Actuarial gains/losses on defined pension plans 6.3 -2.7 3.6
Items that may be reclassified to profit or loss
Cash flow hedges -2.9 0.9 -2.0
Available for sale investments -23.0 4.6 -18.4
Share of other comprehensive income of associated companies 0.1 - 0.1
Translation differences 7.0 - 7.0
Share of other comprehensive income of associated companies, translation differences 0.2 - 0.2
Total -18.6 5.5 -13.1
10. Earnings per share
2016 2015
RESULT FOR THE PERIOD ATTRIBUTABLE TO SHARE-HOLDERS OF PARENT COMPANY, EUR MILLION 90.4 137.3
Adjusted number of shares (average) in thousands 355,513 349,504
Basic and diluted earnings per share, EUR 0.25 0.39
NOTES TO THE ACCOUNTS 9–10

NOTE TO THE ACCOUNTS 11 – FINANCIAL STATEMENTS 2016 49
11. Intangible assets
EUR million GoodwillOther intangible
assetsConstruction in
progress Total
Acquisition costs, 1 Jan 2016 12.7 154.1 - 166.8
Translation differences -0.4 -0.4
Increases 4.0 0.2 4.2
Decreases -0.4 -21.7 -22.1
Transfers between items -
Acquisition costs, 31 Dec 2016 12.4 135.9 0.2 148.4
Accumulated depreciation, amortisation and impairment charges, 1 Jan 2016 -0.4 -140.4 -140.8
Translation differences 0.4 0.4
Accumulated amortisation on deductions and transfers 0.4 21.7 22.1
Amortisation for the period -3.2 -3.2
Impairments for the period -
Accumulated depreciation, 31 Dec 2016 0.0 -121.4 -121.4
Book value, 1 Jan 2016 12.4 13.7 - 26.1
Book value, 31 Dec 2016 12.4 14.5 0.2 27.0
EUR million GoodwillOther intangible
assetsConstruction in
progress Total
Acquisition costs, 1 Jan 2015 12.7 172.4 0.1 185.2
Translation differences 0.3 0.3
Increases 1.7 0.0 1.7
Decreases -21.0 0.0 -21.0
Transfers between items 0.7 -0.1 0.6
Acquisition costs, 31 Dec 2015 12.7 154.1 - 166.8
Accumulated depreciation, amortisation and impairment charges, 1 Jan 2015 -157.4 -157.4
Translation differences -0.2 -0.2
Accumulated amortisation on deductions and transfers 20.9 20.9
Amortisation for the period -3.7 -3.7
Impairments for the period -0.4 -0.4
Accumulated depreciation, 31 Dec 2015 -0.4 -140.4 -140.8
Book value, 1 Jan 2015 12.7 15.0 0.1 27.8
Book value, 31 Dec 2015 12.4 13.7 - 26.1
No impairments were recorded for intangible assets during the financial year. Previous year’s impairment charges included an impairment loss of EUR 0.4 million related to goodwill of a closed sales company. Other intangible assets include among other things computer software, patents and licenses. Metsä Board has not capitalised development expenditure.
NOTE TO THE ACCOUNTS 11

50 FINANCIAL STATEMENTS 2016 – NOTE TO THE ACCOUNTS 12
12. Tangible assets
EUR millionLand and
water BuildingsMachinery and
equipmentOther tangible
assetsConstruction
in progress Total
Acquisition costs, 1 Jan 2016 13.5 422.9 2,456.3 38.8 158.6 3,090.1
Translation differences 0.0 -4.7 -43.1 -1.1 -4.6 -53.5
Increases 0.0 2.7 119.4 0.2 11.9 134.2
Decreases -1.1 -0.4 -4.0 0.0 0.0 -5.5
Transfers between items 10.9 115.3 -126.2 0.0
Acquisition costs, 31 Dec 2016 12.4 431.3 2,643.8 37.9 39.8 3,165.2
Accumulated depreciation, 1 Jan 2016 -0.5 -287.5 -1,959.0 -30.8 -2,277.8
Translation differences 0.0 3.8 34.4 0.9 39.1
Accumulated depreciation on deductions and transfers 0.4 2.0 0.0 2.4
Depreciation for the period -6.8 -84.8 -1.0 -92.6
Impairment charges and reversed impairment charges -2.1 -4.5 -6.6
Accumulated depreciation and impairment charges, 31 Dec 2016 -0.5 -292.2 -2,011.8 -30.9 -2,335.4
Book value, 1 Jan 2016 13.0 135.4 497.3 8.0 158.6 812.3
Book value, 31 Dec 2016 11.8 139.1 632.0 7.0 39.8 829.8
EUR millionLand and
water BuildingsMachinery and
equipmentOther tangible
assetsConstruction
in progress Total
Acquisition costs, 1 Jan 2015 23.6 667.0 3,180.8 80.8 15.4 3,967.6
Translation differences 0.0 2.8 24.1 0.6 2.6 30.1
Increases 0.0 0.6 22.7 0.0 151.1 174.4
Decreases -10.1 -247.6 -779.6 -42.6 -1.4 -1,081.3
Transfers between items 0.1 8.3 0.0 -9.1 -0.7
Acquisition costs, 31 Dec 2015 13.5 422.9 2,456.3 38.8 158.6 3,090.1
Accumulated depreciation, 1 Jan 2015 -5.3 -524.4 -2,628.6 -71.6 -3,229.9
Translation differences 0.0 -2.3 -19.8 -0.5 -22.6
Accumulated depreciation on deductions and transfers 4.8 247.6 779.1 42.6 1,074.1
Depreciation for the period -8.4 -90.0 -1.3 -99.7
Impairment charges and reversed impairment charges 0.3 0.3
Accumulated depreciation and impairment charges, 31 Dec 2015 -0.5 -287.5 -1,959.0 -30.8 -2,277.8
Book value, 1 Jan 2015 18.3 142.6 552.2 9.2 15.4 737.7
Book value, 31 Dec 2015 13.0 135.4 497.3 8.0 158.6 812.3
Impairment charges for the financial year 2016 include EUR 8.5 mil-lion impairments of tangible assets used in discontinued wallpaper base production at Kyro mill and a EUR 2.0 million reversal of previously recognized impairment on a paper machine sold by Husum mill.
Tangible asset decreases of 2015 included the assets of Metsä Board Zanders divested in May 2015. Reversed impairment charges included reversal of impairment on sale of an old paper machine at Simpele mill.
Real estate mortgages for loans from financial institutions, pension loans and other liabilities amounted to EUR 232.8 million (232.8). Commitments are presented in more detail in Note 30.
Borrowing costs totaling EUR 0.6 million were capitalised in tangi-ble assets (in 2015 capitalised interest amounted to EUR 1.8 million). The capitalisation rate used to determine the amount of borrowing costs eligible for capitalisation was 3.57 per cent (3.85 per cent).
NOTE TO THE ACCOUNTS 12

NOTE TO THE ACCOUNTS 12 – FINANCIAL STATEMENTS 2016 51
At 31 December 2016 tangible assets include assets acquired under finance lease agreements:
EUR million BuildingsMachinery and
equipment Total
Acquisition costs 0.8 48.7 49.5
Accumulated depreciation -0.2 -35.6 -35.8
Book value, 1 Jan 2016 0.7 10.4 11.1
Book value, 31 Dec 2016 0.6 13.1 13.7
At 31 December 2015 tangible assets included assets acquired under finance lease agreements:
EUR million BuildingsMachinery and
equipment Total
Acquisition costs 0.8 44.7 45.5
Accumulated depreciation -0.1 -34.3 -34.4
Book value, 1 Jan 2015 0.7 10.7 11.4
Book value, 31 Dec 2015 0.7 10.4 11.1
Additions include assets of EUR 4.8 million (2015: EUR 0.1 million) acquired under finance lease agreements.

52 FINANCIAL STATEMENTS 2016 – NOTE TO THE ACCOUNTS 13
13. Group structure
THE PRINCIPAL SUBSIDIARIES 31 DECEMBER 2016Country Group’s holding, % Number of shares
SHARES AND HOLDINGS IN THE GROUP
Metsäliitto Cooperative Finland 179,171
SHARES IN SUBSIDIARIES
IN FINLAND
Oy Hangö Stevedoring Ab Finland 100.00 150
Metsä Board Kemi Oy Finland 100.00 2,000,000
Metsä Board International Oy Finland 100.00 10,000
IN OTHER COUNTRIES
Metsä Board Deutsche Holding GmbH Germany 100.00
Metsä Board Netherlands B.V. The Netherlands 100.00 1,000
Metsä Board IBP Deals Americas Ltd USA 100.00 50
Metsä Board NL Holding B.V. The Netherlands 100.00 15,350
Metsä Board Reinsurance AG Switzerland 100.00 19,997
Metsä Board Sverige AB Sweden 100.00 10,000,000
M-real UK Holdings Ltd United Kingdom 100.00 146,750,000
Country Group’s holding, % Number of shares
SUBGROUPS IN FINLAND
METSÄ BOARD INTERNATIONAL OY
Metsä Board Benelux n.v./s.a Belgium 100.00 2,921
Metsä Board OOO Russia 100.00 100
Metsä Board CZ, s.r.o. Czech Republic 100.00
Metsä Board Deutschland GmbH Germany 100.00 1
Metsä Board France S.A. France 100.00 8,211
M-real Hellas Ltd Greece 51.00 306
Metsa Board Hong Kong Ltd Hong Kong 100.00 100
Metsa Board Shanghai Ltd China 100.00
Metsa Board Ibéria S.A. Spain 100.00 147,871
Metsa Board Italia S.r.l. Italy 100.00 100,000
Metsä Board Hungary Kft Hungary 100.00 30
Metsä Board (Middle East & North Africa) Ltd Cyprus 100.00 742,105
Metsä Board Polska Sp. Z o.o. Poland 100.00 232
Metsä Board Nordic A/S Denmark 100.00 36
Metsä Board Nordic AB Sweden 100.00 1,000
Metsa Board Singapore Pte Ltd Singapore 100.00 10,000
Metsä Board Schweiz AG Switzerland 100.00 100
Metsa Board UK Ltd United Kingdom 100.00 2,400
Metsa Board Americas Corporation USA 100.00 180
Metsa Board Australia and New Zealand Pty Ltd Australia 100.00 1
Metsa Board Middle East & Africa DMCC United Arab Emirates 100.00 50
OOO Peterbox Russia 100.00 1
NOTE TO THE ACCOUNTS 13

NOTE TO THE ACCOUNTS 13 – FINANCIAL STATEMENTS 2016 53
Country Group’s holding, % Number of shares
SUBGROUPS IN OTHER COUNTRIES
Metsä Board NL Holding B.V.
Metsa Board IBP China Ltd China 100.00
Metsa Board IBP (HK) Ltd Hong Kong 100.00 7,009,900
M-real UK Holdings Ltd
M-real UK Services Ltd United Kingdom 100.00 115,800,001
Country Group’s holding, % Number of shares
JOINT OPERATIONS
Äänevoima Oy 1) Finland 56.25 4,500,000
Ääneverkko Oy 1) Finland 56.25 51,000
1) The primary purpose of the arrangement is to produce energy for the parties, and liabilities incurred in the arrangement shall in actuality be paid from cash flows obtained when the parties purchase the energy generated.
JOINT OPERATIONS
Äänevoima Oy and Ääneverkko Oy have been consolidated using the line-by-line method proportionate to the Metsä Board Group’s holding. Group’s consolidated Income statement and Balance sheet included assets, liabilities, income and costs as follows:
EUR million 2016 2015
Non-current assets 9.9 11.0
Current assets 4.3 4.1
Assets total 14.1 15.1
Non-current liabilities 1.1 15.7
Current liabilities 16.0 3.0
Liabilities total 17.1 18.7
Sales 13.0 12.9
Expenses 12.3 12.2
The result for the period 0.7 0.7
MATERIAL SUBSIDIARIES
Metsä Board has two material subsidiaries:• Metsä Board Sverige AB• Metsä Board Kemi Oy
Metsä Board Sverige AB is located in Örnsköldsvik, Sweden. Metsä Board Sverige AB produces folding boxboard and fresh forest fibre lin-erboard. Until July 2016, the company also produced uncoated paper. In addition, Metsä Board Sverige AB produces pulp for its own produc-tion needs and to the market. Metsä Board Sverige AB’s sales were EUR 398 million (585). The company’s capacity is 270,000 tonnes of liner,
400,000 tonnes of folding boxboard and 730,000 tonnes of chemical pulp.
Metsä Board Kemi Oy is located in Kemi, Finland. Metsä Board Kemi Oy produces fresh forest fibre linerboard, and the company’s capacity is 410,000 tonnes. The company’s sales were EUR 323 million (322).
Non-controlling interest in Metsä Board condolidated Balance sheet amounts to EUR 0.0 million.
INVESTMENTS IN ASSOCIATED COMPANIES AND IN JOINT VENTURES
EUR million 2016 2015
At 1 Jan 260.2 223.1
Investment in Metsä Fibre 24.9 -
Share of results from associated companies and joint ventures
Share of result from Metsä Fibre (operating result) 45.0 61.3
Share of results from other associated companies and joint ventures 0.1 0.1
Dividends received -32.9 -24.9
Share of other comprehensive income from associated companies and joint ventures
Fair value reserve -6.9 0.1
Translation differences and other changes in equity 1.3 0.5
At 31 Dec 291.6 260.2

54 FINANCIAL STATEMENTS 2016 – NOTE TO THE ACCOUNTS 13
AMOUNTS IN INCOME STATEMENT
EUR million 2016 2015
Associated companies 45.0 61.3
Joint ventures 0.1 0.1
Total 45.0 61.4
AMOUNTS IN BALANCE SHEET
EUR million 2016 2015
Associated companies 291.2 259.9
Joint ventures 0.4 0.3
Total 291.6 260.2
The carrying amount of associated companies at 31 December 2016 includes goodwill of EUR 45.2 million (2015: 45.2).
FINANCIAL INFORMATION SUMMARY
OF ESSENTIAL ASSOCIATED COMPANIES
According to management’s view, the only essential associated company is Metsä Fibre Group, which produces chemical pulp and sawn timber. Metsä Board owns 24.9 per cent of Metsä Fibre. Metsä Board’s parent company, Metsäliitto Cooperative, owns 50.2 per cent, and Itochu Corporation from Japan owns 24.9 per cent. Metsä Fibre has operations primarily in Finland, and its production capacity is approximately 2.5 million tonnes of chemical pulp and 1.6 million cubic meters of sawn timber.
SUMMARISED FINANCIAL INFORMATION FOR METSÄ FIBRE
METSÄ FIBRE GROUP
EUR million 2016 2015
Sales 1,351.0 1,444.6
Profit for the period 174.7 263.4
Other comprehensive income -22.8 1.6
Total comprehensive income for the period 152.0 265.0
Dividends received 32.9 24.9
Non-current assets 1,179.7 638.6
Current assets 498.7 614.4
Non-current liabilities 363.6 97.6
Current liabilities 356.3 316.9
Net assets 958.5 838.5
RECONCILIATION OF FINANCIAL INFORMATION FOR METSÄ FIBRE TO THE VALUE RECOGNISED IN CONSOLIDATED BALANCE SHEET
EUR million 2016 2015
Group’s share of net assets 238.7 208.8
Goodwill 45.2 45.2
Other purchase price allocations (PPA) 8.8 9.9
Other items -1.8 -4.4
Carrying amount in consolidated Balance sheet 290.9 259.5
Metsä Fibre has been consolidated according to equity method based on its consolidated financial statements prepared under IFRS.
FINANCIAL INFORMATION SUMMARY OF OTHER THAN ESSENTIAL ASSOCIATED COMPANIES
EUR million 2016 2015
Share of results from other associated companies 0.0 0.0
Carrying amount in consolidated balance sheet 0.4 0.4
JOINT VENTURES
Metsä Board has one joint venture, Kemishipping Oy. Kemishipping Oy offers logistics services in Kemi, in Finland. Parties have joint control of relevant activities. Kemishipping Oy has been consolidated according to equity method. Metsä Board’s ownership is 15 per cent.
EUR million 2016 2015
Sales 16.3 16.8
Profit for the period 0.7 0.6
Profit for the period includes the following items:
Depreciation and impairment charges 1.5 1.7
Interest expenses 0.3 0.4
Income taxes 0.2 0.2
Dividends received - -
Non-current assets 8.8 9.7
Current assets
Cash and cash equivalents 3.1 2.8
Other current assets 2.1 1.9
Non-current liabilities
Non-current financial liabilities 7.4 8.6
Other non-current liabilities 0.0 0.1
Current liabilities
Current financial liabilities 1.3 1.3
Other current liabilities 2.6 2.3
Net assets 2.8 2.1
Group’s share of net assets 0.4 0.3
Carrying amount in consolidated Balance sheet 0.4 0.3
None of the associated companies or joint ventures are listed compa-nies. Transaction and outstanding balances with associated companies and joint ventures are presented in Note 31.

NOTES TO THE ACCOUNTS 14–15 – FINANCIAL STATEMENTS 2016 55
14. Available for sale investments
Available for sale financial assets consist of listed and unlisted shares. The fair value of listed shares are based on public quotation for shares at the Balance sheet date.
EUR million 2016 2015
Shares in other companies
Listed companies 0.0 0.1
Other companies 195.9 210.1
Total 195.9 210.2
The most important shareholding of non-quoted companies consists of a 3.2 per cent stake in Finnish energy company Pohjolan Voima Oy, which produces electricity and heat for its shareholders in Finland. Pohjolan Voima trades with its shareholders at prices based on produc-tion costs, which generally are lower than market prices. The Group is entitled to about 5.2 per cent of the electrity produced by Olkiluoto nuclear power plant (OL1 and OL2) through Pohjolan Voima’s B-shares as well as to about 6.4 per cent of electricity produced by Meripori coal-fired power plant (through C2 shares). The Group is also entitled to 84 per cent of the energy produced by Hämeenkyron Voima Oy (through Pohjolan Voima’s G10 shares). In addition, the Group also has, through Pohjolan Voima’s B2 shares, a share of about 1.5 per cent in Olkiluoto 3, the new nuclear power plant under construction.
The ownership is measured quarterly at fair value on share series basis by using the average of discounted cash flow method and valua-tion based on earlier transactions. The weighted average cost of capital used was 2.06 (2015: 2.72) per cent and 4.06 per cent (5.72) for the Olkiluoto 3 under construction. 12-month rolling averages have been used for energy price estimates, which evens out the effect of fluctua-tions in short-term energy price estimates. The changes in fair value less deferred tax calculated at Finnish tax rate are recorded in other compre-hensive income and presented under fair value reserve in equity.
The acquisition cost of shares in Pohjolan Voima Oy is EUR 39.1million (39.1) and the fair value EUR 191.8 million (206.0), which can be allocated to different shares as follows: The fair value of nuclear power shares totals EUR 185.0 million (198.8), coal power plant shares (C2 shares) have a fair value of EUR -5.2 million (-4.9) and G10 shares EUR 12.0 million (12.0).
Shareholder agreement restricts sale of shares to buyers that are not existing shareholders. Sensitivity analysis of Pohjolan Voima Oy’s shares based on changes in key assumptions is presented in Note 2.
Other shares in unquoted companies, for which fair value cannot be measured reliably, are carried at cost less any impairment losses.
15. Other non-current financial assets
EUR million 2016 2015
INTEREST-BEARING LOAN RECEIVABLES
Loans to Group companies
Loans to associated companies and joint ventures 0.3 0.3
Other loan receivables 3.3 3.4
3.6 3.7
NON-INTEREST BEARING RECEIVABLES
Loans to Group companies - -
Other loan receivables 0.5 0.2
Defined benefit pension plans (note 21) 12.2 10.7
12.7 10.9
Other non-current financial assets total 16.3 14.6
Loans from Group companies are loans granted to parent company Metsäliitto Cooperative and to other subsidiaries of the parent company.
NOTES TO THE ACCOUNTS 14–15

56 FINANCIAL STATEMENTS 2016 – NOTE TO THE ACCOUNTS 16
16. Deferred taxes
RECONCILIATION OF DEFERRED TAX ASSETS AND LIABILITIES TO 2016 BALANCE SHEET
EUR millionAs at
31 Jan 2016Charged to
income statement
Charged to other comprehen-
sive incomeTranslation differences
As at 31 Dec 2016
Deferred tax assets
Pension obligations and other provisions 5.7 -1.3 0.2 0.0 4.7
Intercompany margins 0.6 0.2 0.7
Unused operating loss carry-forwards 0.1 8.2 -0.1 8.2
Financial instruments 9.3 -0.5 -4.8 4.0
Other temporary differences 0.6 2.0 0.0 2.6
Deferred tax assets, total 16.3 8.6 -4.6 -0.1 20.2
Netting against liabilities -11.8 -9.0 4.8 0.1 -15.9
Deferred tax assets in Balance sheet 4.5 -0.4 0.2 0.0 4.3
Deferred tax liabilities
Pension obligations 2.4 -0.1 -0.1 -0.2 2.1
Appropriations 53.5 4.5 -1.4 56.6
Available for sale financial assets recognised at fair value 33.4 -2.8 30.5
Financial instruments 1.5 -1.6 0.9 0.9
Hedge of net investments in foreign operations 0.0 1.3 -1.3 0.0
Other temporary differences 1.2 -0.6 0.6
Deferred tax liabilities, total 92.0 3.5 -2.1 -2.9 90.6
Netting against assets -11.8 -9.0 4.8 0.1 -15.9
Deferred tax liabilities in Balance sheet 80.2 -5.5 2.8 -2.7 74.7
RECONCILIATION OF DEFERRED TAX ASSETS AND LIABILITIES TO 2015 BALANCE SHEET
EUR millionAs at
31 Jan 2015Charged to
income statement
Charged to other comprehen-
sive incomeTranslation differences
Disposed operations
As at 31 Dec 2015
Deferred tax assets
Pension obligations and other provisions 19.0 -1.4 -1.1 0.1 -10.9 5.7
Intercompany margins 1.1 -0.5 0.6
Unused operating loss carry-forwards 3.8 -3.7 0.1
Financial instruments 7.8 -0.2 1.7 9.3
Other temporary differences 0.0 0.6 0.6
Deferred tax assets, total 31.7 -5.2 0.6 0.1 -10.9 16.3
Netting against liabilities -14.4 3.6 -1.0 0.0 -11.8
Deferred tax assets in Balance sheet 17.3 -1.6 -0.4 0.1 -10.9 4.5
Deferred tax liabilities
Pension obligations 0.5 0.3 1.5 0.1 2.4
Appropriations 53.3 -0.6 0.8 53.5
Available for sale financial assets recognised at fair value 38.0 -4.6 33.4
Financial instruments 0.0 0.7 0.8 1.5
Hedge of net investments in foreign operations 0.0 -0.3 0.3 0.0
Other temporary differences 0.8 0.4 1.2
Deferred tax liabilities, total 92.6 0.5 -2.3 1.2 92.0
Netting against assets -14.4 3.6 -1.0 0.0 -11.8
Deferred tax liabilities in Balance sheet 78.2 4.1 -3.3 1.2 80.2
Deferred income tax assets and liabilities are offset when there is a legally enforceable right to offset current tax assets against current tax liabilities and when the deferred income tax relates to the same taxation authority on either the same taxable entity or different taxable entity, which intends to settle current tax liabilities and assets on a net basis, or to realise the assets and settle the liabilities simultaneously.
The Group has recognised deferred tax assets related to operating loss carry-forwards for EUR 8.2 million in Sweden. Management
assesses that taxable profit will be available against which loss carry-forward can be utilised.
The taxable loss carry-forwards of business operations, for which deferred tax assets have not been recognised due to uncertainty of amount or utilisation possibilities, amounted approximately to EUR 507 million (508), mainly in Finland. The unrecognised deferred tax assets for these loss carry forwards is about EUR 113 million (113). About EUR 259 million of the loss carry-forwards will expire between 2017–2021 and another EUR 151 million between 2022–2026. The remaining loss carry-forwards of about EUR 98 million do not expire.
NOTE TO THE ACCOUNTS 16

NOTES TO THE ACCOUNTS 17–19 – FINANCIAL STATEMENTS 2016 57
17. Inventories
EUR million 2016 2015
Raw materials and consumables 69.9 72.9
Work in progress 0.0 0.0
Finished goods and goods for sale 251.1 214.4
Advance payments 11.5 12.0
Total 332.5 299.3
Metsä Board Corporation reduced the carrying value of its inventories by EUR 1.2 million in 2016. In 2015, Metsä Board Sverige AB recog-nised a EUR 2.0 million reduction in the carrying value of inventories.
The expense is included in materials and services in the income statement.
18. Accounts receivables and other receivables
EUR million 2016 2015
Financial assets at fair value through profit or loss (current)
At 1 Jan 0.0 0.0
No changes
At 31 Dec 0.0 0.0
Derivatives outside the application scope of hedge accounting are classi-fied as financial assets at fair value through profit or loss.
INTEREST-BEARING LOAN RECEIVABLES
Other loan receivables - -
Total - -
ACCOUNTS RECEIVABLES AND OTHER NON-INTEREST-BEARING RECEIVABLES
From group companies
Accounts receivables 13.7 13.5
Other receivables 1.8 -
Prepayment and accrued income 3.2 0.2
18.8 13.7
From associated companies and joint ventures
Accounts receivables 0.3 0.2
0.3 0.2
From others
Accounts receivables 203.6 207.9
Other receivables 26.7 31.8
Prepayment and accrued income 24.0 17.3
254.3 257.0
Accounts receivables and other receivables 273.4 270.9
Receivables from Group companies are receivables from parent com-pany Metsäliitto Cooperative and from other subsidiaries of the parent company.
DOUBTFUL ACCOUNTS RECEIVABLES
Accounts receivables are recognised net of the following items of impairment:
EUR million 2016 2015
At 1 Jan 2.7 4.7
Increases 0.6 0.4
Decreases -2.2 -2.4
At 31 Dec 1.1 2.7
EUR 0.4 million of credit loss was recognised during 2016 (EUR 0.1 million in 2015).
AGEING ANALYSIS OF ACCOUNTS RECEIVABLES, EXTERNAL
No overdue 184.0 192.5
Overdue
Less than 30 days 16.6 11.5
Between 31 and 60 days 2.2 1.1
Between 61 and 90 days 0.0 0.3
Between 91 and 180 days 0.3 1.6
More than 180 days 0.4 0.9
Total 203.6 207.9
19. Cash and cash equivalents
EUR million 2016 2015
Current investments 0.5 0.0
Cash at bank and in hand 220.1 321.8
Total 220.6 321.8
Cash and cash equivalents comprise cash on hand and other short-term, highly liquid investments that are readily convertible to known amounts of cash and which are subject to an insignificant risk of changes in value. Metsä Group has classified as cash and cash equiva-lents short-term money market investments according to Group Treasury Policy and interest-bearing receivables comparable to cash funds and available immediately from Metsä Group’s internal bank Metsä Group Treasury Oy.
NOTES TO THE ACCOUNTS 17–19

58 FINANCIAL STATEMENTS 2016 – NOTE TO THE ACCOUNTS 20
20. Shareholders’ equity
CHANGES IN SHARE CAPITAL Share capital
EUR million Series A Series B Total
At 1 Jan 2015 61.2 496.7 557.9
Conversion of A shares into B shares -0.2 0.2 0.0
Rights issue - -
At 31 Dec 2015 61.0 496.9 557.9
Conversion of A shares into B shares - - -
At 31 Dec 2016 61.0 496.9 557.9
Each series A share confers to its holder twenty (20) votes at the General Meeting of Shareholders, and each series B share confers to the holder one (1) vote. All shares carry the same right to receive a dividend. Metsä Board’s A shares can be converted to B shares if shareholder or representative of the nominee registered shares makes a written request of the conversion to the company. No monetary consideration is paid for the conversion.
NUMBER OF SHARES
Series A Series B Total
At 1 Jan 2015 35,985,651 292,179,961 328,165,612
Conversion of A shares into B shares -90,000 90,000 0
Rigths issue 27,347,134 27,347,134
At 31 Dec 2015 35,895,651 319,617,095 355,512,746
Conversion of A shares into B shares - - -
At 31 Dec 2016 35,895,651 319,617,095 355,512,746
The share has no nominal value. All shares have been paid in full.In the first quarter of 2015, Metsä Board Corporation organised a
rights issue, in which 27,347,134 new B shares in total were subscribed at EUR 3.66 per share. The funds received from the new shares, net of transaction cost and deferred tax, were added to reserve for invested unrestricted equity.
FAIR VALUE AND OTHER RESERVES
EUR million 2016 2015
Fair value reserve 113.0 110.0
Legal reserve and reserves stipulated by the Articles of Association 1.7 1.7
Total 114.7 111.7
Reserve for invested unrestricted equity 383.1 383.1
LEGAL RESERVE AND RESERVES STIPULATED
BY THE ARTICLES OF ASSOCIATION
Legal reserve and reserves stipulated by the Articles of Association have been created and accumulated on resolutions by the General Meeting of Shareholders.
FAIR VALUE RESERVE
The reserve include the effective portion of fair value based on hedge accounting applied to interest, currency and commodity derivatives and the fair value change of available for sale financial assets less deferred tax.
TRANSLATION DIFFERENCES
Translation differences include translation differences arising on trans-lation of subsidiaries in other currencies than euro and gains and losses arising on hedging of net investments in these subsidiaries less deferred tax, when requirements of hedge accounting have been fulfilled.
Total cumulative translation difference as of 31 December 2016 amounted to EUR 3.2 million, of which EUR -5.6 million was from the Swedish krona, EUR -4.4 million from the Russian Ruble, mainly through the associate company Metsä Fibre, EUR 10.3 million from the British pound and the remaining EUR 2.9 million from about ten other functional Group currencies.
Total cumulative translation difference as of 31 December 2015 amounted to EUR 14.2 million, of which EUR 5.0 million was from the Swedish krona, EUR -5.9 million from the Russian Ruble, mainly through the associate company Metsä Fibre, EUR 12.2 million from the British pound and the remaining EUR 2.9 million from about ten other functional Group currencies.
RESERVE FOR INVESTED UNRESTRICTED EQUITY
According to Finnish Limited Liability Companies Act the reserve for invested unrestricted equity shall be credited with that part of the subscription price of the shares that according to the share issue deci-sion is not to be credited to the share capital and that according to the Accounting Act is not to be credited to liabilities, as well as with other equity additions that are not to be credited to some other reserve.
DIVIDENDS
After Balance sheet day the Board of Directors has proposed a dividend of EUR 0.19 per share.
NOTE TO THE ACCOUNTS 20

NOTE TO THE ACCOUNTS 20 – FINANCIAL STATEMENTS 2016 59
OTHER COMPREHENSIVE INCOME AFTER TAXES 2016 Equity attributable to shareholders of parent company
EUR millionTranslation
differencesFair value and
other reservesRetained earnings Total
Non-controlling interest Total equity
Actuarial gains/losses on defined pension plans 1.3 1.3 1.3
Income tax relating to items that will not be reclassified 0.3 0.3 0.3
Cash flow hedges
Currency flow hedges
Gains and losses recorded in equity -5.7 -5.7 -5.7
Transferred to adjust sales 0.7 0.7 0.7
Interest flow hedges
Gains and losses recorded in equity 2.3 2.3 2.3
Commodity hedges
Gains and losses recorded in equity 22.1 22.1 22.1
Transferred to adjust purchases 7.6 7.6 7.6
Share of other comprehensive income of associated companies -4.4 -4.4 -4.4
Cash flow hedges, total 22.6 22.6 22.6
Available for sale financial assets
Gains and losses recorded in equity -14.2 -14.2 -14.2
Transferred to other operating income -0.1 -0.1 -0.1
Share of other comprehensive income of associated companies -2.5 -2.5 -2.5
Available for sale financial assets, total -16.7 -16.8 -16.8
Translation differences -12.3 -12.3 -12.3
Gains and losses on hedges of net investments in foreign operations
Share of other comprehensive income of associated companies 1.3 1.3 1.3
Translation differences, total -11.0 -11.0 -11.0
Income tax relating to items that may be reclassified -2.8 -2.8 -2.8
Other comprehensive income after taxes -11.0 3.1 1.6 -6.4 -6.4
OTHER COMPREHENSIVE INCOME AFTER TAXES 2015 Equity attributable to shareholders of parent company
EUR millionTranslation
differencesFair value and
other reservesRetained earnings Total
Non-controlling interest Total equity
Actuarial gains/losses on defined pension plans 6.3 6.3 6.3
Income tax relating to items that will not be reclassified -2.7 -2.7 -2.7
Cash flow hedges
Currency flow hedges
Gains and losses recorded in equity -13.3 -13.3 -13.3
Transferred to adjust sales 21.9 21.9 21.9
Interest flow hedges
Gains and losses recorded in equity 2.6 2.6 2.6
Commodity hedges
Gains and losses recorded in equity -27.7 -27.7 -27.7
Transferred to adjust purchases 13.6 13.6 13.6
Share of other comprehensive income of associated companies 1.5 1.5 1.5
Cash flow hedges, total -1.4 -1.4 -1.4
Available for sale financial assets
Gains and losses recorded in equity -22.7 -22.7 -22.7
Transferred to financial income -0.3 -0.3 -0.3
Share of other comprehensive income of associated companies -1.5 -1.5 -1.5
Available for sale financial assets, total -24.5 -24.5 -24.5
Translation differences 7.1 7.1 7.1
Gains and losses on hedges of net investments in foreign operations
Share of other comprehensive income of associated companies 0.2 0.2 0.2
Translation differences, total 7.3 7.3 7.3
Income tax relating to items that may be reclassified 5.5 5.5 5.5
Other comprehensive income after taxes 7.3 -20.4 3.6 -9.5 -9.5

60 FINANCIAL STATEMENTS 2016 – NOTE TO THE ACCOUNTS 21
arrangement is closed to new members. The assets in the arrangement have been invested in funds that are managed in accordance with local guidelines and practice. Funds administered by third parties pay the benefits to the eligible recipients. The Group participates actively in the activities of the pension trust’s investment committee.
In Finland, the Group has additional pension arrangements that qualify as defined benefit plans. Metsäliitto Employees’ Pension Foundation grants old-age pensions, disability pensions and family pen-sions exceeding the statutory pension level to some of its officials. New members are no longer accepted to the Foundation. The Foundation’s assets have been invested in property, Group company shares and par-ticipations as well as other quoted shares. In addition, the Foundation holds bonds issued by the Group, as well as other issuers, and bank deposits.
The new Finnish pension legislation does not affect Group’s defined benefit obligation, as the rise in statutory pension age is not compen-sated through additional pension benefits.
The Group also has defined benefit plans in Belgium, Italy and Switzerland. The defined benefit plan in the Netherlands has been converted to defined contribution basis in 2016, which reduced both the Group’s defined benefit liabilities and assets by EUR 7.8 million through settlement.
AMOUNTS IN BALANCE SHEET
EUR million 2016 2015
Present value of funded obligations 53.9 60.9
Fair value of plans assets -64.4 -69.7
Deficit of funded plans -10.5 -8.8
Present value of unfunded obligations 12.2 12.0
Deficit of defined benefit pension plans, total 1.6 3.2
Impact of minimum funding requirement / asset ceiling - -
Net liability in Balance sheet 1.6 3.2
21. Retirement benefit obligations
The Group has several arrangements concerning post-employment benefits, including both defined benefit pension plans and defined contribution pension plans.
PENSION AND OTHER POST-EMPLOYMENT BENEFITS
EUR million 2016 2015
Amounts recognised in Balance sheet
Defined benefit pension plans 13.9 13.9
Defined contribution plans 1.3 0.7
Liability in Balance sheet 15.1 14.6
Defined benefit pension plans
Liability in Balance sheet 13.9 13.9
Surplus of funded plans in assets -12.2 -10.7
Net liability of defined benefit pension plans in Balance sheet 1.6 3.2
DEFINED BENEFIT PENSION PLANS
The most significant defined benefit pension plans are in Germany, United Kingdom and Finland.
The number and scope of Group’s German defined benefit pension plans was significantly reduced following the divestment of Metsä Board Zanders GmbH in 2015. The remaining plans grant old-age pensions, disability pensions and family pensions exceeding the statu-tory pension level to eligible officials and senior management. The retirement age is usually 65 years, and the amount of pension depends on the length of service. Officials and senior management are required to have a service history of 25 to 30 years to receive a full pension. Some of the pension arrangements are closed. The defined benefit plans in Germany are unfunded.
The defined benefits plans in United Kingdom guarantee par-ticipants of the plan a pension, the amount of which is based on the length of service and the salary in the most recent working years. The
NOTE TO THE ACCOUNTS 21

NOTE TO THE ACCOUNTS 21 – FINANCIAL STATEMENTS 2016 61
DEFINED BENEFIT PENSION OBLIGATIONS AND PLAN ASSETS BY COUNTRY IN 2016
EUR million Germany United Kingdom Finland Other countries Total
Present value of obligations 10.7 36.4 14.2 4.8 66.1
Fair value of plan assets -45.7 -15.9 -2.8 -64.4
Total 10.7 -9.3 -1.7 2.0 1.6
DEFINED BENEFIT PENSION OBLIGATIONS AND PLAN ASSETS BY COUNTRY IN 2015
EUR million Germany United Kingdom Finland Other countries Total
Present value of obligations 10.5 35.3 13.9 13.2 72.9
Fair value of plan assets -44.1 -14.3 -11.3 -69.7
Total 10.5 -8.8 -0.4 1.9 3.2
CHANGE OF DEFINED BENEFIT PENSION OBLIGATIONS IN 2016
EUR millionPresent value
of obligationFair value of plan assets Total
1 Jan 2016 72.9 -69.7 3.2
Current service cost 0.4 0.4
Administrative costs 0.0 0.0
Interest expense (+) or interest income (-) 2.0 -2.2 -0.2
Past service cost 0.0 0.0
Total amount recognised in profit and loss 2.4 -2.2 0.2
Remeasurements in other comprehensive income
The return on plan assets, excl. amounts included in interest -10.9 -10.9
Gains (-) and losses (+) from change in demo-graphic assumptions -0.6 -0.6
Gains (-) and losses (+) from change in financial assumptions 9.9 9.9
Experience gains and losses 0.1 0.1
Total remeasuments in other comprehensive income 9.4 -10.9 -1.5
Translation differences -5.1 6.3 1.3
Contribution
Employers -0.8 -0.8
Plan participants 0.0 -0.1 -0.1
Payments from plans
Benefit payments -5.7 5.1 -0.6
Settlements -7.8 7.8 0.0
Disposed operations
31 Dec 2016 66.1 -64.4 1.6
CHANGE OF DEFINED BENEFIT PENSION OBLIGATIONS IN 2015
EUR millionPresent value
of obligationFair value of plan assets Total
1 Jan 2015 168.0 -63.8 104.2
Current service cost 0.9 0.0 0.9
Administrative costs 0.0 0.0 0.0
Interest expense (+) or interest income (-) 2.4 -1.9 0.5
Past service cost -0.6 0.0 -0.6
Total amount recognised in profit and loss 2.7 -1.9 0.8
Remeasurements in other comprehensive income
The return on plan assets, excl. amounts included in interest 0.0 -2.6 -2.6
Gains (-) and losses (+) from change in demo-graphic assumptions -0.8 0.0 -0.8
Gains (-) and losses (+) from change in financial assumptions -2.7 0.0 -2.7
Experience gains and losses -0.2 0.0 -0.2
Total remeasuments in other comprehensive income -3.7 -2.6 -6.3
Translation differences 2.5 -2.7 -0.2
Contribution
Employers 0.0 -1.1 -1.1
Plan participants 0.0 0.0 0.0
Payments from plans
Benefit payments -4.3 2.4 -1.9
Settlements -0.7 0.0 -0.7
Disposed operations -91.6 -91.6
31 Dec 2015 72.9 -69.7 3.2

62 FINANCIAL STATEMENTS 2016 – NOTE TO THE ACCOUNTS 21
SENSITIVITY OF BENEFIT OBLIGATION TO CHANGES IN ESSENTIAL WEIGHTED ASSUMPTIONS 2016 Impact on benefit obligation
Change of assumption Increase Decrease
Discount rate, 0.5 %-points 7.8% decrease 8.2% increase
Increase in salary growth rate 0.5 %-points 0.4% increase 0.3% decrease
Increase in pension growth rate 0.5 %-points 6.1% increase 6.0% decrease
One year increase in assumption
One year decrease in assumption
Life expectancy 3.7% increase 3.7% decrease
SENSITIVITY OF BENEFIT OBLIGATION TO CHANGES IN ESSENTIAL WEIGHTED ASSUMPTIONS 2015 Impact on benefit obligation
Change of assumption Increase Decrease
Discount rate, 0.5 %-points 7.5% decrease 8.6% increase
Increase in salary growth rate 0.5 %-points 0.7% increase 0.3% decrease
Increase in pension growth rate 0.5 %-points 5.1% increase 4.4% decrease
One year increase in assumption
One year decrease in assumption
Life expectancy 3.1% increase 3.0% decrease
The aforementioned sensitivity analyses are based on a situation where all other assumptions remain unchanged when one assumption changes. In practice this is not probable, and changes in some assumptions may correlate with each other. The sensitivity of a defined benefit obligation
to changes in significant actuarial assumptions has been calculated using the same method as is used in calculating the pension obligation entered in the balance sheet. The sensitivity analysis has been calculated using the same methods and same assumptions as in previous year.
SIGNIFICANT ACTUARIAL ASSUMPTIONS 2016
Germany United Kingdom Finland Other countries
Discount rate, % 1.53 2.70 1.37 0.40–1.50
Salary growth rate, % 3.0 2.3 1.0 1.0
Pension growth rate, % 1.8 3.3 1.9 0.0–1.5
Average life expectancy of persons retiring at the end of the reporting period
Male 21.4 21.9 21.4 17.2
Female 25.7 23.9 25.4 23.0
Retiring 20 years after the end of reporting period
Male 24.2 23.2 23.7 17.2
Female 28.3 25.4 28.1 23.0
SIGNIFICANT ACTUARIAL ASSUMPTIONS 2015
Germany United Kingdom Finland Other countries
Discount rate, % 2.16 3.90 2.13 0.60–2.33
Salary growth rate, % 3.0 2.0 1.5 1.0–3.0
Pension growth rate, % 2.0 3.0 1.8 0.0–2.0
Average life expectancy of persons retiring at the end of the reporting period
Male 21.3 22.2 21.4 17.2–21.5
Female 25.6 24.4 25.4 23.0–24.4
Retiring 20 years after the end of reporting period
Male 24.0 23.6 23.7 17.2–24.4
Female 28.1 25.9 28.0 23.0–26.9
Assumptions on mortality rate are based on guidance by actuaries on the basis of published statistics in each region and on experience. The assump-tions are used to calculate the average life expectancy for people retiring at the age of 65.

NOTE TO THE ACCOUNTS 21 – FINANCIAL STATEMENTS 2016 63
PLAN ASSETS IN 2016 ARE COMPRISED AS FOLLOWS:
EUR million Quoted Unquoted Total %
Equity instruments 2.6 0.1 2.7 4
Debt instruments
Corporate bonds (investment grade) 0.2 0.3 0.4
Other loans 6.0 6.0
Total 0.2 6.3 6.4 10
Property 5.9 5.9 9
Qualifying insurance policies 1.2 1.2 2
Cash and cash equivalents 0.4 0.4 1
Investment funds 46.2 46.2 72
Assets managed by insurance company 1.6 1.6 2
Total 52.2 12.2 64.4 100
PLAN ASSETS IN 2015 ARE COMPRISED AS FOLLOWS:
EUR million Quoted Unquoted Total %
Equity instruments 2.7 0.1 2.8 4
Debt instruments
Corporate bonds (investment grade) 0.6 0.3 0.9
Other loans 6.0 6.0
Total 0.6 6.3 6.9 10
Property 4.1 4.1 6
Qualifying insurance policies 8.9 8.9 13
Cash and cash equivalents 1.5 1.5 2
Investment funds 43.2 43.2 62
Assets managed by insurance company 2.3 2.3 3
Total 59.2 10.5 69.7 100
Assets included in the pension arrangements include Metsäliitto Cooperative’s participations with a fair value of EUR 0.1 million (2015: 0.1) and Metsä Board Corporation’s B shares with a fair value of EUR 1.5 million (1.6).
Metsäliitto Employees’ Pension Foundation is a separate legal entity granting defined supplementary pension benefits to part of Metsä Board officials and manages foundation’s assets. The foundation owns about 0.1 per cent of Metsä Board Corporation. Furthermore, the foundation has invested EUR 0.2 million in Metsäliitto Cooperative’s participations. The company did not pay any contributions to the foundation in 2016 and 2015. The employer loans granted by the foun-dation to the Group amounted to EUR 5.9 million (5.9) in 2016.
Defined benefit plans expose the Group to several different risks, the most considerable being as follows:
VOLATILITY OF ASSETS
Liabilities arising from the arrangements have been calculated using a discount rate based on the return on corporate bonds. If the return on assets included in the arrangement is less than this return, a deficit is generated. A considerable portion of the assets included in the arrange-ment in United Kingdom consists of shares that are expected to provide a better long-term return than corporate bonds, although in the short-term they generate volatility and risks.
The Group works to reduce investment risk by diversifying the assets in the arrangement to different asset types. However, the Group believes that equity investments offer the best yield in the long run with acceptable risk and that is why a considerable portion of the assets consists of equity investments. The plan assets have been diversifyied also to other asset types, such as property, government bonds as well as corporate bonds.
CHANGES IN THE RETURN ON BONDS
A decrease in corporate yields will increase plan obligations through a lower discount rate even though this will partially be offset by an increase in the value of the plan’s bond assets.
INFLATION RISK
The plan’s benefit obligations are linked to inflation and a higher infla-tion will lead to increased obligation. As a major part of plan’s asset values are unaffected by inflation or inflation only has a minor effect on plan’s asset values, it means that an increase in inflation will also increase the obligation deficit.
LIFE EXPECTANCY
The majority of the arrangement obligations arises from generating life-time benefits for members, so the expected increase in life expectancy will increase the arrangement obligations.
The contribution made to post-employment defined benefit plans is expected to be EUR 1.4 million in 2017.
The weighted average duration of the defined benefit obligation is 14.7 years (15.6).
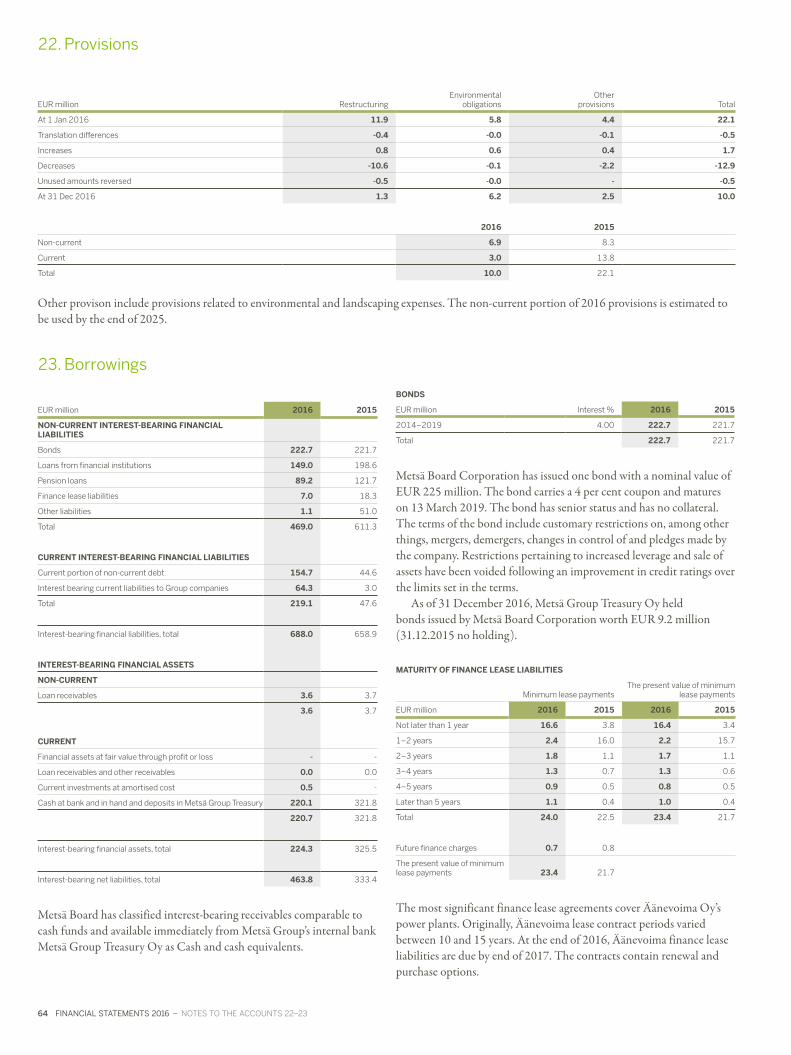
64 FINANCIAL STATEMENTS 2016 – NOTES TO THE ACCOUNTS 22–23
22. Provisions
EUR million RestructuringEnvironmental
obligationsOther
provisions Total
At 1 Jan 2016 11.9 5.8 4.4 22.1
Translation differences -0.4 -0.0 -0.1 -0.5
Increases 0.8 0.6 0.4 1.7
Decreases -10.6 -0.1 -2.2 -12.9
Unused amounts reversed -0.5 -0.0 - -0.5
At 31 Dec 2016 1.3 6.2 2.5 10.0
2016 2015
Non-current 6.9 8.3
Current 3.0 13.8
Total 10.0 22.1
Other provison include provisions related to environmental and landscaping expenses. The non-current portion of 2016 provisions is estimated to be used by the end of 2025.
23. Borrowings
EUR million 2016 2015
NON-CURRENT INTEREST-BEARING FINANCIAL LIABILITIES
Bonds 222.7 221.7
Loans from financial institutions 149.0 198.6
Pension loans 89.2 121.7
Finance lease liabilities 7.0 18.3
Other liabilities 1.1 51.0
Total 469.0 611.3
CURRENT INTEREST-BEARING FINANCIAL LIABILITIES
Current portion of non-current debt 154.7 44.6
Interest bearing current liabilities to Group companies 64.3 3.0
Total 219.1 47.6
Interest-bearing financial liabilities, total 688.0 658.9
INTEREST-BEARING FINANCIAL ASSETS
NON-CURRENT
Loan receivables 3.6 3.7
3.6 3.7
CURRENT
Financial assets at fair value through profit or loss - -
Loan receivables and other receivables 0.0 0.0
Current investments at amortised cost 0.5 -
Cash at bank and in hand and deposits in Metsä Group Treasury 220.1 321.8
220.7 321.8
Interest-bearing financial assets, total 224.3 325.5
Interest-bearing net liabilities, total 463.8 333.4
Metsä Board has classified interest-bearing receivables comparable to cash funds and available immediately from Metsä Group’s internal bank Metsä Group Treasury Oy as Cash and cash equivalents.
BONDS
EUR million Interest % 2016 2015
2014–2019 4.00 222.7 221.7
Total 222.7 221.7
Metsä Board Corporation has issued one bond with a nominal value of EUR 225 million. The bond carries a 4 per cent coupon and matures on 13 March 2019. The bond has senior status and has no collateral. The terms of the bond include customary restrictions on, among other things, mergers, demergers, changes in control of and pledges made by the company. Restrictions pertaining to increased leverage and sale of assets have been voided following an improvement in credit ratings over the limits set in the terms.
As of 31 December 2016, Metsä Group Treasury Oy held bonds issued by Metsä Board Corporation worth EUR 9.2 million (31.12.2015 no holding).
MATURITY OF FINANCE LEASE LIABILITIES
Minimum lease paymentsThe present value of minimum
lease payments
EUR million 2016 2015 2016 2015
Not later than 1 year 16.6 3.8 16.4 3.4
1–2 years 2.4 16.0 2.2 15.7
2–3 years 1.8 1.1 1.7 1.1
3–4 years 1.3 0.7 1.3 0.6
4–5 years 0.9 0.5 0.8 0.5
Later than 5 years 1.1 0.4 1.0 0.4
Total 24.0 22.5 23.4 21.7
Future finance charges 0.7 0.8
The present value of minimum lease payments 23.4 21.7
The most significant finance lease agreements cover Äänevoima Oy’s power plants. Originally, Äänevoima lease contract periods varied between 10 and 15 years. At the end of 2016, Äänevoima finance lease liabilities are due by end of 2017. The contracts contain renewal and purchase options.
NOTES TO THE ACCOUNTS 22–23

NOTES TO THE ACCOUNTS 24–26 – FINANCIAL STATEMENTS 2016 65
24. Other non-current liabilities
EUR million 2016 2015
Non-interest bearing non-current liabilities to Group companies
Non-interest bearing non-current liabilities to others
Accruals and deferred income 0.1 0.1
Other liabilities 0.0 0.1
Total non-interest bearing non-current liabilities 0.1 0.2
Liabilities to Group companies are liabilities to parent company Metsäliitto Corporative and other subsidiaries of the parent company.
25. Accounts payable and other liabilities
EUR million 2016 2015
Non-interest bearing current liabilities to Group companies
Accounts payable 40.8 42.7
Other liabilities 2.3 2.2
Non-interest bearing current liabilities to associated companies and joint ventures
Accounts payable 1.2 1.5
Non-interest bearing current liabilities to others
Advance payments 9.4 6.1
Accounts payable 209.8 248.5
Other liabilities 8.1 19.6
Accruals and deferred income 61.6 66.7
Total 333.2 387.3
Liabilities to Group companies are liabilities to parent company Metsäliitto Corporative and other subsidiaries of the parent company.
26. Management of financial risks
The financial risks associated with business operations are managed in accordance with the financial policy endorsed by the Board of Directors and the senior management of the company. The policy defines focal instructions on the management of foreign currency, inter-est rate, liquidity and counterparty risks, and for the use of derivative financial instruments. Correspondingly, commodity risks are managed according to the company’s commodity risk policy. The purpose is to protect the company against major financial and commodity risks, to balance the cash flow and to allow the business units time to adjust their operations to changing conditions.
Metsä Group Treasury Oy is specialized in finance and functions as the Group’s internal bank. Metsäliitto Cooperative’s holding is 100 per cent of the company. Financial operations have been centralised to Metsä Group Treasury, which is in charge of managing the Group companies’ financial positions according to the strategy and financial policy, providing necessary financial services and acting as an advisor in financial matters.
FOREIGN CURRENCY RISK
The Group’s foreign currency exposure consists of the risks associated with foreign currency flows, translation risk of net investments in foreign entities and economic currency exposure. Most of the Group’s costs are incurred in the euro zone and to some extent in Sweden, but a significant part of the sales is in other currencies. Sales may therefore vary because of changes in exchange rates, while production costs remain unchanged. Product prices are also often quoted in curren-cies other than the home currency. The foreign currency transaction exposure consists of foreign currency denominated sales and costs. The exposure includes foreign currency denominated balance sheet exposure consisting of accounts receivable and accounts payable and a quarter share of the annual contracted or estimated net currency cash flow.
The main currencies of the Group’s foreign currency transaction exposure are the US dollar, the British pound and the Swedish krona. The share of dollar is 57 per cent, share of pound is 6 per cent and share of Swedish krona is 34 per cent. A strengthening of the dollar and the pound has a positive impact on the financial result and a weakening a negative impact. A weakening of the Swedish krona has a positive impact on the result of the Group. Other significant currencies are the Australian dollar, the Canadian dollar and the Danish krone. The Russian rouble’s share of the direct currency transaction exposure is minor. The hedging policy is to keep the balance sheet exposure and a quarter of annual cash flow of contracted or estimated currency flows consistently hedged. The hedging level can, however vary between 0–12 months as the financial policy has defined separate risk mandates for deviating from the norm hedging. The Board of Directors decides on significant changes in the hedging level if they see a reason to deviate from the norm set out in the financial policy. The amount of currency-specific hedging depends on current exchange rates and market expecta-tions, on the interest rate differences between the currencies and the sig-nificance of the exchange rate risk for the financial result of the Group. The transaction exposure is mainly hedged by forward transactions but also by the use of foreign currency loans and currency options.
NOTES TO THE ACCOUNTS 24–26

66 FINANCIAL STATEMENTS 2016 – NOTE TO THE ACCOUNTS 26
Hedge accounting in accordance with IAS 39 is applied to hedging of part of the currency transaction exposure, which allows fair value changes of hedges designated to hedge accounting to be recognized in other comprehensive income. At the end of the reporting period, the foreign exchange transaction exposure had been hedged 6.4 months on average (2015: 3.6). During the reporting period, the hedging level has varied between 3 and 7 months (3–6). The dollar’s hedging level was 6.5 months (2.9), of which the portion of hedge accounting was 3.8 months (2.4). The Swedish krona’s hedging level was 6.5 months (4.5), of which the portion of hedge accounting was 3.6 months (2.5). The pound’s hedging level was 5.2 months (5.6), of which the portion of hedge accounting was 3.6 months (4.3). Hedges allocated to hedge accounting have been used to hedge the portion of highly probable forecast sales of the currency transaction exposure. At the end of the reporting period on average 152 per cent of the norm determined in the hedging policy was hedged (84). After the review period the Treasury Policy has been changed so that policy is to keep the balance sheet exposure and 50 per cent of annual cash flow of contracted or estimated currency flows hedged.
The translation risk of a net investment in a foreign entity is gener-ated from the consolidation of the equity of subsidiaries and associ-ated companies outside the euro area into euros in the consolidated financial statements. According to the financial policy, 0–100 per cent of equity should be hedged. Hedging of equity has for the time been discontinued.
The Group applies the Value-at-Risk method to assess the risk of its open foreign currency positions. The VaR is calculated on the deviation from the balance sheet exposure plus the quarter of annual foreign cur-rency exposure hedge norm defined in the financial policy. A 99 per cent confidence level on one month period is applied to the VaR risk figure, i.e., the VaR indicates that with a 1 per cent probability the market value of the open foreign currency position depreciates more than the amount of the risk figure in a month. The risk mandates regarding hedging decisions have been defined by restricting the company management’s powers by linking them to maximum currency-specific hedging level changes and to a VaR limit. Possible strategic decisions which exceed the policy risk limits are made by the Board of Directors. The limit set for the Metsä Board’s foreign currency risk is EUR 10.0 million (12.0) and the VaR at the end of the reporting period was EUR 8.5 million (1.1). Average during the period has been EUR 3.1 million (1.6).
INTEREST RATE RISK
The interest rate risk is related mainly in the interest bearing receivables and loans, working capital financing and currency hedging. The most significant currencies in risk management are the euro, the US dollar, the British pound and the Swedish krona. The objective of the inter-est rate risk policy is to minimise the negative impact of interest rate changes on the Group’s and group companies’ result and the financial position, and to optimise financing costs within the framework of risk limits. The effect of interest rate changes on financial costs depends on the average interest fixing time of interest bearing assets and liabilities, which is measured in the Group by duration. As duration is lengthen-ing the rise of interest rates affects more slowly the interest expenses of financial liabilities. The maturity of the loan portfolio can be influ-enced, e.g., by adjusting between floating-rate and fixed-rate loans and by using interest rate derivatives. The Group uses in its interest rate risk management interest rate swaps, interest rate futures and interest rate options.
The average interest duration norm based on the Group’s financial policy is twelve months. The duration can, however, deviate from the hedging policy norm so that the decision of a deviation exceeding four months has to be made by the Board of Directors. The average duration of loans was 14.9 months at the end of the year (20.6). During the reporting period duration has varied between 14 and 21 months (20–28). At the end of 2016, an increase of one percentage point in interest rates would increase net interest rate costs of the next 12 months by EUR -0.3 million (decrease by 1.1).
The Group is exposed to a risk of change in the value of derivatives due to a change in market prices when using interest rate derivatives, since according to IAS 39 derivatives must be valued to their fair value in the balance sheet. However, the partial application of hedge account-ing will balance the effects of changes in the market value of derivatives on the financial result of the Group. The Group is applying fair value hedge accounting in accordance with IAS 39 to fixed-rate loans which have been converted by interest rate and currency swaps to floating-rate financing. In addition, the Group is applying cash flow hedge account-ing in accordance with IAS 39 to the major part of the interest rate swaps by which floating-rate financing has been converted to fixed-rate financing. The gross nominal volume of interest rate derivatives at the time of the 2016 financial statements was EUR 100.0 million (253.4), which is totally allocated to hedge accounting. The maturity of interest rate swap contracts varies between 1–2 years (1–5).
1.6
1.4
1.2
1.0
0.8
0.6
2012 2013 2014 2015 2016 2012 2013 2014 2015 2016
2.0
1.5
1.0
0.5
0
-0.5
EXCHANGE RATE TRENDSEUR
EUR/USD EUR/GBP
INTEREST RATE TRENDS3 MONTHS
EURIBOR USD GBP
NOTE TO THE ACCOUNTS 26

NOTE TO THE ACCOUNTS 26 – FINANCIAL STATEMENTS 2016 67
COMMODITY RISK
In the hedging of commodity risks the Group applies risk management policies defined separately for each selected commodity. According to the policy, the management of commodity risks with regard to financial hedges is accomplished centralized by Metsä Group Treasury based on the strategy approved by Board of Directors of Metsä Board. The commodity hedging policy has been applied to the management of the price risks of electricity, natural gas, propane, gas oil and pulp and also transactions related to emission allowances have been managed by Metsä Group Treasury.
Metsä Board’s target in managing the electricity price risk is to balance the effect of changes in the price of electricity on the Group’s result and financial position. The main principle is to hedge the elec-tricity purchase exposure, which consists of the difference of factory-specific electricity consumption estimates and power plant production shares in the possession of the Group. With regard to the Finnish and Swedish electricity procurement, the hedge strategy is implemented in cooperation with Metsä Group Energy service unit centralized through Metsä Group Treasury. Metsä Board hedges the electricity price risk actively by setting the hedging norm at 80, 40, 20, 10 and 10 per cent share of the estimated net position during the first, second, third, fourth and fifth successive 12-month periods respectively. Electricity hedging has been carried out by using financial hedges, and hedge accounting in accordance with IAS 39 has been applied to all electric-ity hedges. Consequently, the fair value of hedges allocated to hedge accounting is recognized in other comprehensive income and only after the realisation of electricity purchases in the income statement as an adjustment of the purchases.
Approximately a quarter of Metsä Board’s mills’ purchase of fuel is based on natural gas. The hedging of natural gas price risks has so far been done with physical, fixed-price contracts. Since the beginning of 2016, the prices of natural gas in Finland have been bound to crude oil prices (Brent), coal price applied in Europe (API2) and the energy price index. Metsä Board is hedging the price risk of propane purchases by using financial hedges, and IAS 39 hedge accounting is applied. The hedging strategy of natural gas and propane is based on a risk policy according to which Metsä Group Energy makes the hedging decisions with the support of Metsä Group Treasury, and the Group Board of Directors makes significant strategic decisions.
Metsä Board is hedging also the gas oil price risk hedging related to logistics costs (sea freights) based on risk policy by using financial hedges and IAS 39 hedge accounting is applied.
According to the pulp price risk hedging policy, a Group company may selectively hedge its price risk either by financial hedges through Metsä Group Treasury or fixed-price physical contracts. Hedge accounting in accordance with IAS is applied within the pulp price risk management. Metsä Board has no valid pulp price risk hedges at the end of the year.
LIQUIDITY RISK
Liquidity risk is defined as the risk that funds and available funding become insufficient to meet business needs, or costs that are incurred in arranging the necessary financing are unreasonable high. Liquidity risk is monitored by estimating the need for liquidity 12–24 months ahead and ensuring that the total liquidity available will cover a main part of this need. According to the financial policy, the liquidity reserve must
at all times cover 100 per cent of the Group’s liquidity requirement for the first 12 months and 50–100 per cent of the following 12–24 months liquidity requirement. The objective is that at the most 20 per cent of the Group’s loans, including committed credit facilities, are allowed to mature within the next 12 months and at least 25 per cent of the total debt must have a maturity in excess of four years. When the financial markets are functioning normally from the company’s point of view, the target is to avoid keeping extra liquidity as liquid funds and instead maintain a liquidity reserve as committed credit facilities outside the balance sheet.
The cornerstone of liquidity risk management is to manage the Group’s operative decisions in such a way that targets concerning indebtedness and sufficient liquidity reserve can be secured in all economic conditions. Liquidity risk is also managed by diversifying the use of capital and money markets to decrease dependency on any single financing source. The optimisation of the maturity structure of loans is also emphasized in financial decisions. Metsä Board is using short-term working capital financing related to accounts receivables and accounts payables.
Metsä Board agreed in June 2016 on the extension of its existing syndicated credit facility by two years. The syndicated facility consist-ing of EUR 150 million term loan facility and EUR 100 million revolv-ing credit facility will after the amendment mature in March 2020.
Metsä Board’s liquidity has remained strong. At the end of the review period, available liquidity was EUR 422.6 million (486.5), of which EUR 100.0 million (100.0) consisted of a revolving credit facil-ity, EUR 102.0 million (64.7) consisted of undrawn pension premium (TyEL) funds and EUR 220.6 million (321.8) of liquid assets and investments. Of the liquid funds, EUR 5.1 million consisted of cash and cash equivalents and investments and EUR 215.5 million were cash comparable, interest-bearing immediately drawable receivables from Metsä Group’s internal bank Metsä Group Treasury Oy. In addi-tion, the Group had other interest-bearing receivables worth EUR 3.7 million (3.7). Metsä Board liquidity reserve is supplemented by Metsä Group internal EUR 150.0 million unused short-term funding limit.
At the end of 2016, the liquidity reserve covers fully the forecasted financing need of 2017–2018. 19 per cent (5) of long-term loans and committed facilities fall due in a 12 month period and 13 per cent (11) have a maturity of over four years. The average maturity of long-term loans is 2.2 years (2.6). The share of short-term financing of the Group’s interest bearing liabilities is 9.3 per cent (0.5).
COUNTERPARTY RISK
Financial instruments carry the risk that the Group may incur losses should the counterparty be unable to meet its commitments. The Group is managing this risk by entering into financial transactions only with most creditworthy counterparties and within pre-determined limits. During the reporting period, credit risks of financial instru-ments did not result in any losses. Cash and cash equivalents, and other investments have been spread to several banks and commercial papers of several institutions. Counterparty limits have been revised during the year by taking into account the needs of the company and the view on the financial position of the used counterparties. Derivatives trading is regulated by the standardised ISDA contracts made with the coun-terparties. Main part of financial credit risks were in 2013 transferred

68 FINANCIAL STATEMENTS 2016 – NOTE TO THE ACCOUNTS 26
directly out of Metsä Board balance sheet followed by the change of Metsä Group Treasury ownership.
The Group’s accounts receivable carry a counterparty risk that the Group may incur losses should the counterparty be unable to meet its commitments. Credit risk attached to accounts receivable is managed on the basis of the credit risk management policies approved by opera-tive management. Accounts receivable performance is followed weekly by Group Credit Risk Management Team and reported monthly to Corporate Credit Committee and operative management. Credit qual-ity of customers is assessed at regular intervals based on the customers’ financial statements, payment behaviour, credit agencies and credit ratings agencies. Individual credit limits are reviewed at least annually. Letters of Credits, bank and parent company guarantees and Credit insurance are used to mitigate credit risk according to management decisions. Credit limits are approved according to credit risk manage-ment policy with approval limits of varying values across the Group. The Corporate Credit Committee reviews and sets all major credit lim-its which are not supported by credit insurance and/ or other security.
Metsä Board implements regular impairment tests for customer accounts receivables. Credit loss impairment is booked when a cus-tomer enters legal bankruptcy, or becomes past due for more than 6 months (180 days) without a valid payment plan or other acceptable reasons. New credit loss provisions for the year were EUR 0.4 million (2015: 0.1). The portion of overdue client receivables of all accounts receivable is at the time of financial statements 9.6 per cent (6.2), of which 0.1 per cent (0.7) is overdue between 90–180 days and 0.2 per cent (0.2) over 180 days. The specification of doubtful receivables is in the Notes.
The geographical structure of the accounts receivable is diversified and is reflecting the external sales structure presented in the Segment information. The top ten largest sources of credit risk exist in Italy, USA, United Kingdom, Poland, Sweden, Finland, Germany, Russia, Spain and Australia (around 59 per cent of total external receivables (67)). The share of largest individual customer (individual companies or groups of companies under common ownership) credit risk exposure of Metsä Board at the end of 2016 represented 6 per cent (5) of total external accounts receivable. 28 per cent (30) of accounts receivable was owed by ten largest customer groups (individual companies or groups of companies under common ownership). At the end of 2016, there was no material shortfall of credit insurance limits beyond usually policy deductibles and exclusions.
MANAGING THE CAPITAL
Terms capital and capital structure are used to describe investments made in the company by its owners and retained earnings (together equity) and debt capital (liabilities) as well as the relation between them. In managing its capital structure, the Group aims at maintaining an efficient capital structure that ensures the Group’s operational condi-tions in financial and capital markets in all circumstances despite the fluctuations typical to the sector. The company has a credit rating for its long-term financing. Certain central target values, which correspond to standard requirements set by financing and capital markets, have been defined for the capital structure. No target level has been defined for the credit rating. The Group’s capital structure is regularly assessed by the Group’s Board of Directors and its Audit Committee.
The Group monitors the development of its capital structure through a key ratio that describes net gearing. The objective of the Group is to maintain its net gearing ratio below the 70 per cent level.
The key ratios describing the capital structure and the capital amounts used for the calculation of the key ratio were on 31.12.2016 and 31.12.2015 the following:
EUR million 2016 2015
Net gearing ratio, % 44 32
Interest-bearing borrowings 688.0 658.9
./. Liquid funds 220.6 321.8
./. Interest-bearing receivables 3.7 3.7
463.8 333.4
Equity attributable to shareholders of parent company 1,052.5 1,028.9
+ Non-controlling interest 0.0 0.0
Total 1,052.5 1,028.9
In Group’s certain financial contracts financial covenants have been set regarding financial performance and capital structure. Other covenants in the Group’s loan agreements are customary terms and conditions including for example a negative pledge, restrictions on major asset dis-posals, limitations on subsidiary indebtedness, restrictions on changes of business and mandatory prepayment obligations upon a change of control of the Group. During 2015 the improvement of credit ratings removed part the mentioned restrictions. The Group has been in compliance with its covenants during the accounting periods 2016 and 2015.
In case the company could not meet its obligations as defined in financial contracts and in order to avoid a breach of contract that could have an adverse effect on the company’s financial position, it would need to renegotiate its financial arrangements, repay its loans or get its debtors to give up their claims to meet these obligations.

NOTE TO THE ACCOUNTS 26 – FINANCIAL STATEMENTS 2016 69
HEDGING OF FOREIGN EXCHANGE TRANSACTION EXPOSURE
31 DEC 2016 Annual transaction exposure
USD GBP SEK DKK AUD CAD Other long Other short2016
TOTAL2015
TOTAL
Transaction exposure, net (mill. currency units) 734 64 -3,950 32 15 19
Transaction exposure, net (EUR million) 696 75 -414 4 10 14 1 0 1,213 1,078
Transaction exposure hedging (EUR million) -375 -32 224 -1 -7 -4 0 0 -643 -325
Hedging at the end of the year (months) 6.5 5.2 6.5 3.5 8.0 3.4 0.0 6.4 3.6
Average hedging in 2016 (months) 4.6 5.1 5.6 3.3 7.2 3.4 3.8 4.9 4.2
HEDGING OF NET INVESTMENTS IN A FOREIGN ENTITY
31 DEC 2016 Equity exposure
GBP SEK Others2016
TOTAL2015
TOTAL
Equity exposure (mill. currency units) 12 2,708
Equity exposure (EUR million) 14 283 7 304 339
Equity hedging (EUR million) 0 0 0 0 0
Hedging at the end of the year (%) 0 0 0 0 0
Average hedging in 2016 (%) 0 0 0 0 0
INTEREST RATE RISK / DURATION AND RE-PRICING STRUCTURE OF LOANS (INCL. INTEREST RATE DERIVATIVES)
31 DEC 2016 31 DEC 2015
Loanamount
(mill. EUR)Duration(months)
Averageinterest rate
(%)
Interest ratesensitivity1) (mill. EUR)
Re-pricing structure of interest rates of loans Loanamount
(mill. EUR)Duration(months)
Averageinterest rate
(%)
Interest ratesensitivity1)
(mill. EUR)1–4/2017 5–8/2017 9–12/2017 2018 2019 2020 –>2020
688 14.9 3.3 0.3 63 189 17 133 258 26 2 659 20.6 3.8 -1.1
1) Interest rate sensitivity is an estimate of the effect of an interest rate change of one percent in one direction on net interest cost based on year end exposure.
HEDGING OF ELECTRICITY PRICE RISK EXPOSURE
GWh 31 DEC 2016 31 DEC 2015
Electricity exposure, net 2017 1,011 969
Electricity hedging 2017 751 823
Hedging at the end of the year 2016 (%) 74 85
Electricity price risk is hedged based on defined risk management policy on a time horizon of four years either by physical contracts or by financial contracts. The table is applying only to the hedging of electricity price risk of the following year. The net electricity exposure has been calculated by taking into account the own and associated companies’ electricity production.
CURRENCY BREAKDOWN FOR LOANS%
EUR ..............................................................98.9 SEK ................................................................. 1.1
FOREIGN CURRENCY BREAKDOWN FOR CURRENCY EXPOSURE%
USD ..................................................................58 GBP .................................................................... 6 SEK ...................................................................34 DKK .................................................................... 0 AUD .................................................................... 1 CAD .................................................................... 1 Others ................................................................ 0

70 FINANCIAL STATEMENTS 2016 – NOTE TO THE ACCOUNTS 26
MARKET RISK SENSITIVITY 31 DEC 2016 31 DEC 2016 IMPACT ON EQUITY EXPOSURE AND ANNUAL TRANSACTION EXPOSURE 31 DEC 2016
EUR million
Impact on financial assets
and liabilities
Impact onnet equity of
foreign entities
Impact onnet equity of
foreign entitiesincl. hedging
Impact on annualtransaction expo-
sure (cash flow)
Impact on annualtransaction expo-
sure (cash flow)incl. hedging
INTEREST RATE RISK (100 BP RISE IN INTEREST RATES)
Effect on profit -0,3 0,8
Effect on other change in equity 1,0
COMMODITY RISK (ELECTRICITY PRICE + 20%)
Effect on profit -6,9 4,1
Effect on other change in equity 11,0
FX RISK (USD - 10%)
Effect on profit 7,7 -69,6 -32,1
Effect on other change in equity 21,7 -0,1 -0,1
FX RISK (GBP - 10%)
Effect on profit 0,1 -X.X -X.X
Effect on other change in equity 2,3 -1,4 -1,4
FX RISK (SEK - 10%)
Effect on profit -5,2 41,4 18,9
Effect on other change in equity -12,1 -28,3 -28,3
MARKET RISK SENSITIVITY 31 DEC 2015 31 DEC 2015 IMPACT ON EQUITY EXPOSURE AND ANNUAL TRANSACTION EXPOSURE 31 DEC 2015
EUR million
Impact on financial assets
and liabilities
Impact onnet equity of
foreign entities
Impact onnet equity of
foreign entitiesincl. hedging
Impact on annualtransaction expo-
sure (cash flow)
Impact on annualtransaction expo-
sure (cash flow)incl. hedging
INTEREST RATE RISK (100 BP RISE IN INTEREST RATES)
Effect on profit -1.3 1.1 2.1
Effect on other change in equity 2.3
COMMODITY RISK (ELECTRICITY PRICE + 20%)
Effect on profit -5.0 3.3
Effect on other change in equity 8.4
FX RISK (USD - 10%)
Effect on profit 0.1 -67.0 -50.6
Effect on other change in equity 13.3 -0.1 -0.1
FX RISK (GBP - 10%)
Effect on profit -1.2 -9.0 -4.8
Effect on other change in equity 3.2 -1.4 1.4
FX RISK (SEK - 10%)
Effect on profit -0.7 28.2 17.6
Effect on other change in equity -5.7 -32.0 -32.0
Items with + sign = positive effect = increase of assets / decrease of liabilities / increase of cash flow.Items with - sign = negative effect = decrease of assets / increase of liabilities / decrease of cash flow.
IFRS 7 requires an entity to disclose a sensitivity analysis for each type of market risk to which the entity is exposed at the reporting date, show-ing how profit or loss and equity would have been affected by changes in the relevant risk variable that were reasonably possible at that date. The Group has recognised interest rates, electricity prices and foreign exchange rates as its key market risks and has set 1 per cent interest rate rise, 20 per cent rise in electricity price and 10 per cent weakening of the US dollar, the British pound and the Swedish krona as reasonably possi-ble risk variables. These currencies represent over 90 per cent of Group’s annual transaction exposure. The nature of the market price risk is rela-tively linear so that the size of effects of opposite market price changes do not essentially differ from the presented figures. The scenarios have been calculated by using regular principles of calculating market values of financial instruments described in the Group Accounting policies. Figures at the reporting date reflect quite well the average market risk conditions throughout the reporting period.
Additionally the Group is presenting figures describing the effects of the risk variables to its equity exposure and annual transaction exposure (cash flow) to present a broader picture about market risks of interest rates, electricity prices and foreign exchange rates. Annual cash flows are based on estimates, but not existing commercial contracts. The weakening of the US dollar and the British pound has a negative impact on annual cash flow and the weakening of the Swedish krona has a positive impact. Hedges reduce this impact depending on hedging strategy. The impact on net equity of foreign entities is arising from the consolidation of subsidiaries to the Group consolidated accounts. The rise of electricity price has a negative impact on cash flow. As according to hedging policy the electricity price risk of the nearest year has mostly been hedged, the impct including hedges remains minor. When the cash flow of the nearest year and all electricity hedges have been taken into account, the calculatory impact is slightly positive.

NOTE TO THE ACCOUNTS 26 – FINANCIAL STATEMENTS 2016 71
CASH FLOWS OF INSTALLMENTS AND INTEREST PAYMENT OF FINANCIAL LIABILITIES 31 DEC 2016
EUR millionCarrying amount 2017 2018 2019 2020 2021 2022–
Bonds 222.7
Installments -222.7
Interest payment -9.0 -9.0 -9.0
Loans from financial institutions 199.0
Installments -50.0 -0.2 -0.2 -148.6
Interest payment -3.3 -3.0 -3.1 -0.9
Pension loans 127.6
Installments -38.5 -32.5 -32.5 -24.1
Interest payment -5.2 -3.6 -2.1 -0.6
Finance lease liabilities 23.4
Installments -16.4 -2.2 -1.7 -1.3 -0.8 -1.0
Interest payment -0.3 -0.1 -0.1 0.0 0.0 -0.1
Interest-bearing liabilities 51.0
Installments -49.9 -1.1
Interest payment -0.7
NON-CURRENT INTEREST-BEARING LIABILITIES, TOTAL 623.7
REPAYMENTS IN 2017 -154.7
NON-CURRENT INTEREST-BEARING LIABILITIES IN BALANCE SHEET 469.0
Total
Installments -154.7 -35.0 -257.1 -174.0 -0.8 -2.1
Interest payment -18.5 -15.7 -14.3 -1.5 0.0 -0.1
Current interest-bearing liabilities 64.3
Installments -64.3
Interest payment 0.0
Accounts payables and other liabilities 339.2
Repayment -339.1 -0.1
TOTAL LIABILITIES 1,027.2
Installments -558.1 -35.1 -257.1 -174.0 -0.8 -2.1
Interest payment -18.5 -15.7 -14.3 -1.5 0.0 -0.1
Carrying amount
Guarantees agreement 4.1 -0.3 -0.3 0.0 -0.2 -3.2
Derivative financial instrument liabilities 14.6
Interest rate swaps -1.2 -0.5
Currency derivatives -710.7
Commodity derivatives
DERIVATIVE FINANCIAL INSTRUMENT LIABILITIES TOTAL -711.9 -0.5
Derivative financial instrument assets 5.6
Interest rate swaps
Currency derivatives 697.7
Commodity derivatives 2.9 1.6 -0.2 1.3
DERIVATIVE FINANCIAL INSTRUMENT ASSETS TOTAL 700.6 1.6 -0.2 1.3
Derivative financial instruments cash flow -11.3 1.1 -0.2 1.3

72 FINANCIAL STATEMENTS 2016 – NOTE TO THE ACCOUNTS 26
CASH FLOWS OF INSTALLMENTS AND INTEREST PAYMENT OF FINANCIAL LIABILITIES 31 DEC 2015
EUR millionCarrying amount 2016 2017 2018 2019 2020 2021–
Bonds 221.7
Installments -221.7
Interest payment -9.0 -9.0 -9.0 -9.0
Loans from financial institutions 198.6
Installments -50.0 -148.6
Interest payment -3.2 -3.6 -1.1
Pension loans 160.2
Installments -38.5 -32.5 -32.5 -32.5 -24.2
Interest payment -6.7 -5.0 -3.6 -2.1 -0.6
Finance lease liabilities 21.7
Installments -3.4 -15.7 -1.1 -0.6 -0.5 -0.4
Interest payment -0.4 -0.3 -0.1 -0.0 -0.0 -0.0
Interest-bearing liabilities 53.7
Installments -2.7 -49.9 -1.1
Interest payment -0.7 -0.7
NON-CURRENT INTEREST-BEARING LIABILITIES, TOTAL 655.9
REPAYMENTS IN 2016 -44.6
NON-CURRENT INTEREST-BEARING LIABILITIES IN BALANCE SHEET 611.3
Total
Installments -44.6 -148.1 -182.2 -254.8 -24.7 -1.5
Interest payment -20.0 -18.6 -13.8 -11.1 -0.6 -0.0
Current interest-bearing liabilities 3.0
Installments -3.0
Interest payment -0.0
Accounts payables and other liabilities 390.3
Repayment -390.2 -0.1 -0.1
TOTAL LIABILITIES 1,049.2
Installments -437.8 -148.2 -182.2 -254.8 -24.7 -1.6
Interest payment -20.0 -18.6 -13.8 -11.1 -0.6 -0.0
Carrying amount
Guarantees agreement 4.3 -0.4 -0.2 -0.3 -0.0 -3.4
Derivative financial instrument liabilities 25.0
Interest rate swaps -1.9 -0.2 0.1 0.4 0.1
Currency derivatives -465.5
Commodity derivatives -15.1 -5.2 -2.1 -1.9 -0.0
DERIVATIVE FINANCIAL INSTRUMENT LIABILITIES TOTAL -482.5 -5.4 -2.0 -1.5 0.1
Derivative financial instrument assets 0.2
Interest rate swaps
Currency derivatives 465.7
Commodity derivatives
DERIVATIVE FINANCIAL INSTRUMENT ASSETS TOTAL 465.7
Derivative financial instruments cash flow -16.8 -5.4 -2.0 -1.5 0.1

NOTE TO THE ACCOUNTS 26 – FINANCIAL STATEMENTS 2016 73
MATURITY ANALYSIS OF CASH FLOW HEDGE ACCOUNTING
Result of the hedging instrument is recognised to the income statement at the realisation of the cash flow. Contractual maturities of hedging instruments equals to the hedged cash flow.
EUR million 31 DEC 2016
Periods when the forecasted cash flow are expected to occur, EUR million
Highly probable
foreign currency
cash flows
Contractualinterest
cash flows
Highly probable commodity
cash flows (pulp)
Highly probable commodity
cash flows (others)
Q1 154,8 - -7,7
Q2 115,9 -1,0 -7,7
Q3 82,0 - -7,1
Q4 10,4 -1,0 -7,1
Total 2017 363,2 -2,0 - -29,5
2018 -1,0 -16,9
2019 -10,9
2020 -8,7
2021
Cash flows total 363,2 -3,0 - -66,1
Total nominal values of derivatives directed to hedge accounting 363,2 100,0 - 66,1
EUR million 31 DEC 2015
Periods when the forecasted cash flow are expected to occur, EUR million
Highly probable
foreign currency
cash flows
Contractualinterest
cash flows
Highly probable commodity
cash flows (pulp)
Highly probable commodity
cash flows (others)
Q1 88.0 -0.3 -10.6
Q2 73.4 -1.5 -10.4
Q3 46.1 -0.3 -9.8
Q4 15.9 -0.5 -9.7
Total 2016 223.4 -2.6 - -40.5
2017 -1.9 -21.0
2018 -0.8 -9.7
2019 -7.4
2020 -1.5
Cash flows total 223.4 -5.3 - -80.1
Total nominal values of derivatives directed to hedge accounting 223.4 200.0 - 80.1

74 FINANCIAL STATEMENTS 2016 – NOTE TO THE ACCOUNTS 27
27. Fair value of financial assets and liabilities
FINANCIAL ASSETS 31 DEC 2016
EUR million Note
Fair value through
profit & loss
Availablefor sale
fin. assetsLoans and
receivables
Derivativesat hedge
accountingAmortised
cost
Totalcarrying amount
Fairvalue
Non-current investments 14 195.9 195.9 195.9
Other non-current financial assets 15 16.3 16.3 16.3
Accounts receivables and other receivables 18 264.8 264.8 264.8
Cash and cash equivalents 19 220.6 220.6 220.6
Derivative financial instruments 27 5.6 5.6 5.6
Total - 195.9 501.8 5.6 703.3 703.3
FINANCIAL LIABILITIES
Non-current interest-bearing financial liabilities 23 469.0 469.0 489.1
Other non-current financial liabilities 24 0.1 0.1 0.1
Current interest-bearing financial liabilities 23 219.1 219.1 220.8
Accounts payable and other financial liabilities 25 303.2 303.2 303.2
Derivative financial instruments 27 6.6 8.0 14.6 14.6
Total 6.6 8.0 991.4 1,006.0 1,027.8
FINANCIAL ASSETS 31 DEC 2015
EUR million Note
Fair value through
profit & loss
Availablefor sale
fin. assetsLoans and
receivables
Derivativesat hedge
accountingAmortised
cost
Totalcarrying amount
Fairvalue
Non-current investments 14 210.2 210.2 210.2
Other non-current financial assets 15 14.6 14.6 14.6
Accounts receivables and other receivables 18 270.7 270.7 270.7
Cash and cash equivalents 19 321.8 321.8 321.8
Derivative financial instruments 27 1.5 -1.4 0.2 0.2
Total 1.5 210.2 607.1 -1.4 817.4 817.4
FINANCIAL LIABILITIES
Non-current interest-bearing financial liabilities 23 611.3 611.3 636.3
Other non-current financial liabilities 24 0.1 0.1 0.1
Current interest-bearing financial liabilities 23 47.6 47.6 49.5
Accounts payable and other financial liabilities 25 355.2 355.2 355.2
Derivative financial instruments 27 -3.1 28.1 25.0 25.0
Total -3.1 28.1 1,014.2 1,039.2 1,066.2
Accounts receivables and other receivables do not include advance payments, accrued tax refunds and employee cost accruals (note 18). Accounts payable and other financial liabilities do not include advance payments, accrued tax expenses and employee cost accruals (note 25).
In Metsä Board Group all interest-bearing liabilities are valued in the balance sheet at amortised cost based on effective interest method. Interest-bearing financial assets have been classified by applying IAS 39 standard. Fair values in the table are based on the present value of cash
flow of each liability or assets calculated by market rate. The discount rates applied are between 0.3–2.3 per cent (2015: 0.6–2.7). Floating rate liabilities accounted for 39 per cent (38) of total interest-bearing liabilities with the rest of the liabilities being fixed rate liabilities. The average interest rate of interest-bearing liabilities at the end of 2016 was 3.3 per cent (2015: 3.8 per cent). The fair values of accounts and other receivables and accounts payables and other liabilities do not essentially deviate from their carrying amounts in the balance sheet.
NOTE TO THE ACCOUNTS 27

NOTE TO THE ACCOUNTS 27 – FINANCIAL STATEMENTS 2016 75
FAIR VALUE HIERARCHY OF FINANCIAL ASSETS AND LIABILITIES 2016
EUR million Note Level 1 Level 2 Level 3 Total
Financial assets at fair value through profit or loss, non-current 14
Available for sale financial assets 14 0.0 195.9 195.9
Financial assets at fair value through profit or loss, current 18
Derivative financial assets 27 5.6 5.6
Derivative financial liabilities 27 14.6 14.6
Financial assets not measured at fair value
Cash and cash equivalent 19 220.6 220.6
Financial liabilities not measured at fair value
Non-current interest-bearing financial liabilities 23 489.1 489.1
Current interest-bearing financial liabilities 23 220.8 220.8
FAIR VALUE HIERARCHY OF FINANCIAL ASSETS AND LIABILITIES 2015
EUR million Note Level 1 Level 2 Level 3 Total
Financial assets at fair value through profit or loss, non-current 14
Available for sale financial assets 14 0.1 210.1 210.2
Financial assets at fair value through profit or loss, current 18
Derivative financial assets 27 0.2 0.2
Derivative financial liabilities 27 24.1 0.9 25.0
Financial assets not measured at fair value
Cash and cash equivalent 19 321.8 321.8
Financial liabilities not measured at fair value
Non-current interest-bearing financial liabilities 23 636.3 636.3
Current interest-bearing financial liabilities 23 49.5 49.5
FINANCIAL ASSETS AND LIABILITIES MEASURED AT FAIR VALUE BASED ON LEVEL 3
EUR million 2016 2015
Opening balance 210.1 232.9
Total gains and losses in profit or loss 0.0 0.6
Total gains and losses in other comprehensive income -14.1 -22.7
Purchases - -
Disposals -0.1 -0.7
Closing balance 195.9 210.1
Finacial assets and liabilities measured at fair value have been catego-rised according to IFRS 7 Paragraph 27 A and 27 B.
Level 1 Fair value is based on quoted prices in active markets.Level 2 Fair value is determined by using valuation techniques that use
observable price information from market.Level 3 Fair value are not based on observable market data, but com-
pany’s own assumptions.
The fair values of electricity, natural gas, propane and gas oil derivatives are determined by using public price quotations in an active market (Level 1).
The fair values of currency forwards and options are determined by using the market prices of the closing date of the reporting period The fair values of interest rate swaps are determined by using the present value of expected payments, discounted using a risk adjusted discount rate, supported by market interest rates and other market data of the closing date of the reporting period (Level 2).
For financial instruments not traded on an open market, the fair value is determined by valuation techniques. Consideration is used when choosing the different techniques and making assumptions, which are mainly based on circumstances prevailing in the markets on each closing date of the reporting period (Level 3).

76 FINANCIAL STATEMENTS 2016 – NOTE TO THE ACCOUNTS 27
DERIVATIVES
NOMINAL VALUE FAIR VALUE
EUR million Assets Liabilities TotalFair Value
HedgesCash Flow
Hedges Equity hedges
Derivatives/Hedge
Accounting not applied
2016
Interest forward agreements
Interest rate options
Interest rate swaps 100.0 1.7 -1.7 -1.7
INTEREST RATE DERIVATIVES 100.0 1.7 -1.7 -1.7
Currency forward agreements 697.7 12.3 -12.3 -6.4 -6.0
Currency option agreements 56.9 0.6 -0.6 -0.6
Currency swap agreements
CURRENCY DERIVATIVES 754.6 13.0 -13.0 -6.4 -6.6
Electricity derivatives 83.1 4.1 4.1 4.1
Pulp derivatives
Oil derivatives 11.1 0.4 0.4 0.4
Other commodity derivatives 3.7 1.0 1.0 1.0
COMMODITY DERIVATIVES 97.9 5.6 5.6 5.6
DERIVATIVES TOTAL 952.5 5.6 14.6 -9.1 -2.5 -6.6
EUR million
2015
Interest forward agreements
Interest rate options
Interest rate swaps 253.4 0.9 -0.9 -4.0 3.1
INTEREST RATE DERIVATIVES 253.4 0.9 -0.9 -4.0 3.1
Currency forward agreements 465.5 0.2 0.2 -1.4 1.5
Currency option agreements 91.8 0.0 0.0 0.0
Currency swap agreements
CURRENCY DERIVATIVES 557.4 0.2 0.2 -1.4 1.5
Electricity derivatives 62.6 16.6 -16.6 -16.6
Pulp derivatives
Oil derivatives 16.7 6.4 -6.4 -6.4
Other commodity derivatives 5.0 1.1 -1.1 -1.1
COMMODITY DERIVATIVES 84.3 24.1 -24.1 -24.1
DERIVATIVES TOTAL 895.1 0.2 25.0 -24.8 -29.4 4.6

NOTES TO THE ACCOUNTS 28–29 – FINANCIAL STATEMENTS 2016 77
29. Contingent liabilities
DISPUTES AND CLAIMS
In May 2014, Metsä Board petitioned the District Court of Helsinki to revoke the judgment issued by the Arbitral Tribunal on 11 February 2014 that orders Metsä Board to pay EUR 19.7 million in damages to UPM Kymmene Corporation. In a judgment issued in June 2015, the District Court rejected Metsä Board’s petition. Metsä Board appealed the decision of the District Court to the Court of Appeal. The Court of Appeal dismissed Metsä Board’s appeal on 21 October 2016. Metsä Board has applied for leave to appeal the matter to the Supreme Court.
Metsä Board companies have been sellers in several share transac-tions in recent years. In these divestments, the companies have issued regular seller’s assurances. Claims presented against Metsä Board companies and costs incurred by the companies due to these assurances cannot be ruled out.
EUR million 2016 2015
FOR OWN LIABILITIES
Liabilities secured by pledges
Pension loans 34.6 43.9
Pledges granted 103.0 91.9
Liabilities secured by floating charges
Other liabilities - 3.0
Floating charges - 3.0
Liabilities secured by mortgages
Pension loans 87.1 110.3
Real estate mortages 232.8 232.8
As security of own commitments
Pledged assets
Guarantees and counter-indemnities 3.9 4.1
Other rent and leasing commitments 12.2 4.4
On behalf of associated companies
Guarantee liabilities 0.1 0.1
On behalf of others
Guarantee liabilities 0.1 0.1
TOTAL
Pledges 103.0 91.9
Floating charges - 3.0
Real estate mortages 232.8 232.8
Guarantees and counter-indemnities 4.1 4.3
Other rent and leasing commitments 12.2 4.4
Total 352.1 336.4
28. Notes to the Consolidated cash flow statement
EUR million 2016 2015
ADJUSTMENTS TO THE RESULT FOR THE PERIOD
Taxes 11.3 29.8
Depreciation, amortisation and impairment charges 102.3 103.5
Share of results from associated companies -45.1 -61.4
Gains and losses on sale of non-current assets -14.4 -23.7
Finance costs, net 30.7 32.0
Provisions -11.5 -13.9
73.4 66.3
CHANGE IN WORKING CAPITAL
Inventories -36.3 11.1
Accounts receivables and other receivables -11.0 27.1
Accounts payable and other liabilities -27.2 34.0
Total -74.5 72.2
DISPOSALS OF SUBSIDIARIES
Metsä Board sold its share (25.0 per cent) in a structured entity Alrec Boiler Oy consolidated as a subsidiary to group accounts in June 2016 to its partner company Rinheat Oy at a price determined in accord-ance with the shareholder and option agreements in force between the parties. Cash balance of the sold company at the time of the sale was EUR 7.6 million. The disposal had a total cash flow effect of EUR -5.5 million, of which EUR -2.7 million was presented in net cash flow from financing activities. A disposal loss affecting comparability of EUR -1.1 million was recognized for the divestment.
In September 2011, Metsä Board divested the 100.0 per cent hold-ing in its Austrian subsidiary M-real Hallein GmbH. The company was paid a EUR 4.4 million earn-out for the sale of subsidiary receivables in connection with the divestment in November 2016. The received earn-out was presented as proceeds from sale of subsidiaries in the consoli-dated statement of cash flows. The earn-out resulted in the reporting of a EUR 4.4 million partial reversal of previously recognised divestment loss as an item affecting comparability.
In May 2015, Metsä Board divested its 100 per cent holding in Metsä Board Zanders GmbH, the subsidiary owning the mill in Gohrsmühle, to a company wholly owned by German mutares AG and to its partner company. Cash balance of the divested company amounted to EUR 35.8 million, including cash equivalent funds in immediately available deposits. The disposal had a cash flow effect of EUR -38.2 million and resulted in a recogniseddivestment gain affect-ing comparability of EUR 17.5 million.
NOTES TO THE ACCOUNTS 28–29

78 FINANCIAL STATEMENTS 2016 – NOTE TO THE ACCOUNTS 30
Commitments include granted pledges, mortgages and floating charges as well as guarantees. Pledges granted are shares in associate company (Metsä Fibre).
OTHER RENT AND LEASE COMMITMENTS
Metsä Board rents various offices and warehouses under non-cancella-ble operating lease agreements as defined in IAS 17. Additionally, some lease contracts entered into by the Group are not finance lease contracts by nature. Some contracts are renewable at the end of the lease period.
EUR million 2016 2015
Operating leases
Not later than one year 4.0 2.3
Later than one year and not later than five years 7.4 1.9
Later than five years 0.7 0.2
Total 12.2 4.4
COMMITMENTS RELATED TO PROPERTY, PLANT AND EQUIPMENT
EUR million 2016 2015
Payments due in following 12 months 11.2 30.7
Payments due later - 5.9
Total 11.2 36.6
30. Share based payment
SHARE INCENTIVE SCHEMES
During the review period, Metsä Board had two active share-based incentive schemes: Share incentive scheme 2011, which company Board of Directors decided to adopt on 15 December 2010, and Share incen-tive scheme 2014, which company Board of Directors decided to adopt on 6 February 2014 as part of company’s incentive and key personnel commitment programme.
In 2016, EUR 781,236 was recognized as expense in the income statement related to the share-based incentive schemes.
SHARE INCENTIVE SCHEME 2011
The scheme offers the participants the possibility to be awarded Metsä Board Corporation’s B shares for achieving set goals for three incentive periods. Incentive periods are the calendar years 2011–2013, 2012–2014 and 2013–2015. The bonus awarded under the share incentive scheme is determined by achievement of the set goals; by the end of April following the incentive period. In addition to shares, the bonus includes a cash portion, which is used to cover taxes and tax-like charges incurred by plan participants due to the bonus. The bonus is not paid, if the employee’s contract with the company ends before the end of the incentive period. In addition, the awarded person must continue to own the shares for at least two years following the end of the vesting period.
Based on the realisation of the criteria of the share incentive scheme 2013–2015, a total of 154,326 Metsä Board Corporation B shares and a cash portion were paid in order to cover the taxes and tax-like charges incurred from the bonus at the time of the share transfer. As a result of the Metsä Board share rights issue carried out in 2015, the share alloca-tions of 2013–2015 were increased to correspond with shareholders’ position at the time of the issue.
NOTE TO THE ACCOUNTS 30

NOTE TO THE ACCOUNTS 30 – FINANCIAL STATEMENTS 2016 79
31 Dec 2016 Share incentive scheme 2011 Share incentive scheme 2014
Maximum number of shares 525,000 1,121,250
Criteria Equity ratio, ROCE, EBIT Equity ratio, ROCE, EBIT
Personnel (31.12.2016) 9 7–17
FAIR VALUE MEASURING 1)
Fair value of share at grant date, EUR 2.55 2.90–5.12
Fair value at end of financial period, EUR 0 6,628,408
EFFECT ON RESULT AND FINANCIAL POSITION
Expense for 2016, share based payment, EUR -43,194 824,429
Expense for 2016, share based payment, settled as equity, EUR 48,252 321,203
Liability at the end of period, EUR 0 1,914,189
Number of shares 1 Jan 2016 2)
Outstanding at the beginning of period 603,333 398,334
Changes during the period
Shares granted 0 291,249
Shares forfeited 11,588 115,200
Shares exercised 154,326 0
Shares expired 156,819 0
Number of shares 31 Dec 2016
Outstanding at the end of the period 0 975,159
1) The fair value of the share-settled part at grant date was the market price of Metsä Board Corporation’s B-share less any dividend estimated by analyst consensus to be paid before the payment of the incentive. Furthermore, possible rights issues are taken into account in line with applicable rights issue factor. The fair value of the cash-settled part changes at every reporting date following changes in share closing price until the end of incentive period. The fair value of share-based payment is recognised to the amount based on best possible estimate of the incentive, which it is believed the scheme participants will earn during the vesting period.2) The amounts in the table reflect net amounts, i.e. the number of shares to be given based on share-based payment. In addition, the payment includes a cash part used to cover taxes and tax-like charges.
SHARE INCENTIVE SCHEME 2014
The scheme offers the participants the possibility to be awarded Metsä Board Corporation’s B shares for achieving set goals for three incentive periods of three years each. Incentive periods are the calendar years 2014–2016, 2015–2017 and 2016–2018. The bonus awarded under the share incentive scheme is determined by achievement of the set goals by the end of April following the incentive period. In addition to shares, the bonus includes a cash portion, which is used to cover taxes and tax-like charges incurred by plan participants due to the bonus. The bonus is not paid, if the employee’s contract with the company ends before the end of the incentive period. In addition, the awarded person must continue to own the shares for at least two years following the end of the vesting period. If the employment of a plan participant ends during the incentive period, the participant should, as a rule, return the transferred shares to the company without consideration.
As a result of Metsä Board rights issue carried out in 2015, the share allocations of Share incentive scheme 2014 were increased to cor-respond with shareholders’ position at the time of the issue. The rights issue has been taken into account in share incentives granted during the financial period.
The company changed the terms of Share incentive scheme 2014 during 2016 so that for incentive periods 2014–2016 and 2015–2017 a cap was set for total employee compensation, including the share incen-tive paid, based on each plan participant’s salary. The part of earned incentive exceeding the cap is deferred and paid in full in cash in com-ing years when allowed by the cap. For incentive period 2016–2018, a salary based cap was set with the effect of cutting the part of share incentive exceeding the cap and resulting in the forfeiture of the excess part of the incentive.

80 FINANCIAL STATEMENTS 2016 – NOTE TO THE ACCOUNTS 31
31. Related party transactions
Related parties include Metsä Board’s ultimate parent company Metsäliitto Cooperative, which owns 41.9 per cent of Metsä Board’s shares and 61.6 per cent of the voting rights (including shares owned by Metsäliitto Employees’ Pension Foundation), other subsidiaries of Metsäliitto, associated companies and joint ventures as well as Metsäliitto Employees’ Pension Foundation. The members of the Board of Directors, Metsä Group’s Executive Management Team and Metsä Board’s Corporate Management Team as well as their close fam-ily members are also included in related parties.
The most significant subsidiaries of Metsäliitto, with which Metsä Board has business transactions, are as follows:Metsä Tissue GroupMetsä Fibre GroupMetsä Forest Sverige Ab
Metsä Fibre has been consolidated by using equity method according to Investments in associates standard (IAS 28). Related party transactions with Metsä Fibre are presented as transactions with sister companies.
Financial operations of the Group have been centralised to Metsä Group Treasury Oy, which is a wholly-owned subsidiary of Metsäliitto Cooperative and in charge of managing the Group companies’ financial positions according to the strategy and financial policy, providing nec-essary financial services and acting as a competence center in financial matters. Financial transactions with Metsä Group Treasury Oy are carried out at market prices.
The value of wood purchases from Metsäliitto Cooperative was EUR 105.5 million (2015: 105.6) and pulp purchases from Metsä Fibre Oy EUR 305.7 million (398.5). The purchases were carried out at market prices.
Metsä Board is participating in supplementary pension arrangement related to executive management of Metsä Group. Payments to arrange-ment amounted to EUR 0.3 million in 2016 (0.2).
Metsäliitto Employees’ Pension Foundation is a separate legal entity granting defined supplementary pension benefits to part of Metsä Board officials and manages foundation’s assets. The foundation owns about 0.1 per cent of Metsä Board Corporation. Furthermore, the foundation has invested EUR 0.2 million in Metsäliitto Cooperative’s participations. Metsä Board did not pay any contributions to the foun-dation in 2016 and 2015. The employer loans granted by the founda-tion to Metsä Board amounted to EUR 5.9 million (5.9) in 2016.
EUR millionTransactions with
parent companyTransactions withsister companies
2016 2015 2016 2015
Sales 11.2 10.4 57.3 64.4
Other operating income 3.0 3.6 10.6 1.8
Purchases 105.5 105.6 492.4 594.7
Share of result from associated companies - - 45.0 61.3
Dividend income 0.0 0.0 32.9 24.9
Interest income - 0.0 0.1 0.2
Interest expenses 0.1 0.1 2.7 2.4
Receivables
Accounts receivables and other receivables 2.2 1.7 19.3 12.2
Cash and cash equivalents - - 215.5 311.3
Liabilities
Accounts payable and other liabilities 10.7 12.1 120.5 60.8
TRANSACTION AND BALANCES WITH ASSOCIATED COMPANIES AND JOINT VENTURES
EUR million 2016 2015
Sales 0.7 0.6
Purchases 6.1 7.4
Interest income 0.0 0.0
Receivables
Other non-current financial assets 0.3 0.3
Accounts receivables and other receivables 0.3 0.2
Liabilities
Accounts payable and other liabilities 1.2 1.5
Metsä Board has classified interest-bearing receivables comparable to cash funds and available immediately from Metsä Group’s internal bank Metsä Group Treasury Oy as Cash and cash equivalents.
The receivables from group companies do not include doubtful receivables, and no bad debt was recognised during the period. No security has been given for group liabilities.
Key management includes members of the Board as well as Corporate Management Team.
REMUNERATION PAID TO THE KEY MANAGEMENT
EUR 2016 2015
Salaries and other remuneration 4,330,918.51 3,262,557.99
Pension costs 808,878.85 712,061.80
Total 5,139,797.36 3,974,619.79
NOTE TO THE ACCOUNTS 31
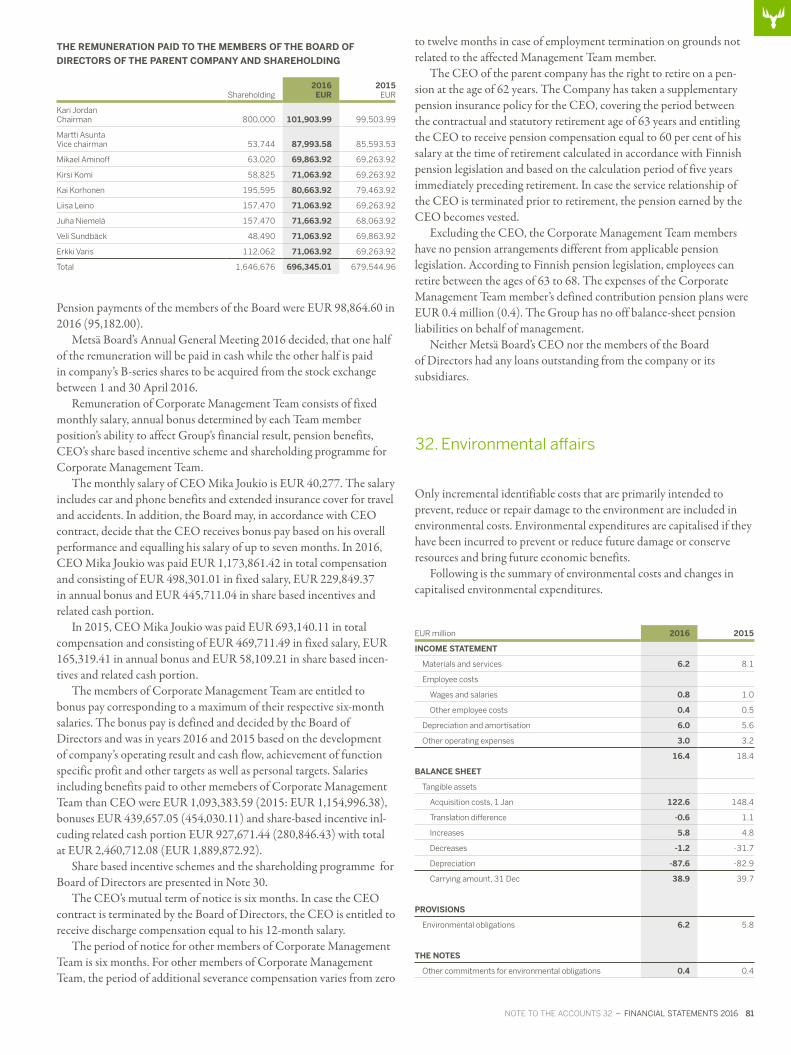
NOTE TO THE ACCOUNTS 32 – FINANCIAL STATEMENTS 2016 81
THE REMUNERATION PAID TO THE MEMBERS OF THE BOARD OF
DIRECTORS OF THE PARENT COMPANY AND SHAREHOLDING
Shareholding2016EUR
2015EUR
Kari Jordan Chairman 800,000 101,903.99 99,503.99
Martti Asunta Vice chairman 53,744 87,993.58 85,593.53
Mikael Aminoff 63,020 69,863.92 69,263.92
Kirsi Komi 58,825 71,063.92 69,263.92
Kai Korhonen 195,595 80,663.92 79,463.92
Liisa Leino 157,470 71,063.92 69,263.92
Juha Niemelä 157,470 71,663.92 68,063.92
Veli Sundbäck 48,490 71,063.92 69,863.92
Erkki Varis 112,062 71,063.92 69,263.92
Total 1,646,676 696,345.01 679,544.96
Pension payments of the members of the Board were EUR 98,864.60 in 2016 (95,182.00). Metsä Board’s Annual General Meeting 2016 decided, that one half of the remuneration will be paid in cash while the other half is paid in company’s B-series shares to be acquired from the stock exchange between 1 and 30 April 2016. Remuneration of Corporate Management Team consists of fixed monthly salary, annual bonus determined by each Team member position’s ability to affect Group’s financial result, pension benefits, CEO’s share based incentive scheme and shareholding programme for Corporate Management Team.
The monthly salary of CEO Mika Joukio is EUR 40,277. The salary includes car and phone benefits and extended insurance cover for travel and accidents. In addition, the Board may, in accordance with CEO contract, decide that the CEO receives bonus pay based on his overall performance and equalling his salary of up to seven months. In 2016, CEO Mika Joukio was paid EUR 1,173,861.42 in total compensation and consisting of EUR 498,301.01 in fixed salary, EUR 229,849.37 in annual bonus and EUR 445,711.04 in share based incentives and related cash portion.
In 2015, CEO Mika Joukio was paid EUR 693,140.11 in total compensation and consisting of EUR 469,711.49 in fixed salary, EUR 165,319.41 in annual bonus and EUR 58,109.21 in share based incen-tives and related cash portion.
The members of Corporate Management Team are entitled to bonus pay corresponding to a maximum of their respective six-month salaries. The bonus pay is defined and decided by the Board of Directors and was in years 2016 and 2015 based on the development of company’s operating result and cash flow, achievement of function specific profit and other targets as well as personal targets. Salaries including benefits paid to other memebers of Corporate Management Team than CEO were EUR 1,093,383.59 (2015: EUR 1,154,996.38), bonuses EUR 439,657.05 (454,030.11) and share-based incentive inl-cuding related cash portion EUR 927,671.44 (280,846.43) with total at EUR 2,460,712.08 (EUR 1,889,872.92).
Share based incentive schemes and the shareholding programme for Board of Directors are presented in Note 30.
The CEO’s mutual term of notice is six months. In case the CEO contract is terminated by the Board of Directors, the CEO is entitled to receive discharge compensation equal to his 12-month salary.
The period of notice for other members of Corporate Management Team is six months. For other members of Corporate Management Team, the period of additional severance compensation varies from zero
to twelve months in case of employment termination on grounds not related to the affected Management Team member.
The CEO of the parent company has the right to retire on a pen-sion at the age of 62 years. The Company has taken a supplementary pension insurance policy for the CEO, covering the period between the contractual and statutory retirement age of 63 years and entitling the CEO to receive pension compensation equal to 60 per cent of his salary at the time of retirement calculated in accordance with Finnish pension legislation and based on the calculation period of five years immediately preceding retirement. In case the service relationship of the CEO is terminated prior to retirement, the pension earned by the CEO becomes vested.
Excluding the CEO, the Corporate Management Team members have no pension arrangements different from applicable pension legislation. According to Finnish pension legislation, employees can retire between the ages of 63 to 68. The expenses of the Corporate Management Team member’s defined contribution pension plans were EUR 0.4 million (0.4). The Group has no off balance-sheet pension liabilities on behalf of management.
Neither Metsä Board’s CEO nor the members of the Board of Directors had any loans outstanding from the company or its subsidiares.
32. Environmental affairs
Only incremental identifiable costs that are primarily intended to prevent, reduce or repair damage to the environment are included in environmental costs. Environmental expenditures are capitalised if they have been incurred to prevent or reduce future damage or conserve resources and bring future economic benefits.
Following is the summary of environmental costs and changes in capitalised environmental expenditures.
EUR million 2016 2015
INCOME STATEMENT
Materials and services 6.2 8.1
Employee costs
Wages and salaries 0.8 1.0
Other employee costs 0.4 0.5
Depreciation and amortisation 6.0 5.6
Other operating expenses 3.0 3.2
16.4 18.4
BALANCE SHEET
Tangible assets
Acquisition costs, 1 Jan 122.6 148.4
Translation difference -0.6 1.1
Increases 5.8 4.8
Decreases -1.2 -31.7
Depreciation -87.6 -82.9
Carrying amount, 31 Dec 38.9 39.7
PROVISIONS
Environmental obligations 6.2 5.8
THE NOTES
Other commitments for environmental obligations 0.4 0.4
NOTE TO THE ACCOUNTS 32

82 FINANCIAL STATEMENTS 2016 – NOTES TO THE ACCOUNTS 33–34
EMISSION ALLOWANCES
Metsä Board Group participates in the European Union Emissions Trading System. In 2016, the Group received 677,000 tonnes of emission allowances free of charge. On the balance sheet date, the company had 421,000 tonnes of emission allowances. Actual emissions during the financial period were 279,000 tonnes.
The Group has recognised the emission allowances in accordance with the net method. The difference between the emissions and the emission allowances received has been recognised through income statement if the actual emissions have exceeded the allowances received. Actual emission during the period did not have any effect on income statement or on balance sheet.
In 2016, the Group sold emission allowances worth of EUR 2.6 mil-lion. On the balance sheet date, the fair value of an emission right was EUR 6.54 per ton and total value of owned rights approximately EUR 2.8 million.
33. Comparable key figures
New European Securities and Markets Authority (ESMA) guidelines on Alternative Performance Measures are effective for the financial year 2016. From Q3 2016 Metsä Board has relabeled the previously refer-enced “excluding non-recurring items” non-IFRS financial measures with “comparable” performance measures. Exceptional and material items outside the ordinary course of business have been eliminated from the comparable operating result. The change in terminology does not affect the definition of items affecting comparability and therefore no restatement of historical data is necessary.
Reconciliation of operating result under IFRS and comparable operating result is presented below. Comparable return on capital employed has been calculated using the same adjustments as the com-parable operating result, and it has been further adjusted with financial items affecting comparability when applicable. Metsä Board considers that key figures derived in this manner improve comparability between reporting periods.
None of these key figures with items affecting comparability eliminated are key figures used in IFRS reporting, and they cannot be compared with other companies’ key figures identified with the same names. Typical items affecting comparability include material gains and losses on disposals of assets, impairments and impairment reversals in accordance with IAS 36 Impairment of Assets, restructuring costs and their adjustments as well as items arising from legal proceedings.
EUR million 2016 2015
OPERATING RESULT (IFRS) 132.3 199.0
Items affecting comparability
Gains and losses on disposal in other operating income and expenses -9.8 -17.5
Employee costs 5.2 0.3
Share of result of associated company -1.8 -
Impairment charges and reversals of impairments 8.7 0.1
Other operating expenses 2.8 -2.0
Total 5.2 -19.2
COMPARABLE OPERATING RESULT 137.5 179.9
"+" sign items = expense affecting comparability
"-" sign items = income affecting comparability
NOTES TO THE ACCOUNTS 33–34
Comparable operating result for the reporting period includes a net disposal gain of EUR 9.8 million. Among other things, it consists of disposals of assets related to wallpaper base business and the sale of Alrec Boiler Oy, a structured entity previously owning the combustion facility in operation at Kaskinen pulp mill and consolidated to group accounts as a subsidiary. Furthermore, the net gain includes an earn-out received from the sale of subsidiary receivables in connection with a subsidiary disposal carried out in 2011 and treated as a reversal of previ-ously recognized disposal loss.
As a result of the transactions concerning Alrec Boiler Oy, Metsä Board Corporation has become the direct owner of the combustion facility at Kaskinen while selling its shares in Alrec Boiler Oy to its partner company in accordance with the shareholder agreement between the parties.
Employee costs of EUR 5.2 million affecting comparability consist of restructuring costs arising from Simpele mill, Belgian sales office and Kyro board and paper mills. Furthermore, a disposal gain of EUR 1.8 million realized by associated company Metsä Fibre has been deducted from operating result as an item affecting comparability. Impairment charges of EUR 8.7 million affecting comparability arise from the remaining carrying values of tangible assets related to the discontinued wallpaper base production at Kyro mill and the closed Belgian sales office while other operating expenses of EUR 2.8 million mainly comprise other expenses arising from wallpaper production discontin-uation and the related expense of writing wallpaper base inventories down to their net realizable value.
Items affecting comparability in comparison year 2015 amounted to a positive net effect of EUR 19.2 million including the disposal gain of Gohrsmühle mill in Germany amounting to EUR 17.5 million. The result improving reversal of unused provisions valued at EUR 2.6 million originally recognized for closure of the Alizay mill in France was reported in other operating expenses. Furthermore, an impairment reversal of a sold paper machine in Simpele mill amounting to EUR 0.3 million was recognized in comparison year together with a EUR 0.4 million impairment of goodwill related to a closed sales company. Other items affecting comparability reported in year 2015 consisted mostly of closure costs of EUR 0.5 million incurred in closing a sales company located in United Kingdom.
34. Events after the Balance sheet date
The company is not aware of any material events after the Balance sheet date.

SHARES AND SHAREHOLDERS – FINANCIAL STATEMENTS 2016 83
SHARES AND SHAREHOLDERS
METSÄ BOARD’S SHARES
Metsä Board’s shares are listed on the Nasdaq Helsinki. On 31 December 2016, the com-pany’s share capital was EUR 557,881,540.40.
Metsä Board has two series of shares. There are 35,895,651 A shares and 319,617,095 B shares.
Each series A share entitles its holder to twenty (20) votes at a General Meeting of Shareholders, and each series B share entitles the holder to one (1) vote. All shares carry the same right to receive a dividend. Metsä Board’s A shares can be converted to B shares if a shareholder or a representative of the nominee registered shares makes a written request for the conversion to the company.
In addition to the Nasdaq Helsinki, Metsä Board’s shares are traded on other market-places, such as Chi-X and BATS. In 2016, approximately 73 million of Metsä Board B shares were traded on other marketplaces; this amount accounts for roughly 30 per cent of all shares traded. Of the other marketplaces, Metsä Board’s shares were traded particularly on Chi-X. (Source: Euroland) SHARE PRICE DEVELOPMENT 2016
METSÄ BOARD A METSÄ BOARD B
OMX HELSINKI PORTFOLIO INDEX TURNOVER
0.60
0.50
0.40
0.30
0.20
0.10
-0
80
60
40
20
0
3.0
2.5
2.0
1.5
1.0
0.5
0
SHAREHOLDER’S EQUITY PER SHAREEUR
DIVIDEND/PROFIT%
EARNINGS PER SHAREEUR
12 13 14 15 16 1)12 13 14 15 16
12 13 14 15 16 31 842 95 106 117 12
BASIC INFORMATION ON METSÄ BOARD’S SHARES
Metsä Board's A share Metsä Board's B share
Listing Nasdaq Helsinki Nasdaq Helsinki
Date of listing 2 January 1987 2 January 1987
Market cap segment Large Cap Large Cap
Ticker symbol METSA METSB
ISIN code FI0009000640 FI0009000665
Reuters code METSA.HE METSB.HE
Bloomberg code METSA FH METSB FH
Number of shares 35,895,651 319,617,095
TRADING ON THE NASDAQ HELSINKI IN 2016 (2015)
Metsä Board's A share Metsä Board's B share
Closing price on 31 December, EUR 6.75 (6.75) 6.80 (6.86)
Lowest price, EUR 4.80 (4.47) 4.23 (4.47)
Highest price, EUR 6.93 (7.67) 7.15 (7.01)
Average price, EUR 5.85 (5.98) 5.34 (5.72)
Average daily trading volume, no. of shares 3,070 (4,739) 734,042 (438,203)
Total trading volume, no. of shares 776,677 (1,189,370) 185,712,500 (109,988,836)
- % of total no. of shares 2 (3) 58 (34)
Market value, EUR million 242 (242) 2,173 (2,193)
0.21 3.5
0.18 3.0
0.15 2.5
0.12 2.0
0.09 1.5
0.06 1.0
0.03 0.5
0 0
8.00 4.0
7.00 3.0
6.00 2.0
5.00 1.0
4.00 0
12 13 14 15 16 2)
Euros Million shares
DIVIDENDEUR %
DIVIDEND YIELD, % 1)
1) Calculated from the closing price of B share on 31 Dec 20162) Board’s proposal to the Annual General Meeting
1) Board’s proposal to the Annual General Meeting
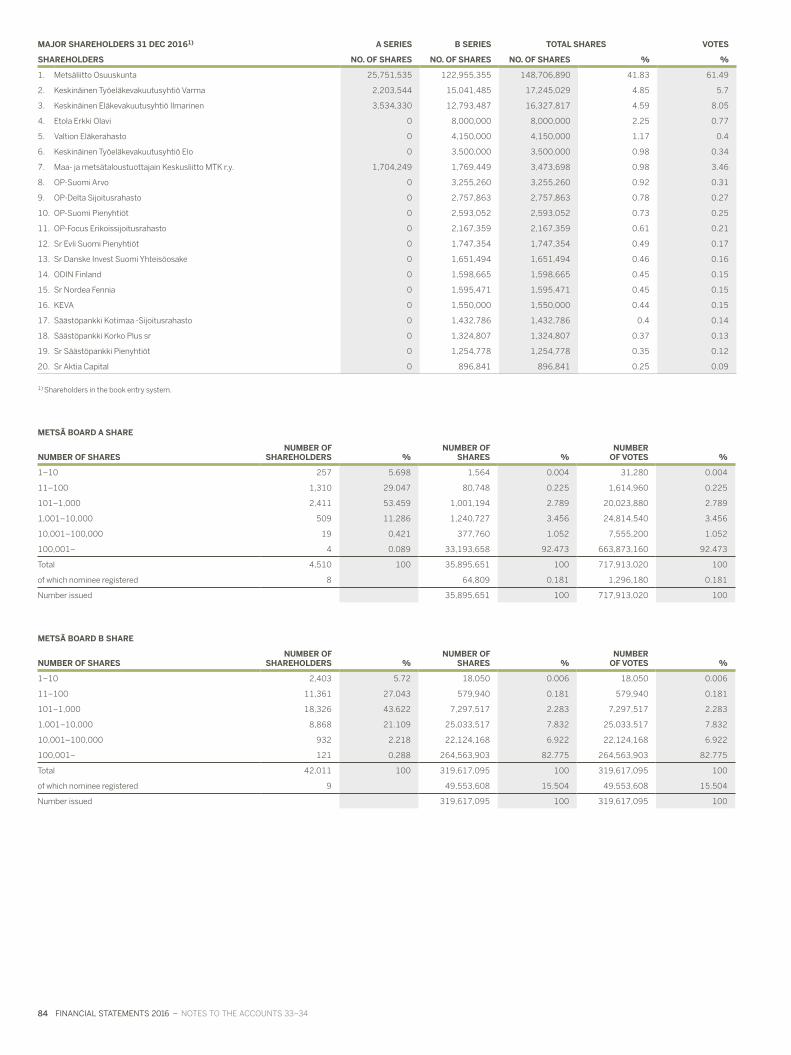
84 FINANCIAL STATEMENTS 2016 – NOTES TO THE ACCOUNTS 33–34
MAJOR SHAREHOLDERS 31 DEC 20161) A SERIES B SERIES TOTAL SHARES VOTES
SHAREHOLDERS NO. OF SHARES NO. OF SHARES NO. OF SHARES % %
1. Metsäliitto Osuuskunta 25,751,535 122,955,355 148,706,890 41.83 61.49
2. Keskinäinen Työeläkevakuutusyhtiö Varma 2,203,544 15,041,485 17,245,029 4.85 5.7
3. Keskinäinen Eläkevakuutusyhtiö Ilmarinen 3,534,330 12,793,487 16,327,817 4.59 8.05
4. Etola Erkki Olavi 0 8,000,000 8,000,000 2.25 0.77
5. Valtion Eläkerahasto 0 4,150,000 4,150,000 1.17 0.4
6. Keskinäinen Työeläkevakuutusyhtiö Elo 0 3,500,000 3,500,000 0.98 0.34
7. Maa- ja metsätaloustuottajain Keskusliitto MTK r.y. 1,704,249 1,769,449 3,473,698 0.98 3.46
8. OP-Suomi Arvo 0 3,255,260 3,255,260 0.92 0.31
9. OP-Delta Sijoitusrahasto 0 2,757,863 2,757,863 0.78 0.27
10. OP-Suomi Pienyhtiöt 0 2,593,052 2,593,052 0.73 0.25
11. OP-Focus Erikoissijoitusrahasto 0 2,167,359 2,167,359 0.61 0.21
12. Sr Evli Suomi Pienyhtiöt 0 1,747,354 1,747,354 0.49 0.17
13. Sr Danske Invest Suomi Yhteisöosake 0 1,651,494 1,651,494 0.46 0.16
14. ODIN Finland 0 1,598,665 1,598,665 0.45 0.15
15. Sr Nordea Fennia 0 1,595,471 1,595,471 0.45 0.15
16. KEVA 0 1,550,000 1,550,000 0.44 0.15
17. Säästöpankki Kotimaa -Sijoitusrahasto 0 1,432,786 1,432,786 0.4 0.14
18. Säästöpankki Korko Plus sr 0 1,324,807 1,324,807 0.37 0.13
19. Sr Säästöpankki Pienyhtiöt 0 1,254,778 1,254,778 0.35 0.12
20. Sr Aktia Capital 0 896,841 896,841 0.25 0.09
1) Shareholders in the book entry system.
METSÄ BOARD A SHARE
NUMBER OF SHARESNUMBER OF
SHAREHOLDERS %NUMBER OF
SHARES %NUMBER
OF VOTES %
1–10 257 5.698 1,564 0.004 31,280 0.004
11–100 1,310 29.047 80,748 0.225 1,614,960 0.225
101–1,000 2,411 53.459 1,001,194 2.789 20,023,880 2.789
1,001–10,000 509 11.286 1,240,727 3.456 24,814,540 3.456
10,001–100,000 19 0.421 377,760 1.052 7,555,200 1.052
100,001– 4 0.089 33,193,658 92.473 663,873,160 92.473
Total 4,510 100 35,895,651 100 717,913,020 100
of which nominee registered 8 64,809 0.181 1,296,180 0.181
Number issued 35,895,651 100 717,913,020 100
METSÄ BOARD B SHARE
NUMBER OF SHARESNUMBER OF
SHAREHOLDERS %NUMBER OF
SHARES %NUMBER
OF VOTES %
1–10 2,403 5.72 18,050 0.006 18,050 0.006
11–100 11,361 27.043 579,940 0.181 579,940 0.181
101–1,000 18,326 43.622 7,297,517 2.283 7,297,517 2.283
1,001–10,000 8,868 21.109 25,033,517 7.832 25,033,517 7.832
10,001–100,000 932 2.218 22,124,168 6.922 22,124,168 6.922
100,001– 121 0.288 264,563,903 82.775 264,563,903 82.775
Total 42,011 100 319,617,095 100 319,617,095 100
of which nominee registered 9 49,553,608 15.504 49,553,608 15.504
Number issued 319,617,095 100 319,617,095 100

NOTES TO THE ACCOUNTS 33–34 – FINANCIAL STATEMENTS 2016 85
SPLIT OF SHAREHOLDINGS%
SPLIT OF VOTING RIGHTS%
Metsäliitto Cooperative ...............................................................41.8 Nominee registered and foreign owners ..................................14.8 Finnish institutions, companies and organisations................25.6 Finnish households ....................................................................... 17.8
Metsäliitto Cooperative ...............................................................61.5 Nominee registered and foreign owners .................................... 5.3 Finnish institutions, companies and organisations................22.9 Finnish households .......................................................................10.3
SHAREHOLDINGS OF THE MEMBERS OF THE BOARD OF DIRECTORS AND CEO ON 31 DECEMBER 2016
Holding Related party shareholdings
Kari Jordan Chairman of the Board of Directors 800,000 -
Martti Asunta Deputy Chairman of the Board of Directors 53,744 8,450
Mikael Aminoff Member of the Board of Directors 63,020 -
Kirsi Komi Member of the Board of Directors 58,825 -
Kai Korhonen Member of the Board of Directors 195,595 37,657
Liisa Leino Member of the Board of Directors 157,470 -
Juha Niemelä Member of the Board of Directors 157,470 -
Veli Sundbäck Member of the Board of Directors 48,490 -
Erkki Varis Member of the Board of Directors 112,062 -
Mika Joukio CEO 186,348 43,976
The shareholdings of other members of Metsä Board’s Corporate Management Team are presented on pages 114–115.
SPLIT OF SHAREHOLDINGS AND VOTING RIGHTS PER GROUP, 31 DECEMBER 2016
CHANGES IN SHARE CAPITAL AND NUMBER OF SHARES 1 JAN 2004–31 DEC 2016
Number of shares Share capital, EUR million
2003 Share capital 31 Dec 2003 178,999,425 304.3
2004 Rights issue 148,633,415 252.7
Rights issue 532,772 0.9
Share capital 31 Dec 2004 328,165,612 557.9
2005–2014 No changes
2015 Rights issue, no changes to share capital 27,347,134 -
Share capital 31 Dec 2015 355,512,746 557.9
2016 No changes
2016 Share capital 31 Dec 2016 355,512,746 557.9
SHAREHOLDERS
At the end of 2016, Metsä Board had 4,510 (4,204) registered shareholders of A shares and 42,011 of B shares (39,969).
At the end of 2016, Metsäliitto Cooperative owned 42 per cent of the shares, and the voting rights conferred by these shares totalled 61 per cent. Foreign and nominee-registered investors held 15 (20) per cent of the shares. The company does not hold any treasury shares.
IMPACT OF CHANGE IN CONTROL
Some of Metsä Board’s shareholder agree-ments concerning resource and associated companies include provisions under which Metsä Board must offer its shares in an associ-ated company for sale to the other sharehold-ers in the case of a change of control of Metsä Board. Of these agreements, pursuant to the shareholders agreement of Metsä Fibre Oy, Metsä Fibre’s shareholders should offer their shares for sale to the other shareholders in the case of a change of control. A decrease in the voting rights of Metsäliitto Cooperative in Metsä Board to below 50 per cent would not, however, obligate Metsä Board to offer its shares in Metsä Fibre Oy for sale.
BOARD OF DIRECTORS’ AUTHORITY
TO ISSUE SHARES
The Board of Directors is authorised to decide on the issuance of new shares or special rights entitling to shares, as specified in Chapter 10, section 1 of the Limited Liability Companies Act. By virtue of the authorisation, the Board is entitled to issue up to 70,000,000 new B-series shares. Correspondingly, the Board is entitled to issue special rights entitling to such shares such that the maximum number of new B shares to be issued directly or pursuant to the special rights does not exceed 70,000,000. The special rights entitle their holders to receive the company’s new shares against the monetary payment of a subscription price or by setting off a receivable against the subscription price (“Convertible Bond”). The new shares may be issued against a payment or without payment. The authorisation is effective until 28 March 2017. In the spring of 2015, the Board of Directors decided to issue a total of 27,347,134 B-series shares. Thus, 42,652,866 B-series shares remained unissued on 31 December 2016.
DIVIDEND POLICY
Metsä Board’s objective is to pay a dividend equal-ling at least one third of the earnings per share. The Board of Directors proposes to the Annual General Meeting to be held on 23 March 2017 that a dividend of EUR 0.19 per share, equalling 76 per cent of the earnings per share, be paid for the 2016 financial period.

86 FINANCIAL STATEMENTS 2016 – NOTES TO THE ACCOUNTS 33–34
SHARE PERFORMANCE
2016 2015 2014 2013 2012
Share prices, EUR
A share high 6.93 7.67 4.61 3.10 2.76
low 4.80 4.47 2.86 2.13 1.47
at year end 6.75 6.75 4.44 2.99 2.14
average 5.85 5.98 3.39 2.51 2.27
B share high 7.15 7.01 4.43 3.06 2.40
low 4.23 4.47 2.83 2.12 1.29
at year end 6.80 6.86 4.34 3.06 2.15
average 5.34 5.72 3.34 2.50 1.94
Trading in shares, units of Nasdaq Helsinki
A share 776,677 1,189,370 1,136,611 713,546 992,596
% of total no. of A shares 2.2 3.3 3.2 2.0 2.7
B share 185,712,500 109,988,836 59,119,118 52,692,081 110,668,983
% of total average no. of B shares 58.1 35.1 20.2 18.0 37.9
Number of shares at the year end
A share 35,895,651 35,895,651 35,985,651 35,985,651 36,339,550
B share 319,617,095 319,617,095 292,179,961 292,179,961 291,826,062
Total 355,512,746 355,512,746 328,165,612 328,165,612 328,165,612
Adjusted number of shares at year end 355,512,746 355,512,746 338,216,496 338,216,496 338,216,496
Market capitalisation of shares at year end, EUR million 2,415.7 2,434.9 1,471.6 1,031.2 728.2
Number of shareholders1) 42,011 42,050 40,235 40,390 41,232
1) Shareholders in the book entry system. Does not include nominee registered shareholders.
FIGURES PER SHARE
EUR million 2016 2015 2014 2013 2012
Calculation of earnings per share
Result before tax 101.6 167.1 77.6 57.8 173.9
- non-controlling interest 0.0 0.0 0.0 -0.2 -0.2
- income taxes -11.3 -29.8 -9.1 6.3 -2.6
= Earnings 90.4 68,5 63,9 171,1 -273,2
Adjusted number of shares (average) 355,512,746 349,503,922 338,216,496 338,216,496 338,216,496
Earnings per share, basic and diluted, EUR 0.25 0.39 0.20 0.19 0.51
Shareholders’ equity per share, EUR 2.96 2.89 2.49 2.51 2.52
Shareholders’ equity per share, EUR 2.96 2.89 2.49 2.51 2.52
Dividend per share, EUR 0.191) 0.17 0.12 0.09 0.06
Payout ratio, % 76.0 43.6 57.1 47.4 11.5
Nominal value per share, EUR - - - - -
Dividend yield, % of closing price
Series A 2.81) 2.5 2.6 2.9 2.7
Series B 2.81) 2.5 2.7 2.9 2.7
Price/earning ratio (P/E ratio)
Series A 27.0 17.3 21.9 16.2 4.3
Series B 27.2 17.6 21.3 16.6 4.3
P/BV , %
Series A 228.0 233.6 179.7 118.9 85.3
Series B 229.7 237.4 174.6 121.6 85.7
1) Board of Directors proposes that a dividend of EUR 0.19 per share is paid for 2016.

CALCULATION OF KEY RATIOS – FINANCIAL STATEMENTS 2016 87
CALCULATION OF KEY RATIOS
PROFITABILITY
Return on equity (%) =Profit from continuing operations before tax - direct taxes
Shareholders’ equity (average)
Return on capital employed (%) =Profit from continuing operations before tax + interest expenses, net exchange gains/losses and other financial expenses
Total equity + interest-bearing borrowings (average)
FINANCIAL POSITION
Equity ratio (%) =Shareholders’ equity
Total assets - advance payments received
Gearing ratio (%) =Interest-bearing borrowings
Shareholders’ equity
Net gearing ratio (%) =Interest-bearing borrowings - liquid funds - interest-bearing receivables
Shareholders’ equity
SHARE PERFORMANCE INDICATORS
Earnings per share =Profit attributable to shareholders of parent company
Adjusted number of shares (average)
Shareholders’ equity per share =Equity attributable to shareholders of parent company
Adjusted number of shares at 31 December
Dividend per share =Dividends
Adjusted number of shares at 31 December
Payout ratio (%) =Dividend per share
Earnings per share
Dividend yield (%) =Dividend per share
Share price at 31 December
Price/earnings ratio (P/E ratio) (%) =Adjusted share price at 31 December
Earnings per share
P/BV (%) =Adjusted share price at 31 December
Shareholders' equity per share
Adjusted average share price =Total traded volume per share (EUR)
Average adjusted number of shares traded during the financial year
Market capitalisation = Number of shares x market price at 31 December
OTHER KEY FIGURES
Internal financing of capital expenditure (%) =Net cash flow arising from operating activities
Gross capital expenditure
Interest cover =Net cash flow arising from operating activities + net interest expenses
Net interest expenses
Net cash flow arising from operating activities = Net cash flow arising from operating activities in the cash flow statement

88 FINANCIAL STATEMENTS 2016 – PARENT COMPANY ACCOUNTS
EUR million Note 1 JAN – 31 DEC 2016 1 JAN – 31 DEC 2015
SALES 1 1 020,3 1,057.8
Change in stocks of finished goods and work in progress -22,5 -3.6
Other operating income 3 42,0 28.7
Materials and services
Raw materials and consumables
Purchases during the financial period -550,7 -608.7
Change in inventories -2,3 -0.3
External services 4 -164,9 -176.1
-717,9 -785.1
Employee costs 5
Wages and salaries -57.8 -59.2
Social security expenses
Pension expenses -13.4 -14.4
Other social security expenses -27.3 -26.5
-98.5 -100.0
Depreciation, amortisation and impairment charges 6
Depreciation according to plan -43.5 -46.5
Impairment charges and reversal of impairment charges -8.5 0.3
-52.1 -46.2
Other operating expenses 7 -103.7 -101.5
OPERATING RESULT 67.7 50.1
Financial income and expenses 8
Income from Group companies 40.9 29.9
Income from participating interests 0.0 0.0
Income from other non-current assets 0.1 0.1
Other interest and financial income 0.0 0.4
Net exchange gains/losses -6.1 -6.8
Write-downs and reversal of write-downs on non-current investments 3.8 -33.2
Interest and other financial expenses -24.7 -29.1
14.0 -38.7
RESULT BEFORE APPROPRIATIONS AND TAXES 81.6 11.4
Appropriations
Change in depreciation differences -11.2 -22.0
Group contribution 41.5 29.9
30.2 7.8
Income taxes 9
Income taxes for the financial year -15.0 -4.0
Income taxes for previous periods 0.0 -9.6
RESULT FOR THE FINANCIAL PERIOD 96.8 5.6
PARENT COMPANY ACCOUNTS(FINNISH ACCOUNTING STANDARDS, FAS)INCOME STATEMENT

PARENT COMPANY ACCOUNTS – FINANCIAL STATEMENTS 2016 89
EUR million Note 31 DEC 2016 31 DEC 2015
ASSETS
NON-CURRENT ASSETS
INTANGIBLE ASSETS 10
Intangible rights 9.6 12.9
Other capitalised expenditure 1.0 1.1
Advance payments 0.2 -
10.8 14.0
TANGIBLE ASSETS 10, 25
Land and water areas 11.0 12.1
Buildings 95.5 99.5
Machinery and equipment 232.6 253.9
Other tangible assets 2.6 2.7
Advance payment and construction in progress 8.8 6.2
350.6 374.4
INVESTMENTS 11, 15
Shares in Group companies 558.6 559.5
Receivables from Group companies 345.5 174.1
Shares in participating interests 90.9 66.0
Other shares and holdings 40.5 40.6
Other receivables 0.0 0.0
1,035.5 840.2
1,396.9 1,228.7
CURRENT ASSETS
Inventories
Raw materials and consumables 34.5 36.8
Finished goods and goods for resale 103.7 126.2
Advance payment 7.3 7.7
145.5 170.7
RECEIVABLES 12, 13, 14, 15
Current
Accounts receivables 109.4 127.3
Receivables from Group companies 198.6 327.1
Receivables from participating interests 0.3 0.2
Other receivables 12.9 13.9
Prepayment and accrued income 14.4 12.3
335.6 480.8
Cash and cash equivalents 0.6 0.7
TOTAL ASSETS 1,878.6 1,881.0
EUR million Note 31 DEC 2016 31 DEC 2015
EQUITY AND LIABILITIES
SHAREHOLDERS’ EQUITY 16
Share capital 557.9 557.9
Reserve for invested unrestricted equity 384.8 384.8
Retained earnings 9.5 64.3
Result for the financial period 96.8 5.6
1,049.0 1,012.6
APPROPRIATIONS
Accumulated depreciation difference 84.2 72.9
PROVISIONS 17, 25
Provisions for pensions 2.3 1.9
Other provisions 7.3 6.3
9.6 8.3
LIABILITIES
NON-CURRENT 19, 20, 21
Bonds 224.2 223.9
Loans from financial institutions 150.4 200.0
Pension loans 86.9 118.7
Accruals and deferred income 0.1 0.1
461.6 542.6
CURRENT 19, 20, 22, 23
Loans from financial institutions 50.0 -
Pension loans 37.7 37.7
Advance payments 6.8 5.1
Accounts payable 76.9 93.1
Payables to Group companies 34.7 40.6
Payables to participating interests 0.2 0.2
Other liabilities 6.3 6.3
Accruals and deferred income 61.6 61.5
274.2 244.6
735.9 787.2
TOTAL EQUITY AND LIABILITIES 1,878.6 1,881.0
PARENT COMPANY ACCOUNTS
BALANCE SHEET

90 FINANCIAL STATEMENTS 2016 – PARENT COMPANY ACCOUNTS
EUR million 2016 2015
CASH FLOW FROM OPERATING ACTIVITIES
Operating result 67.7 50.1
Adjustments to operating result a) 44.9 36.4
Change in net working capital b) 39.9 58.4
Interest received 8.1 5.1
Interests paid -23.6 -25.7
Dividends received 33.0 25.0
Other financial items 3.8 -13.6
Taxes -12.0 -11.4
NET CASH FLOW FROM OPERATIONS 161.6 124.2
INVESTMENTS
Acquisition of subsidiary shares -0.6 -
Acquisition of participating interests -24.9 -
Acquisition of other shares - -1.5
Capital expenditure -27.7 -17.1
Proceeds from disposal of subsidiary shares 2.1 -
Proceeds from disposal of other shares 0.1 1,0
Proceeds from sale of tangible and intangible assets 10.0 6.1
Increase (-) or decrease (+) in other non-current investments -178.0 37.9
TOTAL CASH USED IN INVESTMENTS -219.0 26.5
CASH FLOW BEFORE FINANCING -57.4 150.7
FINANCING
Share issue - 100.1
Increase in non-current liabilities 5.9 5.9
Decrease in non-current liabilities -37.7 -28.7
Increase (-) or decrease (+) in interest-bearing non-current receivables 144.5 -176.4
Increase (-) or decrease (+) in interest-bearing current receivables 5.0 -12.3
Dividends paid -60.4 -39.4
TOTAL FINANCING 57.2 -150.8
Change in liquid funds -0.1 -0.1
Liquid funds at 1 Jan 0.7 0.8
LIQUID FUNDS AT 31 DEC 0.6 0.7
a) Adjustments to operating result
Depreciation 52.1 46.2
Gains (-) or losses (+) on sale of non-current assets -8.5 -6.0
Change in provisions 1.3 -3.8
Total 44.9 36.4
b) Change in net working capital
Increase (-) or decrease (+) in stocks 25.2 3.1
Increase (-) or decrease (+) in non-interest bearing receivables 42.3 47.2
Increase (+) or decrease (-) in non-interest bearing liabilities -27.6 8.1
Total 39.9 58.4
PARENT COMPANY ACCOUNTS
CASH FLOW STATEMENT

PARENT COMPANY ACCOUNTING POLICIES – FINANCIAL STATEMENTS 2016 91
PARENT COMPANY ACCOUNTING POLICIES
Metsä Board Corporation’s financial statements have been prepared in accordance with Finnish accounting standards (FAS).
SALES
Sales are calculated after deduction of indirect sales taxes, trade dis-counts and other items adjusting sales.
EXCHANGE RATE DIFFERENCES
Foreign exchange gains and losses have been booked to net exchange gains/losses under financial income and expense. Open and actual foreign exchange differences hedging sales are recorded immediately to financial income and expenses in the income statement.
TRANSACTIONS IN FOREIGN CURRENCY
Transactions in foreign currency have been recognised at the exchange rate on the day of the transaction.
At the balance sheet date, receivables and liabilities denominated in foreign currency have been translated into euros at the exchange rate quoted by the European Central Bank at the balance sheet date.
DERIVATIVE CONTRACTS
Derivative contracts have not been recognized at fair value. All deriva-tive contracts entered into by Metsä Board Corporation fulfill the crite-ria of hedge accounting as defined under IAS 39 and hedge accounting has been applied to them in consolidated IFRS accounts, or they are hedges on open foreign currency positions recognised in the balance sheet under so-called fair value hedge accounting. Off-balance sheet liabilities arising from derivatives are presented in note 24.
PENSIONS AND PENSION FUNDING
Statutory pensions are handled by pension insurance companies outside the Group. In addition to statutory pensions, some salaried employees have supplementary pension arrangements which are either insured, arranged through Metsäliitto Employees’ Pension Foundation or con-stitute an unfunded liability of the company. Metsäliitto Employees’ Pension Foundation is fully funded based on the fair value of its assets.
Pension insurance premiums have been periodized to correspond to the accrual-based wages and salaries in the financial statements.
INVENTORIES
Inventories are measured at the lower of cost or net realizable value. FIFO principle is observed in measuring inventories or, alternatively, the weighted average cost method. Value of finished and semi-finished goods comprises raw materials, direct wages and salaries, depreciation and amortisation and other direct cost as well as a reasonable share of variable and fixed production overhead cost calculated at normal level of production. Net realizable value is the estimated selling price less the
estimated cost of completion and the estimated costs necessary to make the sale.
PROPERTY, PLANT AND EQUIPMENT AND DEPRECIATION
The carrying values of property, plant and equipment are based on original acquisition costs less depreciation according to plan and impairment losses. Straight-line depreciation according to plan is based on the estimated useful life of the asset as follows:
Buildings and constructions 20–40 yearsHeavy power plant machinery 20–40 yearsOther heavy machinery 15–20 yearsLightweight machinery and equipment 5–15 yearsOther items 5–10 years
Depreciation is not recorded on the acquisition cost of land and water.
LEASING
Lease payments are treated as rental expenses.
ENVIRONMENTAL EXPENDITURE
Environmental expenditure comprises the identifiable expenses of environmental protection measures aimed primarily at preventing, remedying or alleviating environmental damage.
APPROPRIATIONS
Finnish tax legislation offers the possibility to deduct expenses prema-turely from the profit for the financial year and to transfer them to the balance sheet as provisions. The items are taken into account in tax filings only if they have been entered in the accounts. These items are presented under appropriations in the income statement and include depreciation on property, plant and equipment in excess of plan, which is stated as depreciation difference in the balance sheet and as change in the depreciation difference in the income statement. Received and given group contributions are also presented under appropriations.
PROVISIONS
Future costs and losses, to which the company is committed and which are likely to be realized, are included in the income statement under the appropriate expense heading and in the balance sheet under provi-sions for future costs whenever the precise amount and timing are not known, and in other cases under accrued liabilities. These can be i.a. pension liabilities or costs of discontinued operations and restructuring costs.
COMPARATIVE INFORMATION
Year 2015 financials have been restated to correspond with presentation changes implemented for the current year.

92 FINANCIAL STATEMENTS 2016 – NOTES TO THE PARENT COMPANY FINANCIAL STATEMENTS
NOTES TO THE PARENT COMPANY FINANCIAL STATEMENTS
EUR million 2016 2015
1. SALES
Finland 75.6 128.2
European Union 508.1 481.9
Rest of Europe 177.9 147.7
Rest of world 258.7 300.0
Total 1,020.3 1,057.8
2. EXCEPTIONAL ITEMS
Change in stocks of finished goods and work in progress
Write-down of Kyro mill inventories to net realizable value -1.2 -
Other operating income
Gains on sale of non-current assets 7.7 -
Employee costs
Restructuring cost 4.9 -
Other operating expenses
Reversal of unused Alizay closure provisions - -2.6
Restructuring cost 1.5 -
Other exceptional expenses - 0.1
Other operating expenses total 1.5 -2.5
Impairment charges and reversal of impairment charges
Impairment reversal of a sold paper machine in Simpele mill - -0.3
Impairment of Kyro mill tangible assets 8.5 -
Write-downs and reversal of write-downs on non-current investments
Write-off of Pohjolan Voima Oy OL4 shareholder loan - -2.2
Exceptional items in income statement total,income (+) or expense (-) -8.4 0.6
3. OTHER OPERATING INCOME
Rental income 0.9 0.7
Gains on disposal of fixed assets 9.8 6.1
Service revenue 19.4 15.1
Government grants and allowances 0.0 1.0
Scrap and waste sale 0.1 1.1
Other 11.8 4.6
Total 42.0 28.7
4. EXTERNAL SERVICES
Logistics expenses 118.4 127.6
Other external services 46.5 48.5
Total 164.9 176.1
External services include production related services and logistics expenses of sold products. Other operating expenses include among others non-production related services, energy costs, real estate costs and administration costs.
5. EMPLOYEE COSTS
Wages and salaries 57.8 59.2
Pension expenses 13.4 14.4
Other social security expenses 27.3 26.5
98.5 100.0
Key management salaries including variable bonus and incentives
CEO 1.2 0.7
Members of the Board 0.7 0.7
Total 1.9 1.3
Remuneration paid to key management personnel is described in more detail in note 31 of the consolidated Group accounts.
PENSION COMMITMENTS RELATED TO CEO
CEO of the parent company has the right to retire on a pension at the age of 62 years. The company has taken a supplementary pension insurance policy for the CEO, covering the period between the contractual and statutory retirement age of 63 years and entitling the CEO to receive pension compensation equal to 60 per cent of his salary at the time of retirement calculated in accordance with Finnish pension legislation and based on the calculation period of five years immediately preceding retirement. In case the service relationship of the CEO is terminated prior to retirement, the pension earned by the CEO becomes vested.
Metsä Board Corporation employed an average of 1,192 people (2015: 1,213). KPMG Oy acted as the independent principal auditor of the parent company during years 2016 and 2015.
PRINCIPAL AUDITOR FEES
Fees paid to independent principal auditor KPMG Oy in 2016 and 2015 were as follows:
Audit fees 0.12 0.12
Other fees 0.00 0.00
Total 0.13 0.13
The audit fees are paid for the audit of the annual financial statements and related services.
EUR million 2016 2015

NOTES TO THE PARENT COMPANY FINANCIAL STATEMENTS – FINANCIAL STATEMENTS 2016 93
EUR million 2016 2015
10. NON-CURRENT ASSETS:INTANGIBLE ASSETS
INTANGIBLE RIGHTS
Acquisition costs, 1 Jan 105.1 108.3
Increases 0.8 1.9
Transfers between items - 0.6
Decreases -1.6 -5.8
Acquisition costs, 31 Dec 104.3 105.1
Accumulated depreciation, 1 Jan -92.2 -95.1
Accumulated depreciation on deduction and transfers - 5.7
Depreciation for the period -2.5 -2.8
Accumulated depreciation, 31 Dec -94.7 -92.2
Book value, 31 Dec 9.6 12.9
OTHER CAPITALIZED EXPENDITURE
Acquisition costs, 1 Jan 15.9 15.2
Increases - 0.7
Transfers between items - 0.0
Decreases - 0.0
Acquisition costs, 31 Dec 15.9 15.9
Accumulated depreciation, 1 Jan -14.8 -14.2
Accumulated depreciation on deduction and transfers - 0.0
Depreciation for the period -0.1 -0.6
Accumulated depreciation, 31 Dec -14.9 -14.8
Book value, 31 Dec 1.0 1.1
ADVANCE PAYMENTS
Acquisition costs, 1 Jan - 0.1
Increases 0.2
Transfers between items - -0.1
Acquisition costs, 31 Dec 0.2 -
Book value, 31 Dec 0.2 -
EUR million 2016 2015
6. DEPRECIATION ACCORDING TO PLAN AND IMPAIRMENT CHARGES
Depreciation according to plan
Intangible rights 2.5 2.8
Other capitalised expenditure 0.1 0.6
Buildings and constructions 5.4 6.6
Machinery and equipment 35.2 36.1
Other tangible assets 0.3 0.3
Total depreciation according to plan 43.5 46.5
Impairment charges and reverse of impairment charges
Buildings and constructions 2.1 -
Machinery and equipment 6.5 -0.3
Change in depreciation difference 11.2 22.0
Total depreciation, amortization and impairment charges 63.3 68.3
Accumulated depreciation difference, 1 Jan 72.9 50.9
Increase in depreciation difference 11.2 22.0
Accumulated depreciation difference, 31 Dec 84.2 72.9
7. OTHER OPERATING EXPENSES
Rents and other real estate expenses 6.5 6.9
Purchased services 59.2 57.1
Other operating expenses 38.1 37.5
Total 103.7 101.5
8. FINANCIAL INCOME AND EXPENSES
Dividend income 33.0 25.0
Interest income from non-current investments 8.0 5.0
Other interest income 0.0 0.1
Write-downs and reversal of write-downs on non-current investments 3.8 -33.2
Interest expenses -23.3 -25.7
Other financial expenses -1.4 -3.0
20.1 -31.9
Net exchange differences -6.1 -6.8
Financial income and expenses, total 14.0 -38.7
EXCHANGE DIFFERENCES IN INCOME STATEMENT
Exchange differences on sales 0.0 4.6
Exchange differences on purchases -0.1 -0.5
Exchange differences on financing -6.1 -10.9
Exchange differences, total -6.1 -6.8
9. INCOME TAXES
Income taxes for the financial period 15.0 4.0
Income taxes for previous periods 0.0 9.6
Total 15.0 13.6
In the autumn of 2015, the Finnish Tax Administration took a stand against the deductibility of certain losses in Metsä Board Corporation’s 2014 taxation. The company recognised EUR 9.6 million of previous periods’ taxes in its tax expense of 2015. Metsä Board has appealed against the decision issued by the Tax Administration, as the company believes the losses are deductible.

94 FINANCIAL STATEMENTS 2016 – NOTES TO THE PARENT COMPANY FINANCIAL STATEMENTS
EUR million 2015 2015
11. INVESTMENTS
SHARES IN GROUP COMPANIES
Acquisition costs, 1 Jan 559.5 559.5
Increases 0.6 -
Decreases -0.9 -
Write-downs -0.6 -
Acquisition costs, 31 Dec 558.6 559,5
Book value, 31 Dec 558.6 559.5
SHARES IN PARTICIPATING INTERESTS
Acquisition costs, 1 Jan 66.0 66.0
Increases 24.9 -
Acquisition costs, 31 Dec 90.9 66.0
Book value, 31 Dec 90.9 66.0
OTHER SHARES AND HOLDINGS
Acquisition costs, 1 Jan 40.6 40.6
Decreases -0.1 0.0
Acquisition costs, 31 Dec 40.5 40.6
Book value, 31 Dec 40.5 40.6
RECEIVABLES FROM GROUP COMPANIES
Acquisition costs, 1 Jan 174.1 207.6
Increases 329.0 -
Decreases -157.6 -33.5
Acquisition costs, 31 Dec 345.5 174.1
Book value, 31 Dec 345.5 174.1
OTHER RECEIVABLES
Acquisition costs, 1 Jan 0.0 2.8
Decreases - -2.8
Acquisition costs, 31 Dec 0.0 0.0
Book value, 31 Dec 0.0 0.0
INVESTMENTS, TOTAL
Acquisition costs, 1 Jan 840.2 876.6
Increases 354.5 -
Decreases -158.6 -36.3
Write-downs -0.6 -
Acquisition costs, 31 Dec 1,035.5 840.2
Book value, 31 Dec 1,035.5 840.2
12. LOAN RECEIVABLES FROM MANAGEMENT
There are no loan receivables from the CEO, members of the Board of Directors and their deputies as well as persons who are members of similar bodies.
EUR million 2016 2015
10. NON-CURRENT ASSETS:TANGIBLE ASSETS
LAND AND WATER AREAS
Acquisition costs, 1 Jan 12.1 12.5
Increases 0.0 0.0
Decreases -1.1 -0.4
Acquisition costs, 31 Dec 11.0 12.1
Book value, 31 Dec 11.0 12.1
BUILDINGS
Acquisition costs, 1 Jan 273.1 273.7
Increases 3.3 0.5
Transfers between items 0.2 0.1
Decreases 0.0 -1.2
Acquisition costs, 31 Dec 276.5 273.1
Accumulated depreciation, 1 Jan -173.5 -168.1
Accumulated depreciation on deduction and transfers - 1.2
Depreciation and impairment charges for the period -7.4 -6.6
Accumulated depreciation, 31 Dec -181.0 -173.5
Book value, 31 Dec 95.5 99.5
MACHINERY AND EQUIPMENT
Acquisition costs, 1 Jan 1.192.1 1,188.8
Increases 15.6 9.3
Transfers between items 4.8 3.2
Decreases -2.0 -9.2
Acquisition costs, 31 Dec 1.210.5 1,192.0
Accumulated depreciation, 1 Jan -938.2 -911.3
Accumulated depreciation on deduction and transfers 2.0 8.9
Depreciation and impairment charges for the period -41.7 -35.8
Accumulated depreciation, 31 Dec -977.9 -938.2
Book value, 31 Dec 232.6 253.9
Production machinery and equipment, 31 Dec 232.6 253.9
OTHER TANGIBLE ASSETS
Acquisition costs, 1 Jan 9.4 9.4
Increases 0.2 -
Transfers between items - 0.0
Decreases - 0.0
Acquisition costs, 31 Dec 9.6 9.4
Accumulated depreciation, 1 Jan -6.7 -6.4
Accumulated depreciation on deduction and transfers - 0.0
Depreciation for the period -0.3 -0.3
Accumulated depreciation, 31 Dec -7.0 -6.7
Book value, 31 Dec 2.6 2.7
CONSTRUCTION IN PROGRESS
Acquisition costs, 1 Jan 6.2 5.5
Increases 7.6 4.6
Transfers between items -5.0 -3.9
Acquisition costs, 31 Dec 8.8 6.2
Book value, 31 Dec 8.8 6.2
The remaining net book value of capitalized interest expenses under balance sheet item “Machinery and equipment” was EUR 0.0 million (2015: 0.0). No interest expenses were capitalized during financial years 2016 and 2015.

NOTES TO THE PARENT COMPANY FINANCIAL STATEMENTS – FINANCIAL STATEMENTS 2016 95
EUR million 1 Jan Increase Decrease 31 Dec
17. PROVISIONS
Provisions for pension 1.2 - -0.2 1.0
Provisions for unemployment pension costs 0.7 0.9 -0.3 1.3
Restucturing 0.4 0.6 - 1.0
Provision for rental costs 0.2 - -0.2 -
Other provisions 5.7 0.6 -0.1 6.2
Total 8.3 2.1 -0.8 9.6
EUR million 2016 2015
18. DEFERRED TAX ASSETS AND LIABILITIES NOT RECOGNISED IN BALANCE SHEET
Deferred tax assets
Provisions 1.9 1.7
Total 1.9 1.7
Deferred tax liabilities
Accumulated depreciation difference 16.8 14.6
Total 16.8 14.6
19. LIABILITIES
Non-current
Non-interest-bearing 0.1 0.0
Interest-bearing 461.6 542.6
Total 461.6 542.6
Current
Non-interest-bearing 181.1 206.4
Interest-bearing 93.1 38.2
Total 274.2 244.6
Bonds Nominal value Interest, % EUR million
2014–2019 225.0 4.0 224.2 223,9
Total 224.2 223,9
Metsä Board Corporation has issued one bond with a nominal value of EUR 225 million. The bond carries a 4.0 per cent coupon and matures on 13 March 2019. The bond has senior status and no collateral. The terms of the bond include customary restrictions on, among other things, mergers, demergers, changes in control of and pledges made by the company. Restrictions pertaining to increased leverage and sale of assets have been voided following an improve-ment in credit ratings over the limits set in the terms.
EUR million 2016 2015
13. CURRENT RECEIVABLES
Receivables from Group companies
Accounts receivables 11.8 9.2
Loan receivables 141.5 285.9
Other receivables 43.7 30.6
Prepayment and accrued income 1.7 1.4
Receivables from associated companies
Accounts receivables 0.3 0.2
Receivables from others
Accounts receivables 109.4 127.3
Other receivables 12.9 13.9
Prepayment and accrued income 14.4 12.3
Total 335.6 480.8
14. PREPAYMENT AND ACCRUED INCOME
Insurances 0.1 0.0
Energy taxes and other taxes 10.8 8.5
Other items 3.5 3.8
Total 14.4 12.3
15. INTEREST-BEARING RECEIVABLES
Loan receivables and other non-current assets 167.5 174.1
Liquid funds and other current assets 142.1 286.7
Total 309.6 460.8
16. SHAREHOLDERS’ EQUITY
Share capital, 1 Jan
Series A shares 61.0 61.2
Series B shares 496.9 496.7
Share capital, 1 Jan 557.9 557.9
Conversion of A-shares into B-shares
Series A shares - -0.2
Series B shares - 0.2
Total - 0.0
Share capital, 31 Dec
Series A shares 61.0 61.0
Series B shares 496.9 496.9
Share capital, 31 Dec 557.9 557.9
Reserve for invested unrestricted equity 1 Jan 384.8 284.8
Share issue - 100.1
Reserve for invested unrestricted equity 31 Dec 384.8 384.8
Retained earnings, 1 Jan 69.9 103.6
Dividend -60.4 -39.4
Profit for the period 96.8 5.6
Retained earnings, 31 Dec 106.3 69.9
Shareholders’ equity, total 1,049.0 1,012.6

96 FINANCIAL STATEMENTS 2016 – NOTES TO THE PARENT COMPANY FINANCIAL STATEMENTS
EUR million 2016 2015
21. NON-CURRENT LIABILITIES
Liabilities to Group companies
Bonds 9.2 -
Other liabilities
Bonds 215.0 223.9
Loans from financial institutions 150.4 200.0
Pension loans 86.9 118.7
Other liabilities 0.1 0.1
Total 461.6 542.6
22. CURRENT LIABILITIES
Liabilities to Group companies 34.7 40.6
Liabilities to participating interests 0.2 0.2
Other liabilities
Pension loans 37.7 37.7
Advance payment 6.8 5.1
Accounts payable 76.9 93.1
Other liabilities 56.3 6.3
Accruals and deferred income 61.6 61.5
Total 274.2 244.6
23. ACCRUALS AND DEFERRED INCOME
Current
Insurances 1.0 1.5
Personnel expenses 18.9 21.8
Interests 7.7 8.0
Accruals of purchases 7.2 6.4
Discounts 16.3 13.9
Others 10.5 9.8
Total 61.6 61.5
EUR million 2016 2015
20. NON-CURRENT DEBTS WITH AMORTISATION PLAN
Bonds
2019 224.2 223.9
Total, at the end of the financial period 224.2 223.9
Loans from financial institutions
2017 50.0 50.0
2018 0.2 150.0
2019 0.2 -
2020 150.0 -
Total, at the end of the financial period 200.4 200.0
Pension loans
2016 - 37.7
2017 37.7 31.8
2018 31.8 31.8
2019 31.8 31.8
2020 23.3 23.3
Total, at the end of the financial period 124.6 156.4
Total
2016 - 37.7
2017 87.7 81.8
2018 32.0 181.8
2019 256.2 255.6
2020 173.4 23.3
Total, at the end of the financial period 549.3 580.3

NOTES TO THE PARENT COMPANY FINANCIAL STATEMENTS – FINANCIAL STATEMENTS 2016 97
24. CONTINGENT LIABILITIES
DISPUTESIn May 2014, Metsä Board petitioned the District Court of Helsinki to revoke the judgment issued by the Arbitral Tribunal on 11 February 2014 that orders Metsä Board to pay EUR 19.7 million in damages to UPM Kymmene Corporation. In a judgment issued in June 2015, the District Court rejected Metsä Board’s petition. Metsä Board appealed the decision of the District Court to the Court of Appeal. The Court of Appeal dismissed Metsä Board’s appeal on 21 October 2016. Metsä Board has applied for leave to appeal the matter to the Supreme Court.
EUR million 2016 2015
For own liabilities
Liabilities secured by pledges
Pension loans 34.6 43.9
Pledges granted 30.6 21.8
Liabilities secured by mortgages
Pension loans 87.1 110.3
Real estate mortgages 232.8 232.8
As security of own commitments
Guarantees and counter-indemnities 5.1 5.9
Other commitments 49.9 49.9
Other rent and leasing commitments
Payments due in the following year 1.5 1.4
Payments due in subsequent years 3.2 2.5
Total
Pledges 30.6 21.8
Floating charges
Real estate mortgages 232.8 232.8
Guarantees and counter-indemnities 5.1 5.9
Other commitments 49.9 49.9
Other rent and leasing commitments 4.7 3.9
Total 323.1 314.3
Other commitments consist of a sale and leaseback arrangement made by Metsä Board Corporation. Commitments arising from derivative contracts not recog-nised in Balance sheet are as follows:
EUR million 2016 2016 2015 2015
Nominal value
Fair value
Nominalvalue
Fair value
Interest rate swaps 100.0 -1.7 253.4 -0.9
Interest rate derivatives total 100.0 -1.7 253.4 -0.9
Currency forward agreements 697.7 -12.3 465.5 0.2
Currency option agreements 56.9 -0.6 91.8 0.0
Currency derivatives total 754.6 -13.0 557.4 0.2
Electricity derivatives 45.8 0.9 27.9 -7.0
Oil derivatives 11.1 0.4 16.7 -6.4
Other commodity derivatives 1.1 0.3 1.4 -0.3
Commodity derivatives total 58.1 1.7 46.0 -13.7
Derivatives total 912.7 -13.0 856.8 -14.4
All derivative agreements of Metsä Board Corporation have been entered into for hedging purposes and cash flow hedge accounting according to IAS 39 is applied to a major part of the contracts in IFRS financial statements of the Metsä Board Group. Only the part of currency derivatives designated as hedges of accounts receivables and accounts payables is excluded from the application of hedge accounting.
Interest rate derivatives are interest rate swaps maturing in 2018 and entered into to hedge the floating rate interest payments. Currency derivatives contracts
concluded to hedge currency cash flows mature fully during the financial year starting on 1 January 2017. Commodity derivatives are electricity forwards, propane forwards and gasoil forwards concluded to hedge the cash flows arising from purchases of these commodities. Commodity derivative contracts mature in years 2017–2020. A more detailed description of financial risk management and the principles applied to derivative contracts is included in note 26 of the consolidated Group accounts.
25. ENVIRONMENTAL ITEMS
Only incremental identifiable costs that are primarily intended to prevent, reduce or repair damage to the environment are included in environmental costs. Environmental expenditures are capitalised if they have been incurred to prevent or reduce future damage or conserve resources and bring future economic benefits.
Following is the summary of environmental costs and changes in capitalised environmental expenditures.
EUR million 2016 2015
Income statement
Materials and consumables 3.5 3.9
Employees costs
Wages and salaries 0.6 0.7
Social security costs 0.3 0.3
Depreciation 3.4 3.0
Other operating expenses 3.8 3.0
11.7 11.0
Balance sheet
Tangible assets
Acquisition costs, 1 Jan 70.8 67.2
Increases 5.8 4.8
Decreases - -1.2
Depreciation -51.4 -48.0
Book value, 31 Dec 25.2 22.8
Provisions
Other provisions 6.2 5.7
EMISSION ALLOWANCESMetsä Board Corporation participates in the European Union Emissions Trading System. In 2016, the company received 354,000 tonnes of emission allowances free of charge. On the balance sheet date, the company had 332,000 tonnes of emission allowances. Actual emissions during the financial period were 199,000 tonnes.
Metsä Board Corporation has recognised the emission allowances in accord-ance with the net method. The difference between the emissions and the emis-sion allowances received has been recognised through income statement if the actual emissions have exceeded the allowances received. Actual emission during the period did not have any effect on income statement or on balance sheet.
In 2016, Metsä Board Corporation sold emission allowances worth EUR 2.2 million. On the balance sheet date, the fair value of an emission right was EUR 6.54 per ton and total value of the rights held by the company was about EUR 2.2 million.

98 FINANCIAL STATEMENTS 2016 – THE BOARD’S PROPOSAL FOR THE DISTRIBUTION OF PROFITS
THE BOARD’S PROPOSAL FOR THE DISTRIBUTION OF PROFITS
The distributable funds of the parent company amount to EUR 491,104,577.54 of which the result for the period is EUR 96,798,084.60.The Board of Directors proposes to the Annual General Meeting that the distributable funds be distributed as follows:
A dividend of EUR 0.19 per share be paid, or in total 67,547,421.74To be left to the shareholders’ equity 423,557,155.80 491,104,577.54
The Board of Directors proposes that the dividend will be paid on 3 April 2017.
No material changes have taken place with respect to the company’s financial position after the balance sheet date. Liquidity of the company is good.
Espoo, 2 February 2017
Kari Jordan Martti Asunta Mikael Aminoff
Kirsi Komi Kai Korhonen Liisa Leino
Juha Niemelä Veli Sundbäck Erkki Varis
Mika Joukio CEO
AUDITOR’S REPORT 99
AUDITOR’S REPORT
This document is an English translation of the Finnish auditor’s report. Only the Finnish version of the report is legally binding.
TO THE ANNUAL GENERAL MEETING OF METSÄ BOARD CORPORATION
REPORT ON THE AUDIT OF THE FINANCIAL STATEMENTS
OPINION
We have audited the financial statements of Metsä Board Corporation (business identity code 0635366-7) for the year ended 31 December 2016. The financial statements comprise the consolidated balance sheet, statement of comprehensive income, statement of changes in equity, statement of cash flows and notes, including a summary of significant accounting policies, as well as the parent company’s balance sheet, income statement, statement of cash flows and notes.
In our opinion— the consolidated financial statements give a true and fair view of
the group’s financial performance, financial position and cash flows in accordance with International Financial Reporting Standards (IFRS) as adopted by the EU
— the financial statements give a true and fair view of the parent com-pany’s financial performance and financial position in accordance with the laws and regulations governing the preparation of financial statements in Finland and comply with statutory requirements.
BASIS FOR OPINION
We conducted our audit in accordance with good auditing practice in Finland. Our responsibilities under good auditing practice are further described in the Auditor’s Responsibilities for the Audit of the Financial Statements section of our report.
We are independent of the parent company and of the group com-panies in accordance with the ethical requirements that are applicable
in Finland and are relevant to our audit, and we have fulfilled our other ethical responsibilities in accordance with these requirements.
We believe that the audit evidence we have obtained is sufficient and appropriate to provide a basis for our opinion.
MATERIALITY
The scope of our audit was influenced by our application of materiality. The materiality is determined based on our professional judgement and is used to determine the nature, timing and extent of our audit procedures and to evaluate the effect of identified misstatements on the financial statements as a whole. The level of materiality we set is based on our assessment of the magnitude of misstatements that, individually or in aggregate, could reasonably be expected to have influence on the economic decisions of the users of the financial statements. We have also taken into account misstatements and/or possible misstatements that in our opinion are material for qualitative reasons for the users of the financial statements.
KEY AUDIT MATTERS
Key audit matters are those matters that, in our professional judgment, were of most significance in our audit of the financial statements of the current period. These matters were addressed in the context of our audit of the financial statements as a whole, and in forming our opinion thereon, and we do not provide a separate opinion on these matters.
We have also addressed the risk of management override of internal controls. This includes consideration of whether there was evidence of management bias that represented a risk of material misstatement due to fraud.
THE KEY AUDIT MATTER HOW THE MATTER WAS ADDRESSED IN THE AUDIT
CONTROL ENVIRONMENT RELATING TO THE FINANCIAL REPORTING PROCESS AND RELATED IT SYSTEMS
The IT control environment relating to the financial reporting process and the application controls of individual IT systems have an impact on the selected audit approach.
As the consolidated financial statements are based on extensive number of data flows from multiple IT systems, consequently the financial reporting control environment is determined as a key audit matter.
Our audit procedures included evaluation of the financial report-ing process and related control environment, as well as testing of the effectiveness of controls including general IT controls. Our audit procedures focused on testing the reconciliation and approval controls as well as on evaluating the administration of access rights.
Our audit procedures extensively consisted of several substantive procedures as well as data analysis relating to the most significant balances on the income statement and on the balance sheet.

100 AUDITOR’S REPORT
THE KEY AUDIT MATTER HOW THE MATTER WAS ADDRESSED IN THE AUDIT
VALUATION OF TANGIBLE AND INTANGIBLE ASSETS
(REFER TO ACCOUNTING POLICIES AND NOTES 11 AND 12 TO THE CONSOLIDATED FINANCIAL STATEMENTS)
Tangible and intangible assets total EUR 857 million and repre-sent 39 percent of the consolidated total assets. Gross investments totalled EUR 162 million.
The impairment tests cover non-financial assets allocated to the business units. Determining the key assumptions used in the cash flow forecasts underlying the impairment tests requires manage-ment judgment.
Due to the significant carrying values involved, valuation of tangi-ble and intangible assets is determined as a key audit matter.
Our audit procedures included evaluation of the appropriateness of the capitalization and depreciation principles applied.
We also assessed the key assumptions used in the impairment tests by reference to the budgets approved by the parent company’s Board of Directors, data external to the Group and our own views. We involved KPMG valuation specialists when assessing the mathematical accuracy of the calculations, as well as comparing the assumptions to externally available market and industry data.
In addition, we considered the appropriateness of the disclosures regarding the tangible and intangible assets.
VALUATION OF INVENTORIES (REFER TO ACCOUNTING POLICIES AND NOTE 17 TO THE CONSOLIDATED FINANCIAL STATEMENTS)
Inventory management, stocktaking routines and pricing of inven-tories are key factors in the valuation of inventories. The Group’s carrying value of inventories was EUR 333 million at the end of the financial year.
The valuation of inventories involves management estimates in relation to potentially obsolete inventory, as well as to fluctuations in the market prices of finished goods.
The valuation of inventories has a significant impact on the profit and loss account and therefore it is determined as a key audit matter.
We evaluated the appropriateness of the accounting policies by reference to IFRS standards, as well as the functionality of the key IT systems of inventory management.
We tested the controls over inventory management, accuracy of inventory amounts and valuation of inventories, as well as performed substantive audit procedures relating to the valuation of inventories to test the accuracy of inventory valuation. We also followed the execution of certain stocktaking during the financial year.
FINANCIAL CONTRACTS AND HEDGING INSTRUMENTS
(REFER TO ACCOUNTING POLICIES AND NOTES 23, 26 AND 27 TO THE CONSOLIDATED FINANCIAL STATEMENTS)
The financial liabilities amount to EUR 688 million, accounting for 31 percent of the consolidated balance sheet. In addition, the Group has off-balance sheet committed credit facility agreements amounting to EUR 202 million.
The Group hedges financial risks with interest rate and foreign currency derivatives and their nominal values amounted to EUR 855 million at the end of the financial year.
Due to the significance of the financial and derivative contracts and the IFRS requirements set for hedge accounting, the financial contracts and hedging instruments are determined as a key audit matter.
Our audit procedures included evaluation of the recognition and measurement principles applied to financial instruments for appropriateness, as well as testing of controls over the accuracy and valuation of financial instruments.
As part of our year-end audit procedures we tested the appropriate-ness of valuations by using data analysis, as well as selecting transac-tions for testing on a sample basis.
In respect to hedge accounting, we evaluated the effectiveness of hedge accounting by reference to IFRS requirements.
In addition, we evaluated the adequacy of the disclosures relating to financial instruments.
RESPONSIBILITIES OF THE BOARD OF DIRECTORS AND THE MANAGING
DIRECTOR FOR THE FINANCIAL STATEMENTS
The Board of Directors and the Managing Director are responsible for the preparation of consolidated financial statements that give a true and fair view in accordance with International Financial Reporting Standards (IFRS) as adopted by the EU, and of financial statements that give a true and fair view in accordance with the laws and regula-tions governing the preparation of financial statements in Finland and comply with statutory requirements. The Board of Directors and the
Managing Director are also responsible for such internal control as they determine is necessary to enable the preparation of financial statements that are free from material misstatement, whether due to fraud or error.
In preparing the financial statements, the Board of Directors and the Managing Director are responsible for assessing the parent company’s and the group’s ability to continue as a going concern, disclosing, as applicable, matters relating to the going concern and using the going concern basis of accounting. The financial statements are prepared using the going concern basis of accounting unless there is an intention
AUDITOR’S REPORT

AUDITOR’S REPORT 101
to liquidate the parent company or the group or cease operations, or there is no realistic alternative but to do so.
AUDITOR’S RESPONSIBILITIES FOR THE
AUDIT OF THE FINANCIAL STATEMENTS
Our objectives are to obtain reasonable assurance on whether the finan-cial statements as a whole are free from material misstatement, whether due to fraud or error, and to issue an auditor’s report that includes our opinion. Reasonable assurance is a high level of assurance, but is not a guarantee that an audit conducted in accordance with good audit-ing practice will always detect a material misstatement when it exists. Misstatements can arise from fraud or error and are considered material if, individually or in aggregate, they could reasonably be expected to influence the economic decisions of users taken on the basis of the financial statements.
As part of an audit in accordance with good auditing practice, we exercise professional judgment and maintain professional scepticism throughout the audit. We also:— Identify and assess the risks of material misstatement of the financial
statements, whether due to fraud or error, design and perform audit procedures responsive to those risks, and obtain audit evidence that is sufficient and appropriate to provide a basis for our opinion. The risk of not detecting a material misstatement resulting from fraud is higher than for one resulting from error, as fraud may involve collusion, forgery, intentional omissions, misrepresentations, or the override of internal control.
— Obtain an understanding of internal control relevant to the audit in order to design audit procedures that are appropriate in the cir-cumstances, but not for the purpose of expressing an opinion on the effectiveness of the parent company’s or the group’s internal control.
— Evaluate the appropriateness of accounting policies used and the reasonableness of accounting estimates and related disclosures made by management.
— Conclude on the appropriateness of the Board of Directors’ and the Managing Director’s use of the going concern basis of accounting and based on the audit evidence obtained, whether a material uncer-tainty exists related to events or conditions that may cast significant doubt on the parent company’s or the group’s ability to continue as a going concern. If we conclude that a material uncertainty exists, we are required to draw attention in our auditor’s report to the related disclosures in the financial statements or, if such disclosures are inadequate, to modify our opinion. Our conclusions are based on the audit evidence obtained up to the date of our auditor’s report. However, future events or conditions may cause the parent company or the group to cease to continue as a going concern.
— Evaluate the overall presentation, structure and content of the finan-cial statements, including the disclosures, and whether the financial statements represent the underlying transactions and events so that the financial statements give a true and fair view.
— Obtain sufficient appropriate audit evidence regarding the financial information of the entities or business activities within the group to express an opinion on the consolidated financial statements. We are responsible for the direction, supervision and performance of the group audit. We remain solely responsible for our audit opinion.
We communicate with those charged with governance regarding, among other matters, the planned scope and timing of the audit and significant audit findings, including any significant deficiencies in internal control that we identify during our audit.
We also provide those charged with governance with a statement that we have complied with relevant ethical requirements regarding independence, and communicate with them all relationships and other matters that may reasonably be thought to bear on our independence, and where applicable, related safeguards.
From the matters communicated with those charged with gover-nance, we determine those matters that were of most significance in the audit of the financial statements of the current period and are therefore the key audit matters. We describe these matters in our auditor’s report unless law or regulation precludes public disclosure about the matter or when, in extremely rare circumstances, we determine that a matter should not be communicated in our report because the adverse con-sequences of doing so would reasonably be expected to outweigh the public interest benefits of such communication.
OTHER REPORTING REQUIREMENTS
OTHER INFORMATION
The Board of Directors and the Managing Director are responsible for the other information. The other information comprises information included in the report of the Board of Directors and in the Annual Report, but does not include the financial statements and our auditor’s report thereon. We obtained the report of the Board of Directors prior to the date of this auditor’s report, and the Annual Report is expected to be made available to us after that date.
Our opinion on the financial statements does not cover the other information.
In connection with our audit of the financial statements, our respon-sibility is to read the other information identified above and, in doing so, consider whether the other information is materially inconsistent with the financial statements or our knowledge obtained in the audit, or otherwise appears to be materially misstated. With respect to the report of the Board of Directors, our responsibility also includes con-sidering whether the report of the Board of Directors has been prepared in accordance with the applicable laws and regulations.
In our opinion, the information in the report of the Board of Directors is consistent with the information in the financial statements and the report of the Board of Directors has been prepared in accor-dance with the applicable laws and regulations.
If, based on the work we have performed on the report of the Board of Directors, we conclude that there is a material misstatement of this other information, we are required to report that fact. We have nothing to report in this regard.
OTHER OPINIONS
We support that the financial statements should be adopted. The pro-posal by the Board of Directors regarding the treatment of distributable funds is in compliance with the Limited Liability Companies Act. We support that the Board of Directors of the parent company and the Managing Director should be discharged from liability for the financial period audited by us.
Espoo, 14 February 2017
KPMG Oy Ab
Raija-Leena HankonenAuthorized Public Accountant

102 CORPORATE GOVERNANCE STATEMENT
INTRODUCTION
This statement describing the corporate governance of Metsä Board Corporation (Metsä Board or Company) has been issued as a separate statement pursuant to the Securities Markets Act and the Finnish Corporate Governance Code and is published concur-rently with the Company’s financial state-ments and report of the Board of Directors. The Finnish Corporate Governance Code from 2015 is available at the website of the Finnish Securities Markets Association at www.cgifinland.fi.
Metsä Board is a Finnish public limited company whose A and B series shares are subject to public trading on the official list of NASDAQ OMX Helsinki Ltd. (Helsinki Stock Exchange). In its administration and
governance Metsä Board applies Finnish laws, especially the Companies Act, the Company’s Articles of Association and rules and regula-tions issued pursuant to laws, including those issued by the Financial Supervisory Authority and applying to listed companies. Metsä Board also complies with the rules and recom-mendations of the Helsinki Stock Exchange as applicable to listed companies.
Metsä Board prepares its financial state-ments and interim reports according to the International Financial Reporting Standards (IFRS). The financial statement documents are prepared and published in Finnish and English.
Metsä Board’s headquarters are located in Espoo, Finland. The Company’s registered domicile is Helsinki.
APPLICATION OF THE FINNISH CORPORATE
GOVERNANCE CODE
As a Finnish listed company, Metsä Board applies the Finnish Corporate Governance Code of 2015. Currently Metsä Board does not deviate from any single recommendation of the Code. The new Corporate Governance Code entered into force on 1 January 2016. This statement has been issued in compliance with the regulations concerning reporting content set out in the Corporate Governance Code of 2015.
METSÄ BOARD’S GOVERNANCE STRUCTURE
The Company’s statutory bodies include the General Meeting of Shareholders, the Board of Directors and the CEO. In addition, a
CORPORATE GOVERNANCE STATEMENT
SHAREHOLDERS’ MEETING
BOARD OF DIRECTORS
BOARD COMMITTEES AUDIT
COMMITTEENOMINATION AND COMPENSATION
COMMITTEE
CEO
CORPORATE MANAGEMENT TEAM
FINA
NC
IAL R
EP
OR
TIN
G
INT
ER
NA
L A
UD
ITIN
G
| A
UD
ITIN
G
CORPORATE GOVERNANCE IN METSÄ BOARD

CORPORATE GOVERNANCE STATEMENT 103
Corporate Management Team assists the CEO in the operative management of the Company and in coordinating its operations. Members of the management team are not members of the Board of Directors. The tasks and responsibilities of the different corporate bodies are specified in the Finnish Companies Act.
Metsä Board has a function based organisation, including marketing and sales, production and technology, finance, business development and human resources. Functions are supported by centralized support func-tions, most of which are common with other Metsä Group companies. Support functions are based on specific service agreements, the terms of which are at arm’s length.
GENERAL MEETING
The General Meeting of Shareholders is the Company’s highest decision-making body where shareholders use their decision-making power. Each shareholder is entitled to participate in a General Meeting by fol-lowing the procedure described in the notice to the General Meeting. According to the Companies Act, the General Meeting decides on the following matters, among others:• amending the Articles of Association• approving the financial statements• profit distribution• mergers and demergers• acquisition and transfer of own shares• appointing the members of the Board and
specifying their and Board committee members’ compensation
• appointing the auditor and specifying his compensation.
Shareholders are entitled to put forward a matter pertaining to the General Meeting to be addressed when the shareholder delivers a written request to this effect so well in advance that the matter can be included in the notice to the meeting. The Company has specified January 15th as the relevant deadline. In addition, a shareholder has a right to present questions on the items on the agenda of the General Meeting. A shareholder is entitled to participate in a General Meeting when he/she is included in the register of
shareholders eight (8) working days before the General Meeting. An Annual General Meeting takes place each year in June at the latest. Notice to a General Meeting is served at the earliest three months and at the latest three weeks before the meeting by publishing it on the Company’s website and by publish-ing the notice or a summary thereof in at least one Finnish newspaper of general circulation.
An Extraordinary General Meeting will convene if the Board finds it necessary, or if the auditor or shareholders representing at least 10 per cent of all shares deliver a written request to this effect in order to process a specified matter.
BOARD OF DIRECTORS
The Board of Directors is responsible for the Company’s administration and arranging the Company’s operations properly according to applicable laws, the Articles of Association and good corporate governance. The general authority of the Board cover matters that are far-reaching, strategically significant or unusual and which therefore do not belong to the Company’s day-to-day business opera-tions. The Board supervises Metsä Board’s operations and management and decides on strategy, major investments, the Company’s organisation structure and significant financing matters. The Board supervises the proper arrangement of the Company’s opera-tions, and ensures that accounting and asset management control, financial reporting and risk management have been organised in an appropriate manner.
For its operation, the Board has a written working order. In accordance with the work-ing order, the Board’s tasks include:• appointing the CEO and discharging him
and ensuring that the CEO takes care of the Company’s day-to-day administration in accordance with the regulations and guidelines given by the Board
• establishing necessary committees, appointing their members and approving their working orders
• addressing and approving the long range plan and corporate strategy
• accepting the annual operational plan and budget
• monitoring how the Company’s account-ing, asset management, risk control and financial reporting are arranged
• deciding on significant investments, busi-ness acquisitions, divestments and closures of operations
• deciding on considerable investments and financing arrangements
• deciding on the transfer and pledging of the Company’s significant real property
• deciding on management authorizations and granting rights to represent the Company
• monitoring that the Company’s Articles of Association are complied with; convening the General Meeting and monitoring that the decisions taken by the General Meeting are implemented
• signing and presenting the financial state-ments to the Annual General Meeting for approval, and preparing a proposal for the use of profits
• approving key policies and guidelines, including the insider guidelines
• publishing the financial statements bul-leting as well as interim and semi-annual reports
• publishing or authorizing the CEO to publish all inside information likely to have a significant effect on the value of the Company’s shares, or which otherwise have to be made public according to the Finnish Securities Markets Act or the Rules of the Helsinki Stock Exchange.
The working order of the Board of Directors is presented in full on the Company’s website (www.metsaboard.com > lnvestors > Corporate Governance). The Board can delegate matters in its general authority to the CEO and correspondingly take charge of decision-making in a task that belongs to the CEO’s general authority.
On an annual basis, the Board assesses its own operation and the Company’s governance and decides on any necessary changes.
The Board convenes on a regular basis. In the financial year 2016, the Board held a total of 17 meetings, five of which were phone meetings. The Board members participated in the meetings as follows: Asunta, Jordan, Komi, Korhonen, Niemelä, Sundbäck and

104 CORPORATE GOVERNANCE STATEMENT
Varis took part in all meetings, while Leino took part in 16 and Aminoff in 15 meetings. (The attendance rate of the members was 99 per cent in 2015 and 100 per cent in 2014).
COMPOSITION, DIVERSITY AND
INDEPENDENCE OF THE BOARD OF DIRECTORS
The composition and number of members of the Board of Directors must facilitate effective fulfilment of the Board’s tasks. The composition of the Board of Directors takes into account the development phase of the Company, ownership structure, the special requirements of the industry and the needs of the Company’s operations. Both sexes are rep-resented on the Board of Directors. A mem-ber of the Board must possess the competence required by the task and the opportunity to allocate sufficient time for the task.
The Board recognizes the benefits to the Company and its shareholders of a diverse and broad Board composition. Diversity sup-ports the Board’s open work atmosphere and decision-making. The Board is responsible for the Company’s administration and the proper arrangement of its operations. A key task of the Board is also to support and challenge operative management from various perspec-tives in a consistent and predictable manner. The successful working by the Board and its Committees requires a diverse composition, knowledge and experience base as well as tak-ing into account the personal qualities of indi-vidual members. Metsä Board has identified that key diversity factors for the Company include industry knowledge, experience from different fields of business and international business scene. In addition, varying educa-tional backgrounds, management experience from different business sectors and a varying age and gender structure have been identified as items promoting diversity. Metsä Board’s continuous target is to have both genders rep-resented at the Board. Further, diversity shall correspond to and support the Company’s then current development stage and respond to the Company’s and its business’ future development needs.
According to the Articles of Association, a minimum of five and a maximum of ten ordinary members shall be appointed to the Board of Directors by the shareholders at the Annual General Meeting for a one-year period at a time. The number of consecutive terms is not limited. At present, the Board has nine members. The Board appoints a Chairman and a Vice Chairman from among its mem-bers. The Annual General Meeting of 2016 appointed the following persons as members of the Board of Directors:– Mr Kari Jordan, born 1956, Chairman,
M.Sc. (Econ.), 800,000 B shares– Mr Martti Asunta, born 1955, Vice
Chairman, M.Sc. (For.), 53,744 B shares– Mr Mikael Aminoff, born 1951, M.Sc.
(For.), 63,020 B shares– Ms Kirsi Komi, born 1963, independent
member, L.L.M., 58,825 B shares– Mr Kai Korhonen, born 1951, independ-
ent member, M.Sc. (Eng.), eMBA, 195,595 B shares
– Ms Liisa Leino, born 1960, independent member, M.Sc. (Nutrition), 157,470 B shares
– Mr Juha Niemelä, born 1946, independent member, M.Sc. (Econ.), 157,470 B shares
– Mr Veli Sundbäck, born 1946, independ-ent member, L.L.M., 48,490 B shares
– Mr Erkki Varis, born 1948, independent member, M.Sc. (Eng.), 112,062 B shares
These ownerships include shares possibly owned by controlled entities. A majority of the members of the Board of Directors are independent of both the Company and its sig-nificant shareholders. As President and CEO of Metsä Group and as Managing Director of Metsäliitto Cooperative, Chairman Jordan is dependent on both the Company and its majority shareholder. Martti Asunta and Mikael Aminoff are members of the Board of Metsäliitto Cooperative and consequently not independent of a significant shareholder. Juha Niemelä has served on the Board for more than 10 consecutive years but is considered as independent based on the Board’s general evaluation.
The Board’s Nomination and Compensation committee proposes to the Annual General Meeting convened for March 23, 2017 that all current Board members except Aminoff be re-elected for a new term and that Mr Jussi Linnaranta be elected as a new member. Mr Linnaranta holds a M.Sc (Agriculture) degree and works as an agricul-ture and power entrepreneur. He is a member of the Board of Metsäliitto Cooperative and hence not independent of the Company’s significant shareholder. Further information on existing and proposed Board members is available on the Company’s website at (www.metsaboard.com > Investors > Corporate Governance).
BOARD COMMITTEES
Board committees provide, as necessary, assistance to the Board of Directors, preparing matters for which the Board is responsible. The Board of Directors has appointed an Audit Committee and a Nomination and Compensation Committee from among its members. Every year after the Annual General Meeting, the Board of Directors appoints each committee’s chairman and members. The Board of Directors and its committees can also seek assistance from external advisors.
Final decisions concerning matters related to the tasks of the committees are made by the Board of Directors on the basis of committee proposals, excluding proposals made directly to the General Meeting by the Nomination and Compensation Committee on board compensation and remuneration.
AUDIT COMMITTEE
The Audit Committee is responsible for assisting the Board of Directors in ensuring that the company’s financial reporting, calcu-lation methods, annual financial statements and other financial information made public by the Company are correct, balanced, trans-parent and clear. On a regular basis, the Audit Committee reviews the internal control and management systems and monitors the pro-gress of financial risk reporting and the audit-

CORPORATE GOVERNANCE STATEMENT 105
ing of the accounts. The Audit Committee assesses the efficiency and scope of internal auditing, the company’s risk management, key risk areas and compliance with applicable laws and regulations. The committee gives a recommendation to the Board concerning the appointment of auditors to the Company. The Audit Committee also processes the annual plan for internal auditing and the reports prepared on significant auditing.
The Audit Committee consists of four Board members who are independent of the Company and its significant shareholders. Since the Annual General Meeting of 2016, Kai Korhonen has been chairman of the Audit Committee with Kirsi Komi, Veli Sundbäck and Erkki Varis as members.
The committee members must have adequate expertise in accounting and financial statement policies. The Audit Committee convenes on a regular basis, at least four times a year, including meeting with the company’s auditor. The committee chairman provides the Board with a report on every meeting of the Audit Committee. The tasks and respon-sibility areas have been specified in the com-mittee’s working order which the Board has approved (www.metsaboard.com > Investors > Corporate Governance).
When necessary, the following persons are also represented in the Audit Committee meetings as summoned by the Committee: the auditor, Chief Executive Officer and Chief Financial Officer as well as other man-agement representatives and external advisors.
The Audit Committee convened four times during 2016 and the attendance rate of the members was 100 per cent (100 per cent also in 2015 and 2014).
NOMINATION AND COMPENSATION
COMMITTEE
The task of the Nomination and Compensation Committee is to assist the Board of Directors in matters related to the appointment and compensation of the company’s CEO, a possible Deputy CEO and the senior management and prepare matters related to the reward schemes for management
and employees. In addition, the Committee prepares for the Annual General Meeting a proposal on the number of Board members, Board composition and Board member com-pensation. The Committee also recommends, prepares and proposes to the Board the CEO’s (and a Deputy CEO’s) nomination, salary and compensation, and further evaluates and provides the Board and the CEO with recom-mendations concerning management rewards and compensation systems.
The Committee consists of five Board members. It convenes on a regular basis at least four times a year. The Committee chairman presents the proposals issued by the Committee to the Board. The tasks and responsibilities of the Nomination and Compensation committee have been specified in the committee’s working order, which the Board approves (www.metsaboard.com > Investors > Corporate Governance).
Since the Annual General Meeting of 2016, Kari Jordan has been chairman of the Nomination and Compensation Committee with Mikael Aminoff, Martti Asunta, Liisa Leino and Juha Niemelä as members.
The Nomination and Compensation Committee convened six times during 2016 and members Jordan, Asunta, Leino and Niemelä participated in all meetings while Aminoff participated in five meetings (the attendance rate of all members was 100 per cent in 2015 and 2014).
CHIEF EXECUTIVE OFFICER
Chief Executive Officer Mika Joukio, M.Sc.(Eng.), born 1964, is responsible for the daily management of the Company’s admin-istration according to the guidelines and instructions given by the Board. In addition, the CEO is responsible for ensuring that the Company’s accounting has been carried out according to applicable laws and that asset management has been organised in a reliable manner. The CEO manages the Company’s daily business and is responsible for control-ling and steering the business areas.
The CEO has a written CEO contract approved by the Board. The Board monitors
the CEO’s performance and provides a perfor-mance evaluation once a year. The contractual retirement age of the CEO is 62 years. The Company has commissioned an additional pension insurance policy for the CEO, covering the period between the contractual retirement and the statutory retirement age of 63 years and entitling the CEO to receive pension compensation equal to 60 per cent of his total salary calculated on the basis of the past five years’ salary preceding retirement. According to Finnish pension legislation, a person has the option to retire between the ages of 63 to 68.
The Board appoints and discharges the CEO. The Board can discharge the CEO without a specific reason. The CEO can also resign from his assignment. The mutual term of notice is six months. The Board may, how-ever, decide to discharge the CEO without a period of notice. When the service contract of the CEO is terminated by the Board, the CEO is entitled to receive discharge compen-sation equal to his 12-month salary.
DEPUTY TO THE CEO
The Board can at its discretion appoint a Deputy to the CEO. The Deputy to the CEO is responsible for carrying out the CEO’s tasks when the CEO is unable to perform his duties. For the time being no Deputy to the CEO has been appointed.
CORPORATE MANAGEMENT TEAM
In the operative management of Metsä Board, the CEO is assisted by the Corporate Management Team, which consists of Mika Joukio, CEO, together with function heads Ari Kiviranta (Production and Technology), Seppo Puotinen (Marketing and Sales), Jussi Noponen (Finance and Control), Sari Pajari (Business Development) and Susanna Tainio, (Human Resources), who are all reporting to the CEO.
Each Corporate Management Team member has a written employment or service contract. With the exception of the CEO members of the Corporate Management Team

106 CORPORATE GOVERNANCE STATEMENT
have no extraordinary pension arrangements which would deviate from applicable pension legislation. The term of notice of Corporate Management team members is six months.
The Corporate Management Team’s tasks and responsibilities include planning investments, specifying and preparing the Company’s strategic guidelines, allocating resources, controlling routine functions as well as preparing several matters to be reviewed by the Board. The Corporate Management Team convenes at the Chairman’s invitation once a month, as a rule, and also otherwise when necessary.
The Corporate Management Team mem-bers’ owned the Company’s shares at the end of the financial year 2016 were as follows:– Mika Joukio 186,348 B shares– Jussi Noponen 41,420 B shares– Ari Kiviranta 0 shares– Sari Pajari 31,826 B shares– Seppo Puotinen 84,000 B shares
and 2,000 A shares– Susanna Tainio 11,495 B shares
Possible controlled entities of management team members do not hold shares in the Company.
INTERNAL CONTROL, INTERNAL AUDITING AND
RISK MANAGEMENT
Profitable business requires that operations are monitored continuously and with adequate efficiency. Metsä Board’s internal management and control procedure is based on the Finnish Companies Act, regulations and recommen-dations for listed companies, the Articles of Association and the company’s own approved principles and policies. The functionality of the company’s internal control is evaluated by the company’s internal auditing. Internal control is carried out throughout the organi-sation. Internal control methods include internal guidelines and reporting systems. The following describes the principles, objectives and responsibilities of Metsä Board’s internal control, risk management and internal auditing.
INTERNAL CONTROL
Being a listed company, Metsä Board’s internal control is steered by the Finnish Companies Act and the Securities Market Act, other laws and regulations applicable to the opera-tions and the rules and recommendations of the Helsinki Stock Exchange, including the Corporate Governance Code. External control is carried out by Metsä Board’s auditor and the authorities.
In Metsä Board, internal control covers financial reporting and other monitoring. Internal control is implemented by the Board and operative management as well as the entire personnel. Internal control aims to ensure achieving the goals and objectives set for the company; economical, appropriate and efficient use of resources; correct and reliable financial information and other management information; adherence to external regulations and internal policies; security of operations, information and property in an adequate manner; and the arrangement of adequate and suitable manual and IT systems to support operations.
Internal control is divided into (i) proac-tive control, such as the specification of cor-porate values, general operational and business principles; (ii) daily control, such as opera-tional systems and work instructions related to operational steering and monitoring; and (iii) subsequent control, such as management evaluations and inspections, comparisons and verifications with the aim of ensuring that the goals are met and that the agreed operational and control principles are followed. The cor-porate culture, governance and the approach to control together create the basis for the entire process of internal control.
MONITORING OF THE FINANCIAL REPORTING
PROCESS, CREDIT CONTROL AND
AUTHORISATION RIGHTS
The financial organisations of the functions and the central administration are responsible for financial reporting. The units and func-tions report the financial figures each month. The functions’ control functions check their units’ monthly performance and report them
further to central administration. Functions’ profitability development and business risks and opportunities are discussed in monthly meetings attended by senior management of the Company and of the function in ques-tion. The result will be reported to the Board and the Corporate Management Team each month. The Board presents the Financial Statements to the Annual General Meeting for approval, approves the financial statement bulletin and quarterly reports and decides on their publication. The Company’s internal guidelines provide detailed descriptions on the reporting and control rules and the report-ing procedure.
Credit control in Metsä Board has been centralised under a Credit Committee, which convenes at least each quarter. The develop-ment of trade receivables is monitored in each sales company by credit controllers under the supervision of the Group VP of Credits. Counterparty-specific credit limits are set within the boundaries of the credit policy confirmed by the Board in cooperation with centralised credit control and business area management. The development of credit risks is reported to the Board on a regular basis.
Authorisation rights concerning expenses, significant contracts and investments have been specified continuously for different organisation levels according to the decision-making authority policy confirmed by the Board and the authority separately granted by the CEO and other management personnel. Investment follow-up is carried out by the Group’s financial administration according to the investment policy confirmed by the Board. After pre-approval, investments are taken to the management teams of the business areas and the Corporate Management Team within the framework of the annual investment plan. Most significant investments are separately submitted for Board approval. Investment follow-up reports are compiled each quarter.
INTERNAL AUDITING
Internal auditing assists the Board and CEO with their control tasks by evaluating the qual-

CORPORATE GOVERNANCE STATEMENT 107
ity of internal control maintained in order to achieve the Company’s objectives. In addition, internal auditing supports the organisation by evaluating and ensuring the functionality of business processes, risk management and the management and administration systems.
The key task of internal auditing is to assess the efficiency and suitability of internal control concerning the company’s functions and units. In its assignment, internal auditing evaluates how well the operational principles, guidelines and reporting systems are adhered to, how property is protected and how effi-ciently resources are used. Internal auditing also acts as an expert in development projects related to its task area and prepares special reports at the request of the Audit Committee or operative management.
Internal auditing operates under the supervision of the Audit Committee and the CEO. Audit observations, recommendations and the progress of measures are reported to the management of the target audited, the company management and the auditor. Every six months, internal auditing reports its auditing measures, plans and operations to the Audit Committee. Internal auditing applies in its tasks a working order approved by the Board of Directors.
The action plan of internal auditing is prepared for one calendar year at a time. The aim is to allocate the auditing to all functions and units at certain intervals. Auditing is annually allocated to areas that are in a key position regarding the evaluated risk and the company’s objectives at the time. The topical-ity and appropriateness of the action plan are processed with the Company’s management every six months.
The scope and coordination of the audit-ing operations are ensured through regular communication and information exchange with other internal assurance functions and the auditor. When necessary, internal auditing uses external service providers for temporary additional resourcing or special expertise for carrying out demanding evaluation tasks.
RISK MANAGEMENT
Risk management is an essential part of Metsä Board’s standard business planning and leadership. Risk management belongs to daily decision-making, operations follow-up and internal control, and it promotes and ensures that the objectives set by the Company are met.
Linking business management efficiently with risk management is based on the opera-tional principles confirmed by the Board; the aim of the principles is to maintain risk management as a process that is well defined, understandable and sufficiently practical. Risks and their development are reported on a regular basis to the Board’s Audit Committee. Centralised risk management also takes care of the coordination and competitive bidding of Metsä Board’s insurance coverage.
The most crucial objective of risk manage-ment is to identify and evaluate those risks, threats and opportunities which may have an impact on the implementation of the strategy and on how short-term and long-term objec-tives are met. A separate risk review is also included in the most significant investment proposals. The businesses regularly evaluate and monitor the risk environment and related changes as part of their normal operational planning. The risks identified and their control is reported to the company’s manage-ment, Audit Committee and the Board at least twice a year. Business risks also involve opportunities, and they can be utilised within the boundaries of the agreed risk limits. Conscious risk-taking decisions must always be based on an adequate evaluation of the risk-bearing capacity and the profit/loss potential, among other things.
Risk management responsibilities in Metsä Board are divided among different functions. The Board is responsible for the Company’s risk management and approves the Company’s risk management policy; the Audit Committee evaluates the levels and proce-dures of the Company’s risk management and the essential risk areas and provides the Board with related proposals. The CEO and the Management Team are responsible for the
specification and adoption of the risk manage-ment principles. They are also responsible for ensuring that the risks are taken into account in the company’s planning processes and that risk reporting is adequate and appropriate. The Vice President of Risk Management reports to the CFO and is responsible for the Company’s risk management process develop-ment, coordination, the implementation of risk evaluation and the essential insurance decisions. Businesses and support functions identify and evaluate the essential risks related to their own areas of responsibility in their planning processes, prepare for them, take necessary preventive action and report on the risks as agreed.
Metsä Board’s essential risk management elements include implementing a comprehen-sive corporate risk management process that supports the entire business, protecting prop-erty and ensuring business continuity, corpo-rate security and its continuous development, as well as crisis management and continuity and recovery plans. According to the risk management policy and principles, adequate risk management forms a necessary part of the preliminary review and implementation stages of projects which are financially or otherwise significant.
The tasks of Metsä Board’s risk manage-ment are to:• ensure that all identified risks with an
impact on personnel, customers, products, property, information assets, corporate image, corporate responsibility and opera-tional capacity are controlled according to applicable laws and on the basis of best available information and financial aspects
• ensure that the company’s objectives are met
• fulfil the expectations of stakeholders• protect property and ensure disruption-
free business continuity• optimise the profit/loss possibility ratio• ensure the management of the company’s
overall risk exposure and minimise the overall risks.

108 CORPORATE GOVERNANCE STATEMENT
The most significant risks and uncertainties that the company is aware of are described in the Report of the Board of Directors.
AUDITING
According to Metsä Board’s Articles of Association, the Company has one auditor who shall be an auditing firm authorised by the Central Chamber of Commerce of Finland. The General Meeting appoints the auditor each year. The Audit Committee together with the Audit Committee of the parent entity Metsäliitto Cooperative arranged in 2011 a tender for the audit-ing services. As a result of the tender-ing, the Company’s long-term auditor Pricewaterhouse Coopers Oy was changed to KPMG Oy Ab. Pursuant to the decision of the Annual General Meeting of 2016, KPMG Oy Ab acts as the Company’s auditor and has appointed Raija-Leena Hankonen, APA, as the auditor with main responsibility. The Audit committee controls the appoint-ment procedure of the auditors and provides the Board and the General Meeting with a recommendation for the appointment of the auditor.
In 2016, KPMG Oy Ab received EUR 227,242 (229,742 in 2015 and 222,690 in 2014) in auditing compensation, KPMG internationally received altogether EUR 425,333 (EUR 407,883 in 2015 and 447,954 in 2014) and other auditing firms outside Finland were paid EUR 15,150 (EUR 42,321 in 2015 and EUR 50,344 in 2014). In addi-tion, KPMG has received EUR 3,864 (EUR 10,554 in 2016 and EUR 9,113 in 2014) for services not related to the actual auditing of the accounts.
INSIDER ADMINISTRATION
Metsä Board group complies in insider matters with Finnish laws, namely the Securities Markets Act, the Regulation N:o 596/2014 by the European Parliament and
the Commission on market abuse (MAR) and supporting orders and regulations as well as the insider guidelines of NASDAQ OMX Helsinki Ltd. (Helsinki Stock Exchange) (http://business.nasdaq.com/list/Rules-and-Regulations/European-rules/nasdaq-helsinki). The Board has based on the above rules approved the Company’s own insider guidelines.
Pursuant to MAR Article 14 and Chapter 51 of the Penal Code, a person who possesses inside information shall not (i) engage or attempt to engage in insider dealing by acquir-ing or transferring financial instruments in his own name or on behalf of a third party, (ii) recommend that another person engage in insider dealing or induce another person to engage in insider dealing, (iii) unlawfully disclose inside information to another person, unless such disclosure is made as part of car-rying out normal work duties. The purpose of insider management is to enable a transparent ownership of the Company’s securities by the Company’s insiders, while simultaneously maintaining public trust in the trading with the Company’s securities and their price formation. The Company only recommends long-term investments. Insiders are being trained and guided on a regular basis.
Following the MAR becoming effective on 3 July 2017, the Company no longer has a register of public insiders and the Company no longer maintains a permanent company-specific insider register. The Company shall, when required and by decision of the Chairman of the Board of Directors, set up a project-specific insider register to cover all persons who are involved in the prepara-tion of a specific project containing insider information.
The Company’s managers with a duty to notify include members of the Board of Directors and the CEO. The holdings of such managers and their related parties is public. Each of them have an individual duty vis-à-vis the Company and the competent supervisory authority to notify all transactions
executed with the shares and other financial instruments of Metsä Board. Metsä Board will publish all such notifications by means of a stock exchange release.
Trading in the Company’s shares and other financial instruments is prohibited during a period starting at the end of each reporting period and lasting until the results release has been published (always at minimum 30 days; “closed window”). This prohibition applies not only to managers with a duty to notify but also to such other persons specified by the Company who participate in the preparation of financial reports.
RELATED PARTY TRANSACTIONS
The Company’s business activities include contractual relationships with the parent entity Metsäliitto Cooperative and affili-ated companies Metsä Fibre Oy and Metsä Tissue Oyj. In situations where the Board of Directors addresses a business relationship or other contractual relationship or connection to Metsäliitto Cooperative or the Company’s affiliated companies, the Board of Directors shall, if necessary, act without those of its members who are dependent on Metsäliitto Cooperative or the relevant affiliated company.
To assess the independence and impartial-ity of the members of the Board of Directors, the members shall notify the Company of circumstances that may have an impact on the member’s ability to act without conflict of interest.
On 31 December 2016, neither the Board members, nor the Company’s CEO or the Corporate Management Team members had monetary loans from the Company or its subsidiaries. No security arrangements or significant business relations existed between these persons (including their related parties as defined in IFRS) and the Company during 2016.

SALARY AND REMUNERATION REPORT 109
SALARY AND REMUNERATION REPORT
This salary and remuneration report of Metsä Board Corporation (Metsä Board or the Company) has been issued pursuant to recommendations concerning reporting of the Finnish Corporate Governance Code of 2015. The description on remuneration principles and decision-making is updated on a regular basis, two times every calendar year as a start-ing point, however, always in connection with the annual Corporate Governance Statement. A report regarding the fees paid out during the previous financial year is also published concurrently.
DECISION-MAKING ORDER AND PRINCIPLES OF
REMUNERATION
GENERAL
The purpose of the management’s compensa-tion system is to compensate management in a fair and competitive way for a successful and profitable implementation of the Company’s strategy. The objective of remuneration is also to encourage management in the development of the Company’s strategy and business to thereby act for the benefit the Company in the long run. The Board approves the forms and basis of compensation and incentive systems as well as the measures and targets applied. The Board’s Nomination and Compensation Committee assists the Board in matters relating to management remuneration, conditions of employment and engagement of management members as well as prepares Board decisions relating to management remuneration.
The Company currently uses a short-term bonus scheme for management and personnel as well as a long-term share based compensation scheme for management and key employees.
BOARD OF DIRECTORS
The Annual General Meeting of the Company decides on the remuneration of the Board of Directors. The Nomination and Compensation Committee presents the General Meeting with proposals for remu-neration of the Board of Directors, taking into account the Company’s financial standing at a given time and, among other things, remu-neration guidelines in other comparable com-
panies. The Committee consults, if necessary, the majority shareholder, who has the decisive vote at the General Meeting as regards Board remuneration.
CHIEF EXECUTIVE OFFICER
The Board of Directors in turn appoints and discharges the CEO and approves his salary and compensation. The Board can discharge the CEO without a specific reason. The CEO can also resign from his assignment. The mutual term of notice is six months. The Board may, however, decide to discharge the CEO without a period of notice. When the service contract of the CEO is terminated by the Board, the CEO is entitled to receive dis-charge compensation equal to his 12-month salary. The Board may, in accordance with the CEO’s service contract, decide that the CEO annually receives bonus pay based on his overall performance and corresponding to a maximum of his seven (7) month salary.
The contractual retirement age of the CEO is 62 years. The Company has commis-sioned an extra pension insurance policy for the CEO, covering the period between the contractual and statutory retirement age of 63 years. The policy entitles the CEO to receive pension compensation equal to 60 per cent of his salary at the time of retirement (calculated in accordance with Finnish pension laws) on the basis of a five-year-period preceding the moment of retirement. Pursuant to Finnish pension laws a person has the option to retire at a desired point-in-time between the ages of 63 and 68. The cost of the policy in 2016 was 279,858 euros (207,794 euros in 2015).
CORPORATE MANAGEMENT TEAM
The CEO decides on the compensation of other Corporate Management Team members in cooperation with the Board Chairman and in accordance with the principles approved and guidelines given by the Board.
Also other Corporate Management Team members have written employment contracts. The period of notice of Corporate Management Team members is six months. Termination of employment without cause entitles members of the Corporate
Management Team to receive discharge com-pensation equal to their 0 to 12-month salary.
Excluding the CEO, Corporate Management Team members have no extraor-dinary pension arrangements which would deviate from applicable pension legislation. Pursuant to Finnish pension laws a person has the option to retire at a desired point-in-time between the ages of 63 and 68. The Finnish TyEL pension system provides for a retire-ment benefit based on years of service and earnings according to the prescribed statutory system. For purposes of the Finnish pension system earnings include salary, bonuses and fringe benefits but exclude share or stock option based income.
LONG-TERM SHARE INCENTIVE SCHEME
In December 2010, the Board of Directors approved a share-based incentive plan. The aim of the plan is to combine the objectives of shareholders and executives in order to increase the value of the company, to commit the executives to perform the mutual strategy, and to offer them a competitive reward plan based on share ownership. The plan consists of three consecutive three-year earnings periods, namely calendar years 2011–2013, 2012–2014 and 2013–2015. At the begin-ning of each period, the Board of Directors decided on the earnings criteria and defined performance targets. The potential reward from the plan for each of the earnings periods was based on Metsä Board Group’s equity ratio at the end of the period as well as the development of return on capital employed (ROCE) and earnings before interest and taxes (EBIT) during each earnings period. Each earnings period is followed by a two-year restriction period during which a participant is not entitled to transfer or dispose of the shares. In addition, a cash proportion is included in the reward to cover taxes and tax-related costs arising from the reward. At the start of the first earnings period the system covered nine persons, including all manage-ment team members.
The Board decided in December 2013 to continue the share-based incentive scheme for management. The plan consists of three new three-year earnings periods, namely calendar years 2014–2016, 2015–2017
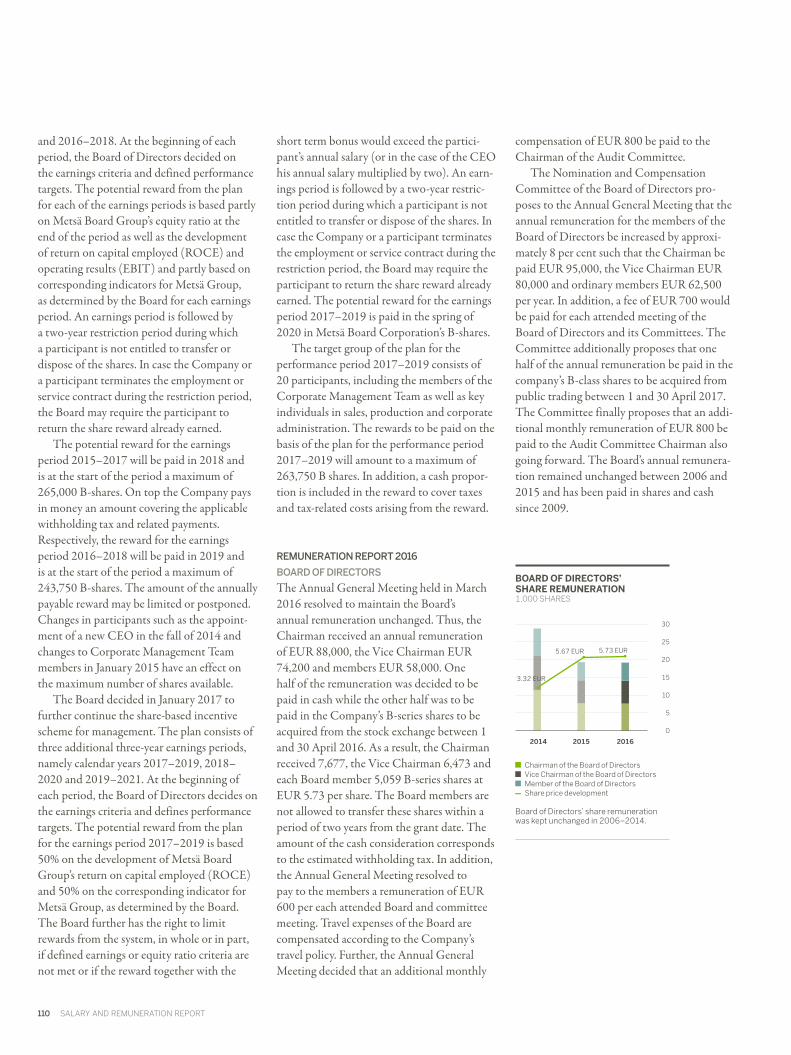
110 SALARY AND REMUNERATION REPORT
and 2016–2018. At the beginning of each period, the Board of Directors decided on the earnings criteria and defined performance targets. The potential reward from the plan for each of the earnings periods is based partly on Metsä Board Group’s equity ratio at the end of the period as well as the development of return on capital employed (ROCE) and operating results (EBIT) and partly based on corresponding indicators for Metsä Group, as determined by the Board for each earnings period. An earnings period is followed by a two-year restriction period during which a participant is not entitled to transfer or dispose of the shares. In case the Company or a participant terminates the employment or service contract during the restriction period, the Board may require the participant to return the share reward already earned.
The potential reward for the earnings period 2015–2017 will be paid in 2018 and is at the start of the period a maximum of 265,000 B-shares. On top the Company pays in money an amount covering the applicable withholding tax and related payments. Respectively, the reward for the earnings period 2016–2018 will be paid in 2019 and is at the start of the period a maximum of 243,750 B-shares. The amount of the annually payable reward may be limited or postponed. Changes in participants such as the appoint-ment of a new CEO in the fall of 2014 and changes to Corporate Management Team members in January 2015 have an effect on the maximum number of shares available.
The Board decided in January 2017 to further continue the share-based incentive scheme for management. The plan consists of three additional three-year earnings periods, namely calendar years 2017–2019, 2018–2020 and 2019–2021. At the beginning of each period, the Board of Directors decides on the earnings criteria and defines performance targets. The potential reward from the plan for the earnings period 2017–2019 is based 50% on the development of Metsä Board Group’s return on capital employed (ROCE) and 50% on the corresponding indicator for Metsä Group, as determined by the Board. The Board further has the right to limit rewards from the system, in whole or in part, if defined earnings or equity ratio criteria are not met or if the reward together with the
short term bonus would exceed the partici-pant’s annual salary (or in the case of the CEO his annual salary multiplied by two). An earn-ings period is followed by a two-year restric-tion period during which a participant is not entitled to transfer or dispose of the shares. In case the Company or a participant terminates the employment or service contract during the restriction period, the Board may require the participant to return the share reward already earned. The potential reward for the earnings period 2017–2019 is paid in the spring of 2020 in Metsä Board Corporation’s B-shares.
The target group of the plan for the performance period 2017–2019 consists of 20 participants, including the members of the Corporate Management Team as well as key individuals in sales, production and corporate administration. The rewards to be paid on the basis of the plan for the performance period 2017–2019 will amount to a maximum of 263,750 B shares. In addition, a cash propor-tion is included in the reward to cover taxes and tax-related costs arising from the reward.
REMUNERATION REPORT 2016
BOARD OF DIRECTORS
The Annual General Meeting held in March 2016 resolved to maintain the Board’s annual remuneration unchanged. Thus, the Chairman received an annual remuneration of EUR 88,000, the Vice Chairman EUR 74,200 and members EUR 58,000. One half of the remuneration was decided to be paid in cash while the other half was to be paid in the Company’s B-series shares to be acquired from the stock exchange between 1 and 30 April 2016. As a result, the Chairman received 7,677, the Vice Chairman 6,473 and each Board member 5,059 B-series shares at EUR 5.73 per share. The Board members are not allowed to transfer these shares within a period of two years from the grant date. The amount of the cash consideration corresponds to the estimated withholding tax. In addition, the Annual General Meeting resolved to pay to the members a remuneration of EUR 600 per each attended Board and committee meeting. Travel expenses of the Board are compensated according to the Company’s travel policy. Further, the Annual General Meeting decided that an additional monthly
compensation of EUR 800 be paid to the Chairman of the Audit Committee.
The Nomination and Compensation Committee of the Board of Directors pro-poses to the Annual General Meeting that the annual remuneration for the members of the Board of Directors be increased by approxi-mately 8 per cent such that the Chairman be paid EUR 95,000, the Vice Chairman EUR 80,000 and ordinary members EUR 62,500 per year. In addition, a fee of EUR 700 would be paid for each attended meeting of the Board of Directors and its Committees. The Committee additionally proposes that one half of the annual remuneration be paid in the company’s B-class shares to be acquired from public trading between 1 and 30 April 2017. The Committee finally proposes that an addi-tional monthly remuneration of EUR 800 be paid to the Audit Committee Chairman also going forward. The Board’s annual remunera-tion remained unchanged between 2006 and 2015 and has been paid in shares and cash since 2009.
30
25
20
15
10
5
0
BOARD OF DIRECTORS’ SHARE REMUNERATION1,000 SHARES
2014 2015 2016
Chairman of the Board of Directors Vice Chairman of the Board of Directors Member of the Board of Directors Share price development
Board of Directors’ share remuneration was kept unchanged in 2006–2014.
5.67 EUR 5.73 EUR
3.32 EUR

SALARY AND REMUNERATION REPORT 111
CHIEF EXECUTIVE OFFICER
The monthly salary of CEO Mika Joukio is EUR 40,277. The salary includes car and mobile phone benefits and an extended travel and accident insurance policy. In 2016 the CEO Joukio received a total of EUR 1,173,860 in salary, bonuses and other benefits, including share incentive (EUR 693,140 in 2015 and for CEO Helander EUR 894,616 in 2014), of which EUR 498,301 (EUR 469,711 in 2015 and Helander EUR 444,183 in 2014) was fixed compensation and EUR 229,849 (EUR 165,319 and Helander EUR 130,383 in 2014) was short-term bonus pay and EUR 445,711 (EUR 58,109 and Helander EUR 320,050 in 2014) share incen-tives. CEO Joukio received EUR 116,262 in fixed compensation in the period between October 1 and December 31, 2014.
CORPORATE MANAGEMENT TEAM
In 2016, other Corporate Management Team members (in total five) received a total of EUR 2,460,712 (EUR 1,889,873 in 2015 and EUR 1,578,817 in 2014) in salary and bonuses of which EUR 1,093,384 (EUR 1,154,996 in 2015 and EUR 1,156,109 in 2014) were fixed salaries and benefits (car and mobile phone) and EUR 439,657 (EUR 454,030 in 2015 and EUR 180,484 in 2014) short-term bonus pay and EUR 927,671 (EUR 280,846 in 2015 and EUR 242,224 in 2014) share incentives. The members of the Corporate Management Team are entitled to bonus pay corresponding to a maximum of their respective 6-month salaries. The bonus pay is defined and decided by the Board and the CEO and was in the financial years 2014–2016 based on the Company’s and its functions’ (business area heads) revenue and other targets, and on personal targets.
LONG-TERM SHARE-BASED COMPENSATION
The Board confirmed in January 2014 that the result for the earnings period 2011–2013 was 45 per cent, based on which 125,750 B-series shares were paid to participants in the spring of 2014 at the rate of EUR 3.26. Similarly the Board confirmed in February 2015 that the result for the earnings period 2011–2013 was 33.5 per cent, based on which 62,533 B-series shares were paid to partici-pants in February 2015 at the rate of EUR 5.90. CEO Helander was not entitled to any shares since his service relationship with the Company ended during the earnings period. Mr Joukio was entitled to 4,653 shares for the time period August 1 through December 31, 2014. The Board of Directors confirmed in February 2016 that the result for the earnings period 2013–2015 was 74.4 per cent, based on which a total of 160,074 B-series shares were paid to participants in spring 2016. Of these 36,187 were paid to CEO Joukio.
The Board confirmed in February 2017 that the result for the earnings period 2015–2016 was 111.6 per cent (taking into account the revenue multiplier, which increased the result outcome), pursuant to which partici-pants earned in total 259,162 shares, of which 92,598 were earned by CEO Joukio. In addi-tion, there is a cash proportion covering taxes and other tax-related costs.
1,200
1,000
8 00
600
400
200
0
50
40
30
20
10
0
SHARE REMUNERATION OF THE CEO1,000 SHARES
20141) 2015 2016
Osakepalkkiot Osakkeen kurssikehitys
1) Change of CEO in 2014
3.26 EUR
5.90 EUR 5.82 EUR
COMPENSATION OF THE CEO1,000 EUR
20141) 2015 2016
Fixed compensation Bonus pay Share incentive
1) Change of CEO in 2014

KARI JORDANb. 1956M.Sc. (Econ)Vuorineuvos (Finnish honorary title)
MARTTI ASUNTAb. 1955M.Sc. (Forestry)Metsäneuvos (Finnish honorary title)
MIKAEL AMINOFFb. 1951M.Sc. (Forestry)Agriculture and Forestry entrepreneur
KIRSI KOMIb. 1963LL.M., Master of Laws
KAI KORHONENb. 1951M.Sc. (Eng), eMBA
112 METSÄ BOARD CORPORATION’S BOARD OF DIRECTORS
METSÄ BOARD CORPORATION’S BOARD OF DIRECTORS
Chairman of the Board since 2005
Metsä Group, President and CEO (2006–)Metsäliitto Cooperative, CEO (2004–), vice chairman of the Board (2005–)Metsä Tissue Corporation, chairman of the Board (2004–)Metsä Fibre Oy, member of the Board (2004–), chairman of the Board (2006–)Central Chamber of Commerce, member of the Board (2007–2011), chairman of the Board (2012–2016)Confederation of Finnish Industries (EK), member of the Board (2005–2016), vice chairman of the Board (2009–2011 and 2013–2014), member of the Executive Committee (2015–2016)Finnish Forest Industries Federation, chairman of the Board and the Federation’s Working Group (2009–2011), vice chairman of the Board and the Federation’s Working Group (2005–2009, 2014–), member of the Board (2012–2013)Varma Mutual Pension Insurance Company, member of the Supervisory Board (2006–2012), vice chairman of the Board (2013), chairman of the Board (2014), chairman of the Supervisory Board (2015–)Holds several positions of trust in foundations and non-profit associations.Shares owned in Metsä Board Corporation 31 Dec 2016: 800,000 B shares
Member and vice chairman of the Board since 2008
Metsäliitto Cooperative, chairman of the Board (2008–)Metsä Fibre Oy, member of the Board (2008–)Metsä Tissue Corporation, member of the Board (2008–)Pellervo-Seura, member of the Board (2008–), chairman of the Board (2010–)Pellervo-Media Oy, chairman of the Board (2013–)Finnish Agri-Agency for Food and Forest Development, member of the Board (2012–)Cooperative Council of Finland, chairman (2013–)Shares owned in Metsä Board Corporation 31 Dec 2016: 53,744 B shares
Member of the Board since 2010
Metsäliitto Cooperative, member of the Supervisory Board (2001–), member of the Board (2008–)Shares owned in Metsä Board Corporation 31 Dec 2016: 63,020 B shares
Member of the Board since 2010
Independent Board memberVeikkaus Oy, chairman of the Board (2016)Bittium Oyj, member of the Board (2015–)Martela Corporation, member of the Board (2013–)Finnvera Oyj, member of the Board (2013–)Patria Plc, vice chairman of the Board (2011–2016)Citycon Oyj, member of the Board (2011–)Docrates Oy, chairman of the Board (2011–)Finnish Red Cross Blood Service, member of the Board (2010–), chairman of the Board (2011–)Nokia Siemens Networks, General Counsel, Member of the Executive Board (2007–2010)Nokia Corporation, Vice President, Legal, Networks Business Group Leadership Team (1999–2007)Nokia Corporation, Legal Counsel (1992–1999)Shares owned in Metsä Board Corporation 31 Dec 2016: 58,825 B shares
Member of the Board since 2008
Independent Board memberStora Enso Oyj, Senior Executive Vice President (1998–2007)Ilmarinen Mutual Pension Insurance Company, member of the Supervisory Board (2006–2008)Finnish Forest Industries Federation, vice chairman of the Board (2006–2007)American Forest & Paper Association, member of the Board (2000–2003)German Pulp and Paper Association, member of the Board (1995–2000)Shares owned in Metsä Board Corporation 31 Dec 2016: 195,595 B shares

LIISA LEINOb. 1960M.Sc. (Nutrition)Teollisuusneuvos (Finnish honorary title)
JUHA NIEMELÄb. 1946M.Sc. (Econ)Doctor of Sciences in Economics and Technology h.c.Vuorineuvos (Finnish honorary title)
VELI SUNDBÄCKb. 1946LL.M., Master of LawsAmbassador
ERKKI VARISb. 1948M.Sc. (Eng)
METSÄ BOARD CORPORATION’S BOARD OF DIRECTORS 113
Member of the Board since 2009
Independent Board memberLeino Group Ltd., full-time chairman of the Board (2006–), CEO (2011–)Confederation of Finnish Industries (EK), member of the Board (2011–2012)The Federation of Finnish Technology Industries, member of the Board (2011–2016)Varma Mutual Pension Insurance Company, deputy member of the Board (2011–)Rautaruukki Corporation, member of the Board (2007–2014)Alko Oy, member of the Board (2009–2011)Finnish Business and Policy Forum (EVA), member of the Supervisory Board (2010–2016)Elomatic Oy, member of the Board (2011–)Cadmatic Oy, member of the Board (2015–)Shares owned in Metsä Board Corporation 31 Dec 2016: 157,470 B shares
Member of the Board since 2007
Independent Board memberUPM-Kymmene Corporation, CEO (1996–2004)MeritaNordbanken Plc, member of the Board (1998–1999)Veikkaus Oy, chairman of the Board (2001–2011)Powerflute Oyj, member of the Board (2005–2013)Green Resources AS, member of the Board and chairman of the Board (2009–2015)Shares owned in Metsä Board Corporation 31 Dec 2016: 157,470 B shares
Member of the Board since 2013
Independent Board memberNokia Corporation, member of the Executive Board, Executive Vice President, Corporate Relations and Responsibility (1996–2008)Ministry for Foreign Affairs, Secretary of State (1993–1996), various positions in the Ministry for Foreign Affairs, diplomatic offices in Brussels and Geneva (1969–1993)Vaaka Partners, chairman of the Board (2010–)IYF, member of the Board (2009–2014)Finnair Plc, member of the Board (2004–2012)Huhtamäki Oyj, chairman of the Board (1999–2005)Confederation of Finnish Industries (EK), member of the Board (2004–2008)The Federation of Finnish Technology Industries, member and vice chairman of the Board (2004–2007)Shares owned in Metsä Board Corporation 31 Dec 2016: 48,490 B shares
Member of the Board since 2009
Independent Board memberPohjolan Voima Oy, member of the Board (2000–2009)Botnia SA, (Uruguay), chairman of the Board (2005–2008)Laatukeskus Excellence Finland Oy, chairman of the Board (2003–2006)Keskinäinen Eläkevakuutusyhtiö Ilmarinen, member of the Supervisory Board (1997–2008)Sunila Oy, member of the Board (1997–2004)Oy Metsä-Botnia Ab, President and CEO (1997–2008)Metsäliitto Group, member of the Executive Management Team (2002–2008)Oy Metsä-Rauma Ab, Managing Director (1994–1996)Oy Metsä-Botnia Ab, Deputy to CEO (1990–1994)Shares owned in Metsä Board Corporation 31 Dec 2016: 112,062 B shares

114 METSÄ BOARD CORPORATION’S CORPORATE MANAGEMENT TEAM
METSÄ BOARD CORPORATION’S CORPORATE MANAGEMENT TEAM
Worked in Metsä Board in 1990–2012 and joined the company again in 2014. Chairman of the Corporate Management Team as of 1 Oct 2014.
Metsä Board Corporation, CEO (2014 –)Metsä Tissue Corporation, CEO (2012–2014)M-real Corporation (present Metsä Board), Head of Consumer Packaging (2006–2012) M-real Corporation, Vice President and Mill Manager, M-real Kyro and M-real Tako (2006) M-real Corporation, Vice President and Mill Manager, M-real Kyro (2005–2006) M-real Corporation, Senior Vice President, Corporate Logistics and Supply Chain (2004–2005) M-real Corporation, Vice President and Mill Manager, M-real Äänekoski (2001–2004) Various positions in management tasks at Metsä-Serla Corporation (present Metsä Board) and M-real Corporation since 1990 Shares owned in Metsä Board Corporation 31 Dec 2016: 186,348 B shares
Joined Metsä Group in 2000. Member of Metsä Board Corporate Management Team since 2016.
Metsä Board Corporation, Chief Financial Officer (2016–)Metsä Group, Senior Vice President, Group Finance (2009–2016)M-real Corporation (present Metsä Board), Senior Vice President, Business Control, Graphic Papers (2008)M-real Corporation, Vice President, Group Business Control (2006–2008)M-real Corporation, Business Controller, Folding Cartons (2003–2006)Nokia Corporation (1999-2000) and Metsä Group (2000–2003), SAP system implementation projects in financeShares owned in Metsä Board Corporation 31 Dec 2016: 41,420 B shares
Worked in Metsä-Serla (present Metsä Board) in 1993–1995 and joined the company again in 1999. Member of the Corporate Management Team since 2014.
Metsä Board Corporation, Senior Vice President, Production and Technology (2015–)Metsä Board Corporation, Senior Vice President, Head of Cartonboard business area (2014)Metsä Board Zanders GmbH, Managing Director and Vice President, Mill Manager (2012–2013)M-real Corporation (present Metsä Board), Vice President, R&D, Consumer Packaging business area (2008–2012) and mill manager, M-real Kyro and M-real Tako (2009–2010)M-real Zanders GmbH, Head of Production (2004– 2008)M-real Corporation, Vice President, R&D (2001–2004)Metsä-Serla Corporation (present Metsä Board), Manager, Process Development (1999–2001)Valmet Corporation, Manager, Product Development (1997–1999)Valmet Corporation, USA, Manager, R&D (1995–1997)Metsä-Serla Paper and Board Ltd. (present Metsä Board), Development Manager (1993–1995)Shares owned in Metsä Board Corporation 31 Dec 2016: no ownership
Joined Metsä Group in 2007 and Metsä Board in 2011. Member of the Corporate Management Team since 2011.
Metsä Board Corporation, Senior Vice President, Business Development (2011–)Tieto Corporation, member of the Board (2012–)Metsäliitto Group (present Metsä Group), CIO, Senior Vice President (2009–2011)Metsäliitto Group, Director, Group ICT (2007–2009)IBM Corporation, Principal Consultant and Business Development Executive (2002–2007)PwC Management Consulting, Principal Consultant (2000–2002)Jaakko Pöyry Consulting, various positions (Consultant, Senior Consultant, Vice President) in Finland and USA (1990–2000)Shares owned in Metsä Board Corporation 31 Dec 2016: 31,826 B shares
MIKA JOUKIOb.1964 M.Sc. (Tech), MBA Chief Executive Officer
JUSSI NOPONENb. 1975M.Sc. (Tech)Chief Financial Officer
ARI KIVIRANTAb. 1963D.Sc. (Tech)Senior Vice President, Production and Technology
SARI PAJARIb. 1968M.Sc. (Tech)Senior Vice President, Business Development

METSÄ BOARD CORPORATION’S CORPORATE MANAGEMENT TEAM 115
Worked in Metsä-Serla (present Metsä Board) in 1986–2000 and joined the company again in 2004. Member of the Corporate Management Team since 2005.
Metsä Board Corporation, Senior Vice President, Marketing and Sales (2015–)Metsä Board Corporation, Senior Vice President, Head of Linerboard and Paper business area (2014) and Vice President and Mill Manager, Metsä Board Husum (2009–2014)Metsä Board Corporation, Senior Vice President, Head of Paper and Pulp business area (2005–2013) and Vice President and Mill Manager, Metsä Board Husum (2009–2014)M-real Corporation (present Metsä Board), Executive Vice President, Corporate Strategy & Sales Services (2004–2005)SCA, President, Containerboard Division (2002–2004)SCA Packaging Finland Oy, Managing Director, Finland, Russia and the Baltic countries (2000–2002)Metsä-Serla Corporation (present Metsä Board), various positions in business development, marketing and operational responsibility: i.e. Vice President, Cartons Division, Corrugated and Folding Carton operations (1986–1999)Shares owned in Metsä Board Corporation 31 Dec 2016: 2,000 A shares; 84,000 B shares
Joined Metsä Board in 2011. Member of the Corporate Management Team since 2015.
Metsä Board Corporation, Senior Vice President, Human Resources (2015–)Metsä Board Corporation, Vice President, Human Resources (2012–2014)Metsä Board Corporation, Vice President, Human Resources, Paperboard business area, and Group HRD Services at Metsä Group (2012)Metsä Board Corporation, Vice President, Human Resources, Consumer Packaging business area (2011–2012) Oy Sinebrychoff Ab, Head of HR Development (2011) Oy Sinebrychoff Ab, Human Resources Development Manager (2007–2011) Shares owned in Metsä Board Corporation 31 Dec 2016: 11,495 B shares
SEPPO PUOTINENb. 1955Lic.Sc. (Tech)Senior Vice President, Marketing and Sales
SUSANNA TAINIOb. 1975Phil. Lic. (Comm)Senior Vice President, Human Resources

116 QUARTERLY DATA
QUARTERLY DATA
EUR million Total year Quarterly
SALES 2016 2015 IV/2016 III/2016 II/2016 I/2016 IV/2015 III/2015 II/2015 I/2015
METSÄ BOARD 1,720.3 2,007.5 421.8 440.0 422.9 435.6 462.2 497.6 522.0 525.7
OPERATING RESULT, COMPARABLE 2016 2015 IV/2016 III/2016 II/2016 I/2016 IV/2015 III/2015 II/2015 I/2015
METSÄ BOARD 137.5 179.9 32.8 34.0 35.8 35.0 35.0 54.6 47.0 43.2
OPERATING RESULT AND RESULT BEFORE TAXES 2016 2015 IV/2016 III/2016 II/2016 I/2016 IV/2015 III/2015 II/2015 I/2015
OPERATING RESULT 132.3 199.0 38.5 26.6 34.5 32.7 34.1 54.6 67.2 43.1
Share of profit from associated companies 0.1 0.1 0.0 0.0 0.0 0.0 0.0 0.0 0.0 0.1
Exchange gains/losses -4.9 -3.4 -3.9 -0.7 -1.9 1.6 1.9 -0.6 -0.9 -3.8
Other financial income and expenses -25.8 -28.6 -6.0 -6.1 -7.1 -6.5 -6.6 -6.5 -8.3 -7.2
RESULT BEFORE TAXES 101.6 167.1 28.6 19.8 25.5 27.7 29.4 47.5 58.0 32.2
OPERATING RESULT, % OF SALES 2016 2015 IV/2016 III/2016 II/2016 I/2016 IV/2015 III/2015 II/2015 I/2015
METSÄ BOARD 7.7 9.9 9.1 6.0 8.2 7.5 7.4 11.0 12.9 8.2
1,000 t Total year Quarterly
DELIVERIES 2016 2015 IV/2016 III/2016 II/2016 I/2016 IV/2015 III/2015 II/2015 I/2015
Paperboard 1,607 1,449 399 422 408 378 365 373 366 345
Paper 35 478 2 7 11 15 65 118 138 156
Market pulp 500 549 116 128 113 144 134 123 142 150
PRODUCTION 2016 2015 IV/2016 III/2016 II/2016 I/2016 IV/2015 III/2015 II/2015 I/2015
Paperboard 1,708 1,481 418 456 428 405 375 367 376 363
Paper 23 430 0 2 9 12 38 113 126 153
Metsä Fibre’s pulp 1) 577 586 149 144 139 146 148 143 147 147
Metsä Board’s pulp 1,236 1,206 306 314 307 309 257 318 302 328
1) Corresponds to Metsä Board’s ownership of 24.9 per cent in Metsä Fibre.

PRODUCTION CAPACITIES 117
PRODUCTION CAPACITIES
PAPERBOARD MILLS
1,000 t Country MachinesFolding
boxboardWhite fresh
fibre linerboard Total
Tampere (Tako) Finland 2 210 210
Kyröskoski (Kyro) Finland 1 190 190
Äänekoski Finland 1 240 240
Simpele Finland 1 280 280
Kemi Finland 1 410 410
Husum Sweden 2 400 270 670
Total 8 1,320 680 2,000
PULP MILLS
1,000 t CountryChemical
pulpHigh-yield
pulp Total
Husum Sweden 730 730
Joutseno Finland 320 320
Kaskinen Finland 340 340
Total 730 660 1,390
METSÄ FIBRE 1)
1,000 t Country Total
Äänekoski Finland 530
Kemi Finland 610
Rauma Finland 650
Joutseno Finland 690
Total 2,480
1) Metsä Board’s share of production capacity is 24.9 per cent.

118 TEN YEARS IN FIGURES
TEN YEARS IN FIGURES
2015 2015 2014 2013 2012 2011 2010 2009 2008 2007
INCOME STATEMENT, EUR MILLION
Sales 1,720 2,008 2,008 2,019 2,108 2,485 2,605 2,432 3,236 3,499
- change % -14.3 -0.0 -0.5 -4.2 -15.2 -4.6 7.1 -24.8 -7.5 -5.4
Exports from Finland 1,268 1,242 1,108 1,110 1,118 1,140 1,179 1,073 1,216 1,084
Exports and non-Finnish subsidiaries 1,604 1,892 1,853 1,948 1,936 2,307 2,396 2,232 3,068 3,274
Operating result 132 199 117 114 221 -214 146 -267 -61 -49
- % of sales 7.7 9.9 5.8 5.6 10.5 -8.6 5.6 -11.0 -1.9 -1.4
Result from continuing operations before tax 102 167 78 58 174 -281 48 -358 -204 -191
- % of sales 5.9 8.3 3.9 2.9 8.3 -11.3 1.8 -14.7 -6.3 -5.5
Result for the period from continuing operations 90 137 69 64 171 -273 27 -331 -170 -168
- % of sales 5.3 6.8 3.4 3.2 8.1 -11.0 1.0 -13.6 -5.3 -4.8
BALANCE SHEET, EUR MILLION
Balance sheet total 2,194 2,220 2,149 2,097 2,581 2,688 3,117 3,132 4,505 5,481
Shareholders’ equity 1,052 1,029 841 850 851 732 994 916 1,329 1,830
Non-controlling interest 0 0 0 0 6 5 5 8 58 52
Interest-bearing net liabilities 464 333 427 597 625 783 827 777 1,254 1,867
DIVIDENDS AND FIGURES PER SHARE
Dividends, EUR million 67.51) 60.4 39.4 29.5 19.7 0.0 0.0 0.0 0.0 19.7
Dividend per share, EUR 0.191) 0.17 0.12 0.09 0.06 0.0 0.0 0.0 0.0 0.06
Dividend/profit, % 76.01) 43.6 57.1 47.4 11.3 0.0 0.0 0.0 0.0 -10.2
Dividend yield, % 2) 2.81) 2.5 2.7 2.9 2.7 0.0 0.0 0.0 0.0 1.8
Earnings per share, EUR 0.25 0.39 0.20 0.19 0.51 -0.81 0.08 -1.06 -1.54 -0.57
Shareholders’ equity per share, EUR 2.96 2.89 2.49 2.51 2.52 2.17 2.94 2.71 3.93 5.41
KEY FIGURES - PROFITABILITY
Return on capital employed (ROCE), total, % 7.8 12,5 7.7 7.0 12.4 -9.9 5.7 -8.9 -1.3 -0.8
Return on equity, % 8.7 14,7 8.1 7.5 21.5 -31.5 2.8 -28.6 -10.4 -8.5
KEY FIGURES - FINANCIAL POSITION
Equity ratio, % 48.2 46.5 39.2 40.7 33.2 27.4 32.1 29.6 30.8 34.4
Net gearing ratio, % 44 32 51 70 73 106 83 84 90 99
Net cash flow arising from operating activities 77 247 198 82 -2 83 -69 81 -97 127
Internal financing on capital expenditure, EUR million 47 139 450 122 -3 87 -105 111 -76 50
Net interest expenses, EUR million 26 26 42 60 70 66 64 92 156 148
Interest cover 3) 4.0 10.4 5.7 2.4 1.0 2.3 -0.1 1.9 0.4 1.9
OTHER KEY FIGURES
Gross capital expenditure, EUR million 162 178 44 67 66 95 66 73 128 259
- % of sales 3) 9.4 8.9 2.2 3.3 3.1 3.8 2.5 3.0 3.2 5.9
R&D expenditure, EUR million 3) 6 8 6 5 5 5 5 7 10 14
- % of sales 0.4 0.4 0.3 0.3 0.2 0.2 0.2 0.3 0.3 0.4
Personnel, average 3) 2,588 2,851 3,200 3,245 3,552 4,428 4,772 5,913 6,849 8,267
- of whom in Finland 1,552 1,538 1,542 1,560 1,634 1,795 1,842 2,173 2,437 2,824
Dividends and figures per share for years 2007–2014 have been have been issue-adjusted. The rights issue factor was 1.030627.Effect of IAS19r Employee benefits has been reported only for years 2012–2016.
1) Board of Directors propose that a dividend of EUR 0.19 per share be distributed for financial year 2016.2) Calculated from the closing price of B share on 31 Dec 2016.3) The key ratio for 2007–2016 has been calculated for continuing operations only
Calculation of key ratios is presented on page 87.

INVESTOR RELATIONS AND INVESTOR INFORMATION 119
INVESTOR RELATIONS AND INVESTOR INFORMATION
INVESTOR RELATIONS
The task of Metsä Board’s investor relations is to ensure that the market receives accurate and sufficient information in order to determine the value of Metsä Board’s shares. The investor relations function is responsible for planning and providing financial and investor commu-nication. The activities of investor relations also include collecting investor feedback and market information for Metsä Board’s man-agement and Board of Directors. All requests from investors are handled in a centralised manner by Metsä Board’s investor relations.
The tools used in Metsä Board’s investor communication include financial statements bulletins, interim reports, annual reports, stock exchange and press releases, as well as the company’s Investors page at www.metsa board.com/investors. You can also order Metsä Board’s publications and provide feedback on the website. In addition, the company’s investor relations include meetings with investors, Capital Markets Days, semi-nars, webcasts and Annual General Meetings. Investor events are attended variously by the Head of Investor Relations, CEO, CFO and, if needed, other members of the company’s senior management.
INVESTOR RELATIONS IN 2016
In 2016, Metsä Board organised more than 28 roadshow days in 18 different cities in Europe and North America. In addition, the company organised several group and private meetings and telephone conferences with investors and analysts. A telephone conference in which the CEO presented the interim report and the audience had the chance to ask questions was organised in connection with the release of each interim report. Recordings and transcriptions of these events are avail-
able on Metsä Board’s Investors page. Mill tours were organised at the Husum, Simpele, Joutseno and Kyro mills, among others. The tours also included representatives of local management. During the year, Metsä Board also participated in events aimed at private investors, such as the public events organised by Nordnet, the Finnish Foundation for Share Promotion, Arvopaperi and Osakesäästäjät. Metsä Board’s investor communication also makes use of social media through Twitter and LinkedIn accounts, for example.
SILENT PERIOD
Metsä Board does not comment on the company’s financial performance or future outlook from the close of each reporting period up to the publication of the report for the period, apart from substantial changes in the market situation or to correct information that is incorrect.
ANALYST COVERAGE
In 2016, Metsä Board was followed by eleven analysts. The analysts’ contact information and consensus forecasts are available on Metsä Board’s Investors pages at www.metsaboard.com/investors. Metsä Board is not responsible for the content, accuracy or extent of the analysts’ views. At least the following broker-age firms conducted analyses of Metsä Board in 2016: ABGSC, Carnegie, Danske Equities, DNB, Evli Bank, Handelsbanken, Inderes, Kepler Cheuvreux, Nordea Markets, OP and SEB.
ANNUAL GENERAL MEETING IN 2017
The Annual General Meeting of Metsä Board Corporation will be held at Finlandiatalo,
Hall A, Congress Wing, Mannerheimintie 13 E, Helsinki, on Thursday 23 March 2017 at 3 p.m. EET. Shareholders wishing to take part in the Annual General Meeting and to exercise their right to vote must be registered in the company’s shareholders’ register held by Euroclear Finland Ltd. on 13 March 2017, the record date of the Annual General Meeting, and must register for the meeting by 10 a.m. on 20 March 2017 on the company’s website at www.metsaboard.com, by e-mail to [email protected], by telephone from Monday to Friday between 10 and 11 a.m. at +358 10 465 4102, or by mail to Metsä Board Corporation, Legal Services/Nenonen, P.O. Box 20, 02020 Metsä. Any proxy documents should be delivered to the above address before the last date for registration.
DISTRIBUTION OF DIVIDEND
The Board of Directors proposes to the Annual General Meeting to be held on 23 March 2017 that a dividend of EUR 0.19 per share be paid for the 2016 financial period. The dividend will be paid to shareholders who are registered in the company’s shareholders register held by Euroclear Finland Oy on the dividend payment record date of 27 March 2017. The Board of Directors proposes 3 April 2017 as the dividend payment date.
INVESTOR RELATIONS
CONTACT INFORMATION
Katri SundströmHead of Investor RelationsTel. +358 400 976 [email protected]
Anu JasolaAssistantTel. +358 10 469 [email protected]
General questions and comments on investor relations can be e-mailed to [email protected].
www.metsaboard.com
CLOSED WINDOW FINANCIAL REPORT PUBLICATION DATE
1 January to 1 February 2017 Financial result for 2016 Thursday 2 February 2017
1 April to 3 May 2017 Interim report January–March Thursday 4 May 2017
1 July to 2 August 2017 Interim report January–June Thursday 3 August 2017
1 October to 31 October 2017 Interim report January–September Wednesday 1 November 2017

120 CONTACT INFORMATION
CONTACT INFORMATION
METSÄ BOARD CORPORATION
Head officeP.O. Box 2002020 METSÄ, Finland
Revontulenpuisto 202100 Espoo, FinlandTel. +358 10 4611
Business ID 0635366–7
www.metsaboard.com
Metsä Board has a global sales network. To locate contact details of Metsä Board sales offices, please visit company website www.metsaboard.com/contacts


METSÄ BOARD CORPORATION
P.O. Box 20
FI-02020 METSÄ
Tel. +358 10 4611
www.metsaboard.com
Cov
er C
arta
Inte
gra
23
5 g
/m2. ©
Met
sä B
oard
20
17
ME
TS
Ä B
OA
RD
AN
NU
AL R
EP
OR
T 2
016

ME
TS
Ä B
OA
RD
AN
NU
AL R
EP
OR
T 2
016