mima k et al. mir21, t cells, and colorectal cancer. page 1 · mima k et al. mir21, t cells, and...
TRANSCRIPT
Mima K et al. MIR21, T cells, and Colorectal Cancer. Page 1
Research article MicroRNA MIR21 and T cells in Colorectal Cancer Short title: MIR21, T cells, and Colorectal Cancer Kosuke Mima,1 Reiko Nishihara,1,2,3,4 Jonathan A. Nowak,5 Sun A Kim,1 Mingyang Song,2,3 Kentaro Inamura,1 Yasutaka Sukawa,1 Atsuhiro Masuda,1 Juhong Yang,1 Ruoxu Dou,1
Katsuhiko Nosho,6 Hideo Baba,7 Edward L. Giovannucci,2,3,8 Michaela Bowden,1 Massimo Loda,1,5,9 Marios Giannakis,1,9,10 Adam J. Bass,1,9 Glenn Dranoff,1,10,11 Gordon J. Freeman,1 Andrew T. Chan,8,12 Charles S. Fuchs,1,8 Zhi Rong Qian,1 Shuji Ogino1,3,5 K.M., R.N., J.A.N., and S.A.K. contributed equally. A.T.C., C.S.F., Z.R.Q., and S.O. contributed equally. 1. Department of Medical Oncology, Dana-Farber Cancer Institute and Harvard Medical
School, Boston, MA 2. Department of Nutrition, Harvard T.H. Chan School of Public Health, Boston, MA 3. Department of Epidemiology, Harvard T.H. Chan School of Public Health, Boston, MA 4. Department of Biostatistics, Harvard T.H. Chan School of Public Health, Boston, MA 5. Department of Pathology, Brigham and Women’s Hospital and Harvard Medical School,
Boston, MA 6. Department of Gastroenterology, Rheumatology and Clinical Immunology, Sapporo Medical
University School of Medicine, Sapporo, Japan 7. Department of Gastroenterological Surgery, Graduate School of Medical Science,
Kumamoto University, Kumamoto, Japan 8. Channing Division of Network Medicine, Department of Medicine, Brigham and Women’s
Hospital and Harvard Medical School, Boston, MA 9. Broad Institute of Massachusetts Institute of Technology and Harvard, Cambridge, MA 10. Department of Medicine, Brigham and Women’s Hospital and Harvard Medical School,
Boston, MA 11. Cancer Vaccine Center, Dana-Farber Cancer Institute, Boston, MA 12. Division of Gastroenterology, Massachusetts General Hospital, Boston, MA Co-corresponding authors: Zhi Rong Qian, MD, PhD Department of Medical Oncology Dana-Farber Cancer Institute Harvard Medical School 450 Brookline Ave., Room M420, Boston, MA 02215 Telephone: 617-582-9145 Fax: 617-582-8558 Email: [email protected]
Shuji Ogino, MD, PhD, MS Department of Medical Oncology Dana-Farber Cancer Institute Harvard Medical School 450 Brookline Ave., Room M422, Boston, MA 02215 Telephone: 617-632-1972 Fax: 617-582-8558 Email: [email protected]
on May 25, 2020. © 2015 American Association for Cancer Research. cancerimmunolres.aacrjournals.org Downloaded from
Author manuscripts have been peer reviewed and accepted for publication but have not yet been edited. Author Manuscript Published OnlineFirst on September 29, 2015; DOI: 10.1158/2326-6066.CIR-15-0084
Mima K et al. MIR21, T cells, and Colorectal Cancer. Page 2
Word count: 250 for abstract; 2,966 for text. Figures and tables: 4 tables, 1 figure, and 4 supplementary tables. Keywords: colorectum; epigenetics; immunoprevention; molecular pathological epidemiology; non-coding RNA. Funding: This work was supported by U.S. National Institutes of Health (NIH) grants [P01 CA87969 to M.J. Stampfer; UM1 CA186107 to M.J. Stampfer; P01 CA55075 to W.C. Willett; UM1 CA167552 to W.C. Willett; P50 CA127003 to C.S.F.; R01 CA137178 to A.T.C.; R01 CA151993 to S.O.; R35 CA197735 to S.O.; and K07 CA190673 to R.N.]; and by grants from The Paula and Russell Agrusa Fund for Colorectal Cancer Research, The Friends of the Dana-Farber Cancer Institute, Bennett Family Fund, and the Entertainment Industry Foundation through National Colorectal Cancer Research Alliance. K.M. is supported by a fellowship grant from Uehara Memorial Foundation and a grant from Program for Advancing Strategic International Networks to Accelerate the Circulation of Talented Researchers from Japanese Society for the Promotion of Science. S.A.K. is supported by Early Exchange Postdoctoral Fellowship Grant from Asan Medical Center. The content is solely the responsibility of the authors and does not necessarily represent the official views of NIH. The funders had no role in study design, data collection and analysis, decision to publish, or preparation of the manuscript. Conflict of interest: No conflict of interest exists related to this manuscript. Acknowledgments: We would like to thank the participants and staff of the Nurses’ Health Study and the Health Professionals Follow-up Study for their valuable contributions as well as the following state cancer registries for their help: AL, AZ, AR, CA, CO, CT, DE, FL, GA, ID, IL, IN, IA, KY, LA, ME, MD, MA, MI, NE, NH, NJ, NY, NC, ND, OH, OK, OR, PA, RI, SC, TN, TX, VA, WA, WY. The authors assume full responsibility for analyses and interpretation of these data. Abbreviations: cDNA, complementary DNA; CI, confidence interval; CIMP, CpG island methylator phenotype; Ct, cycle threshold; FFPE, formalin-fixed paraffin-embedded; HPFS, Health Professionals Follow-up Study; LINE-1, long interspersed nucleotide element-1; MSI, microsatellite instability; MSS, microsatellite stable; NHS, Nurses’ Health Study; OR, odds ratio; PCR, polymerase chain reaction; PGE2, prostaglandin E2; SD, standard deviation. Use of standardized official symbols: We use HUGO (Human Genome Organisation)-approved official symbols for genes and gene products, including BRAF, CACNA1G, CD3, CD8, CD274, CDKN2A, CRABP1, CTLA4, FOXP3, HPGD, IGF2, IL10, KRAS, MIR21, MLH1, NEUROG1, PDCD1, PDCD4, PIK3CA, PTPRC, RNU6-2, RUNX3, and SOCS1; all of which are described at www.genenames.org. Gene names are italicized, and gene product names are non-italicized.
on May 25, 2020. © 2015 American Association for Cancer Research. cancerimmunolres.aacrjournals.org Downloaded from
Author manuscripts have been peer reviewed and accepted for publication but have not yet been edited. Author Manuscript Published OnlineFirst on September 29, 2015; DOI: 10.1158/2326-6066.CIR-15-0084
Mima K et al. MIR21, T cells, and Colorectal Cancer. Page 3
Abstract
The complex interactions between colorectal neoplasia and immune cells in the tumor
microenvironment remain to be elucidated. Experimental evidence suggests that microRNA
MIR21 (miR-21) suppresses antitumor T-cell–mediated immunity. Thus, we hypothesized that
tumor MIR21 expression might be inversely associated with T-cell density in colorectal
carcinoma tissue. Utilizing 538 rectal and colon cancer cases in the Nurses’ Health Study and
the Health Professionals Follow-up Study, we measured tumor MIR21 expression by quantitative
reverse-transcription polymerase chain reaction assay. Densities of CD3+, CD8+, CD45RO
(PTPRC)+ and FOXP3+ cells in tumor tissue were determined by tissue microarray
immunohistochemistry and computer-assisted image analysis. Ordinal logistic regression
analysis was conducted to assess the association of MIR21 expression (ordinal quartiles as a
predictor variable) with T-cell density (ordinal quartiles as an outcome variable), adjusting for
tumor molecular features including microsatellite instability; CpG island methylator phenotype;
KRAS, BRAF, and PIK3CA mutations; and LINE-1 methylation. We adjusted two-sided α level
to 0.012 for multiple hypothesis testing. Tumor MIR21 expression was inversely associated with
densities of CD3+ and CD45RO+ cells (Ptrend < 0.0005). Multivariate odds ratio of the highest vs.
lowest quartile of MIR21 for a unit increase in quartile categories of CD3+ or CD45RO+ cells
was 0.44 (95% confidence interval [CI], 0.28 to 0.68) or 0.41 (95% CI, 0.26 to 0.64),
respectively. Our data support a possible role of tumor epigenetic deregulation by non-coding
RNA in suppressing antitumor T-cell–mediated adaptive immune response, and suggest MIR21
as a potential target for immunotherapy and prevention in colorectal cancer.
on May 25, 2020. © 2015 American Association for Cancer Research. cancerimmunolres.aacrjournals.org Downloaded from
Author manuscripts have been peer reviewed and accepted for publication but have not yet been edited. Author Manuscript Published OnlineFirst on September 29, 2015; DOI: 10.1158/2326-6066.CIR-15-0084
Mima K et al. MIR21, T cells, and Colorectal Cancer. Page 4
Introduction
Accumulating evidence indicates that innate and adaptive immunity influences tumor
evolution (1). Attesting to an important role of T-cell–mediated adaptive immunity in inhibiting
tumor progression, therapeutic antibodies specific for immune checkpoint molecules, including
CTLA4, PDCD1 (programmed cell death 1; PD-1), and CD274 (programmed cell death 1 ligand
1; PD-L1) can effectively enhance antitumor T-cell activity in various cancers (2, 3). Emerging
evidence suggests complex roles of tumor genetic alterations and tumor-host interactions in
response to T-cell-based immunotherapies (4, 5). Although these immunotherapies appeared to
be less effective for colorectal cancer, intense infiltrates of T cells in colorectal cancer tissue
have been associated with better patient survival (6-8), and studies have suggested a potential
role of immune checkpoint pathways in suppressing antitumor immune responses in a subset of
colorectal cancers (9, 10). A high degree of microsatellite instability (MSI-high) in colorectal
cancer is associated with intense infiltrates of T cells, as mismatch repair defects in MSI-high
tumors causes numerous frameshift mutations and truncated proteins (neopeptides), which elicit
antitumor T-cell–mediated adaptive immunity (11-13). However, MSI status is not the sole
determinant of immune response to colorectal cancer, because the numbers of tumor-infiltrating
T cells considerably overlap between MSI-high and microsatellite stable (MSS) colorectal
tumors (7, 9, 13). Hence, other factors may influence the antitumor immune response to
colorectal cancer.
MicroRNAs are short non-coding RNAs (18-24 nucleotides in length) that play
substantial roles in epigenetic gene regulation in diverse biological and pathological processes,
including immunity and carcinogenesis (14, 15). Among various microRNAs, MIR21 (miR-21)
on May 25, 2020. © 2015 American Association for Cancer Research. cancerimmunolres.aacrjournals.org Downloaded from
Author manuscripts have been peer reviewed and accepted for publication but have not yet been edited. Author Manuscript Published OnlineFirst on September 29, 2015; DOI: 10.1158/2326-6066.CIR-15-0084
Mima K et al. MIR21, T cells, and Colorectal Cancer. Page 5
has been shown to play roles in immunity and colorectal carcinogenesis (16-18). In fact, high
MIR21 expression in colorectal cancer tissue has been associated with worse clinical outcome,
suggesting MIR21 as a prognostic tumor biomarker (19, 20). MIR21 is expressed in colorectal
cancer cells (20, 21), and MIR21 increases amounts of IL10 (interleukin 10) and prostaglandin E2
(PGE2) in the tumor microenvironment in vivo (22-24). IL10 and PGE2 can suppress antitumor
T-cell–mediated adaptive immunity through the inhibition of the antigen-presenting capacities of
dendritic cells and the recruitment of myeloid-derived suppressor cells into the tumor
microenvironment (25, 26). Therefore, we hypothesized that higher MIR21 expression might be
associated with fewer T cells in colorectal cancer tissue. A better understanding of the
relationship between microRNAs and immune cells in the tumor microenvironment may open
opportunities to use microRNAs for immunotherapy and prevention of colorectal cancer.
To test our hypothesis, we analyzed two U.S. nationwide prospective cohort studies (the
Nurses’ Health Study (NHS) and the Health Professionals Follow-up Study (HPFS)) and
examined tumor MIR21 expression in relation to densities of CD3+, CD8+, CD45RO (PTPRC)+,
and FOXP3+ T cells in colorectal cancer tissue.
Methods
Study population
We used the databases of two U.S. nationwide prospective cohort studies, NHS (121,701
women who enrolled in 1976) and HPFS (51,529 men who enrolled in 1986) (27, 28). Every 2
on May 25, 2020. © 2015 American Association for Cancer Research. cancerimmunolres.aacrjournals.org Downloaded from
Author manuscripts have been peer reviewed and accepted for publication but have not yet been edited. Author Manuscript Published OnlineFirst on September 29, 2015; DOI: 10.1158/2326-6066.CIR-15-0084
Mima K et al. MIR21, T cells, and Colorectal Cancer. Page 6
years, participants were sent follow-up questionnaires to gather information on health and
lifestyle factors, and to identify newly diagnosed cancers and other diseases. Medical records
were reviewed, and the cause of death was assigned by study physicians. The National Death
Index was used to ascertain deaths of study participants and identify unreported lethal colorectal
cancer cases. Formalin-fixed paraffin-embedded (FFPE) tissue blocks were collected from
hospitals where participants with colorectal cancer had undergone tumor resection. Hematoxylin
and eosin-stained tissue sections from all colorectal cancer cases were reviewed by a pathologist
(S. Ogino), who was unaware of other data. Tumor differentiation was categorized as well to
moderate or poor (>50% vs. ≤50% glandular area). Based on the availability of data on tumor
MIR21 expression and T-cell densities, a total of 538 colorectal cancer cases were included.
Written informed consent was obtained from all study participants. Tissue collection and
analyses were approved by the human subjects committee at the Harvard T.H. Chan School of
Public Health and the Brigham and Women’s Hospital (Boston, MA, USA).
RNA isolation and quantitative reverse-transcription (RT) polymerase chain reaction
(PCR) for MIR21
RNA was extracted from colorectal cancer tissue and adjacent non-tumor colonic mucosa
in whole-tissue sections of FFPE specimens with the use of RecoverAll™ Total Nucleic Acid
Isolation Kit (Ambion Inc, Austin, TX). The quantitative RT-PCR assays for MIR21 and RNU6-
2 were performed according to miScript PCR System protocol (Qiagen, Valencia, CA). Briefly,
complementary DNA (cDNA) was synthesized with the use of miScript II RT Kit (Qiagen,
on May 25, 2020. © 2015 American Association for Cancer Research. cancerimmunolres.aacrjournals.org Downloaded from
Author manuscripts have been peer reviewed and accepted for publication but have not yet been edited. Author Manuscript Published OnlineFirst on September 29, 2015; DOI: 10.1158/2326-6066.CIR-15-0084
Mima K et al. MIR21, T cells, and Colorectal Cancer. Page 7
Valencia, CA). Each reaction was performed in 25 μL solution containing 1× final concentration
QuantiTect SYBR Green PCR Master Mix (Qiagen, Valencia, CA) and each miScript Primer
Assay (Qiagen, Valencia, CA) specific for MIR21 (catalog number, MS00009079) and RNU6-2
(catalog number, MS00033740) in a 96-well optical PCR plate. Amplification and detection of
MIR21 and RNU6-2 were performed with the StepOnePlus Real-Time PCR Systems (Applied
Biosystems, San Diego, CA) with the use of the following reaction conditions: 15 minutes at
95ºC and 40 cycles of 15 seconds at 94ºC, 30 seconds at 55ºC, and 30 seconds at 70ºC. The
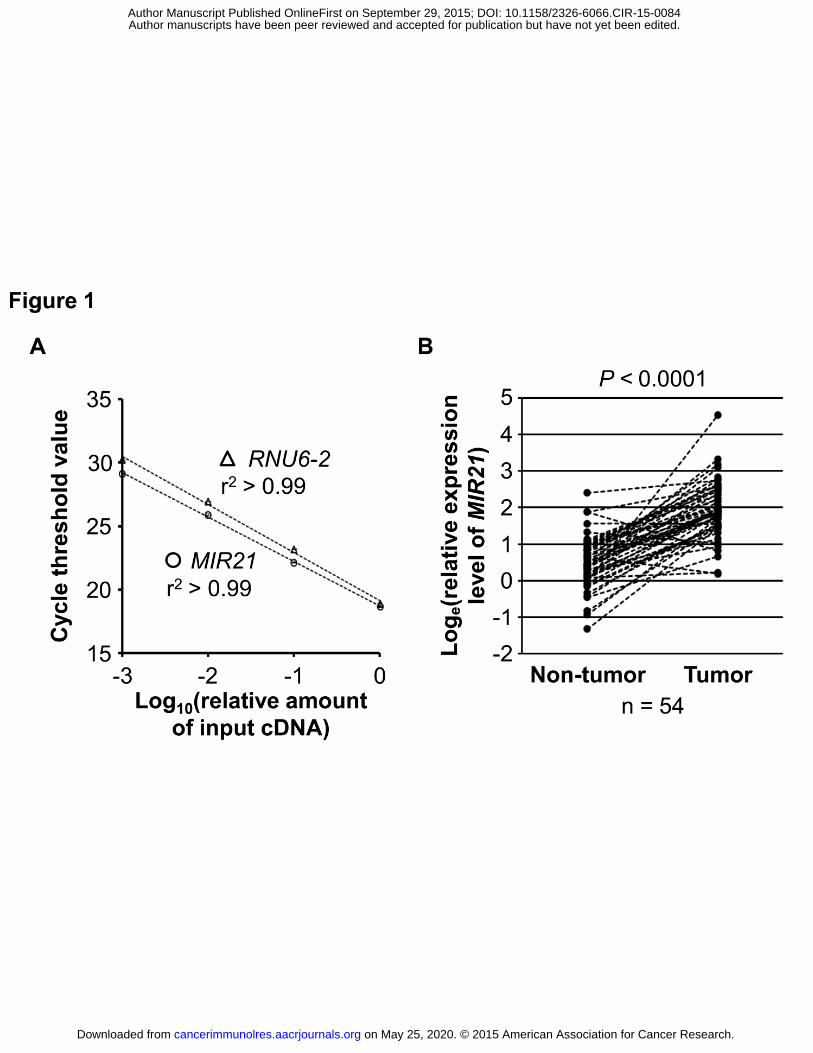
cycle threshold (Ct) values in the quantitative reverse-transcription PCR for MIR21 and RNU6-2
decreased linearly with the amount of input cDNA using 10-fold dilution series from the same
specimen (r2 > 0.99; Fig. 1A). The inter-assay coefficient of variation of Ct values from the
same specimen in five different batches was ≤1% for MIR21 and RNU6-2 in our validation study
using five colorectal cancers (Table 1).
Each specimen was analyzed in duplicate for each target in a single batch, and we used
the average of the two Ct values for each target. Spearman’s rank-correlation coefficient
between the two Ct values (in duplicated runs) was 0.99 in quantitative PCR assays for MIR21
and RNU6-2. MIR21 expression level in each specimen was calculated as a relative unitless
value normalized with RNU6-2 using the 2-∆Ct method (where ∆Ct = “the average Ct value of
MIR21” - “the average Ct value of RNU6-2”) as previously described (29).
Analyses of MSI, DNA methylation, and KRAS, BRAF, and PIK3CA mutations
DNA was extracted from archival colorectal cancer tissue blocks. MSI status was
analyzed with use of 10 microsatellite markers (D2S123, D5S346, D17S250, BAT25, BAT26,
on May 25, 2020. © 2015 American Association for Cancer Research. cancerimmunolres.aacrjournals.org Downloaded from
Author manuscripts have been peer reviewed and accepted for publication but have not yet been edited. Author Manuscript Published OnlineFirst on September 29, 2015; DOI: 10.1158/2326-6066.CIR-15-0084

Mima K et al. MIR21, T cells, and Colorectal Cancer. Page 8
BAT40, D18S55, D18S56, D18S67, and D18S487) as previously described (30). We defined
MSI-high as the presence of instability in ≥30% of the markers, and MSI-low/microsatellite
stable (MSS) as instability in <30% of the markers. Methylation analyses of long interspersed
nucleotide element-1 (LINE-1) (31, 32) and eight promoter CpG islands specific for CpG island
methylator phenotype (CIMP) (CACNA1G, CDKN2A, CRABP1, IGF2, MLH1, NEUROG1,
RUNX3, and SOCS1) (33, 34) were performed. PCR reaction and pyrosequencing were
performed for KRAS (codons 12, 13, 61, and 146) (35, 36), BRAF (codon 600) (30), and PIK3CA
(exons 9 and 20) (37, 38).
Immunohistochemistry and quantification of the density of T cells
We constructed a tissue microarray, and conducted immunohistochemistry for CD3, CD8,
CD45RO (one of the PTPRC protein isoforms), and FOXP3 (7). We used automated scanning
microscope and the Ariol image analysis system (Genetix, San Jose, CA, USA) to measure
densities (cells/mm2) of CD3+, CD8+, CD45RO+, and FOXP3+ T cells in colorectal cancer tissue
as previously described (7).
Statistical analysis
All statistical analyses were conducted using SAS (version 9.3, SAS Institute, Cary, NC)
and all P values were two-sided. Neither MIR21 expression, T-cell density, nor log-transformed
values of MIR21 or T-cell density fit a normal distribution with the use of the Kolmogorov-
Smirnov test for normality (P ≤ 0.048). Thus, we tested our primary hypothesis using a linear
on May 25, 2020. © 2015 American Association for Cancer Research. cancerimmunolres.aacrjournals.org Downloaded from
Author manuscripts have been peer reviewed and accepted for publication but have not yet been edited. Author Manuscript Published OnlineFirst on September 29, 2015; DOI: 10.1158/2326-6066.CIR-15-0084
Mima K et al. MIR21, T cells, and Colorectal Cancer. Page 9
trend test in an ordinal logistic regression model to assess associations of tumor MIR21
expression (an ordinal quartile predictor variable as a continuous variable) with the density of
CD3+, CD8+, CD45RO+, or FOXP3+ T cells in colorectal cancer tissue (an ordinal quartile
outcome variable). Because we tested four primary hypotheses (for CD3+, CD8+, CD45RO+, and
FOXP3+ T cells as outcome variables), we adjusted two-sided α level to 0.012 (= 0.05/4) by
simple Bonferroni correction. All other analyses including evaluation of individual odds ratio
(OR) estimates represented secondary analyses. In those secondary analyses, in view of multiple
comparisons, we interpreted our data cautiously, in addition to the use of the adjusted α level of
0.012.
We performed multivariable ordinal logistic regression analysis to control for potential
confounders. The multivariable model initially included age (continuous), sex, year of diagnosis
(continuous), family history of colorectal cancer in a first-degree relative (present vs. absent),
tumor location (proximal colon vs. distal colon vs. rectum), tumor differentiation (well to
moderate vs. poor), MSI (high vs. MSI-low/MSS), CIMP (high vs. low/negative), KRAS (mutant
vs. wild-type), BRAF (mutant vs. wild-type), and PIK3CA (mutant vs. wild-type), and LINE-1
methylation level (continuous). For cases with missing information in any of the covariates, we
assigned a separate (“missing”) indicator variable. A backward stepwise elimination with a
threshold of P = 0.05 was used to select variables in the final models. We assessed the
proportional odds assumption in the ordinal logistic regression model, which was generally
satisfied (P > 0.05).
All cross-sectional univariable analyses for clinical, pathological, and molecular
associations (with variables listed in Table 2) were secondary exploratory analyses, and we
adjusted two-sided α level to 0.003 (= 0.05/14) by simple Bonferroni correction for multiple
on May 25, 2020. © 2015 American Association for Cancer Research. cancerimmunolres.aacrjournals.org Downloaded from
Author manuscripts have been peer reviewed and accepted for publication but have not yet been edited. Author Manuscript Published OnlineFirst on September 29, 2015; DOI: 10.1158/2326-6066.CIR-15-0084
Mima K et al. MIR21, T cells, and Colorectal Cancer. Page 10
hypothesis testing. To assess associations between the ordinal categories (first to fourth quartile)
of tumor MIR21 expression and categorical data, the chi-square test was performed. To compare
mean age and mean LINE-1 methylation levels, an analysis of variance assuming equal variances
was performed.
Results
MIR21 expression in colorectal cancer
To test the hypothesis of an inverse relationship between MIR21 expression and T-cell
infiltration in colorectal cancer tissue, we measured MIR21 expression with RT-PCR assays on
538 colorectal cancer cases within the NHS and the HPFS databases. In 54 pairs of colorectal
cancer and adjacent non-tumor colonic mucosa, MIR21 expression was generally higher in
colorectal cancer than in paired adjacent nontumor colonic mucosa (Wilcoxon signed rank test, P
< 0.0001; Fig. 1B).
Table 2 shows clinical, pathological, and molecular features of the 538 cases according to
tumor MIR21 expression. Higher tumor MIR21 expression was associated with BRAF mutation
(P = 0.003; with adjusted α level of 0.003 for multiple hypothesis testing).
on May 25, 2020. © 2015 American Association for Cancer Research. cancerimmunolres.aacrjournals.org Downloaded from
Author manuscripts have been peer reviewed and accepted for publication but have not yet been edited. Author Manuscript Published OnlineFirst on September 29, 2015; DOI: 10.1158/2326-6066.CIR-15-0084
Mima K et al. MIR21, T cells, and Colorectal Cancer. Page 11
Association of tumor MIR21 expression with T-cell density in colorectal cancer tissue
We measured the densities of CD3+, CD8+, CD45RO+, and FOXP3+ T cells in colorectal
cancer tissue by immunohistochemistry and image analysis. Supplementary Table S1 shows
pairwise correlations between the densities of CD3+, CD8+, CD45RO+, and FOXP3+ T cells.
Except for between CD8+ and FOXP3+ T cells (P = 0.16), all of the other pairwise correlations
were statistically significant (with Spearman’s rank-correlation coefficients ranging 0.18 to 0.48;
all P < 0.0001).
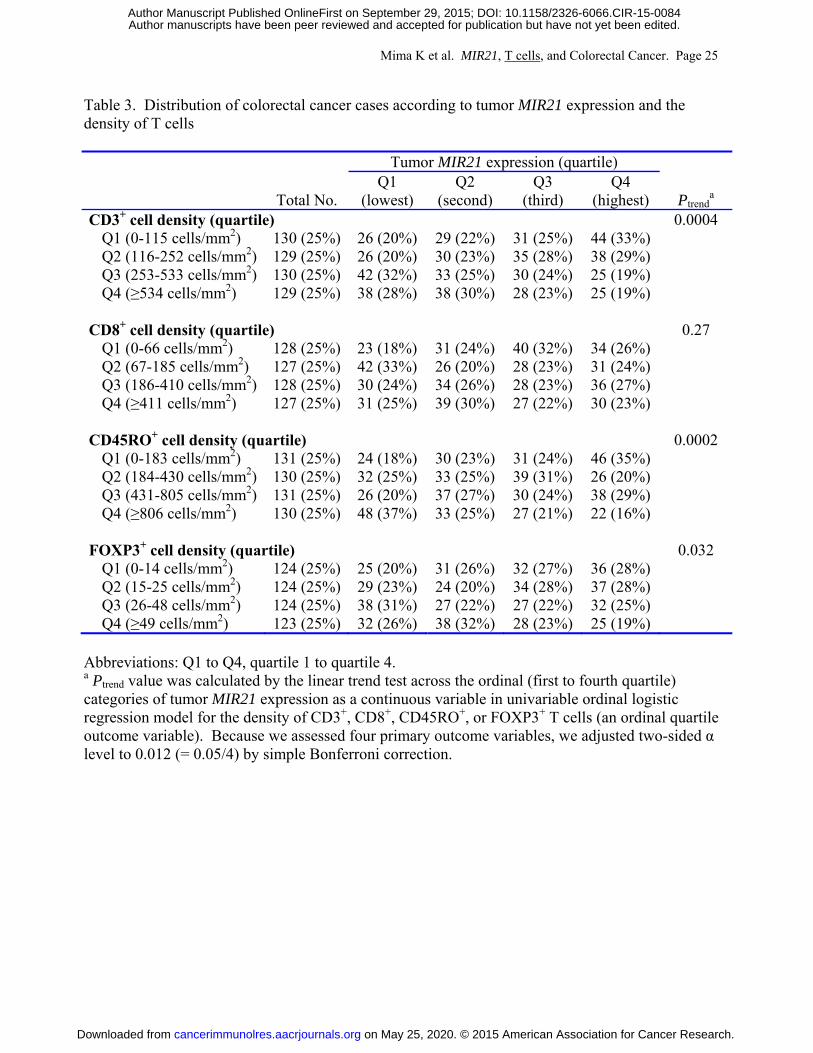
Table 3 shows a distribution of colorectal cancer cases according to tumor MIR21
expression (quartiles) and the density of T cells in colorectal cancer tissue (quartiles). In our
primary hypothesis testing, we conducted univariable and multivariable ordinal logistic
regression analyses to assess the associations of tumor MIR21 expression (as an ordinal quartile
predictor variable) with the density of CD3+, CD8+, CD45RO+, or FOXP3+ T cells in colorectal
cancer tissue (an ordinal quartile outcome variable) (Table 4 and Supplementary Table S2 with
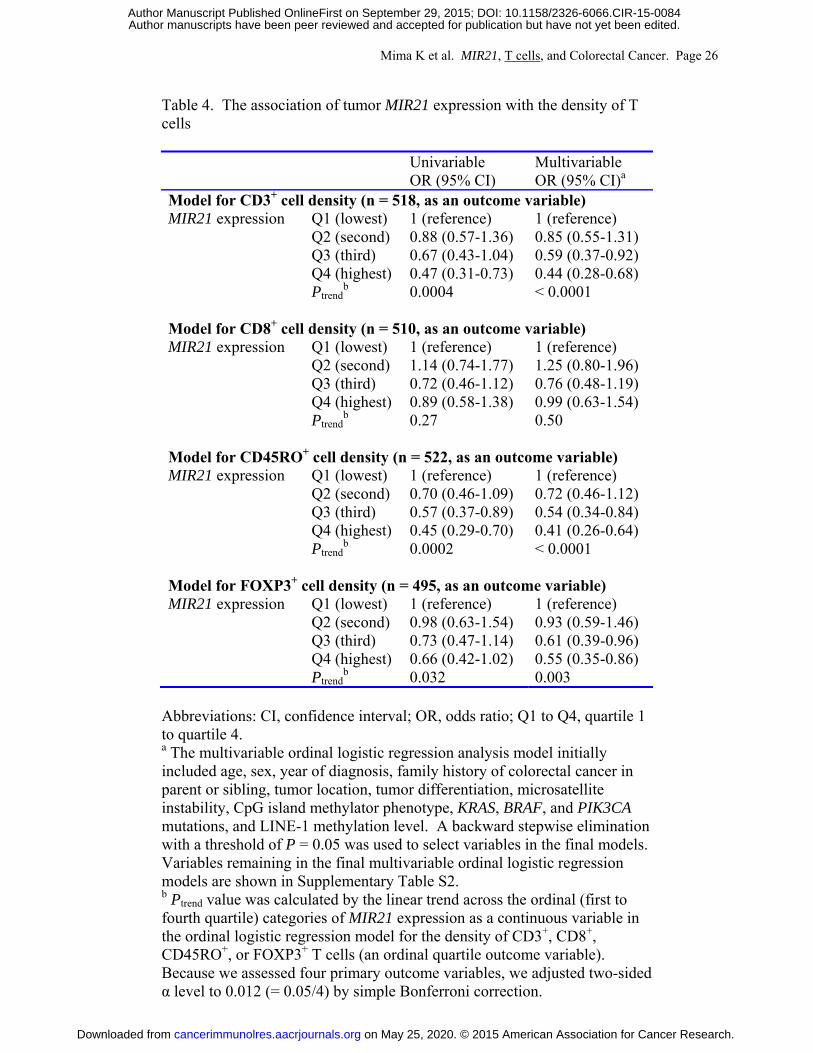
all covariates). Tumor MIR21 expression was inversely associated with the densities of CD3+ T
cells and CD45RO+ T cells in univariable and multivariable ordinal logistic regression analyses
(all Ptrend < 0.0005; with adjusted α level of 0.012 for multiple hypothesis testing). Compared
with cases in the lowest quartile of tumor MIR21 expression, those in the highest quartile were
inversely associated with the densities of CD3+ T cells (multivariable OR, 0.44; 95% confidence
interval [CI], 0.28 to 0.68; for a unit increase in quartile categories) and CD45RO+ T cells
(multivariable OR, 0.41; 95% CI, 0.26 to 0.64; for a unit increase in quartile categories). Tumor
MIR21 expression was not significantly associated with the density of CD8+ or FOXP3+ T cells
(Ptrend > 0.03 in univariable analysis with adjusted α level of 0.012). We also used tumor MIR21
on May 25, 2020. © 2015 American Association for Cancer Research. cancerimmunolres.aacrjournals.org Downloaded from
Author manuscripts have been peer reviewed and accepted for publication but have not yet been edited. Author Manuscript Published OnlineFirst on September 29, 2015; DOI: 10.1158/2326-6066.CIR-15-0084
Mima K et al. MIR21, T cells, and Colorectal Cancer. Page 12
expression after adjusting for cellularity in colorectal cancer tissue, and observed similar
associations of tumor MIR21 expression with the density of T cells (Supplementary Methods and
Supplementary Table S3).
In our exploratory analyses, higher tumor MIR21 expression was significantly associated
with higher colorectal cancer-specific mortality (Ptrend = 0.003), whereas higher CD8+ T-cell
density was significantly associated with lower colorectal cancer-specific mortality (Ptrend =
0.012; Supplementary Methods and Supplementary Table S4).
Discussion
We conducted this study to test the hypothesis that tumor MIR21 expression might be
inversely associated with the density of T cells in colorectal cancer tissue in a human population.
We demonstrated that microRNA expression analysis, by RT-PCR assay, on FFPE tissue
specimens was feasible and robust, in agreement with the previous studies (19, 20). Utilizing the
database of the 538 colorectal cancer cases in the two U.S. nationwide prospective cohort
studies, we found that tumor MIR21 expression was inversely associated with the densities of
CD3+ and CD45RO+ T cells in human colorectal cancer tissue. Our first-line population-based
data support an immunosuppressive role of MIR21 in colorectal cancer.
High densities of CD3+ pan-T cells and T-cell subpopulations (CD8+, CD45RO+, and
FOXP3+ T cells) in colorectal carcinoma have been associated with better patient survival,
indicating a major role of T-cell–mediated adaptive immunity in inhibiting colorectal tumor
progression (39-41). Therefore, both tumor molecular and immunity analyses are increasing
on May 25, 2020. © 2015 American Association for Cancer Research. cancerimmunolres.aacrjournals.org Downloaded from
Author manuscripts have been peer reviewed and accepted for publication but have not yet been edited. Author Manuscript Published OnlineFirst on September 29, 2015; DOI: 10.1158/2326-6066.CIR-15-0084
Mima K et al. MIR21, T cells, and Colorectal Cancer. Page 13
important in cancer research and clinical practice. MicroRNAs play substantial roles in
carcinogenesis and immunity and are potential biomarkers or therapeutic targets (42). One
possible mechanism of the immunosuppressive effect of MIR21 is based on its ability to suppress
the expression of PDCD4, which normally inhibits the translation of IL10 mRNA. Without this
suppression, more IL10 is present in the tumor microenvironment (22, 23), which inhibits the
antigen-presenting capacities of dendritic cells (25). Tumor MIR21 expression has been shown
to inversely correlate with tumor PDCD4 expression assessed by immunohistochemistry on
human colorectal cancer tissue (43, 44). Taken together, it seems to be plausible that MIR21
may suppress antitumor immune responses through increased IL10 in colorectal cancer. In
addition, emerging evidence indicates that MIR21 suppresses tumor expression of HPGD
(hydroxyprostaglandin dehydrogenase 15-(NAD); or 15-PDGH), which converts PGE2 to its
biologically inactive metabolite (24). Hence, MIR21 may increase PGE2 in the tumor
microenvironment, which can lead to suppression of antitumor T-cell–mediated adaptive
immunity (26). Our human population-based data, along with these lines of experimental
evidence, support the hypothesis that MIR21 suppresses antitumor T-cell–mediated immune
response to colorectal cancer, although additional studies are needed to clarify the exact
mechanism. MicroRNA-targeting therapies for human disease including cancer are currently
being investigated (42, 45, 46). In light of our findings, it would be intriguing for future research
to explore a potential strategy of inhibiting MIR21 and thus its immunosuppressive effect in
immunotherapy and prevention for colorectal cancer.
Higher tumor MIR21 expression was associated with BRAF mutation in the present study,
which has not been examined in colorectal cancer before. Oncogenic mutation of BRAF
activates the mitogen-activated protein kinase (MAPK) signaling pathway (47). Experimental
on May 25, 2020. © 2015 American Association for Cancer Research. cancerimmunolres.aacrjournals.org Downloaded from
Author manuscripts have been peer reviewed and accepted for publication but have not yet been edited. Author Manuscript Published OnlineFirst on September 29, 2015; DOI: 10.1158/2326-6066.CIR-15-0084
Mima K et al. MIR21, T cells, and Colorectal Cancer. Page 14
evidence suggests that activation of the RAF-MAPK signaling pathway may increase MIR21
expression in cancer (48). Taken together, BRAF mutation might increase MIR21 expression
through the activation of the MAPK signaling pathway, although additional experimental studies
are needed to test this hypothesis.
One limitation of the current study is its cross-sectional nature. Hence, we cannot
exclude a possibility of reverse causation. It is possible that the interaction of T cells with tumor
cells might cause low expression of MIR21 in tumors. However, our specific hypothesis was
based on several lines of experimental evidence indicating that MIR21 suppresses T-cell–
mediated immune response to tumor (22-26). Because experimental systems cannot perfectly
recapitulate the complexities of human tumors or the immune system, analyses of human
population are essential in translational medicine. Another limitation is measurement of MIR21
expression in colorectal cancer tissue, which contains a mixture of neoplastic and non-neoplastic
cells including immune cells. Nonetheless, a number of studies have shown that MIR21 is
expressed in neoplastic cells, but not substantially in immune cells (20, 21). We also recognize
the limitations in evaluating T cells in human colorectal cancer tissue. We evaluated the well-
characterized T-cell markers such as CD3, CD8, CD45RO, and FOXP3 with the use of tissue
microarray immunohistochemistry and computer-assisted image analysis to objectively quantify
the T-cell densities in a large number of cases. The favorable prognostic associations of the
densities of these T-cell populations in our cohort studies were consistent with previous studies
of other populations (6, 8), suggesting that the density of T cells, as assessed by
immunohistochemistry, might be considered a reliable measure of the adaptive immune response
to colorectal tumors.
on May 25, 2020. © 2015 American Association for Cancer Research. cancerimmunolres.aacrjournals.org Downloaded from
Author manuscripts have been peer reviewed and accepted for publication but have not yet been edited. Author Manuscript Published OnlineFirst on September 29, 2015; DOI: 10.1158/2326-6066.CIR-15-0084
Mima K et al. MIR21, T cells, and Colorectal Cancer. Page 15
Strengths of this study include the use of our molecular pathological epidemiology
database of more than 500 colorectal cancer cases in the two U.S. nationwide, prospective cohort
studies, which integrates epidemiologic exposures, clinicopathologic features, key tumor
molecular features, and immune reaction status in colorectal cancer tissue (49, 50). This
population-based colorectal cancer database enabled us to rigorously examine the association of
tumor MIR21 expression with the density of T cells, controlling for potential confounders. In
addition, our colorectal cancer specimens were derived from a large number of hospitals in
diverse settings across the U.S. (but not based on a limited number of hospitals), which increase
the generalizability of our findings. As another strength, we used robust laboratory assays,
including microRNA analysis and tissue image analysis that could objectively quantify specific
T cells in tumor tissue.
In conclusion, tumor MIR21 expression is inversely associated with the densities of CD3+
and CD45RO+ T cells in colorectal cancer tissue. Our data support a possible role of MIR21 in
down-regulating antitumor T-cell–mediated adaptive immunity, and suggest MIR21 as a
potential target for immunotherapy and immunoprevention in colorectal cancer.
on May 25, 2020. © 2015 American Association for Cancer Research. cancerimmunolres.aacrjournals.org Downloaded from
Author manuscripts have been peer reviewed and accepted for publication but have not yet been edited. Author Manuscript Published OnlineFirst on September 29, 2015; DOI: 10.1158/2326-6066.CIR-15-0084
Mima K et al. MIR21, T cells, and Colorectal Cancer. Page 16
References
1. Sharma P, Allison JP. The future of immune checkpoint therapy. Science 2015;348:56-
61. 2. Vanneman M, Dranoff G. Combining immunotherapy and targeted therapies in cancer
treatment. Nat Rev Cancer 2012;12:237-51. 3. Topalian SL, Hodi FS, Brahmer JR, Gettinger SN, Smith DC, McDermott DF, et al.
Safety, activity, and immune correlates of anti-PD-1 antibody in cancer. N Engl J Med 2012;366:2443-54.
4. Snyder A, Makarov V, Merghoub T, Yuan J, Zaretsky JM, Desrichard A, et al. Genetic
basis for clinical response to CTLA-4 blockade in melanoma. N Engl J Med 2014;371:2189-99.
5. Herbst RS, Soria JC, Kowanetz M, Fine GD, Hamid O, Gordon MS, et al. Predictive
correlates of response to the anti-PD-L1 antibody MPDL3280A in cancer patients. Nature 2014;515:563-7.
6. Pages F, Berger A, Camus M, Sanchez-Cabo F, Costes A, Molidor R, et al. Effector
memory T cells, early metastasis, and survival in colorectal cancer. N Engl J Med 2005;353:2654-66.
7. Nosho K, Baba Y, Tanaka N, Shima K, Hayashi M, Meyerhardt JA, et al. Tumour-
infiltrating T-cell subsets, molecular changes in colorectal cancer, and prognosis: cohort study and literature review. J Pathol 2010;222:350-66.
8. Salama P, Phillips M, Grieu F, Morris M, Zeps N, Joseph D, et al. Tumor-infiltrating
FOXP3+ T regulatory cells show strong prognostic significance in colorectal cancer. J Clin Oncol 2009;27:186-92.
9. Llosa NJ, Cruise M, Tam A, Wicks EC, Hechenbleikner EM, Taube JM, et al. The
vigorous immune microenvironment of microsatellite instable colon cancer is balanced by multiple counter-inhibitory checkpoints. Cancer Discov 2015;5:43-51.
10. Le DT, Uram JN, Wang H, Bartlett BR, Kemberling H, Eyring AD, et al. PD-1 Blockade
in Tumors with Mismatch-Repair Deficiency. N Engl J Med 2015;372:2509-20. 11. Alexander J, Watanabe T, Wu TT, Rashid A, Li S, Hamilton SR. Histopathological
identification of colon cancer with microsatellite instability. Am J Pathol 2001;158:527-35.
on May 25, 2020. © 2015 American Association for Cancer Research. cancerimmunolres.aacrjournals.org Downloaded from
Author manuscripts have been peer reviewed and accepted for publication but have not yet been edited. Author Manuscript Published OnlineFirst on September 29, 2015; DOI: 10.1158/2326-6066.CIR-15-0084
Mima K et al. MIR21, T cells, and Colorectal Cancer. Page 17
12. Tougeron D, Fauquembergue E, Rouquette A, Le Pessot F, Sesboue R, Laurent M, et al. Tumor-infiltrating lymphocytes in colorectal cancers with microsatellite instability are correlated with the number and spectrum of frameshift mutations. Mod Pathol 2009;22:1186-95.
13. Ogino S, Nosho K, Irahara N, Meyerhardt JA, Baba Y, Shima K, et al. Lymphocytic
reaction to colorectal cancer is associated with longer survival, independent of lymph node count, microsatellite instability, and CpG island methylator phenotype. Clin Cancer Res 2009;15:6412-20.
14. Ha M, Kim VN. Regulation of microRNA biogenesis. Nat Rev Mol Cell Biol
2014;15:509-24. 15. Tili E, Michaille JJ, Croce CM. MicroRNAs play a central role in molecular dysfunctions
linking inflammation with cancer. Immunol Rev 2013;253:167-84. 16. Pencheva N, Tavazoie SF. Control of metastatic progression by microRNA regulatory
networks. Nat Cell Biol 2013;15:546-54. 17. Asangani IA, Rasheed SA, Nikolova DA, Leupold JH, Colburn NH, Post S, et al.
MicroRNA-21 (miR-21) post-transcriptionally downregulates tumor suppressor Pdcd4 and stimulates invasion, intravasation and metastasis in colorectal cancer. Oncogene 2008;27:2128-36.
18. Iliopoulos D, Jaeger SA, Hirsch HA, Bulyk ML, Struhl K. STAT3 activation of miR-21
and miR-181b-1 via PTEN and CYLD are part of the epigenetic switch linking inflammation to cancer. Mol Cell 2010;39:493-506.
19. Oue N, Anami K, Schetter AJ, Moehler M, Okayama H, Khan MA, et al. High miR-21
expression from FFPE tissues is associated with poor survival and response to adjuvant chemotherapy in colon cancer. Int J Cancer 2014;134:1926-34.
20. Schetter AJ, Leung SY, Sohn JJ, Zanetti KA, Bowman ED, Yanaihara N, et al.
MicroRNA expression profiles associated with prognosis and therapeutic outcome in colon adenocarcinoma. JAMA 2008;299:425-36.
21. Sempere LF, Preis M, Yezefski T, Ouyang H, Suriawinata AA, Silahtaroglu A, et al.
Fluorescence-based codetection with protein markers reveals distinct cellular compartments for altered MicroRNA expression in solid tumors. Clin Cancer Res 2010;16:4246-55.
22. Sheedy FJ, Palsson-McDermott E, Hennessy EJ, Martin C, O'Leary JJ, Ruan Q, et al.
Negative regulation of TLR4 via targeting of the proinflammatory tumor suppressor PDCD4 by the microRNA miR-21. Nat Immunol 2010;11:141-7.
on May 25, 2020. © 2015 American Association for Cancer Research. cancerimmunolres.aacrjournals.org Downloaded from
Author manuscripts have been peer reviewed and accepted for publication but have not yet been edited. Author Manuscript Published OnlineFirst on September 29, 2015; DOI: 10.1158/2326-6066.CIR-15-0084
Mima K et al. MIR21, T cells, and Colorectal Cancer. Page 18
23. Merline R, Moreth K, Beckmann J, Nastase MV, Zeng-Brouwers J, Tralhao JG, et al. Signaling by the matrix proteoglycan decorin controls inflammation and cancer through PDCD4 and MicroRNA-21. Sci Signal 2011;4:ra75.
24. Lu L, Byrnes K, Han C, Wang Y, Wu T. miR-21 targets 15-PGDH and promotes
cholangiocarcinoma growth. Mol Cancer Res 2014;12:890-900. 25. Lippitz BE. Cytokine patterns in patients with cancer: a systematic review. Lancet Oncol
2013;14:e218-28. 26. Wang D, Dubois RN. Eicosanoids and cancer. Nat Rev Cancer 2010;10:181-93. 27. Liao X, Lochhead P, Nishihara R, Morikawa T, Kuchiba A, Yamauchi M, et al. Aspirin
use, tumor PIK3CA mutation, and colorectal-cancer survival. N Engl J Med 2012;367:1596-606.
28. Nishihara R, Lochhead P, Kuchiba A, Jung S, Yamauchi M, Liao X, et al. Aspirin use
and risk of colorectal cancer according to BRAF mutation status. JAMA 2013;309:2563-71.
29. Schmittgen TD, Livak KJ. Analyzing real-time PCR data by the comparative C(T)
method. Nat Protoc 2008;3:1101-8. 30. Ogino S, Nosho K, Kirkner GJ, Kawasaki T, Meyerhardt JA, Loda M, et al. CpG island
methylator phenotype, microsatellite instability, BRAF mutation and clinical outcome in colon cancer. Gut 2009;58:90-6.
31. Ogino S, Kawasaki T, Nosho K, Ohnishi M, Suemoto Y, Kirkner GJ, et al. LINE-1
hypomethylation is inversely associated with microsatellite instability and CpG island methylator phenotype in colorectal cancer. Int J Cancer 2008;122:2767-73.
32. Irahara N, Nosho K, Baba Y, Shima K, Lindeman NI, Hazra A, et al. Precision of
pyrosequencing assay to measure LINE-1 methylation in colon cancer, normal colonic mucosa, and peripheral blood cells. J Mol Diagn 2010;12:177-83.
33. Ogino S, Kawasaki T, Brahmandam M, Cantor M, Kirkner GJ, Spiegelman D, et al.
Precision and performance characteristics of bisulfite conversion and real-time PCR (MethyLight) for quantitative DNA methylation analysis. J Mol Diagn 2006;8:209-17.
34. Ogino S, Kawasaki T, Kirkner GJ, Kraft P, Loda M, Fuchs CS. Evaluation of markers for
CpG island methylator phenotype (CIMP) in colorectal cancer by a large population-based sample. J Mol Diagn 2007;9:305-14.
35. Ogino S, Kawasaki T, Brahmandam M, Yan L, Cantor M, Namgyal C, et al. Sensitive
sequencing method for KRAS mutation detection by Pyrosequencing. J Mol Diagn 2005;7:413-21.
on May 25, 2020. © 2015 American Association for Cancer Research. cancerimmunolres.aacrjournals.org Downloaded from
Author manuscripts have been peer reviewed and accepted for publication but have not yet been edited. Author Manuscript Published OnlineFirst on September 29, 2015; DOI: 10.1158/2326-6066.CIR-15-0084

Mima K et al. MIR21, T cells, and Colorectal Cancer. Page 19
36. Imamura Y, Lochhead P, Yamauchi M, Kuchiba A, Qian ZR, Liao X, et al. Analyses of clinicopathological, molecular, and prognostic associations of KRAS codon 61 and codon 146 mutations in colorectal cancer: cohort study and literature review. Mol Cancer 2014;13:135.
37. Nosho K, Kawasaki T, Ohnishi M, Suemoto Y, Kirkner GJ, Zepf D, et al. PIK3CA
mutation in colorectal cancer: relationship with genetic and epigenetic alterations. Neoplasia 2008;10:534-41.
38. Liao X, Morikawa T, Lochhead P, Imamura Y, Kuchiba A, Yamauchi M, et al.
Prognostic role of PIK3CA mutation in colorectal cancer: cohort study and literature review. Clin Cancer Res 2012;18:2257-68.
39. Maker AV, Ito H, Mo Q, Weisenberg E, Qin LX, Turcotte S, et al. Genetic evidence that
intratumoral T-cell proliferation and activation are associated with recurrence and survival in patients with resected colorectal liver metastases. Cancer Immunol Res 2015;3:380-8.
40. Turcotte S, Katz SC, Shia J, Jarnagin WR, Kingham TP, Allen PJ, et al. Tumor MHC
class I expression improves the prognostic value of T-cell density in resected colorectal liver metastases. Cancer Immunol Res 2014;2:530-7.
41. Kibe S, Yutani S, Motoyama S, Nomura T, Tanaka N, Kawahara A, et al. Phase II study
of personalized peptide vaccination for previously treated advanced colorectal cancer. Cancer Immunol Res 2014;2:1154-62.
42. Li Z, Rana TM. Therapeutic targeting of microRNAs: current status and future
challenges. Nat Rev Drug Discov 2014;13:622-38. 43. Fassan M, Pizzi M, Giacomelli L, Mescoli C, Ludwig K, Pucciarelli S, et al. PDCD4
nuclear loss inversely correlates with miR-21 levels in colon carcinogenesis. Virchows Arch 2011;458:413-9.
44. Chang KH, Miller N, Kheirelseid EA, Ingoldsby H, Hennessy E, Curran CE, et al.
MicroRNA-21 and PDCD4 expression in colorectal cancer. Eur J Surg Oncol 2011;37:597-603.
45. Janssen HL, Reesink HW, Lawitz EJ, Zeuzem S, Rodriguez-Torres M, Patel K, et al.
Treatment of HCV infection by targeting microRNA. N Engl J Med 2013;368:1685-94. 46. Guinea-Viniegra J, Jimenez M, Schonthaler HB, Navarro R, Delgado Y, Concha-Garzon
MJ, et al. Targeting miR-21 to treat psoriasis. Sci Transl Med 2014;6:225re1. 47. Ogino S, Lochhead P, Giovannucci E, Meyerhardt JA, Fuchs CS, Chan AT. Discovery of
colorectal cancer PIK3CA mutation as potential predictive biomarker: power and promise of molecular pathological epidemiology. Oncogene 2014;33:2949-55.
on May 25, 2020. © 2015 American Association for Cancer Research. cancerimmunolres.aacrjournals.org Downloaded from
Author manuscripts have been peer reviewed and accepted for publication but have not yet been edited. Author Manuscript Published OnlineFirst on September 29, 2015; DOI: 10.1158/2326-6066.CIR-15-0084

Mima K et al. MIR21, T cells, and Colorectal Cancer. Page 20
48. Huang TH, Wu F, Loeb GB, Hsu R, Heidersbach A, Brincat A, et al. Up-regulation of miR-21 by HER2/neu signaling promotes cell invasion. J Biol Chem 2009;284:18515-24.
49. Ogino S, Chan AT, Fuchs CS, Giovannucci E. Molecular pathological epidemiology of
colorectal neoplasia: an emerging transdisciplinary and interdisciplinary field. Gut 2011;60:397-411.
50. Song M, Nishihara R, Wang M, Chan AT, Qian ZR, Inamura K, et al. Plasma 25-
hydroxyvitamin D and colorectal cancer risk according to tumour immunity status. Gut 2015 in press (published online).
on May 25, 2020. © 2015 American Association for Cancer Research. cancerimmunolres.aacrjournals.org Downloaded from
Author manuscripts have been peer reviewed and accepted for publication but have not yet been edited. Author Manuscript Published OnlineFirst on September 29, 2015; DOI: 10.1158/2326-6066.CIR-15-0084
Mima K et al. MIR21, T cells, and Colorectal Cancer. Page 21
Figure Legend
Figure 1. MIR21 expression in colorectal cancer.
A, Quantitative reverse-transcription PCR assays for MIR21 and RNU6-2 using 10-fold dilution
series (1:1000, 1:100, 1:10, and 1:1) from the same specimen. Mean cycle threshold values (±
standard deviation) of triplicate runs and the coefficient of determination (r2) in the assays for
MIR21 and RNU6-2 are shown. cDNA, complementary DNA; PCR, polymerase chain reaction.
B, MIR21 expression in 54 pairs of colorectal cancer and adjacent non-tumor colonic mucosa. A
statistical analysis was performed using two-sided Wilcoxon signed rank test.
on May 25, 2020. © 2015 American Association for Cancer Research. cancerimmunolres.aacrjournals.org Downloaded from
Author manuscripts have been peer reviewed and accepted for publication but have not yet been edited. Author Manuscript Published OnlineFirst on September 29, 2015; DOI: 10.1158/2326-6066.CIR-15-0084

Mima K et al. MIR21, T cells, and Colorectal Cancer. Page 22
Table 1. Inter-assay coefficients of variation in quantitative reverse-transcription PCR assays for MIR21 and RNU6-2
Targets in quantitative reverse-transcription PCR assays MIR21 RNU6-2
Mean cycle threshold ± SD
Inter-assay coefficient of variation (%)
Mean cycle threshold ± SD
Inter-assay coefficient of variation (%)
Specimen 1 19.5 ± 0.06 0.28 19.9 ± 0.13 0.65 Specimen 2 19.5 ± 0.07 0.36 21.2 ± 0.15 0.73 Specimen 3 19.3 ± 0.09 0.44 21.0 ± 0.18 0.86 Specimen 4 20.0 ± 0.09 0.46 22.1 ± 0.09 0.39 Specimen 5 18.0 ± 0.10 0.55 21.0 ± 0.12 0.59 Mean coefficient of variation (%)
0.42 0.64
Abbreviations: PCR, polymerase chain reaction; SD, standard deviation. Inter-assay coefficient of variation of cycle threshold values from the same specimen was assessed by repeating assays in five different batches with the use of five colorectal cancers.
on May 25, 2020. © 2015 American Association for Cancer Research. cancerimmunolres.aacrjournals.org Downloaded from
Author manuscripts have been peer reviewed and accepted for publication but have not yet been edited. Author Manuscript Published OnlineFirst on September 29, 2015; DOI: 10.1158/2326-6066.CIR-15-0084
Mima K et al. MIR21, T cells, and Colorectal Cancer. Page 23
Table 2. Clinical, pathological, and molecular features according to tumor MIR21 expression in 538 colorectal cancer cases
Tumor MIR21 expression (quartile)
Characteristica Total No. (n = 538)
Q1 (lowest) (n = 135)
Q2 (second) (n = 134)
Q3 (third)
(n = 134)
Q4 (highest) (n = 135) P valueb
Mean age ± SD (year) 67.6 ± 8.3 66.7 ± 8.2 67.2 ± 8.5 68.8 ± 8.1 67.5 ± 8.3 0.19 Sex 0.044
Men 185 (34%) 50 (37%) 44 (33%) 56 (42%) 35 (26%) Women 353 (66%) 85 (63%) 90 (67%) 78 (58%) 100 (74%)
Year of diagnosis 0.006
Prior to 1995 201 (38%) 63 (47%) 55 (41%) 42 (32%) 41 (30%) 1996 to 2000 202 (38%) 43 (32%) 54 (40%) 44 (34%) 61 (45%) 2001 to 2008 131 (24%) 28 (21%) 25 (19%) 45 (34%) 33 (25%)
Family history of colorectal cancer in a first-degree relative 0.21
Absent 422 (79%) 105 (78%) 111 (83%) 96 (74%) 110 (82%) Present 109 (21%) 29 (22%) 22 (17%) 34 (26%) 24 (18%)
Tumor location 0.30
Cecum 96 (18%) 20 (15%) 22 (17%) 27 (20%) 27 (20%) Ascending to transverse colon 173 (32%) 39 (29%) 40 (30%) 43 (32%) 51 (38%) Splenic flexure to sigmoid 149 (28%) 39 (29%) 44 (33%) 31 (23%) 35 (26%) Rectosigmoid and rectum 117 (22%) 36 (27%) 27 (20%) 33 (25%) 21 (16%)
Disease stage 0.009
I 110 (21%) 37 (28%) 29 (22%) 23 (18%) 21 (16%) II 173 (34%) 44 (34%) 45 (35%) 44 (35%) 40 (31%) III 164 (32%) 31 (24%) 44 (34%) 48 (39%) 41 (32%) IV 67 (13%) 18 (14%) 11 (8.5%) 10 (8.0%) 28 (21%)
Tumor differentiation 0.24
Well to moderate 486 (91%) 121 (90%) 127 (95%) 119 (89%) 119 (88%) Poor 51 (9.5%) 13 (9.7%) 7 (5.2%) 15 (11%) 16 (12%)
MSI status 0.26
MSI-low/MSS 440 (84%) 114 (87%) 115 (86%) 107 (82%) 104 (79%) MSI-high 86 (16%) 17 (13%) 18 (14%) 24 (18%) 27 (21%)
MLH1 hypermethylation 0.15
Absent 461 (87%) 118 (89%) 121 (91%) 109 (83%) 113 (85%) Present 69 (13%) 14 (11%) 12 (9.0%) 23 (17%) 20 (15%)
on May 25, 2020. © 2015 American Association for Cancer Research. cancerimmunolres.aacrjournals.org Downloaded from
Author manuscripts have been peer reviewed and accepted for publication but have not yet been edited. Author Manuscript Published OnlineFirst on September 29, 2015; DOI: 10.1158/2326-6066.CIR-15-0084
Mima K et al. MIR21, T cells, and Colorectal Cancer. Page 24
CIMP status 0.015 Low/negative 440 (83%) 113 (86%) 119 (89%) 108 (82%) 100 (75%) High 90 (17%) 19 (14%) 14 (11%) 24 (18%) 33 (25%)
BRAF mutation 0.003
Wild-type 444 (84%) 120 (90%) 116 (88%) 110 (82%) 98 (75%) Mutant 86 (16%) 13 (9.8%) 16 (12%) 24 (18%) 33 (25%)
KRAS mutation 0.11
Wild-type 311 (59%) 76 (58%) 67 (51%) 88 (66%) 80 (61%) Mutant 216 (41%) 55 (42%) 64 (49%) 46 (34%) 51 (39%)
PIK3CA mutation 0.86
Wild-type 408 (83%) 99 (84%) 104 (82%) 105 (82%) 100 (85%) Mutant 82 (17%) 19 (16%) 23 (18%) 23 (18%) 17 (15%)
Mean LINE-1 methylation level (%) ± SD 61.6 ± 9.6 61.6 ± 8.4 59.6 ± 10.4 62.1 ± 10.2 63.0 ± 9.1 0.032
Abbreviations: CIMP, CpG island methylator phenotype; LINE-1, long interspersed nucleotide element-1; MSI, microsatellite instability; MSS, microsatellite stable; Q1 to Q4, quartile 1 to quartile 4; SD, standard deviation. a Percentage indicates the proportion of cases with a specific clinical, pathological, or molecular feature in colorectal cancer cases with each tumor MIR21 expression. There were cases that had missing values for any of the characteristics except for age and sex. b To assess associations between the ordinal categories (first to fourth quartile) of tumor MIR21 expression and categorical data, the chi-square test was performed. To compare mean age and mean LINE-1 methylation levels, an analysis of variance was performed. We adjusted two-sided α level to 0.003 (= 0.05/14) by simple Bonferroni correction for multiple hypothesis testing.
on May 25, 2020. © 2015 American Association for Cancer Research. cancerimmunolres.aacrjournals.org Downloaded from
Author manuscripts have been peer reviewed and accepted for publication but have not yet been edited. Author Manuscript Published OnlineFirst on September 29, 2015; DOI: 10.1158/2326-6066.CIR-15-0084
Mima K et al. MIR21, T cells, and Colorectal Cancer. Page 25
Table 3. Distribution of colorectal cancer cases according to tumor MIR21 expression and the density of T cells
Tumor MIR21 expression (quartile)
Total No. Q1
(lowest) Q2
(second) Q3
(third) Q4
(highest) Ptrenda
CD3+ cell density (quartile) 0.0004 Q1 (0-115 cells/mm2) 130 (25%) 26 (20%) 29 (22%) 31 (25%) 44 (33%) Q2 (116-252 cells/mm2) 129 (25%) 26 (20%) 30 (23%) 35 (28%) 38 (29%) Q3 (253-533 cells/mm2) 130 (25%) 42 (32%) 33 (25%) 30 (24%) 25 (19%) Q4 (≥534 cells/mm2) 129 (25%) 38 (28%) 38 (30%) 28 (23%) 25 (19%)
CD8+ cell density (quartile) 0.27
Q1 (0-66 cells/mm2) 128 (25%) 23 (18%) 31 (24%) 40 (32%) 34 (26%) Q2 (67-185 cells/mm2) 127 (25%) 42 (33%) 26 (20%) 28 (23%) 31 (24%) Q3 (186-410 cells/mm2) 128 (25%) 30 (24%) 34 (26%) 28 (23%) 36 (27%) Q4 (≥411 cells/mm2) 127 (25%) 31 (25%) 39 (30%) 27 (22%) 30 (23%)
CD45RO+ cell density (quartile) 0.0002
Q1 (0-183 cells/mm2) 131 (25%) 24 (18%) 30 (23%) 31 (24%) 46 (35%) Q2 (184-430 cells/mm2) 130 (25%) 32 (25%) 33 (25%) 39 (31%) 26 (20%) Q3 (431-805 cells/mm2) 131 (25%) 26 (20%) 37 (27%) 30 (24%) 38 (29%) Q4 (≥806 cells/mm2) 130 (25%) 48 (37%) 33 (25%) 27 (21%) 22 (16%)
FOXP3+ cell density (quartile) 0.032
Q1 (0-14 cells/mm2) 124 (25%) 25 (20%) 31 (26%) 32 (27%) 36 (28%) Q2 (15-25 cells/mm2) 124 (25%) 29 (23%) 24 (20%) 34 (28%) 37 (28%) Q3 (26-48 cells/mm2) 124 (25%) 38 (31%) 27 (22%) 27 (22%) 32 (25%) Q4 (≥49 cells/mm2) 123 (25%) 32 (26%) 38 (32%) 28 (23%) 25 (19%)
Abbreviations: Q1 to Q4, quartile 1 to quartile 4. a Ptrend value was calculated by the linear trend test across the ordinal (first to fourth quartile) categories of tumor MIR21 expression as a continuous variable in univariable ordinal logistic regression model for the density of CD3+, CD8+, CD45RO+, or FOXP3+ T cells (an ordinal quartile outcome variable). Because we assessed four primary outcome variables, we adjusted two-sided α level to 0.012 (= 0.05/4) by simple Bonferroni correction.
on May 25, 2020. © 2015 American Association for Cancer Research. cancerimmunolres.aacrjournals.org Downloaded from
Author manuscripts have been peer reviewed and accepted for publication but have not yet been edited. Author Manuscript Published OnlineFirst on September 29, 2015; DOI: 10.1158/2326-6066.CIR-15-0084
Mima K et al. MIR21, T cells, and Colorectal Cancer. Page 26
Table 4. The association of tumor MIR21 expression with the density of T cells
Univariable OR (95% CI)
Multivariable OR (95% CI)a
Model for CD3+ cell density (n = 518, as an outcome variable) MIR21 expression Q1 (lowest) 1 (reference) 1 (reference)
Q2 (second) 0.88 (0.57-1.36) 0.85 (0.55-1.31) Q3 (third) 0.67 (0.43-1.04) 0.59 (0.37-0.92)
Q4 (highest) 0.47 (0.31-0.73) 0.44 (0.28-0.68) Ptrend
b 0.0004 < 0.0001 Model for CD8+ cell density (n = 510, as an outcome variable) MIR21 expression Q1 (lowest) 1 (reference) 1 (reference)
Q2 (second) 1.14 (0.74-1.77) 1.25 (0.80-1.96) Q3 (third) 0.72 (0.46-1.12) 0.76 (0.48-1.19)
Q4 (highest) 0.89 (0.58-1.38) 0.99 (0.63-1.54) Ptrend
b 0.27 0.50 Model for CD45RO+ cell density (n = 522, as an outcome variable) MIR21 expression Q1 (lowest) 1 (reference) 1 (reference)
Q2 (second) 0.70 (0.46-1.09) 0.72 (0.46-1.12) Q3 (third) 0.57 (0.37-0.89) 0.54 (0.34-0.84)
Q4 (highest) 0.45 (0.29-0.70) 0.41 (0.26-0.64) Ptrend
b 0.0002 < 0.0001 Model for FOXP3+ cell density (n = 495, as an outcome variable) MIR21 expression Q1 (lowest) 1 (reference) 1 (reference)
Q2 (second) 0.98 (0.63-1.54) 0.93 (0.59-1.46) Q3 (third) 0.73 (0.47-1.14) 0.61 (0.39-0.96)
Q4 (highest) 0.66 (0.42-1.02) 0.55 (0.35-0.86) Ptrend
b 0.032 0.003 Abbreviations: CI, confidence interval; OR, odds ratio; Q1 to Q4, quartile 1 to quartile 4. a The multivariable ordinal logistic regression analysis model initially included age, sex, year of diagnosis, family history of colorectal cancer in parent or sibling, tumor location, tumor differentiation, microsatellite instability, CpG island methylator phenotype, KRAS, BRAF, and PIK3CA mutations, and LINE-1 methylation level. A backward stepwise elimination with a threshold of P = 0.05 was used to select variables in the final models. Variables remaining in the final multivariable ordinal logistic regression models are shown in Supplementary Table S2. b Ptrend value was calculated by the linear trend across the ordinal (first to fourth quartile) categories of MIR21 expression as a continuous variable in the ordinal logistic regression model for the density of CD3+, CD8+, CD45RO+, or FOXP3+ T cells (an ordinal quartile outcome variable). Because we assessed four primary outcome variables, we adjusted two-sided α level to 0.012 (= 0.05/4) by simple Bonferroni correction.
on May 25, 2020. © 2015 American Association for Cancer Research. cancerimmunolres.aacrjournals.org Downloaded from
Author manuscripts have been peer reviewed and accepted for publication but have not yet been edited. Author Manuscript Published OnlineFirst on September 29, 2015; DOI: 10.1158/2326-6066.CIR-15-0084
Published OnlineFirst September 29, 2015.Cancer Immunol Res Kosuke Mima, Reiko Nishihara, Jonathan Nowak, et al.
and T-cells in Colorectal CancerMIR21MicroRNA
Updated version
10.1158/2326-6066.CIR-15-0084doi:
Access the most recent version of this article at:
Manuscript
Authoredited. Author manuscripts have been peer reviewed and accepted for publication but have not yet been
E-mail alerts related to this article or journal.Sign up to receive free email-alerts
Subscriptions
Reprints and
To order reprints of this article or to subscribe to the journal, contact the AACR Publications
Permissions
Rightslink site. Click on "Request Permissions" which will take you to the Copyright Clearance Center's (CCC)
.http://cancerimmunolres.aacrjournals.org/content/early/2015/09/29/2326-6066.CIR-15-0084To request permission to re-use all or part of this article, use this link
on May 25, 2020. © 2015 American Association for Cancer Research. cancerimmunolres.aacrjournals.org Downloaded from
Author manuscripts have been peer reviewed and accepted for publication but have not yet been edited. Author Manuscript Published OnlineFirst on September 29, 2015; DOI: 10.1158/2326-6066.CIR-15-0084