minnesota pollution control agency frank j. ebert st. · pdf filemajor issues are anxiously...
TRANSCRIPT

1
Minnesota Pollution Control Agency Frank J. Ebert 520 Lafayette Road North 100 Scott Terrace St. Paul, Minnesota 55155-4194 Le Sueur, MN. 56058 Attention: Mr. William Lynott Phone: (507) 665-2271 E-mail: [email protected] Subject: Hometown BioEnergy Facility, Le Sueur County. Response to the 30 day EAW. Dear Mr. Lynott, EQB Staff, and other Agencies or persons of interest and importance. The following is my written review and comments on the EAW for the proposed Hometown BioEnergy Facility, Le Sueur County, which was referenced in the February 6, 2012 MPCA announcement. These comments are submitted within the 30-day review and comment period pursuant to the EQB rules. It is of vital importance to announce my review represents 1,075 citizens by their request. To prevent excess generation of responses from these individual citizens we felt this one large document may be more effective to process rather than attempting to flood the MPCA with multiple letters. However, it is expected there may be other groups or individuals that may respond independently. We all express our appreciation to the MPCA for all of their hard work and many hours invested to provide the best and most accurate and fair results of this project. Please feel free to contact me at any time if any further correspondence is desired. My basic qualifications while at General Mills Inc. included seventeen years as a manager of an Analytical laboratory, 5 years as the OSHA safety manager, and my last 7 years as the Environmental Manager responsible for seven facilities. I have graduate degrees in the Chemical and Biological Sciences. I also have many other minors in the Science field. I thought it of value to share some of my most relevant credentials pertaining to this matter. I note that Hometown BioEnergy has applied for an Air Emission Permit and a State Disposal System Permit and that I may submit written comments on the draft permits to the MPCA staff during the scheduled March 20, 2012, public information meeting in Le Sueur, by mail or by e-mail to the MPCA any time during the public notice period and that these comments must arrive at MPCA at or before 4:30 p.m. Tuesday, March 27, 2012. The anaerobic digester process, incompletely described in the EAW, appears to be a new and untested technology. The many unknowns that now exist cause concern to all who read this EAW and the real possibility of a multitude of major issues are anxiously invoked by the incompleteness of the current EAW. How will the public know if these Environmental Issues will be addressed by the MPCA and other responsible governmental agencies if they are not now being addressed in the current EAW? How will the safety and welfare of the public be assured and maintained into the future, should this project go forward based on this incomplete and insufficient process?
1

2
Because of: • missing permits, • incomplete and insufficient information in support of the process design, • potential performance issues in what clearly is a new and untested technology, • the many unknowns that now exist and which cause concern to all who read this EAW, • and the multitude of major issues anxiously invoked by the incompleteness of the current EAW and the
missing companion permit applications. Myself, along with 1,074 Le Sueur-area residents are requesting the continuation of this process to completion through an EIS. Finally because of the lack of essential information I am unable to address specific Environmental Issues since these systematically interconnect with other unknown potential performance issues. For that reason, within my summary some non-specific Environmental Issues will have to be included. Sincerely yours, Frank J. Ebert 3/01/2012.

3
Health Sanitation concerns:
• Because of the design of this project, related to various feedstock high-volume and the storage conditions from the large effluent holding ponds there is a high potential for the attraction of disease vectors, such as flies, vermin, and birds. What preventive measures are and will be implemented to control these health concerns regarding potential transmission and control of diseases.
• Depending on the type of silage storage and conditions, what assurances are there to ensure there are no mold issues which generate mycotoxins that are known to be highly detrimental to health?
• These concerns indicate a need for a Health Risk Assessment by the Minnesota Department of Health.
Section 6 Description; Feedstock and the biodigester process concerns:
• Depending on the type of silage storage and conditions, what assurances are there to ensure there are no mold issues which generate mycotoxins that are known to be highly detrimental to health?
• Exact control of the balance of feedstock in a digester is critical. Carbon:Nitrogen ratios are 1:15 to 1:30 or digester performance issues can occur. Too little nitrogen will not promote proper bacterial growth, and too much nitrogen can form ammonia products which will affect growth of the bacterial fermentation process. This project claims the use of many potential types of feedstocks. What type of studies, procedures, and preparations will be implemented to ensure proper balance of the feedstock nutrients.
• pH is critical for biodigester performance. What type of studies and procedures will be implemented to ensure proper pH control? (The optimum biogas production is achieved when the pH value of input mixture in the digester is between 6 and 7. The pH in a biogas digester is also a function of the retention time. In the initial period of fermentation, as large amounts of organic acids are produced by acid-forming bacteria, the pH inside the digester can decrease to below 5. This inhibits or even stops the digestion or fermentation process. Methanogenic bacteria are very sensitive to pH and do not thrive below a value of 6.5. Later, as the digestion process continues, concentration of NH4 increases due to digestion of nitrogen which can increase the pH value to above 8. When the methane production level is stabilized, the pH range remains buffered between 7.2 to 8.2.
• pH and exact control of nutrient balances are critical for proper digester performance. What effect will the addition of silage run-off diverted to the digester have on digester performance? Silage has a very low pH and can drastically affect digester performance.
• What pH and possible pH buffer procedures are included for monitoring and for pH control? Has various buffer materials been included that will affect their hazardous material storage and hazardous waste programs?
• Generally, the type of material being processed in the digester will affect out- going mineral composition and therefore, alter fertilizer properties of the effluent. What type of analysis will be conducted to provide the mineral and nutrient content to the customers who might be using the effluent in their fertilizer process?
• A group of several citizens has inquired and researched this digester design. This appears to be the first of a kind with this type of digestion process. It appears no pilot studies have been conducted to ensure reliable and successful operation of this project.
• Page 3 in the EAW: The process design for the facility based on a “design case” of feedstock high highly variable and questions the controlled performance of digester efficiency and how this might affect the solid/water balances on the SDS Permit Environmental issues. The table on page 3 also has significant variation and distribution of percent solids. All of these variances make it difficult to evaluate the process and the actual mass balance system.
• How much heat energy is available to ensure proper temperature control for the digesters, the biological scrubber unit, and the digestate drying process? No calculation data are provided with the combination of biogas generated plus heat from the gensets to ensure enough heat energy will be generated to maintain digester required temperatures and to dry the digestate.

4
• Attachment #3 (Process flow diagram) illustrates heat generated from the engine jacket heat recovery is used to heat the feedstock pretreatment modules. However, there is no process indicating a reliable heat energy source to maintain the digester temperatures which are critical for digester required performance.
• What is the reliability of feedstock during the non-growing season in addition to silage? 15 to 55% of the additional feedstock listed as potato wastes and other vegetables are included in the feedstock composition and are seasonal materials. It is documented only silage will be stored. How can this feedstock supply be guaranteed during the non-season?
• Feedstock is listed at 45,000 tons per year dry weight. What is the actual percent moisture or percent solids in this feedstock material? Generally an acceptable estimate is about 25% solids or 75% water. At 25% solids, this would calculate to a total “as received weight” equal to 180,000 tons. This digester has been described by Avant BioPower Vice-President Kelsey Dahlen as a low solids digestion system. A low solids digestion system typically will not contain more than 12% solids. Therefore, to meet this requirement, this total 180,000 tons of feedstock would have to be diluted by adding an additional 180,000 tons of water. Yet it is stated that hardly any additional water will have to be added to the process. Attachment #3 illustrates that a certain amount of water recovered from the process after digestion will be sent back into the stock holding tank to provide this water source. Research indicates that no more than 30% of this effluent material can be added into the digester process without causing major negative effects to the digestion process (Lotte C, Malene L and Hellek N 1995.) This conflicts with the statement in section 13 “Water Use” which states nearly all water necessary for operations will be acquired via the high moisture feedstock and that no separate water supply will be needed for the digestion or ancillary processes. Because of this, the water balance process should be reviewed and corrected.
• What contingency plans have been developed to prepare for emergencies, maintenance-related shutdowns, feedstock supply interruptions, or digester malfunctions? Will feedstock deliveries continue to arrive if the plant is shut down? If the shipments stop, are suppliers responsible for redirecting the feedstock?
• Have long-term contracts been secured to ensure that reliable sources of all claimed feedstock will be consistently available?
• Have land application contracts and permits been completed to ensure the effluent will be totally removed from this facility?
• Have actions been studied or included that might affect any other permitted facilities in relationship to this project including suppliers, that would need to be modified to accommodate this project?
• Are there any tanks or structures that are specifically identified as above ground storage units (AST)? If so, are permits required and will they be registered, and has secondary containment to meet tank storage been processed and approved?
• Are all important structures for vessels or tanks addressed for secondary containment or other leaks or spills.
• Is there a plan for an emergency situation such as potential tank failures for these vessels? • Are there provisions for corrosion protection provisions for regular inspections and maintenance and leak
detection for the digesters? • Mesophilic bacteria requires strict temperature control. Just a few degrees variation in temperature can
shock and stop bacterial activity. What process is being used to ensure optimum efficiency required temperature control? What contingency plan has been designed to ensure optimum temperature control in case of various plant failures? (The methanogens are inactive in extreme high and low temperatures. The optimum temperature is 35 degrees C. or (95 degrees F.) When the ambient temperature goes down to 10 degrees C, gas production virtually stops. Satisfactory gas production takes place in the mesophilic range, between 25 degrees ( 77 degrees F. ) to 30 degrees C (86 degrees F.). Proper insulation of digester helps to increase gas production in the cold season. When the ambient temperature is 30 degrees C or less, the average temperature within the dome remains about 4 degrees C above the ambient temperature (Lund, Andersen and Torry-Smith, 1996). The EAW states the biodigester is to operate at a thermophylic temperature of 50 deg C. (122 Degrees F.) How will this temperature change affect the performance of their digester operation?

5
• Attachment #3 (Process flow diagram) illustrates heat generated from the engine jacket heat recovery is used to heat the feedstock pretreatment modules. However, there is no process indicating a reliable heat energy source to maintain the digester temperatures which are critical for optimal digester performance.
• What is the reliability of feedstock during the non-growing season in addition to silage? Fifteen to fifty-five percent (15 to 55%) of the additional feedstock listed as potato wastes and other vegetables are included in the feedstock composition and are seasonal materials. It is documented that only silage will be stored. How can this feedstock supply be guaranteed during the non-growing season?
Section 6. Description:Section (b). Page 5
• The EAW states the silage storage area (silage bunks) will be sized to store approximately 15,000 dry tons of silage in horizontal storage containers to prevent leachate runoff (page 5) utilizing a “horizontal storage bunk concept”. However, information in the EAW is again contradictory as it is further defined as “a pile concept” (page 14). What does this actually mean and which is it? Since silage isn’t dropped off at the site dry, shouldn’t the silage bunks be designed for wet tons? What is the wet tons storage capacity of the bunks? How will they be separated to ensure the covers work as designed and ensure precipitation doesn’t cause failure or come into contact with the silage?
• Attachment 12 does not clearly define the silage bunk structure. Define “soil cement surface” and “impervious surface with ballasts.” The EAW also states non-permeable covers will be installed on “each of the bunks” and the covers rolled back “one bunk at a time” in order to provide access for the removal of this material throughout the year. More detail on these silage bunks should be provided in an EIS in order to accurately identify significant environmental effects.
• What is meant by, “horizontal storage bunk concept”? What part is defined and what part is concept? • What will be proposed to ensure the impervious surface remains impervious over time and leachate doesn’t
enter soil and groundwater? • What are the design parameters and future monitoring requirements to ensure leachate does not cause
runoff concerns or leak into the soil and groundwater below the bunks? Does this “concept” interpret to mean that at least one silage bunk will be completely uncovered throughout the year in order to provide access?
• Does this “concept” interpret to mean that other silage bunks will have a permanent but removable roof (cover) over the bunk(s) at all times as odor mitigation and to ensure precipitation doesn’t come into contact with the silage? Please provide additional detail regarding the silage bunks in the EIS.
Section 6 b. By-product Production and Use; Digestate:
• What studies have been conducted to determine the efficiency of the digestate as an efficient fuel? Have any required combustion tests been conducted?
• What contracts have been signed to ensure valid and economic demand for this material?
• What provisions are accounted for if the digestate drying process gets shut down or fails?
• What provisions have been made in case users do not want to use, or the digestate cannot be transported? How will it be stored and how much will be stored on-site? How will this affect Environmental concerns and regulations?
• What impact or concerns will the presence of heavy metals have on emissions as related to health concerns and air permit requirements upon combustion of the digestate as a fuel?
• This digestate has been suggested as a fuel to supply energy for boilers. The digestate may contain considerable levels of silica-containing products and other minerals that may be detrimental to the boiler process by generating excess slag build up during combustion that might result in major issues. Has this potential issue been evaluated and considered?

6
• Several engineers have challenged if there is enough heat energy generated by this facility to allow drying of the digestate. Please provide studies to validate the energy available and energy required calculations to ensure the drying process.
• The biodigesters operate continuously 24 hours/day. However, it is stated the general production hours consist of 16 hours. What procedures and storage of the material consistently coming out of the digesters are provided to address the overnight accumulation of this material including generation of odors?
• The project claims 1 ton/hr. or 16 tons/day of digestate generated. Our calculations conflict with these statements. We would like this information further verified by showing how this is calculated. This could have major effects on their claims for the amount of digestate claimed as a potential fuel source.
• Example: Using the combination of feedstocks in the table on page 3 of the EAW, overall they contain 91% Volatile Solids or 41,000 tons VS. Of this, 33,812 tons are predicted to be utilized by the digestion process. This leaves 45,000 tons - 33,812 tons = 11,188 tons of dry material or 11,188/0.9 = 12,431 tons/yr of 10% moisture digestate. 12,431 tons/yr / 365 days/yr = 34.1 tons/day compared to the EAW estimate of 16 tons/day.
• Based on the last statement, if those calculations are correct, we request calculations to ensure enough heat energy will be available to dry this double amount of digestate generated.
Section 6 e.
“Is this project a subsequent stage of an earlier project?” The EAW response is no. It appears to me this might be a subsequent stage of the earlier MMPA-proposed LeSueur Energy Park project located off Hwy 169 north of Le Sueur.
Section 8 Permits and Approvals Required; Unavailable Permits:
• The only permit completed and able to evaluate is the Archeological and Historical Data Base Review. Other required permits of which some are related to specific Environmental subject matter are not available. This makes it impossible to provide adequate information to the public to respond effectively. In addition, the following permits listed below are expected to be included. This is another reason I am requesting an EIS.
Item 8. Permits and approvals required The following permits are not listed but are assumed to be required for the project:
• City of Le Sueur/ Le Sueur County (depending on annexation)– Conditional Use Permit • FAA – Notice of Proposed Construction or Alteration Form, Aeronautical Study, Wildlife Hazard Assessment • MPCA – Solid Waste Permit • MPCA – AST, UST, vessel permits • MPCA – other permits depending on actual waste application sites • Le Sueur County – WCA Permits • MDH via Le Sueur County – Well Permit(s) • Le Sueur County – Septic Permit • State of Minnesota – Plumbing Inspection • State of Minnesota – Electrical Inspection • Transmission approvals? • DNR – water appropriations permit • MDH – Health Risk Assessment • RCRA Hazardous Waste Permit (EPA Form 8700-23) • State Fire Marshall Fire Permit

7
Please also include all approvals and financial assistance for the project as required, specifically any direct and indirect forms of public financial assistance, such as grants as required.
Section 9 Land Use-Land Application on Nearby Farms; Heavy Metal Toxicity and Impacts in digestate and effluent:
• The impact of heavy metal toxicity that may concentrate and accumulate in the dry digestate and effluent through the process must be considered. Please refer to the publication entitled: Limits and Merits of Digested Application on Arable Land by Erin Pfundtner, the Departmental for Fertilizer Surveillance, Control, and Microscopy. Heavy metals that are included are Mercury, cadmium, lead, chromium, nickel, and Alkyl Benzene Sulfonates. For fertilizer applications, lead chromium and nickel are listed at 1 mg per kilogram, d.m. LAS at 2600mg/kg d.m.(=100%).
• If the digestate will be used for fuel as stated, how might this affect air permit and health impacts by users of this product?
• What are the potential risks and effects of heavy metals that may concentrate in the effluent regarding fertilizer applications
• Distances and directions within one mile of this site for waste application sites should be included as it may affect nearby residences, schools, daycare facilities, senior citizen housing, places of worship, and other places accessible to the public. This is a requirement for other EAWs prepared for similar projects for waste application sites.
Future land use. (Attachment 7). Residential affects:
• The information is this section appears to be not accurate. The nearest residential homestead is approximately 400 ft from the project boundary. There are also three (3) nearby residences that are approximately 925 ft and not 1,000 ft as stated on page 9, from the proposed silage bunks, and also approximately 1,000 ft (not 1,200 ft) from the covered liquid byproduct storage pond. One resident to the south which is 1,200 ft and not 2,000 feet from the main facility processing area.
• Separation distance should also be required for all building permits within 1,000 feet for residential structures in the City of Le Sueur and Le Sueur County.
Item 11. Fish, Wildlife and Ecologically Sensitive Resources.
Fieldwork should be conducted at the site during the most opportune times of year in order to determine if there are any species present in accordance with MN Rules 6134 an 6212.1800 to 621.12.2300 in order to ensure this project is in compliance with the Minnesota Environmental Protection Act and MN State Statutes
Item 13. Water Use • The entire stormwater collection system, site elevations, significant material contact, and industrial
wastewater ponds needs to be revisited in the EIS to meet local, state, and federal water standards. • A well inventory, followed by an Aquifer pump test should be included as part of the EIS per Minnesota
Department of Health guidance in order to account for all domestic, public, and irrigation wells in the area of the project to fully understand the environmental impacts from the amount of water dewatered from this well.
• The estimated water use volumes provided in the EAW are highly underestimated and incomplete. Therefore, there are potential significant environmental effects from this project that require further review in an EIS.
• The attachment 3 states “contact water bypass to lagoon” What “lagoon”? This is not shown in the figure on page 6. Where is this located and what size is it? Is it a lined and covered pond?

8
• Where will water required for the industrial operations at the site come from when it doesn’t rain? Where will water required for the industrial operations at the site come from when it snows? Where will water be stored when the site receives more rain or snow than assumed in this EAW?
• What effects will snow have in the proposed “trench drain”? • How will the proposer ensure the pump in the sump works during winter months? What is the emergency
procedure if the sump freezes? • What technologies will be employed to ensure the liquid waste ponds do not freeze? • In the EAW is states that 1.9 million gallons of water is expected to come from precipitation collected at the
site (page 16) with 65,000 gallons (0.65 million) of precipitation collected from the site every month of the year. What is the exact source that claim 18.8 million gallons per year of recycled water. This conflicts with the statement that “nearly all water necessary for operational [will] be acquired via the high moisture feedstock and that no separate water supply will be needed for the digestion or ancillary processes”. Because of this conflicting information the water balance process should be reviewed and corrected.
• The EAW also states the site will, “collect up to 8,000 gallons of contact stormwater per day” (page 14). If the water use cycle is dependent upon this as indicated throughout the EAW, then where will water come from when the site does not receive up to 8,000 gallons of contact stormwater per day?
• What is the volume of water required during start up. How many start up cycles will there be? How will this affect the total water balance claims?
• The EAW currently says 2,000 gallons of per day will be required for operations at the site. This equals 730,000 gallons per year. Since the water use for the site could very easily be upwards of 10,000 gallons of water per day or 1 million gallons per year, a permit to appropriate water should be required.
• It is recommended information in the EIS on the depth of the proposed well, how the well will be developed, and the aquifer the project will be dewatering from. At a minimum, the proposer should be required to report water use per MN DNR requirements. Water level monitoring and water quality analysis should be conducted annually to ensure the site is not contaminating drawdown nor creating a cone of depression to the local groundwater aquifer. Mitigation measures should be defined in response to monitoring activities.
Section 17 Water Quality-Surface-water Runoff; NPDES regarding the storm water holding pond:
• The storm water retention pond identified at the northwest corner as explained to me has been known and used for several generations as a popular swimming hole. Of major interest are several claims this is not used for specific storm water retention and is a spring feed system. I have no proof to validate this information. However, if this is true it might have future hydraulic issues on the land. Also, if various forms of leachate enter this system it may be possible it would act as a source of ground water contamination. For this reason it may be wise to verify this information.
• Section 17 b states the Northwest section will be filled in and another storm water pond will be constructed on the West side and in the Northeast corner of the site. “All other non-contact runoff will be received in an on-site storm water pond on the west side and in the Northeast corner of the site where it will “infiltrate” or evaporate. Attachment #7 refers to a shallow open water of 0.2 acres. In section 12 it is stated “Primary site storm water storage will be provided by the “existing pond” along the west side of the property” I do not see two storm water ponds illustrated. I do see one “shallow open water” site denoted in Illustration #6.
• This storm water design is highly confusing. Does the present storm water design meet proper storm water holding pond requirements?
Item 17. Water Quality – Surface Water Runoff. The stormwater system described in the EAW is incomplete and includes contradictory information. Based on the information provided, there are significant environmental effects from this project that require further review in an EIS.

9
• It appears the storm elevation data at 850 ft. is higher than the silage bunk storage areas proposed at 840 ft
msl. Where does stormwater go in the event of an emergency situation when the sump fails? How does the proposer plan to have stormwater run uphill from the silage bunker structures to be treated in this pond if the pump fails? The silage bunk structures are proposed in the lowest portion of the property and would require over 20 feet of fill in order to allow the “entire site” to be treated in the 0.3 acre storage pond.
• It does not appear that the storm water basin been sized to have the “capacity to infiltrate the 100-year, 24-hour storm runoff from the tributary area within 24 hours for the entire site.
• What effect will the impervious surfaces listed at 15.3 acres have on the 0.3 acre stormwater capacity? • How does the proposed stormwater facility ensure site improvements (specifically the silage bunk
structures) do not become flooded requiring stormwater to be diverted offsite?
Section 18 Water Quality—Wastewater; Waste Effluent Holding Ponds:
(Some of the concerns related to the holding ponds have been addressed within other related subjects but will be summarized again in this section and will include other information of concerns).
• The EAW states sanitary wastes will be treated with an on-site septic system (page 11). Subsurface Sewage Treatment Systems require in situ soils and soils protected from disturbance, compaction, etc per MN Rules. The septic drain field is shown on a portion of disturbed site. Provide more information on the placement of this drain field and treatment requirements per MN Rules 7080 and 7081 and MN Statute 115. Also, please provide the location of two septic sites as required.
• traffic and odor impacts, sanitation concerns, permit requirements for land applications, potential silage drainage to induce alteration of the effluent and generate odors.
• Effluent storage stated total capacity of 23,000,000 gallons per year with a landmass of approximately 5 acres, and covered by an impermeable cover. Little if any important information is provided to explain this structure. What type of covers will be used? Example 80 mm poly? How will the effluent be accessed?
• How is this over-structure designed, including the covers to address heavy rainfall and what impacts will winter conditions and snowfall have on the structure? Will there be a framework to support this structure and to ensure proper run-off?
• These type of holding ponds and at this size have the potential for accumulating solids and sludge at the bottom of the basins. How will this be managed on a long-term basis?
• To my knowledge there is no data identifying the nutrient content of the effluent for fertilizer applications. • How will effluent be removed from one of the two basins since they are separated by a centered dike? Are
they hydraulically connected? What provisions have been made to ensure the integrity of the center dike? • Has the required State “Anaerobic Sludge Digestion Review Checklist” been completed? This information is
not available. • How tightly sealed will this structure be to prevent the release of odors? • Bacterial activity may continue to occur in the effluent holding ponds in the event of (a) incomplete digestion,
(b) silage pile runoff, (c) flushed H2S from the biological units. Will this generate gases of concern? Will this structure require a flare in case significant gases are generated?
• If complete digestion is not performed, along with adding silage, and the flushing of the hydrogen sulfide from the biological units, continuous bacterial activity may continue to occur. Will this generate gases of concern? Will this structure require a flare in case significant gases are generated?
• Clarification is needed for waste applications stating “4,300 acres of corn to apply the entire annual production”. Since most farmers have either a corn-bean or third-crop rotation, waste application sites should be provided for at least 8,600 acres.

10
• Silage bunks have to be routinely cleaned out to prevent remaining silage (which will spoil) from contaminating new silage. How will this waste be managed? How often will this occur? What odor mitigation will be utilized?
• Is the digestate from this process to be sold to use in off-site boilers considered an Industrial Solid Waste according to EPA definitions? Does it meet local, State, and Federal regulations as a solid waste? Is this material regulated by MN Rule 7035.1700 that prohibits the burning of Industrial Waste?
• The EAW states sanitary wastes will be treated with an on-site septic system (page 11). Subsurface Sewage Treatment Systems require in situ soils and soils protected from disturbance, compaction, etc per MN Rules. The septic drain field is shown on a portion of disturbed site. Provide more information on the placement of this drain field and treatment requirements per MN Rules 7080 and 7081 and MN Statute 115. Also, please provide the location of two septic sites as required.
• How was 24 million gallons per year from the feedstock calculated? If 45,000 tons dry weight is converted to wet weight, at an estimate of 25% solids, 180,000 tons is calculated. At 75% water or 180,000 tons “as received” of feedstock, then 180,000 tons times 0.75 = 135,000 tons of water. 135,000 tons x 2000 lbs/ton = 270,000,000 lbs./8.3 lb/gal. = 32,530,120 gallons of water. These calculations would indicate an additional 8,530,120 gallons. If these calculations apply it would indicate a higher volume of effluent storage is required.
• The water flow balance needs to be further studied and responded to accordingly.
Section 18. Water Quality —Waste Water; Flow diagram, Page16
• This diagram indicates contact storm water and silage leachate pump stations. However, it is not explained how these liquid sources enter the digestion process. In the EAW it is stated this material will be “diverted” but does not explain the function and process of the pump stations presented in this flow diagram. It appears some storm water will be pumped into the recycle water holding tank which will pumped directly to the effluent holding ponds. I do not see this process described in the EAW.
• What is the purpose of the “gas conditioning system”? Is this illustrating the water by-product from the biofilter unit?
• What is the exact source of the claim of 18.8 million gallons per year of recycled water, that is shown in the diagram on page 16. Please provide calculations that support this number.
• Additionally, how was 24 million gallons per year from the feedstock calculated? If 45,000 tons dry weight is converted to wet weight, at an estimate of 25% solids, 180,000 tons is calculated. At 75% water or 180,000 tons “as received” of feedstock, then 180,000 tons times 0.75 = 135,000 tons of water. 135,000 tons x 2000 lbs/ton = 270,000,000 lbs./8.3 lb/gal. = 32,530,120 gallons of water. These calculations would indicate an additional 8,530,120 gallons. If these calculations apply it would indicate a need for increased effluent storage capacity.
• The water flow balance needs to be further studied and reported with better clarification
Flow Diversion Device:
• Leachate and raw silage from the silage pile, entering the effluent storage holding ponds via the trench drain may greatly contribute to the generation of odors. Additionally, these liquids have the potential to alter the composition of the effluent, affecting its nutrient content, which may impact its use as a fertilizer source.

11
• How will the volume and content of the leachate diverted to the holding ponds and to the digestion process be monitored? What criteria will be used to determine how the leachate affects the effluent properties and the digestion process?
Section 18 b.
The EAW states that the nearest major body of water is the Minnesota River. However, there is a creek or small river approximately 1 mile east of the facility location. Can we be assured this body of water will be protected from potential “run-off”?
Section 19 Geologic hazards and soil conditions; Ground Water, Well Water and Safe Drinking Water Act:
• Item 19 needs to be revised and further information provided in the EIS to include factual, accurate data (rather than broad assumptions) regarding the wells, geology, and potential hazards of this project on local soils and groundwater.
• The proposer may also want to check their sources regarding the described “sink holes” from the dissolution of Oneida dolomite (page 17) as well as the indicated impermeable nature of the “clay till” (page 18) that the EAW assumes will protect the “groundwater from any leakage from the fermentation/digestion tanks” and

12
revise the EAW to be consistent with information presented on page 19 which states “groundwater freely drains from the site” because of “high-permeabilty zones”.
• The EAW also fails to include discussion or accurate analysis of the implications of this condition with respect to the potential for groundwater contamination, as required in Item 19b. This should also be included in the EIS to identify risks and discuss any mitigation measure that may be utilized to prevent groundwater contamination.
• Regarding comments under groundwater in section 19 and attachment 15 “Area wells in cross-section”, this survey is not fully completed. Because of this, it is requested that the well survey be completed to validate potential effects.
• The state did not require well drillers to report their well installations until the 1970s, so most of the wells installed before then are not in the database and there is no way to know the type or depth of these wells without doing a 'well inventory'.
• All of these wells in Section 12 are within the shallow aquifer of the glacial till and are not within the major aquifer in the area (Jordan Sandstone). It is unknown whether or not the limestone in this area below the till acts as a confining layer to the Jordan sandstone aquifer or if they are hydrogeologically connected.
• Because of these ongoing concerns and conditions and variation in well water levels, piezometers should be continued to be monitored and further studies conducted on the concerns of the water table levels decreasing.
• Attachment 5 does not provide horizontal or vertical scales in order to completely understand the cross section elevation of the site and is therefore misleading
• The silage bunks are proposed to include the “use of soil-cement concrete slabs for the bunk bottoms to provide an impervious surface thereby preventing silage liquids (leachate) from seeping into the ground”. How will this 5 acre slab be installed to insure it doesn’t crack resulting in leachate entering the soil and groundwater?
• There are claims by citizens that 12 wells have gone dry. One resident had to have his well dug deeper. It is not known if present drought conditions, farm irrigation, or other water usage is responsible for this condition. However, with increased water usage from this additional project it is requested to include further studies.
Section 20. Solid Wastes, Hazardous Wastes, Storage Tanks; Hazardous Wastes (RCRA).
• This EAW states no hazardous or special wastes. It appears this information is inaccurate. I would expect a State Tier 2 form, a facility federal EPA Hazardous waste number assigned, and a hazardous waste permit would be required. The Tier 2 requires an emergency contingency plan. This would include hazardous or special wastes generated such as fluorescent lights, possible waste oil and grease from maintenance applications and so on.
• What type of emergency response contingency plans are prepared in case of fire or potential explosion due to unknown or uncontrolled causes? Will various fire suppression processes be required?
• Under the general duty clause, all companies are responsible to ensure the safety requirements including employee and public safety. Are there any potential explosion or fire risk factors that could affect nearby residents, businesses, or the airport?
• The EAW states no solid wastes are generated. It is expected reagent packing, office and laboratory waste, pallets, cafeteria related wastes, etc. would have to be generated.

13
Section 21. Traffic:
• It is our consensus that the impact of traffic remains another primary issue and should be further studied. It is recommended a traffic impact study be conducted.
• Traffic flow will not only affect State Highway 112 and County Road 115 near Le Sueur, it is expected much traffic will have to pass through the town of Le Sueur to gain access to State Highway 112. This would cause annoyances, safety issues, and potential odor issues.
• In addition the transportation of effluent transporting vehicles from the project site to the farm land fields has not been included in the traffic section nor has traffic been included for transportation of digestate.
• In addition this will add to the concern of noise generation and safety concerns. • Truck weights, distances, and specific traffic routes have not been provided to fully explain the traffic
impacts. • This additional truck traffic will add to the concerns regarding noise and safety. • The traffic section must be re-studied and addressed appropriately. A traffic impact study is requested
Section 22. Vehicle-related Air Emissions
• “Estimate the effect of the project’s traffic generation of air quality, including carbon monoxide”. I do not see this information listed. I expect that will be provided upon completion of the air permit.
Section 23. Air Emissions Permit:
The Air permit is not available for effective EAW evaluation. The following comments relate to concerns and issues as stated in the EAW to this point in time:
• Stack Height: Several complex model systems are used to determine stack height. My challenge is the validity of existing stack height noted in the EAW indicating two stack heights listed at 54 feet and 50 feet. Three anaerobic digesters are listed at 75 feet in height exceeding the stack heights. Because of this design I question the effectiveness and efficiency of the air dispersion model. Furthermore, I refer to this formula, where: Hg= 2.5 X H. Hg = good engineering practice stack height, measured from the ground-level elevation at the base of the stack; and H = height of nearby structure(s) measured from the ground-level elevation at the base of the stack; (b) For all other stacks, the stack height calculated by the following formula: Hg= H + 1.5 L. Where: Hg = good engineering practice stack height, measured from the ground-level elevation at the base of the stack; H = height of nearby structure(s) measured from the ground-level elevation at the base of the stack; and L = height or projected width, whichever is less, of nearby structure(s); If the same Stack Height Regulation parameters are in force in Minnesota, it seems probable that the 75 ft digesters would be close enough to the stacks to result in 2.5 x 75 = 187.5 ft stack height, but that the "greater of" clause from this information might require a minimum stack height up to 213.25 ft.
• Carbon monoxide catalyst. No information on this device is available to evaluate this process and its performance. How does this device control VOC emissions? Does this device require any chemical materials or generate any hazardous waste? Is this an oxidative catalytic converter unit? If this is an oxidative catalytic converter process? These are designed to be used on stationary combustion turbines and not applicable to landfill and digestion gases. Will this device perform properly with reciprocating internal combustion engines?
• Carbon monoxide catalyst and Siloxanes: Silage and chicken manure have significant levels of siloxanes. Siloxanes are known to foul oxidative catalytic converters. Has this concern and potential impact been evaluated for this application?
• With no air permit available, evaluation of how air emissions were calculated cannot be conducted. This includes what levels of biogas in standard cubic feet per unit of time, what Btu’s values are used for the biogas, emission

14
factors in MMBtu, emissions in Lbs./hr. and if Manufacture’s emission data meet MPCA requirements in comparison to AP 42 specifications.
• Control Emission Units (CE001 through CE004) are not specifically defined. What are these? Bag filters? Wet scrubbers? What are their functions and what are their specifications for emission reduction?
• It is noted that exhaust from the gensets are using two outlets. EU006 is used for fuel drying and preparation. It appears to have no control emission unit (CE) and is expelled through SV003. Should an emission control device be added to this unit? There is no data on this emission source or what level of emissions will be generated. Is this being included in the Air Emissions Permit? Will or does this section include additional air emissions?
• How is the exhaust drying system designed? Is the exhaust contained to go directly out through the stack vent and using the heat from a heat jacket, or does the exhaust flow through the digestate? If the raw exhaust gas makes contact with the digestate it should have a control emission device. Also, if the heated exhaust gas makes contact with the effluent what effects would that have on collecting extensive moisture and emission sources from the digestate to affect the stack performance?
• Regarding the biofilter (EU008): The document states 100% absorption with an expected destruction efficiency of 70 to 90%. This does not guarantee fully efficient odor control. In addition, and under ongoing exposure to the elements, what type of maintenance program does this unit require?
• Biogas Conditioning and storage: Regarding the hydrogen sulfide bioscrubber, is this an approved effective system under MPCA regulations? How is it designed from a biological design to function specifically to absorb and react with hydrogen sulfide gas? What are the maintenance requirements? How reliable and efficient is it on performing this process? It is noted some bacterial growth will collect in the bioreactor and will be transferred to the liquid byproduct storage ponds. This transfer adds to potential ongoing biological reactions in the effluent holding ponds, generating the potential for more odor and hydrogen sulfide gas. Since this is a biological system, what effects will temperature have on its performance? What provisions are incorporated to maintain proper temperatures that might affect the performance of this device? Please confirm.
• Little if any information is provided on the Bioscrubber. All prior information provided contained only a publication but nothing of the type of bioscubber that will be used, how it will operated, or if this is an approved efficient system. This needs more in depth study.
• The bioscrubber is a biological bacterial process. Bacteria are highly depended on temperature, pH, and nutrient balances. How can this process be ensured to be effective and reliable?
• There is nothing stated in the EAW stating formaldehyde emission levels or any specifications for HAP’s (Hazardous Air Pollutants).
• Gensets (EU001-EU004): Are these gensets as bio-gas engines certified by the Manufacturer? Or are they listed as “compliant capable”. If so, will N.S.P.S. JJJJ compliance needs be demonstrated with performance testing?
• Essential information is lacking on plumes from this facility. Analysis stating the approximate distance of 200 ft. of the plumes from the facility should be better clarified. I recommend a formal A.E.R.A. (Air Emissions Risk Analysis) be completed by a certified Agency and this included in an E.I.S.
• Information gathered from EPA website http://www.epa.gov/triexplorer/ indicates that on a per capita basis, Le Sueur’s EPA-monitored releases exceed those of Shakopee, Chaska, New Prague and St. Peter. Only Mankato has greater per capita releases than Le Sueur. This indicates Le Sueur already has a higher pollution quotient than nearby communities. Since the Air Permit is not available to evaluate, this presents a concern to citizens on what the cumulative effect this project will have on air quality of this region.
• Gensets (EU001-EU004): Are these gensets as bio-gas engines certified by the Manufacturer? Or are they listed as “compliant capable”. If so, will N.S.P.S. JJJJ compliance needs be demonstrated with performance testing?
• Essential information is lacking on plumes from this facility. Analysis stating the approximate distance of 200 ft. of the plumes from the facility should be better clarified. I recommend a formal A.E.R.A. (Air Emissions Risk Analysis) be completed by a certified Agency and this included in an E.I.S.

15
Section 24 Odors, Noise, Dust; Odor
• Odor remains a major primary concern, and the control systems for odor control as stated in the EAW remains highly questionable.
• Regarding traffic and transportation of feedstock and effluent, upon roadways and through the city of Le Sueur, what odor control measurements will be applied for these vehicles?
• Filling of silage storage bins, and continuous removal of the covers are bound to generate extensive odors. • Of three piles of silage two will be covered, however, one pile will be uncovered frequently which will generate
considerable odors. • The proposed biofilter is only 70 to 90% efficient. • Drainage of silage juice by a trench drain is stated. Is this a closed or open system? Silage juice has a strong
pungent odor and if the trench drain is not designed properly it is obvious odors will be released. • It is mentioned that some silage juice under certain conditions may be diverted to the byproduct storage ponds.
My responsibility while working at the Green Giant Company included monitoring and ensuring compliance to regulations for the seven holding ponds at the Glencoe plant indicated a BOD level of 20,000 PPM for silage juice. If silage juice is diverted to the holding ponds it will continue to create massive amounts of various odor components.
• Odor emissions generated by the digestate drying process appears to go directly into a stack vent which means these odors will simply be discharged directly into the air. Since odor generating components are dependent on the efficiency of the digester system, odor control of this section is questionable.
• Odor reduction by use of anaerobic digestion may apply to wastewater treatment plants. However, this process is not a wastewater treatment facility and will be a generation source of odors. Therefore, this statement as it now exists is confusing, contradictory, and misleading. I ask that the MPCA advise me whether this statement will be allowed to remain in the EAW as published. This information as now shown in the EAW might lead the general public to conclude there was some similarity to a wastewater plant and an anaerobic digester. To allow this misconception to continue to be foisted on the unknowing public is preposterous and demands correction. This is misinformation, whether Avant energy recognizes that fact or not.
• If the digestion process is processed efficiently there should be no volatile fatty acids to generate orders. All fatty acids should be totally digested in the methanogenic step of the digestion.
• It is stated that the bioscrubber that removes hydrogen sulfide from the biogas will be cleaned and purged and that material will be sent to the effluent holding ponds. What effect will this have for the potential of generating odors? Will this material contain reduced forms of hydrogen sulfide such as sulfur, or will it be in oxidized forms such as sulfates? Either way, upon this material entering the effluent holding ponds will it add various chemical components that might continue to generate more hydrogen sulfide gas? This is a very important question regarding odor control.
• Depending on the performance and balance of the digester, and the effluent composition which is supposed to have ample nitrogen fertilizer material, high levels of ammonia gas could be generated in the effluent holding ponds.
• What odor compounds have been studied that may contribute to odors? • Odor conditions needs to be defined for this project through the various state and local permits. Well defined
parameters and monitoring requirements need to be included that utilize compliance determining criteria, annoyance criteria, ambient odor criteria (threshold or intensity), and ambient odorant criteria (mass concentration), episode duration-frequency criteria, source emission criteria (threshold or mass concentration) and best available control technology criteria (ie. industry standards).
• A standard practice for determining odor intensity similar to ATM E679-91, ASTM E544-75,88 or a program utilizing a scentometer or similar program should be referenced. What governing body will regulate, field complaints, and ensure compliance for this project? Please detail the complaint criteria and method to file complaints.

16
Section 24 Noise:
• The noise section of this EAW is inadequate and noise has the potential for significant environmental effects. An EIS should be required to address the significant issue of noise pollution and noise violations that this project will have based on information stated in the EAW.
• As part of future local and state permits, conditions should be put into place that implements a noise monitoring program to ensure compliance with MN State Statute and Rules. This is a common practice for noise-generating operations in Le Sueur County. If continued monitoring is not required, how will the MPCA and city of Le Sueur ensure compliance with MN Statutes and Rules?
• This study should occur to accurately quantify the project noise including the cumulative effect of backup alarms, generators, driers, traffic, and all other noise generating operations within the project boundary and accessing the site.This analysis should take into account wind effects, temperature inversions, which would also increase noise levels. None of this has been addressed in the EAW and should be included in the EIS and future permits.
• The noise rules place numerous limits on noise that is allowed that are specific limits and not simply guidance levels. From the hours of 7 am to 10 pm, noise levels cannot exceed 60 decibels (dB) for more than 30 minutes (L50) in any given hour and cannot exceed 65 dB for more than 6 minutes (L10) in any given hour. These limits become more stringent during the hours of 10 pm to 7 am, requiring noise levels not to exceed 50 decibels.
• The proposer should be able to quantify and place hard numbers (not assumptions) on the maximum noise level at the nearest residence through a detailed noise study as part of an EIS.
• According to MN Rules Chapter 7030.0030, “No person may violate the standards established in part 7030.0040, unless exempted by Minnesota Statutes, section 116.07, subdivision 2a. Any municipality having authority to regulate land use shall take all reasonable measures within its jurisdiction to prevent the establishment of land use activities listed in noise area classification (NAC) 1, 2, or 3 in any location where the standards established in part 7030.0040 will be violated immediately upon establishment of the land use.” It is required that the city, the county, and the MPCA do everything in its power to guarantee that noise levels stated in these rules are not exceeded
• In addition, If trucks will be hauling and unloading 24 hours per day, noise should also be considered 24 hours per day, not the 12 to 16 hours stated in the EAW (page 25). The traffic increase is NOT a small percentage of existing traffic levels, and most trucks would NOT occur during the day (page 26). Noise information should include the entire site and traffic, not just one genset engine.
Section 25 Nearby Resources: Are any of the following resources on or in proximity to the site?
• I question the potential effects of this project as it might affect the Le Sueur Country club which includes a golf course. Depending on the definition of “proximity”, the project could have major impact on this business, especially if there are odors, traffic impact, or other elements.
Section 27 Compatibility with plans and land use regulations; Airport project
• Permits for Avant in regard to the Le Sueur airport’s existing or expanded projects have not been completed or available. This does not allow us a proper evaluation of this subject and the potential impacts. Recent contact with an FAA representative on 2/28/2012 informed me that Avant has not even applied for this study. The FAA was notified through Bolton and Menk who felt it due diligence to conduct this notification.
• Referring to stack height questions documented in the Air Permit section, clarification is required how this will affect proper permit requirements through the FAA. If the stack height requires higher stack height, the stack height along with a warning beacon might have major effects on FAA regulations.

17
Section 29. Cumulative Potential Effects:
Agricultural Commodities Corn silage is a commodity and not an agricultural waste. This is highly contradictory of statements in the EAW that refers to this proposed project as a green technology to reuse “wastes”. Agricultural producers including most dairy and beef farmers utilize this material as a source of feed. What are the cumulative impacts of losing this practical and dependable feed source on area farmers? What is the job loss from this? Where will farmers find alternative feedstock sources? Recently, we have just received an E-mail of concern from the Minnesota Cattlemen’s Association of the impact this project will have on the source of silage for feed.
Section 30. Other Potential Environmental Impacts; Including proposed mitigation
The proposed location of this facility is presenting major issues with the residents of Le Sueur, Ottawa Township, and Sharon township because:
a) A real estate study performed by interviewing several licensed real estate agents, predicts a potential decrease of 10% to 30% of real estate values to homes within one to one and half miles of the digester facility.
b) Odor and potential ground water qualities and levels are a major concern. c) The project appears to lack an effective proper planning process at an already indicated cost of
$3,000,000.00 dollars. d) Ongoing petitions have already accumulated 1,075 signatures to date from concerned residents that
oppose this facility at the proposed location at the south edge of the community. e) Real Estate Agents are being affected by the announcement of the project resulting in buyers not wanting
any property or homes within over a mile from proposed site. f) Transportation concerns for safety, noise, and odor remain high concerns. g) Many multiple requests for information of the project and issues have not been provided to the people. h) The amount of employment the project might support continues to change and decrease. The latest
employee number is down to 5 to 7. Most of these employees are expected to be technical people transferred from Avant staffing. MMPA/Avant has claimed that the project will create up to 15 new jobs. The town has already lost 7 jobs when the DQ and gas station were demolished to prepare for the Le Sueur Energy Park project proposed nearly 2 years ago. If the new project creates 5 jobs, we’ve lost 2 jobs overall.
i) There is no guarantee electrical rates will decrease from the addition of this site. j) Past performance of Avant Wind turbine generators have shown inferior performance due to poor decision-
making (purchasing 20-year old turbines that are not designed to operate in the Minnesota climate) reflecting concerns of competency in Project Management decision making.
k) The location of the facility raises major concerns about the cost of transportation for feedstock, digestate, and effluent that challenges financial success of the project.
l) This is the first of its kind of a new technical process and no pilot studies have been conducted and if so, none of that information has been provided.
m) Because of poor planning, and lack of sharing specific planning information, the project reflects a very high failure rate.
n) No mitigation plans or assurance has been provided in case of project failure and who might be left paying costs of clean up.
o) There has been no information or verification of professional contractors involved in designing the project. To my knowledge, Xergi has not guaranteed the digestion process. Xergi, a Danish company, admitted to the Le Sueur City council, that they “could not compete with the Germans” [on small maize & manure-

18
based digesters]. The Xergi rep indicated that most German digesters were small and on-site (at the source of the feedstock). He went on to state that the Germans “were experts” in maize and manure digesters. Danish projects are more centralized (Combined Heat & Power) and online research indicates that many of them utilize municipal waste – not maize or chicken manure! So why did Avant/MMPA choose Xergi for their digester design? Xergi has already had a presence in this country with their Microgy venture which failed. It makes one wonder what criteria MMPA/Avant used in choosing Xergi when it appears Xergi does not have the expertise with the feedstocks Avant/MMPA claim to be using. Unless they really plan to use municipal waste, which Xergi is experience with.
p) Avant refused to provide a pro forma to ensure financial status in relation to the project. q) Concerns of air emission effects on the health and Environment have not been provided. r) Corn silage as a commodity is a concern with the changing world. There are combines being developed
that in years will leave the silage in the field. Poet Corporation, one of the major producers of ethanol fuel (formerly Broin) has developed an enzymatic process to convert cellulose material into simple sugars to ferment into ethanol. This has already been published, with them announcing using corn silage as a major product. Silage is now a commodity and prices are increasing. This presents another concern of the future availability of available silage for the future, especially as it may affect this project.
Item 31. Summary of Issues.
• The EAW state “None” under this section. A summary of issues were not presented.
• Inclusive should be the positive declaration on the need for an EIS, with the scope of the EIS to include the list of appropriate studies to obtain the lacking information as identified throughout this document. Additional studies should include a Noise Analysis, Odor Analysis, Traffic Analysis, Well Inventory, Groundwater Impact Analysis, Cumulative Impact Analysis studying environmental, social, and economic impacts and a compatible land use analysis.
• The EIS should also include details regarding a full Mitigation and Monitoring Plan. This mitigation and
monitoring plan should include items that address the comments and questions in this document. If any local, state, and federal agency is going to give a permit to allow a project that is this controversial and has this many mitigation procedures for compliance with the law, then the MPCA as the RGU is responsible for making sure the site continues to meet these permit conditions and future compliance with the law.
• It is irresponsible to issue a permit and not ensure compliance with this permit. For the safety, health, and
welfare of citizens of this area and the protection of the environment, the MPCA is responsible for ensuring this project continues to be in compliance with local, county, and state rules.

1
March 6, 2012
Mr. William Lynott, Project Manager Sent via email: [email protected]
Minnesota Pollution Control Agency
520 Lafayette Road North
St. Paul, MN 55155-4194
RE: Hometown BioEnergy Facility EAW Comments
Mr. Lynott,
Thank you for your group’s diligence in attempting to search out the realities of the proposed
Hometown BioEnergy Facility, Le Sueur, hereafter referred to as the “Facility”.
I appreciate the opportunity to provide comments on the EAW and will do my best to only
address the accuracy and completeness of information and potential impacts that are
reasonably expected to occur that warrant further investigation.
My background is 32 years of industrial systems process engineering and design in combination
with the associated project management, installation, startup, testing, and operation of those
systems in several different industries including food processing and automotive
manufacturing.
From careful assessment of the data in the published, but incomplete, EAW, it appears that
different groups of data were probably provided to the MPCA at different stages of the Facility
design process. The result of this is that the data presented in the EAW does not all correlate,
but rather seems to contain numerous inconsistencies and contradictions. Therefore, my
approach is to:
1. Develop Case 1- Calculate average feedstock input % by dry weights, % solids, and %
volatile solids from the ranges of those items as stated on page 3 of the EAW. Then,
follow the mix of average feedstock through the proposed process to determine notable
system issues.
2. Develop Case 2- Provide the same type of analysis as for Case 1, but for the situation in
which the Facility input parameters have been adjusted to provide 12% solids (“low
solids”) input to the digester.
2

My intent is to thereby provide, to the best of my abi l i ty and understanding of the process, two
complete sets of Faci l i ty informat ion wherein al l aspects are properly related to each other and
inconsistencies and contradict ions wi l l be ident i f ied. l t appears that numerous basic design
cr i ter ia need to be looked at more closely, which you wi l l understand after reviewing the two
cases out l ined on the fol lowing pages. Due to the incompleteness of the EAW, along with
conf l ict ing and contradictory informat ion within the EAW, I request that an EIS be required to
br ing more focus and foresight to these issues.
Respectful ly su bmitted,
n\!5',,*'.2- fnf.*+
(Bruce McKay, PE
b mckay.aces @ gm ai l .co m
Cell: 612-386-5983
E-ma i l : bmckav .aces@gmai l . com
cc: Robert Ober le, Mayor , Ci ty of Le SueurLe Sueur Ci ty Counci lLe Sueur Planning CommissionOttawa Township BoardKathy Brockway, Le Sueur County Envi ronmenta l Serv ices

3
1. Preface
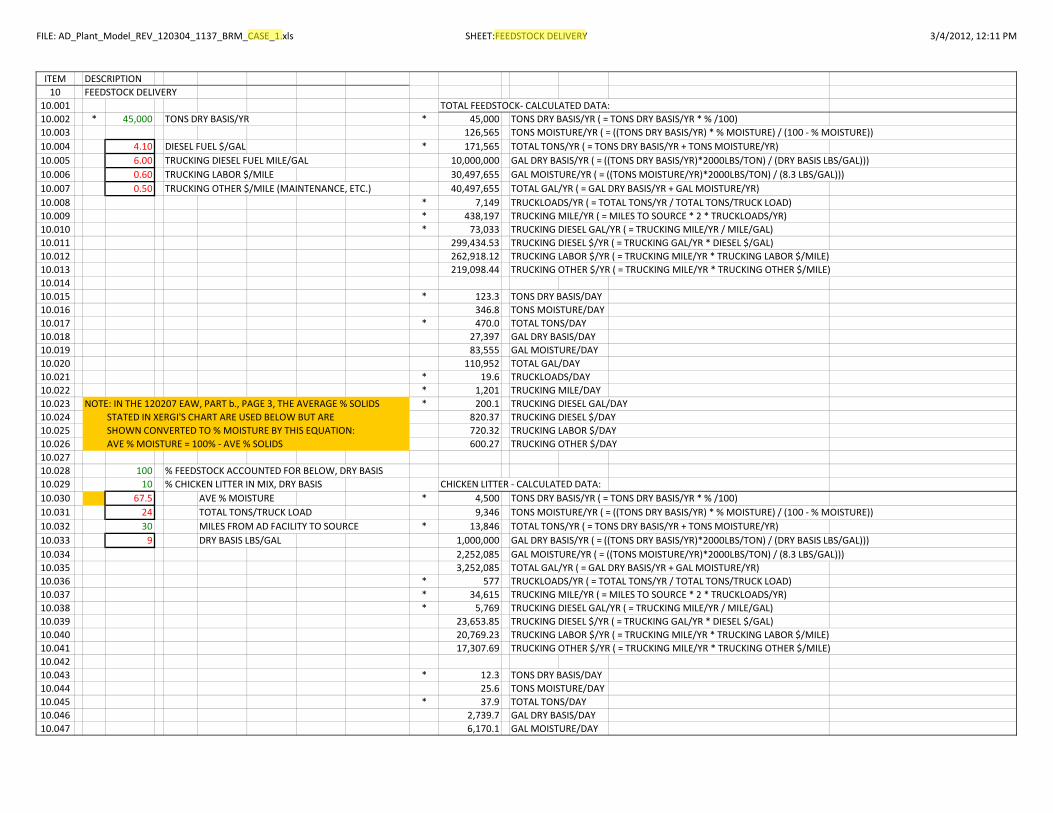
a. Supporting documentation is provided following Case1 and Case 2 sections below. The
documentation is in the form of spreadsheet pages, some of which are referenced from
within the Cases. For both Cases, the supporting documents are organized as follows:
i. “FACILITY OPERATION” sheet- Overview of parameters being assessed.
ii. “FEEDSTOCK DELIVERY’ sheet- Feedstock weight and transportation details.
iii. “HIGHWAY TRAFFIC” sheet- Month by month traffic estimates.
iv. “FEEDSTOCK PARAMETERS” sheet- Feedstock conversion to biogas details.
v. “DIGESTER” sheet- Digester input, output, and contained volume details.
vi. “GAS OUTPUT” sheet- Conversion of biogas to electricity and heat details.
vii. “FLUID OUTPUT” sheet- Liquid Byproduct flow and accumulation details.
viii. “FLUID REMOVAL” sheet- Liquid Byproduct field application details.
ix. “DIGESTATE REMOVAL” sheet- Digestate drying and shipping details.
2. Case 1
a. Description: Case 1 uses average feedstock input % by dry weights, % solids, and % volatile
solids from the ranges of those items as stated on page 3 of the EAW, water balance
information from page 16 of the EAW, and the stated Avant description of the Facility as
utilizing a “low solids” process.
b. Notable Issues:
i. On the Case 1 FACILITY OPERATION sheet, Lines 05.04 and 05.05- The 18% solids of
the pretreated feedstock slurry is higher than desired for a low solids process. As is
shown on page 16 of the EAW, 18.8 MMGal/yr of supernatant is to be recycled back
to the feedstock slurry, which results in decreasing the incoming feedstock mixture
from 26.23% solids to 18% solids. This amount of recycled supernatant is already
above the maximum recommended recycling percentage without decreasing the %
solids to the desired level. This indicates the need to add well water to the
feedstock slurry to reduce the mix from 18% solids to roughly 12% solids (“low
solids”), which contradicts the statement in EAW section 13 that “No separate water
supply will be needed for the digestion or ancillary processes.” The higher well
water usage needs to be factored into the plan and the assessment of the plan.
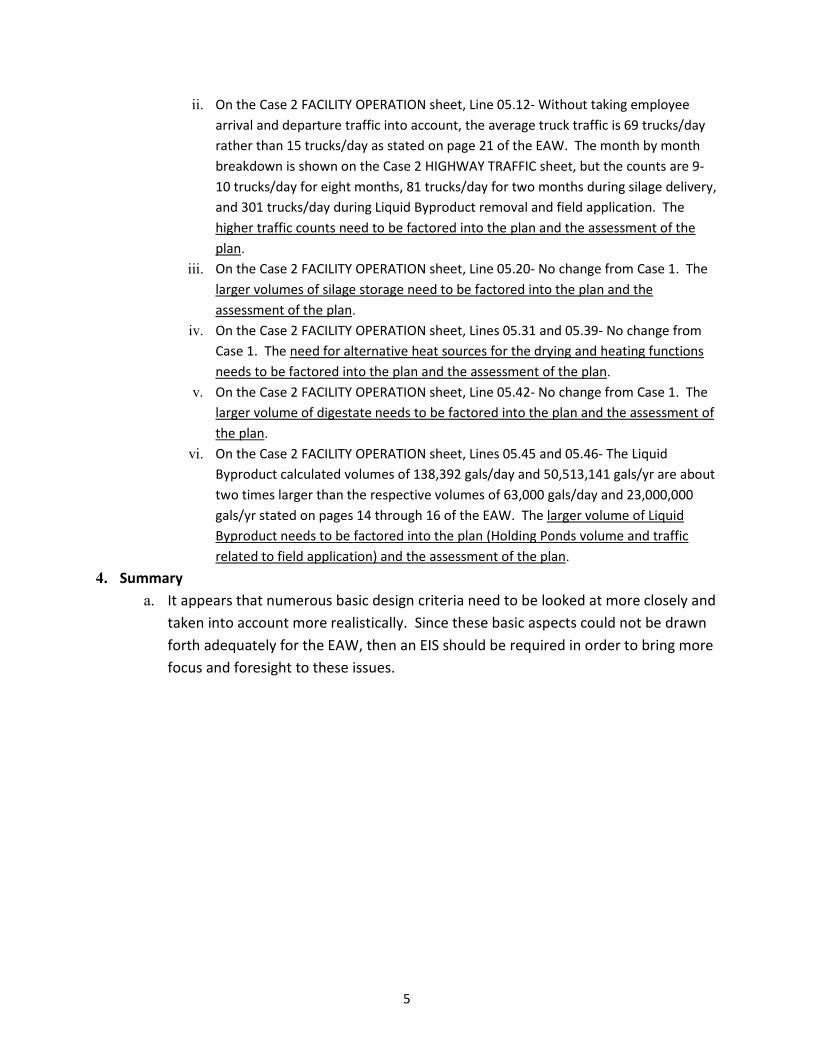
ii. On the Case 1 FACILITY OPERATION sheet, Line 05.12- Without taking employee
arrival and departure traffic into account, the average truck traffic is 48 trucks/day
rather than 15 trucks/day as stated on page 21 of the EAW. The month by month
breakdown is shown on the Case 1 HIGHWAY TRAFFIC sheet, but the counts are 9-
10 trucks/day for eight months, 81 trucks/day for two months during silage delivery,
and 175 trucks/day during Liquid Byproduct removal and field application. The
higher traffic counts need to be factored into the plan and the assessment of the
plan.

4
iii. On the Case 1 FACILITY OPERATION sheet, Line 05.20- Using the average mix of
57.5% silage in the feedstock results in the need to have room to store 25,875 dry
tons of silage rather than the 15,000 tons dry silage storage that is described on
page 5 of the EAW. If the silage portion of the mix is increased to 75% (the high end
of the predicted range), the necessary storage volume is even larger. The larger
volumes of silage storage need to be factored into the plan and the assessment of
the plan.
iv. On the Case 1 FACILITY OPERATION sheet, Lines 05.31 and 05.39- Using Xergi’s
Normal Cubic Meter/Short Ton of Volatile Solids Biogas Production data, it appears
that the amount of biogas produced each day would be enough to run the four
gensets for only about 8 hours each day. See the Case 1 Feedstock Parameters
sheet for calculation details. This is not directly an EAW issue, however less run
time does result in less recovered heat available for use in drying digestate and
warming the feedstock pretreatment modules as shown on Attachment 3, Process
Flow Diagram. The need for alternative heat sources for the drying and heating
functions needs to be factored into the plan and the assessment of the plan.
v. On the Case 1 FACILITY OPERATION sheet, Line 05.42- The calculated 33.55 tons/day
of digestate after drying is more than twice the amount of 16 tons/day after drying
as stated on page 23 of the EAW. The larger volume of digestate needs to be
factored into the plan and the assessment of the plan.
vi. On the Case 1 FACILITY OPERATION sheet, Lines 05.45 and 05.46- The Liquid
Byproduct calculated volumes of 78,316 gals/day and 28,585,430 gals/yr are
significantly larger than the respective volumes of 63,000 gals/day and 23,000,000
gals/yr stated on pages 14 through 16 of the EAW. The larger volume of Liquid
Byproduct needs to be factored into the plan (Holding Ponds volume and traffic
related to field application) and the assessment of the plan.
3. Case 2
a. Description: Case 2 uses Facility input parameters that have been adjusted to provide 12%
solids (“low solids”) input to the digester, water balance information from page 16 of the
EAW, and the stated Avant description of the Facility as utilizing a “low solids” process.
b. Notable Issues:
i. On the Case 2 FACILITY OPERATION sheet, Lines 05.04 and 05.05- The 11.98% solids
of the pretreated feedstock slurry is now OK for a low solids process. As a change to
what is shown on page 16 of the EAW, 27.1 MMGal/yr of supernatant is to be
recycled back to the feedstock slurry along with 21.9 MMGal/yr of well water, which
results in decreasing the incoming feedstock mixture from 26.23% solids to 11.98%
solids while maintaining the amount of recycled supernatant near the maximum
recommended recycling percentage at 29.96%. The higher well water usage needs
to be factored into the plan and the assessment of the plan.
5
ii. On the Case 2 FACILITY OPERATION sheet, Line 05.12- Without taking employee
arrival and departure traffic into account, the average truck traffic is 69 trucks/day
rather than 15 trucks/day as stated on page 21 of the EAW. The month by month
breakdown is shown on the Case 2 HIGHWAY TRAFFIC sheet, but the counts are 9-
10 trucks/day for eight months, 81 trucks/day for two months during silage delivery,
and 301 trucks/day during Liquid Byproduct removal and field application. The
higher traffic counts need to be factored into the plan and the assessment of the
plan.
iii. On the Case 2 FACILITY OPERATION sheet, Line 05.20- No change from Case 1. The
larger volumes of silage storage need to be factored into the plan and the
assessment of the plan.
iv. On the Case 2 FACILITY OPERATION sheet, Lines 05.31 and 05.39- No change from
Case 1. The need for alternative heat sources for the drying and heating functions
needs to be factored into the plan and the assessment of the plan.
v. On the Case 2 FACILITY OPERATION sheet, Line 05.42- No change from Case 1. The
larger volume of digestate needs to be factored into the plan and the assessment of
the plan.
vi. On the Case 2 FACILITY OPERATION sheet, Lines 05.45 and 05.46- The Liquid
Byproduct calculated volumes of 138,392 gals/day and 50,513,141 gals/yr are about
two times larger than the respective volumes of 63,000 gals/day and 23,000,000
gals/yr stated on pages 14 through 16 of the EAW. The larger volume of Liquid
Byproduct needs to be factored into the plan (Holding Ponds volume and traffic
related to field application) and the assessment of the plan.
4. Summary
a. It appears that numerous basic design criteria need to be looked at more closely and
taken into account more realistically. Since these basic aspects could not be drawn
forth adequately for the EAW, then an EIS should be required in order to bring more
focus and foresight to these issues.

FILE: AD_Plant_Model_REV_120304_1137_BRM_CASE_1.xls SHEET: FACILITY OPERATION 3/4/2012, 12:10 PM
ITEM DESCRIPTION05 FACILITY OPERATION
05.01 LIMITS05.02 45K 45,000 TON/YR DRY BASIS 171,565 TON/YR AS‐IS 41,341,028 GAL/YR AS‐IS05.03 0 GAL/YR 26.23 TS (TOTAL SOLIDS) (%) OF FEEDSTOCK BEFORE ADJUSTMENT05.04 ?? 0 TON/YR WATER TO ADJUST FEEDSTOCK TS (%) ?? 12.0 Excess > 18.00 TS (TOTAL SOLIDS) (%) OF FEEDSTOCK AFTER ADJUSTMENT05.05 78.02K 78,020 TON/YR FACILITY OUTPUT RECYCLED TO INPUT 30.0 Excess > 31.21 % OF INFEED THAT IS RECYCLED FLUID05.06 415 TON/YR TRUCK CLEANOUT 18,800,000 GAL/YR05.07 0 TON/YR OTHER05.08 30 30 DAYS IN DIGESTER FOR SOLIDS 4,800,000 4,571,694 GAL IN DIGESTERS 19,041 TON IN DIGESTERS05.09 ?? 30 DAYS IN DIGESTER FOR LIQUIDS EAW = 4,800,000 GAL IN DIGESTERS05.1005.1105.12 39 Excess > 48.17 TRUCKLOADS/DAY TOTAL (AVERAGE!! SEE HIGHWAY TRAFFIC SHEET)
05.13 THE AVERAGE OF % FEEDSTOCKS ON PAGE 3 OF EAW ARE BELOW: 1.40 TRUCKLOADS/DAY DIGESTATE REMOVAL05.14 100 % FEEDSTOCK ACCOUNTED FOR BELOW, DRY BASIS 27.18 TRUCKLOADS/DAY FLUID REMOVAL05.15 10.0 10 % CHICKEN LITTER IN MIX, DRY BASIS 1.58 TRUCKLOADS/DAY FEEDSTOCK DELIVERY05.16 30 MILES FROM FACILITY TO SOURCE05.17 2.5 2.5 % VEGETABLE WASTE IN MIX, DRY BASIS 0.47 TRUCKLOADS/DAY FEEDSTOCK DELIVERY05.18 25 MILES FROM FACILITY TO SOURCE05.19 57.5 57.5 % SILAGE IN MIX, DRY BASIS 11.82 TRUCKLOADS/DAY FEEDSTOCK DELIVERY05.20 25 MILES FROM FACILITY TO SOURCE 15,000 Excess > 25,875 DRY TONS STORAGE NEEDED EAW = 15,000 DRY TONS05.21 25.0 25 % POTATO WASTE IN MIX, DRY BASIS 5.14 TRUCKLOADS/DAY FEEDSTOCK DELIVERY05.22 45 MILES FROM FACILITY TO SOURCE05.23 2.5 2.5 % SNACK FOOD WASTE IN MIX, DRY BASIS 0.19 TRUCKLOADS/DAY FEEDSTOCK DELIVERY05.24 25 MILES FROM FACILITY TO SOURCE05.25 2.5 2.5 % FRUIT WASTE IN MIX, DRY BASIS 0.40 TRUCKLOADS/DAY FEEDSTOCK DELIVERY05.26 25 MILES FROM FACILITY TO SOURCE
ACTIONS/ADJUSTMENTS INFEED RESULTS
AVERAGE TRUCKLOADS/DAY
05.2705.28 65 % MOISTURE OF DIGESTATE AFTER PRESSING05.29 10 10 % MOISTURE OF DIGESTATE AFTER DRYING05.30 EAW = 12‐16 HRS/DAY, 7 DAYS/WEEK TO RUN GENERATORS05.31 8.05 HRS/DAY TO RUN GENERATORS05.32 1,000 BTU/SCF OF METHANE05.33 50 50 % OF BIOGAS THAT IS METHANE05.34 100 100 % OF AVAILABLE METHANE ALLOCATED05.35 TO DRIVE THE GENERATORS05.3605.37 547.2 MMBTU/DAY 05.38 EAW = 8 KW‐HR/HR MAXIMUM GENERATOR OUTPUT 8,000 7,966 KW‐HR/HR PRODUCED05.39 EAW = 96,000‐128,000 KW‐HR/DAY FROM GENERATORS 96,000 Deficit > 64,125 KW‐HR/DAY PRODUCED05.40 59,997 KW‐HR/DAY AVAIL TO SELL05.4105.42 EAW = 16 TON/DAY DIGESTATE AFTER DRYING 16 Excess > 33.55 TON/DAY DIGESTATE DISCHARGE AFTER DRYING05.43 0 Deficit > ‐5,661,195 BTU/HR HEAT AVAILABLE AFTER DRYING DIG & WARMING FEEDSTOCK05.4405.45 EAW = 55,000 GAL/DAY PROCESS + 8,000 GAL/DAY STORMWATER 63,000 Excess > 78,316 GAL/DAY LIQUID BY‐PRODUCT ENTERING HOLDING PONDS05.46 EAW = 23,000,000 GAL/YR MAXIMUM 23,000,000 Excess > 28,585,430 GAL/YR IN PONDS 119,058 TON/YR IN PONDS05.4705.4805.49 NOTES: = DATA THAT CAME FROM THE EAW05.50 XXX = A CELL WHERE DATA CAN BE ENTERED MANUALLY
FACILITY OUTPUTS
FILE: AD_Plant_Model_REV_120304_1137_BRM_CASE_1.xls SHEET:FEEDSTOCK DELIVERY 3/4/2012, 12:11 PM
ITEM DESCRIPTION10 FEEDSTOCK DELIVERY
10.001 TOTAL FEEDSTOCK‐ CALCULATED DATA:10.002 * 45,000 TONS DRY BASIS/YR * 45,000 TONS DRY BASIS/YR ( = TONS DRY BASIS/YR * % /100)10.003 126,565 TONS MOISTURE/YR ( = ((TONS DRY BASIS/YR) * % MOISTURE) / (100 ‐ % MOISTURE))10.004 4.10 DIESEL FUEL $/GAL * 171,565 TOTAL TONS/YR ( = TONS DRY BASIS/YR + TONS MOISTURE/YR)10.005 6.00 TRUCKING DIESEL FUEL MILE/GAL 10,000,000 GAL DRY BASIS/YR ( = ((TONS DRY BASIS/YR)*2000LBS/TON) / (DRY BASIS LBS/GAL)))10.006 0.60 TRUCKING LABOR $/MILE 30,497,655 GAL MOISTURE/YR ( = ((TONS MOISTURE/YR)*2000LBS/TON) / (8.3 LBS/GAL)))10.007 0.50 TRUCKING OTHER $/MILE (MAINTENANCE, ETC.) 40,497,655 TOTAL GAL/YR ( = GAL DRY BASIS/YR + GAL MOISTURE/YR)10.008 * 7,149 TRUCKLOADS/YR ( = TOTAL TONS/YR / TOTAL TONS/TRUCK LOAD)10.009 * 438,197 TRUCKING MILE/YR ( = MILES TO SOURCE * 2 * TRUCKLOADS/YR)10.010 * 73,033 TRUCKING DIESEL GAL/YR ( = TRUCKING MILE/YR / MILE/GAL)10.011 299,434.53 TRUCKING DIESEL $/YR ( = TRUCKING GAL/YR * DIESEL $/GAL)10.012 262,918.12 TRUCKING LABOR $/YR ( = TRUCKING MILE/YR * TRUCKING LABOR $/MILE)10.013 219,098.44 TRUCKING OTHER $/YR ( = TRUCKING MILE/YR * TRUCKING OTHER $/MILE)10.01410.015 * 123.3 TONS DRY BASIS/DAY10.016 346.8 TONS MOISTURE/DAY10.017 * 470.0 TOTAL TONS/DAY10.018 27,397 GAL DRY BASIS/DAY10.019 83,555 GAL MOISTURE/DAY10.020 110,952 TOTAL GAL/DAY10.021 * 19.6 TRUCKLOADS/DAY10.022 * 1,201 TRUCKING MILE/DAY10.023 NOTE: IN THE 120207 EAW, PART b., PAGE 3, THE AVERAGE % SOLIDS * 200.1 TRUCKING DIESEL GAL/DAY10.024 STATED IN XERGI'S CHART ARE USED BELOW BUT ARE 820.37 TRUCKING DIESEL $/DAY10.025 SHOWN CONVERTED TO % MOISTURE BY THIS EQUATION: 720.32 TRUCKING LABOR $/DAY10.026 AVE % MOISTURE = 100% ‐ AVE % SOLIDS 600.27 TRUCKING OTHER $/DAY10.02710.028 100 % FEEDSTOCK ACCOUNTED FOR BELOW, DRY BASIS10.029 10 % CHICKEN LITTER IN MIX, DRY BASIS CHICKEN LITTER ‐ CALCULATED DATA:10.030 67.5 AVE % MOISTURE * 4,500 TONS DRY BASIS/YR ( = TONS DRY BASIS/YR * % /100)10.031 24 TOTAL TONS/TRUCK LOAD 9,346 TONS MOISTURE/YR ( = ((TONS DRY BASIS/YR) * % MOISTURE) / (100 ‐ % MOISTURE))10.032 30 MILES FROM AD FACILITY TO SOURCE * 13,846 TOTAL TONS/YR ( = TONS DRY BASIS/YR + TONS MOISTURE/YR)10.033 9 DRY BASIS LBS/GAL 1,000,000 GAL DRY BASIS/YR ( = ((TONS DRY BASIS/YR)*2000LBS/TON) / (DRY BASIS LBS/GAL)))10.034 2,252,085 GAL MOISTURE/YR ( = ((TONS MOISTURE/YR)*2000LBS/TON) / (8.3 LBS/GAL)))10.035 3,252,085 TOTAL GAL/YR ( = GAL DRY BASIS/YR + GAL MOISTURE/YR)10.036 * 577 TRUCKLOADS/YR ( = TOTAL TONS/YR / TOTAL TONS/TRUCK LOAD)10.037 * 34,615 TRUCKING MILE/YR ( = MILES TO SOURCE * 2 * TRUCKLOADS/YR)10.038 * 5,769 TRUCKING DIESEL GAL/YR ( = TRUCKING MILE/YR / MILE/GAL)10.039 23,653.85 TRUCKING DIESEL $/YR ( = TRUCKING GAL/YR * DIESEL $/GAL)10.040 20,769.23 TRUCKING LABOR $/YR ( = TRUCKING MILE/YR * TRUCKING LABOR $/MILE)10.041 17,307.69 TRUCKING OTHER $/YR ( = TRUCKING MILE/YR * TRUCKING OTHER $/MILE)10.04210.043 * 12.3 TONS DRY BASIS/DAY10.044 25.6 TONS MOISTURE/DAY10.045 * 37.9 TOTAL TONS/DAY10.046 2,739.7 GAL DRY BASIS/DAY10.047 6,170.1 GAL MOISTURE/DAY

FILE: AD_Plant_Model_REV_120304_1137_BRM_CASE_1.xls SHEET:FEEDSTOCK DELIVERY 3/4/2012, 12:11 PM
10.048 8,909.8 TOTAL GAL/DAY10.049 * 1.6 TRUCKLOADS/DAY10.050 * 94.8 TRUCKING MILE/DAY10.051 * 15.8 TRUCKING DIESEL GAL/DAY10.052 64.81 TRUCKING DIESEL $/DAY10.053 56.90 TRUCKING LABOR $/DAY10.054 47.42 TRUCKING OTHER $/DAY10.05510.056 2.5 % VEGETABLE WASTE IN MIX, DRY BASIS VEGETABLE WASTE ‐ CALCULATED DATA:10.057 72.5 AVE % MOISTURE * 1,125 TONS DRY BASIS/YR ( = TONS DRY BASIS/YR * % /100)10.058 24 TOTAL TONS/TRUCK LOAD 2,966 TONS MOISTURE/YR ( = ((TONS DRY BASIS/YR) * % MOISTURE) / (100 ‐ % MOISTURE))10.059 25 MILES FROM AD FACILITY TO SOURCE * 4,091 TOTAL TONS/YR ( = TONS DRY BASIS/YR + TONS MOISTURE/YR)10.060 9 DRY BASIS LBS/GAL 250,000 GAL DRY BASIS/YR ( = ((TONS DRY BASIS/YR)*2000LBS/TON) / (DRY BASIS LBS/GAL)))10.061 714,677 GAL MOISTURE/YR ( = ((TONS MOISTURE/YR)*2000LBS/TON) / (8.3 LBS/GAL)))10.062 964,677 TOTAL GAL/YR ( = GAL DRY BASIS/YR + GAL MOISTURE/YR)10.063 * 170 TRUCKLOADS/YR ( = TOTAL TONS/YR / TOTAL TONS/TRUCK LOAD)10.064 * 8,523 TRUCKING MILE/YR ( = MILES TO SOURCE * 2 * TRUCKLOADS/YR)10.065 * 1,420 TRUCKING DIESEL GAL/YR ( = TRUCKING MILE/YR / MILE/GAL)10.066 5,823.86 TRUCKING DIESEL $/YR ( = TRUCKING GAL/YR * DIESEL $/GAL)10.067 5,113.64 TRUCKING LABOR $/YR ( = TRUCKING MILE/YR * TRUCKING LABOR $/MILE)10.068 4,261.36 TRUCKING OTHER $/YR ( = TRUCKING MILE/YR * TRUCKING OTHER $/MILE)10.06910.070 * 3.1 TONS DRY BASIS/DAY10.071 8.1 TONS MOISTURE/DAY10.072 * 11.2 TOTAL TONS/DAY10.073 684.9 GAL DRY BASIS/DAY10.074 1,958.0 GAL MOISTURE/DAY10.075 2,643.0 TOTAL GAL/DAY10.076 * 0.5 TRUCKLOADS/DAY10.077 * 23.3 TRUCKING MILE/DAY10.078 * 3.9 TRUCKING DIESEL GAL/DAY10.079 15.96 TRUCKING DIESEL $/DAY10.080 14.01 TRUCKING LABOR $/DAY10.081 11.67 TRUCKING OTHER $/DAY10.08210.083 57.5 % SILAGE IN MIX, DRY BASIS SILAGE‐ CALCULATED DATA:10.084 75 AVE % MOISTURE * 25,875 TONS DRY BASIS/YR ( = TONS DRY BASIS/YR * % /100)10.085 24 TOTAL TONS/TRUCK LOAD 77,625 TONS MOISTURE/YR ( = ((TONS DRY BASIS/YR) * % MOISTURE) / (100 ‐ % MOISTURE))10.086 25 MILES FROM AD FACILITY TO SOURCE * 103,500 TOTAL TONS/YR ( = TONS DRY BASIS/YR + TONS MOISTURE/YR)10.087 9 DRY BASIS LBS/GAL 5,750,000 GAL DRY BASIS/YR ( = ((TONS DRY BASIS/YR)*2000LBS/TON) / (DRY BASIS LBS/GAL)))10.088 18,704,819 GAL MOISTURE/YR ( = ((TONS MOISTURE/YR)*2000LBS/TON) / (8.3 LBS/GAL)))10.089 EAW = STORAGE FOR 15K DRY TONS OF SILAGE 24,454,819 TOTAL GAL/YR ( = GAL DRY BASIS/YR + GAL MOISTURE/YR)10.090 * 4,313 TRUCKLOADS/YR ( = TOTAL TONS/YR / TOTAL TONS/TRUCK LOAD)10.091 * 215,625 TRUCKING MILE/YR ( = MILES TO SOURCE * 2 * TRUCKLOADS/YR)10.092 * 35,938 TRUCKING DIESEL GAL/YR ( = TRUCKING MILE/YR / MILE/GAL)10.093 147,343.75 TRUCKING DIESEL $/YR ( = TRUCKING GAL/YR * DIESEL $/GAL)10.094 129,375.00 TRUCKING LABOR $/YR ( = TRUCKING MILE/YR * TRUCKING LABOR $/MILE)10.095 107,812.50 TRUCKING OTHER $/YR ( = TRUCKING MILE/YR * TRUCKING OTHER $/MILE)10.096

FILE: AD_Plant_Model_REV_120304_1137_BRM_CASE_1.xls SHEET:FEEDSTOCK DELIVERY 3/4/2012, 12:11 PM
10.097 * 70.9 TONS DRY BASIS/DAY10.098 212.7 TONS MOISTURE/DAY10.099 * 283.6 TOTAL TONS/DAY10.100 15,753.4 GAL DRY BASIS/DAY10.101 51,246.1 GAL MOISTURE/DAY10.102 66,999.5 TOTAL GAL/DAY10.103 * 11.8 TRUCKLOADS/DAY10.104 * 590.8 TRUCKING MILE/DAY10.105 * 98.5 TRUCKING DIESEL GAL/DAY10.106 403.68 TRUCKING DIESEL $/DAY10.107 354.45 TRUCKING LABOR $/DAY10.108 295.38 TRUCKING OTHER $/DAY10.10910.110 25 % POTATO WASTE IN MIX, DRY BASIS POTATO WASTE‐ CALCULATED DATA:10.111 75 AVE % MOISTURE * 11,250 TONS DRY BASIS/YR ( = TONS DRY BASIS/YR * % /100)10.112 24 TOTAL TONS/TRUCK LOAD 33,750 TONS MOISTURE/YR ( = ((TONS DRY BASIS/YR) * % MOISTURE) / (100 ‐ % MOISTURE))10.113 45 MILES FROM AD FACILITY TO SOURCE * 45,000 TOTAL TONS/YR ( = TONS DRY BASIS/YR + TONS MOISTURE/YR)10.114 9 DRY BASIS LBS/GAL 2,500,000 GAL DRY BASIS/YR ( = ((TONS DRY BASIS/YR)*2000LBS/TON) / (DRY BASIS LBS/GAL)))10.115 8,132,530 GAL MOISTURE/YR ( = ((TONS MOISTURE/YR)*2000LBS/TON) / (8.3 LBS/GAL)))10.116 10,632,530 TOTAL GAL/YR ( = GAL DRY BASIS/YR + GAL MOISTURE/YR)10.117 * 1,875 TRUCKLOADS/YR ( = TOTAL TONS/YR / TOTAL TONS/TRUCK LOAD)10.118 * 168,750 TRUCKING MILE/YR ( = MILES TO SOURCE * 2 * TRUCKLOADS/YR)10.119 * 28,125 TRUCKING DIESEL GAL/YR ( = TRUCKING MILE/YR / MILE/GAL)10.120 115,312.50 TRUCKING DIESEL $/YR ( = TRUCKING GAL/YR * DIESEL $/GAL)10.121 101,250.00 TRUCKING LABOR $/YR ( = TRUCKING MILE/YR * TRUCKING LABOR $/MILE)10.122 84,375.00 TRUCKING OTHER $/YR ( = TRUCKING MILE/YR * TRUCKING OTHER $/MILE)10.12310.124 * 30.8 TONS DRY BASIS/DAY10.125 92.5 TONS MOISTURE/DAY10.126 * 123.3 TOTAL TONS/DAY10.127 6,849.3 GAL DRY BASIS/DAY10.128 22,280.9 GAL MOISTURE/DAY10.129 29,130.2 TOTAL GAL/DAY10.130 * 5.1 TRUCKLOADS/DAY10.131 * 462.3 TRUCKING MILE/DAY10.132 * 77.1 TRUCKING DIESEL GAL/DAY10.133 315.92 TRUCKING DIESEL $/DAY10.134 277.40 TRUCKING LABOR $/DAY10.135 231.16 TRUCKING OTHER $/DAY10.13610.137 2.5 % SNACK FOOD WASTE IN MIX, DRY BASIS SNACK FOOD WASTE‐ CALCULATED DATA:10.138 32.5 AVE % MOISTURE * 1,125 TONS DRY BASIS/YR ( = TONS DRY BASIS/YR * % /100)10.139 24 TOTAL TONS/TRUCK LOAD 542 TONS MOISTURE/YR ( = ((TONS DRY BASIS/YR) * % MOISTURE) / (100 ‐ % MOISTURE))10.140 25 MILES FROM AD FACILITY TO SOURCE * 1,667 TOTAL TONS/YR ( = TONS DRY BASIS/YR + TONS MOISTURE/YR)10.141 9 DRY BASIS LBS/GAL 250,000 GAL DRY BASIS/YR ( = ((TONS DRY BASIS/YR)*2000LBS/TON) / (DRY BASIS LBS/GAL)))10.142 130,522 GAL MOISTURE/YR ( = ((TONS MOISTURE/YR)*2000LBS/TON) / (8.3 LBS/GAL)))10.143 380,522 TOTAL GAL/YR ( = GAL DRY BASIS/YR + GAL MOISTURE/YR)10.144 * 69 TRUCKLOADS/YR ( = TOTAL TONS/YR / TOTAL TONS/TRUCK LOAD)10.145 * 3,472 TRUCKING MILE/YR ( = MILES TO SOURCE * 2 * TRUCKLOADS/YR)

FILE: AD_Plant_Model_REV_120304_1137_BRM_CASE_1.xls SHEET:FEEDSTOCK DELIVERY 3/4/2012, 12:11 PM
10.146 * 579 TRUCKING DIESEL GAL/YR ( = TRUCKING MILE/YR / MILE/GAL)10.147 2,372.69 TRUCKING DIESEL $/YR ( = TRUCKING GAL/YR * DIESEL $/GAL)10.148 2,083.33 TRUCKING LABOR $/YR ( = TRUCKING MILE/YR * TRUCKING LABOR $/MILE)10.149 1,736.11 TRUCKING OTHER $/YR ( = TRUCKING MILE/YR * TRUCKING OTHER $/MILE)10.15010.151 * 3.1 TONS DRY BASIS/DAY10.152 1.5 TONS MOISTURE/DAY10.153 * 4.6 TOTAL TONS/DAY10.154 684.9 GAL DRY BASIS/DAY10.155 357.6 GAL MOISTURE/DAY10.156 1,042.5 TOTAL GAL/DAY10.157 * 0.2 TRUCKLOADS/DAY10.158 * 9.5 TRUCKING MILE/DAY10.159 * 1.6 TRUCKING DIESEL GAL/DAY10.160 6.50 TRUCKING DIESEL $/DAY10.161 5.71 TRUCKING LABOR $/DAY10.162 4.76 TRUCKING OTHER $/DAY10.16310.164 2.5 % FRUIT WASTE IN MIX, DRY BASIS FRUIT WASTE ‐ CALCULATED DATA:10.165 67.5 AVE % MOISTURE * 1,125 TONS DRY BASIS/YR ( = TONS DRY BASIS/YR * % /100)10.166 24 TOTAL TONS/TRUCK LOAD 2,337 TONS MOISTURE/YR ( = ((TONS DRY BASIS/YR) * % MOISTURE) / (100 ‐ % MOISTURE))10.167 25 MILES FROM AD FACILITY TO SOURCE * 3,462 TOTAL TONS/YR ( = TONS DRY BASIS/YR + TONS MOISTURE/YR)10.168 9 DRY BASIS LBS/GAL 250,000 GAL DRY BASIS/YR ( = ((TONS DRY BASIS/YR)*2000LBS/TON) / (DRY BASIS LBS/GAL)))10.169 563,021 GAL MOISTURE/YR ( = ((TONS MOISTURE/YR)*2000LBS/TON) / (8.3 LBS/GAL)))10.170 813,021 TOTAL GAL/YR ( = GAL DRY BASIS/YR + GAL MOISTURE/YR)10.171 * 144 TRUCKLOADS/YR ( = TOTAL TONS/YR / TOTAL TONS/TRUCK LOAD)10.172 * 7,212 TRUCKING MILE/YR ( = MILES TO SOURCE * 2 * TRUCKLOADS/YR)10.173 * 1,202 TRUCKING DIESEL GAL/YR ( = TRUCKING MILE/YR / MILE/GAL)10.174 4,927.88 TRUCKING DIESEL $/YR ( = TRUCKING GAL/YR * DIESEL $/GAL)10.175 4,326.92 TRUCKING LABOR $/YR ( = TRUCKING MILE/YR * TRUCKING LABOR $/MILE)10.176 3,605.77 TRUCKING OTHER $/YR ( = TRUCKING MILE/YR * TRUCKING OTHER $/MILE)10.17710.178 * 3.1 TONS DRY BASIS/DAY10.179 6.4 TONS MOISTURE/DAY10.180 * 9.5 TOTAL TONS/DAY10.181 684.9 GAL DRY BASIS/DAY10.182 1,542.5 GAL MOISTURE/DAY10.183 2,227.5 TOTAL GAL/DAY10.184 * 0.4 TRUCKLOADS/DAY10.185 * 19.8 TRUCKING MILE/DAY10.186 * 3.3 TRUCKING DIESEL GAL/DAY10.187 13.50 TRUCKING DIESEL $/DAY10.188 11.85 TRUCKING LABOR $/DAY10.189 9.88 TRUCKING OTHER $/DAY10.190

FILE: AD_Plant_Model_REV_120304_1137_BRM_CASE_1.xls SHEET: HIGHWAY TRAFFIC 3/4/2012, 12:12 PM
ITEM11 EAW = HWY 112 TRAFFIC VOLUME OF 920
11.01 JAN FEB MAR APR MAY JUN JUL AUG SEP OCT NOV DEC DESCRIPTION & COUNTY ROAD 115 TRAFFIC VOLUME OF 54011.0211.03 1.58 1.58 1.58 1.58 1.58 1.58 1.58 1.58 1.58 1.58 1.58 1.58 CHICKEN LITTER11.0411.05 0.47 0.47 0.47 0.47 0.47 0.47 0.47 0.47 0.47 0.47 0.47 0.47 VEGETABLE WASTE11.0611.07 71.88 71.88 SILAGE EAW = 2 TRUCKS/HR DURING AUGUST & SEPTEMBER11.08 FOR TOTAL 6‐11% INCREASE11.09 5.14 5.14 5.14 5.14 5.14 5.14 5.14 5.14 5.14 5.14 5.14 5.14 POTATO WASTE11.1011.11 0.19 0.19 0.19 0.19 0.19 0.19 0.19 0.19 0.19 0.19 0.19 0.19 SNACK FOOD WASTE11.1211.13 0.40 0.40 0.40 0.40 0.40 0.40 0.40 0.40 0.40 0.40 0.40 0.40 FRUIT WASTE11.1411.15 1.40 1.40 1.40 1.40 1.40 1.40 1.40 1.40 1.40 1.40 1.40 1.40 DIGESTATE REMOVAL11.1611.17 165.36 165.36 LIQUID BY‐PRODUCT REMOVAL EAW = 1‐2 TRUCKS/HR FOR LIQUID BY‐PRODUCT DELIVERY11.18 APRIL & OCTOBER FOR TOTAL 9‐15% INCREASE11.19 9.17 9.17 9.17 174.53 9.17 9.17 9.17 81.04 81.04 174.53 9.17 9.17 TOTALS EAW = 15/DAY AVERAGE FOR 1‐2% INCREASE11.2011.21 CALCULATE CONCENTRATED SILAGE DELIVERY LOADS PER DAY FOR USE IN TABLE ABOVE11.22 11.82 AVERAGE TRUCKLOADS/DAY FROM SILAGE SOURCE (FROM "FEEDSTOCK DELIVERY" SHEET)11.23 4,312.5 TRUCKLOADS/YR = AVERAGE TRUCKLOADS/DAY * 36511.24 60.0 NUMBER OF DAYS/YR IN WHICH TO ACCOMPLISH TRUCKLOADS11.25 71.9 CONCENTRATED TRUCKLOADS/DAY = TRUCKLOADS/YR / TRUCKDAYS/YR11.26 24.0 HRS/DAY FOR TRUCKLOADS TO BE DELIVERED11.27 3.0 CONCENTRATED TRUCKLOADS/HR = CONCENTRATED TRUCKLOADS/DAY / HRS/DAY FOR TRUCKLOADS11.28
TRUCKLOADS PER DAY

FILE: AD_Plant_Model_REV_120304_1137_BRM_CASE_1.xls SHEET:FEEDSTOCK PARAMETERS 3/4/2012, 12:14 PM
ITEM DESCRIPTION15 FEEDSTOCK PARAMETERS
15.0115.02 50 % OF BIOGAS THAT IS METHANE (FROM 'FACILITY OPERATION' SHEET)15.03 1000 BTU/SCF OF METHANE (FROM 'FACILITY OPERATION' SHEET)15.0415.05 PARAMETER POULTRY 1 VEG WASTE CORN SILAGE POTATO WASTE SNACK FOOD WASTE FRUIT WASTE MIXTURE ENGINEERING UNITS15.06 YEARLY AS‐IS MASS PRODUCTION (TPY) 13,846 4,091 103,500 45,000 1,667 3,462 171,565 AS‐IS TONS/YR15.07 TS (TOTAL SOLIDS) (%) 32.5 27.5 25 25 67.5 32.5 26.23 TS %15.08 YEARLY DRY SOLIDS MASS (TPY) 4,500 1,125 25,875 11,250 1,125 1,125 45,000 DRY TONS/YR15.09 VS (VOLATILE SOLIDS) (% OF TS) 60 90 96 94 87.5 90 91.39 VS % OF TS15.10 YEARLY VS MASS (TPY) 2,700 1,013 24,840 10,575 984 1,013 41,124 VS TONS/YR15.11 VS CONVERSION‐TO‐BIOGAS EFFICIENCY (%) 60 75 85 85 80 70 82.62 VS % CONV15.12 MASS VS CONVERTED TO BIOGAS (TPY) 1,620 759 21,114 8,989 788 709 33,978 VS TONS CONV/YR15.13 MASS NOT CONVERTED TO BIOGAS (TPY) 2,880 366 4,761 2,261 338 416 11,022 SOLID DIG TONS/YR15.14 YEARLY MASS CONVERTED TO BIOGAS (%) 36.00 67.50 81.60 79.90 70.00 63.00 75.51 % TONS CONV/YR15.15 BIOGAS PRODUCTION/TON VS (SCF) (XERGI TABLE) 10,152.7 11,160.5 11,869.7 11,869.7 11,869.7 11,160.5 11,757.2 BIOGAS SCF/TON VS15.16 BIOGAS PRODUCTION/YEAR (SCF/YR) (VAR% METHANE) 16,447,329 8,474,985 250,616,170 106,693,478 9,347,364 7,909,986 399,489,311 BIOGAS SCF/YR15.17 BIOGAS PRODUCTION/DAY (SCF/DAY) (VAR% METHANE) 45,061 23,219 686,620 292,311 25,609 21,671 1,094,491 BIOGAS SCF/DAY15.18 BIOGAS PRODUCTION/HR (SCF/HR) (VAR% METHANE) 1,878 967 28,609 12,180 1,067 903 45,604 BIOGAS SCF/HR15.19 METHANE PRODUCTION/YEAR (SCF/YR) 8,223,664 4,237,492 125,308,085 53,346,739 4,673,682 3,954,993 199,744,656 METHANE SCF/YR15.20 ANNUAL MMBTU PRODUCTION @ STATED BTU/SCF 8,224 4,237 125,308 53,347 4,674 3,955 199,745 MMBTU/YR15.21 METHANE PRODUCTION/DAY (SCF/DAY) 22,531 11,610 343,310 146,155 12,805 10,836 547,246 METHANE SCF/DAY15.22 DAILY MMBTU PRODUCTION @ STATED BTU/SCF 22.5 11.6 343.3 146.2 12.8 10.8 547.2 MMBTU/DAY15.23 METHANE PRODUCTION/HR (SCF/HR) 938.8 483.7 14,304.6 6,089.8 533.5 451.5 22,801.9 METHANE SCF/HR15.24 HRLY MMBTU PRODUCTION @ STATED BTU/SCF 0.94 0.48 14.30 6.09 0.53 0.45 22.80 MMBTU/HR15 25
FEEDSTOCK PARAMETERS
15.2515.26 NCM/SHORT TON VS (FROM XERGI TABLE) 272 299 318 318 318 29915.27 NCM/SHORT TON VS CONV RATIO (FROM XERGI TABLE) 4.5 4.0 3.7 3.7 4.0 4.315.28 NCM TO SCF CONVERSTION RATE: 37.326 37.326 37.326 37.32615.29 AIR DISPER WIKIPEDIA WIKI ANSWERS15.30 NOTE 1: EVERYTHING IN THE TABLE ABOVE IS CALCULATED FROM DATA GENERATED ON THE "FEEDSTOCK DELIVERY" SHEET, EXCEPT USER ENTRIES15.31 CAN BE MADE IN THE BOLD‐BORDER CELLS CONTAINING RED TEXT.15.3215.33 NOTE 2: ALL PARAMETERS ARE FROM THE XERGI TABLE ON THE BOTTOM OF PAGE 3 OF THE 120207 EAW.15.3415.35 NOTE 3: Normal Cubic Meter(NCM)/SHORT TON = NCM/2000 Lbs 1.000 NCM @ 0 DEG C & 1 ATM = 37.326 SCF @ 60 DEG F & 1 ATM15.36 Normal Cubic Meter(NCM) IS AT 1 ATM AND 0 Deg C15.37 NATURAL GAS NCM IS AT 14.73 PSIA AND 60 Deg F15.38 Standard Cubic Meter (SCM) IS AT 1 ATM AND 60 Deg F15.39 1.000 NCM = 1.056 SCM = 37.31 SCF 00.00 Deg C = 32 Deg F = 273.15 K15.40 1 CM = 1000 L = 264.2 US GAL 15.00 Deg C = 59 Deg F = 288.15 K15.41 PV = nRT (Pa * cm = mol * 8.3145 cm‐Pa/mol‐K * K) 15.56 Deg C = 60 Deg F = 288.71 K15.42 1 ATM = 101.325 kPa = 14.73 PSIA = 760 TORR 20.00 Deg C = 68 Deg F = 293.15 K15.43 0.986 ATM = 100.0 kPa = 14.504 PSIA = 1 BAR 25.00 Deg C = 77 Deg F = 298.15 K15.44

FILE: AD_Plant_Model_REV_120304_1137_BRM_CASE_1.xls SHEET:FEEDSTOCK PARAMETERS 3/4/2012, 12:14 PM
15.4515.46 ENTITY Deg C kPa15.47 IUPAC, STP 0 100.00015.48 NIST, ISO 10780, FORMERLY IUPAC 0 101.32515.49 SPE 15 100.00015.50 ICAO'S ISA, ISO 13443, EEA, EGIA 15 101.32515.51 CAGI 20 100.00015.52 ISO 5011 20 101.30015.53 EPA, NIST 20 101.32515.54 SATP 25 100.00015.55 EPA 25 101.32515.56 ENTITY Deg F PSI15.57 US ARMY STANDARD METRO 59 14.50315.58 ISO 2314, ISO 3977‐2 59 14.69615.59 SPE, US OSHA, SCAQMD 60 14.69615.60 EGIA, OPEC, US EIA 60 14.73015.61 ENTITY Deg F in Hg15.62 FAA 59 29.9215.63 AMCA 70 29.9215.64
STANDARD REFERENCE CONDITIONS IN CURRENT USE

FILE: AD_Plant_Model_REV_120304_1137_BRM_CASE_1.xls SHEET: DIGESTER 3/4/2012, 12:15 PM
ITEM DESCRIPTION20 FLOW THROUGH THE DIGESTER
20.0120.02 NON‐SILAGE20.03 0 TON/YR WATER TO ADJUST FEEDSTOCK TS (%) TRUCK20.04 78,020 TON/YR FACILITY OUTPUT RECYCLED TO INPUT GAL/YR LOADS/YR GAL/LOAD20.05 35.3 GAL/TRUCK CLEANOUT EAW = 100K GAL/YR INTO SYSTEM 100,000 2,836 35.320.06 0 TON/YR OTHER20.07 75.51 % REDUCTION IN VOLUME OF SOLIDS THROUGH DIGESTER (% TONS CONV/YR, FROM 'FEEDSTOCK PARAMETERS' SHEET)20.08 30 DAYS IN DIGESTER FOR SOLIDS20.09 30 DAYS IN DIGESTER FOR LIQUIDS20.10 EAW = NO POLISHER DIGESTER MENTIONED20.11 9 LB/GAL FOR SOLIDS OF DIGESTATE20.12 8.05 HR/DAY TO RUN GENERATORS20.1320.14 DAILY TOTAL FEEDSTOCK INPUT TO DIGESTER20.15 27,397 GAL/DAY DRY BASIS (FROM 'FEEDSTOCK DELIVERY' SHEET)20.16 ~1.25 X EAW EST 83,555 GAL/DAY MOISTURE (FROM 'FEEDSTOCK DELIVERY' SHEET) EAW = 24 MMGAL/YR MOISTURE IN FEEDSTOCK INTO SYSTEM20.17 110,952 TOTAL GAL/DAY (FROM 'FEEDSTOCK DELIVERY' SHEET) = 65,753 GAL/DAY20.18 19.59 TRUCKLOADS/DAY (FROM 'FEEDSTOCK DELIVERY' SHEET) NOTE: DOES NOT INCLUDE MOISTURE TO REDUCE FEEDSTOCK TO20.19 12% SOLIDS (12% SOLIDS NOT STATED IN EAW)20.20 DAILY NON‐FEEDSTOCK INPUT TO DIGESTER20.21 0 GAL/DAY WATER TO ADJUST FEEDSTOCK TS (%) = (TON/YR WATER TO ADJUST TS * 2000 LB/TON / 8.3 LB/GAL) / 365 DAY/YR20.22 51,507 GAL/DAY FACILITY OUTPUT RECYCLED TO INPUT = (TON/YR FACILITY OUTPUT RECYCLED * 2000 LB/TON / 8.3 LB/GAL) / 365 DAY/YR20.23 274 GAL/DAY TRUCK CLEANOUT = GAL/TRUCK CLEANOUT * NON‐SILAGE TRUCKS/YR / 36520.24 0 GAL/DAY OTHER = (TON/YR OTHER * 2000 LB/TON / 8.3 LB/GAL) / 365 DAY/YR20.2520.26 DAILY TOTAL INPUT TO DIGESTER20.27 27,397 GALLONS OF SOLIDS ENTERING DIGESTER = GALLONS DRY BASIS/DAY (FROM ABOVE)20.28 135,336 GALLONS OF FLUIDS ENTERING DIGESTER ( = GAL/DAY IN FEEDSTOCK + GAL/DAY ADJUST FEEDSTOCK TS(20.29 + GAL/DAY FACILITY OUTPUT RECYCLED + GAL/DAY TRUCK CLEANOUT + GAL/DAY OTHER)20.3020.31 TOTAL VOLUME CONTAINED IN DIGESTER20.32 511,613 GALLONS OF SOLIDS = (GALLONS SOLIDS ENTERING * DAYS IN FERM) ‐ ((GALLONS SOLIDS ENTERING * (% RED / 100) * DAYS IN FERM) / 2)20.33 4,060,081 GALLONS OF FLUIDS = GALLONS FLUIDS ENTERING * DAYS IN FERM20.34 * 4,571,694 GALLONS TOTAL = GALLONS OF SOLIDS + GALLONS OF FLUIDS20.3520.36 DAILY TOTAL DISCHARGE FROM DIGESTER20.37 * 6,710 GAL/DAY SOLIDS = GAL/DAY SOLIDS ENTERING DIGESTER * (1‐(% RED / 100))20.38 * 30.20 TON/DAY SOLIDS = SOLIDS GAL/DAY * SOLIDS LB/GAL * TON/2000 LB20.39 * 135,336 GAL/DAY FLUIDS = GAL/DAY FLUIDS ENTERING DIGESTER20.40 * 561.64 TON/DAY FLUIDS = FLUIDS GAL/DAY * 8.3 LB/GAL * TON/2000 LB20.41 1,094,491 CUBIC FT/DAY OF BIOGAS (X% METHANE) (FROM 'FEEDSTOCK PARAMATERS' SHEET)20.42 547,246 CUBIC FT/DAY OF METHANE (FROM 'FEEDSTOCK PARAMATERS' SHEET)20.4320.44 HRLY TOTAL DISCHARGE FROM DIGESTER20.45 * 834 GAL/HR SOLIDS = GAL/DAY SOLIDS * (1 / (HRS/DAY TO RUN GEN)(FROM 'FACILITY OPERATION' SHEET))20.46 * 3.75 TON/HR SOLIDS = TON/DAY SOLIDS * (1 / (HRS/DAY TO RUN GEN)(FROM 'FACILITY OPERATION' SHEET))20.47 * 5,639 GAL/HR FLUIDS = GAL/DAY FLUIDS * DAY/24 HRS20.48 * 23.40 TON/HR FLUIDS = TON/DAY FLUIDS * DAY/24 HRS20.49 45,604 CUBIC FT/HR OF BIOGAS = BIOGAS PRODUCTION/HR (SCF/HR) (X% METHANE)(FROM 'FEEDSTOCK PARAMATERS' SHEET)20.50 22,802 CUBIC FT/HR OF METHANE = METHANE PRODUCTION/HR (SCF/HR) (FROM 'FEEDSTOCK PARAMATERS' SHEET)20.5120.52 EAW = LIQUID BY‐PRODUCT WILL HAVE A HIGH CONCENTRATION OF BIOLOGICALLY AVAILABLE NITROGEN AND PHOSPHOROUS20.53

FILE: AD_Plant_Model_REV_120304_1137_BRM_CASE_1.xls SHEET: GAS OUTPUT 3/4/2012, 12:17 PM
ITEM DESCRIPTION35 GAS OUTPUT FROM THE FACILITY
35.0135.02 GAS OUTPUT AVAILABLE FROM THE FACILITY:35.03 547,246 SCF/DAY METHANE AVAILABLE (FROM 'FEEDSTOCK PARAMATERS' SHEET)35.04 547,245,632 BTU/DAY AVAILABLE = MMBTU/HR (FROM 'FEEDSTOCK PARAMATERS' SHEET) * 1,000,00035.05 22,802 SCF/HR METHANE AVAILABLE (FROM 'FEEDSTOCK PARAMATERS' SHEET)35.06 22,801,901 BTU/HR AVAILABLE = MMBTU/HR (FROM 'FEEDSTOCK PARAMATERS' SHEET) * 1,000,00035.07 8.1 HR/DAY TO RUN GENERATORS (FROM 'FACILITY OPERATION' SHEET)35.0835.09 GAS OUTPUT CONVERTED TO ELECTRICITY:35.10 * 100 % OF AVAILABLE METHANE ALLOCATED TO DRIVE THE GENERATORS (FROM 'FACILITY OPERATION' SHEET)35.11 547,246 SCF/DAY METHANE INPUT TO INTERNAL COMBUSTION ENGINES OF GENERATORS35.12 547,245,632 BTU/DAY INPUT TO INTERNAL COMBUSTION ENGINES OF GENERATORS35.13 67,981 SCF/HR METHANE INPUT TO INTERNAL COMBUSTION ENGINES OF GENERATORS35.14 100 67,980,824 BTU/HR INPUT TO INTERNAL COMBUSTION ENGINES OF GENERATORS35.15 0.435 43.5 % EFFICIENCY OF INTERNAL COMBUSTION ENGINES EAW = CUMMINS C2000 ENGINES COMPLY WITH NEW SOURCE35.16 29,571,658 BTU/HR TRANSFERRED TO GENERATORS PERFORMANCE STANDARD (NSPS), 40 CFR, SUBPART JJJJ.35.17 0.92 92 % EFFICIENCY OF GENERATORS A CO CATALYST WILL BE USED TO CONTROL CO AND VOC'S35.18 40.02 27,205,926 BTU/HR CONVERTED TO ELECTRICITY35.19 * 7,966 KW‐HR PRODUCED PER HR @ 0.0002928 KW‐HR/BTU35.20 EAW = CONNECTION VIA DEDICATED 12.47 KV DISTRIBUTION CLASS CIRCUIT, 500 KCMIL, 15 KV CABLE35.21 64,125 KW‐HR PRODUCED PER DAY35.2235.23 HEAT BTU'S RECOVERED FROM ENGINE AND GENERATOR:35.24 40,774,898 BTU/HR CONVERTED TO HEAT BY ENGINES AND GENERATORS = BTU/HR TO ENGINES ‐ BTU/HR CONVERTED TO ELECTRICITY35.25 70 % RECOVERY OF BTU/HR THAT WAS CONVERTED TO HEAT35.26 28,542,429 BTU/HR HEAT RECOVERED FROM COOLING JACKETS AND EXHAUST STACKS35.2735.28 RECOVERED HEAT BTU'S USED TO DRY DIGESTATE:35.29 * 834 GAL/HR SOLIDS DISCHARGED (FROM 'DIGESTER' SHEET)35.30 3.75 TONS/HR SOLIDS DISCHARGED (FROM 'DIGESTER' SHEET) EAW = 1 TON/HR DRYING DURING TYPICAL OPERATIONS35.31 65 % DIGESTATE MOISTURE AFTER PRESSING FLUID OUT (FROM 'FACILITY OPERATION' SHEET)35.32 6.97 TONS/HR FLUIDS IN PRESSED DIGESTATE = (SOLIDS TONS/HR DISCHARGED * % MOISTURE/100)/(1 ‐ % MOISTURE/100)35.33 10 % DIGESTATE MOISTURE AFTER PRESSING FLUID OUT (FROM 'FACILITY OPERATION' SHEET)35.34 0.42 TONS/HR FLUIDS IN DRIED DIGESTATE = (SOLIDS TONS/HR DISCHARGED * % MOISTURE/100)/(1 ‐ % MOISTURE/100)35.35 6.55 TONS/HR FLUIDS TO BE REMOVED FROM DIGESTATE = TONS/HR FLUIDS IN PRESSED DIG ‐ TONS/HR FLUID IN DRIED DIG35.36 * 1,578 GAL/HR FLUIDS TO BE REMOVED FROM DIGESTATE = TONS/HR FLUIDS TO BE REMOVED * 2000LB/TON * GAL/8.3LB35.37 930 BTU/GAL TO RAISE FLUID TEMP FROM 100 DEG F TO 212 DEG F = 1 BTU/LB * 8.3 LB/GAL * 11235.38 9,346 BTU/GAL TO EVAPORATE FLUID35.39 504 BTU/GAL TO RAISE SOLIDS TEMP FROM 100 DEG F TO 212 DEG F = 0.5 BTU/LB * STATED LB/GAL * 11235.40 70 % THERMAL EFFICIENCY OF EVAPORATOR35.41 * 23,767,188 BTU/HR HEAT TO DRY DIGESTATE = (FLUID GAL/HR * (BTU/GAL TO RAISE FLUID TEMP + BTU/GAL TO EVAP) / % EFFICIENCY/100)35.42 + ((SOLIDS GAL/HR * BTU/GAL TO RAISE SOLIDS TEMP) / % EFFICIENCY/100)35.4335.44 RECOVERED HEAT BTU'S USED TO WARM INCOMING FEEDSTOCK:35.45 3,403 GAL/HR SOLIDS INPUT TO DIGESTER = GAL/DAY SOLIDS (FROM 'FEEDSTOCK DELIVERY' SHEET) /35.46 HRS/DAY TO RUN GEN(FROM 'FACILITY OPERATION' SHEET)35.47 10,380 GAL/HR FLUIDS INPUT TO DIGESTER = GAL/DAY SOLIDS (FROM 'FEEDSTOCK DELIVERY' SHEET) /35.48 HRS/DAY TO RUN GEN(FROM 'FACILITY OPERATION' SHEET)35.49 50 DEG F OF INCOMING FEEDSTOCK35.50 122 DEG F DIGESTER INPUT EAW = THERMOPHYLIC TEMP OF APPROX 50 DEG C = 122 DEG F35.51 597.6 BTU/GAL TO RAISE TEMP OF FLUIDS = 1 BTU/LB * 8.3 LB/GAL * (DIGESTER INPUT TEMP ‐ INCOMING FEEDSTOCK TEMP)35.52 324 BTU/GAL TO RAISE TEMP OF SOLIDS = 0.5 BTU/LB * STATED LB/GAL * (DIGESTER INPUT TEMP ‐ INCOMING FEEDSTOCK TEMP)35.53 70 % THERMAL EFFICIENCY OF HEAT TRANSFER35.54 * 10,436,435 BTU/HR HEAT TO WARM FEEDSTOCK = (FLUID GAL/HR * (BTU/GAL TO RAISE FLUID TEMP / % EFFICIENCY/100))35.55 + ((SOLIDS GAL/HR * BTU/GAL TO RAISE SOLIDS TEMP) / % EFFICIENCY/100)35.5635.57 RECOVERED HEAT BTU'S AVAILABLE FOR OTHER USES:35.58 * ‐5,661,195 BTU/HR AVAILABLE AFTER DRYING DIGESTATE AND WARMING FEEDSTOCK = 35.59 BTU/HR RECOVERED ‐ BTU/HR TO DRY DIGESTATE ‐ BTU/HR TO WARM INCOMING FEEDSTOCK35.60

FILE: AD_Plant_Model_REV_120304_1137_BRM_CASE_1.xls SHEET: FLUID OUTPUT 3/4/2012, 12:16 PM
ITEM DESCRIPTION30 WATER OUTPUT FROM THE FACILITY
30.0130.02 FLUIDS DISCHARGED FROM DIGESTER30.03 135,336 GAL/DAY FLUIDS, INCLUDING FLUIDS IN DIGESTATE (FROM 'DIGESTER' SHEET)30.04 13,513 GAL/DAY FLUIDS IN PRESSED DIGESTATE (FROM 'DIGESTATE REMOVAL' SHEET)30.05 121,823 GAL/DAY FLUIDS FACILITY OUTPUT = GAL/DAY FLUIDS INCL IN DIGESTATE ‐ GAL/DAY FLUIDS IN DIGESTATE30.0630.07 FLUIDS RECYCLED BACK TO FACILITY:30.08 * 78,020 TON/YR FACILITY OUTPUT RECYCLED TO INPUT30.09 * 51,507 GAL/DAY FACILITY OUTPUT RECYCLED TO INPUT = (TONS/YR * 2000 LB/TON / 8.3 LB/GAL) / 365 DAY/YR30.1030.11 FLUIDS DISCHARGED FROM THE FACILITY TO HOLDING PONDS:30.12 * 70,316 GAL/DAY FLUIDS DISCHARGED = GAL/DAY FLUIDS FACILITY OUTPUT ‐ GAL/DAY FACILITY OUTPUT RECYCLED TO INPUT30.13 25,665,430 GAL/YR FLUIDS DISCHARGED30.14 EAW = 55,000 GAL/DAY FROM THE PROCESS => 20,075,000 = GAL/YR30.15 EAW = 23 MMGAL/YR LIQUID BY‐PRODUCT TO HOLDING PONDS30.16 9,400 CUBIC FT/DAY FLUIDS DISCHARGED = GAL/DAY DISCHARGED * 0.13368 CUBIC FT/GAL30.17 3,430,955 CUBIC FT/YR FLUIDS DISCHARGED30.1830.19 FLUIDS FROM CONTACT STORMWATER AND SILAGE LEACHATE CHANNELED TO HOLDING PONDS:30.20 * 8,000 EAW = 8,000 GAL/DAY FROM CONTACT STORMWATER => 2,920,000 = GAL/YR30.21 EAW = 1.9 MMGAL/YR CONTACT STORMWATER AND SILAGE LEACHATE INTO SYSTEM30.22 2,920,000 GAL/YR FLUIDS CHANNELED30.23 1,069 CUBIC FT/DAY FLUIDS CHANNELED = GAL/DAY CHANNELED * 0.13368 CUBIC FT/GAL30.24 390,346 CUBIC FT/YR FLUIDS CHANNELED30.2530.26 TOTAL FLUIDS ENTERING HOLDING PONDS:30.27 78,316 TOTAL GAL/DAY FLUIDS ENTERING HOLDING PONDS = DISCHARGED GAL/DAY + CHANNELED GAL/DAY30.28 * 28,585,430 TOTAL GAL/YR FLUIDS ENTERING HOLDING PONDS30.29 10,469 TOTAL CUBIC FT/DAY FLUIDS ENTERING HOLDING PONDS = DISCHARGED CUBIC FT/DAY + CHANNELED CUBIC FT/DAY30.30 3,821,300 TOTAL CUBIC FT/YR ENTERING HOLDING PONDS30.3130.32 LEVEL CHANGE IN HOLDING PONDS:30.33 5 ACRES OF HOLDING PONDS EAW = 5.0 ACRES SPLIT BETWEEN 2 PONDS WITH CAPACITY OF 23M GALLONS30.34 43,560 = SQ FT/ACRE30.35 217,800 SQ FT OF HOLDING PONDS = ACRES OF HOLDING PONDS * SQ FT/ACRE30.36 0.04807 FT/DAY LEVEL CHANGE = TOTAL CUBIC FT/DAY ENTERING HOLDING PONDS / SQ FT OF HOLDING PONDS30.37 17.54 FT/YR LEVEL CHANGE = FT/DAY LEVEL CHANGE * 36530.3830.39 APPLICATION RATE ON FIELDS:30.40 4,300 ACRES OF APPLICATION FIELDS EAW = 4,300 ACRES OF CORN TO APPLY ENTIRE ANNUAL PRODUCTION30.41 6,648 GAL/YR/ACRE APPLICATION = TOTAL GAL/YR ENTERING HOLDING PONDS / ACRES OF APPLICATION FIELDS30.42 0.153 GAL/YR/SQ FT APPLICATION = GAL/YR/ACRE APPLICATION / SQ FT/ACRE30.43

FILE: AD_Plant_Model_REV_120304_1137_BRM_CASE_1.xls SHEET: FLUID REMOVAL 3/4/2012, 12:17 PM
ITEM DESCRIPTION31 REMOVAL OF FLUIDS FROM THE HOLDING PONDS
31.0131.02 APPLICATION LOADS NEEDED TO REMOVE FLUIDS FROM HOLDING PONDS AND APPLY THEM TO FIELDS31.03 28,585,430 TOTAL GAL/YR FLUIDS ENTERING HOLDING PONDS (FROM 'FLUID OUTPUT' SHEET)31.04 119,058.3 TOTAL TON/YR = TOTAL GAL/YR * 8.33 LB/GAL / 2000 LB/TON31.05 ? 12.0 TONS/APPLICATION LOAD31.06 9,921.5 APPLICATION LOADS/YR = TOTAL TON/YR / TONS/APPLICATION31.07 27.2 AVERAGE APPLICATION LOADS/DAY = APPLICATION LOADS/YR / 36531.0831.09 ? 60.0 NUMBER OF DAYS/YR IN WHICH TO ACCOMPLISH APPLICATION LOADS31.10 165.4 CONCENTRATED APPLICATION LOADS/DAY = APPLICATION LOADS/YR / APPLICATION DAYS/YR31.11 ? 24.0 NUMBER OF HRS/DAY IN WHICH TO ACCOMPLISH APPLICATION LOADS31.12 6.9 CONCENTRATED APPLICATION LOADS/HR = APPLICATION LOADS/DAY / APPLICATION HRS/DAY31.1331.14 FROM 'FEEDSTOCK DELIVERY' SHEET AVERAGE DAILY FLUIDS APPLICATION‐ CALCULATED DATA:31.15 4.10 DIESEL FUEL $/GAL 326.19 AVE APPL TON/DAY = TOTAL TON/YR / 36531.16 6.00 TRUCKING DIESEL FUEL MILE/GAL 27.18 AVE APPL LOADS/DAY = AVE APPL TON/DAY / TON/LOAD31.17 0.60 TRUCKING LABOR $/MILE 135.9 AVE APPL MILES/DAY = AVE MILES TO FIELD * 2 * AVE APPL LOADS/DAY31.18 0.50 TRUCKING OTHER $/MILE (MAINTENANCE, ETC.) 22.7 AVE APPL GAL/DAY = AVE APPL MILE/DAY / MILE/GAL31.19 92.87 AVE APPL DIESEL $/DAY = AVE APPL GAL/DAY * DIESEL $/GAL31.20 2.50 AVE MILES FROM AD FACILITY TO FIELDS 81.55 AVE APPL LABOR $/DAY = AVE APPL MILES/DAY * TRUCKING LABOR $/MILE31.21 67.96 AVE APPL OTHER $/DAY = AVE APPL MILES/DAY * TRUCKING OTHER $/MILE31.2231.23 CONCENTRATED DAILY FLUIDS APPLICATION‐ CALCULATED DATA:31.24 1,984.31 CONC APPL TON/DAY = TOTAL TON/YR / CONC DAY/YR31.25 165.36 CONC APPL LOADS/DAY = CONC APPL TON/DAY / TON/LOAD31.26 826.8 CONC APPL MILES/DAY = AVE MILES TO FIELD * 2 * CONC APPL LOADS/DAY31.27 137.8 CONC APPL GAL/DAY = CONC APPL MILE/DAY / MILE/GAL31.28 564.98 CONC APPL DIESEL $/DAY = CONC APPL GAL/DAY * DIESEL $/GAL31.29 496.08 CONC APPL LABOR $/DAY = CONC APPL MILES/DAY * TRUCKING LABOR $/MILE31.30 413.40 CONC APPL OTHER $/DAY = CONC APPL MILES/DAY * TRUCKING OTHER $/MILE31.3131.32 YEARLY FLUIDS APPLICATION‐ CALCULATED DATA:31.33 119,058.32 APPL TON/YR = TOTAL TON/YR31.34 9,921.53 APPL LOADS/YR = APPL LOAD/YR31.35 49,607.6 APPL MILES/YR = AVE MILES TO FIELD * 2 * APPL LOAD/YR31.36 8,267.9 APPL GAL/YR = APPL MILE/YR / MILE/GAL31.37 33,898.55 APPL DIESEL $/YR = APPL GAL/YR * DIESEL $/GAL31.38 29,764.58 APPL LABOR $/YR = APPL MILES/YR * TRUCKING LABOR $/MILE31.39 24,803.82 APPL OTHER $/YR = APPL MILES/YR * TRUCKING OTHER $/MILE31.40

FILE: AD_Plant_Model_REV_120304_1137_BRM_CASE_1.xls SHEET:DIGESTATE REMOVAL 3/4/2012, 12:16 PM
ITEM DESCRIPTION25 DIGESTATE REMOVAL
25.0125.02 DAILY SOLIDS DISCHARGED FROM DIGESTER25.03 30.20 TON/DAY SOLIDS (FROM 'DIGESTER' SHEET)25.04 8.1 HR/DAY TO RUN GENERATORS (FROM 'FACILITY OPERATION' SHEET)25.0525.06 DAILY FLUIDS CONTAINED IN DIGESTATE AFTER PRESSING:25.07 65 % DIGESTATE MOISTURE AFTER PRESSING FLUID OUT (FROM 'FACILITY OPERATION' SHEET)25.08 56.08 TON/DAY FLUIDS IN PRESSED DIGESTATE = (SOLIDS TON/DAY DISCHARGED * % MOISTURE/100)/(1 ‐ (% MOISTURE/100))25.09 13,513 GAL/DAY FLUIDS IN PRESSED DIGESTATE = TON/DAY FLUIDS IN PRESSED DIGESTATE * 2000LB/TON * GAL/8.3LB25.1025.11 DAILY FLUIDS CONTAINED IN DIGESTATE AFTER DRYING:25.12 10 % DIGESTATE MOISTURE AFTER DRYING (FROM 'FACILITY OPERATION' SHEET)25.13 3.36 # TON/DAY FLUIDS IN DRIED DIGESTATE = (SOLIDS TON/DAY DISCHARGED * % MOISTURE/100)/(1 ‐ (% MOISTURE/100))25.14 808 GAL/DAY FLUIDS IN DRIED DIGESTATE = TON/DAY FLUIDS IN DRIED DIGESTATE * 2000LB/TON * GAL/8.3LB25.1525.16 DAILY FLUIDS EVAPORATED FROM DIGESTATE DURING DRYING:25.17 12,704 GAL/DAY EVAPORATED = GAL/DAY IN PRESSED DIGESTATE ‐ GAL/DAY IN DRIED DIGESTATE25.18 4,637,134 = CALC'D GAL/YR EAW = 3 MMGAL/YR IN DIGESTATE TO EVAPORATION25.1925.20 DAILY DIGESTATE DISCHARGED FROM THE FACILITY:25.21 * 33.55 TON/DAY DIGESTATE = SOLIDS TON/DAY + FLUIDS TONS/DAY25.22 EAW = 16 TON/DAY25.23 YEARLY DIGESTATE DISCHARGED FROM THE FACILITY:25.24 12,246 TON/YEAR DIGESTATE = DIGESTATE TON/DAY * 36525.2525.26 FROM 'FEEDSTOCK DELIVERY' SHEET TOTAL DIGESTATE TO ALL DESTINATIONS‐ CALCULATED DATA:25.27 4.10 DIESEL FUEL $/GAL * 33.55 TON/DAY25.28 6.00 TRUCKING DIESEL FUEL MILE/GAL 1.40 TRUCKLOADS/DAY25.29 0.60 TRUCKING LABOR $/MILE 209.7 TRUCKING MILES/DAY25.30 0.50 TRUCKING OTHER $/MILE (MAINTENANCE, ETC.) 34.9 TRUCKING GAL/DAY25.31 143.29 TRUCKING DIESEL $/DAY25.32 125.82 TRUCKING LABOR $/DAY25.33 104.85 TRUCKING OTHER $/DAY25.3425.35 100 % DIGESTATE ACCOUNTED FOR BELOW25.36 * 50 % TO DIGESTATE DESTINATION 1 DIGESTATE DESTINATION 1‐ CALCULATED DATA:25.37 24 TON/TRUCK LOAD 16.78 TON/DAY = TOTAL TON/DAY * (% / 100)25.38 50 MILES FROM FACILITY TO DESTINATION 0.70 TRUCKLOADS/DAY = TON/DAY / TON/TRUCK LOAD25.39 69.9 TRUCKING MILES/DAY = MILES TO DESTINATION * 2 * TRUCKLOADS/DAY25.40 11.6 TRUCKING GAL/DAY = TRUCKING MILE/DAY / MILE/GAL25.41 47.76 TRUCKING DIESEL $/DAY = TRUCKING GAL/DAY * DIESEL $/GAL25.42 41.94 TRUCKING LABOR $/DAY = TRUCKING MILES/DAY * TRUCKING LABOR $/MILE25.43 34.95 TRUCKING OTHER $/DAY = TRUCKING MILES/DAY * TRUCKING OTHER $/MILE25.4425.45 * 50 % TO DIGESTATE DESTINATION 2 DIGESTATE DESTINATION 2‐ CALCULATED DATA:25.46 24 TON/TRUCK LOAD 16.78 TON/DAY = TOTAL TON/DAY * (% / 100)25.47 100 MILES FROM FACILITY TO DESTINATION 0.70 TRUCKLOADS/DAY = TON/DAY / TON/TRUCK LOAD25.48 139.8 TRUCKING MILES/DAY = MILES TO DESTINATION * 2 * TRUCKLOADS/DAY25.49 23.3 TRUCKING GAL/DAY = TRUCKING MILE/DAY / MILE/GAL25.50 95.53 TRUCKING DIESEL $/DAY = TRUCKING GAL/DAY * DIESEL $/GAL25.51 83.88 TRUCKING LABOR $/DAY = TRUCKING MILES/DAY * TRUCKING LABOR $/MILE25.52 69.90 TRUCKING OTHER $/DAY = TRUCKING MILES/DAY * TRUCKING OTHER $/MILE25.53

FILE: AD_Plant_Model_REV_120304_1137_BRM_CASE_2.xls SHEET: FACILITY OPERATION 3/4/2012, 4:38 PM
ITEM DESCRIPTION05 FACILITY OPERATION
05.01 LIMITS05.02 45K 45,000 TON/YR DRY BASIS 171,565 TON/YR AS‐IS 41,341,028 GAL/YR AS‐IS05.03 21,927,711 GAL/YR 26.23 TS (TOTAL SOLIDS) (%) OF FEEDSTOCK BEFORE ADJUSTMENT05.04 ?? 91,000 TON/YR WATER TO ADJUST FEEDSTOCK TS (%) ?? 12.0 11.98 TS (TOTAL SOLIDS) (%) OF FEEDSTOCK AFTER ADJUSTMENT05.05 78.02K 112,500 TON/YR FACILITY OUTPUT RECYCLED TO INPUT 30.0 29.96 % OF INFEED THAT IS RECYCLED FLUID05.06 415 TON/YR TRUCK CLEANOUT 27,108,434 GAL/YR05.07 0 TON/YR OTHER05.08 30 30 DAYS IN DIGESTER FOR SOLIDS 4,800,000 3,784,235 GAL IN DIGESTERS 15,761 TON IN DIGESTERS05.09 ?? 15 DAYS IN DIGESTER FOR LIQUIDS EAW = 4,800,000 GAL IN DIGESTERS05.1005.1105.12 39 Excess > 69.02 TRUCKLOADS/DAY TOTAL (AVERAGE!! SEE HIGHWAY TRAFFIC SHEET)
05.13 THE AVERAGE OF % FEEDSTOCKS ON PAGE 3 OF EAW ARE BELOW: 1.40 TRUCKLOADS/DAY DIGESTATE REMOVAL05.14 100 % FEEDSTOCK ACCOUNTED FOR BELOW, DRY BASIS 48.03 TRUCKLOADS/DAY FLUID REMOVAL05.15 10.0 10 % CHICKEN LITTER IN MIX, DRY BASIS 1.58 TRUCKLOADS/DAY FEEDSTOCK DELIVERY05.16 30 MILES FROM FACILITY TO SOURCE05.17 2.5 2.5 % VEGETABLE WASTE IN MIX, DRY BASIS 0.47 TRUCKLOADS/DAY FEEDSTOCK DELIVERY05.18 25 MILES FROM FACILITY TO SOURCE05.19 57.5 57.5 % SILAGE IN MIX, DRY BASIS 11.82 TRUCKLOADS/DAY FEEDSTOCK DELIVERY05.20 25 MILES FROM FACILITY TO SOURCE 15,000 Excess > 25,875 DRY TONS STORAGE NEEDED EAW = 15,000 DRY TONS05.21 25.0 25 % POTATO WASTE IN MIX, DRY BASIS 5.14 TRUCKLOADS/DAY FEEDSTOCK DELIVERY05.22 45 MILES FROM FACILITY TO SOURCE05.23 2.5 2.5 % SNACK FOOD WASTE IN MIX, DRY BASIS 0.19 TRUCKLOADS/DAY FEEDSTOCK DELIVERY05.24 25 MILES FROM FACILITY TO SOURCE05.25 2.5 2.5 % FRUIT WASTE IN MIX, DRY BASIS 0.40 TRUCKLOADS/DAY FEEDSTOCK DELIVERY05.26 25 MILES FROM FACILITY TO SOURCE
ACTIONS/ADJUSTMENTS INFEED RESULTS
AVERAGE TRUCKLOADS/DAY
05.2705.28 65 % MOISTURE OF DIGESTATE AFTER PRESSING05.29 10 10 % MOISTURE OF DIGESTATE AFTER DRYING05.30 EAW = 12‐16 HRS/DAY, 7 DAYS/WEEK TO RUN GENERATORS05.31 8.05 HRS/DAY TO RUN GENERATORS05.32 1,000 BTU/SCF OF METHANE05.33 50 50 % OF BIOGAS THAT IS METHANE05.34 100 100 % OF AVAILABLE METHANE ALLOCATED05.35 TO DRIVE THE GENERATORS05.3605.37 547.2 MMBTU/DAY 05.38 EAW = 8 KW‐HR/HR MAXIMUM GENERATOR OUTPUT 8,000 7,966 KW‐HR/HR PRODUCED05.39 EAW = 96,000‐128,000 KW‐HR/DAY FROM GENERATORS 96,000 Deficit > 64,125 KW‐HR/DAY PRODUCED05.40 59,997 KW‐HR/DAY AVAIL TO SELL05.4105.42 EAW = 16 TON/DAY DIGESTATE AFTER DRYING 16 Excess > 33.55 TON/DAY DIGESTATE DISCHARGE AFTER DRYING05.43 0 Deficit > ‐5,661,195 BTU/HR HEAT AVAILABLE AFTER DRYING DIG & WARMING FEEDSTOCK05.4405.45 EAW = 55,000 GAL/DAY PROCESS + 8,000 GAL/DAY STORMWATER 63,000 Excess > 138,392 GAL/DAY LIQUID BY‐PRODUCT ENTERING HOLDING PONDS05.46 EAW = 23,000,000 GAL/YR MAXIMUM 23,000,000 Excess > 50,513,141 GAL/YR IN PONDS 210,387 TON/YR IN PONDS05.4705.4805.49 NOTES: = DATA THAT CAME FROM THE EAW05.50 XXX = A CELL WHERE DATA CAN BE ENTERED MANUALLY
FACILITY OUTPUTS

FILE: AD_Plant_Model_REV_120304_1137_BRM_CASE_2.xls SHEET:FEEDSTOCK DELIVERY 3/4/2012, 4:39 PM
ITEM DESCRIPTION10 FEEDSTOCK DELIVERY
10.001 TOTAL FEEDSTOCK‐ CALCULATED DATA:10.002 * 45,000 TONS DRY BASIS/YR * 45,000 TONS DRY BASIS/YR ( = TONS DRY BASIS/YR * % /100)10.003 126,565 TONS MOISTURE/YR ( = ((TONS DRY BASIS/YR) * % MOISTURE) / (100 ‐ % MOISTURE))10.004 4.10 DIESEL FUEL $/GAL * 171,565 TOTAL TONS/YR ( = TONS DRY BASIS/YR + TONS MOISTURE/YR)10.005 6.00 TRUCKING DIESEL FUEL MILE/GAL 10,000,000 GAL DRY BASIS/YR ( = ((TONS DRY BASIS/YR)*2000LBS/TON) / (DRY BASIS LBS/GAL)))10.006 0.60 TRUCKING LABOR $/MILE 30,497,655 GAL MOISTURE/YR ( = ((TONS MOISTURE/YR)*2000LBS/TON) / (8.3 LBS/GAL)))10.007 0.50 TRUCKING OTHER $/MILE (MAINTENANCE, ETC.) 40,497,655 TOTAL GAL/YR ( = GAL DRY BASIS/YR + GAL MOISTURE/YR)10.008 * 7,149 TRUCKLOADS/YR ( = TOTAL TONS/YR / TOTAL TONS/TRUCK LOAD)10.009 * 438,197 TRUCKING MILE/YR ( = MILES TO SOURCE * 2 * TRUCKLOADS/YR)10.010 * 73,033 TRUCKING DIESEL GAL/YR ( = TRUCKING MILE/YR / MILE/GAL)10.011 299,434.53 TRUCKING DIESEL $/YR ( = TRUCKING GAL/YR * DIESEL $/GAL)10.012 262,918.12 TRUCKING LABOR $/YR ( = TRUCKING MILE/YR * TRUCKING LABOR $/MILE)10.013 219,098.44 TRUCKING OTHER $/YR ( = TRUCKING MILE/YR * TRUCKING OTHER $/MILE)10.01410.015 * 123.3 TONS DRY BASIS/DAY10.016 346.8 TONS MOISTURE/DAY10.017 * 470.0 TOTAL TONS/DAY10.018 27,397 GAL DRY BASIS/DAY10.019 83,555 GAL MOISTURE/DAY10.020 110,952 TOTAL GAL/DAY10.021 * 19.6 TRUCKLOADS/DAY10.022 * 1,201 TRUCKING MILE/DAY10.023 NOTE: IN THE 120207 EAW, PART b., PAGE 3, THE AVERAGE % SOLIDS * 200.1 TRUCKING DIESEL GAL/DAY10.024 STATED IN XERGI'S CHART ARE USED BELOW BUT ARE 820.37 TRUCKING DIESEL $/DAY10.025 SHOWN CONVERTED TO % MOISTURE BY THIS EQUATION: 720.32 TRUCKING LABOR $/DAY10.026 AVE % MOISTURE = 100% ‐ AVE % SOLIDS 600.27 TRUCKING OTHER $/DAY10.02710.028 100 % FEEDSTOCK ACCOUNTED FOR BELOW, DRY BASIS10.029 10 % CHICKEN LITTER IN MIX, DRY BASIS CHICKEN LITTER ‐ CALCULATED DATA:10.030 67.5 AVE % MOISTURE * 4,500 TONS DRY BASIS/YR ( = TONS DRY BASIS/YR * % /100)10.031 24 TOTAL TONS/TRUCK LOAD 9,346 TONS MOISTURE/YR ( = ((TONS DRY BASIS/YR) * % MOISTURE) / (100 ‐ % MOISTURE))10.032 30 MILES FROM AD FACILITY TO SOURCE * 13,846 TOTAL TONS/YR ( = TONS DRY BASIS/YR + TONS MOISTURE/YR)10.033 9 DRY BASIS LBS/GAL 1,000,000 GAL DRY BASIS/YR ( = ((TONS DRY BASIS/YR)*2000LBS/TON) / (DRY BASIS LBS/GAL)))10.034 2,252,085 GAL MOISTURE/YR ( = ((TONS MOISTURE/YR)*2000LBS/TON) / (8.3 LBS/GAL)))10.035 3,252,085 TOTAL GAL/YR ( = GAL DRY BASIS/YR + GAL MOISTURE/YR)10.036 * 577 TRUCKLOADS/YR ( = TOTAL TONS/YR / TOTAL TONS/TRUCK LOAD)10.037 * 34,615 TRUCKING MILE/YR ( = MILES TO SOURCE * 2 * TRUCKLOADS/YR)10.038 * 5,769 TRUCKING DIESEL GAL/YR ( = TRUCKING MILE/YR / MILE/GAL)10.039 23,653.85 TRUCKING DIESEL $/YR ( = TRUCKING GAL/YR * DIESEL $/GAL)10.040 20,769.23 TRUCKING LABOR $/YR ( = TRUCKING MILE/YR * TRUCKING LABOR $/MILE)10.041 17,307.69 TRUCKING OTHER $/YR ( = TRUCKING MILE/YR * TRUCKING OTHER $/MILE)10.04210.043 * 12.3 TONS DRY BASIS/DAY10.044 25.6 TONS MOISTURE/DAY10.045 * 37.9 TOTAL TONS/DAY10.046 2,739.7 GAL DRY BASIS/DAY10.047 6,170.1 GAL MOISTURE/DAY

FILE: AD_Plant_Model_REV_120304_1137_BRM_CASE_2.xls SHEET:FEEDSTOCK DELIVERY 3/4/2012, 4:39 PM
10.048 8,909.8 TOTAL GAL/DAY10.049 * 1.6 TRUCKLOADS/DAY10.050 * 94.8 TRUCKING MILE/DAY10.051 * 15.8 TRUCKING DIESEL GAL/DAY10.052 64.81 TRUCKING DIESEL $/DAY10.053 56.90 TRUCKING LABOR $/DAY10.054 47.42 TRUCKING OTHER $/DAY10.05510.056 2.5 % VEGETABLE WASTE IN MIX, DRY BASIS VEGETABLE WASTE ‐ CALCULATED DATA:10.057 72.5 AVE % MOISTURE * 1,125 TONS DRY BASIS/YR ( = TONS DRY BASIS/YR * % /100)10.058 24 TOTAL TONS/TRUCK LOAD 2,966 TONS MOISTURE/YR ( = ((TONS DRY BASIS/YR) * % MOISTURE) / (100 ‐ % MOISTURE))10.059 25 MILES FROM AD FACILITY TO SOURCE * 4,091 TOTAL TONS/YR ( = TONS DRY BASIS/YR + TONS MOISTURE/YR)10.060 9 DRY BASIS LBS/GAL 250,000 GAL DRY BASIS/YR ( = ((TONS DRY BASIS/YR)*2000LBS/TON) / (DRY BASIS LBS/GAL)))10.061 714,677 GAL MOISTURE/YR ( = ((TONS MOISTURE/YR)*2000LBS/TON) / (8.3 LBS/GAL)))10.062 964,677 TOTAL GAL/YR ( = GAL DRY BASIS/YR + GAL MOISTURE/YR)10.063 * 170 TRUCKLOADS/YR ( = TOTAL TONS/YR / TOTAL TONS/TRUCK LOAD)10.064 * 8,523 TRUCKING MILE/YR ( = MILES TO SOURCE * 2 * TRUCKLOADS/YR)10.065 * 1,420 TRUCKING DIESEL GAL/YR ( = TRUCKING MILE/YR / MILE/GAL)10.066 5,823.86 TRUCKING DIESEL $/YR ( = TRUCKING GAL/YR * DIESEL $/GAL)10.067 5,113.64 TRUCKING LABOR $/YR ( = TRUCKING MILE/YR * TRUCKING LABOR $/MILE)10.068 4,261.36 TRUCKING OTHER $/YR ( = TRUCKING MILE/YR * TRUCKING OTHER $/MILE)10.06910.070 * 3.1 TONS DRY BASIS/DAY10.071 8.1 TONS MOISTURE/DAY10.072 * 11.2 TOTAL TONS/DAY10.073 684.9 GAL DRY BASIS/DAY10.074 1,958.0 GAL MOISTURE/DAY10.075 2,643.0 TOTAL GAL/DAY10.076 * 0.5 TRUCKLOADS/DAY10.077 * 23.3 TRUCKING MILE/DAY10.078 * 3.9 TRUCKING DIESEL GAL/DAY10.079 15.96 TRUCKING DIESEL $/DAY10.080 14.01 TRUCKING LABOR $/DAY10.081 11.67 TRUCKING OTHER $/DAY10.08210.083 57.5 % SILAGE IN MIX, DRY BASIS SILAGE‐ CALCULATED DATA:10.084 75 AVE % MOISTURE * 25,875 TONS DRY BASIS/YR ( = TONS DRY BASIS/YR * % /100)10.085 24 TOTAL TONS/TRUCK LOAD 77,625 TONS MOISTURE/YR ( = ((TONS DRY BASIS/YR) * % MOISTURE) / (100 ‐ % MOISTURE))10.086 25 MILES FROM AD FACILITY TO SOURCE * 103,500 TOTAL TONS/YR ( = TONS DRY BASIS/YR + TONS MOISTURE/YR)10.087 9 DRY BASIS LBS/GAL 5,750,000 GAL DRY BASIS/YR ( = ((TONS DRY BASIS/YR)*2000LBS/TON) / (DRY BASIS LBS/GAL)))10.088 18,704,819 GAL MOISTURE/YR ( = ((TONS MOISTURE/YR)*2000LBS/TON) / (8.3 LBS/GAL)))10.089 EAW = STORAGE FOR 15K DRY TONS OF SILAGE 24,454,819 TOTAL GAL/YR ( = GAL DRY BASIS/YR + GAL MOISTURE/YR)10.090 * 4,313 TRUCKLOADS/YR ( = TOTAL TONS/YR / TOTAL TONS/TRUCK LOAD)10.091 * 215,625 TRUCKING MILE/YR ( = MILES TO SOURCE * 2 * TRUCKLOADS/YR)10.092 * 35,938 TRUCKING DIESEL GAL/YR ( = TRUCKING MILE/YR / MILE/GAL)10.093 147,343.75 TRUCKING DIESEL $/YR ( = TRUCKING GAL/YR * DIESEL $/GAL)10.094 129,375.00 TRUCKING LABOR $/YR ( = TRUCKING MILE/YR * TRUCKING LABOR $/MILE)10.095 107,812.50 TRUCKING OTHER $/YR ( = TRUCKING MILE/YR * TRUCKING OTHER $/MILE)10.096

FILE: AD_Plant_Model_REV_120304_1137_BRM_CASE_2.xls SHEET:FEEDSTOCK DELIVERY 3/4/2012, 4:39 PM
10.097 * 70.9 TONS DRY BASIS/DAY10.098 212.7 TONS MOISTURE/DAY10.099 * 283.6 TOTAL TONS/DAY10.100 15,753.4 GAL DRY BASIS/DAY10.101 51,246.1 GAL MOISTURE/DAY10.102 66,999.5 TOTAL GAL/DAY10.103 * 11.8 TRUCKLOADS/DAY10.104 * 590.8 TRUCKING MILE/DAY10.105 * 98.5 TRUCKING DIESEL GAL/DAY10.106 403.68 TRUCKING DIESEL $/DAY10.107 354.45 TRUCKING LABOR $/DAY10.108 295.38 TRUCKING OTHER $/DAY10.10910.110 25 % POTATO WASTE IN MIX, DRY BASIS POTATO WASTE‐ CALCULATED DATA:10.111 75 AVE % MOISTURE * 11,250 TONS DRY BASIS/YR ( = TONS DRY BASIS/YR * % /100)10.112 24 TOTAL TONS/TRUCK LOAD 33,750 TONS MOISTURE/YR ( = ((TONS DRY BASIS/YR) * % MOISTURE) / (100 ‐ % MOISTURE))10.113 45 MILES FROM AD FACILITY TO SOURCE * 45,000 TOTAL TONS/YR ( = TONS DRY BASIS/YR + TONS MOISTURE/YR)10.114 9 DRY BASIS LBS/GAL 2,500,000 GAL DRY BASIS/YR ( = ((TONS DRY BASIS/YR)*2000LBS/TON) / (DRY BASIS LBS/GAL)))10.115 8,132,530 GAL MOISTURE/YR ( = ((TONS MOISTURE/YR)*2000LBS/TON) / (8.3 LBS/GAL)))10.116 10,632,530 TOTAL GAL/YR ( = GAL DRY BASIS/YR + GAL MOISTURE/YR)10.117 * 1,875 TRUCKLOADS/YR ( = TOTAL TONS/YR / TOTAL TONS/TRUCK LOAD)10.118 * 168,750 TRUCKING MILE/YR ( = MILES TO SOURCE * 2 * TRUCKLOADS/YR)10.119 * 28,125 TRUCKING DIESEL GAL/YR ( = TRUCKING MILE/YR / MILE/GAL)10.120 115,312.50 TRUCKING DIESEL $/YR ( = TRUCKING GAL/YR * DIESEL $/GAL)10.121 101,250.00 TRUCKING LABOR $/YR ( = TRUCKING MILE/YR * TRUCKING LABOR $/MILE)10.122 84,375.00 TRUCKING OTHER $/YR ( = TRUCKING MILE/YR * TRUCKING OTHER $/MILE)10.12310.124 * 30.8 TONS DRY BASIS/DAY10.125 92.5 TONS MOISTURE/DAY10.126 * 123.3 TOTAL TONS/DAY10.127 6,849.3 GAL DRY BASIS/DAY10.128 22,280.9 GAL MOISTURE/DAY10.129 29,130.2 TOTAL GAL/DAY10.130 * 5.1 TRUCKLOADS/DAY10.131 * 462.3 TRUCKING MILE/DAY10.132 * 77.1 TRUCKING DIESEL GAL/DAY10.133 315.92 TRUCKING DIESEL $/DAY10.134 277.40 TRUCKING LABOR $/DAY10.135 231.16 TRUCKING OTHER $/DAY10.13610.137 2.5 % SNACK FOOD WASTE IN MIX, DRY BASIS SNACK FOOD WASTE‐ CALCULATED DATA:10.138 32.5 AVE % MOISTURE * 1,125 TONS DRY BASIS/YR ( = TONS DRY BASIS/YR * % /100)10.139 24 TOTAL TONS/TRUCK LOAD 542 TONS MOISTURE/YR ( = ((TONS DRY BASIS/YR) * % MOISTURE) / (100 ‐ % MOISTURE))10.140 25 MILES FROM AD FACILITY TO SOURCE * 1,667 TOTAL TONS/YR ( = TONS DRY BASIS/YR + TONS MOISTURE/YR)10.141 9 DRY BASIS LBS/GAL 250,000 GAL DRY BASIS/YR ( = ((TONS DRY BASIS/YR)*2000LBS/TON) / (DRY BASIS LBS/GAL)))10.142 130,522 GAL MOISTURE/YR ( = ((TONS MOISTURE/YR)*2000LBS/TON) / (8.3 LBS/GAL)))10.143 380,522 TOTAL GAL/YR ( = GAL DRY BASIS/YR + GAL MOISTURE/YR)10.144 * 69 TRUCKLOADS/YR ( = TOTAL TONS/YR / TOTAL TONS/TRUCK LOAD)10.145 * 3,472 TRUCKING MILE/YR ( = MILES TO SOURCE * 2 * TRUCKLOADS/YR)

FILE: AD_Plant_Model_REV_120304_1137_BRM_CASE_2.xls SHEET:FEEDSTOCK DELIVERY 3/4/2012, 4:39 PM
10.146 * 579 TRUCKING DIESEL GAL/YR ( = TRUCKING MILE/YR / MILE/GAL)10.147 2,372.69 TRUCKING DIESEL $/YR ( = TRUCKING GAL/YR * DIESEL $/GAL)10.148 2,083.33 TRUCKING LABOR $/YR ( = TRUCKING MILE/YR * TRUCKING LABOR $/MILE)10.149 1,736.11 TRUCKING OTHER $/YR ( = TRUCKING MILE/YR * TRUCKING OTHER $/MILE)10.15010.151 * 3.1 TONS DRY BASIS/DAY10.152 1.5 TONS MOISTURE/DAY10.153 * 4.6 TOTAL TONS/DAY10.154 684.9 GAL DRY BASIS/DAY10.155 357.6 GAL MOISTURE/DAY10.156 1,042.5 TOTAL GAL/DAY10.157 * 0.2 TRUCKLOADS/DAY10.158 * 9.5 TRUCKING MILE/DAY10.159 * 1.6 TRUCKING DIESEL GAL/DAY10.160 6.50 TRUCKING DIESEL $/DAY10.161 5.71 TRUCKING LABOR $/DAY10.162 4.76 TRUCKING OTHER $/DAY10.16310.164 2.5 % FRUIT WASTE IN MIX, DRY BASIS FRUIT WASTE ‐ CALCULATED DATA:10.165 67.5 AVE % MOISTURE * 1,125 TONS DRY BASIS/YR ( = TONS DRY BASIS/YR * % /100)10.166 24 TOTAL TONS/TRUCK LOAD 2,337 TONS MOISTURE/YR ( = ((TONS DRY BASIS/YR) * % MOISTURE) / (100 ‐ % MOISTURE))10.167 25 MILES FROM AD FACILITY TO SOURCE * 3,462 TOTAL TONS/YR ( = TONS DRY BASIS/YR + TONS MOISTURE/YR)10.168 9 DRY BASIS LBS/GAL 250,000 GAL DRY BASIS/YR ( = ((TONS DRY BASIS/YR)*2000LBS/TON) / (DRY BASIS LBS/GAL)))10.169 563,021 GAL MOISTURE/YR ( = ((TONS MOISTURE/YR)*2000LBS/TON) / (8.3 LBS/GAL)))10.170 813,021 TOTAL GAL/YR ( = GAL DRY BASIS/YR + GAL MOISTURE/YR)10.171 * 144 TRUCKLOADS/YR ( = TOTAL TONS/YR / TOTAL TONS/TRUCK LOAD)10.172 * 7,212 TRUCKING MILE/YR ( = MILES TO SOURCE * 2 * TRUCKLOADS/YR)10.173 * 1,202 TRUCKING DIESEL GAL/YR ( = TRUCKING MILE/YR / MILE/GAL)10.174 4,927.88 TRUCKING DIESEL $/YR ( = TRUCKING GAL/YR * DIESEL $/GAL)10.175 4,326.92 TRUCKING LABOR $/YR ( = TRUCKING MILE/YR * TRUCKING LABOR $/MILE)10.176 3,605.77 TRUCKING OTHER $/YR ( = TRUCKING MILE/YR * TRUCKING OTHER $/MILE)10.17710.178 * 3.1 TONS DRY BASIS/DAY10.179 6.4 TONS MOISTURE/DAY10.180 * 9.5 TOTAL TONS/DAY10.181 684.9 GAL DRY BASIS/DAY10.182 1,542.5 GAL MOISTURE/DAY10.183 2,227.5 TOTAL GAL/DAY10.184 * 0.4 TRUCKLOADS/DAY10.185 * 19.8 TRUCKING MILE/DAY10.186 * 3.3 TRUCKING DIESEL GAL/DAY10.187 13.50 TRUCKING DIESEL $/DAY10.188 11.85 TRUCKING LABOR $/DAY10.189 9.88 TRUCKING OTHER $/DAY10.190

FILE: AD_Plant_Model_REV_120304_1137_BRM_CASE_2.xls SHEET: HIGHWAY TRAFFIC 3/4/2012, 4:40 PM
ITEM11 EAW = HWY 112 TRAFFIC VOLUME OF 920
11.01 JAN FEB MAR APR MAY JUN JUL AUG SEP OCT NOV DEC DESCRIPTION & COUNTY ROAD 115 TRAFFIC VOLUME OF 54011.0211.03 1.58 1.58 1.58 1.58 1.58 1.58 1.58 1.58 1.58 1.58 1.58 1.58 CHICKEN LITTER11.0411.05 0.47 0.47 0.47 0.47 0.47 0.47 0.47 0.47 0.47 0.47 0.47 0.47 VEGETABLE WASTE11.0611.07 71.88 71.88 SILAGE EAW = 2 TRUCKS/HR DURING AUGUST & SEPTEMBER11.08 FOR TOTAL 6‐11% INCREASE11.09 5.14 5.14 5.14 5.14 5.14 5.14 5.14 5.14 5.14 5.14 5.14 5.14 POTATO WASTE11.1011.11 0.19 0.19 0.19 0.19 0.19 0.19 0.19 0.19 0.19 0.19 0.19 0.19 SNACK FOOD WASTE11.1211.13 0.40 0.40 0.40 0.40 0.40 0.40 0.40 0.40 0.40 0.40 0.40 0.40 FRUIT WASTE11.1411.15 1.40 1.40 1.40 1.40 1.40 1.40 1.40 1.40 1.40 1.40 1.40 1.40 DIGESTATE REMOVAL11.1611.17 292.20 292.20 LIQUID BY‐PRODUCT REMOVAL EAW = 1‐2 TRUCKS/HR FOR LIQUID BY‐PRODUCT DELIVERY11.18 APRIL & OCTOBER FOR TOTAL 9‐15% INCREASE11.19 9.17 9.17 9.17 301.37 9.17 9.17 9.17 81.04 81.04 301.37 9.17 9.17 TOTALS EAW = 15/DAY AVERAGE FOR 1‐2% INCREASE11.2011.21 CALCULATE CONCENTRATED SILAGE DELIVERY LOADS PER DAY FOR USE IN TABLE ABOVE11.22 11.82 AVERAGE TRUCKLOADS/DAY FROM SILAGE SOURCE (FROM "FEEDSTOCK DELIVERY" SHEET)11.23 4,312.5 TRUCKLOADS/YR = AVERAGE TRUCKLOADS/DAY * 36511.24 60.0 NUMBER OF DAYS/YR IN WHICH TO ACCOMPLISH TRUCKLOADS11.25 71.9 CONCENTRATED TRUCKLOADS/DAY = TRUCKLOADS/YR / TRUCKDAYS/YR11.26 24.0 HRS/DAY FOR TRUCKLOADS TO BE DELIVERED11.27 3.0 CONCENTRATED TRUCKLOADS/HR = CONCENTRATED TRUCKLOADS/DAY / HRS/DAY FOR TRUCKLOADS11.28
TRUCKLOADS PER DAY

FILE: AD_Plant_Model_REV_120304_1137_BRM_CASE_2.xls SHEET:FEEDSTOCK PARAMETERS 3/4/2012, 4:41 PM
ITEM DESCRIPTION15 FEEDSTOCK PARAMETERS
15.0115.02 50 % OF BIOGAS THAT IS METHANE (FROM 'FACILITY OPERATION' SHEET)15.03 1000 BTU/SCF OF METHANE (FROM 'FACILITY OPERATION' SHEET)15.0415.05 PARAMETER POULTRY 1 VEG WASTE CORN SILAGE POTATO WASTE SNACK FOOD WASTE FRUIT WASTE MIXTURE ENGINEERING UNITS15.06 YEARLY AS‐IS MASS PRODUCTION (TPY) 13,846 4,091 103,500 45,000 1,667 3,462 171,565 AS‐IS TONS/YR15.07 TS (TOTAL SOLIDS) (%) 32.5 27.5 25 25 67.5 32.5 26.23 TS %15.08 YEARLY DRY SOLIDS MASS (TPY) 4,500 1,125 25,875 11,250 1,125 1,125 45,000 DRY TONS/YR15.09 VS (VOLATILE SOLIDS) (% OF TS) 60 90 96 94 87.5 90 91.39 VS % OF TS15.10 YEARLY VS MASS (TPY) 2,700 1,013 24,840 10,575 984 1,013 41,124 VS TONS/YR15.11 VS CONVERSION‐TO‐BIOGAS EFFICIENCY (%) 60 75 85 85 80 70 82.62 VS % CONV15.12 MASS VS CONVERTED TO BIOGAS (TPY) 1,620 759 21,114 8,989 788 709 33,978 VS TONS CONV/YR15.13 MASS NOT CONVERTED TO BIOGAS (TPY) 2,880 366 4,761 2,261 338 416 11,022 SOLID DIG TONS/YR15.14 YEARLY MASS CONVERTED TO BIOGAS (%) 36.00 67.50 81.60 79.90 70.00 63.00 75.51 % TONS CONV/YR15.15 BIOGAS PRODUCTION/TON VS (SCF) (XERGI TABLE) 10,152.7 11,160.5 11,869.7 11,869.7 11,869.7 11,160.5 11,757.2 BIOGAS SCF/TON VS15.16 BIOGAS PRODUCTION/YEAR (SCF/YR) (VAR% METHANE) 16,447,329 8,474,985 250,616,170 106,693,478 9,347,364 7,909,986 399,489,311 BIOGAS SCF/YR15.17 BIOGAS PRODUCTION/DAY (SCF/DAY) (VAR% METHANE) 45,061 23,219 686,620 292,311 25,609 21,671 1,094,491 BIOGAS SCF/DAY15.18 BIOGAS PRODUCTION/HR (SCF/HR) (VAR% METHANE) 1,878 967 28,609 12,180 1,067 903 45,604 BIOGAS SCF/HR15.19 METHANE PRODUCTION/YEAR (SCF/YR) 8,223,664 4,237,492 125,308,085 53,346,739 4,673,682 3,954,993 199,744,656 METHANE SCF/YR15.20 ANNUAL MMBTU PRODUCTION @ STATED BTU/SCF 8,224 4,237 125,308 53,347 4,674 3,955 199,745 MMBTU/YR15.21 METHANE PRODUCTION/DAY (SCF/DAY) 22,531 11,610 343,310 146,155 12,805 10,836 547,246 METHANE SCF/DAY15.22 DAILY MMBTU PRODUCTION @ STATED BTU/SCF 22.5 11.6 343.3 146.2 12.8 10.8 547.2 MMBTU/DAY15.23 METHANE PRODUCTION/HR (SCF/HR) 938.8 483.7 14,304.6 6,089.8 533.5 451.5 22,801.9 METHANE SCF/HR15.24 HRLY MMBTU PRODUCTION @ STATED BTU/SCF 0.94 0.48 14.30 6.09 0.53 0.45 22.80 MMBTU/HR15 25
FEEDSTOCK PARAMETERS
15.2515.26 NCM/SHORT TON VS (FROM XERGI TABLE) 272 299 318 318 318 29915.27 NCM/SHORT TON VS CONV RATIO (FROM XERGI TABLE) 4.5 4.0 3.7 3.7 4.0 4.315.28 NCM TO SCF CONVERSTION RATE: 37.326 37.326 37.326 37.32615.29 AIR DISPER WIKIPEDIA WIKI ANSWERS15.30 NOTE 1: EVERYTHING IN THE TABLE ABOVE IS CALCULATED FROM DATA GENERATED ON THE "FEEDSTOCK DELIVERY" SHEET, EXCEPT USER ENTRIES15.31 CAN BE MADE IN THE BOLD‐BORDER CELLS CONTAINING RED TEXT.15.3215.33 NOTE 2: ALL PARAMETERS ARE FROM THE XERGI TABLE ON THE BOTTOM OF PAGE 3 OF THE 120207 EAW.15.3415.35 NOTE 3: Normal Cubic Meter(NCM)/SHORT TON = NCM/2000 Lbs 1.000 NCM @ 0 DEG C & 1 ATM = 37.326 SCF @ 60 DEG F & 1 ATM15.36 Normal Cubic Meter(NCM) IS AT 1 ATM AND 0 Deg C15.37 NATURAL GAS NCM IS AT 14.73 PSIA AND 60 Deg F15.38 Standard Cubic Meter (SCM) IS AT 1 ATM AND 60 Deg F15.39 1.000 NCM = 1.056 SCM = 37.31 SCF 00.00 Deg C = 32 Deg F = 273.15 K15.40 1 CM = 1000 L = 264.2 US GAL 15.00 Deg C = 59 Deg F = 288.15 K15.41 PV = nRT (Pa * cm = mol * 8.3145 cm‐Pa/mol‐K * K) 15.56 Deg C = 60 Deg F = 288.71 K15.42 1 ATM = 101.325 kPa = 14.73 PSIA = 760 TORR 20.00 Deg C = 68 Deg F = 293.15 K15.43 0.986 ATM = 100.0 kPa = 14.504 PSIA = 1 BAR 25.00 Deg C = 77 Deg F = 298.15 K15.44

FILE: AD_Plant_Model_REV_120304_1137_BRM_CASE_2.xls SHEET:FEEDSTOCK PARAMETERS 3/4/2012, 4:41 PM
15.4515.46 ENTITY Deg C kPa15.47 IUPAC, STP 0 100.00015.48 NIST, ISO 10780, FORMERLY IUPAC 0 101.32515.49 SPE 15 100.00015.50 ICAO'S ISA, ISO 13443, EEA, EGIA 15 101.32515.51 CAGI 20 100.00015.52 ISO 5011 20 101.30015.53 EPA, NIST 20 101.32515.54 SATP 25 100.00015.55 EPA 25 101.32515.56 ENTITY Deg F PSI15.57 US ARMY STANDARD METRO 59 14.50315.58 ISO 2314, ISO 3977‐2 59 14.69615.59 SPE, US OSHA, SCAQMD 60 14.69615.60 EGIA, OPEC, US EIA 60 14.73015.61 ENTITY Deg F in Hg15.62 FAA 59 29.9215.63 AMCA 70 29.9215.64
STANDARD REFERENCE CONDITIONS IN CURRENT USE

FILE: AD_Plant_Model_REV_120304_1137_BRM_CASE_2.xls SHEET: DIGESTER 3/4/2012, 4:42 PM
ITEM DESCRIPTION20 FLOW THROUGH THE DIGESTER
20.0120.02 NON‐SILAGE20.03 91,000 TON/YR WATER TO ADJUST FEEDSTOCK TS (%) TRUCK20.04 112,500 TON/YR FACILITY OUTPUT RECYCLED TO INPUT GAL/YR LOADS/YR GAL/LOAD20.05 35.3 GAL/TRUCK CLEANOUT EAW = 100K GAL/YR INTO SYSTEM 100,000 2,836 35.320.06 0 TON/YR OTHER20.07 75.51 % REDUCTION IN VOLUME OF SOLIDS THROUGH DIGESTER (% TONS CONV/YR, FROM 'FEEDSTOCK PARAMETERS' SHEET)20.08 30 DAYS IN DIGESTER FOR SOLIDS20.09 15 DAYS IN DIGESTER FOR LIQUIDS20.10 EAW = NO POLISHER DIGESTER MENTIONED20.11 9 LB/GAL FOR SOLIDS OF DIGESTATE20.12 8.05 HR/DAY TO RUN GENERATORS20.1320.14 DAILY TOTAL FEEDSTOCK INPUT TO DIGESTER20.15 27,397 GAL/DAY DRY BASIS (FROM 'FEEDSTOCK DELIVERY' SHEET)20.16 ~1.25 X EAW EST 83,555 GAL/DAY MOISTURE (FROM 'FEEDSTOCK DELIVERY' SHEET) EAW = 24 MMGAL/YR MOISTURE IN FEEDSTOCK INTO SYSTEM20.17 110,952 TOTAL GAL/DAY (FROM 'FEEDSTOCK DELIVERY' SHEET) = 65,753 GAL/DAY20.18 19.59 TRUCKLOADS/DAY (FROM 'FEEDSTOCK DELIVERY' SHEET) NOTE: DOES NOT INCLUDE MOISTURE TO REDUCE FEEDSTOCK TO20.19 12% SOLIDS (12% SOLIDS NOT STATED IN EAW)20.20 DAILY NON‐FEEDSTOCK INPUT TO DIGESTER20.21 60,076 GAL/DAY WATER TO ADJUST FEEDSTOCK TS (%) = (TON/YR WATER TO ADJUST TS * 2000 LB/TON / 8.3 LB/GAL) / 365 DAY/YR20.22 74,270 GAL/DAY FACILITY OUTPUT RECYCLED TO INPUT = (TON/YR FACILITY OUTPUT RECYCLED * 2000 LB/TON / 8.3 LB/GAL) / 365 DAY/YR20.23 274 GAL/DAY TRUCK CLEANOUT = GAL/TRUCK CLEANOUT * NON‐SILAGE TRUCKS/YR / 36520.24 0 GAL/DAY OTHER = (TON/YR OTHER * 2000 LB/TON / 8.3 LB/GAL) / 365 DAY/YR20.2520.26 DAILY TOTAL INPUT TO DIGESTER20.27 27,397 GALLONS OF SOLIDS ENTERING DIGESTER = GALLONS DRY BASIS/DAY (FROM ABOVE)20.28 218,175 GALLONS OF FLUIDS ENTERING DIGESTER ( = GAL/DAY IN FEEDSTOCK + GAL/DAY ADJUST FEEDSTOCK TS(20.29 + GAL/DAY FACILITY OUTPUT RECYCLED + GAL/DAY TRUCK CLEANOUT + GAL/DAY OTHER)20.3020.31 TOTAL VOLUME CONTAINED IN DIGESTER20.32 511,613 GALLONS OF SOLIDS = (GALLONS SOLIDS ENTERING * DAYS IN FERM) ‐ ((GALLONS SOLIDS ENTERING * (% RED / 100) * DAYS IN FERM) / 2)20.33 3,272,622 GALLONS OF FLUIDS = GALLONS FLUIDS ENTERING * DAYS IN FERM20.34 * 3,784,235 GALLONS TOTAL = GALLONS OF SOLIDS + GALLONS OF FLUIDS20.3520.36 DAILY TOTAL DISCHARGE FROM DIGESTER20.37 * 6,710 GAL/DAY SOLIDS = GAL/DAY SOLIDS ENTERING DIGESTER * (1‐(% RED / 100))20.38 * 30.20 TON/DAY SOLIDS = SOLIDS GAL/DAY * SOLIDS LB/GAL * TON/2000 LB20.39 * 218,175 GAL/DAY FLUIDS = GAL/DAY FLUIDS ENTERING DIGESTER20.40 * 905.43 TON/DAY FLUIDS = FLUIDS GAL/DAY * 8.3 LB/GAL * TON/2000 LB20.41 1,094,491 CUBIC FT/DAY OF BIOGAS (X% METHANE) (FROM 'FEEDSTOCK PARAMATERS' SHEET)20.42 547,246 CUBIC FT/DAY OF METHANE (FROM 'FEEDSTOCK PARAMATERS' SHEET)20.4320.44 HRLY TOTAL DISCHARGE FROM DIGESTER20.45 * 834 GAL/HR SOLIDS = GAL/DAY SOLIDS * (1 / (HRS/DAY TO RUN GEN)(FROM 'FACILITY OPERATION' SHEET))20.46 * 3.75 TON/HR SOLIDS = TON/DAY SOLIDS * (1 / (HRS/DAY TO RUN GEN)(FROM 'FACILITY OPERATION' SHEET))20.47 * 9,091 GAL/HR FLUIDS = GAL/DAY FLUIDS * DAY/24 HRS20.48 * 37.73 TON/HR FLUIDS = TON/DAY FLUIDS * DAY/24 HRS20.49 45,604 CUBIC FT/HR OF BIOGAS = BIOGAS PRODUCTION/HR (SCF/HR) (X% METHANE)(FROM 'FEEDSTOCK PARAMATERS' SHEET)20.50 22,802 CUBIC FT/HR OF METHANE = METHANE PRODUCTION/HR (SCF/HR) (FROM 'FEEDSTOCK PARAMATERS' SHEET)20.5120.52 EAW = LIQUID BY‐PRODUCT WILL HAVE A HIGH CONCENTRATION OF BIOLOGICALLY AVAILABLE NITROGEN AND PHOSPHOROUS20.53

FILE: AD_Plant_Model_REV_120304_1137_BRM_CASE_2.xls SHEET: GAS OUTPUT 3/4/2012, 4:43 PM
ITEM DESCRIPTION35 GAS OUTPUT FROM THE FACILITY
35.0135.02 GAS OUTPUT AVAILABLE FROM THE FACILITY:35.03 547,246 SCF/DAY METHANE AVAILABLE (FROM 'FEEDSTOCK PARAMATERS' SHEET)35.04 547,245,632 BTU/DAY AVAILABLE = MMBTU/HR (FROM 'FEEDSTOCK PARAMATERS' SHEET) * 1,000,00035.05 22,802 SCF/HR METHANE AVAILABLE (FROM 'FEEDSTOCK PARAMATERS' SHEET)35.06 22,801,901 BTU/HR AVAILABLE = MMBTU/HR (FROM 'FEEDSTOCK PARAMATERS' SHEET) * 1,000,00035.07 8.1 HR/DAY TO RUN GENERATORS (FROM 'FACILITY OPERATION' SHEET)35.0835.09 GAS OUTPUT CONVERTED TO ELECTRICITY:35.10 * 100 % OF AVAILABLE METHANE ALLOCATED TO DRIVE THE GENERATORS (FROM 'FACILITY OPERATION' SHEET)35.11 547,246 SCF/DAY METHANE INPUT TO INTERNAL COMBUSTION ENGINES OF GENERATORS35.12 547,245,632 BTU/DAY INPUT TO INTERNAL COMBUSTION ENGINES OF GENERATORS35.13 67,981 SCF/HR METHANE INPUT TO INTERNAL COMBUSTION ENGINES OF GENERATORS35.14 100 67,980,824 BTU/HR INPUT TO INTERNAL COMBUSTION ENGINES OF GENERATORS35.15 0.435 43.5 % EFFICIENCY OF INTERNAL COMBUSTION ENGINES EAW = CUMMINS C2000 ENGINES COMPLY WITH NEW SOURCE35.16 29,571,658 BTU/HR TRANSFERRED TO GENERATORS PERFORMANCE STANDARD (NSPS), 40 CFR, SUBPART JJJJ.35.17 0.92 92 % EFFICIENCY OF GENERATORS A CO CATALYST WILL BE USED TO CONTROL CO AND VOC'S35.18 40.02 27,205,926 BTU/HR CONVERTED TO ELECTRICITY35.19 * 7,966 KW‐HR PRODUCED PER HR @ 0.0002928 KW‐HR/BTU35.20 EAW = CONNECTION VIA DEDICATED 12.47 KV DISTRIBUTION CLASS CIRCUIT, 500 KCMIL, 15 KV CABLE35.21 64,125 KW‐HR PRODUCED PER DAY35.2235.23 HEAT BTU'S RECOVERED FROM ENGINE AND GENERATOR:35.24 40,774,898 BTU/HR CONVERTED TO HEAT BY ENGINES AND GENERATORS = BTU/HR TO ENGINES ‐ BTU/HR CONVERTED TO ELECTRICITY35.25 70 % RECOVERY OF BTU/HR THAT WAS CONVERTED TO HEAT35.26 28,542,429 BTU/HR HEAT RECOVERED FROM COOLING JACKETS AND EXHAUST STACKS35.2735.28 RECOVERED HEAT BTU'S USED TO DRY DIGESTATE:35.29 * 834 GAL/HR SOLIDS DISCHARGED (FROM 'DIGESTER' SHEET)35.30 3.75 TONS/HR SOLIDS DISCHARGED (FROM 'DIGESTER' SHEET) EAW = 1 TON/HR DRYING DURING TYPICAL OPERATIONS35.31 65 % DIGESTATE MOISTURE AFTER PRESSING FLUID OUT (FROM 'FACILITY OPERATION' SHEET)35.32 6.97 TONS/HR FLUIDS IN PRESSED DIGESTATE = (SOLIDS TONS/HR DISCHARGED * % MOISTURE/100)/(1 ‐ % MOISTURE/100)35.33 10 % DIGESTATE MOISTURE AFTER PRESSING FLUID OUT (FROM 'FACILITY OPERATION' SHEET)35.34 0.42 TONS/HR FLUIDS IN DRIED DIGESTATE = (SOLIDS TONS/HR DISCHARGED * % MOISTURE/100)/(1 ‐ % MOISTURE/100)35.35 6.55 TONS/HR FLUIDS TO BE REMOVED FROM DIGESTATE = TONS/HR FLUIDS IN PRESSED DIG ‐ TONS/HR FLUID IN DRIED DIG35.36 * 1,578 GAL/HR FLUIDS TO BE REMOVED FROM DIGESTATE = TONS/HR FLUIDS TO BE REMOVED * 2000LB/TON * GAL/8.3LB35.37 930 BTU/GAL TO RAISE FLUID TEMP FROM 100 DEG F TO 212 DEG F = 1 BTU/LB * 8.3 LB/GAL * 11235.38 9,346 BTU/GAL TO EVAPORATE FLUID35.39 504 BTU/GAL TO RAISE SOLIDS TEMP FROM 100 DEG F TO 212 DEG F = 0.5 BTU/LB * STATED LB/GAL * 11235.40 70 % THERMAL EFFICIENCY OF EVAPORATOR35.41 * 23,767,188 BTU/HR HEAT TO DRY DIGESTATE = (FLUID GAL/HR * (BTU/GAL TO RAISE FLUID TEMP + BTU/GAL TO EVAP) / % EFFICIENCY/100)35.42 + ((SOLIDS GAL/HR * BTU/GAL TO RAISE SOLIDS TEMP) / % EFFICIENCY/100)35.4335.44 RECOVERED HEAT BTU'S USED TO WARM INCOMING FEEDSTOCK:35.45 3,403 GAL/HR SOLIDS INPUT TO DIGESTER = GAL/DAY SOLIDS (FROM 'FEEDSTOCK DELIVERY' SHEET) /35.46 HRS/DAY TO RUN GEN(FROM 'FACILITY OPERATION' SHEET)35.47 10,380 GAL/HR FLUIDS INPUT TO DIGESTER = GAL/DAY SOLIDS (FROM 'FEEDSTOCK DELIVERY' SHEET) /35.48 HRS/DAY TO RUN GEN(FROM 'FACILITY OPERATION' SHEET)35.49 50 DEG F OF INCOMING FEEDSTOCK35.50 122 DEG F DIGESTER INPUT EAW = THERMOPHYLIC TEMP OF APPROX 50 DEG C = 122 DEG F35.51 597.6 BTU/GAL TO RAISE TEMP OF FLUIDS = 1 BTU/LB * 8.3 LB/GAL * (DIGESTER INPUT TEMP ‐ INCOMING FEEDSTOCK TEMP)35.52 324 BTU/GAL TO RAISE TEMP OF SOLIDS = 0.5 BTU/LB * STATED LB/GAL * (DIGESTER INPUT TEMP ‐ INCOMING FEEDSTOCK TEMP)35.53 70 % THERMAL EFFICIENCY OF HEAT TRANSFER35.54 * 10,436,435 BTU/HR HEAT TO WARM FEEDSTOCK = (FLUID GAL/HR * (BTU/GAL TO RAISE FLUID TEMP / % EFFICIENCY/100))35.55 + ((SOLIDS GAL/HR * BTU/GAL TO RAISE SOLIDS TEMP) / % EFFICIENCY/100)35.5635.57 RECOVERED HEAT BTU'S AVAILABLE FOR OTHER USES:35.58 * ‐5,661,195 BTU/HR AVAILABLE AFTER DRYING DIGESTATE AND WARMING FEEDSTOCK = 35.59 BTU/HR RECOVERED ‐ BTU/HR TO DRY DIGESTATE ‐ BTU/HR TO WARM INCOMING FEEDSTOCK35.60

FILE: AD_Plant_Model_REV_120304_1137_BRM_CASE_2.xls SHEET: FLUID OUTPUT 3/4/2012, 4:44 PM
ITEM DESCRIPTION30 WATER OUTPUT FROM THE FACILITY
30.0130.02 FLUIDS DISCHARGED FROM DIGESTER30.03 218,175 GAL/DAY FLUIDS, INCLUDING FLUIDS IN DIGESTATE (FROM 'DIGESTER' SHEET)30.04 13,513 GAL/DAY FLUIDS IN PRESSED DIGESTATE (FROM 'DIGESTATE REMOVAL' SHEET)30.05 204,662 GAL/DAY FLUIDS FACILITY OUTPUT = GAL/DAY FLUIDS INCL IN DIGESTATE ‐ GAL/DAY FLUIDS IN DIGESTATE30.0630.07 FLUIDS RECYCLED BACK TO FACILITY:30.08 * 112,500 TON/YR FACILITY OUTPUT RECYCLED TO INPUT30.09 * 74,270 GAL/DAY FACILITY OUTPUT RECYCLED TO INPUT = (TONS/YR * 2000 LB/TON / 8.3 LB/GAL) / 365 DAY/YR30.1030.11 FLUIDS DISCHARGED FROM THE FACILITY TO HOLDING PONDS:30.12 * 130,392 GAL/DAY FLUIDS DISCHARGED = GAL/DAY FLUIDS FACILITY OUTPUT ‐ GAL/DAY FACILITY OUTPUT RECYCLED TO INPUT30.13 47,593,141 GAL/YR FLUIDS DISCHARGED30.14 EAW = 55,000 GAL/DAY FROM THE PROCESS => 20,075,000 = GAL/YR30.15 EAW = 23 MMGAL/YR LIQUID BY‐PRODUCT TO HOLDING PONDS30.16 17,431 CUBIC FT/DAY FLUIDS DISCHARGED = GAL/DAY DISCHARGED * 0.13368 CUBIC FT/GAL30.17 6,362,251 CUBIC FT/YR FLUIDS DISCHARGED30.1830.19 FLUIDS FROM CONTACT STORMWATER AND SILAGE LEACHATE CHANNELED TO HOLDING PONDS:30.20 * 8,000 EAW = 8,000 GAL/DAY FROM CONTACT STORMWATER => 2,920,000 = GAL/YR30.21 EAW = 1.9 MMGAL/YR CONTACT STORMWATER AND SILAGE LEACHATE INTO SYSTEM30.22 2,920,000 GAL/YR FLUIDS CHANNELED30.23 1,069 CUBIC FT/DAY FLUIDS CHANNELED = GAL/DAY CHANNELED * 0.13368 CUBIC FT/GAL30.24 390,346 CUBIC FT/YR FLUIDS CHANNELED30.2530.26 TOTAL FLUIDS ENTERING HOLDING PONDS:30.27 138,392 TOTAL GAL/DAY FLUIDS ENTERING HOLDING PONDS = DISCHARGED GAL/DAY + CHANNELED GAL/DAY30.28 * 50,513,141 TOTAL GAL/YR FLUIDS ENTERING HOLDING PONDS30.29 18,500 TOTAL CUBIC FT/DAY FLUIDS ENTERING HOLDING PONDS = DISCHARGED CUBIC FT/DAY + CHANNELED CUBIC FT/DAY30.30 6,752,597 TOTAL CUBIC FT/YR ENTERING HOLDING PONDS30.3130.32 LEVEL CHANGE IN HOLDING PONDS:30.33 5 ACRES OF HOLDING PONDS EAW = 5.0 ACRES SPLIT BETWEEN 2 PONDS WITH CAPACITY OF 23M GALLONS30.34 43,560 = SQ FT/ACRE30.35 217,800 SQ FT OF HOLDING PONDS = ACRES OF HOLDING PONDS * SQ FT/ACRE30.36 0.08494 FT/DAY LEVEL CHANGE = TOTAL CUBIC FT/DAY ENTERING HOLDING PONDS / SQ FT OF HOLDING PONDS30.37 31.00 FT/YR LEVEL CHANGE = FT/DAY LEVEL CHANGE * 36530.3830.39 APPLICATION RATE ON FIELDS:30.40 4,300 ACRES OF APPLICATION FIELDS EAW = 4,300 ACRES OF CORN TO APPLY ENTIRE ANNUAL PRODUCTION30.41 11,747 GAL/YR/ACRE APPLICATION = TOTAL GAL/YR ENTERING HOLDING PONDS / ACRES OF APPLICATION FIELDS30.42 0.270 GAL/YR/SQ FT APPLICATION = GAL/YR/ACRE APPLICATION / SQ FT/ACRE30.43

FILE: AD_Plant_Model_REV_120304_1137_BRM_CASE_2.xls SHEET: FLUID REMOVAL 3/4/2012, 4:44 PM
ITEM DESCRIPTION31 REMOVAL OF FLUIDS FROM THE HOLDING PONDS
31.0131.02 APPLICATION LOADS NEEDED TO REMOVE FLUIDS FROM HOLDING PONDS AND APPLY THEM TO FIELDS31.03 50,513,141 TOTAL GAL/YR FLUIDS ENTERING HOLDING PONDS (FROM 'FLUID OUTPUT' SHEET)31.04 210,387.2 TOTAL TON/YR = TOTAL GAL/YR * 8.33 LB/GAL / 2000 LB/TON31.05 ? 12.0 TONS/APPLICATION LOAD31.06 17,532.3 APPLICATION LOADS/YR = TOTAL TON/YR / TONS/APPLICATION31.07 48.0 AVERAGE APPLICATION LOADS/DAY = APPLICATION LOADS/YR / 36531.0831.09 ? 60.0 NUMBER OF DAYS/YR IN WHICH TO ACCOMPLISH APPLICATION LOADS31.10 292.2 CONCENTRATED APPLICATION LOADS/DAY = APPLICATION LOADS/YR / APPLICATION DAYS/YR31.11 ? 24.0 NUMBER OF HRS/DAY IN WHICH TO ACCOMPLISH APPLICATION LOADS31.12 12.2 CONCENTRATED APPLICATION LOADS/HR = APPLICATION LOADS/DAY / APPLICATION HRS/DAY31.1331.14 FROM 'FEEDSTOCK DELIVERY' SHEET AVERAGE DAILY FLUIDS APPLICATION‐ CALCULATED DATA:31.15 4.10 DIESEL FUEL $/GAL 576.40 AVE APPL TON/DAY = TOTAL TON/YR / 36531.16 6.00 TRUCKING DIESEL FUEL MILE/GAL 48.03 AVE APPL LOADS/DAY = AVE APPL TON/DAY / TON/LOAD31.17 0.60 TRUCKING LABOR $/MILE 240.2 AVE APPL MILES/DAY = AVE MILES TO FIELD * 2 * AVE APPL LOADS/DAY31.18 0.50 TRUCKING OTHER $/MILE (MAINTENANCE, ETC.) 40.0 AVE APPL GAL/DAY = AVE APPL MILE/DAY / MILE/GAL31.19 164.11 AVE APPL DIESEL $/DAY = AVE APPL GAL/DAY * DIESEL $/GAL31.20 2.50 AVE MILES FROM AD FACILITY TO FIELDS 144.10 AVE APPL LABOR $/DAY = AVE APPL MILES/DAY * TRUCKING LABOR $/MILE31.21 120.08 AVE APPL OTHER $/DAY = AVE APPL MILES/DAY * TRUCKING OTHER $/MILE31.2231.23 CONCENTRATED DAILY FLUIDS APPLICATION‐ CALCULATED DATA:31.24 3,506.45 CONC APPL TON/DAY = TOTAL TON/YR / CONC DAY/YR31.25 292.20 CONC APPL LOADS/DAY = CONC APPL TON/DAY / TON/LOAD31.26 1,461.0 CONC APPL MILES/DAY = AVE MILES TO FIELD * 2 * CONC APPL LOADS/DAY31.27 243.5 CONC APPL GAL/DAY = CONC APPL MILE/DAY / MILE/GAL31.28 998.37 CONC APPL DIESEL $/DAY = CONC APPL GAL/DAY * DIESEL $/GAL31.29 876.61 CONC APPL LABOR $/DAY = CONC APPL MILES/DAY * TRUCKING LABOR $/MILE31.30 730.51 CONC APPL OTHER $/DAY = CONC APPL MILES/DAY * TRUCKING OTHER $/MILE31.3131.32 YEARLY FLUIDS APPLICATION‐ CALCULATED DATA:31.33 210,387.23 APPL TON/YR = TOTAL TON/YR31.34 17,532.27 APPL LOADS/YR = APPL LOAD/YR31.35 87,661.3 APPL MILES/YR = AVE MILES TO FIELD * 2 * APPL LOAD/YR31.36 14,610.2 APPL GAL/YR = APPL MILE/YR / MILE/GAL31.37 59,901.92 APPL DIESEL $/YR = APPL GAL/YR * DIESEL $/GAL31.38 52,596.81 APPL LABOR $/YR = APPL MILES/YR * TRUCKING LABOR $/MILE31.39 43,830.67 APPL OTHER $/YR = APPL MILES/YR * TRUCKING OTHER $/MILE31.40

FILE: AD_Plant_Model_REV_120304_1137_BRM_CASE_2.xls SHEET:DIGESTATE REMOVAL 3/4/2012, 4:45 PM
ITEM DESCRIPTION25 DIGESTATE REMOVAL
25.0125.02 DAILY SOLIDS DISCHARGED FROM DIGESTER25.03 30.20 TON/DAY SOLIDS (FROM 'DIGESTER' SHEET)25.04 8.1 HR/DAY TO RUN GENERATORS (FROM 'FACILITY OPERATION' SHEET)25.0525.06 DAILY FLUIDS CONTAINED IN DIGESTATE AFTER PRESSING:25.07 65 % DIGESTATE MOISTURE AFTER PRESSING FLUID OUT (FROM 'FACILITY OPERATION' SHEET)25.08 56.08 TON/DAY FLUIDS IN PRESSED DIGESTATE = (SOLIDS TON/DAY DISCHARGED * % MOISTURE/100)/(1 ‐ (% MOISTURE/100))25.09 13,513 GAL/DAY FLUIDS IN PRESSED DIGESTATE = TON/DAY FLUIDS IN PRESSED DIGESTATE * 2000LB/TON * GAL/8.3LB25.1025.11 DAILY FLUIDS CONTAINED IN DIGESTATE AFTER DRYING:25.12 10 % DIGESTATE MOISTURE AFTER DRYING (FROM 'FACILITY OPERATION' SHEET)25.13 3.36 # TON/DAY FLUIDS IN DRIED DIGESTATE = (SOLIDS TON/DAY DISCHARGED * % MOISTURE/100)/(1 ‐ (% MOISTURE/100))25.14 808 GAL/DAY FLUIDS IN DRIED DIGESTATE = TON/DAY FLUIDS IN DRIED DIGESTATE * 2000LB/TON * GAL/8.3LB25.1525.16 DAILY FLUIDS EVAPORATED FROM DIGESTATE DURING DRYING:25.17 12,704 GAL/DAY EVAPORATED = GAL/DAY IN PRESSED DIGESTATE ‐ GAL/DAY IN DRIED DIGESTATE25.18 4,637,134 = CALC'D GAL/YR EAW = 3 MMGAL/YR IN DIGESTATE TO EVAPORATION25.1925.20 DAILY DIGESTATE DISCHARGED FROM THE FACILITY:25.21 * 33.55 TON/DAY DIGESTATE = SOLIDS TON/DAY + FLUIDS TONS/DAY25.22 EAW = 16 TON/DAY25.23 YEARLY DIGESTATE DISCHARGED FROM THE FACILITY:25.24 12,246 TON/YEAR DIGESTATE = DIGESTATE TON/DAY * 36525.2525.26 FROM 'FEEDSTOCK DELIVERY' SHEET TOTAL DIGESTATE TO ALL DESTINATIONS‐ CALCULATED DATA:25.27 4.10 DIESEL FUEL $/GAL * 33.55 TON/DAY25.28 6.00 TRUCKING DIESEL FUEL MILE/GAL 1.40 TRUCKLOADS/DAY25.29 0.60 TRUCKING LABOR $/MILE 209.7 TRUCKING MILES/DAY25.30 0.50 TRUCKING OTHER $/MILE (MAINTENANCE, ETC.) 34.9 TRUCKING GAL/DAY25.31 143.29 TRUCKING DIESEL $/DAY25.32 125.82 TRUCKING LABOR $/DAY25.33 104.85 TRUCKING OTHER $/DAY25.3425.35 100 % DIGESTATE ACCOUNTED FOR BELOW25.36 * 50 % TO DIGESTATE DESTINATION 1 DIGESTATE DESTINATION 1‐ CALCULATED DATA:25.37 24 TON/TRUCK LOAD 16.78 TON/DAY = TOTAL TON/DAY * (% / 100)25.38 50 MILES FROM FACILITY TO DESTINATION 0.70 TRUCKLOADS/DAY = TON/DAY / TON/TRUCK LOAD25.39 69.9 TRUCKING MILES/DAY = MILES TO DESTINATION * 2 * TRUCKLOADS/DAY25.40 11.6 TRUCKING GAL/DAY = TRUCKING MILE/DAY / MILE/GAL25.41 47.76 TRUCKING DIESEL $/DAY = TRUCKING GAL/DAY * DIESEL $/GAL25.42 41.94 TRUCKING LABOR $/DAY = TRUCKING MILES/DAY * TRUCKING LABOR $/MILE25.43 34.95 TRUCKING OTHER $/DAY = TRUCKING MILES/DAY * TRUCKING OTHER $/MILE25.4425.45 * 50 % TO DIGESTATE DESTINATION 2 DIGESTATE DESTINATION 2‐ CALCULATED DATA:25.46 24 TON/TRUCK LOAD 16.78 TON/DAY = TOTAL TON/DAY * (% / 100)25.47 100 MILES FROM FACILITY TO DESTINATION 0.70 TRUCKLOADS/DAY = TON/DAY / TON/TRUCK LOAD25.48 139.8 TRUCKING MILES/DAY = MILES TO DESTINATION * 2 * TRUCKLOADS/DAY25.49 23.3 TRUCKING GAL/DAY = TRUCKING MILE/DAY / MILE/GAL25.50 95.53 TRUCKING DIESEL $/DAY = TRUCKING GAL/DAY * DIESEL $/GAL25.51 83.88 TRUCKING LABOR $/DAY = TRUCKING MILES/DAY * TRUCKING LABOR $/MILE25.52 69.90 TRUCKING OTHER $/DAY = TRUCKING MILES/DAY * TRUCKING OTHER $/MILE25.53

31840 356th Street ● Le Sueur, MN 56058 [email protected]
February 27, 2012 William Lynott Sent via email: [email protected] Minnesota Pollution Control Agency 520 Lafayette Road North St Paul, MN 55155 RE: Comments on the Environmental Assessment Worksheet prepared for the Hometown BioEnergy Facility, Avant
Energy, agent for Minnesota Municipal Power Agency, Le Sueur, Minnesota Mr. Lynott, Thank you for the opportunity to review and comment on the Environmental Assessment Worksheet (EAW) prepared for the Hometown BioEnergy Facility proposed by Avant Energy on behalf of the Minnesota Municipal Power Agency in Ottawa Township, Le Sueur County, Minnesota. Overall, the MPCA did well to explain the project and to identify potentially significant issues relevant to the proposed project. Please consider the information attached regarding the accuracy and completeness of the material contained in the EAW which details my questions, comments, and concerns regarding the project as described in the EAW made available on February 6th, 2012. The proposed project does not comply with specific local, state and federal regulations and has the potential for significant environmental impacts. The term ‘environment’ means, “physical conditions existing in the area that may be affected by a proposed project,” including, “land, air, water, minerals, flora, fauna, ambient noise, energy resources, and artifacts or natural features of historic, geologic, or aesthetic significance,” per MN Rules 4410.0200, Subp 23. Although an EAW cannot technically approve or deny projects, it is obvious through this environmental review that all permit applications currently in MPCA review should be denied at this time. Further, since there is potential for significant environmental impacts, a positive declaration on the need for an EIS should be the outcome of this EAW. Additionally, since important information necessary to make a reasoned decision about the potential for, or significance of, one or more possible environmental impacts is also lacking, the current EAW should be amended and a new scoping EAW and draft scoping decision document for the EIS be developed to include all important information necessary to make a reasoned decision about possible environmental impacts that are not currently presented in the EAW. The Order for an EIS should include, but not be limited to, further analysis of the following scope items: traffic, soil and groundwater contamination, well interferences, odor, ambient noise, land use compatibility, and cumulative impacts. One of the alternatives in the EIS should include other renewable electricity sources that the MMPA can enlist as an alternative to the proposed project in order to meet statutory requirements (MN Statute § 216B.1691). Thank you for the opportunity to review this proposed project. If you have any questions concerning these comments, please contact me by USPS or email. Also, please accept this letter as a formal request to receive a written response to comments and a copy of the record of findings prepared under subpt 4, MN Rules 4410.1700.
Sincerely,
Jamie Swenson Ottawa township resident Enclosures cc: City of Le Sueur City Council & Planning Commission, Ottawa Township, Le Sueur County Environmental
Services, Le Sueur Municipal Airport Board, Federal Aviation Administration, MNDOT Office of Aeronautics
3

Page 1 of 18
DETAILED QUESTIONS, COMMENTS AND CONCERNS BY ITEM AND TOPIC The Site Plan for the project included as Attachment 4 does not meet MN Rules 4410 for EAW requirements and is insufficient for determining significant environmental impacts. Utilizing the data provided in the EAW, included is a detailed site plan as Figure 1 in order to understand the compatibility of the project to the area. Further, Attachment 5 does not provide horizontal or vertical scales in order to completely understand the cross section elevation of the site and is therefore misleading. Please include an update to this plan, showing an accurate rendering of the site with scales, in order to understand the project in context to the Le Sueur Municipal Airport, significant environmental impacts and local, state, and federal regulations. Item 6 (c) Project Purpose. This item says the project will contribute to Minnesota Municipal Power Agency’s (MMPA’s) compliance with Minnesota’s renewable portfolio standard (page 7). In order to accurately determine the project purpose, please provide the type and percent of renewable electricity MMPA already has eligible towards this standard and how this project specifically fits into that percentage. Also in this section, information on the project proposer as a governmental or semi/governmental unit should be clearly stated. Avant Energy is listed as the proposer for this project on behalf of the MMPA. The Le Sueur Municipal Utility Commission is a member of the MMPA, which encompasses the city of Le Sueur, the majority of Ottawa township, and portions of Tyrone township including all electrical users within this service area. Every citizen within this service area, as well as every citizen within the partner service providers, should be listed under this section as ‘beneficiaries’ of this project. Item 7. Project Magnitude Data This section includes a building height of 40.3 feet but should also include structure heights of all tanks and stacks in order to accurately understand the project magnitude, including the following (this information was pulled from various parts of the EAW): Table 1. Structure Heights
Description Height Size Ground Elevation Anticipated (ft mean sea level)
Height Elevation (based on ground elevation anticipated) (ft mean sea level)
Within Airport Safety Zone A Silage Bunker #1 20 ft 5 ac proposed 840, currently
830 proposed 860**
likely 870 Silage Bunker #2 unknown, assumed 20 ft 0.6 ac 852 872 Planted trees on west & north borders average 60 ft mature height various various, ave 850 various, ave 910 Within Airport Safety Zone B Liquid Industrial Waste Pits/Lagoons (Fertilizer) unknown, assumed 3 ft 5.2 ac,
23 mill gal 852 855
Within Airport Safety Zone C directly adjacent to Safety Zone A (approximately 20-100 linear ft from Zone A) Digester Tank #1 75 ft 67.2’ dia 857 932 Digester Tank #2 75 ft 67.2’ dia 857 932 Digester Tank #3 75 ft 67.2’ dia 857 932 Drier Stack* 54 ft 3’ dia 857 911 Generator Stack* 50 ft 3’ dia 857 907 Bio Filter 20 ft unknown 857 877 Liquid Biomass Tank unknown unknown 857 unknown H2S Scrubber #1 25 ft 15’ x 15’ 857 882 H2S Scrubber #2 25 ft 15’ x 15’ 857 882 Generation & Solid Fuel Building 40 ft unknown 857 897 Receiving Building 40 ft unknown 857 897 Biogas Tank #1 65 ft 87.2’ dia 857 922 Biogas Tank #2 65 ft 87.2’ dia 857 922 Biogas Tank #3 65 ft 87.2’ dia 857 922 Radiators unknown unknown 857 unknown Plum from stacks 200 ft from facility (minimum) 200 ft dia 857 1107 - 1111 Gas Flare unknown, 10 ft unknown 850 860 * Depending on the stack height requirements for air emissions, the stack height (along with a potential warning beacon) may be
required to be taller than the highest structure at the site, which is currently 75 feet. ** In order to facilitate site stormwater drainage, the ground elevation at the silage bunk structure #1 will have to be raised at
least 20 feet from existing elevations (830 ft above msl) (10 feet from the proposed 840 ft above msl), which means that the silage bunk structure height elevation would be at least 870 ft above msl, resulting in a violation of the land use requirements of Safety Zone A, and most likely a violation of the height requirement of Safety Zone A.

Page 2 of 18
What lighting will be required for these structure heights and how will it affect surrounding areas? What is the anticipated height of temporary construction structures, such as cranes or drilling derricks? Where will the onsite flare mentioned in the EAW (page 6) for burning off excess biogas be located? Please indicate the location and height of overhead transmission lines required as part of this project as well. Please indicate the total structure height in whole feet, including anything mounted on top of the structure – antennas, obstruction lights, lightning rods, and the overall wall height in elevation. Similarly to waste requirements for feedlots, the total project acres required for waste application should be included here in order to fully understand the project magnitude. Item 8. Permits and approvals required The following permits are not listed but are assumed to be required for the project:
• City of Le Sueur/ Le Sueur County (depending on annexation)– Conditional Use Permit, Airport Safety Variance • FAA – Notice of Proposed Construction or Alteration Form, Aeronautical Study, Wildlife Hazard Assessment • MPCA – Solid Waste Permit, AST, UST, vessel permits, other permits depending on actual waste application sites • Le Sueur County – WCA Permits, Septic Permits • MDH via Le Sueur County – Well Permit(s) • State of Minnesota – Plumbing Inspection, Electrical Inspection • DNR – water appropriations permit • MDH – Health Risk Assessment, Air Emissions Risk Analysis • RCRA Hazardous Waste Permit
Please also include all approvals and financial assistance for the project as required, specifically any direct and indirect forms of public financial assistance, such as grants as required. Item 9. Land Use & Item 27. Compatibility with Plans and Land Use Regulations Please include location information for liquid waste land application sites, similar to the EAW requirements for land application of wastes associated with similar projects (ie. feedlots). In order to determine the significant environmental effects of this project, the specific land application sites need to be included in the EIS. According to information in the EAW, this should include at least 8,600 acres. Further, similar to other EAW requirements, please provide contracts for reliable sources of feedstock as well as waste land application contracts. Also, please include data identifying the nutrient content of the waste for land application. Please include transportation routes to be utilized for bringing material into the site and hauling material off the site as industrial solid waste and liquid waste for land application. This should be addressed throughout the document. Additionally, please include information of adjacent lands to waste application sites and give the distances and directions to nearby residences, schools, daycare facilities, senior citizen housing, places of worship, and other places accessible to the public (including haul roads) within one-mile of the site and within or adjacent to the haul routes and boundaries of all waste application sites. This is a requirement for other EAWs prepared for similar projects for waste application sites. This should be addressed throughout the document. Please describe the reasoning for the statement on page 9 that states, “The proposed project is compatible with the surrounding land uses, which include gravel mining, agriculture, and the airport.” Actually, this proposed project would be an island of industrial land use surrounded by permitted and conditional agricultural uses. What part of this industrial project is compatible with gravel mining? What part of this industrial project is compatible with residential? What part of this industrial project is compatible with agriculture? What part of this industrial project is compatible with the airport? How do you define compatible? In fact, this project is very clearly not compatible with surrounding land uses, Le Sueur County Land Use Goals, the Le Sueur County Zoning Ordinance, the City of Le Sueur Comprehensive Plan, the City of Le Sueur Zoning Ordinance, nor the Le Sueur Municipal Airport Zoning Ordinance. Instead, this project is actually in conflict with surrounding land uses and the project is not suitable for long-term agricultural or mineral extraction uses, which are priorities in Le Sueur County. This needs to be clearly stated and more information provided in an EIS. Further, the EAW also incorrectly states that the project is not subject to any local comprehensive plan, land use plan or regulation, or other applicable land use, water, or resource management plan of a local, regional state or federal agency (page 27). Please review the city of Le Sueur comprehensive plan and zoning ordinance, as well as Le Sueur County land use goals and zoning ordinance and list applicable regulations to this property and project, specifically regarding the safety, health, and welfare of citizens and the protection of the environment.

Page 3 of 18
Agricultural and Aggregate Use The entire EAW incorrectly refers to the current land use of the site as an abandoned gravel pit. The site is actually an active sand and gravel pit allowed as a Conditional Use in an Agricultural District through Le Sueur County and includes both stockpiles, stormwater impoundments and idle, unreclaimed areas within the proposed project footprint. This site is required to be reclaimed through the current Le Sueur County CUP and bonding requirements. Further, this area is within the draft Le Sueur County Mineral Extraction Overlay District because of its non-renewable sand and gravel resources which is a priority for Le Sueur County and the State of Minnesota. The MN DNR lists this site as having 20-50+ feet deep of good textured sand and gravel on the west (currently mined 20 feet) and 25-75+ feet deep of very good, highly desirable sand and gravel deposits (currently mined 30 feet) according to mineral maps. Based on this information, it appears this site has not been exhausted of all marketable sand and gravel, and therefore the claim that this site is “exhausted” or abandoned” is incorrect and should not be utilized as a reason for making the project more feasible for this site. In addition, the loss of this non-renewable resource resulting from this project should also be considered during permit review since the availability of this material is easily accessible at this site. Please update the information to accurately consider this use. Residential Use It should also be clearly stated that the nearest residential homestead is approximately 400 ft from the project boundary. Also, there are three (3) nearby residences that should be considered (not just one) with the closest residential homesteads are approximately 925 ft (not 1,000 ft as stated on page 9) from the proposed silage bunks, approximately 1,000 ft (not 1,200 ft) from the covered liquid byproduct storage pond, and approximately 1,200 ft (not 2,000 feet) from the main facility processing area. Separation distance should also be required for all building permits obtained prior to this project for residential structures in the City of Le Sueur and Le Sueur County within 1,000 feet of the project even though the structure hasn’t started construction. Per the State Disposal System (SDS) Permit (Permit Authorization to Land Apply Wastes Generated from Food and Beverage Processing Facilities) required for this project, the minimum separation distance for permanent silage storage structures and structures of industrial by-products is 1,000 feet from residences, residential development, public contact sites, and down-gradient surface waters and wetlands. Further, MN Rules 7035.1600 prohibits industrial solid waste fill areas “within 1,000 feet of the nearest edge of the right-of-way of any state, federal or interstate highway,” “locations considered hazardous because of the proximity of airports” and areas “which is unsuitable because of topography, geology, hydrology, or soils”. Based on site conditions, including the surrounding State Highway, residences, onsite down-gradient surface waters (including both the existing 1.6 acre and 0.3 acre impoundments), as well as the proximity of the airport, this project is completely incompatible with surrounding land uses and local, state, and federal land use regulations. Le Sueur Municipal Airport Saying there is incorrect information provided in the EAW regarding this project and the Le Sueur Municipal Airport is a substantial understatement. It is assumed to occur since airport regulations are largely unknown situations because they are not a common occurrence and not because the project is known to be in direct violation of local, state, and federal rules regulating off-site airport land uses and airspace (which would immediately stop this project). The EAW incorrectly states the height and location of the facility will not affect the Le Sueur Municipal Airport (incorrectly identified in the EAW as the “Le Sueur County Airport”). Also as stated in the EAW, please define how the proposer came to the conclusion that, “the facility will also meet airport safety zoning requirements.” Actually, this proposed project does not meet airport safety zoning requirements and the project is not eligible to receive a “determination of no hazard” from the FAA as stated in the EAW (page 27). In order to accurately review the project, the following information (not detailed in the EAW) is important for agencies to gain an understanding of the proposed project: The Le Sueur Municipal Airport elevation is 868 ft above mean sea level (msl). The runway elevations are 838.2 for Runway 13 and 867.4 for Runway 31. The airport is publicly owned by the City of Le Sueur and averages 49 aircrafts per week. Approximately 59% of these aircrafts are local general aviation, with 39% transient general aviation. The remaining 2% is military aviation.1 To my knowledge, there has been one fatal airplane crash in association with this airport in the 1970s/1980s, and actually, the crash tragically occurred at the proposed project site. This is a very serious issue that is not to be taken lightly. There are many entities involved in implementing actions directly involving land use compatibility around airports include the FAA, state and local governments, and the community at-large. It should be made clear to local and state governments that the FAA has no regulatory authority for controlling land uses to protect airport capacities. The FAA recognizes that state and local
1 Source: http://www.aopa.org/airports/12Y

Page 4 of 18
governments are the ones responsible for land use planning, zoning, and regulation including actions necessary to provide land use compatibility with airport operations. Further, approving any permits for this proposed project which is in direct conflict with aviation activity and airport facilities results in undue constraints being placed on the airport. In order to enable this sector of the economy to continue to be in compliance with federal regulations, to continue to expand, to continue to provide a wide variety of job opportunities for local citizens, and to meet the needs of the traveling public, it is of vital importance that this airport operate in an environment that maximizes the compatibility of the airport with off-airport development. The City of Le Sueur and Le Sueur County is responsible for this local land use zoning and control. In accordance with the US Department of Transportation (US DOT), Federal Aviation Administration (FAA), there are very specific procedures to promote air safety and efficient use of the navigable airspace, and to handle airspace matters in order to promote and protect the health, safety, morals and general welfare throughout Le Sueur County in order to protect the safety of the flying public and people and property on the ground near the Le Sueur Municipal Airport (a Public/Public-Use Airport). According to FAA definitions, this project is proposing putrescible-waste disposal operations within the navigable airspace. Has an FAA aeronautical study been conducted? Has a Notice of Proposed Construction or Alteration (Form 7460-1) been filed with the FAA? Please provide detailed information regarding the proposed elevations, proposed structure heights, and the tallest elevations relating to each applicable airspace infringement. Clearly define what structures are directly within the Horizontal Zone of the Air Space Obstruction Zoning, the Conical Zone of the Air Space Obstruction Zoning, and the Approach Zone of the Air Space Obstruction Zoning. This project proposes structures and uses that exceed obstruction standards and would be a hazard to air navigation. Further, these operations are known to attract large numbers of hazardous wildlife, particularly birds. Because of this, these operations, when located within the vicinity of an airport, are considered an airport hazard and incompatible with safe airport operations. ‘Airport hazard’ is defined in the ordinance as, “any structure, tree, or use of land which obstructs the air space required for, or is otherwise hazardous to, the flight of aircraft in landing or taking off at the airport; and any use of land which is hazardous to persons or property because of its proximity to the airport.” A ‘structure’ is defined in the ordinance as “an object constructed or installed by man, including, but without limitations, buildings, towers, smokestacks, earth formations, and overhead transmission lines.” Based on these definitions, the silage bunks are considered structures. Further, the Le Sueur County Assessor’s office also considers them as structures with a value of $0.75 per square foot on similar silage bunk structures within the county. Safety Zone A: Although some of these structures meet height restrictions in applicable zones since they are at a lower elevation and do not project above the imaginary air space surfaces described in the ordinance, not all of these structures meet this requirement as indicated in the EAW. In addition, these structures DO NOT meet Section V: Land Use Safety Zoning, Le Sueur Municipal Airport Ordinance, which “restricts those uses which may be hazardous to the operational safety of aircraft operating to and from the Le Sueur Municipal Airport, and, furthermore, to limit population and building density in the runway approach areas, thereby creating sufficient open space to protect life and property in case of an accident.” The silage (by-product) bunker structures proposed directly within Safety Zone A, are hazardous because of their proximity to the airport. They are considered structures (by the zoning ordinance definition) with bulk putrescible (capable of decaying or rotting) waste (solid wastes that contain organic matter capable of being decomposed by micro-organisms) and of such construction, character and proportion as to be capable of attracting or providing food for birds (40 CFR §257.3-8) within Safety Zone A, which is prohibited. The Airport Ordinance clearly states, “areas designated as Zone A shall contain no buildings, temporary structures, exposed transmission lines, or other similar above-ground land use structural hazards, and shall be restricted to those uses which will not create, attract, or bring together an assembly of persons thereon.” Please indicate how these structures and uses proposed in Safety Zone A are not a hazard for the Le Sueur Municipal Airport. No permits for any aspect of the project should be issued unless this is resolved. In order to minimize visual impacts of the project, the proposer indicates trees will be planted along the borders (within Safety Zone A) (pg 27). This is not allowed. Therefore, what alternative method will be utilized to screen the site from neighboring properties and public state highways? Safety Zone B: The project proposes liquid industrial waste/fertilizer pits/lagoons/retention ponds – aka sludge storage area, and is also defined as any solid, semi-solid, or liquid waste generated from municipal, commercial, or industrial wastewater, etc (40 CFR 257.3) within this zone. These structures DO NOT meet Section V: Land Use Safety Zoning which, “restricts those uses

Page 5 of 18
which may be hazardous to the operational safety of aircraft operating to and from the Le Sueur Municipal Airport, and, furthermore, to limit population and building density in the runway approach areas, thereby creating sufficient open space to protect life and property in case of an accident.” The liquid sludge storage area (industrial by-product structures) proposed directly within Safety Zone B, are considered hazardous because of their proximity to the airport. It should be noted that the chemical makeup of this material is similar to fertilizer (and is being proposed to be sold offsite as fertilizer), which includes ammonium nitrate. As a comparison, a mixture of dry ammonium nitrate and fuel oil (such as fuel oil from airplanes) is a widely used bulk industrial recipe for explosives (known as ANFO). Please indicate how this lagoon in Safety Zone B is not a hazard for the Le Sueur Municipal Airport. Safety Zone C: Solid waste storage and buildings proposed in Safety Zone C is provided in Table 1. The Use Restrictions defined in Section V: Land Use Safety Zoning, B (1), state that, “no use shall be made of any land in any of the safety zones defined in Section V A [Safety Zone Boundaries of Zone A, B, and C] that creates or causes interference with the operations of radio or electronic facilities of the airport or with radio or electronic communications between the airport and aircraft, make it difficult for pilots to distinguish between airport lights and other lights, results in glare in the eyes of pilots using the airport, impairs visibility in the vicinity of the airport, or otherwise endangers the landing, taking off, or maneuvering of aircraft. Please include the following information: What construction material is proposed for all buildings and improvements within the safety zones? Please provide information on the potential glare from roofs, tarps, pit covers, etc. What is the size and configuration of wires and their supporting structures for overhead transmission lines? For each pole and support, include the locations, height, and elevations. Please include information on temporary and permanent lighting required, as well as obstruction markings, strobe lights on stacks, and any other potential for impaired visibility in these zones. The site is proposed to add electricity to the grid, where will the transmission lines be installed? What are the emergency procedures for light outages to ensure safe airport lighting? The plumes from various stacks and driers located directly adjacent to Safety Zone A within Safety Zone C impairs visibility in the vicinity of the airport and has the potential to endanger the landing, taking off, and maneuvering of aircrafts. The EAW states that the plume is anticipated to dissipate within 200 feet “from the facility” (page 27) (does this mean the site boundary or the source location)? However, photographs presented as Figure 2 show plumes from existing facilities that include similar operations (not exact) as the proposed site. This is a serious concern for the Le Sueur Municipal Airport. Hazardous Wildlife – Hazardous wildlife are those animals associated with aircraft strike problems and are capable of causing structural damage to aircraft, such as vultures, geese, cormorants/pelicans, cranes, eagles, ducks, osprey, hawks, pigeons, owls, larks, crows/ravens, mourning doves, shorebirds, blackbirds/starling, kestrels, meadowlarks, swallows, sparrows, and nighthawks. Provide information further detailing how proposing silage bunks within Safety Zone A in the direct line of the Le Sueur Municipal Airport runway does not create a very serious hazardous wildlife problem. The Office of Airports has overseen a wildlife management program for nearly fifty years and has conducted wide-ranging research to find the best way to keep airports safe by making them less attractive to all types of wildlife. The FAA remains committed to its long-standing goal of reducing wildlife hazards at or near airports. The City of Le Sueur was issued a certification alert on June 11, 2009 reminding them of their obligations under Part 139 to conduct Wildlife Hazard Assessments if they experience any triggering event, such as having wildlife capable of causing aircraft problems from wildlife. This is so important, in fact, the FAA is currently working on making Wildlife Hazard Assessments mandatory at every airport. Has this been conducted? Has the proposed project been considered? In accordance with the wildlife hazardous guidance recently developed, a Wildlife Hazard Assessment (WHA) should be conducted in accordance with Part 139 to determine if the airport needs a WHMP and if the proposed project impacts the safety of the public. How will the cover/roof on the silage bunk structures be constructed and what material will it consist of? It appears the proposed “trench drain” collecting “silage juice and precipitation” (page 14) will not be enclosed. How will this prohibit hazardous wildlife from congregating at this site? It is a commonly known problem that birds and rodents will puncture plastic and membrane silage covers as well. How will this be handled to prevent an abundance of wildlife from frequenting the site creating an airspace hazard for the Le Sueur Municipal Airport? How will the proposer proceed to reposition or redesign the silage bunk structures within Safety Zone A (also required to be outside of the 1,000 ft residential and state highway setbacks to meet SDS permit requirements) within the direct line of the Le Sueur Municipal Airport runway that doesn’t create a very serious hazardous wildlife problem?

Page 6 of 18
Before any permit is issued, this proposed project must successfully prove that the facility will meet separation distances, will not handle putrescible material, does not attract hazardous wildlife and does not threaten public aviation. In order to satisfy this requirement, in the past some facilities have offered to conduct experimental measures to demonstrate that their proposed project will not be a hazard to aircraft. However, it should be noted, that to date, no such facility has been able to demonstrate an ability to reduce and sustain hazardous wildlife to levels that existed before the facility began operation. For this reason, demonstrations of experimental wildlife control measures CAN NOT be conducted within the airport separation distance, in other words, at this proposed site.2 Further, the city of Le Sueur and proposer were supposed to immediately notify the FAA of the proposed land use changes that have the potential to attract hazardous wildlife if proposed within five miles of the airport. If this would have been completed, this project would not have wasted the time, money, and resources of citizens and the local, state, and other federal regulatory agencies. Item 11. Fish, Wildlife and Ecologically Sensitive Resources. Was fieldwork conducted at the site in order to ensure there are no state-listed endangered or threatened species at the site? If not, how does the proposer know there are no state endangered or threatened species on the site? Loggerhead Shrikes (Lanius ludovicianus), Henslow’s Sparrow (Ammodramus henslowii), Spilogale species (potentially Spilogale putorius), Emydoidea blandingii, as well as multiple Pipistrellus species are known in this area and the site provides ideal habitat for these species. Fieldwork should be conducted at the site during the most opportune times of year in order to determine if there are any species present in accordance with MN Rules 6134 an 6212.1800 to 621.12.2300 in order to ensure this project is in compliance with the Minnesota Environmental Policy Act and MN State Statutes. As previously mentioned, it is generally known that silage is a common food source for multiple bird and rodent species, and in fact the MN DNR actually provides BMPs to agricultural producers to help deter wildlife in and around silage bunks. Further information needs to be provided regarding foraging wildlife species utilizing the proposed silage bunks for food. This includes, but is not limited to the following species (per FAA Advisory Circular 150/5200-33B): vultures, geese, cormorants/pelicans, cranes, eagles, ducks, osprey, hawks, pigeons, owls, larks, crows/ravens, mourning doves, shorebirds, blackbirds/starling, kestrels, meadowlarks, swallows, sparrows, and nighthawks. Also provide information further detailing how proposing silage bunks within Safety Zone A in the direct line of the Le Sueur Municipal Airport runway does not create a very serious hazardous wildlife problem. Item 12. Physical Impacts on Water Resources. Has a wetland delineation been completed in accordance with the criteria set forth in the Army Corps of Engineers 1987 Manual and Regional Supplements in order to determine wetland areas and incidental wetlands as described on page 11? There is no dispute that wetlands created by mining activities are incidental, however has the “incidental wetland” status described in the EAW been approved by the local governmental unit? If so, the results of this information should be made available in the EAW and if not, this delineation needs to be conducted and submitted to Le Sueur County Soil and Water Conservation District for review and approval. It should be noted that wetland impacts that may be considered non-jurisdictional or exempted from the CWA 404 program or WCA, but may still be regulated by the MPCA and are still required to be considered as surface waters in applicable permits (ie. SDS permit). For example, any existing wetlands (or stormwater impoundments) that are altered by excavation or other construction to function as stormwater retention basins should be considered to be adversely impacted and evaluated under the sequencing mitigation requirements of water quality standards in MN Rule 7050.0186 and the NPDES permit. The requirement in water quality standards to avoid, minimize and mitigate wetland impacts must be satisfied in all MPCA NPDES/SDS permits, including the issuance of a general construction NPDES permit. If the project does not involve altering a wetland by draining, filling, excavation or inundating through either a USACE Section 404 permit, the MN DNR, the WCA or other determinations, then the proposer must demonstrate compliance with the mitigation requirements of MN Rule 7050.0186. For the purposes of the construction NPDES permit, non-jurisdictional determination by another permitting agency, such as an ‘incidental wetland’ determination, does not address project impacts and therefore does require the proposer to demonstrate mitigation to meet NPDES permit conditions and MN Rule 7050.0186.
2 4-2 (c) http://www.faa.gov/documentLibrary/media/advisory_circular/150-5200-33B/150_5200_33b.pdf

Page 7 of 18
The EAW states the Minnesota River is over a mile away (page 17), but in reviewing Attachment 9, it appears there is a stream headwater within 2,000 feet to the north and Le Sueur River within one mile to the east. Please address these two surface water resources in the EAW. Item 13. Water Use The estimated water use volumes provided in the EAW are highly underestimated and incomplete. Therefore, there are potential significant environmental effects from this project that require further review in an EIS. The EAW states no separate water supply will be needed for the digestion or ancillary processes (I am assuming this means all other operations proposed with this project) since “nearly” all the water necessary for operation will be acquired via the high-moisture feedstock and that a well will be required only for potable water supply onsite (page 11). However, the EAW goes on to say this potable water will be required for operations including pressure washers to rinse delivery trucks, which contradicts the first statement. Please clearly describe all of the industrial operational uses requiring water. How many gallons of water per day, minute, year does this include? The EAW also states, “an initial fill of water for the process may also be required during start-up.” How many gallons of water dewatered from the local aquifer does this include? How many “start-up” cycles are required per year? Per month? Per day? If all of the liquid waste is pumped out of the lagoons twice a year, and this is being utilized as the main source of “water”, then where does the water come from when it is pumped out and no “water” is available? As required in this section, please provide all water quantities used, the source, duration, and specific use. It appears 1.9 million gallons of water is expected to come from precipitation collected at the site (page 16) with 65,000 gallons (0.65 million) of precipitation collected from the site every month of the year. Where does water come from when it doesn’t rain? What is the exact source that claims 18.8 million gallons per year of recycled water? Please provide these calculations. Attachment #3 illustrates that a certain amount of water recovered from the process after digestion will be sent back into the stock holding tank to provide this water source. It is clearly stated that no more than 30% of this effluent material can be added into the digester process without causing major negative effects to the digestion process. This directly conflicts with the statement that “nearly all water necessary for operational [will] be acquired via the high moisture feedstock and that no separate water supply will be needed for the digestion or ancillary processes.” Because of this conflicting information the water balance process should be reviewed and corrected. The EAW also states the site will, “collect up to 8,000 gallons of contact stormwater per day” (page 14). How does the project proposer plan to make it rain every day? This may work in other parts of the world, but not in Ottawa township. If the water use cycle is dependent upon this as indicated throughout the EAW, then where will water come from when the site does not receive up to 8,000 gallons of contact stormwater per day? The following table shows the monthly precipitation totals for 2011: Table 2. 2011 Monthly Precipitation Totals, Le Sueur County3 (in inches) Jan Feb Mar Apr May Jun July Aug Sept Oct Nov Dec Total 0.69 1.23 2.07 2.92 3.99 4.90 5.89 1.56 0.65 0.80 0.23 1.25 26.18 Where will water required for the industrial operations at the site come from when it doesn’t rain? Where will water required for the industrial operations at the site come from when it snows? Where will water be stored when the site receives more rain or snow than assumed in this EAW? There are multiple months of the year (approximately 4 to 8) when the temperatures in Minnesota are below freezing and precipitation is in the form of snow. How will snow be collected in the proposed “trench drain”? How will the proposer ensure the pump in the sump works during winter months? What is the emergency procedure for when the sump freezes? What technologies will be employed to ensure the liquid waste ponds do not freeze? The EAW states that the first step of anaerobic digestion is to use water in order to break down the starch and cellulose to make them soluble (page 6). Where does this water come from to start this process? If it comes from feedstock, what is the process to extract this water and where will this activity be conducted? How much water will be required for this input in gallons per minute, gallons per day, and gallons per year? The attachment 3 states “contact water bypass to lagoon” What “lagoon”? This is not shown in the figure on page 6. Where is this located and what size is it? Is it a lined and covered pond? Please provide more information. The EAW states that in order to prepare a consistent feedstock, a slurry is created in order to pump the material to the anaerobic digesters (page 6). Where does this water come from to create the slurry? Is this required daily? How much water will be pumped in gallons per minute, gallons per day, and gallons per year? Is this water shown as “Water from 3 Minnesota Climatology Working Group

Page 8 of 18
Recycle Tank” and/or “Rinse Water to Feedstock Tanks” on Attachment 3? The EAW states that the raw biogas will be composed of 6 percent water (page 6). This is water lost in the water cycle that hasn’t been accounted for in the water use amounts. The EAW states that the moisture (water) from the unconditioned biogas will have to be removed (including undefined levels of hydrogen sulfide which is removed via scrubbers) and will be added to the “liquid byproduct for land application” therefore this will not be reentered into the water cycle. Is the industrial wastewater proposed for recirculation even compatible with the proposed process? Please provide data that shows this. What role does seasons and temperatures in Minnesota play in this process? Provide information on how the entire system and cycle is designed to account for temperature changes. The EAW states a slurry will be created by the anaerobic digestion process (page 7). The liquids and solids will be separated with the solid waste dried (creating steam in a plume at the site) to a 10% moisture content. Therefore, an unknown amount of moisture will be lost in the drying process as well as within the solid waste. If the liquid waste stream will be sold as a by-product, then not all the collected water will be entered into the water cycle, correct? The Attachment 3 does not clearly define the water cycle for the site. As required in the EAW, please provide the water quantities to be used, the source, duration and quantity of any appropriations. Further, please define how much water in contact with significant materials will be allowed to infiltrate onsite. Will this be monitored for water quality? What will the MPCA require to ensure no material in tanks proposed for the project, nor industrial wastewater contaminates groundwater aquifers? The EAW currently says 2,000 gallons of water per day will be required for operations at the site. This equals 730,000 gallons per year. Since the water use for the site could very easily be upwards of 10,000 gallons of water per day or 1 million gallons per year or more, a permit to appropriate water will be required. Provide information in the EIS on the depth of the proposed well, how the well will be developed, and the aquifer the project will be dewatering from. At a minimum, the proposer should be required to report water use per MN DNR requirements. Water level monitoring and water quality analysis should be conducted annually to ensure the site is not contaminating groundwater nor is drawdown creating a cone of depression to the local groundwater aquifer affecting surrounding water supplies. Mitigation measures should be defined in response to monitoring activities. Clearly, the proposed water cycle and water use from local aquifers need to consider both drought and wet season precipitation amounts when considering total water use at the site as well as the annual seasonal fluctuations in Minnesota. Further, the entire stormwater collection system, site elevations, significant material contact, and industrial wastewater ponds needs to be revisited in the EIS to meet local, state, and federal water standards. Conduct a well inventory as part of the EIS per Minnesota Department of Health guidance in order to account for all domestic, public, and irrigation wells in the area of the Project. Once the proposer accurately details actual water use at the site and water needed from the proposed well, please conduct an aquifer pump test as part of the EIS to fully understand the environmental impacts from the amount of water dewatered from this well. Consider the existing water levels in the area, shallow aquifers within the terrace deposits, and overlapping cones of depression from other irrigation wells, the city of Le Sueur, and other industrial users within a five-mile radius. Depending on the results of this aquifer pump test, please detail in the EIS how the proposer will be responsible for surrounding well impacts from water level drawdown, or groundwater contamination from leaking ponds, tanks, or infiltration allowed of contact stormwater. Also detail how this protocol compares to the existing protocol currently in place in Le Sueur County. Item 17. Water Quality – Surface Water Runoff. The stormwater system described in the EAW is incomplete and includes contradictory information. Based on the information provided, there are significant environmental impacts from this project that require further review in an EIS. The EAW states that an excavated area present between the proposed project buildings and State Highway 112 will receive the majority of runoff from the site (page 11). This section is unclear relating to stormwater facilities at the site. One sentence in section 17 states the northwest section will be filled in and another storm water pond will be constructed and another sentence says all other non-contact runoff will be received in a stormwater pond on the west side and in the northeast corner of the site, and Attachment 7 refers to a separate area all together. In section 12 it says storage will be provide in an existing pond. Attachment 10 shows a sump to process stormwater around the silage storage area #1. Please provide more information and clarification on this issue throughout the EAW. This EAW also states that the 0.3 acre basin has the capacity to infiltrate the 100-year, 24-hour storm runoff from the tributary area within 24 hours for the entire site. However, the only area proposed to be draining to the site (based on the elevations listed on site plan in Attachment 4 and Attachment 10) is the area of the buildings since the lowest elevation of the site is shown in the location of the silage bunk structures. The current stormwater pond at the site is permanently inundated and includes 1.6 acres. The “new” stormwater pond is proposed at 0.3 acres. Impervious surface is proposed to increase from 0.3 acres to 15.3 acres according to information in the EAW (page 10). The runoff quantity (in peak flow) pre-project is stated at 32 cfs and post-project

Page 9 of 18
at 144 cfs with the phosphorus loading multiplying by almost seven times from 3 to 20 lbs/yr (pg 13). The soils are the same if not more permeable at the existing pond. Given this information, how exactly has this basin been sized to have the “capacity to infiltrate the 100-year, 24-hour storm runoff from the tributary area within 24 hours for the entire site?” How does the proposed stormwater facility ensure site improvements (specifically the silage bunk structures) do not become flooded requiring untreated stormwater to be diverted offsite? This information is astonishingly unclear and confusing – is the 0.3 acres pond supposed to treat the “tributary area” or the “entire site”? Obviously, the information presented in the EAW is inaccurate and contradictory relating to stormwater runoff. Please provide clarity on this issue in the response to comments and further provide an analysis and model results for stormwater in the EIS. Include with the information the specific design parameters to be employed to ensure filled soils under the silage bunks will be stable to construct a non-permeable silage bunker floor and walls that won’t shift and crack during soil settling, resulting in potential stormwater contact with significant material and groundwater contamination from leaching silage juices. Further, the elevation of the silage bunk storage area is proposed at 840 ft above msl. However, the 0.3 ac stormwater pond elevation and remaining site is proposed at 850-857 ft above msl according to Attachment 4 and Attachment 10. Where is the sump shown in Attachment 10 supposed to pump stormwater in contact with significant-material to? Where does stormwater go in the event of an emergency situation when the pump fails? What event is this sump and pump designed for? What happens when we receive back-to-back events? How does the proposer plan to have stormwater run uphill from the silage bunker structures to be treated in this undersized pond when the pump fails? The silage bunk structures are proposed in the lowest portion of the property and would require over 20 feet of fill in order to allow the “entire site” to be treated in the 0.3 acre storage pond. If the elevation at the proposed location of the silage bunks doesn’t change, then stormwater will naturally flow to the lowest portion of the property, which is location of the silage bunk structures, resulting in stormwater in contact with significant materials and flooding at the site. In order to ensure this doesn’t happen, the silage bunks would have to be at a higher elevation (which is why I am assuming page 11 mentioned that the existing stormwater pond will be filled) of at least 850 ft above msl (rather than 840 ft above msl) in order to ensure stormwater drains to the stormwater basin and not the silage bunks. The silage bunks would therefore have a height elevation of at least 870 ft above msl. Is the “flow diversion device” in Attachment 11 supposed to show something of value? What exactly would that be? What is the center box supposed to represent? The term “trench drain” listed in Attachment 11 is not clearly defined in the EAW, what does this mean? This leachate collection and treatment system should be reconsidered, especially given the fact it is proposed in Minnesota. Item 18. Wastewater & Item 20. Solid Wastes & Other Waste Streams, Storage Tanks The EAW states that the moisture (water) from the unconditioned biogas will have to be removed (including undefined levels of hydrogen sulfide) (page 6). It goes on further to say that the remaining liquid will be added to the liquid waste stream to be used as fertilizer. What happens to the other waste from the scrubbers used to remove the hydrogen sulfide from the waste stream from the unconditioned biogas? The EAW states that the liquid waste stream will be stored on-site in covered, lined storage ponds until it can be sold offsite and “seasonally applied to nearby agricultural land” (page 7). Similarly to feedlots, waste application site requirements for 4,300 acres of corn to apply the entire annual production need to be included in the EAW. Since most farmers have either a corn-bean or third-crop rotation, waste application sites should be provided for at least 8,600 acres. Please provide information throughout the EAW for the 8,600 acres required for waste from the project. Additional information should be provided regarding the design of these liquid waste storage structures. Monitoring parameters should include ammonia-nitrogen, hydrogen sulfide, phosphorus, potassium dissolved “salts” and other materials as indicated on page 7. With the infrequent influx of contact stormwater to the liquid waste storage pits, how will the composition of this waste material ensure it meets application parameters for land application sites? How will this material be sold to local farmers at prices below market prices for seasonal application to nearby agricultural land when the composition is not reliable because of the influx of contact stormwater and recycled water? Silage bunks have to be routinely cleaned out to prevent remaining silage (which will spoil) from contaminating new silage. How will this waste be managed? How often will this occur? What odor mitigation will be utilized for this? The EAW states sanitary wastes will be treated with an on-site septic system (page 11). Subsurface Sewage Treatment Systems require in situ soils and soils protected from disturbance, compaction, etc per MN Rules. The septic drain field is shown

Page 10 of 18
on a portion of disturbed site. Provide more information on the placement of this drain field and treatment requirements per MN Rules 7080 and 7081 and MN Statute 115. Also, please provide the location of two septic sites as required. The EAW states the solid waste by-product will be sold for use in off-site boilers. What is the chemical composition of this solid waste product? This material is defined as solid waste according to Environmental Pollution Control Agency (EPA) definitions. Does it meet local, state, and federal regulations as a solid waste and does it meet these same parameters to burn as proposed? Isn’t burning of industrial solid waste prohibited per MN Rule 7035.1700? Include information on amounts, transporters, and receivers of solid wastes generated from reagent packing, office and laboratory waste, pallets, containers, employee waste, etc. The EAW describes in great detail the possibility that the feedstock and the biogas created should be classified as a solid waste pursuant to the Clean Air Act (page 19) the outcome of this detailed investigation is that the biogas is comparable to a fuel and not a solid waste. However, no details are provided regarding the possibility of the resulting solid and liquid wastes generated by the processing is classified as solid wastes. Please provide to the same level of detail, the criteria for qualifying not only these two final waste streams, but each individual waste stream throughout the process. Also please provide information on the feedstock and silage used at the site and how it is described as a solid waste and the applicability of those regulations to this material. The EAW incorrectly states there will be no toxic or hazardous materials to be used or present at the site, nor does it identify measure to be used to prevent them from contaminating groundwater. If biogas is considered a fuel, and fuel is considered a hazardous material requiring measure to prevent them from contaminating groundwater, what exempts all of the storage tanks, vessels, bunks, etc proposed for this site from these same regulations? Obviously this information is inaccurate and contradictory with the next two paragraphs which indicates there will be 314,000 gallons of storage at the site. Please provide either additional information or detail the methodology use to arrive at the “None” answer listed (page 20). The EAW mentions diesel fuel tanks will be required to fuel on-site and off-site transportation vehicles. Where will these tanks be located? Will these be above ground or underground tanks? How will waste oils and material be handled? It is expected that at the least, a RCRA permit and/or hazardous waste permit would be required. Generally, a spill prevention control and countermeasures plan is also required if the site will have over 1,320 gallons of oil onsite. Please include details on these permits and plans required. Please include an emergency contingency plan as well since the site will include 314,000 gallons of material storage. Additional information in the EIS should identify secondary containment as well as plans for leaks and spill in this highly sensitive groundwater area. Also include all applicable provisions (including but not limited to) corrosion and cathotic protection requirements, inspection and maintenance plans, and leak detection for all the tanks, vessels, and bulk storage areas. All tanks and areas of material storage should include conditions for monitoring (per RCRA requirements) and additional groundwater monitoring requirements with results provided to the MPCA, MN DNR, MDH, city of Le Sueur, and all residents as requested. This monitoring program should be operated per MN Rules 7035 to determine whether industrial waste, leachate, or any of the tanks or storage vessels is causing pollution to soils, groundwater or surface water. The drilling and construction of all site wells, including those used for monitoring purposes, must be done in compliance with MN Rules 4725. The conditions of monitoring, including the frequency and the analysis for water monitoring samples, should be detailed in the EIS. Item 19. Geologic hazards and soil conditions. Overall, Item 19 needs to be revised and further information provided in the EIS to include factual, accurate data (rather than broad assumptions) regarding the wells, geology, and potential hazards of this project on local soils and groundwater. Item 19 fails to identify that the proposed project is located in an area of high ground-water sensitivity and provides incorrect information relating to the status of the gravel mine at the site. The proposer may also want to check their sources regarding the described “sink holes” from the “dissolution of Oneida dolomite” (page 17) as well as the indicated impermeable nature of the “clay till” (page 18) that the EAW assumes will protect the “groundwater from any leakage from the fermentation/digestion tanks” and revise the EAW to be consistent with information presented on page 19 which states “groundwater freely drains from the site” because of “high-permeabilty zones”. Please revise accordingly to be accurate. The EAW also fails to include discussion or accurate analysis of the implications of this condition with respect to the potential for groundwater contamination, as required in Item 19b. This should also be included in the EIS to identify risks and discuss any mitigation measure that may be utilized to prevent groundwater contamination.

Page 11 of 18
Remove assumptions on the alluvial material, clay till, and bedrock as substantial, published information exists on these resources and the assumptions made in the EAW are inconsistent with these findings. Please provide more detailed information consistent with in-depth studies that have been completed in this area. Remove assumptions regarding wells not constructed in water table aquifers. Wells not within the CWI are most likely not included because they were installed prior to the 1970s when the well code referenced in the EAW (page 18) was implemented. Therefore, a complete well inventory should be conducted as part of the EIS. If any assumptions should be made, it is that any well not listed in the CWI were developed in the water table aquifers prior to the well regulations. The EAW states, “groundwater that exists above the clay till has been impacted by agricultura activities in the region” (page 18). Is there evidence that groundwater aquifers above the clay till have been impacted by agricultural activities? This is a bold statement and one the proposer may want to revisit. Please provide evidence that supports this claim. Does the EAW really intend to claim that since wells were not allowed to be installed in the shallow groundwater aquifer in the last 30-40 years (many residences in the area are twice as old as that) that there shouldn’t be any wells in that aquifer anyway, and since the shallow groundwater aquifer is contaminated by agricultural activities, it is therefore okay for leachate, chemicals, and waste to be “released to the water table” from this project? Perhaps the proposer should consult further with the MPCA, the MDH and MN DNR who regulate water use and quality for the purpose of protecting these water resources in Minnesota and for clarification on the federal Clean Water Act of 1972 and the Minnesota Environmental Policy Act of 1973. Please define how much water in contact with significant materials will be allowed to infiltrate onsite. Will this be monitored for water quality? What will the MPCA require to ensure no material in tanks proposed for the project nor industrial wastewater leaks from storage containers to potentially contaminate soils, shallow groundwater aquifers and deeper aquifers? The silage bunks are proposed to include the “use of soil-cement concrete slabs for the bunk bottoms to provide an impervious surface thereby preventing silage liquids (leachate) from seeping into the ground”. Obviously, the proposer understands that this leachate cannot be allowed to infiltrate onsite. How will this five five-acre slab be installed to insure it doesn’t crack resulting in leachate entering the soil and groundwater? Please include information on design parameters of these “soil-cement concreted slab” structures and what monitoring protocol will be included at the site to ensure leachate is not entering the soil and groundwater from below the slab. Obviously the water information collected from the site is inconclusive. The piezometer locations installed at the site are not shown in Attachment 15 as indicate on page 19. Because of these ongoing concerns and conditions and variation in well water levels, piezometers should be continued to be monitored and further studies conducted on the concerns of water contamination and the water table levels decreasing. Please include additional information regarding the location, size, depth, and elevation of these piezometers in order to attempt to understand the information presented in the EAW. Item 21. Traffic & Item 22. Vehicle-related Air Emissions. The estimated traffic volumes provided in the EAW are highly underestimated and incomplete. Therefore, there is significant environmental effects from this project that requires a detailed traffic analysis and further review in an EIS with a focus on public safety, noise, odor, and other related concerns. Since Hwy 112 is not designed to current state standards and is the proposed main access for this project, a traffic impact study should be completed. The EAW states there will be a total of 20 average daily vehicles generated with a maximum peak hour of 15 vehicles at a 4 pm shift change. This is inconsistent with other information in the EAW. The following information attempts to estimate the traffic and peak generation given the information provided in the EAW. This also includes volumes that were not included in the EAW. It is assumed liquid waste lagoons will be cleaned out twice per year (April and October as indicated on page 21), with trucks hauling 24 hours per day. It is calculated corn silage is hauled during August and September (as indicated on page 5 and 12), with trucks hauling 24 hours per day. The following information was listed in the EAW:
- Feedstock (not including corn silage): 15 trucks per day (30 trips) - Employees: 10 vehicles per day (20 trips) - Liquid waste: 2 trucks per hour = 48 trucks per day (96 trips) - Corn silage: 2 trucks per hour = 48 trucks per day (96 trips)
This totals 121 vehicles, or 242 trips per day during peak days (this does not include solid waste removal, or other daily trips not mentioned in the EAW). However, both the liquid waste and corn silage estimates provided in the EAW are underestimated. Here are more accurate estimates:

Page 12 of 18
According to the EAW document, the site will convert up to 45,000 tons per year (dry basis) (pg 2). These materials will be delivered to the site via truck (page 5). Using the numbers provided in the EAW, that equates to the following: Table 3. Anticipated Annual Tons per Year (based on information from page 3) Feedstock % by dry weight Anticipated dry
tonnage % solids Anticipated wet tonnage
Sweet corn silage 40-75 18,000 - 33,750 20-30 72,000 - 135,000 Potato waste 10-40 4,500 - 18,000 15-35 18,000 - 72,000 Chicken manure 5-15 2,250 - 6,750 25-40 9,000 - 27,000 Vegetable waste 1-5 2,250 - 6,750 15-40 1800 - 9000 Fruit waste 1-5 2,250 - 6,750 15-50 1800 - 9000 Snack food 1-5 2,250 - 6,750 40-95 1800 - 9000 45,000 total 25 min ave 180,000 tons ave The average tank trucks has approximately 6,000 to 7,500 gallons capacity (a 24-ton semi-truck is an industry standard which is about 6,000 gallons) and was used in these traffic estimations. Corn silage includes a maximum of 135,000 tons (wet) per the table above. This equals approximately 5,625 trucks hauling 24 hours per day for 2 months (60 days), equaling approximately 94 trucks (188 trips) per day, or approximately 4 trucks (8 trips) per hour. This is double the numbers provided in the EAW. If trucks are only hauling 8 hours per day, this equates to 12 trucks per hour, or 24 trips per hour. Since all drivers may not be on a 24-hour haul schedule, an average number should be utilized. The figure on page 16 of the EAW shows there will be two 11.5 million gallons of liquid waste by-product storage capacity at the site with 23 million gallons loaded out. It is unclear if this amount is per year or per load-out as there is conflicting information and material is usually completely emptied during each load-out (if only once per year, provide information on the design to ensure capacities). Using the same assumptions as the EAW (liquid waste lagoons will be cleaned out twice per year (April and October as indicated on page 21), with trucks hauling 24 hours per day), that equals 3,833 total trucks (7,667 trips) annually, or (1,916 trucks (3,833 trips) per cleanout. If hauled for 30 days, this equates to 64 trucks per day (128 trips), averaging 2-3 trucks per hour (4 to 6 trips) hauling 24 hours per day, or averaging 8 trucks (16 trips) hauling 8-hours per day. If the material cleaned out of the lagoons totals 23 million gallons per loadout (rather than per year) then that equates to 128 trucks per day (256 trips per hour) averaging 5 to 6 trucks (10-12 trips) per hour with trucks hauling 24 hours per day, or 16 trucks (32 trips) per hour with trucks hauling 8 hours per day. Based on this analysis, the following is true:
- Feedstock (not including corn silage and liquid waste): 15 trucks per day (30 trips) (from EAW) (this is also more if considering wet vs dry feedstock, but was not calculated)
- Employees: 10 vehicles per day (20 trips) (from EAW) - Liquid waste: 2-8 trucks per hour = 64-128 trucks per day (128-256 trips) - Corn silage (ave): 4-12 trucks per hour = 94 trucks per day (188 trips)
Rather than the estimated 121 vehicles (242 trips) per day during peak days, the actual number is closer to 183 to 247 vehicles, or 366 to 494 trips per day. The EAW should be revised to include this more accurate assessment of trips per day and rather than saying there will be a maximum peak hour of 15 vehicles per day at shift change, the information should indicate the maximum number of trips in September or October when trucks are hauling corn silage to the site, liquid waste is being removed from the site, additional feedstock is coming into the site, as well as employee shift changes. These peak and daily numbers are also assuming a 24-hour a day operation (rather than a more intense 8-hour a day operation). However, please indicate the percentage that the traffic in and out of the site will be a 24-hour a day operation for liquid waste and corn silage transit. If this is not 100%, please revise peak traffic accordingly. Additionally, the EAW states that a solid waste by-product will be sold for use in off-site boilers, however no further information was provided regarding this solid waste in regards to amounts, site capacities, transportation, permits, etc. Please provide information on this additional solid waste by-product and include this information in all applicable sections. Page 23 mentions that approximately 16 tons per day of “dried fuel product” (page 23) which translates to approximately 5,840 tons annually. Where will this be stored? How often will it be removed from the site? Assuming it is hauled off daily, this will add an additional 3 vehicles per day (6 trips) that has not been calculated into the above figures.

Page 13 of 18
The EAW states silage will be moved from storage to the reception area by means of dedicated vehicles from the bunkers to the receiving building as needed. Will this also occur 24 hours a day? Please specifically define these vehicles in greater detail. Do these “dedicated vehicles” include backup alarms? Backup alarms at this site should be prohibited in order to meet state noise standards. Back up strobes can be utilized for employee safety instead and should be included in permit conditions. It is understood that “feedstock flexibility is critical to the project because the exact mix of feedstock will vary somewhat over the life of the project as markets and the needs of local supply shift over time.” However, this statement doesn’t exempt this project from basic MPCA processes and state regulations. Please provide information throughout the EAW giving ranges and general assumptions and detailed information for at least the first one to five years. The liquid waste by-product is assumed to be sold to local farmers to be land applied during the spring and fall (page 7). If this assumption is correct, where are these sites located? Hwy 112 has seasonal load limits in the spring, how will material be hauled offsite or onsite during the spring if there are seasonal load restrictions to local roads? If the proposer obtains an over-weight permit on an annual basis for the life of the project, what type of mitigation will be provided for adequate repair of this road? Traffic generation is a concern. The MN-Hwy 112/T-115 intersection has been a long-standing problem. There are no shoulders on either road, nor median storage space for left turns into the site, nor right turns. What road upgrades will the proposer complete to alleviate heightened safety concerns from this project? The planning of the area road system is a concern. Areas need to be served by an integrated overall transportation system. This needs to be planned out so that improvements can be made efficiently and with funding by the proper sources. This planning currently does not exist. Planning needs to be done in collaboration with MnDOT, Le Sueur County, Ottawa Township, and the City of Le Sueur in order to address the area road system prior to issuing any permits for this site. Impacts to the road system network, impacts to individual roads based on anticipated routes identified by the proposer, and safety concerns should be addressed in an EIS and future permits. Information to be considered in the EIS should include current Levels of Service (LOS) for anticipated haul roads, and future LOS from traffic levels from the proposed project. For sight distance and public safety reasons, the following road improvements are requested to be completed as part of this project:
1) a right turn lane on northbound Hwy 112 2) a right turn lane on eastbound t-115 3) a left turn by-pass lane to southbound Hwy 112 4) a left turn by-pass lane to westbound T-115 5) the addition of a shoulder to Hwy 112 along the west boundary of the project 6) the addition of a shoulder to T-115 along the north boundary of the project 7) Sidewalks should be required along all city streets and from the city of Le Sueur proper.
These roads should be constructed to State Aid Standards. Further, no trucks should be allowed to access the site through the City of Le Sueur. If so, include in the EIS and future permits how truck traffic will be mitigated for in order to ensure the safety of citizens with churches, schools, and daycare centers along this route. Also, include in the EIS and future permits how odor will be mitigated for haul trucks. Further, please indicate traffic volumes and LOS on all haul roads into an out of the site. In addition to the traffic analysis in an EIS, future permit conditions regarding haul routes road upgrades, and planning improvements; an actual traffic study should be conducted to compare anticipated traffic levels to actual traffic levels during peak traffic times within the first two years of project commencement. Based on this study, permit conditions should be considered accordingly in order to ensure public safety. Please update item 21 and 22 to include all traffic volumes which significantly changes the percentages provided as well as provide the numbers used to obtain these percentages. There is not a “relatively small increase in total daily traffic volumes” (page 21) if the proposer uses the correct traffic volume information to formulate an answer for the EAW. Also, correctly identify the daily average traffic volume for all sections of Hwy 112 (not just the segment with the lowest volume) and CR 115, which includes the following:
Page 14 of 18
Hwy 112 – segment from 5-mile corner north to T-115 intersection: 920 AADT (2009) Hwy 112 – segment from T-115 north to Kaukis Drive: 2,700 AADT (2009) Hwy 112 – segment from Kaukis Drive, north to Ferry St: 3,255 AADT (2009) Hwy 115 – segment from Hwy 112 to T-152 (4-way) 520 AADT (2009) Also, please include the required information for Item 22, which states, “Estimate the effect of the project’s traffic generation on air quality, including carbon monoxide levels. Discuss the effect of traffic improvements or other mitigation measures on air quality impacts.” Include a cumulative impact analysis combining the vehicle air emissions with the stationary source emissions in the EIS. Item 23. Air Quality. The EAW provides insufficient information to analyze significant environmental effects. The EAW states that a state air permit application was submitted to the MCPA and included dispersion modeling (page 7). However, the EAW states the dispersion modeling only demonstrates that the short-term ambient air quality standards are not exceeded by engine emissions. The EIS should include a complete air quality analysis that studies the long-term effects from the entire site, not just engine emissions. This should also include odor. Future permit conditions also need to include monitoring requirements to ensure all emitting operations at the site meet or exceed all ambient air quality standards. The EAW states a CO catalyst will be incorporated to control CO and VOC emissions. Monitoring requirements should be included in permits to ensure CO and VOC emissions are continually controlled to design parameters and meet or exceed all state and federal air quality standards. Please further describe how this facility will meet and exceed Minnesota’s enforceable ambient air quality standards for hydrogen sulfide that apply at the property line of facilities (no more than two half-hour episodes of hydrogen sulfide above 30 ppb within any five-day period and no more than two half-hour episodes above 50 ppb in any year)? How will this be monitored, reported, and enforced? Please discuss what measures will be used to control airborne pathogens. Calculations used for information in the EAW should be provided as part of the EAW. It is unlikely a permit application can be considered complete prior to the environmental review period. What exactly is the purpose then of the EAW if information discovered during the environmental review process isn’t included in a complete permit application? After this EAW will the permits be put back out for public comment once they are actually complete? Item 24. Odor, Noise & Dust. Odors The odor from this facility is a serious nuisance and is a potential significant environmental impact. Only some portions of odor emitting areas of the project have included mitigation. This needs to be further studied in the EIS. Odorous emissions are regulated by the MPCA, however it appears the MPCA has dissolved the odor rule and defaults to cities and counties. Please provide information on the MPCA’s approach to this significant environmental impact. Please provide information on the proposer’s approach to odor concerns. Do they have a ‘good neighbor’ protocol similar to other industries and agricultural facilities in this area? If so, what is it? What is the city or county regulation regarding odor? Has an odor analysis been completed? What are the results? Can OFFSET be used to predict the level and frequency of odor that can be expected and to determine an “annoyance free” setback distance? Although the MPCA odor rule has been repealed, odor is still one of the top air pollution problems. Citizens in communities with similar types of structures have experienced headaches, nausea, reflex nausea, gastrointestinal distress, fatigue, eye irritation, throat irritation, etc. This doesn’t touch on the quality of life effects or the effects to property values, salability, or community image. The frequency of odor nuisance, the duration of each episode, the intensity of the odors, and the character or offensiveness of the odor all contribute to the problem. For this project, air pollution from odor will exist for the site and surrounding properties 24 hours per day, 7 days per week, 365 days per year. Odor conditions needs to be defined for this project through the various state and local permits. Well defined parameters and monitoring requirements need to be included that utilize compliance determining criteria, annoyance criteria, ambient odor criteria (threshold or intensity), and ambient odorant criteria (mass concentration), episode duration-frequency criteria, source emission criteria (threshold or mass concentration) and best available control technology criteria (ie. industry standards). A standard practice for determining odor intensity similar to ATM E679-91, ASTM E544-75,88 or a program utilizing a scentometer or similar program should be referenced. What governing

Page 15 of 18
body will regulate, field complaints, and ensure compliance for this project? Please detail the complaint criteria and method to file complaints. The EAW states that to control odors from the feedstock receiving area, MMPA will incorporate several odor management practices (page 5 and 24). That is appreciated, however, what about the rest of the project? Why just the feedstock receiving area? There is more odor-producing operations within the project site (and outside the project site) than just the feedstock receiving area, including the silage bunk structures. The EAW goes on further to state, “the project design assumes that all feedstock, except for the stored silage, will be processed the same day that it is received.’ (page 5). So, although the project may be “designed” to process material the same day, this is obviously not definitive. Even if it is processed at a “reduced level” for “several days”, what is the storage capacity of the “indoor controlled-environment” area? Is this sufficient and based on what requirements? Further detail needs to be provided in the EAW on this subject in order to accurately identify all odor-producing sources. If this waste material is left to sit indoors for an unknown period of time, where will liquid waste from this material drain to? Storage of all waste material, including infrequent events which would require storage of this material for longer than a 24-hour period, needs to be further analyzed in the EIS and considered in all future permits, specifically for odor, wastewater, stormwater, groundwater protection, solid waste, and land use compatibility. The EAW states the silage storage area (silage bunks) will be sized to store approximately 15,000 dry tons of silage in horizontal storage containers to prevent leachate runoff (page 5) utilizing a “horizontal storage bunk concept”. However, information in the EAW is again contradictory as it is further defined as “a pile concept” (page 14). What does this actually mean and which is it? Since silage isn’t dropped off at the site dry, shouldn’t the silage bunks be designed for wet tons? What is the wet tons storage capacity of the bunks? How will they be separated to ensure the covers work as designed and ensure precipitation doesn’t cause failure or come into contact with the silage? Attachment 12 does not clearly define the silage bunk structure. Define “soil cement surface” and “impervious surface with ballasts.” The EAW also states non-permeable covers will be installed on “each of the bunks” and the covers rolled back “one bunk at a time” in order to provide access for the removal of this material throughout the year. More detail on these silage bunks should be provided in an EIS in order to accurately identify significant environmental effects. What is meant by, “horizontal storage bunk concept”? What part is defined and what part is concept? What will be proposed to ensure the impervious surface remains impervious over time and leachate doesn’t enter soil and groundwater? What are the design parameters and future monitoring requirements to ensure leachate does not cause runoff concerns or leak into the soil and groundwater below the bunks? Does this “concept” interpret to mean that at least one silage bunk will be completely uncovered throughout the year in order to provide access? Does this “concept” interpret to mean that other silage bunks will have a permanent but removable roof (cover) over the bunk(s) at all times for use as odor mitigation and to ensure precipitation doesn’t come into contact with the silage? Please provide additional detail regarding the silage bunks in the EIS. The table on page 15 states that there will be 25% exposed area of the silage storage areas #1, #2, and #3 for 11 months and 100% exposed area for one month during loading (which occurs August and September according to page 5, so in actuality, it would be 100% exposure for 2 months which was also the assumption for the traffic section). If the proposer is applying for an Individual SDS permit rather than the General Permit because they cannot meet the general permit conditions, than an additional setback above 1,000 ft from sensitive receptors (including residential dwellings and public state highways) needs to be included as a permit condition or at the very least, the 1,000 ft setback should be from a residential property boundary. If not, please provide the reasoning for a setback only to a ‘dwelling’ (should the entire residence not be afforded the same setback if citizens are outside on their property versus inside their ‘dwelling’)? What parameters will be put into place to ensure odor is not a significant environmental impact? What continuing monitoring program will be put into place to ensure compliance? This needs to be very specifically detailed in the EIS and permits. Noise The noise section of this EAW is inadequate and noise has the potential for significant environmental effects. An EIS should be required to address the significant issue of noise pollution and noise violations that this project will have based on information stated in the EAW. According to MN Rules Chapter 7030.0030, “No person may violate the standards established in part 7030.0040, unless exempted by Minnesota Statutes, section 116.07, subdivision 2a. Any municipality having authority to regulate land use shall take all reasonable measures within its jurisdiction to prevent the establishment of land use activities listed in noise area classification (NAC) 1, 2, or 3 in any location where the standards established in part 7030.0040 will be violated immediately

Page 16 of 18
upon establishment of the land use.” It is require that the city, the county, and the MPCA do everything in its power to guarantee that noise levels stated in these rules are not exceeded. Further on in the document, the nose rules discuss the Noise Area Classification (NAC). Household units (including farmhouses) are in classification 1, which have the most stringent rules. The noise rules place numerous limits on noise that is allowed. Please keep in mind, these are NOT guidance levels, there are hard limits and law. From the hours of 7 am to 10 pm, nose levels cannot exceed 60 decibels (dB) for more than 30 minutes (L50) in any given hour and cannot exceed 65 dB for more than 6 minutes (L10) in any given hour. These limits become more stringent during the hours of 10 pm to 7 am, requiring noise levels not to exceed 50 dB for 30 minutes or 55 dB for 6 minutes of any given hour. The proposer should be able to quantify and place hard numbers (not assumptions) on the maximum noise level at the nearest residence through a detailed noise study as part of an EIS. This study should occur to accurately quantify the project noise including the cumulative effect of backup alarms, generators, driers, traffic, and all other noise generating operations within the project boundary and accessing the site. This analysis should take into account wind effects, temperature inversions, which would also increase noise levels. None of this has been addressed in the EAW and should be included in the EIS and future permits. If trucks will be hauling and unloading 24 hours per day, noise should also be considered 24 hours per day, not the 12 to 16 hours stated in the EAW (page 25). The traffic increase is NOT a small percentage of existing traffic levels, and most trucks would NOT occur during the day (page 26). Please include noise information for the entire site and traffic, not just one genset engine. As part of future local and state permits, conditions should be put into place that implements a noise monitoring program to ensure compliance with MN State Statute and Rules. This is a common practice for noise-generating operations in Le Sueur County. If continued monitoring is not required, how will the MPCA and city of Le Sueur ensure compliance with MN Statutes and Rules? Item 25. Nearby Resources. The EAW does not address the impact of the project on the Le Sueur Country Club and golf course which hosts large public gatherings. Provide information on the impact to this resource and provide odor and noise modeling that includes all surrounding amenities. Item 26. Visual Impacts. Please update this section to include more information on plumes from multiple sources at the site as well as all improvements at the site that will add height. Please provide additional information and analysis on the “approximately 200 ft” distance of the “plumes” from the facility. What is facility referring to? Is 200 feet vertical or horizontal or both? Please provide a model in the EIS indicating the minimum, average, and maximum plume sizes for each plume given different atmospheric conditions. 29 Cumulative Impacts. It was incorrectly stated in the EAW that no permits have been issued or applied for over the last four years and that there are no known projects within ten miles of the site that would affect traffic, noise, groundwater, or natural resources or add to any impacts on such resources. Obviously the proposer hasn’t looked into this sufficiently as there are multiple cumulative impacts that need to be considered as part of this environmental review. No analysis was made of specific projects that may interact with the proposed project in such a way as to cause cumulative impacts. The Minnesota Supreme Court (CARD vs. Kandiuhi County) determined that a “cumulative potential effects” inquiry under MN Rule 4410.1700, subp 7, requires the RGU to inquire whether a proposed project, which may or may not individually have the potential to cause significant environmental effects, could have a significant effect when considered along with other projects that: (1) are already in existence or planned for the future; (2) are located in the surrounding area; and (3) might reasonably be expected to affect the same natural resource(s). The court clarified that the cumulative potential effects assessment should:
- Consider existing projects, as well as anticipated future projects that have been planned or for which a ‘basis of expectation has been laid’
- Consider a limited geographic area surrounding the project, in which facilities may reasonably be expected to affect the same natural resource – for instance, a groundwater resource, roads, etc. (the project footprint should include waste application sites as well)

Page 17 of 18
In completing this item, please include information from the analysis that identifies a) the limited geographical area considered; b) any other projects as outlined above (and explain how they were identified); c) the cumulative impacts that may occur as a result of interaction of the other projects(s) with the proposed project; and d) the natural resource(s) affected and how it may be affected. Due to the proposed projects utilization of a well for water supply and the number of domestic drinking water sources in the area, in combination of other known and existing projects in the area which currently have an efficient well conflict protocol in place which encompasses the same cone of depression that would result from this project, a focus on this resource seems appropriate. The existing EAW does not currently provide a sufficient analysis of the potential cumulative impact issue either within or outside the boundaries of the project area in light of the current EQB guidance. The cumulative impact assessment does not provide a discussion of potential cumulative impacts to areas outside the boundaries of the project area, specifically the airport. It is recognized that the manner in which the cumulative impact assessment is conducted is a function of financial and information resources. However, a variety of methods exist in which a cost-effective analysis could be conducted that would aid in the EAW decision making process. Clearly, not all environmental, social, or economic media lend themselves to an effective quantitative analysis. In the absence of method or information to conduct a quantitative cumulative impact assessment, qualitative methods could be utilized. Please provide either as a separate analysis or within the framework of an EIS to account for the potential cumulative impacts of the project on the natural environment, social, and economic environment. Please include the complete final cumulative impacts analysis as part of an EIS. At a minimum, it is expected that the direct and indirect impacts of the proposed project would be identified, along with the affected resources, ecosystems, or human communities. Additionally, the project should be reviewed in temporal context to its operation and impact on the surrounding area including future impact projections on specific resources (ie. water supply, traffic, airport, odor, noise, etc). Agricultural Impacts Since this project plans to process “agricultural waste”, other entities in the area will have to amend their permits in order to supply this project. It is important to fully address the extent to which this will be necessary and to identify these projects and permits. Please provide additional information on this cumulative potential significant environmental impact. Throughout the EAW document, corn silage is listed as an agricultural waste. The overall tone of the EAW refers to this proposed project as an innovative green technology to reuse “wastes”. However, and I cannot stress this enough, corn silage is a huge commodity in the State of Minnesota and the outstate Minnesota agricultural communities. Agricultural producers including most dairy and beef farmers utilize this material as a source of feed. What is the cumulative impacts of increased prices of this feedstock and the outcome of farmers losing this practical and dependable feed source? What is the job loss from this? How does this affect the agricultural community as a whole? Where will farmers find alternative feedstock sources? This needs to be included in a cumulative impact analysis as part of a future EIS. The EAW states the project will require approximately 4,300 acres of corn to apply the entire annual production of liquid waste, which translates to needing at least an average of 8,600 acres (over 13 square miles) under contract. The EAW further states the liquid waste by-product will be sold to local farmers to be land applied during the spring and fall at a discount to fertilizer market prices (page 7). If this assumption is correct, what is the cumulative impact to fertilizer sales and other associated businesses in the area? Specifically address the impact to manure as a fertilizer source, the impact this project will have on this commodity, and also how this project will impact the 251 feedlots in Le Sueur County who land apply manure for fertilizer. Who will these producers sell their manure to if this project undercuts this market and where will it be applied? Some counties in this area don’t allow the transport and stockpiling of manure from outside the county – provide analysis regarding the hardship this creates to feedlot owners in Le Sueur County. If this assumption regarding the idea that the liquid waste will be sold “below market prices” is not correct (since contracts for this product have yet to be obtained) please provide information on how this liquid waste product will be disposed of. Also please identify the cumulative impacts in terms of the social and economic environment of selling the liquid manure “below market prices” to local farmers. How does this ‘help’ the agricultural community? This project is in direct conflict with the Goals and Policies of Le Sueur County (specifically goal #1, 2, 3, (objective #1 of goal 4), 5, and 6), and increases the conflicts with agricultural operators. Since this project is not under private ownership, please describe how a government-owned enterprise (public/semipublic entity of municipalities) cumulatively impacts free market through the purchase of feedstocks and the sale of liquid waste as fertilizer

Page 18 of 18
below market prices. Please provide information on the monopolization of these markets in this area and the impacts on private enterprise and how that impacts the environment. Item 30. Other Potential Environmental Impacts. Health Sanitation Concerns: There is a high potential for the attraction of disease vectors, such as birds, vermin, flies, and other insects from the holding ponds and large amounts of putrescible waste material at the site. What mitigation measures will be implemented to control this problem and this potential health concern regarding the potential transmission and control of diseases? A Health Risk Assessment should be conducted as part of the EIS. Emergency Response: What plans will be implemented at the site for emergency response due to operational failure, power outages, weather, spills, and interruptions of feedstock, digester issues, fire or an airplane crash? Include emergency response procedures in the EIS. Item 31. Summary of Issues. As required as part of this item, please provide a summary of issues. “None” doesn’t summarize the issues. Include with the positive declaration on the need for an EIS, the scope of the EIS to include the list of appropriate studies to obtain the lacking information as identified throughout this document. Additional studies should include a Noise Analysis, Air and Odor Analysis, Traffic Analysis, Well Inventory, Groundwater Impact Analysis, Cumulative Impact Analysis (studying environmental, social, and economic impacts) and a Compatible Land Use Analysis. The EIS should also include details regarding a full Mitigation and Monitoring Plan. This mitigation and monitoring plan should include items that address the comments and questions in this document. If any local, state, and federal agency is going to give a permit to allow a project that is this controversial and has this many mitigation procedures for compliance with the law, then the MPCA as the RGU is responsible for making sure the site continues to meet these permit conditions and future compliance with the law. It is irresponsible to issue a permit and not ensure compliance with this permit and even more irresponsible not to specify the exact protocol to follow if permit conditions are NOT satisfied. For the safety, health, and welfare of citizens of this area and the protection of the environment, the MPCA is responsible for ensuring this project continues to be in compliance with local, county, and state rules. Also, please provide information on what criteria the MPCA will use to determine if a “substantial change” has been made in the proposed project or a change has been made in the project’s circumstances, which could affect the potential for significant adverse environmental effects that were not addressed in this existing EAW, therefore would require a new EAW per MN Rules 4410.1000, sub 5. Again, thank you to the MPCA for the work they have put into this project.


Plume from similar facilities Plume from similar facilities
FIGURE 2-1

Plume from similar facilities
FIGURE 2-2

1
March 7, 2012
William Lynott Sent via email: [email protected]
Minnesota Pollution Control Agency
520 Lafayette Road North
St Paul, MN 55155
RE: Comments on the EAW prepared for the Hometown BioEnergy Facility, Le Sueur,
Minnesota, Avant Energy, agent for Minnesota Municipal Power Agency
Dear Mr. Lynott,
Thank you for the opportunity to review and comment on the Environmental Assessment
Worksheet (EAW) prepared for the Hometown BioEnergy Facility proposed by Avant Energy on
behalf of the Minnesota Municipal Power Agency in Ottawa Township, Le Sueur County,
Minnesota.
Please consider the information attached regarding the accuracy and completeness of the
material contained in the EAW which details my concerns regarding the project. I have had the
opportunity to review other’s responses to this EAW (those of F. Ebert, J. Swenson, B. McKay).
I concur with the questions, comments and concerns they have expressed in their individual
responses. As such, I will not be commenting on the any of items addressed in their previous
letters.
As a health professional, I am deeply concerned over Public Health issues not addressed in the
EAW, and as such, request that an EIS be required for this project, including a Health Risk
Assessment by the Minnesota Department of Health.
I am concerned with several aspects of the plant’s design, site layout and proposed operation
with regard to infectious and zoonotic disease potential. In particular, zoonotic diseases
transmitted by vermin, poultry, or their droppings.
I question the effectiveness of the silage bunker design to prevent vermin infestation. Although
my greater concern is with the risks that the daily transportation of 75,840 lbs of potentially
infective chicken litter/manure through downtown Le Sueur to a site within city limits, in close
proximity to existing homes and businesses poses to the general public. Avian Influenza may be
shed and remain infective in chicken manure. The incubation period of Highly Pathogenic Avian
Influenza (HPAI) is 3-7 days. It would not be impossible for infective litter to be transported
from a farm to the digester site up to a week before any clinical signs of disease were detected
within the poultry flock.
I am equally concerned about the health and safety of facility employees, many of who may be
unfamiliar with modes of disease transmission of infectious diseases associated with poultry.
4

They may be equal ly unaware of bio-secur i ty protocols commonly employed at poul tryproduct ion faci l i t ies which are crucial to control the spread of disease, both avian and human.Chicken l i t ter /manure is not a benign substance, and needs to be treated as such. I see nothingin the EAW to indicate to me that the proposer of th is project understands their feedstocks,what they may contain or at t ract , and how their s i te plan, water control , t raf f ic patterns, andvehicle processing protocols should combine to mit igate associated and potent ial heal th r isks.For this reason, along with the many issues presented by others, I respectful ly request that anEnv i ronmenta l lmpact Sta tement be requ i red, inc lud ing a Heal th R isk Assessment by theMinnesota Depar tment o f Heal th .
For recipients of this letter who are unfamilior with the details of the proposed HometownBioEnergy project, you may occess its Environmental Assessment Worksheet (EAW) at the linklisted in Table 10 on page 22.
Sincerely,
Dv-lx"^l" ( h4olQy*' aT*Deborah C. McKay, DVM \JTyrone township resident
cc: Bob Oberle, Mayor, Ci ty of Le SueurCity of Le Sueur City Counci lOttawa Township BoardCity of Le Sueur Planning CommissionAnn Traxler, Director, Le Sueur County Emergency ManagementKathy Brockwav, Le Sueur County Environmental Services,Cindy Shaughnessy, Le Sueur County Publ ic Heal thDr. John King, Execut ive Director, MN Board of Veter inary MedicineDave Frederickson, Commissioner, MN Department of Agr icul tureDr. W. Hartmann, Execut ive Director, MN Board of Animal HealthDr . Edward Ehl inger , Commiss ioner , MN Depar tment o f Heal thDr. Ri ta Messing, Si te Assessment & Consultat ion, Environ. Health Divis ion, MDHDr. Bruce Alexander, Director, Upper Midwest Agr icul tural Safety & Health CenterDr. Joni Scheftel , Sr Epidemiological Supervisor, Zoonot ic Diseases, MDH

3
ATTACHMENTS:
Table 1. Diseases Transmitted by Rodents
Table 2. Infectious or Parasitic Diseases Affecting Chickens
Table 3. Infectious Diseases Affecting Turkeys
Table 4. Helminths and Cestodes of Poultry
Table 5. Key Changes in Highly Pathogenic Avian Influenza
Table 6. Professional and Ancilliary Training Dr. McKay has Received Relative to Avian
Diseases, Foreign Animal Diseases or Emergency Management & Response
Table 7. Effect of Chemical Factors on the Survival of Avian Influenza Virus H5N1 subtype.
Table 8. Effect of Soap, Detergent and Alkali on the Survival of Avian Influenza Virus H5N1
Subtype
Table 9. Effect of pH on the Survival of Avian Influenza Virus H5N1 subtype
Table 10. References

4
DETAILED QUESTIONS, COMMENTS & CONCERNS BY ITEM AND TOPIC
6b. [Description] Feedstock Unloading and Pre-treatment
EAW p5 ¶3 “The feedstock trucks will be rinsed with well water to clean the vehicle…”
Tables 2 through 4 (pp 12-16) list infectious and parasitic diseases of chicken and turkeys.
Many infectious organisms, some zoonotic (transmissible and capable of causing disease in
humans) remain infective in poultry litter. The EAW describes “cleaning” of the feedstock
transport vehicles.
Avian Influenza virus is inactivated at temperatures of 56C. Will the wash water be at last 56C?
I question the volume of water specified for this purpose; 100,000 gallons over a year’s time is
about 35 gallons per vehicle wash. This does not appear to be sufficient and should be looked
at more closely. The digester process operates in the thermophilic temperature range of 50C.
It is unclear to me whether the digestion process itself, will be sufficient to inactivate the virus
in the effluent or digestate. Have their been any studies on the survivability of Avian Influenza
within an anaeorbic digester?
Tables 7 and 8 (p 20) list the effect of chemical factors, soap, detergent and alkali on the
survival of Avian Influenza Virus H5N1 subtype. Table 9 (p 21) illustrates that the virus is stable
within the pH range that the digester will be operating within. The virus is capable of surviving
in water over a relatively wide temperature range.
I am concerned that the EAW does not properly address the topic of biosecurity with regard to
potentially infectious and transmissible disease organisms within their feedstocks. The EAW
contains no protocol or provision for disinfecting feedstock transport vehicles.
EAW p5 ¶7 “A horizontal storage bunk … store the silage material…”
The EAW states that horizontal storage bunks with impermeable covers will be utilized to store
sweet corn silage. The covers will not be placed until the silage pile is full. I have concerns,
both before and after the covers are placed as to whether this design will adequately prevent
rats and mice from gaining access to the feedstock. If vermin are not completely kept out, the
site could become a reservoir for rodent-transmitted infectious disease for the city of Le Sueur
and surrounding countryside.

5
11. Fish, Wildlife, and Ecologically Sensitive Resources.
The project is just over 1 mile from the Minnesota River, an avian flyway. Wild birds serve as a
reservoir for Avian Influenza and contributed to the rapid spread of HPAI throughout Europe in
recent years.
Any conditions that could attract wild birds to the digester site could increase the chance of
virus transmission. Attractants such as exposed silage bunker, tracked or spilled feedstocks
(silage, vegetable waste, chicken litter), insects, and access to open water. Trucks and people
movement may serve as fomites, increasing the chances of Avian Influenza being easily spread
to wild populations.
Whether the virus source is the wild birds, being attracted to the site by feedstocks, insects or
open water, or whether the virus source is the chicken manure/litter being transported to the
site, the possibility for direct or indirect avian-to-avian transmission exists.
13. Water Use
The EAW did not address the possibility of having to add water to the silage during filling of the
horizontal bunker to compensate for sweet corn that was harvested with too low of a moisture
content. This will affect the project’s well-water usage beyond the issues and inaccuracies
mentioned in other responders’ comment letters.
Harvesting sweet corn silage at moistures that are too low will result in poor packing,
inadequate air exclusion, poor fermentation, molding and heating. This will mean higher dry
matter losses, greater spoilage and poor bunk life. Low-moisture corn silage also has lower
starch and fibre digestibilities. Water can be added to bring moisture concentration to at least
60%. Water uniformly mixed with the forage at roughly 7 gallons of water per ton prior to
ensiling will increase the moisture content of silage by about 1%.
The EAW states storage of 15,000 tons (dry basis) of silage. For example, if you need to raise
the mosture level 10%, you will need to add 70 gallons of water per ton, requiring an additional
1,050,000 gallons of well water (15,000 x 7 x 10 = 1,050,000 gallons or 4,357 tons).
However, as was stated in B. McKay’s comment letter, Case 1, 2b (iii), using the midrange
mixture of feedstocks stated in the EAW, sweet corn silage would be 57.5% of the mixture, or
25,875 tons (dry basis). Raising this amount by 10% moisture would require 1,811,250
additional gallons of fresh well water (25,875 x 7 x 10 = 1,811,250 gallons or 7,516 tons).

6
18. Water Quality – Wastewater. [ Silage Bunk Storage ]
18a. Rinse water from cleaning feedstock delivery trucks (non-silage) will be incorporated into
the pretreatment process with the feedstock. Concerns over the “cleaning” method have been
previously addressed in 6b above.
…non-permeable covers will be placed upon each of the piles, providing
protection of the silage and odor control. The covers would be rolled back to provide access…
throughout the year…” What happens to “odor control” when the covers are rolled back? How
often will the covers be rolled back? “Throughout the year” does not quantify this activity. I
would surmise that the covers will be removed daily for access to the silage pile. This is not a
“odor control” or “barrier” against vermin infestation.
The silage storage design uses best management practices by incorporating covered storage
and drainage for contact and non-contact stormwater. The pile’s exposed surface area and
odor potential are minimized compared with typical silage storage practices. What is a
“typical” silage storage practice. Typical silage storage does not cover 5.5 acres. Typical silage
storage is not within city limits. Typically, the storage of silage on a rural farm, does not involve
trucking thousands of tons of silage great distances.
Additionally, problems can arise with sweet corn silage if it is not harvested with the correct
moisture content. Harvesting at moisture levels above 70% (too wet) will result in seepage and
a very undesirable clostridia fermentation. Clostridia bacteria are very inefficient and convert
forage sugars and organic acids into butyric acid, carbon dioxide and ammonia. This silage will
have high levels of foul-smelling butyric acid, with a higher pH, high dry matter losses, and poor
feed quality. Laboratory fermentation profile analysis should be performed to determine
relative amounts of lactic, acetic, butyric and propionic acids, all of which affect quality.
Seepage results in a loss of nutrients and can be harmful to the environment. Very wet or
frozen silage can be difficult to handle in the winter. What techniques would be used to access
a frozen silage? This could be another source of noise not currently addressed in the EAW.
20b. Solid Wastes, Hazardous Wastes, Storage Tanks.
If any shipments of chicken manure or litter cannot be received into the normal process due to
plant shutdown, malfunction, emergency, etc.; what contingency plans will be implemented to
prevent any occurrence of temporary outdoor storage of chicken manure/litter. Any outdoor
storage of chicken litter should be considered storage of hazardous waste and be strictly
forbidden.

7
24. Odor, Noise & Dust.
I take issue with the statement in the EAW that implies that [this] anaerobic digester (AD) will
reduce odors. This may be true for AD’s sited at a Concentrated Animal Feeding Operation
(CAFO), but when the most objectionable byproducts of a CAFO and putrescible byproducts
from food processing facilities are transported variable distances to be concentrated near a
population center, odors are, in fact, being produced at this location. This EAW statement is
misleading at best and blatantly false at worst and must be corrected. Only AD’s located at the
farm site where the feedstock or manure (i.e. source of odors) is being generated can claim
that their AD reduces odors.
29. Cumulative Impacts:
Agricultural Commodities
The EAW states that the digestion process will utilize agricultural and food processing wastes.
The term “wastes” is misleading. There are no “wastes” in modern agricultural practices today.
A more appropriate term would be agricultural byproduct. Sweet corn silage and other food
processing byproducts are commonly fed to livestock. Redirecting these “wastes” from their
current use puts undue pressure on local agricultural producers to locate alternative products.
30. Other Potential Environmental Impacts.
Vermin Infestation of Silage Bunker.
Worldwide, rats and mice spread over 35 diseases (Table 1, p 11). These diseases can be
spread to humans directly, through handling of rodents, through contact with rodent feces,
urine, or saliva, or through rodent bites. Diseases carried by rodents can also be spread to
humans indirectly, through ticks, mites or fleas that have fed on an infected rodent. Due to the
attractive nature that the silage bunker poses to field vermin, a Health Risk Assessment should
be conducted as part of the EIS.
Infectious or Parasitic Diseases Affecting Chickens (other than Avian Influenza)
Poultry manure and litter is not an inocuous material. Dozens of bacterial, viral, fungal, and
parasitic organisms may be present in poultry droppings. See Tables 2 through 4 (pp 12-16),
Diseases and parasites affecting poultry.
Avian Influenza – a global pandemic concern.
Avian influenza viruses are now widely recognized as important threats to agricultural
biosecurity and public health, and as the potential source for pandemic human influenza
viruses. Human infections with avian influenza viruses have been reported from Asia (H5N1,
H5N2, H9N2), Africa (H5N1, H10N7), Europe (H7N7, H7N3, H7N2), and North America (H7N3,
H7N2, H11N9). Direct and indirect public health risks from avian influenzas are not restricted to
the highly pathogenic H5N1 “bird flu” virus, and include low pathogenic as well as high
pathogenic strains of other avian influenza virus subtypes, e.g., H1N1, H7N2, H7N3, H7N7, and
H9N2.

8
Research has shown that the 1918 Spanish Flu pandemic was caused by an H1N1 influenza virus
of avian origins, and during the past decade, fatal human disease and human-to-human
transmission has been confirmed among persons infected with H5N1 and H7N7 avian influenza
viruses. Our ability to accurately assess and map the potential economic and public health risks
associated with avian influenza outbreaks is currently constrained by uncertainties regarding
key aspects of the ecology and epidemiology of avian influenza viruses in birds and humans,
and the mechanisms by which HPAI viruses are transmitted between and among wild birds,
domestic poultry, mammals, and humans. I strongly urge a Health Risk Assessment as part of
an Invironmental Impact Statement be required for the Hometown BioEnergy project, to
adequately address issues of public health and safety related to Avian Influenza.

9
Key factors needing further investigation from a risk management perspective include
identification of the driving forces behind the emergence and persistence of HPAI viruses within
poultry populations, and a comprehensive understanding of the mechanisms regulating
transmission of HPAI viruses between industrial poultry farms and backyard poultry flocks.
More information is needed regarding the extent to which migratory bird populations
contribute to the transnational and transcontinental spread of HPAI viruses, and the potential
for wild bird populations to serve as reservoirs for HPAI viruses.
Possible mechanisms for the international and transcontinental spread of H5N1 include animal
feeds containing unsterilized poultry by-products or poultry litter.
There is a need to determine risk factors associated with the extent of direct human involve-
ment in the spread and proliferation of avian influenza viruses through commercial supply
chain and transportation networks, and specific risk factors associated with domestic and
international trade in live poultry, captive wild birds, poultry food products, (meat, eggs),
poultry by-products (feathers, poultry meal), poultry manure, and poultry litter.
Environmental exposure to poultry viruses through swimming or bathing in contaminated
water, and exposure to poultry manure fertilizer, have been identified as possible risk factors
for human infection with the H5N1 avian influenza.
A single feed supplier was linked to seven of nine sites in Israel affected by an outbreak of
H5N1 during March 2006, whereas the spread of H5N1 among commercial poultry farms in
Sudan has been linked to trucks used for the collection and transport of poultry manure.
The continuing evolution and proliferation of highly pathogenic H5N1 avian influenza virus
strains across an area spanning nearly half the globe increases the likelihood of a reassortment
with a human influenza virus or another avian influenza virus into a genetic configuration that
would enhance the virulence and infectivity of this virus for humans and other mammals, and
expand the potential efficiency of transmission between poultry, wild birds, humans, and other
animals.
Although highly pathogenic H5N1 strains constitute the most important avian influenza threat
in terms of economic impacts and health risks to poultry, humans, and wildlife, we must not
allow the current focus on H5N1 strains to blind us to the potential public health risks
presented by both low-pathogenic and high pathogenic strains of other avian influenza virus
subtypes. Although most known instances of serious human disease from avian influenza
infections have been associated with avian influenza virus strains that are highly pathogenic in
poultry, low-pathogenic avian influenza strains of H5N2, H7N3, H7N2, H7N7, and H9N2 viruses
have demonstrated the ability to infect humans, and could potentially acquire the ability to
cause serious systemic disease in humans through stochastic mutation, recombination, or
reassortment.

10
EAW p30 Attachment 1. Project Location
The proposed site is within 1.2 miles of the Minnesota River. Minnesota sits in the path of
many avian flyways, and migratory birds pass over the state in great numbers each fall. The
Mississippi Flyway is used by almost every waterfowl species leaving central Canada and
heading south toward the tier of states along the Gulf Coast. Some birds, such as tundra swans,
wing across Minnesota as they travel southeast from Alaska to the Eastern Seaboard and coast
of North Carolina. Lake Superior--an open-water obstacle for many bird species--funnels
raptors and warblers over Minnesota. A state with over 10,000 lakes is home, both temporary
and permanent, to many species of birds. The project includes open water as storm water
ponds, and trench drains which may attract insects, both of which attract wild birds.
Figure 1. Major Migratory Bird flyways, Human Distribution of Avian Influenza Infections.
Final Comment
Due to the many unknowns regarding survival capacity of a multitude of pathogens likely to be
present in the feedstocks or introduced to the site by vermin or wild birds, much more study
and critical analysis in light of public health concerns are warranted for this project.
Without detailed information of the digestion process itself, actual temperatures, pH levels and
holding times of different stages of the process, it is impossible to make an educated and
reliable assessment of what the potential risk of this project would be to both the surrounding
agricultural and human community in the event that Avian Influenza were introduced into its
process. The ability of avian influenza viruses to mutate with potential for direct person-to-
person transmission warrants detailed analysis of Hometown BioEnergy’s digester design, with
regard to pathogen survival and propagation. This study should look at all aspects of the
process including virus survivability in the digester, biofilters, effluent holding ponds, and
digestate.

11
Table 1. DISEASES TRANSMITTED BY RODENTS
Diseases transmitted directly from rodents to humans include:
• Hantavirus Pulmonary Syndrome
• Hemorrhagic Fever with Renal Syndrome
• Lassa Fever
• Leptospirosis
• Lymphocytic Chorio-meningitis (LCM)
• Omsk Hemorrhagic FeverPlague
• Rat-Bite Fever
• Salmonellosis
• South American Arenaviruses
• Tularemia
Diseases transmitted indirectly from rodents to humans include:
• Babesiosis
• California Serogroup Viruses
• Colorado Tick Fever
• Cutaneous Leishmaniasis
• Human Granulocytic Anaplasmosis
• Lyme Disease
• Murine Typhus
• Omsk Hemorrhagic FeverPowassan Encephalitis
• Scrub Typhus
• Rickettsialpox
• Relapsing Fever
• Rocky Mountain Spotted Fever
• Sylvatic Typhus
• Western Equine Encephalitis
Source: Centers for Disease Control & Prevention, http://www.cdc.gov

12
Table 2. INFECTIOUS OR PARASITIC DISEASES AFFECTING CHICKENS
• Bloodborne Organisms
o Aegyptianellosis
o Atoxoplasmosis
o Filariasis
o Haemoproteus Infection
o Leucocytozoonosis
o Plasmodium Infection
• Other Bloodborne Organisms
o Trypanosomes
o Borreliae
o Rickettsia-like basophilic bodies resembling Pirhemocyton Babesia spp.
o Haemogregarina and Hepatozoon are protozoan parasites, Zoites of other
sporozoa (eg, Toxoplasma, Sarcocystis ) and organisms normally in the digestive
tract (eg, trichomonads, coccidia, histomonads) may be transiently found in
blood.
• Avian Influenza (type A orthomyxoviruses) *
*Discussed in more detail elsewhere
• Chicken anemia virus (CAV)
• Adenoviruses (12 serotypes)
• Candidiasis (Candida albicans)
• Necrotic enteritis (Clostridium perfringens)
• Cryptosporidiosis
• Coccidiosis (Eimeria tenella, E. necatrix, E. acervulina, E. brunetti, E. maxima, E. mitis,
E. praecox, E. hagani, and E. mivati)
• Avian rotaviruses (serotypes A-D).
Group A rotaviruses share a common group antigen with mammalian rotaviruses.
• Trichomoniasis (Trichomonas gallinae)
• Ulcerative Enteritis (Clostridium colinum)

13
Table 2. INFECTIOUS OR PARASITIC DISEASES AFFECTING CHICKENS (cont.)
• Campylobacteriosis
Campylobacteriosis is a significant enterocolitis of humans. C. jejuni has been
demonstrated in all areas of commercial poultry production. Commercial poultry and
free-living birds are natural reservoirs of the thermophilic campylobacters (C. jejuni , C.
coli , and C. lari) and other poorly defined species. The organism has been isolated
from numerous birds, including Columbae and domestic and free-living Galliformes and
Anseriformes. Environmental contamination is the source of infection for poults, chicks,
and ducklings. Litter can remain infective for long periods, subject to at least a 10%
moisture level and neutral pH.
• Avian Chlamydiosis (Chlamydophila psittaci, 8 serotypes)
Avian chlamydiosis is a zoonotic disease that can affect people following exposure to air-
or dustborne organisms when infected birds are in flocks or processed, or when
organisms are shed from the digestive or respiratory tracts of infected birds.
• Avian Nephritis Virus (ANV, an astrovirus)
• Avian Spirochetosis (Borrelia anserina)
• Colibacillosis (Escherichia coli)
Large numbers of E.coli are maintained in the poultry house environment through fecal
contamination.
• Enterococcosis (formerly Lancefield group D streptococci)
Enterococcus spp are considered normal microflora of the intestinal tract of poultry and
other birds. A high percentage of ready-to-eat poultry products are contaminated with
Enterococcus spp.
• Streptococcosis
(including Lancefield antigenic serogroup C, S. zooepidemicus/S. gallinarum)
• Erysipelas (Erysipelothrix rhusiopathiae)
Mammals are also affected; eople usually become infected when the organism enters
through cuts in the skin. There have been no reports of people becoming infected by
the oral route. Erysipeloid in people may be a localized or a septicemic and occasionally
fatal infection.
• Fowl Cholera (Pasteurella multocida)
Rodents are often carriers of P. multocida.
• Helminthiasis (Nematode and cestode infections; see attached Table 4, p X)
• Histomoniasis (Histomonas meleagridis)
• Infectious Bursal Disease (birnavirus, IBDV)

14
Table 2. INFECTIOUS OR PARASITIC DISEASES AFFECTING CHICKENS (cont.)
• Listeriosis (Listeria monocytogenes)
In workers at poultry-processing plants, conjunctivitis due to Listeria monocytogenes
has been linked to handling of apparently normal but infected chickens. Human
infections have also resulted from consumption of contaminated poultry or poultry
products. Abortions and congenitally infected babies have been associated with
handling of L monocytogenes -positive birds or those that have died with the disease.
• Malabsorption Syndrome (mycotoxins, enteroviruses, and reoviruses identified as
potential etiologic factors)
• Mycoplasmosis (M. gallisepticum, M. iowae, M. meleagridis, M. synoviae)
• Mycotoxicoses
Mycotoxicosis is a disease caused by a toxin produced by a fungus. In poultry, this
usually results when fungi grow in grains and feeds. Hundreds of mycotoxins have been
identified and many are pathogenic. Mycotoxins may have additive or even synergistic
effects with other mycotoxins, infectious agents, and nutritional deficiencies. Many are
chemically stable and maintain toxicity over time.
• Newcastle Disease (NDV, avian paramyxovirus-1)
Newcastle disease is an acute viral disease of domestic poultry and many other bird
species. Occurrence of a virulent form of the disease is reportable and may result in
trade restrictions. Newcastle disease viruses can produce a transitory conjunctivitis in
humans.
• Other Paramyxovirus (avian paramyxovirus-2 thru 9) Infections
• Omphalitis (opportunistic bacteria such as coliforms, staphylococci, Pseudomonas spp,
and Proteus spp)
• Salmonelloses (Salmonella pullorum, S. gallinarum, and S. arizonae)
• Staphylococcosis (Staphylococcus aureus)
• Tuberculosis (Mycobacterium avium var avium)
• Ectoparasites (bedbugs, fleas, biting midge, black fly, pigeon fly, fowl ticks, lice, chicken
mite, common chigger, depluming mite, feather mite, northern fowl mite, scaly leg mite,
subcutaneous mite, tropical fowl mite, turkey chigger, mosquitos)
• Fowlpox (avipoxvirus, family Poxviridae)
• Gangrenous Dermatitis
(Clostridium septicum, Clostridium perfringens type A, and Staphylococcus aureus)

15
Table 2. INFECTIOUS OR PARASITIC DISEASES AFFECTING CHICKENS (cont.)
• Viral Arthritis (Reoviral infection, Tenosynovitis)
• Avian Encephalomyelitis (picornavirus)
• Botulism (Clostridium botulinum exotoxin)
• Viral Encephalitides
(aborviruses: EEE, WEE, HJ, Israel turkey meningoencephalitis virus, WNV)
• West Nile Virus Infection in Poultry
• Aspergillosis
(Brooder pneumonia, Mycotic pneumonia, Pneumomycosis)
• Avian Pneumovirus (Turkey rhinotracheitis, Avian rhinotracheitis, Swollen head
syndrome)
• Bordetellosis (Bordetella avium)
• Infectious Bronchitis (coronavirus IBV)
• Infectious Coryza (Haemophilus paragallinarum (gallinarum))
• Infectious Laryngotracheitis (herpesvirus ILT)
Table 3. ADDITIONAL INFECTIOUS DISEASES AFFECTING TURKEYS
(Many of the diseases of chickens listed above also affect turkeys.)
• Coccidiosis (Eimeria adenoeides, E. dispersa, E. gallopavonis, and E. meleagrimitis)
• Coronavirus
• Hexamitiasi
• Hemorrhagic Enteritis of Turkeys (Siadenovirus spp)
• Viral Hepatitis of Turkeys

Nematode HostIntermediate Host
or Life CycleOrgan Infected Pathogenicity
Ta
ble
4
Amidostomum anseris Duck, goose, pigeon Direct Gizzard Severe
Ascaridia dissimilis Turkey Direct Small intestine Moderate
Ascaridia galli Chicken, turkey, duck, quail Direct Small intestine Moderate
Capillaria caudinflata
(columbae)
Chicken, turkey, duck, game birds,
pigeon
Earthworms Small intestine Moderate to severe
Capillaria contorta (annulata) Chicken, turkey, duck, game birds None or earthworms Mouth, esophagus, crop Severe
Capillaria obsignata Chicken, turkey, goose, pigeon, quail Direct Small intestine, ceca Severe
Cheilospirura hamulosa Chicken, turkey, game birds Grasshoppers, beetles Gizzard Moderate
Cyathostoma bronchialis Turkey, duck Direct or earthworm Trachea Severe
Cyrnea colini Turkey, game birds Cockroaches Proventric ulus Mild
Dispharynx nasuta Chicken, turkey, game birds, pigeon Sowbugs Proventric ulus Moderate to severe
Gongylonema ingluvicola Chicken, game birds Beetles, cockroaches Crop, esophagus,
proventriculus
Mild
Heterakis gallinarum Chicken, turkey, duck, game birds Direct Ceca Mild, but transmits agent
of histomoniasis
Heterakis isolonche Quail, duck, pheasant Direct Ceca Severe
Ornitho- strongylus
quadriradiatus
Pigeon, dove Direct Small intestine Severe
Oxyspirura mansoni Chicken, turkey, guinea fowl, quail Cockroaches Eye Moderate
Strongyloides avium Chicken, turkey, quail, goose Direct Ceca Moderate
Subulura brumpti Chicken, turkey, duck, game birds Earwigs, grasshoppers,
beetles, cockroaches
Ceca Mild
Syngamus trachea Chicken, turkey, pheasant, quail None or earthworm Trachea Severe
Tetrameres americana Chicken, turkey, duck, game birds,
pigeon
Grasshoppers,
cockroaches
Proventri culus Moderate to severe
Trichostrongylus tenuis Chicken, turkey, duck, game birds,
pigeon
Direct Ceca Severe
Cestodes HostIntermediate Host
or Life CycleOrgan Infected Pathogenicity
Choanotaenia infundibulum Chicken House flies Upper intestine Moderate
Davainea proglottina Chicken Slugs, snails Duodenum Severe
Metroliasthes lucida Turkey Grasshoppers Intestine Unknown
Raillietina cesticillus Chicken Beetles Duodenum, jejunum Mild
Raillietina echinobothrida Chicken Ants Lower intestine Severe, nodules
Raillietina tetragona Chicken Ants Lower intestine Severe

17
Table 5.
Key Observed Changes in Epidemiological Characteristics of the H5N1 HPAI virus.
1996 pathogenic H5N1 outbreak recorded from domestic geese in southern China (Webster
et al. 2006)
1997
duck H5N1 reassorts with quail H9N2, becomes highly pathogenic strain (Guan et al.
2000); acquires capability for causing fatal disease in humans, and human-to-human
transmission (Tam 2002)
1999
NS genes of post 1998-strains enhance virus replication in mammalian cells (Twu et al.
2007); increased lethality in mammals demonstrated by laboratory trials in mice (Guan
et al. 2002)
2000 infectivity for domestic ducks increased, although domestic ducks remain asymptomatic
carriers (Li et al. 2004)
2001
increase in infection duration and length of virus shedding period in domestic ducks
(Hulse-Post et al. 2005); increased virulence in mammals (Lipatov et al. 2003); infections
among swine discovered in Fujian, China (Shu et al. 2006)
2002
acquires capability to cause fatal disease in wild and domestic ducks (Sturm-Ramirez et
al. 2004); further increased infectivity to mammals (Chen et al. 2004); fatal infections of
tigers and cats recorded in China (Xia et al. 2003).
2003 decreased environmental stability in water (Brown et al. 2007); fatal infections of tigers
and leopards in Thailand (Keawcharoen at al. 2004)
2004
further increased lethality in mammals and humans (Maines et al. 2005); case rate
mortalities of 70-80% recorded for confirmed human H5N1 cases in Vietnam and
Thailand (Tran et al. 2004, Areechokchai at al. 2006)
2005
oseltamivir resistant strain emerges in Vietnam (de Jong et al. 2005);
amantadine/rimantadine resistant H5N1 strain recorded in northern China (He at al.
2007); H5N1 infections of village swine documented in Indonesia (Cyranoski 2005)
2006
vaccine-resistant “Fujian strain” attains dominance in China (Smith et al. 2006); first
human H5N1 cases reported from Europe, Central Asia, Africa, and the Middle East
(Turkey, Iraq, Azerbaijan, Egypt, Djibouti: WHO 2008)
2007 oseltamivir-resistant strain emerges in Egypt (WHO 2007); H5N1 infections detected
among vaccinated poultry in Egypt (WHO 2008a)

18
Table 6. Professional and Ancilliary Training Dr. McKay has Received
Relative to Avian Diseases, Foreign Animal Diseases or
Emergency Management & Response
Date Course Course Title Agency Sponsor / School
01/24/07 ICS100 Intro to Incident Command System US OHS, FEMA
01/25/07 ICS200 ICS Single Resource & Initial Incidents US OHS, FEMA
01/27/07 ICS700 Intro to National Incident Mgmt System US OHS, FEMA
01/28/07 ICS702 NIMS Public Information Systems US OHS, FEMA
01/28/07 ICS703 NIMS Resource Management US OHS, FEMA
02/03/07 Avian Influenza Preparedness, Heidi Kassenborg, DVM, MPH
MVMA Annual Convention Disease Investigation and
Emergency Response Director,
MN Dept. of Agriculture
02/03/07 Zoonotic Disease Prevention Joni Scheftel, DVM, MPH, ACVPM
MVMA Annual Convention MN Department of Health
02/18/07 Mass Dispensing U of M School of Public Health
03/24/09 ICS300 Intermediate ICS for Expanding Incidents US OHS, USDA
03/25/09 ICS300 Intermediate ICS for Expanding Incidents US OHS, USDA
03/26/09 ICS300 Intermediate ICS for Expanding Incidents US OHS, USDA
04/28/09 Tri-State Veterinary Disaster Response US OHS, FEMA, MVRC
Conference (various presenters)
04/29/09 Tri-State Veterinary Disaster Response US OHS, FEMA, MVRC
Conference (various presenters)
05/04/11 Intro to National Animal Health Emer- USDA, APHIS (online)
gency Response Corp
08/24/11 Foreign Animal Disease Emergency HSEM, MDA, MBAH, and
Planning Workshop Le Sueur County Dept of
Emergency Management

19

20
Table 7. Effect of chemical factors on the survival of avian influenza virus H5N1 subtype.
Table 8. Effect of soap, detergent and alkali on the survival of avian influenza virus H5N1 subtype.

21
Table 9. Effect of pH on the Survival of Avian Influenza Virus H5N1 subtype

22
Table 10. References
*Hometown BioEnergy Environmental Assessment Worksheet URL:
http://dl.dropbox.com/u/3532752/_PublicLinks/120207_MMPA_Hometown_BioEnergy_EAW.zip
Anaerobic Digestion of farm and food processing residues GoodPractice Guidelines. British
Biogen, London. URL: http://www.mrec.org/biogas/adgpg.pdf
Avian H5N1 in Minnesota Birds. May 2010. Minnesota Department of Health Fact Sheet.
Avian Influenza (Bird Flu): Agricultural and Wildlife Considerations. January 2012. Center for
Infectious Disease Research & Policy, Academic Health Center, University of Minnesota. URL:
http://www.cidrap.umn.edu/cidrap/content/influenza/avianflu/biofacts/avflu.html
Avian Influenza. USGS National Wildlife Health Center. URL:
http://www.nwhc.usgs.gov/disease_information/avian_influenza/
Bagg, J. and G. Stewart. August 2007. Harvesting Corn Silage at the Right Moisture. AGDEX
120/50.
Benitez, M. A. Mutant Bird Flu in Poultry Delivered on Wild Wings. Sept 22, 2011. The
Standard (newspaper).
Caron, A., M. De Garine-Wichatitsky, N. Gaidet, N. Chiweshe, and G. S. Cumming. 2010.
Estimating dynamic risk factors for pathogen transmission using community-level bird census
data at the wildlife/domestic interface. Ecology and Society 15(3): 25.
Centers for Disease Control and Prevention, National Center for Immunization and Respiratory
Diseases (NCIRD)
Cumming, G. S. 2010. Risk mapping for avian influenza: a social–ecological problem. Ecology
and Society 15(3): 32.
Dudley, J. P. 2008. Public health and epidemiological considerations for avian influenza risk
mapping and risk assessment. Ecology and Society 13(2): 21.
EMS, Public Safety, and First Responders: Avian Influenza Fact Sheet. June 2006. Minnesota
Department of Health.
Flory Gary A, Eric S. Bendfeldt and Robert W. Peer. In-House Composting as a Rapid Response
to Avian Influenza, BioCycle May 2006, Vol. 47, No. 5, p. 38

23
Table 10. References (continued)
Flory Gary A. and Robert W. Peer. Verification of Poultry Carcass Composting Research through
Application during Actual Avian Influenza Outbreaks. Institute for Laboratory Animal Research
Journal 2002. Vol. 51, No. 10.
Infection Control Guidance for EMS, First Responders, Fire, and Law Enforcement. September
2010. Infectious Disease Prevention and Control Division, Minnesota Department of Health.
Information on Avian Influenza. Centers for Disease Control and Prevention. URL:
http://www.cdc.gov/flu/avianflu/
Minnesota Department of Health H5N1 Avian Influenza (“Bird Flu”) URL:
http://www.health.state.mn.us/divs/idepc/diseases/flu/avian/index.html
Mueller, J. P. and J. T. Green. North Carolina State University and W. L. Kjelgaard, Pennsylvania
State University. National Corn Handbook, NCH-49.
Muhammad Akbar Shahid1, et al. Avian influenza virus (H5N1); effects of physico-chemical
factors on its survival. Virology Journal 2009, 6:38. doi:10.1186/1743-422X-6-38
Peterson, A. T., and R. A. J. Williams. 2008. Risk mapping of highly pathogenic Avian Influenza
distribution and spread. Ecology and Society 13(2): 15. [online]
Rice, Eugene W. et al. Chlorine Inactivation of Highly Pathogenic Avian Influenza Virus (H5N1).
Emerging Infectious Diseases. Vol. 13, No. 10, October 2007. Water Infrastructure Protection
Division, National Homeland Security Research Center, US Environmental Protection Agency,
Cincinnati, Ohio.
Si, Y., T. Wang, A. K. Skidmore, W. F. De Boer, L. Li, and H. H. T. Prins. 2010. Environmental
factors influencing the spread of the highly pathogenic avian influenza H5N1 virus in wild birds
in Europe. Ecology and Society 15(3): 26.
Stirling, A. C., and I. Scoones. 2009. From risk assessment to knowledge mapping: science,
precaution and participation in disease ecology. Ecology and Society 14(2): 14.

March 6, 2012 Mr. William J. Lynott Sent via email: [email protected] Minnesota Pollution Control Agency 520 Lafayette Road North St. Paul. MN 55155-4194 Re: Comments on the Environmental Assessment Worksheet prepared for the Hometown Bioenergy Facility to be located in Le Sueur, MN. Mr. Lynott, Thank you and the MPCA for the opportunity to comment on the above noted EAW. I am a citizen and registered voter in the city of Le Sueur for over 30 years. Recently I volunteered for and have been appointed to the Le Sueur Planning Commission. In that capacity, I have attended one recent Planning Commission meeting. I say this complete disclosure. I have 50 years of mechanical and process engineering experience, so while I am not an expert, I do have some relevant experience in new process development, site development and working with local and state agencies. Attachment 4, Site Plan shows proposed grade elevations. Please note that the Silage Storage Area #2 has an elevation of 852, the same elevation as the driveway directly north of this area. This will allow any runoff water and/or silage liquid to leave silage area 2 and flow into the driveway. The driveway directly east of this location has an elevation of 850, 2 feet lower. In my opinion, any rain or melting snow will run to the low point (elevation 850) and carry silage liquids with it. Is this a violation of the requirements to contain pollutants? In addition, the wheeled vehicles referenced in the EAW for transferring silage from long term storage to the process or to Silage Storage Area # 2 will carry silages liquid or juices out to Area #1 onto all driveways. This will create and maintain a dangerous, slippery surface for vehicle and pedestrian traffic. It will also create a potential ground water pollution situation. Along with that it will create a constant source of odor. Without proper driveway cleaning and maintenance, silage juices could be transferred to the adjacent public road surfaces. Silage juices mat also flow off the driveways onto the landscaped areas, causing additional ground water contamination. These points also apply to moving silage into and out of Silage Storage Area # 1. Trucks empting silage onto the slab will track the silage liquid (juices) onto most if not all the driveways on site. The trucks must be scaled before and after unloading. This will track juices onto the truck scale, which will spread the juices to all trucks. This will create and maintain a dangerous, slippery surface for vehicle and pedestrian traffic. It will also create a potential ground water pollution situation. Along with that it will create a constant source of odor. Without proper driveway cleaning and maintenance, silage juices could be transferred to the adjacent public road surfaces. Attachment 4, Site Plan shows two “Liquid By-Product Storage Areas”. The EAW states that this material will by transferred to trucks and removed from the site for use as a “by-product” (see page 7). There is no mention of where or how this truck loading will take place. How will spills at or during loading be managed? How will odors released by the loading process be managed? Will the trucks track spill “by-product” onto all the driveways onsite? This will create and maintain a dangerous, slippery surface for vehicle and pedestrian traffic. It will also create and maintain a surface for ground water pollution. Along with that it will create a constant source of odor.
5

Without proper driveway cleaning and maintenance, By-product could transfer to the adjacent public road surfaces. All of the above noted situations will be compounded by winter weather conditions, snow, sleet, sub-freezing temperatures, melting and re-freezing and frost. How does the proposer plan to handle the above noted situations in these weather conditions? Attachment 7 Future Land Cover, shows 3 dots in the southwest corner of the site. Next to the dots are the words “Material Storage 0.7 acres”. Attachment 4 Site Plan, shows these same three dots noted as “Biogas”. What are these dots? Methane biogas or material storage? If they are material storage, what material(s) is stored in them? If they are methane, does this location and these storage vessels meet NFPA regulations? How much methane will these vessels hold and at what pressure? Has the local fire marshal and building inspector approved this location? The first project proposed two silage storage areas of approximately equal size, sharing a common wall. Attachment 4 shows one very large silage storage area and one driveway for trucks. The EAW offers no explanation of how the covers will be position, secured and moved to allow for filling and empting. The proposer should explain how the filling will be completely and adequately covered to control odor, animal attraction and maintain silage quality, and then uncovered enough to receive more silage or remove a truckload for production. Will the pile be recovered before the truck leaves the area? Is a cover this large (and heavy) easily moved 20 time a day or more by one or two employees? Or will the cover be positioned so it does not have to be moved any more that day? Or once a week? Or once a month? So much for odor and animal control. Page 7, Section 6. b., By-Product Production and Use. Solids from the “slurry-like residual mixture” will be processed thru a screw press to remove “digestate”, leaving a wet solid mixture. This will be placed on a belt dryer and dried to about 10% moisture. These dried solids will be sold as boiler fuel. This dry material will be a fine, dry powder, very similar to dried sewage sludge. There is no mention of any dust control system for the material handling, storage system and loadout systems. Why? This dust can be very explosive, under the right conditions. It can be dangerous to the workers health. Is MPCA concerned about the health and safety of the workers, the neighbors and the city of Le Sueur? On pages 6 & 7, the EAW refers to the Cummins engine/generators “manufactured to comply with the current New Source Performance Standards (NSPS)”. There is not any reference to the air quality of this engine exhaust after it has been used to dry the solids. Will the dried material “pick up” any of the CO, SOX, NOX, PM10 or VOC from the engine exhaust gases? Will the dried material release any CO, SOX, NOX, VOC or PM10 into the exhaust air as it dries? Dried sewage sludge from anaerobic digestion is stored in bags if the amount is small. It is often stored in silos or bins if there are large amounts. These bins or silos usually have inert gases in the head space above product to prevent spontaneous combustion from contact with air (which contains oxygen). The EAW does no provide adequate information on this point. Handling and storage of this material is a health hazard and explosion issue. Should it be addressed in an EIS? Dried sludge from anaerobic digestion can release gases while in storage. Will that be true with this material? If so, what safety measures are included in the plan for employee health and safety?

For any of these materials to be conveyed on public roads, they must have a Material Safety Data Sheet (MSDS). Where are the MSDS’s for the methane, liquid by-product and dried sludge? How can the proper materials of construction be selected for the process equipment without this information? I believe it is important for the successful completion of this project to know more about the project. Please require an EIS. I have publicly endorsed in Le Sueur the idea of local generation of energy from renewable sources. I am in favor of the concept of this project. The citizens of Le Sueur and those served by the Le Sueur electric utility are entitled to know and understand the impact of this project. The proposer has not been forthcoming with that information. I ask you to assist us in getting this information so we can a comfort level with this project. Thank you. Sincerely: Lyle Olson 143 Woodcrest Terrace Le Sueur, MN 56058 Home phone: 507-665-2549 Cell phone 952-215-4335
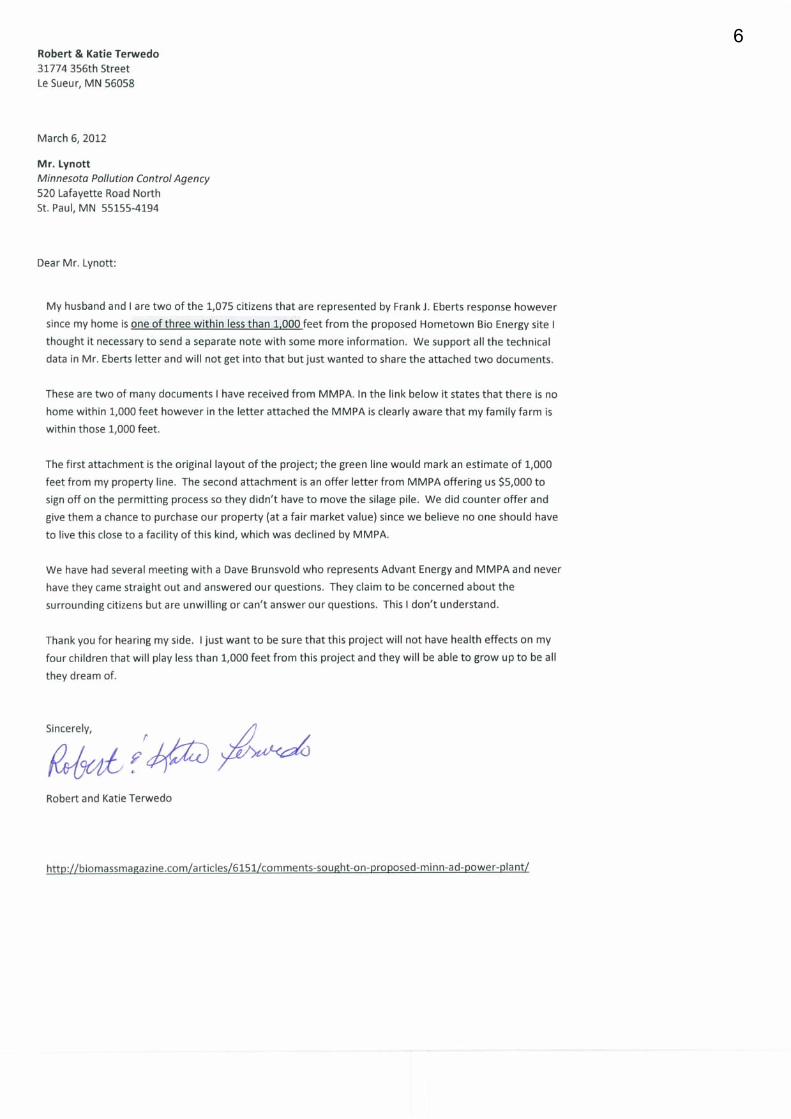
6


7

Minnesota Department of Transportation District 7 2151 Bassett Drive Office Tel: 507-304-6100 Mankato, MN 56001-6888 Fax: 507-304-6119
Memo
An Equal Opportunity Employer
TO: William Lynott, MPCA, 520 Lafayette Rd. N., St. Paul, MN,55155-4194 Email – [email protected] FROM: Mark Scheidel, Transportation Planner, 507-304-6196 DATE: March 7, 2012 SUBJECT: MnDOT District 7 comments on EAW for Hometown BioEnergy Facility South Le Sueur, TH 112, RP 3.7L MnDOT, District 7, is not in opposition to the proposed development from the standpoint of highway operations on TH 112, as long as appropriate improvements are made. We are silent on issues such as local land use, odor, etc., as those issues are outside of our jurisdiction. At this time, District 7 mainly wants to note the MnDOT Highway Access Permit that is mentioned in the Environmental Assessment Worksheet on Page 8. This will be required if MnDOT is still the TH 112 highway authority at time of development. With this permit we will be considering all effects to the operation of the highway and will require necessary access location permission, improvements and other considerations, including, but not limited to: ACCESS LOCATION: The proposed North accesson TH 112 [540 ft. South of Co. Rd. 115] is too close to Co. Rd 115 according to MnDOT Access Spacing Guidelines and it’s location does not leave enough room for a North right turn lane on to Co. Rd. 115. It is likely we won’t approve this location because the South TH 112 access and the Co. Rd.115 access should be enough. NEW LANES: There should be turn lanes and bypass lanes in connection with the Co. Rd. 115 intersection and any new access points on TH 112 – actual spots to be figured with more design. STORM WATER RUNOFF: Additional storm water entering the state right of way will have to be reviewed – the could involve effluent storage tank overflow, if projected to happen. SOUTH ACCESS: This is an existing access but a change of use will require a new MnDOT permit. With consideration of this, it may be that the City wants to have a public road dedicated there for future growth to the East. If they do, we will support that. Thank you and contact me if you have questions. CC: MnDOT District 7 Access Committee and James Swanson, District Engineer Jennie Ross, MnDOT, St. Paul Darrrell Pettis, Le Sueur County Engineer Rick Almich, Le Sueur City Administrator Kelsey Dahlen, Avant Energy
8
