misleading prioritizations from modelling range shifts …€¦ · thuiller, 2005) and continue to...
TRANSCRIPT
R E S E A R CH PA P E R
Misleading prioritizations from modelling range shifts underclimate change
Helen R. Sofaer1 | Catherine S. Jarnevich1 | Curtis H. Flather2
1U.S. Geological Survey, Fort Collins Science
Center, Fort Collins, Colorado
2U.S. Department of Agriculture Forest
Service, Rocky Mountain Research Station,
Fort Collins, Colorado
Correspondence
Helen R. Sofaer, U.S. Geological Survey,
Fort Collins Science Center, 2150 Centre
Avenue, Building C, Fort Collins,
CO 80526, U.S.A.
Email: [email protected]
Funding information
U.S. Geological Survey
Editor: Salit Kark
Abstract
Aim: Conservation planning requires the prioritization of a subset of taxa and geographical
locations to focus monitoring and management efforts. Integration of the threats and opportunities
posed by climate change often relies on predictions from species distribution models, particularly
for assessments of vulnerability or invasion risk for multiple taxa. We evaluated whether species
distribution models could reliably rank changes in species range size under climate and land use
change.
Location: Conterminous U.S.A.
Time period: 1977–2014.
Major taxa studied: Passerine birds.
Methods: We estimated ensembles of species distribution models based on historical North
American Breeding Bird Survey occurrences for 190 songbirds, and generated predictions to
recent years given c. 35 years of observed land use and climate change. We evaluated model pre-
dictions using standard metrics of discrimination performance and a more detailed assessment of
the ability of models to rank species vulnerability to climate change based on predicted range loss,
range gain, and overall change in range size.
Results: Species distribution models yielded unreliable and misleading assessments of relative
vulnerability to climate and land use change. Models could not accurately predict range expansion
or contraction, and therefore failed to anticipate patterns of range change among species. These
failures occurred despite excellent overall discrimination ability and transferability to the validation
time period, which reflected strong performance at the majority of locations that were either
always or never occupied by each species.
Main conclusions: Models failed for the questions and at the locations of greatest interest to
conservation and management. This highlights potential pitfalls of multi-taxa impact assessments
under global change; in our case, models provided misleading rankings of the most impacted
species, and spatial information about range changes was not credible. As modelling methods and
frameworks continue to be refined, performance assessments and validation efforts should focus
on the measures of risk and vulnerability useful for decision-making.
K E YWORD S
birds, climate change impacts, discrimination performance, invasion risk assessment, model trans-
ferability, model validation, species distribution model, vulnerability assessment
658 | VC 2018 JohnWiley & Sons Ltd wileyonlinelibrary.com/journal/geb Global Ecol Biogeogr. 2018;27:658–666.
Received: 9 May 2017 | Revised: 1 December 2017 | Accepted: 23 January 2018
DOI: 10.1111/geb.12726

1 | INTRODUCTION
Climate change impact assessments can be used to direct monitoring
and management towards the taxa that are expected to pose invasion
risks or face population declines under climate change, and to inform
spatial management and reserve design priorities. Assessments of
species vulnerability to climate change have typically been based on
species traits and/or quantitative models of physiology, demography,
or distributions (Pacifici et al., 2015). For assessments of many taxa,
correlative species distribution models (SDMs) have been (Guisan &
Thuiller, 2005) and continue to be (Evans, Merow, Record, McMahon,
& Enquist, 2016) the predominant tool used to evaluate broad-scale
climate change impacts by projecting future distributions (Langham,
Schuetz, Distler, Soykan, & Wilsey, 2015; Thuiller, Richardson et al.,
2005). The ease of implementation and the ability to produce spatially
explicit projections have led to the continued use of SDMs despite
longstanding questions about their biological realism and reliability
(Bahn & McGill, 2007; Pearson & Dawson, 2003). The integration of
predictions from SDMs into conservation planning faces several chal-
lenges, including perceived relevance and reliability for conservation
and management decision-making (Guisan et al., 2013; Sinclair, White,
& Newell, 2010). An outstanding question is whether common summa-
ries used to represent species vulnerability and risk provide a reliable
basis for conservation prioritization.
Validation of model projections under climate change is inherently
difficult because we do not know the future. Studies have used simula-
tions (e.g., Elith & Graham, 2009), fossil records (e.g., Maguire et al.,
2016) and long-term data or temporal partitioning (e.g., Ara�ujo,
Pearson, Thuiller, & Erhard, 2005; Brun, Kiørboe, Licandro, & Payne,
2016; Mor�an-Ord�o~nez, Lahoz-Monfort, Elith, & Wintle, 2017) to test
model assumptions, identify reliable approaches, and validate predicted
distributional patterns. Results of these validation studies have been
mixed, with both optimistic and pessimistic findings regarding model
transferability. However, model evaluations have largely focused on
discrimination performance rather than on the metrics used to summa-
rize relative vulnerability, primarily proportional range loss and change
in range size. Overall discrimination may be an insufficient performance
metric because accuracy at sites where range gain or loss occurred can
be lower (perhaps much lower) than at consistently occupied or unoc-
cupied locations (Rapacciuolo et al., 2012). Although climate-induced
range shifts are increasingly observed (Chen, Hill, Ohlem€uller, Roy, &
Thomas, 2011) and, in turn, affect ecosystem function and services
(Pecl et al., 2017), it remains unclear whether SDMs can anticipate
these shifts and reliably sort species by their relative climate change
vulnerability. If so, then the use of multispecies correlative SDMs in
management planning would be supported. Indeed, consistent bias in
projections of absolute range change may be tolerable provided that
vulnerability rankings are consistent and reliable (Wright, Hijmans,
Schwartz, & Shaffer, 2015), as these rankings would still identify
species that should receive monitoring or management priority.
We used a long-term dataset of North American birds, the
Breeding Bird Survey (BBS; Pardieck, Ziolkowski, & Hudson, 2015), to
test the ability of distribution models to generate reliable rankings of
species vulnerability and risk under climate change. We fitted ensem-
bles of SDMs to historical presence–absence data and generated pre-
dicted occurrences in recent years based on c. 35 years of observed
climate and land use change. We compared avian survey data in recent
years with model predictions, focusing on a set of 512 routes that
were consistently surveyed in both the historical and the recent period.
We compared predicted and observed patterns of range loss and
change in range size, and evaluated model accuracy under different
methodological decisions. Our analyses focused on the following ques-
tions: (a) can models consistently identify the most vulnerable species;
and (b) can models predict where range expansion and contraction are
likely to occur?
2 | METHODS
We summarized occurrence of passerine bird species at BBS routes in
the conterminous U.S. during historical (1977–1979) and recent
(2012–2014) periods. We used 3-year periods to minimize the effects
of imperfect detection, such that only routes surveyed for all three
years contributed absences for each time period. The selected years
were chosen to provide a continental extent and a large number of
routes that were surveyed in all years, while maintaining a long interval
between historical and recent periods. We considered a species pres-
ent on a c. 40 km roadside route if it was detected on at least one stop
(out of 50 systematically arranged stops) in at least one of the 3 years.
Validation routes (n5512) were defined as those that were surveyed
during all 6 years of the historical and recent periods (Supporting Infor-
mation Figure S1) and were used to compare predicted and observed
changes in species presence. Our analysis was limited to the 190 pass-
erine species that were detected on at least 30 routes during the his-
torical period and on at least 10 of the validation routes during either
time period.
We evaluated how model accuracy was affected by methodologi-
cal decisions regarding the selection of climate covariates, the inclusion
of land use covariates, and the spatial extent at which species absences
were included in model estimation. We developed three groups of
climate covariates based on annual, quarterly or all bioclimatic variables,
and estimated models with only climate covariates and with both
climate and land use covariates (Supporting Information Table S1). We
extracted climate and land use covariates within allometrically sized
buffers surrounding each route centroid (see Supporting Information
for details of these and other methods and for comprehensive results).
Bioclimatic covariates were based on PRISM data (PRISM Climate
Group, 2014), using a 4-year time period corresponding to each set of
avian observations and the prior year, to capture potential lag effects.
Land use covariates were the proportion of the buffer surrounding
each route in developed and conservation or low human use classes
based on the 1974 and 2012 versions of the U.S. conterminous wall-
to-wall anthropogenic land use trends dataset (NWALT; Falcone,
2015). The NWALT dataset was selected because it was designed to
estimate land use change. For each covariate set, we fitted models
based on two versions of the response dataset; both versions included
SOFAER ET AL. | 659
all routes where a given species was present historically. In one case,
absences from routes across the conterminous U.S. were included, and
in the other case, absences were geographically restricted to routes
within 600 km of a historically occupied route. Data are available online
(https://doi.org/10.5066/F7NS0S4R).
We estimated ensembles of distribution models for each species
based on eight correlative modelling methods suitable for presence–
absence data using the BIOMOD2 (Thuiller, Georges, Engler, & Breiner,
2016) package in R (R Core Team, 2016). These correlative modelling
approaches were regression- or tree-based methods, including those
found to perform well (Elith et al., 2006); MAXENT was not included
because we had presence–absence data, rather than only presences.
Models were fitted with historical data and predicted to historical and
recent years; we developed an ensemble by weighting predictions pro-
portionally by the area under the receiver operating characteristic
curve (AUC; Marmion, Parviainen, Luoto, Heikkinen, & Thuiller, 2009).
Continuous predictions were thresholded to binary predictions by max-
imizing sensitivity plus specificity in cross-validation. To evaluate
whether poor calibration might underlie problems with predicting rela-
tive vulnerability, we also thresholded continuous predictions using the
optimal cut-off point for each period (which studies would not know in
practice for the future).
Species vulnerability was quantified as the proportional range loss
and change in range size (i.e., change in the number of occupied routes,
considering both loss and gain), which were calculated based on the
512 validation routes. These metrics of vulnerability are commonly
used for assessing species-level climate change impacts (Broennimann
et al., 2006; Buisson, Thuiller, Casajus, Lek, & Grenouillet, 2010;
Erasmus, Van Jaarsveld, Chown, Kshatriya, & Wessels, 2002; Thuiller,
Lavorel, Ara�ujo, Sykes, & Prentice, 2005). Observed change in range
size was correlated with BBS estimates of species population trends
(Sauer et al., 2014), indicating that this metric captured observed popu-
lation trajectories (Supporting Information Figure S2).
For each set of methodological decisions (i.e., estimation area,
climate covariates, and inclusion of land use; Supporting Information
Table S1), we ranked predictions of relative vulnerability among spe-
cies. To compare performance among model ensembles based on these
different decisions, we calculated the absolute value of the difference
between predicted and observed range loss for each species and each
set of model predictions, and fitted generalized linear models to evalu-
ate the effects of different methodological decisions (see Supporting
Information; Methods). Likewise, we modelled how methodological
choices affected the magnitude of the difference between the pre-
dicted and observed change in range size.
Species distribution models provide spatially explicit predictions of
habitat suitability, which can be used to inform spatial conservation
planning decisions. We evaluated whether model ensembles could
identify the locations where range gain and loss occurred. For each
species, we selected the set of survey routes that were observed to be
historically occupied and which had the lowest predicted suitability in
the recent period; across species, we then tested whether more of
these routes showed range contraction, rather than stable occupancy
(see Supporting Information; Methods). To evaluate whether the
predicted direction and magnitude of range shifts aligned qualitatively
with observations, we compared the geographical coordinates of the
centre of occupied validation routes for observed and predicted range
shifts between the historical and recent time periods. We also visual-
ized predictive ability relative to multivariate climatic dissimilarity
(Mahalanobis distance) from historically occupied routes; this was used
to evaluate whether prediction was most difficult at climatically mar-
ginal versus climatically distant survey routes.
Finally, we evaluated whether variation in model performance for
range loss and range change could be explained by variation in four
species attributes: the size of each species’ breeding and resident range
in the conterminous U.S.A. (in square kilometres); the proportion of the
total breeding and resident range located within the conterminous U.S.
A.; estimated long-term population trend based on BBS data (Sauer
et al., 2014); and migratory strategy (neotropical migrant, short-
distance migrant, or resident). We predicted that model performance
would increase with a larger proportion of the species’ range within the
conterminous U.S.A. because estimation would encompass more of the
species’ occupied environmental conditions. We predicted better
performance for resident species compared with migrants, because
migrants can be limited by processes during non-breeding periods that
would not be captured by breeding area land use or climate change.
Predictions regarding total range size and population trend were less
straightforward; for example, discrimination can be poor for wide-
ranging generalist species (Evangelista et al., 2008; Hernandez, Graham,
Master, & Albert, 2006), but conversely, metrics of range loss and
range change may be noisy for species with few validation routes, and
the risk of overfitting may increase for species with restricted ranges
(Thorne et al., 2013).
3 | RESULTS
Predicted range loss and change in range size were highly sensitive to
modelling decisions regarding the selection of covariates and the
geographical extent from which absences were drawn (Supporting
Information Figure S3). Predictions from model ensembles based on a
covariate set that included annual climate and land use, and a model
estimation extent that included absences from routes across the
entire conterminous U.S.A., showed the smallest differences between
observed and predicted vulnerability across all species (see Supporting
Information for model performance comparison: Figures S4 and S5;
Table S1). Based on this model set, we explored the ability of the
ensemble to predict relative vulnerability among species and to identify
the routes where range loss and gain occurred.
Species distribution models showed a striking inability to identify
which species were observed to have the greatest range loss or change
in range size between the historical and recent periods (Figure 1).
Nevertheless, the performance metrics typically used to validate SDMs
yielded a favourable view of model performance and transferability.
Model ensembles generally showed excellent discrimination ability,
even when using temporally independent validation routes to estimate
model performance (median AUC for predictions to recent years was
660 | SOFAER ET AL.

0.96 for focal model set; Supporting Information Figures S5 and S6).
Discrimination performance during the recent period remained high
when excluding distant absences that could lead to overly optimistic
performance assessments (Supporting Information Figure S6; median
AUC50.92).
Model ensembles did not capture relative vulnerability among
species because of systematic failures to predict observed changes in
occupancy correctly. Specifically, binary predictions for the recent
period were usually correct for routes that were always or never
occupied by a given species, but were usually wrong for routes
where a gain or loss of occupancy was observed (Figure 2). Binary
predictions often indicated that a focal species would always or
never occur at locations where gain or loss was observed (Figure 2a).
Model performance evaluations focused on predictions to geographi-
cally restricted validation routes (see Supporting Information
Methods; model estimation was based on the conterminous U.S.A.)
to ensure that performance metrics were not inflated by distant
routes with true absences (Lobo, Jim�enez-Valverde, & Real, 2008).
Poor model calibration could also not explain these differences fully,
because applying the optimal threshold for each period improved
predictions for the most prevalent species but did not align overall
predicted and observed vulnerability ranks (Supporting Information
Figure S7).
Of each species’ historically occupied routes, those with the lowest
predicted suitability in recent years were no more likely to be lost than
to remain occupied; likewise, the routes predicted to be most suitable
among observed historically unoccupied routes were no more likely to
be gained than to remain unoccupied (see Supporting Information
Results). Failure to identify correctly those locations where species
experienced range contraction or expansion led to unreliable predic-
tions of the direction and magnitude of shifts in the centre of each spe-
cies’ occupied range (Figure 3; Supporting Information Figure S8).
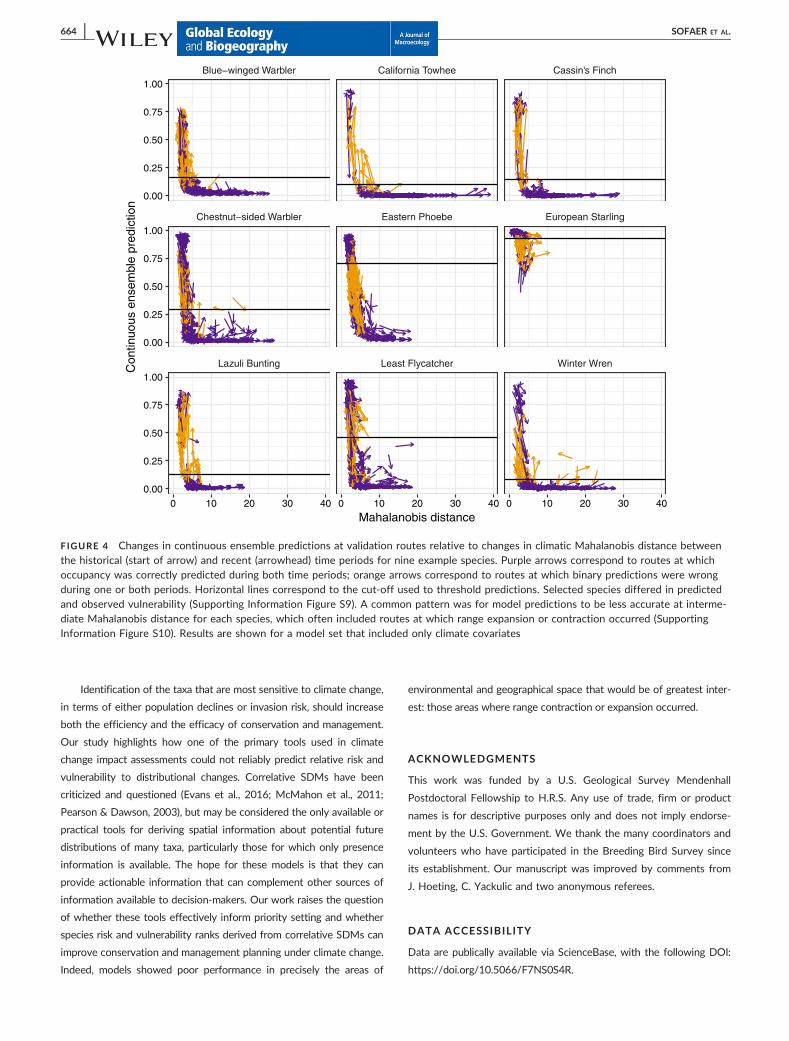
Model predictions were often incorrect for routes at intermediate
climatic distances to a species’ historically occupied range, whereas
routes with climate distances ‘far’ from the historically occupied range
were often correctly predicted to be consistently unoccupied
(Figure 4). Distribution model performance for both range loss and
range change was lower for species with smaller range sizes, and
declining species also showed lower performance for range loss
(Supporting Information Figure S11; Supporting Information Results).
FIGURE 1 Model predictions of range loss and change in range size were not consistently related to observed patterns of loss and changein range size across species. Each point represents a species, with point sizes scaled according to the observed number of occupiedvalidation routes during the historical period. A positive correlation would be seen in each panel if models correctly identified the mostvulnerable species. Species ranks were calculated such that one represented the most vulnerable species (i.e., greatest proportional range
loss, greatest relative decline in range size). Results are shown for models estimated using absences from the entire conterminous U.S.A.,with the set of annual climate covariates and land use
SOFAER ET AL. | 661

4 | DISCUSSION
Species distribution models have been a primary tool in multispecies
climate change impact assessments that aim to identify taxa in need of
monitoring and management attention (Langham et al., 2015; Thuiller,
Richardson et al., 2005). Our results were consistent with previous
findings that SDMs have good to excellent discrimination ability in new
time periods (Ara�ujo et al., 2005; Mor�an-Ord�o~nez et al., 2017), but
highlight a striking inability to translate this performance into reliable
predictions of relative range expansion and contraction among species
(Figure 1). Prediction was most difficult in locations where range
contraction or expansion was observed (Figure 2), yet these areas of
environmental and geographical space are of great interest for manage-
ment and conservation under climate change. The finding that model
ensembles could not identify the survey routes most likely to be gained
or lost (see Supporting Information Methods and Results) suggests that
output from correlative SDMs based on generic covariates across spe-
cies may have limited utility for the identification of vulnerable species
and the incorporation of climate projections into spatially explicit con-
servation planning.
The failure of SDMs to predict vulnerability could reflect one of
the major assumptions inherent in distribution modelling, which is that
species ranges are limited by climatic and other variables included in
the model covariate set (Dormann, 2007). Models that are not tailored
to a species of interest may capture correlates of range limits, rather
than factors truly limiting distributions, and can make qualitatively
different predictions from models based on species-specific expertise
(Thorne et al., 2013). The validation of predictions of range change
based on higher quality models for individual species remains neces-
sary. Multispecies modelling exercises may often fail to identify which
species will show substantial range shifts and where such shifts will
occur (Scherrer, Massy, Meier, Vittoz, & Guisan, 2017). Unfortunately,
it is this information that would be most useful for informing prioritiza-
tion decisions surrounding the allocation of resources among species
and locations (Sinclair et al., 2010). We found that realistic modelling
strategies expected to improve performance across species, such as
including land use covariates, were insufficient to align predicted and
observed rankings of species by range loss and change in range size.
Our results suggest that predictive errors did not arise simply from
extrapolation in climate space, and that neither range expansion nor
contraction was predicted more reliably than the other. We found that
model ensembles often struggled to predict occupancy correctly at
routes that were intermediate in multivariate climatic distance from
each species’ historically occupied routes (Figure 4; see Supporting
Information Methods); the routes at intermediate climatic distances
included many of those where a change in occupancy was observed
(Supporting Information Figure S10). This pattern suggests that errors
largely arose not from extrapolation, but rather in potentially marginal
conditions, where a complex interplay between abiotic and biotic
factors, phenotypic plasticity, and dispersal patterns shapes observed
occupancy. The inability of our models to identify where range expan-
sion and contraction occurred also translated into an inability to predict
the overall magnitude and direction of range shifts (Figure 3). Previous
work has suggested that models may overestimate vulnerability and be
more accurate for predicting range gain than range loss (Schwartz,
2012), but our results showed poor performance at predicting both
expansion and contraction (Figure 2). Models had lower performance
for declining species and those with smaller ranges (Supporting Infor-
mation Figure S11). Our work also supports the importance of model
calibration and suggests potential interactions between calibration and
prevalence, because using the optimal calibration for each time period
improved rankings of range change for common species (Supporting
Information Figure S7).
The lack of agreement between observed and predicted vulnerabil-
ity is of particular concern because multiple attributes of our study
should have led to an optimistic view of the utility of correlative SDMs,
including: (a) basing our work on high-quality presence–absence data
collected via standardized methods, which is generally more accurate
FIGURE 2 Distribution model predictions were less accurate forroutes where a species was observed to have gained or lostoccupancy, compared with routes where a species was always ornever present. (a) Across all species and routes, those that weregained or lost were often predicted to be always or never
occupied. (b) Boxplots showing variation among species in themean change in continuous predictions for routes that weregained, lost, always or never occupied. (c) Boxplots showingvariation among species in the proportion of routes in eachobserved category that were correctly classified. All summaries arebased only on predictions to validation routes within thegeographically restricted area, so distant routes that were neveroccupied were not included. Model estimation included absencesfrom the conterminous U.S.A
662 | SOFAER ET AL.

than basing models on presence-only data (Boitani et al., 2011;
Brotons, Thuiller, Ara�ujo, & Hirzel, 2004); (b) predicting presence–
absence, which can be easier than predicting abundance (Bahn &
McGill, 2013); (c) excluding species with < 30 historical presence
records (Wisz et al., 2008); (d) focusing on a taxonomic group with high
dispersal capacity should have reduced the time-lag in species
responses, enhancing alignment between predictions and observations
(Zurell, Jeltsch, Dormann, & Schr€oder, 2009), although lags also reflect
avian responses to vegetative communities (Yackulic & Ginsberg,
2016); (e) basing models on land use and climate data from the histori-
cal and recent periods, thereby avoiding the uncertainties associated
with future projections (Northrop & Chandler, 2014); and (f) including
validation routes in model estimation, so that validation was in time
only, rather than in both space and time. Each of these characteristics
should have favoured reliable model predictions.
Our results highlight a striking incongruity between models’
excellent discrimination ability and poor capacity to predict range
change. Models both failed to anticipate observed changes and pre-
dicted change where none was observed. We designed our methods
to reflect approaches often used in multi-taxa studies, although we
summarized climate data over 4 years, rather than the typical 30-
year period. The implications of this decision could be explored fur-
ther, but standard performance criteria indicated that continental
climatic patterns during those 4 years did allow models to discrimi-
nate between species’ presences and absences. Our models
appeared to have high transferability, because discrimination per-
formance remained high during the validation time period. However,
the low reliability of predicted range expansion and contraction over
a 35-year historical period should caution against the uncritical use
of SDMs to quantify relative risk and vulnerability among species, in
the context of both ongoing climate change and for risk assessment
among potential invasive species.
We suggest that ecological modellers and conservation practi-
tioners must re-evaluate how best to approach multispecies vulnerabil-
ity and risk assessments under climate and land use change. In
particular, more attention must be given to performance assessment
designs that capture accuracy and bias along the dimensions of
intended use (Ara�ujo & Guisan, 2006; Loiselle et al., 2003; Rapacciuolo
et al., 2012). Studies aimed at validating SDMs in the context of risk and
vulnerability should focus explicitly on the quality of predictions at loca-
tions where occupancy status changed. The type of validation we apply
here should be used to evaluate more advanced modelling methods,
including those that account for spatial autocorrelation (Dormann et al.,
2007) and patterns of species co-occurrence (Kissling et al., 2012).
Dynamic occupancy models explicitly estimate colonization and extinc-
tion and could improve predictions compared with static SDMs
(Naujokaitis-Lewis & Fortin, 2016; Yackulic, Nichols, Reid, & Der, 2015).
In addition, trait-based approaches may be useful for identifying vulner-
able species (Pearson et al., 2014) and, when available, data on spatio-
temporal variation in demography could improve predictions of range
change (Merow et al., 2014). Future work should evaluate whether life
history and natural history traits can reliably predict species’ sensitivity
to climate and other environmental factors, because models that inte-
grate these relationships can derive spatial predictions of distributional
change (Brown et al., 2014; Evans et al., 2016). It will be crucial to vali-
date whether existing and emerging modelling methods effectively
identify both the species that should receive conservation priority and
the locations where range contraction and expansion are anticipated.
FIGURE 3 The direction and distance of predicted range shifts (gold arrows) did not align well with the observed change in thegeographical centre of occupied validation routes (blue arrows). The origin of each arrow set represents the geographical centre of occupiedvalidation routes during the historical period for a particular species. Results are based on predictions to the 512 validation routes, frommodels estimated from data throughout the conterminous U.S.A. with the covariate set including annual climate and land use. SeeSupporting Information Figure S8 for results with geographically restricted estimation and validation and all covariate sets
SOFAER ET AL. | 663
Identification of the taxa that are most sensitive to climate change,
in terms of either population declines or invasion risk, should increase
both the efficiency and the efficacy of conservation and management.
Our study highlights how one of the primary tools used in climate
change impact assessments could not reliably predict relative risk and
vulnerability to distributional changes. Correlative SDMs have been
criticized and questioned (Evans et al., 2016; McMahon et al., 2011;
Pearson & Dawson, 2003), but may be considered the only available or
practical tools for deriving spatial information about potential future
distributions of many taxa, particularly those for which only presence
information is available. The hope for these models is that they can
provide actionable information that can complement other sources of
information available to decision-makers. Our work raises the question
of whether these tools effectively inform priority setting and whether
species risk and vulnerability ranks derived from correlative SDMs can
improve conservation and management planning under climate change.
Indeed, models showed poor performance in precisely the areas of
environmental and geographical space that would be of greatest inter-
est: those areas where range contraction or expansion occurred.
ACKNOWLEDGMENTS
This work was funded by a U.S. Geological Survey Mendenhall
Postdoctoral Fellowship to H.R.S. Any use of trade, firm or product
names is for descriptive purposes only and does not imply endorse-
ment by the U.S. Government. We thank the many coordinators and
volunteers who have participated in the Breeding Bird Survey since
its establishment. Our manuscript was improved by comments from
J. Hoeting, C. Yackulic and two anonymous referees.
DATA ACCESSIBILITY
Data are publically available via ScienceBase, with the following DOI:
https://doi.org/10.5066/F7NS0S4R.
Lazuli Bunting Least Flycatcher Winter Wren
Chestnut−sided Warbler Eastern Phoebe European Starling
Blue−winged Warbler California Towhee Cassin's Finch
0 10 20 30 40 0 10 20 30 40 0 10 20 30 40
0.00
0.25
0.50
0.75
1.00
0.00
0.25
0.50
0.75
1.00
0.00
0.25
0.50
0.75
1.00
Mahalanobis distance
Con
tinuo
us e
nsem
ble
pred
ictio
n
FIGURE 4 Changes in continuous ensemble predictions at validation routes relative to changes in climatic Mahalanobis distance betweenthe historical (start of arrow) and recent (arrowhead) time periods for nine example species. Purple arrows correspond to routes at whichoccupancy was correctly predicted during both time periods; orange arrows correspond to routes at which binary predictions were wrongduring one or both periods. Horizontal lines correspond to the cut-off used to threshold predictions. Selected species differed in predictedand observed vulnerability (Supporting Information Figure S9). A common pattern was for model predictions to be less accurate at interme-diate Mahalanobis distance for each species, which often included routes at which range expansion or contraction occurred (SupportingInformation Figure S10). Results are shown for a model set that included only climate covariates
664 | SOFAER ET AL.

ORCID
Helen R. Sofaer http://orcid.org/0000-0002-9450-5223
Catherine S. Jarnevich http://orcid.org/0000-0002-9699-2336
Curtis H. Flather http://orcid.org/0000-0002-0623-3126
REFERENCES
Ara�ujo, M. B., & Guisan, A. (2006). Five (or so) challenges for species
distribution modelling. Journal of Biogeography, 33, 1677–1688.
Ara�ujo, M. B., Pearson, R. G., Thuiller, W., & Erhard, M. (2005). Validation
of species–climate impact models under climate change. Global
Change Biology, 11, 1504–1513.
Bahn, V., & McGill, B. J. (2007). Can niche-based distribution models
outperform spatial interpolation? Global Ecology and Biogeography, 16,
733–742.
Bahn, V., & McGill, B. J. (2013). Testing the predictive performance of
distribution models. Oikos, 122, 321–331.
Boitani, L., Maiorano, L., Baisero, D., Falcucci, A., Visconti, P., &
Rondinini, C. (2011). What spatial data do we need to develop global
mammal conservation strategies? Philosophical Transactions of the
Royal Society B: Biological Sciences, 366, 2623–2632.
Broennimann, O., Thuiller, W., Hughes, G., Midgley, G. F., Alkemade, J.
M. R., & Guisan, A. (2006). Do geographic distribution, niche property
and life form explain plants’ vulnerability to global change? Global
Change Biology, 12, 1079–1093.
Brotons, L., Thuiller, W., Ara�ujo, M. B., & Hirzel, A. H. (2004). Presence-
absence versus presence-only modelling methods for predicting bird
habitat suitability. Ecography, 27, 437–448.
Brown, A. M., Warton, D. I., Andrew, N. R., Binns, M., Cassis, G., & Gibb,
H. (2014). The fourth-corner solution – using predictive models to
understand how species traits interact with the environment.
Methods in Ecology and Evolution, 5, 344–352.
Brun, P., Kiørboe, T., Licandro, P., & Payne, M. R. (2016). The predictive
skill of species distribution models for plankton in a changing climate.
Global Change Biology, 22, 3170–3181.
Buisson, L., Thuiller, W., Casajus, N., Lek, S., & Grenouillet, G. (2010).
Uncertainty in ensemble forecasting of species distribution. Global
Change Biology, 16, 1145–1157.
Chen, I.-C., Hill, J. K., Ohlem€uller, R., Roy, D. B., & Thomas, C. D. (2011).
Rapid range shifts of species associated with high levels of climate
warming. Science, 333, 1024–1026.
Dormann, C. F. (2007). Promising the future? Global change projections
of species distributions. Basic and Applied Ecology, 8, 387–397.
Dormann, C. F., McPherson, J. M., Ara�ujo, M. B., Bivand, R., Bolliger, J.,
Carl, G., . . . Wilson, R. (2007). Methods to account for spatial auto-
correlation in the analysis of species distributional data: A review.
Ecography, 30, 609–628.
Elith, J., & Graham, C. H. (2009). Do they? How do they? WHY do they
differ? On finding reasons for differing performances of species dis-
tribution models. Ecography, 32, 66–77.
Elith, J., Graham, C. H., Anderson, R. P., Dudík, M., Ferrier, S.,
Guisan, A., . . . Zimmermann, N. E. (2006). Novel methods improve
prediction of species’ distributions from occurrence data. Ecography,
29, 129–151.
Erasmus, B. F. N., Van Jaarsveld, A. S., Chown, S. L., Kshatriya, M., &
Wessels, K. J. (2002). Vulnerability of South African animal taxa to
climate change. Global Change Biology, 8, 679–693.
Evangelista, P. H., Kumar, S., Stohlgren, T. J., Jarnevich, C. S., Crall, A.
W., Norman, J. B., III, & Barnett, D. T. (2008). Modelling invasion for
a habitat generalist and a specialist plant species. Diversity and
Distributions, 14, 808–817.
Evans, M. E. K., Merow, C., Record, S., McMahon, S. M., & Enquist, B. J.
(2016). Towards process-based range modeling of many species.
Trends in Ecology and Evolution, 31, 860–871.
Falcone, J. A. (2015). U.S. conterminous wall-to-wall anthropogenic land
use trends (NWALT), 1974–2012: U.S. Geological Survey Data Series
948, 33 pp. plus appendixes 3–6 as separate files. Retrieved from
https://doi.org/10.3133/ds948
Guisan, A., & Thuiller, W. (2005). Predicting species distribution:
Offering more than simple habitat models. Ecology Letters, 8,
993–1009.
Guisan, A., Tingley, R., Baumgartner, J. B., Naujokaitis-Lewis, I., Sutcliffe, P.
R., Tulloch, A. I. T., . . . Buckley, Y. M. (2013). Predicting species distri-
butions for conservation decisions. Ecology Letters, 16, 1424–1435.
Hernandez, P. A., Graham, C. H., Master, L. L., & Albert, D. L. (2006).
The effect of sample size and species characteristics on performance
of different species distribution modeling methods. Ecography, 29,
773–785.
Kissling, W. D., Dormann, C. F., Groeneveld, J., Hickler, T., K€uhn, I.,
McInerny, G. J., . . . O’Hara, R. B. (2012). Towards novel approaches
to modelling biotic interactions in multispecies assemblages at large
spatial extents. Journal of Biogeography, 39, 2163–2178.
Langham, G. M., Schuetz, J. G., Distler, T., Soykan, C. U., & Wilsey, C.
(2015). Conservation status of North American birds in the face of
future climate change. PLoS One, 10, e0135350.
Lobo, J. M., Jim�enez-Valverde, A., & Real, R. (2008). AUC: A misleading
measure of the performance of predictive distribution models. Global
Ecology and Biogeography, 17, 145–151.
Loiselle, B. A., Howell, C. A., Graham, C. H., Goerck, J. M., Brooks, T.,
Smith, K. G., & Williams, P. H. (2003). Avoiding pitfalls of using
species distribution models in conservation planning. Conservation
Biology, 17, 1591–1600.
Maguire, K. C., Nieto-Lugilde, D., Blois, J. L., Fitzpatrick, M. C., Williams,
J. W., Ferrier, S., & Lorenz, D. J. (2016). Controlled comparison of
species- and community-level models across novel climates and
communities. Proceedings of the Royal Society B: Biological Sciences,
283, 20152817.
Marmion, M., Parviainen, M., Luoto, M., Heikkinen, R. K., & Thuiller, W.
(2009). Evaluation of consensus methods in predictive species distri-
bution modelling. Diversity and Distributions, 15, 59–69.
McMahon, S. M., Harrison, S. P., Armbruster, W. S., Bartlein, P. J., Beale,
C. M., Edwards, M. E., . . . Prentice, I. C. (2011). Improving assessment
and modelling of climate change impacts on global terrestrial biodi-
versity. Trends in Ecology and Evolution, 26, 249–259.
Merow, C., Latimer, A. M., Wilson, A. M., McMahon, S. M., Rebelo, A. G.,
& Silander, J. A. (2014). On using integral projection models to
generate demographically driven predictions of species’ distributions:Development and validation using sparse data. Ecography, 37,
1167–1183.
Mor�an-Ord�o~nez, A., Lahoz-Monfort, J. J., Elith, J., & Wintle, B. A. (2017).
Evaluating 318 continental-scale species distribution models over a
60-year prediction horizon: What factors influence the reliability of
predictions? Global Ecology and Biogeography, 26, 371–384.
Naujokaitis-Lewis, I., & Fortin, M.-J. (2016). Spatio-temporal variation of
biotic factors underpins contemporary range dynamics of congeners.
Global Change Biology, 22, 1201–1213.
Northrop, P. J., & Chandler, R. E. (2014). Quantifying sources of
uncertainty in projections of future climate. Journal of Climate, 27,
8793–8808.
SOFAER ET AL. | 665

Pacifici, M., Foden, W. B., Visconti, P., Watson, J. E., Butchart, S. H.,
Kovacs, K. M., . . . Rondinini, C. (2015). Assessing species vulnerability
to climate change. Nature Climate Change, 5, 215–224.
Pardieck, K. L., Ziolkowski, D. J. Jr., & Hudson, M.-A. R. (2015). North
American breeding bird survey dataset 1966–2014 (version 2014.0). U.
S. Geological Survey, Patuxent Wildlife Research Center. Retrieved
from www.pwrc.usgs.gov/BBS/RawData/
Pearson, R. G., & Dawson, T. P. (2003). Predicting the impacts of climate
change on the distribution of species: Are bioclimate envelope
models useful? Global Ecology and Biogeography, 12, 361–371.
Pearson, R. G., Stanton, J. C., Shoemaker, K. T., Aiello-Lammens, M. E.,
Ersts, P. J., Horning, N., . . . Akcakaya, H. R. (2014). Life history and
spatial traits predict extinction risk due to climate change. Nature
Climate Change, 4, 217–221.
Pecl, G. T., Araujo, M. B., Bell, J. D., Blanchard, J., Bonebrake, T. C.,
Chen, I. C., . . . Williams, S. E. (2017). Biodiversity redistribution under
climate change: Impacts on ecosystems and human well-being.
Science, 355, 1389.
PRISM Climate Group. (2014). Oregon State University, PRISM 4 km
climate data. Retrieved from http://prism.oregonstate.edu/
R Core Team. (2016). R: A language and environment for statistical
computing. Vienna, Austria: R Foundation for Statistical Computing.
Retrieved from https://www.R-project.org/
Rapacciuolo, G., Roy, D. B., Gillings, S., Fox, R., Walker, K., & Purvis, A.
(2012). Climatic associations of British species distributions show
good transferability in time but low predictive accuracy for range
change. PLoS One, 7, e40212.
Sauer, J. R., Hines, J. E., Fallon, J. E., Pardieck, K. L., Ziolkowski, D. J. Jr.,
& Link, W. A. (2014). The North American breeding bird survey,
results and analysis 1966–2013 (Version 01.30.2015). Laurel, MD:
USGS Patuxent Wildlife Research Center. Retrieved from https://
www.mbr-pwrc.usgs.gov/bbs/bbs2013.html
Scherrer, D., Massy, S., Meier, S., Vittoz, P., & Guisan, A. (2017). Assess-
ing and predicting shifts in mountain forest composition across 25
years of climate change. Diversity and Distributions, 23, 517–528.
Schwartz, M. W. (2012). Using niche models with climate projections to
inform conservation management decisions. Biological Conservation,
155, 149–156.
Sinclair, S., White, M., & Newell, G. (2010). How useful are species
distribution models for managing biodiversity under future climates?
Ecology and Society, 15, 8.
Thorne, J. H., Seo, C., Basabose, A., Gray, M., Belfiore, N. M., & Hijmans,
R. J. (2013). Alternative biological assumptions strongly influence mod-
els of climate change effects on mountain gorillas. Ecosphere, 4, 108.
Thuiller, W., Georges, D., Engler, R., & Breiner, F. (2016). biomod2: Ensem-
ble platform for species distribution modeling (R package version 3.3–7).Retrieved from https://CRAN.R-project.org/package5biomod2
Thuiller, W., Lavorel, S., Ara�ujo, M. B., Sykes, M. T., & Prentice, I. C.
(2005). Climate change threats to plant diversity in Europe. Proceed-
ings of the National Academy of Sciences USA, 102, 8245–8250.
Thuiller, W., Richardson, D. M., Py�sek, P., Midgley, G. F., Hughes, G. O.,
& Rouget, M. (2005). Niche-based modelling as a tool for predicting
the risk of alien plant invasions at a global scale. Global Change
Biology, 11, 2234–2250.
Wisz, M. S., Hijmans, R. J., Li, J., Peterson, A. T., Graham, C. H., Guisan,
A., & NCEAS Predicting Species Distributions Working Group (2008).
Effects of sample size on the performance of species distribution
models. Diversity and Distributions, 14, 763–773.
Wright, A. N., Hijmans, R. J., Schwartz, M. W., & Shaffer, H. B. (2015).
Multiple sources of uncertainty affect metrics for ranking
conservation risk under climate change. Diversity and Distributions,
21, 111–122.
Yackulic, C. B., & Ginsberg, J. R. (2016). The scaling of geographic ranges:
Implications for species distribution models. Landscape Ecology, 31,
1195–1208.
Yackulic, C. B., Nichols, J. D., Reid, J., & Der, R. (2015). To predict the
niche, model colonization and extinction. Ecology, 96, 16–23.
Zurell, D., Jeltsch, F., Dormann, C. F., & Schr€oder, B. (2009). Static
species distribution models in dynamically changing systems: How
good can predictions really be? Ecography, 32, 733–744.
BIOSKETCHES
HELEN R. SOFAER is a Mendenhall Postdoctoral Fellow with the
U.S. Geological Survey Fort Collins Science Center. A major focus of
her research is understanding organisms’ responses to ongoing global
change.
CATHERINE S. JARNEVICH is a Research Ecologist with the U.S. Geological
Survey Fort Collins Science Center. Her research focuses on under-
standing patterns of invasion from local to global scales.
CURTIS H. FLATHER is a Research Ecologist with the U.S. Department of
Agriculture Forest Service at the Rocky Mountain Research Station. His
research is focused on understanding the response of biodiversity to
changing climate, land use, natural disturbance and land management
activities to support resource planning activities within the agency.
SUPPORTING INFORMATION
Additional Supporting Information may be found online in the sup-
porting information tab for this article.
How to cite this article: Sofaer HR, Jarnevich CS, Flather CH.
Misleading prioritizations from modelling range shifts under cli-
mate change. Global Ecol Biogeogr. 2018;27:658–666. https://
doi.org/10.1111/geb.12726
666 | SOFAER ET AL.