modeling and optimization of a large-scale slurry bubble ... · modeling and optimization of a...
TRANSCRIPT

www.elsevier.com/locate/jcice
Available online at www.sciencedirect.com
l Engineers 39 (2008) 169–179
Journal of the Chinese Institute of ChemicaModeling and optimization of a large-scale slurry bubble
column reactor for producing 10,000 bbl/day of
Fischer–Tropsch liquid hydrocarbons
Laurent Sehabiague a, Romain Lemoine a, Arsam Behkish a, Yannick J. Heintz a,Mariela Sanoja a, Rachid Oukaci b, Badie I. Morsi a,*
a Chemical and Petroleum Engineering Department, University of Pittsburgh, Pittsburgh, PA 15261, USAb Energy Technology Partners, 135 William Pitt Way, Pittsburgh, PA 15238, USA
Abstract
A user-friendly simulator based on a comprehensive computer model for slurry bubble column reactors (SBCRs) for Fischer–Tropsch (F–T)
synthesis, taking into account the hydrodynamics, kinetics, heat transfer, and mass transfer was developed. The hydrodynamic and mass transfer
data obtained in our laboratories under typical F–T conditions along with those available in the literature were correlated using Back Propagation
Neural Network and empirical correlations with high confidence levels. The data used covered wide ranges of reactor geometry, gas distributor, and
operating conditions. All reactor partial differential equations, equation parameters and boundary conditions were simultaneously solved
numerically.
The simulator was systematically used to predict the effects of reactor geometry (inside diameter and height) as well as superficial gas velocity
and catalyst concentration on the performance of a large-scale SBCR provided with cooling pipes and operating under F–T conditions with cobalt-
supported catalyst and H2/CO = 2. The performance of the SBCR was expressed in terms of CO conversion, liquid hydrocarbon yield, catalyst
productivity, and space time yield. The simulator was also used to optimize the reactor geometry and operating conditions in order to produce
10,000 barrels/day (bbl/day) of liquid hydrocarbons.
# 2008 Published by Elsevier B.V. on behalf of Taiwan Institute of Chemical Engineers.
Keywords: Hydrodynamics; Mass transfer; Multiphase reactors; Bubble column reactor
1. Introduction
Synthetic fuels produced via Fischer–Tropsch (F–T)
reactions exhibit quite attractive properties, such as very low
sulfur content and almost no aromatics, which make them good
candidates as alternative and/or complementary sources of fuel.
The interest in gas-to-liquid (GTL), coal-to-liquid (CTL) or
biomass-to-liquid (BTL) technologies using F–T process as
shown in Fig. 1 will certainly increase in the coming years with
more attractive costs when compared with those of crude oil.
Recently, it has been estimated that using F–T synthesis to
Abbreviations: BCR, bubble column reactor; F–T, Fischer–Tropsch synth-
esis; M-ON, multiple orifices nozzle; PfP, perforated plate; PM, perforated
membrane; PoP, porous plate; R, ring; S, spider; SBCR, slurry bubble column
reactor; S-ON, single orifice nozzle; SP, sintered plate; VLE, vapor–liquid
equilibrium.
* Corresponding author. Tel.: +1 412 624 9650; fax: +1 412 624 9639.
E-mail address: [email protected] (B.I. Morsi).
0368-1653/$ – see front matter # 2008 Published by Elsevier B.V. on behalf of T
doi:10.1016/j.jcice.2007.11.003
produce fuels can become more competitive if the price of the
crude oil exceeds $20–24/bbl (Dry, 2004; Vosloo, 2001;
Wilhelm et al., 2001).
In the F–T synthesis, the syngas (CO + H2) reacts in
presence of a catalyst (commonly iron or cobalt) to form a
mixture of liquid hydrocarbons:
COþ�
1þ m
2n
�H2�!
rFT
�1
n
�CnHm þ H2O (1)
The main products of the F–T synthesis are paraffins and
the usage ratio H2/CO is typically between 2.06 and 2.16
(Dry, 2002; Steynberg and Dry, 2004). It has been known
since the 1950s that slurry bubble column reactors (SBCRs)
could be used to carry out F–T synthesis. In this type of
reactors, the solid-phase consists of fine catalytic particles
suspended in a liquid phase. The advantages of SBCRs over
agitated and packed-bed reactors include (Dry, 2002; Nigam
and Schumpe, 1996; Satterfield and Huff, 1982; Zimmerman
and Bukur, 1990): (1) better temperature control/removal due
aiwan Institute of Chemical Engineers.

Nomenclature
a gas–liquid interfacial area per unit slurry volume
(1/m)
a1 constant in Eq. (33)
A1 coefficient in Eq. (34) (mol/kgcatalyst Pa2 s)
A2 coefficient in Eq. (35) (1/Pa)
C reactant concentration (mol/m3)
C* equilibrium concentration (mol/m3)
CW solid concentration by weight (wt.%)
dorf. diameter of the orifices of the gas distributor (m)
dP diameter of the solid particles (m)
dS Sauter-mean bubble diameter (m)
D dispersion coefficient (m2/s)
DAB diffusivity of gas in the liquid (m2/s)
DC diameter of the column (m)
E constant in Eqs. (34) and (35) (J/mol)
F expression in Eq. (19)
g gravitational constant (m/s2)
h0 heat transfer coefficient (W/m2 K)
H0 coefficient for Henry’s law constant (Pa m3/mol)
He Henry’s law constant (Pa m3/mol)
DH heat of reaction (J/mol)
k reaction rate constant (mol/kg s Pa2)
kLa volumetric liquid-side mass transfer coefficient
(1/s)
L reactor length (m)
m constant in Eq. (1)
MW molecular weight (kg/mol)
n constant in Eq. (1)
NO number of orifices of the gas distributor
P pressure (Pa)
PS saturation vapor pressure (Pa)
r reaction rate (mol/m3 s)
rFT Fischer–Tropsch reaction rate (mol/kg catalyst s)
R universal gas constant (J/mol K)
T temperature (K)
U superficial velocity (m/s)
UTS terminal settling velocity (m/s)
XW concentration of purest component in the liquid
mixture (wt.%)
Greek symbols
a constant defined in Table 2
G gas sparger coefficient
e holdup
m viscosity (kg/m s)
j open area
r density (kg/m3)
s surface tension (N/m)
Subscripts
FT refer to the Fischer–Tropsch reaction
G refer to the gas phase
i refer to the reactant/species i
L refer to the liquid phase
large refer to the large bubble class in the churn-
turbulent flow regime
P refer to the solid particles
S refer to the solid particles suspension
SL refer to the slurry phase
small refer to the small bubble class in the churn-
turbulent flow regime
L. Sehabiague et al. / Journal of the Chinese Institute of Chemical Engineers 39 (2008) 169–179170
to large liquid volume; (2) low maintenance/operating cost
due in part to simple design and absence of moving
components; (3) low capital cost due to the small floor space
needed; (4) lower pressure drop which is equivalent to the
hydrostatic head; (5) ability of using fine catalyst particles
(<100 mm) allowing huge surface area per unit volume
and better liquid–solid mass transfer, (5) higher yield per
reactor volume; (6) higher on-line factor where the catalyst
can be added and removed continuously, allowing longer
runs without reactor shutdown; (7) higher gas–liquid
interfacial areas and volumetric mass transfer coefficients
at low energy input; and (8) greater liquid volume and longer
residence time due to reactor geometry and height to
diameter ratio (L/D). Despite these advantages, SBCRs
have not been applied in a commercial-scale until 1993
(Dry, 2002) due to the following challenges (Nigam and
Schumpe, 1996): (1) considerable back-mixing and bubble–
bubble interactions in the churn-turbulent flow regime; (2)
catalyst attrition (particularly with iron) and deactivation due
to high shear created near the gas distributor; (3) important
side products due to high liquid to solid ratio; (4) difficult
catalyst/liquid separation, particularly for highly viscous
slurries containing fine particles; and (5) lack of knowledge
on the hydrodynamic and mass/heat transfer characteristics
in these reactors under typical industrial conditions.
Recently, correlations and a calculation algorithm (Behkish
et al., 2005, 2006; Lemoine, 2005; Lemoine et al., 2005) have
been developed to predict the hydrodynamics and mass
transfer parameters in bubble column reactors (BCRs) and
SBCRs based on a large experimental database covering
typical F–T conditions, however, those correlations and
algorithms have not been yet included in a model to simulate
the F–T synthesis in a large-scale SBCR. Therefore, the
purpose of this study is to build a comprehensive mathema-
tical model for the SBCRs using the correlations and
algorithm previously developed (Behkish et al., 2006;
Lemoine, 2005; Lemoine et al., 2005) and to use this model
for the design of a commercial-size F–T SBCR to produce
10,000 barrels/day (bbl/day) of synthetic liquid hydrocarbons.
The model will be also used to optimize the performances of
such a commercial reactor.
2. Simulation of the Fischer–Tropsch synthesis
In SBCRs, the gas-phase is conventionally sparged through
the slurry at the bottom of the reactor through a specially
designed distributor, leading to different flow regimes and

Fig. 1. GTL, CTL and BTL processes.
L. Sehabiague et al. / Journal of the Chinese Institute of Chemical Engineers 39 (2008) 169–179 171
complex hydrodynamic as well as mass transfer behaviors.
There are no flow regime maps available in the literature for
SBCRs, however, several flow regime maps were proposed to
delineate the hydrodynamic flow regimes in BCRs, including
the one by Oshinowo and Charles (1974), which identifies six
different flow regimes in an upward flow; and that by
Deckwer et al. (1980) based on the reactor diameter and gas
velocity for air/water system. In BCRs operating with
superficial gas velocities �0.05 m/s, the bubbly or homo-
genous flow regime prevails, which is characterized by a
homogeneous gas bubbles distribution, weak interactions
among gas bubbles, and almost constant gas bubbles
residence time. In this regime, the gas injection point was
reported to have a strong impact on the gas bubbles
formation, whereas the reactor diameter was not as important
(Magaud et al., 2001; Sarrafi et al., 1999). In small BCRs
with internal diameters �0.15 m, increasing the superficial
gas velocity could lead to the formation of large gas bubbles
in the reactor, which is designated as a slug flow regime. In
this regime, the wall effect (Lee and Tsui, 1999; Saxena and
Chen, 1994) is important and has a strong impact on the
hydrodynamic and mass transfer parameters. In large-scale
BCRs, however, increasing the superficial gas velocity leads
the reactor to operate in the heterogeneous or churn-turbulent
flow regime. In this regime, large and fast-rising gas bubbles
induce strong circulations and create back-mixing or re-
circulation zones wherein the small gas bubbles are entrained
(Shah et al., 1982; de Swart et al., 1996; Vermeer and
Krishna, 1981). Visual observations and photographic
methods revealed the coexistence of distinctly two-class
gas bubbles (small and large) in BCRs (Behkish et al., 2007;
Grund et al., 1992; Krishna et al., 2000; Lemoine et al.,
2004; Vermeer and Krishna, 1981) operating in the churn-
turbulent flow regime.
In this study, the commercial-scale SBCR for F–T synthesis
was simulated using an axial dispersion model in conjunction
with the two-class gas bubbles model (de Swart, 1996; de Swart
et al., 1996; de Swart and Krishna, 2002; Lemoine et al., 2004;
Rados et al., 2003). The model was built with the following
features:
- T
he SBCR is operated in the churn-turbulent flow regime.- T
he gas is sparged at the bottom of the reactor through amultiple orifices gas distributor.
- T
he catalyst used is a cobalt-supported catalyst.- T
he slurry is moving upward.- T
he total heat of reaction is removed using saturated waterflowing in a bundle of cooling tubes.
The model was also based on the following key assump-
tions:
- T
he mass transfer resistance in the bulk gas-phase and liquid–solid interface are negligible when compared with that in the
liquid film.
- T
he slurry superficial velocity is constant.- T
he slurry temperature is constant.- T
he catalyst suspension behavior follows the sedimenta-tion-dispersion model (Behkish, 2004; Kato et al., 1972;
Kojima et al., 1986; O’Dowd et al., 1987; Smith and
Ruether, 1985).
- T
he reactor is operating in a steady-state.
stitute of Chemical Engineers 39 (2008) 169–179
In the next sections the different equations and correlations
used in the simulator are given.
L. Sehabiague et al. / Journal of the Chinese In172
2.1. Mass and energy balances
The mass balances of each component in the liquid and gas
phases over a differential element of the reactor are:
@
@z
�ð1� eGÞDL
@Ci;L
@z
�� @ðUSLCi;LÞ
@z
þ kLai;largeðC�i;large � Ci;LÞ þ kLai;smallðC�i;small � Ci;LÞþ ð1� eGÞri ¼ 0 (2)
@
@z
�eG;smallDG;small
@Ci;G;small
@z
�� @ðUG;smallCi;G;smallÞ
@z
� kLai;smallðC�i;small � Ci;LÞ ¼ 0 (3)
@
@z
�eG;largeDG;large
@Ci;G;large
@z
�� @ðUG;largeCi;G;largeÞ
@z
� kLai;largeðC�i;large � Ci;LÞ ¼ 0 (4)
The catalyst particles mass balance is:
@
@z
�ð1� eGÞDS
@CS
@z
�þ @
@z½ðð1� eGÞUP � USLÞCS� ¼ 0 (5)
The heat balance is derived as:
@
@z
�rSLC pSLð1� eGÞDL
@T
@z
�� @ðrSLC pSLUSLTÞ
@z
� UHeatðT � TcoolÞ þ ð1� eGÞð�DHFTrFTÞ ¼ 0 (6)
The boundary conditions for the gas, liquid and slurry at the
inlet (bottom) of the reactor are Danckwerts’ type:
USLCi;L � ð1� eGÞDL
@Ci;L
@z¼ 0 (7)
UG;smallCi;G;small � eG;smallDG;small
@Ci;G;small
@z¼ UG;smallCi;G;inlet
(8)
UG;largeCi;G;large � eG;largeDG;large
@Ci;G;large
@z¼ UG;largeCi;G;inlet
(9)
ð1� eGÞDS
@CS
@zþ ðð1� eGÞUP � USLÞCS þ USLCaverage ¼ 0
(10)
USLrSLT � rSLð1� eGÞDL
@T ¼ ðUSLrSLTÞ0 (11)
@zThe boundary conditions at the outlet of the reactor are:
@Ci;L
@z¼ 0 (12)
@Ci;G;small
@z¼ 0 (13)
@Ci;G;large
@z¼ 0 (14)
@T
@z¼ 0 (15)
The change of gas velocity due to gas consumption was
estimated using the total gas-phase mass balance at each level
in the reactor. The gas velocity of the small bubbles was taken
from de Swart (1996) and the gas velocity of the large bubbles
was calculated from:
UG;large ¼ UG � UG;small (16)
The pressure profile was obtained from (Deckwer, 1992):
@P
@zþ ½ð1� eGÞrSL þ eGrG�g ¼ 0 (17)
2.2. Hydrodynamics and mass transfer correlations
The knowledge of the hydrodynamics and mass transfer
characteristics of both bubble classes is essential (de Swart and
Krishna, 2002; Gupta et al., 2001; Shah et al., 1985) for
modeling SBCRs. The available literature correlations sum-
marized by Behkish et al. (2006) and Lemoine et al. (2005)
along with those proposed by Krishna et al. (1997), Koide et al.
(1984) and Fukuma et al. (1987) could be used to predict the
hydrodynamics and mass transfer parameters for gases in F–T
liquids. These correlations considered the effect of several
variables, such as liquid/solid properties, operating conditions,
and reactor diameter, on these parameters. In our research
laboratories, Behkish et al. (2005, 2006) and Lemoine et al.
(2005) have recently developed Back Propagation Neural
Network (BPNN) correlations as well as empirical correlations
for predicting the gas holdup, Sauter mean bubble diameter and
volumetric mass transfer coefficients in BCRs and SBCRs. As
can be seen in Table 1, the empirical correlations by these
authors take into account not only the liquid/solid properties,
operating conditions, and reactor diameter similar to available
literature correlations, but also the gas distributor type, number/
size of nozzles, catalyst loading, and foamability of the F–T
products, which have been shown to dramatically impact the
hydrodynamics and mass transfer characteristics in SBCRs.
Thus, due to their versatility and proven applicability, the
correlations given in Table 1 were used in the computer model
developed in this study in order to predict the effects of reactor
geometry, superficial gas velocity and catalyst concentration on
the performance of a large-scale SBCR; and to optimize the
reactor geometry as well as operating conditions to produce
10,000 bbl/day of liquid hydrocarbons.

Table 1
Gas holdup, Sauter mean bubble diameter and mass transfer coefficient correlations used in the model (Lemoine et al., 2005; Behkish et al., 2006)
Total gas holdup (Behkish et al., 2006)
eG ¼ 4:94� 10�3 r0:42L r0:18
G
m0:17L s0:27
L
� �U0:55
G
PT
PT � PS
� �0:20 DC
DC þ 1
� ��0:12
G 0:05 expð�2:23CV � 0:16ðrPdPÞ � 0:24XWÞ(18)
Gas holdup of large gas bubbles (Behkish et al., 2006)
eG;large ¼ e0:84G 1� 3:04� 10�6 r0:97
L
m0:16L
e4:50XW�4:49CV
� �¼ e0:84
G ðFÞ(19)
Gas holdup of small gas bubbles (Behkish et al., 2006)
If eG is > ðFÞ25=4 eG;small ¼ eG � eG;large
If eG is > ðFÞ25=4small gas bubbles do not exist
(20)
Total Sauter mean bubble diameter (Lemoine et al., 2005)
dS ¼ 37:19� m0:08L s1:22
L r0:02G T1:66
r1:52L M0:12
W-Gas
U0:14G
DC
DC þ 1
� �0:30
ð1� eGÞ1:56G�0:02e�2:29XWþ2:81CVþ2:77rPdP
(21)
Sauter mean bubble diameter of large gas bubbles (Lemoine et al., 2005)
If eG is> ðFÞ25=4 dS;large ¼ d0:96S ð1� 10�5r0:22
L m0:03L s8:60
L U0:04G e2:37
G e2:74G;largeÞ
(22)
Sauter mean bubble diameter of small gas bubbles (Lemoine et al., 2005)
If eG is > ðFÞ25=4 eG;small
dS;small
¼ eG
dS
� eG;large
dS;large
(23)
Mass transfer coefficient (Lemoine et al., 2005)
kLa
ð1� eGÞ¼ 6:14� 104 r0:26
L m0:12L
s0:52L r0:06
G
e1:21G
U0:12G d0:05
S
D0:50AB
T0:68G0:11 DC
DC þ 1
� �0:40(24)
Table 3
Upper and lower limits of the variables used in Eqs. (18)–(26) (Lemoine et al.,
2005)
Variables Minimum value Maximum value
PT (MPa) 0.1 19.8
PS (MPa) 0.0 0.7�3
L. Sehabiague et al. / Journal of the Chinese Institute of Chemical Engineers 39 (2008) 169–179 173
In Table 1, XW designates the concentration of the primary
liquid in a liquid mixture, and its value varies between 0.5 and
1. For a single-component or an organic liquid mixture,
consisting of different chain length hydrocarbons, such as F–T
products, XW equals 1. Also, G which represents the gas sparger
type is defined as:
G ¼ ðKd � NOdaOÞ (25)
The values of the coefficient Kd and the exponent a for
several distributors are given in Table 2. For perforated plates,
the exponent a depends on z, which is expressed as:
z ¼ NO
�d0
DC
�2
(26)
Table 3 presents the ranges of the conditions of applicability
of Eqs. (18)–(26). It should be noted that the correlations listed
Table 2
Values of a used in Eq. (25) (Lemoine et al., 2005)
Distributor z (%) a Kd (m�a)
PfP <0.055 0.017 1.364
PfP �0.055 and �0.3 0.303 1.364
PfP >0.3 0.293 1.364
M-ON 0.303 1.364
S-ON 0.134 1.205
R, S 0.015 1.000
BC 0.500 1.553
PoP, SP 0.650 1.533
in Table 1 are valid when the volume of internals, commonly
used in SBCRs for cooling or heating purposes, is �20% of the
reactor volume. This is because several literature findings
(Chen et al., 1999; De et al., 1999; Forret et al., 2003; Joseph,
1985; O’Dowd et al., 1987; Saxena et al., 1992; Saxena and
Chen, 1994; Shah et al., 1978; Yamashita, 1987) showed
limited or no effect of internals on the hydrodynamic and mass
transfer parameters as long as their volume fraction remains
under 20%. Also, these correlations should be valid for reactor
UG (m/s) 3.5 � 10 0.574
CV (vol.%) 0 0.36
XW (wt.%) 0.5 1
T (K) 275 538
MW-Gas (kg/kmol) 2 44
DAB (109 m2/s) 2.78 � 10�8 1.25 � 10�11
dp (10�6 m) 5 300
rP (kg/m3) 700 4000
rG (kg/m3) 0.06 223.77
rL (kg/m3) 633 1583
mL (10�3 Pa s) 0.16 398.80
sL (10�3 N/m) 8.4 75
DC (m) 0.0382 7.6200
G 0.06 143800
z (%) 0.0097 75

Table 4
Values for the kinetics constants in Eqs. (34) and (35)
Constant Value Units
A1 8.037 � 10�9 mol/kgcatalyst Pa2 s
E1 37369 J/mol
A2 1.243 � 10�12 Pa�1
E2 �68478 J/mol
Table 5
Coefficients for Henry’s law constant from Soriano (2005)
Gas A B H0
N2 �2.214 � 105 1,267 51.62
He �5.442 � 105 3,336 53.17
H2 �1.929 � 105 1,345 42.18
CO �3.651 � 105 1,873 22.87
L. Sehabiague et al. / Journal of the Chinese Institute of Chemical Engineers 39 (2008) 169–179174
height/inside diameter ratio (L/DC) varying from 4 to 20,
because the considerable data available in the literature
(Eickenbusch et al., 1995; Guy et al., 1986; Moustiri et al.,
2001; Pino et al., 1992; Shah et al., 1982) used to develop these
correlations cover such an L/DC range. It should be mentioned
also that Lemoine et al. (2005) have argued that the use of Eq.
(24) to calculate kLa for small and large gas bubbles using their
corresponding gas holdup and Sauter mean bubble diameter is a
more accurate approach than the ones used by de Swart and
Krishna (2002) and Grund et al. (1992); because it underscores
the fact that the mass transfer behavior of SBCRs is controlled
by the gas-liquid interfacial area (Behkish et al., 2002; Inga and
Morsi, 1997; Lemoine et al., 2004).
All the correlations listed in Table 1 were used in the
simulator according to the algorithm developed by Lemoine
et al. (2005) with the exception of the mass transfer coefficients
of small gas bubbles which was obtained from:
kLai;small ¼ kLai � kLai;large (27)
2.3. Heat transfer
The heat transfer coefficient in the slurry-side (h0) was taken
from Cho et al. (2002):
h0 ¼ 11710U0:445G ðmSL � 103Þ�0:060ðP� 10�6Þ0:176
(28)
2.4. Dispersion coefficients
Baird and Rice (1975) correlated the liquid-phase dispersion
coefficient in bubble columns (DL) using a large number of
experimental data reported by various authors as:
DL ¼ 0:35D4=3C ðgUGÞ0:33
(29)
Since the small gas bubbles are easily entrained by the liquid
recirculation in the reactor under given operating conditions, it
was assumed (de Swart, 1996) that they have the same
dispersion as the liquid phase:
DG;small ¼ DL (30)
For the large gas bubbles, on the other hand, the following
dispersion coefficient (Field and Davidson, 1980; Deckwer and
Schumpe, 1993) was used:
DG;large ¼ 5:64� 10�3
�UG
eG;large
�3:56
D4=3C (31)
The particles settling velocity and solid dispersion
coefficient were estimated using the data/correlations given
by several authors (Kato et al., 1972; Kojima et al., 1986;
O’Dowd et al., 1987; Smith and Ruether, 1985).
The terminal particles settling velocity was calculated from
Ramachandran and Chaudhari (1983):
UTS ¼ðrS � rLÞgD2
C
18mL
(32)
2.5. Kinetics
The F–T reaction rate using cobalt catalyst was taken from
Satterfield and Yates (1991):
rFT ¼ kFT
HeH2CL;H2
HeCOCL;CO
ð1þ a1HeCOCL;COÞ2(33)
with
kFT ¼ A1e�E1=RT (34)
a1 ¼ A2e�E2=RT (35)
The constant in Eqs. (34) and (35) were estimated using the
data from Satterfield and Yates (1991) and are given in Table 4.
2.6. Gas solubilities
The gas solubilities in the liquid phase were determined
from the work by Soriano (2005) who measured the solubilities
of H2, CO, N2 and He in Sasol wax in a small agitated autoclave
under Fischer–Tropsch conditions. The Henry’s law constant
was expressed as a function of temperature as:
He ¼ H0 e½Að1=TÞ2þBð1=TÞ� (36)
The coefficients of Eq. (36) are listed in Table 5.
The solubilities of other gases (H2O, CO2, CH4, etc., . . .)were estimated from Marano and Holder (1997).
2.7. Flash calculations
The multi-component vapor–liquid equilibria (VLE) model
developed by Marano and Holder (1997), along with the
assumption that the liquid products follow a classical Shultz-
Flory distribution (Satterfield and Huff, 1982) with a growth
probability factor of 0.92 (Jager and Espinoza, 1995), was used
to perform equilibrium calculations in order to estimate the
final composition of the gaseous and liquid hydrocarbon
products.
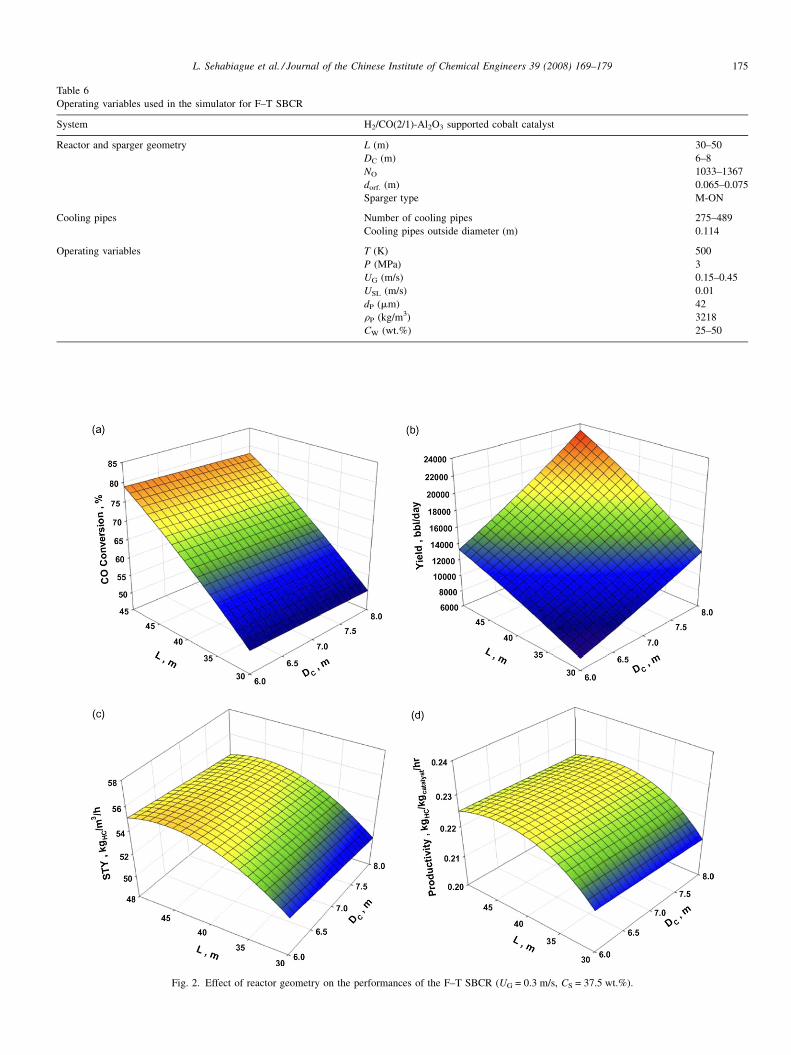
Table 6
Operating variables used in the simulator for F–T SBCR
System H2/CO(2/1)-Al2O3 supported cobalt catalyst
Reactor and sparger geometry L (m) 30–50
DC (m) 6–8
NO 1033–1367
dorf. (m) 0.065–0.075
Sparger type M-ON
Cooling pipes Number of cooling pipes 275–489
Cooling pipes outside diameter (m) 0.114
Operating variables T (K) 500
P (MPa) 3
UG (m/s) 0.15–0.45
USL (m/s) 0.01
dP (mm) 42
rP (kg/m3) 3218
CW (wt.%) 25–50
Fig. 2. Effect of reactor geometry on the performances of the F–T SBCR (UG = 0.3 m/s, CS = 37.5 wt.%).
L. Sehabiague et al. / Journal of the Chinese Institute of Chemical Engineers 39 (2008) 169–179 175

L. Sehabiague et al. / Journal of the Chinese Institute of Chemical Engineers 39 (2008) 169–179176
3. Results and discussion
All the partial differential equations of the material and
energy balances for all components given above along with
equation parameters and boundary conditions were incorpo-
rated in a user-friendly simulator and simultaneously solved
numerically using Athena Visual Studio Software version 11.0
with FORTRAN compiler g95. The simulator was then used to
study the effects of different operating variables, including
reactor inside diameter, reactor height, superficial gas velocity,
and catalyst concentration on the performance of a SBCR
operating in the churn-turbulent flow regime. The ranges of all
operating variables in addition to sparger type/geometry,
catalyst particle size/density, slurry superficial velocity, and
cooling pipes number/size used in the simulator are given in
Table 6.
The performance of the reactor was evaluated using the CO
conversion, the liquid hydrocarbon yield, space time yield
(STY) and catalyst productivity. The STY is defined similar to
de Swart (1996) as the mass of liquid hydrocarbons produced
(kg) per reactor volume (m3) per unit time (hour). The catalyst
productivity was also defined as the mass of liquid
Fig. 3. Effect of superficial gas velocity and catalyst concentration
hydrocarbons produced (kg) per mass of catalyst in the reactor
(kg) per unit time (hour).
The effects of reactor inside diameter (ID) and height (L) on
the performances of an F–T SBCR operating at constant
superficial gas velocity (UG = 0.3 m/s) and catalyst concentra-
tion (CS = 37.5 wt.%) are shown in Fig. 2. As can be seen in
Fig. 2(a), CO conversion appears to increase by more than 50%
with increasing reactor height from 30 to 50 m. This behavior
agrees with that by de Swart (1996) who reported an increase of
CO conversion with increasing the height of a 7.5 m ID SBCR
from 10 to 30 m. Fig. 2(a) also shows that CO conversion
slightly decreases with increasing reactor ID. The effect of
reactor ID and height on the hydrocarbon yield, depicted in
Fig. 2(b), can be directly related to their effects on CO
conversion. The increase of hydrocarbon yield with increasing
reactor ID and height was expected since larger diameter and
height leads to larger gas throughput and consequently greater
hydrocarbon production.
Fig. 2(c) and (d) show the effects of reactor height and ID on
the space time yield (STY) and the catalyst productivity. As can
be seen in these figures, at constant reactor length, both STY
and catalyst productivity appear to slightly decrease with
on the performances of the F–T SBCR (DC = 7 m, L = 30 m).

Table 7
Geometry and operating conditions of the optimized F–T SBCR to produce a
10,000 bbl/day of liquid hydrocarbons
Units Value
Column inside diameter (DC) m 7
Column length (L) m 30
Superficial gas velocity (UG) m/s 0.255
Catalyst loading (CW) wt.% 37.5
CO conversion % 60.6%
Yield bbl/day 10,808
Space time yield (STY) kgHC=m3reactor h 55.04
Catalyst productivity kgHC/kgcatalyst h 0.225
L. Sehabiague et al. / Journal of the Chinese Institute of Chemical Engineers 39 (2008) 169–179 177
increasing reactor ID; whereas at constant reactor diameter,
both STY and catalyst productivity appear to increase with
reactor length by about 5% and then level off after a reactor
height of 40 m. This can be related to the fact that the overall F–
T reaction rate and accordingly the volumetric hydrocarbons
production rate is expected to decrease due to the predictable
decrease of the syngas velocity, CO and H2 partial pressures,
and catalyst concentrations with the reactor height. Thus, Fig. 2
leads one to conclude that in order to produce about 10,000 bbl/
day of liquid hydrocarbons, a SBCR with an internal diameter
of 7 m and a height of 30 m, could be used.
The effects of the superficial gas velocity and catalyst
concentration on the performance of a SBCR with the geometry
given above (ID = 7 m and 30 m height) are illustrated in Fig. 3.
As can be seen in Fig. 3(a), the CO conversion decreases with
increasing superficial gas velocity suggesting a small increase
of the mass transfer rate compared to the decrease of the
residence time of the gaseous reactants (CO and H2) which
becomes too short for converting more CO. Fig. 3(a) also shows
that increasing catalyst concentration, on the other hand,
increases the CO conversion. For low gas velocity (�0.15 m/s)
CO conversion appears to level off at high catalyst loading. This
can be attributed to the fact that increasing catalyst concentra-
tion above 40 wt.% (or 13 vol.%) decreases the mass transfer
coefficients (kLa) and consequently the mass transfer rate,
which drives the SBCR to operate in a mass transfer-controlled
regime, leading to a maximum of CO conversion (�86%). This
effect of catalyst concentration on the CO conversion agrees
with the findings by Inga and Morsi (1996) who simulated a
4.8 m ID and 12 m height F–T SBCR using iron catalyst and
reported that the syngas conversion reached a maximum and
then decreased with increasing catalyst loading. It should be
pointed out that few studies (Krishna and Sie, 2000; van der
Laan et al., 1999) found a plateau of conversion at lower
superficial gas velocities when increasing solid concentration;
and other authors (de Swart, 1996; Fernandez, 2006; Maretto
and Krishna, 1999), who did not find a maximum of conversion
when increasing catalyst concentration up to 35 vol.%. This
could be related to the difference in the catalyst size, density
and activity as well as the absence of catalyst concentration in
the mass transfer coefficients correlations used by these
authors. Fig. 3(a) also shows that increasing gas velocity will
shift the region of mass transfer controlled regime towards
higher catalyst concentrations. Fig. 3(b) illustrates the effects
on superficial gas velocity and catalyst concentration on the
liquid hydrocarbon yield, and as can be observed at constant
superficial gas velocity, the liquid hydrocarbon yield increases
with increasing catalyst concentration, which is similar to the
behavior of the CO conversion. At low catalyst concentration
(<35 wt.%), the hydrocarbon yield decreases with increasing
the superficial gas velocity, whereas, for catalyst concentrations
greater than 35 wt.%, the liquid hydrocarbons yield appears to
increase with superficial gas velocity, reach a maximum and
then decrease.
Fig. 3(c) shows the effects of catalyst concentration and
superficial gas velocity on the space time yield (STY); and as
expected the STY follows the same trend of the yield because
the reactor volume under these conditions is constant. Fig. 3(d)
illustrates the effects of catalyst concentration and superficial
gas velocity on the catalyst productivity; and as can be observed
the catalyst productivity reaches a maximum at catalyst
concentration of 25 wt.% and superficial gas velocities between
0.2 and 0.25 m/s; and generally decreases with increasing
catalyst concentration up to 40 wt.%. At catalyst concentrations
>40 wt.%, however, the catalyst productivity appears to
increase with increasing the superficial gas velocity. At
superficial gas velocities >0.25 m/s, the catalyst productivity
increases with catalyst concentrations, levels off, and then
decreases. From these four plots, Fig. 3 clearly shows that
maximum STY can be achieved using operating conditions
(high catalyst loading and high superficial gas velocities) which
are fundamentally different from those needed to obtain
maximum catalyst productivity (low catalyst loading and
average superficial gas velocities).
Thus, Fig. 3 leads to conclude that it is possible to produce a
10,000 bbl/day of liquid hydrocarbons using different operating
conditions; however, since the conditions for maximum STY
would require greater capital and operating costs than those for
maximum catalyst productivity, the conditions corresponding
to the maximum productivity should be used.
Table 7 summarizes the geometry and operating conditions
of the optimized F–T SBCR with the ancillaries given in
Table 6 in order to produce a 10,000 bbl/day of liquid
hydrocarbons. Table 7 also shows the performance character-
istic of this SBCR.
4. Conclusions
The simulator predictions for F–T SBCR indicated the
following.
At constant superficial gas velocity (0.3 m/s) and catalyst
concentration (37.5 wt.%), the CO conversion and liquid
hydrocarbon yield increased with increasing reactor height.
Also, the CO conversion slightly decreased with increasing
reactor ID, whereas the hydrocarbon yield increased with
increasing reactor ID. Both the space time yield and reactor
productivity increased with reactor length by about 5% and then
leveled off after a reactor height of 40 m. Also, both space-
time-yield and reactor productivity appeared to slightly
decrease with increasing reactor ID.

L. Sehabiague et al. / Journal of the Chinese Institute of Chemical Engineers 39 (2008) 169–179178
At constant reactor inside diameter (7 m) and height (30 m),
the CO conversion decreased with increasing the superficial gas
velocity and increased with catalyst concentration. Increasing the
catalyst concentration above 40 wt.% drove the SBCR to operate
in a mass transfer-controlled regime. Also, the liquid hydro-
carbon yield and space time yield increased with increasing
catalyst concentration at constant superficial gas velocity. At low
catalyst concentration (<35 wt.%), both the hydrocarbon yield
and space time yield decreased with increasing the superficial gas
velocity, whereas, for catalyst concentrations >35 wt.%, the
liquid hydrocarbons yield increased with superficial gas velocity,
reached a maximum and then decreased. The catalyst
productivity reached a maximum at the lowest catalyst
concentration of 25 wt.% and superficial gas velocities between
0.2 and 0.25 m/s, and generally decreased with increasing
catalyst concentration up to 40 wt.%. At catalyst concentrations
greater than 40 wt.%, however, the catalyst productivity
increased with superficial gas velocity. At superficial gas
velocities >0.25 m/s, the catalyst productivity increased with
catalyst concentrations, levels off, and then decreased. Thus, the
maximum space time yield occurred at the highest superficial gas
velocity and catalyst concentration, whereas the maximum
catalyst productivity occurred at a medium superficial gas
velocity and the lowest catalyst concentration.
In order to produce 10,000 bbl/day of F–T liquid hydro-
carbons, a SBCR (7 m ID and 30 m height), operating with
37.5 wt.% of cobalt-supported catalyst at 0.255 m/s superficial
gas velocity, 3 MPa, and 500 K, is required. The SBCR should
be provided with (375) cooling pipes representing 10% of the
total reactor volume, and a multi-nozzle distributor with (1200)
nozzles. The reactor would produce 10,808 bbl/day of liquid
hydrocarbons at CO conversion of 60.6% with space time yield
of 55:04 kgHC=m3reactor h and catalyst productivity of
0.225 kgHC/kgcatalyst h.
References
Baird, M. H. I. and R. G. Rice, ‘‘Axial Dispersion in Large Unbaffled
Columns,’’ Chem. Eng. J., 9 (2), 171 (1975).
Behkish, A., ‘‘Hydrodynamic and Mass Transfer Parameters in Large-Scale
Slurry Bubble Column Reactors,’’ Ph.D. Thesis, University of Pittsburgh,
Pittsburgh, U.S.A. (2004).
Behkish, A., R. Lemoine, R. Oukaci, and B. I. Morsi, ‘‘Novel Correlations for
Gas Holdup in Large-Scale Slurry Bubble Column Reactors Operating
under Elevated Pressures and Temperatures,’’ Chem. Eng. J., 115 (3), 157
(2006).
Behkish, A., R. Lemoine, L. Sehabiague, R. Oukaci, and B. I. Morsi, ‘‘Pre-
diction of the Gas Holdup in Industrial-Scale Bubble Columns and Slurry
Bubble Column Reactors Using Back-Propagation Neural Networks,’’ Int.
J. Chem. Reactor Eng., 3 (A53) (2005).
Behkish, A., R. Lemoine, L. Sehabiague, R. Oukaci, and B. I. Morsi, ‘‘Gas
Holdup and Bubble Size Behavior in a Large-Scale Slurry Bubble Column
Reactor Operating with an Organic Liquid under Elevated Pressures and
Temperatures,’’ Chem. Eng. J., 128 (2–3), 69 (2007).
Behkish, A., Z. Men, J. R. Inga, and B. I. Morsi, ‘‘Mass Transfer Characteristics
in a Large-Scale Slurry Bubble Column Reactor with Organic Liquid
Mixtures,’’ Chem. Eng. Sci., 57 (16), 3307 (2002).
Chen, J., F. Li, S. Degaleesan, P. Gupta, M. H. Al-Dahhan, M. P. Dudukovic, and
B. A. Toseland, ‘‘Fluid Dynamic Parameters in Bubble Columns with
Internals,’’ Chem. Eng. Sci., 54 (13–14), 2187 (1999).
Cho, Y. J., J. W. Kwang, K. Yong, and D. K. Sang, ‘‘Dynamic Characteristics of
Heat Transfer Coefficient in Pressurized Bubble Columns with Viscous
Liquid Medium,’’ Chem. Eng. Process, 41 (8), 699 (2002).
De, S. K., S. Ghosh, R. K. Parichha, and P. De, ‘‘Gas Hold-Up in Two-Phase
System with Internals,’’ Indian Chem. Eng., 41 (2), 112 (1999).
de Swart, J. W. A., ‘‘Scale-Up of a Fischer-Tropsch Slurry Reactor,’’ Ph.D.
Thesis, University of Amsterdam, Amsterdam, Netherlands (1996).
de Swart, J. W. A. and R. Krishna, ‘‘Simulation of the Transient and Steady
State Behavior of a Bubble Column Slurry Reactor for Fisher-Tropsch
Synthesis,’’ Chem. Eng. Process, 41 (1), 35 (2002).
de Swart, J. W. A., R. E. van Vliet, and R. Krishna, ‘‘Size, Structure and
Dynamics of ‘‘Large’’ Bubbles in a Two-Dimensional Slurry Bubble
Column,’’ Chem. Eng. Sci., 51 (20), 4619 (1996).
Deckwer, W. -D. , Bubble Column Reactors, John Wiley & Sons, New York,
U.S.A. (1992).
Deckwer, W.-D. Y. Louisi, M. Ralek, and A. Zaidi, ‘‘Hydrodynamic Properties
of the Fischer-Tropsch Slurry Process,’’ Ind. Eng. Chem. Process Des. Dev.,
19 (4), 699 (1980).
Deckwer, W.-D. and A. Schumpe, ‘‘Improved Tools for Bubble Column
Reactor Design and Scale-Up,’’ Chem. Eng. Sci., 48 (5), 889 (1993).
Dry, M. E., ‘‘The Fischer-Tropsch Process: 1950–2000,’’ Catal. Today, 71 (3–
4), 227 (2002).
Dry, M. E., ‘‘Present and Future Applications of the Fischer-Tropsch Process,’’
Appl. Catal. A: Gen., 276 (1–2), 1 (2004).
Eickenbusch, H., P. O. Brunn, and A. Schumpe, ‘‘Mass Transfer into Viscous
Pseudoplastic Liquid in Large-Diameter Bubble Columns,’’ Chem. Eng.
Process, 34 (5), 479 (1995).
Fernandez, F. A. N., ‘‘Modeling and Product Grade Optimization of Fischer-
Tropsch Synthesis in a Slurry Reactor,’’ Ind. Eng. Chem. Res., 45 (3), 1047
(2006).
Field, R. W. and J. F. Davidson, ‘‘Axial Dispersion in Bubble Columns,’’ Trans.
Inst. Chem. Eng., 58 (4), 228 (1980).
Forret, A., Schweitzer, J.-M. T. Gauthier, R. Krishna, and D. Schweich, ‘‘Liquid
Dispersion in Large Diameter Bubble Columns, with and Without
Internals,’’ Can. J. Chem. Eng., 81 (3–4), 360 (2003).
Fukuma, M., K. Muroyama, and A. Yasunishi, ‘‘Properties of Bubble Swarn in
a Slurry Bubble Column,’’ J. Chem. Eng. Jpn., 20 (1), 28 (1987).
Grund, G., A. Schumpe, and W. D. Deckwer, ‘‘Gas-Liquid Mass Transfer in a
Bubble Column with Organic Liquids,’’ Chem. Eng. Sci., 47 (13–14), 3509
(1992).
Gupta, P., M. H. Al-Dahhan, M. P. Dudukovic, and B. A. Toseland, ‘‘Compar-
ison of Single- and Two-Bubble Class Gas-Liquid Recirculation Models-
Application to Pilot-Plant Radioactive Tracer Studies during Methanol
Synthesis,’’ Chem. Eng. Sci., 56 (3), 1117 (2001).
Guy, C., P. J. Carreau, and J. Paris, ‘‘Mixing Characteristics and Gas Holdup of
a Bubble Column,’’ Can. J. Chem. Eng., 64 (1), 23 (1986).
Inga, J. R. and B. I. Morsi, ‘‘A Novel Approach for the Assessment of the Rate-
Limiting Step in Fischer-Tropsch Slurry Process,’’ Energy Fuels, 10 (3),
566 (1996).
Inga, J. R. and B. I. Morsi, ‘‘Effect of Catalyst Loading on Gas/Liquid Mass
Transfer in a Slurry Reactor: A Statistical Experimental Approach,’’ Can. J.
Chem. Eng., 75 (5), 872 (1997).
Jager, B. and R. Espinoza, ‘‘Advances in Low Temperature Fischer-Tropsch
Synthesis,’’ Catal. Today, 23 (1), 17 (1995).
Joseph, S., ‘‘Hydrodynamic and Mass Transfer Characteristics of a
Bubble Column,’’ Ph.D. Thesis, University of Pittsburgh, Pittsburgh,
U.S.A. (1985).
Kato, Y., A. Nishiwaki, T. Fukuda, and S. Tanaka, ‘‘The Behavior of Suspended
Solid Particles and Liquid in Bubble Columns,’’ J. Chem. Eng. Jpn., 5 (2),
112 (1972).
Koide, K., A. Takazawa, M. Komura, and H. Matsunaga, ‘‘Gas Holdup and
Volumetric Liquid-Phase Mass Transfer Coefficient in Solid-Suspended
Bubble Columns,’’ J. Chem. Eng. Jpn., 17 (5), 459 (1984).
Kojima, H., H. Anjyo, and Y. Mochizuki, ‘‘Axial Mixing in Bubble Column
with Suspended Solid Particles,’’ J. Chem. Eng. Jpn., 19 (3), 232 (1986).
Krishna, R., J. W. A. de Swart, J. Ellenberg, G. B. Martina, and C. Maretto,
‘‘Gas Holdup in Slurry Bubble Columns: Effect of Column Diameter and
Slurry Concentrations,’’ AIChE J., 43, 311 (1997).

L. Sehabiague et al. / Journal of the Chinese Institute of Chemical Engineers 39 (2008) 169–179 179
Krishna, R. and S. T. Sie, ‘‘Design and Scale-Up of the Fischer-Tropsch
Bubble Column Slurry Reactor,’’ Fuel Process. Technol., 64 (1),
73 (2000).
Krishna, R., M. I. Urseanu, and A. J. Dreher, ‘‘Gas Holdup in Bubble Columns:
Influence of Alcohol Addition Versus Operation at Elevated Pressures,’’
Chem. Eng. Process, 39 (4), 371 (2000).
Lee, S.-Y. and Y. P. Tsui, ‘‘Succeed at Gas/Liquid Contacting,’’ Chem. Eng.
Progr., 95 (7), 23 (1999).
Lemoine, R., A. Behkish, and B. I. Morsi, ‘‘Hydrodynamic and Mass Transfer
Characteristics in Organic Liquid Mixtures in a Large-Scale Bubble Col-
umn Reactor for the Toluene Oxidation Process,’’ Ind. Eng. Chem. Process
Des. Dev., 43 (19), 6195 (2004).
Lemoine, R., A. Behkish, L. Sehabiague, Y. Heintz, R. Oukaci, and B. I. Morsi,
‘‘An Algorithm for Predicting the Hydrodynamic and Mass Transfer Para-
meters in Slurry Bubble Column Reactors for Fischer-Tropsch Synthesis,’’
In: Proceedings of the Twenty Second Annual International Pittsburgh Coal
Conference, Pittsburgh, PA, September 12–16 (2005).
Lemoine, R., ‘‘Hydrodynamics, Mass Transfer and Modeling of the Liquid-
Phase Toluene Oxidation Process,’’ Ph.D. Thesis, University of Pittsburgh,
Pittsburgh, U.S.A. (2005).
Magaud, F., M. Souhar, G. Wild, and N. Boisson, ‘‘Experimental Study
of Bubble Column Hydrodynamics,’’ Chem. Eng. Sci., 56 (15), 4597
(2001).
Marano, J. J. and G. D. Holder, ‘‘Characterization of Fischer-Tropsch Liquids
for Vapor-Liquid Equilibria Calculations,’’ Fluid Phase Equilib., 138 (1–2),
1 (1997).
Maretto, C. and R. Krishna, ‘‘Modelling of a Bubble Column Slurry Reactor for
Fischer-Tropsch Synthesis,’’ Catal. Today, 52 (2–3), 279 (1999).
Moustiri, S., G. Hebrard, S. S. Thakre, and M. Roustan, ‘‘A Unified Correlation
for Predicting Liquid Axial Dispersion Coefficient in Bubble Columns,’’
Chem. Eng. Sci., 56 (3), 1041 (2001).
Nigam, K. D. P. and A. Schumpe, Three-Phase Sparged Reactors, Gordon and
Breach Publishers, Amsterdam, The Netherlands (1996).
O’Dowd, W., D. N. Smith, J. A. Ruether, and S. C. Saxena, ‘‘Gas and Solids
Behavior in a Baffled and Unbaffled Slurry Bubble Column,’’ AIChE J., 33(12), 1959 (1987).
Oshinowo, T. and M. Charles, ‘‘Vertical Two-Phase Flow. Part I. Flow Pattern
Correlations,’’ Can. J. Chem. Eng., 52 (1), 25 (1974).
Pino, L. Z., R. B. Solari, S. Siquier, L. Antonio Estevez, and M. M. Yepez,
‘‘Effect of Operating Conditions on Gas Holdup in Slurry Bubble Columns
with a Foaming Liquid,’’ Chem. Eng. Commun., 117 (1), 367 (1992).
Rados, N., M. H. Al-Dahhan, and M. P. Dudukovic, ‘‘Modeling of the Fischer–
Tropsch Synthesis in Slurry Bubble Column Reactors,’’ Catal. Today, 79–80, 211 (2003).
Ramachandran, P. A. and R. V. Chaudhari, Three Phase Catalytic Reactors,
Gordon and Breach, New York, NY, U.S.A. (1983).
Sarrafi, A., M. Jamialahmadi, H. Muller-Steinhagen, and J. M. Smith, ‘‘Gas
Holdup in Homogeneous and Heterogeneous Gas-Liquid Bubble Column
Reactors,’’ Can. J. Chem. Eng., 77 (1), 11 (1999).
Satterfield, C. N. and G. A. Huff, ‘‘Product Distribution from Iron Catalyst in
Fischer-Tropsch Slurry Reactors,’’ Ind. Eng. Chem. Process Des. Dev., 21(3), 465 (1982).
Satterfield, C. N. and I. C. Yates, ‘‘Intrinsic Kinetics of the Fischer-Tropsch
Synthesis on a Cobalt Catalyst,’’ Energy Fuels, 5 (1), 168 (1991).
Saxena, S. C., N. S. Rao, and P. R. Thimmapuram, ‘‘Gas Phase Holdup in Slurry
Bubble Column for Two- and Three-Phase Systems,’’ Chem. Eng. J., 49 (3),
151 (1992).
Saxena, S. C. and Z. D. Chen, ‘‘Hydrodynamics and Heat Transfer of Baffled and
Unbaffled Slurry Bubble Columns,’’ Rev. Chem. Eng., 10 (3–4), 195 (1994).
Shah, Y. T., S. Joseph, D. N. Smith, and J. A. Ruether, ‘‘Two-Bubble Class
Model for Churn Turbulent Bubble-Column Reactor,’’ Ind. Eng. Chem.
Process Des. Dev., 24 (4), 1096 (1985).
Shah, Y. T., B. G. Kelkar, S. P. Godbole, and W. -D. Deckwer ‘‘Design
Parameters Estimations for Bubble Column Reactors,’’ AIChE J., 28 (3),
353 (1982).
Shah, Y. T., C. A. Ratway, and H. G. McIlvried, ‘‘Back-Mixing Characteristics
of a Bubble Column with Vertically Suspended Tubes,’’ Trans. Inst. Chem.
Eng., 56 (2), 107 (1978).
Smith, D. N. and J. A. Ruether, ‘‘Dispersed Solid Dynamics in a Slurry Bubble
Column,’’ Chem. Eng. Sci., 40 (5), 741 (1985).
Soriano, J. P., ‘‘Mass Transfer Characteristics in an Agitated Slurry Reactor
Operating Under Fischer-Tropsch Conditions,’’ M.S. Thesis, University of
Pittsburgh, Pittsburgh, U.S.A. (2005).
Steynberg, A. and M. Dry, Fischer-Tropsch Technology, Elsevier Science,
U.S.A. (2004).
van der Laan, G. P., A. A. C. M. Beenackers, and R. Krishna, ‘‘Multicomponent
Reaction Engineering Model for Fe-Catalyzed Fischer-Tropsch Synthesis in
Commercial Scale Slurry Bubble Column Reactors,’’ Chem. Eng. Sci., 54(21), 5013 (1999).
Vermeer, D. and R. Krishna, ‘‘Hydrodynamics and Mass Transfer in Bubble
Columns in Operating in the Churn-Turbulent Regime,’’ Ind. Eng. Chem.
Process Des. Dev., 20 (3), 475 (1981).
Vosloo, A. C., ‘‘Fischer-Tropsch: A Futuristic View,’’ Fuel Process. Technol.,
71 (1–3), 149 (2001).
Wilhelm, D. J., D. R. Simbeck, A. D. Karp, and R. L. Dickenson, ‘‘Syngas
Production for Gas-to-Liquids Applications: Technologies, Issues and
Outlook,’’ Fuel Process. Technol., 71 (1–3), 139 (2001).
Yamashita, F., ‘‘Effects of Vertical Pipe and Rod Internals on Gas Holdup in
Bubble Columns,’’ J. Chem. Eng. Jpn., 20 (2), 204 (1987).
Zimmerman, W. H. and D. B. Bukur, ‘‘Reaction Kinetics over Iron Catalysts
Used for the Fischer-Tropsch Synthesis,’’ Can. J. Chem. Eng., 68 (2), 292
(1990).