modeling the ebola outbreak in west africa, december 9th 2014 update
TRANSCRIPT

DRAFT – Not for a.ribu2on or distribu2on
Modeling the Ebola Outbreak in West Africa, 2014
December 9th Update
Bryan Lewis PhD, MPH ([email protected]) presen2ng on behalf of the Ebola Response Team of
Network Dynamics and Simula2on Science Lab from the Virginia Bioinforma2cs Ins2tute at Virginia Tech
Technical Report #14-‐123

DRAFT – Not for a.ribu2on or distribu2on
NDSSL Ebola Response Team Staff: Abhijin Adiga, Kathy Alexander, Chris Barre., Richard Beckman, Keith Bisset, Jiangzhuo Chen, Youngyoun Chungbaek, Stephen Eubank, Sandeep Gupta, Maleq Khan, Chris Kuhlman, Eric Lofgren, Bryan Lewis, Achla Marathe, Madhav Marathe, Henning Mortveit, Eric Nordberg, Paula Stretz, Samarth Swarup, Meredith Wilson,Mandy Wilson, and Dawen Xie, with support from Ginger Stewart, Maureen Lawrence-‐Kuether, Kayla Tyler, Kathy Laskowski, Bill Marmagas Students: S.M. Arifuzzaman, Aditya Agashe, Vivek Akupatni, Caitlin Rivers, Pyrros Telionis, Jessie Gunter, Elisabeth Musser, James Schli., Youssef Jemia, Margaret Carolan, Bryan Kaperick, Warner Rose, Kara Harrison
2

DRAFT – Not for a.ribu2on or distribu2on
Currently Used Data
● Data from WHO, MoH Liberia, and MoH Sierra Leone, available at h.ps://github.com/cmrivers/ebola
● MoH and WHO have reasonable agreement ● Sierra Leone case counts censored up
to 4/30/14. ● Time series was filled in with missing
dates, and case counts were interpolated.
3
Cases Deaths Guinea 2,164 1,327 Liberia 7,690 3,145 Sierra Leone 7,754 1,583 Total 17,608 6,055

DRAFT – Not for a.ribu2on or distribu2on
Liberia – Case Loca2ons
4

DRAFT – Not for a.ribu2on or distribu2on
Liberia infec2on rate
5

DRAFT – Not for a.ribu2on or distribu2on
Liberia Forecast
6
11/03 to
11/09
11/10 to
11/16
11/17 to
11/23
11/24 to
11/30
12/1 to
12/7
12/8 to
12/14
12/15 to
12/21
12/22 to
12/28
12/29 to
1/04
1/05 to
1/11
1/12 to 1/8
Reported 362 185 187 156 431 -‐-‐ -‐-‐
Newer model 457 444 431 419 407 405 393 381 370 360 350
Reproduc2ve Number Community 0.3 Hospital 0.3 Funeral 0.3 Overall 0.9

DRAFT – Not for a.ribu2on or distribu2on
Liberia long term forecasts
7
Date Weekly forecast
12/08 404
12/15 392
12/22 381
12/29 370
1/05 360
1/12 349
1/19 339
1/26 330
2/2 320
2/9 311

DRAFT – Not for a.ribu2on or distribu2on
Sierra Leone – County Data
8

DRAFT – Not for a.ribu2on or distribu2on
Sierra Leone – case loca2ons
9

DRAFT – Not for a.ribu2on or distribu2on
Sierra Leone infec2on rate
10

DRAFT – Not for a.ribu2on or distribu2on
Sierra Leone Forecast
11
10/06 to
10/12
10/13 to
10/19
10/20 to
10/26
10/27 to
11/02
11/03 to
11/09
11/10 to
11/16
11/17 to
11/23
11/24 to
11/30
12/01 to
12/07
12/08 to
12/14
12/15 to
12/21
12/22 to
12/28
Reported 468 461 454 580 480 684 643 577 675 -‐-‐
Forecast original 566 690 841 1025 1250 1523 1856
Forecast change txm 430 524 561 565 595 624 654 686 719 754 791
35% of cases are hospitalized
ReproducMve Number Community 1.10 Hospital 0.37 Funeral 0.15 Overall 1.63

DRAFT – Not for a.ribu2on or distribu2on
SL longer term forecast
12
Sierra Leone – Newer Model fit – Weekly Incidence
2014-‐10-‐19 431 2014-‐10-‐26 524 2014-‐11-‐02 561 2014-‐11-‐09 591 2014-‐11-‐16 620 2014-‐11-‐23 650 2014-‐11-‐30 682 2014-‐12-‐07 715 2014-‐12-‐14 749 2014-‐12-‐21 786 2014-‐12-‐28 824

DRAFT – Not for a.ribu2on or distribu2on
Sierra Leone -‐ Prevalence
13
Date People in H+I
10/27/14 530 11/3/14 566 11/10/14 595 11/17/14 624 11/24/14 654 12/01/14 719 12/8/14 754 12/15/14 791 12/22/14 829 12/29/14 869
1/5 911 1/12 955 1/19 1001

DRAFT – Not for a.ribu2on or distribu2on
Guinea Forecasts
14
40% of cases are hospitalized
ReproducMve Number Community 0.70 Hospital 0.13 Funeral 0.09 Overall 0.93
10/09 to
10/15
10/16 to
10/19
10/23to
10/29
10/30to
11/05
11/06 to
11/12
11/13 to
11/19
11/20 to
11/26
11/27 to
12/03
12/04 to
12/10
12/11 to
12/17
12/18 to
12/24
12/25 to
1/01
Reported 175 129 143 12 136 121 142 52 69 -‐-‐
Forecast 118 118 115 112 109 106 103 100 97 94 91 89

DRAFT – Not for a.ribu2on or distribu2on
Guinea – longer term forecast
15
Date Weekly forecast
12/04 97
12/11 94
12/18 91
12/25 89
1/1 86
1/8 84
1/15 81
1/22 79
1/29 77

DRAFT – Not for a.ribu2on or distribu2on
Guinea Prevalence
16
Date People needing care
9/1/14 77 9/8/14 87 9/15/14 100 9/22/14 114 9/29/14 130 10/5/14 140 10/12/14 140 10/19/14 137 10/26/14 133 11/2/14 129 11/9/14 126 11/16/14 122 11/23/14 118 11/30/14 115 12/7/14 112 12/14/14 108 12/21/14 105 12/28/14 102

DRAFT – Not for a.ribu2on or distribu2on
APPENDIX Suppor2ng material describing model structure, and addi2onal results
17

DRAFT – Not for a.ribu2on or distribu2on
Legrand et al. Model Descrip2on
Exposednot infectious
InfectiousSymptomatic
RemovedRecovered and immune
or dead and buried
Susceptible
HospitalizedInfectious
FuneralInfectious
Legrand, J, R F Grais, P Y Boelle, A J Valleron, and A Flahault. “Understanding the Dynamics of Ebola Epidemics” Epidemiology and Infec1on 135 (4). 2007. Cambridge University Press: 610–21. doi:10.1017/S0950268806007217.
18
DRAFT – Not for a.ribu2on or distribu2on
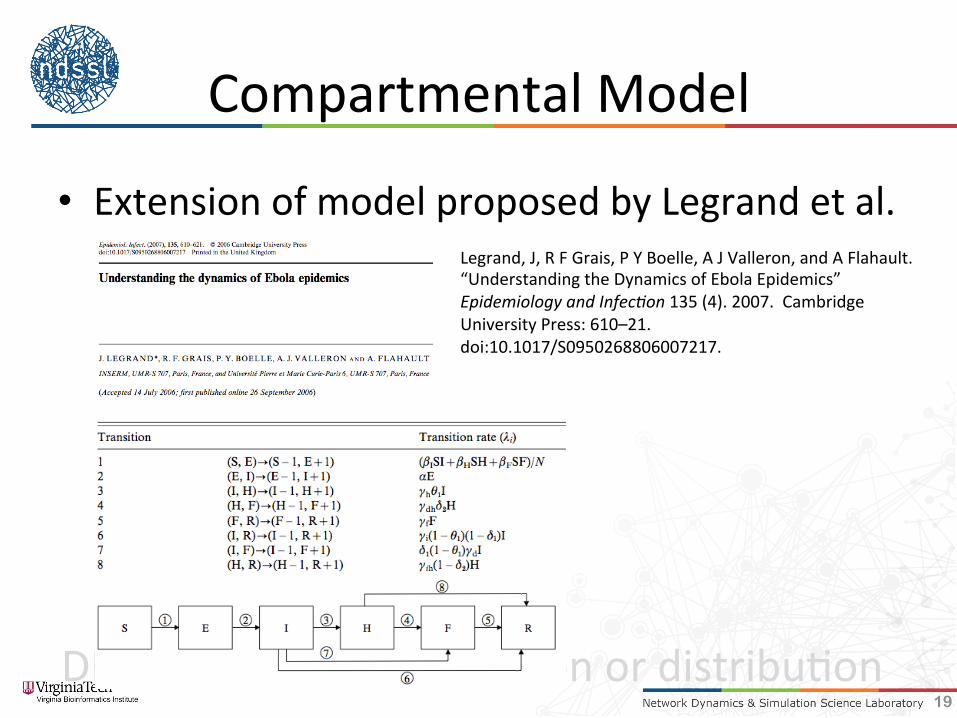
Compartmental Model
• Extension of model proposed by Legrand et al. Legrand, J, R F Grais, P Y Boelle, A J Valleron, and A Flahault. “Understanding the Dynamics of Ebola Epidemics” Epidemiology and Infec1on 135 (4). 2007. Cambridge University Press: 610–21. doi:10.1017/S0950268806007217.
19

DRAFT – Not for a.ribu2on or distribu2on
Legrand et al. Approach
• Behavioral changes to reduce transmissibili2es at specified days
• Stochas2c implementa2on fit to two historical outbreaks – Kikwit, DRC, 1995 – Gulu, Uganda, 2000
• Finds two different “types” of outbreaks – Community vs. Funeral driven outbreaks
20

DRAFT – Not for a.ribu2on or distribu2on
Parameters of two historical outbreaks
21

DRAFT – Not for a.ribu2on or distribu2on
NDSSL Extensions to Legrand Model
• Mul2ple stages of behavioral change possible during this prolonged outbreak
• Op2miza2on of fit through automated method
• Experiment: – Explore “degree” of fit using the two different outbreak types for each country in current outbreak
22

DRAFT – Not for a.ribu2on or distribu2on
Op2mized Fit Process • Parameters to explored selected – Diag_rate, beta_I, beta_H, beta_F, gamma_I, gamma_D, gamma_F, gamma_H
– Ini2al values based on two historical outbreak • Op2miza2on rou2ne
– Runs model with various permuta2ons of parameters
– Output compared to observed case count
– Algorithm chooses combina2ons that minimize the difference between observed case counts and model outputs, selects “best” one
23

DRAFT – Not for a.ribu2on or distribu2on
Fi.ed Model Caveats
• Assump2ons: – Behavioral changes effect each transmission route similarly
– Mixing occurs differently for each of the three compartments but uniformly within
• These models are likely “overfi.ed” – Many combos of parameters will fit the same curve – Guided by knowledge of the outbreak and addi2onal data sources to keep parameters plausible
– Structure of the model is supported
24