modelling and monitoring of intervention
TRANSCRIPT

.
March 24, 2015
Natal van Riel, Eindhoven University of Technology, the Netherlands
Dept. of Biomedical Engineering
Systems Biology and Metabolic Diseases
@nvanriel

Metabolic Syndrome
• Cluster of metabolic abnormalities
• obesity
• hypertension
• insulin resistance
• high TG
• low HDL-C
Rask-Madsen et al. (2012) Arterioscler Thromb Vasc Biol,
32(9):2052-2059
dyslipidemia

Systems Medicine of Metabolic Syndrome
• Resolving the disturbed dynamics and mechanisms
underlying the high triglyceride and low HDL
cholesterol phenotype and insulin resistance
• In patients with the metabolic syndrome and its
associated co-morbidities like cardiovascular disease,
type 2 diabetes, and fatty liver disease
• Through combining basic pre-
clinical and clinical research,
network analysis and
computational modeling
/ biomedical engineering PAGE 325-3-2015 www.resolve-diabetes.org

A mouse model for Metabolic Syndrome
• APOE*3-Leiden.CETP mouse (Cholesteryl ester transfer protein)
model for human-like lipoprotein metabolism
• high-fat diet (HFD / 60% energy)
obesity, hyperglycemia, impaired
glucose tolerance, insulin resistance
• HFD + 0.4% cholesterol
dyslipidemia, hepatic steatosis,
atherosclerosis
Westerterp et al. Arterioscler Thromb Vasc Biol. 2006; 26(11):2552-9
Yanan Wang, Yvonne Rozendaal

Mechanism-based model
• Differential equations
• Integrated system dynamics
• Prediction
Tiemann et al., PLOS Comput Biol 2013

Data analysis in longitudinal studies
• Mathematical parameters inferred from data
• Estimation of unobserved metabolic parameters
• At unobserved time points
• Data: black bars and white dots
• Model: the darker the more
likely
• Variability in data
differences in
accuracy of
mathematical
parameters
quantification of
uncertainty in
predictions
• ADAPT: Analysis of Dynamic
Adaptations in Parameter
Trajectories
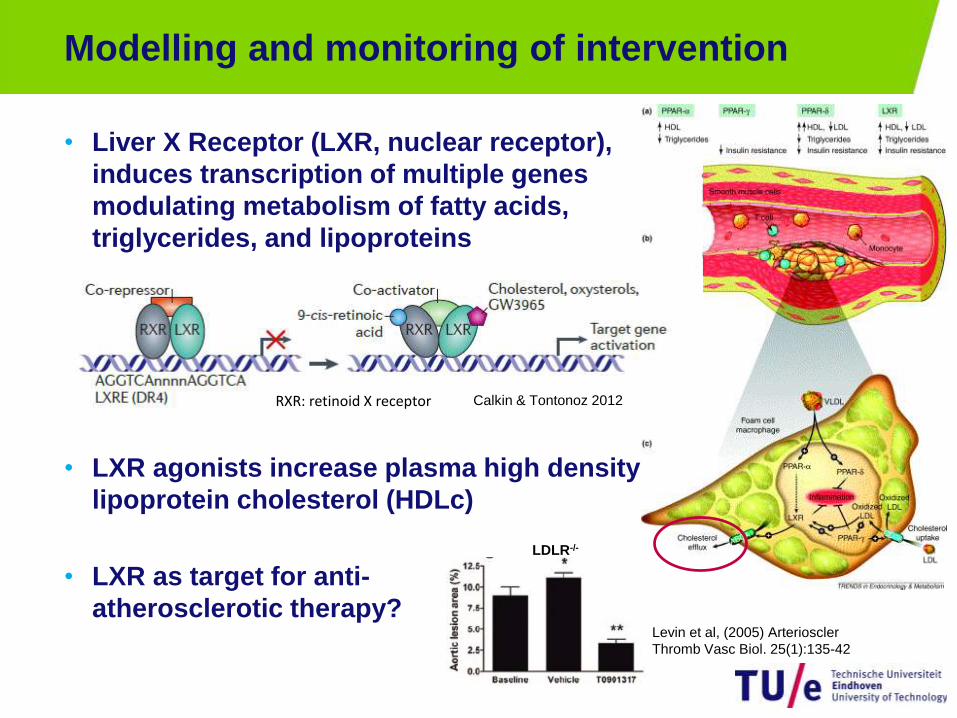
Modelling and monitoring of intervention
• Liver X Receptor (LXR, nuclear receptor),
induces transcription of multiple genes
modulating metabolism of fatty acids,
triglycerides, and lipoproteins
• LXR agonists increase plasma high density
lipoprotein cholesterol (HDLc)
• LXR as target for anti-
atherosclerotic therapy?Levin et al, (2005) Arterioscler
Thromb Vasc Biol. 25(1):135-42
LDLR-/-
RXR: retinoid X receptor Calkin & Tontonoz 2012

Modelling and monitoring of intervention
• Treated with T0901317 for 1, 2, 4, 7, 14, and 21 days
• Hypothesis 1: increase in HDLc is the result of increased
peripheral cholesterol efflux to HDL
Grefhorst et al. Atherosclerosis, 2012, 222: 382– 389
0 10 200
100
200Hepatic TG
Time [days]
[um
ol/g]
0 10 200
1
2
3Hepatic CE
Time [days]
[um
ol/g]
0 10 200
2
4
6Hepatic FC
Time [days]
[um
ol/g]
0 10 200
50
100Hepatic TG
Time [days]
[um
ol]
0 10 200
0.5
1
1.5Hepatic CE
Time [days]
[um
ol]
0 10 200
2
4Hepatic FC
Time [days]
[um
ol]
0 10 200
1000
2000
3000Plasma CE
Time [days]
[um
ol/L]
0 10 200
1000
2000
3000HDL-CE
Time [days]
[um
ol/L]
0 10 200
500
1000
1500Plasma TG
Time [days]
[um
ol/L]
0 10 206
8
10
12VLDL clearance
Time [days]
[-]
0 10 20100
200
300
400ratio TG/CE
Time [days]
[-]
0 10 200
5
10
15VLDL diameter
Time [days]
[nm
]
0 10 200
1
2
3VLDL-TG production
Time [days]
[um
ol/h]
0 10 201
2
3Hepatic mass
Time [days]
[gra
m]
0 10 200
0.2
0.4DNL
Time [days]
[-]

Analysis: HDL cholesterol
Analysis: increased excretion of cholesterol
Observation: increased HDLc

• SR-B1 (Scavenger Receptor-B1)
• Protein activity:
Reduced presence of SR-B1 in liver
membranes contributes to induction of HDLc
• HDL excretion and uptake flux
are increased
Tiemann et al., PLOS Comput Biol 2013
SR-B1 protein content is decreased in
hepatic membranes
Sr-b1 mRNA
expression not
changed
model: decreased
hepatic capacity to
clear cholesterol
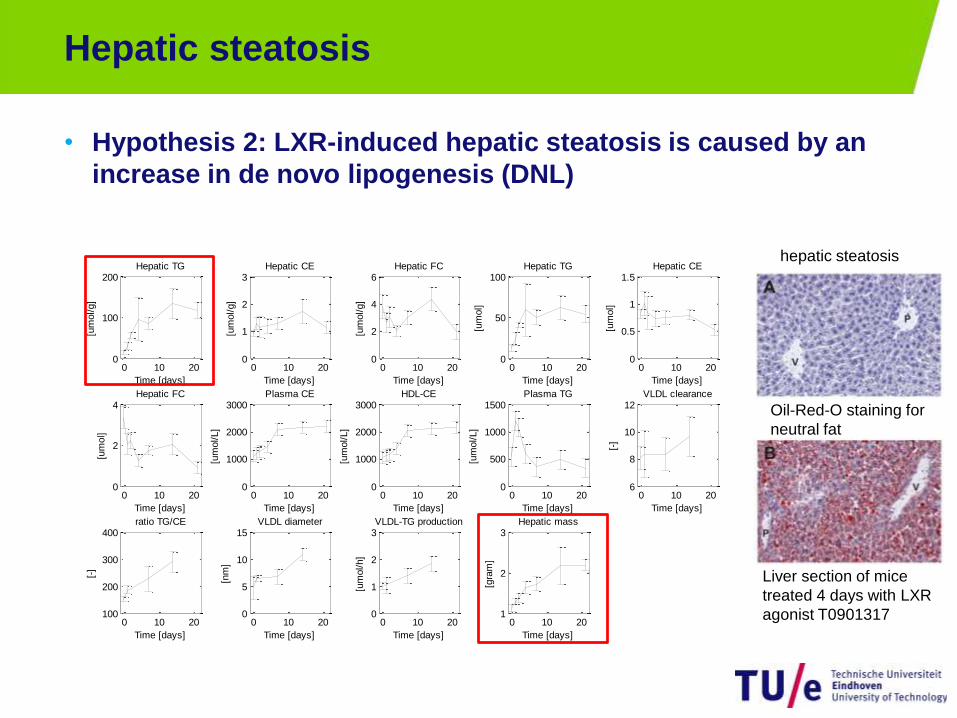
Hepatic steatosis
• Hypothesis 2: LXR-induced hepatic steatosis is caused by an
increase in de novo lipogenesis (DNL)
Liver section of mice
treated 4 days with LXR
agonist T0901317
Oil-Red-O staining for
neutral fat
hepatic steatosis
0 10 200
100
200Hepatic TG
Time [days]
[um
ol/g]
0 10 200
1
2
3Hepatic CE
Time [days]
[um
ol/g]
0 10 200
2
4
6Hepatic FC
Time [days]
[um
ol/g]
0 10 200
50
100Hepatic TG
Time [days]
[um
ol]
0 10 200
0.5
1
1.5Hepatic CE
Time [days]
[um
ol]
0 10 200
2
4Hepatic FC
Time [days]
[um
ol]
0 10 200
1000
2000
3000Plasma CE
Time [days]
[um
ol/L]
0 10 200
1000
2000
3000HDL-CE
Time [days]
[um
ol/L]
0 10 200
500
1000
1500Plasma TG
Time [days]
[um
ol/L]
0 10 206
8
10
12VLDL clearance
Time [days]
[-]
0 10 20100
200
300
400ratio TG/CE
Time [days]
[-]
0 10 200
5
10
15VLDL diameter
Time [days]
[nm
]
0 10 200
1
2
3VLDL-TG production
Time [days]
[um
ol/h]
0 10 201
2
3Hepatic mass
Time [days]
[gra
m]
0 10 200
0.2
0.4DNL
Time [days]
[-]

Increased hepatic FFA influx is the initial
contributor to hepatic TG accumulation
• [13C]16-palmitate infusion
Hijmans et al. (2014) FASEB J.
SFA = saturated fatty acid
C16:0 palmitate
C18:0 stearate
MUFA = monounsaturated fatty acid
C16:1 palmitoleate
C18:1 oleate

Agenda WG 4 session• 15.45-16.00 WG4 Natal Van Riel, Eindhoven University of
Technology
“Modelling and monitoring of intervention”
• 16.00-16.15 WG4 Peter Allegrini, Novartis (TBC)
“Imaging and interventions”
• 16.15-16.30 WG 4 3 min presentation from working group
participants
• Peter McCourt, University of Tromsø
• Carly Taylor, ETH Zurich
• Enrico Dall'Ara, University of Sheffield
• 16.30-17.00 Round table discussion on imaging and modelling
technologies
13