modelling pm in europe - dmu€¦ · modelling pm in europe ... aerosol dry deposition in-cloud...
TRANSCRIPT
University of AveiroUniversity of Aveiro
Modelling PM in Europe
A. I. Miranda, C. Borrego and J. Ferreira
Department of Environment and PlanningUniversity of Aveiro
PORTUGAL
Brussels November 2004
COST ACTION 633COST ACTION 633
Particulate Matter: Properties Related to Health EffectsParticulate Matter: Properties Related to Health Effects
University of AveiroUniversity of Aveiro
Air Quality Models to...
... simulate the � transport� chemical transformation� deposition of air pollutants
... more recently formation of secondary particles from gaseous precursors and particles
dynamics

University of AveiroUniversity of Aveiro
What kind of models?
According to mathematical approach� analytical models (gaussian type models)� statistical models (diagnostic models)� numerical models (prognostic models: eulerian, lagrangean).
According to air pollution problem� spatial scale: global, regional, mesoscale, urban, local, microscale� temporal scale: short-term, seasonal, long-term� chemical reactions: passive dispersion, photochemical, ...
There are different models for different applications !!!
As much complex is the model better results couldprovide, however more resources are needed!!!
but computer capacity and experts are also important
University of AveiroUniversity of AveiroWhat are the model inputs and outputs?
INPUTSMeteorology
Topography and LanduseEmissions
...
AIRQUALITYMODEL
AIR QUALITY
Air Pollutants Concentrations
EFFECTSHuman healthBuildings, Biota, Climate

University of AveiroUniversity of Aveiro
Regional Models � some examples
� Danish Eulerian Model DEMhttp://www.dmu.dk/AtmosphericEnvironment/DEM
� European Air Pollution Dispersion EURAD/FFAhttp://www.eurad.uni-koeln.de
� European Operational Smog EUROS
� Long Term Ozone Simulation LOTOS
� Multi-scale Atmospheric Transport and Chemistry MATCHhttp://www.smhi.se/sgn0106/if/meteorologi/match.htm
� REM3/CALGRID, Regional Eulerian Model + California
Grid Model
University of AveiroUniversity of Aveiro
Regional scale models
Primary organiccompound
SOA formation
Sub-grid depositioncorrection
Heterogeneous chemistry� N2O5 treatment
Aerosol dry deposition
In-cloud conversion
Size distribution
Aerosol Module
REM3CALGRID
MATCHLOTOSEUROSEURADDEM
University of AveiroUniversity of Aveiro
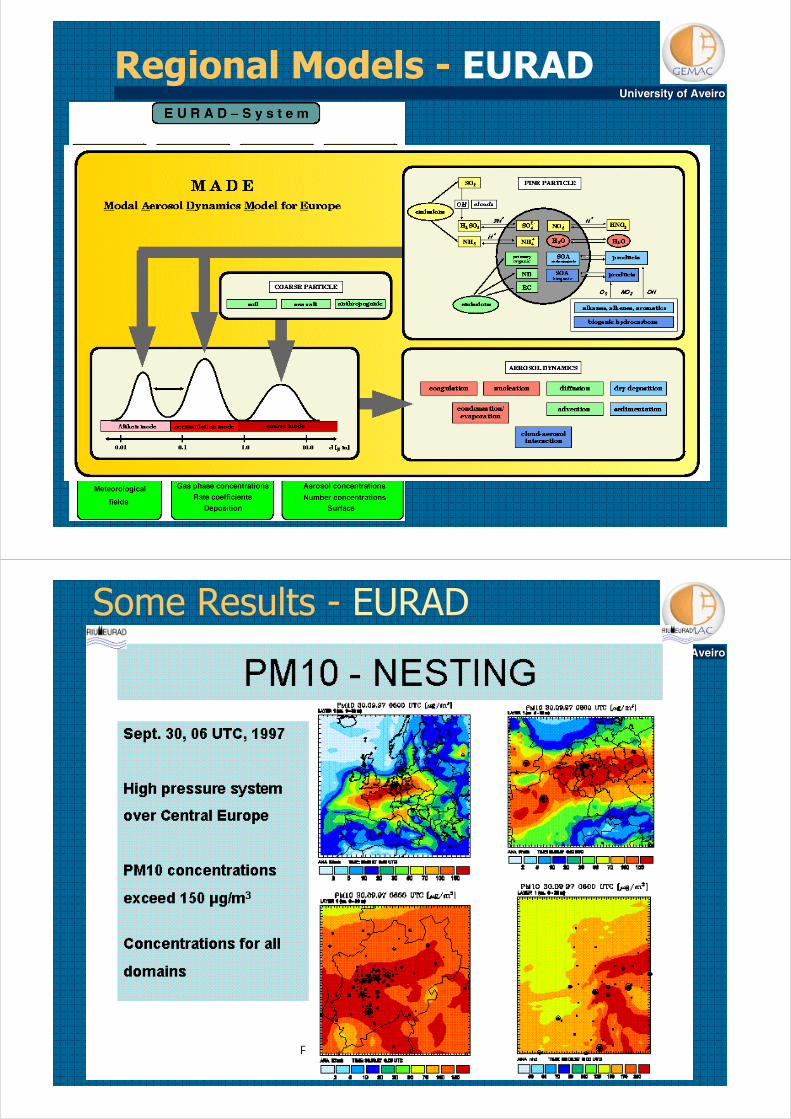
Regional Models - EURAD
University of AveiroUniversity of Aveiro
Some Results - EURAD
University of AveiroUniversity of Aveiro
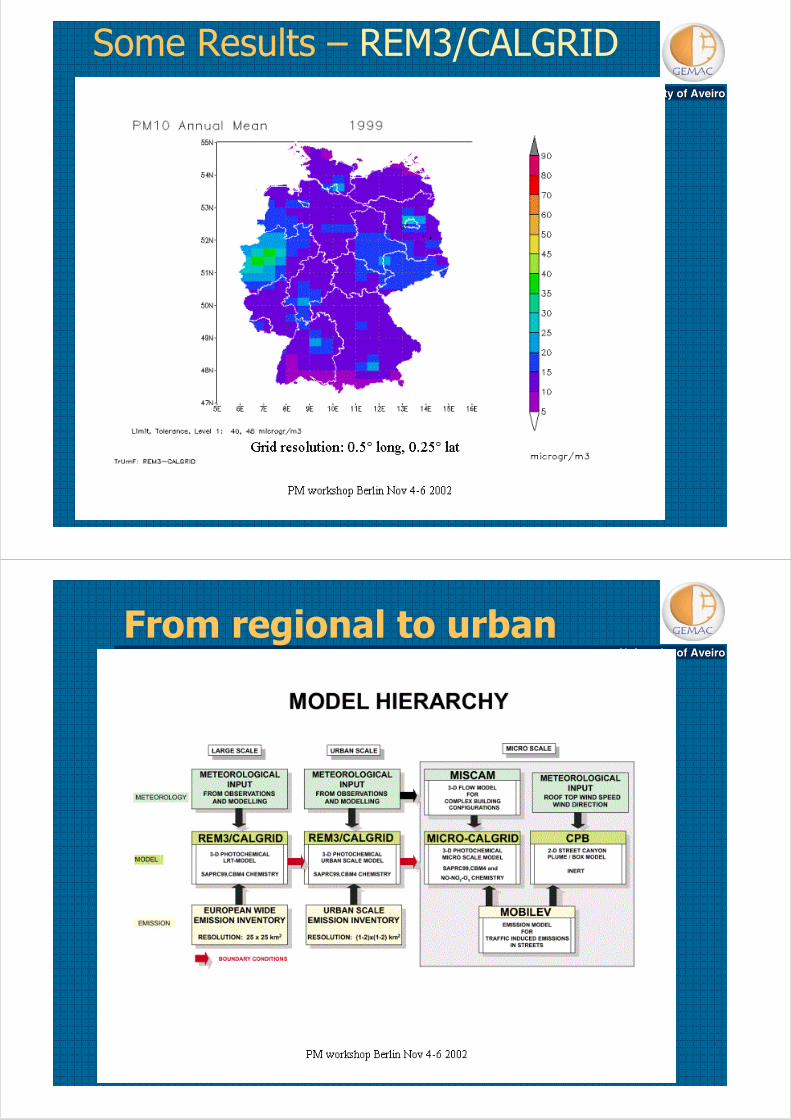
Some Results � REM3/CALGRID
University of AveiroUniversity of Aveiro
From regional to urban

University of AveiroUniversity of Aveiro
Some Results � REM3/CALGRID
University of AveiroUniversity of Aveiro
Urban scale � CITY DELTA
MAIN SCIENTIFIC OBJECTIVES:
� What is the influence of local versus regionalemission (reductions) on health-relevantmetrics for fine particles (PM10, PM2.5) andozone in urban air?
� How are predictions derived from regionalmodels (e.g. with a spatial resolution of 50*50km) different from predictions obtained withfiner resolved models?
� What is the range of agreement betweendifferent scale dispersion models on the level ofresponses to emission changes?
http://rea.ei.jrc.it/netshare/thunis/citydelta/

University of AveiroUniversity of Aveiro
Urban scale � CITY DELTA
http://rea.ei.jrc.it/netshare/thunis/citydelta/
Berlin Copenhagen Katowice London Milan Paris Prague
5km
10km
50km
5km
10km
50km
5km
10km
50km
5km
10km
50km
5km
10km
50km
5km
10km
50km
5km
10km
50km
THOR P P P P P P P P P P P P
REM3 P - - - - - - - - - - - - - - - - - - - -
MCCM P - P - - - P - P - - - - - - - - - - - -
CHIMERE
P - P - - - - P - P P - P P - P -
OFIS P - - P P P P
EMEP - - P - - P - - P - - P - - P - - P - - P
LOTOS
- - - - - - - - - - - - P P P - - -
University of AveiroUniversity of Aveiro
MEMO results � PM
08h
PM10(µg.m-3)
10h
PM10(µg.m-3)
12h
PM10(µg.m-3)
15h
PM10(µg.m-3)
18h
PM10(µg.m-3)
20h
PM10(µg.m-3)
22h
PM10(µg.m-3)
Applications � Mesoscale

University of AveiroUniversity of Aveiro
Applications � Regional Scale
MEMO results and validation� PM
LOURES
0
50
100
150
200
250
300
350
400
1 2 3 4 5 6 7 8 9 10 11 12 13 14 15 16 17 18 19 20 21 22 23
hour
PM10
( µg.
m-3
)
Observed Simulated
ENTRECAMPOS
0
50
100
150
200
250
300
350
1 2 3 4 5 6 7 8 9 10 11 12 13 14 15 16 17 18 19 20 21 22 23
hourPM
10( µ
g.m
-3)
Observed Simulated
REBOLEIRA
0
20
4060
80
100
120
140160
180
200
1 2 3 4 5 6 7 8 9 10 11 12 13 14 15 16 17 18 19 20 21 22 23
hour
CO( µ
g.m
-3)
Observed Simulated
University of AveiroUniversity of Aveiro
define the boundaryconditions for the local scaleapplication
mesoscalemesoscalemodelmodel
CFD model application used forthe estimation of hourly PM10concentrations in indoormicroenvironments
CFD modelCFD modelpopulationpopulation
exposure modelexposure model
From urban to local scale

University of AveiroUniversity of Aveiro
1000 m
1000
m
EntrecamposAir Quality Station
Local scale modelling
VADISVADISCFD model developed at the University of Aveiro
Simulation domain
! 1000m x 1000m x 60m in Lisbon city centre
! resolution 5m x 5m x 3m
! 29 buildings with an average height of 12 m
! 8 main roads
University of AveiroUniversity of Aveiro
Results and Discussionmesoscale modelling
PM10 concentrations reacha maximum of 160 µg.m-3
MEMOMEMO-PM -PM resultsresults – – Wind Wind and PM10 concentration fields at 9:00
2828thth of February 2000 of February 20009:009:00

University of AveiroUniversity of Aveiro
Results and Discussionlocal scale modelling
PM10 concentration values insidethe domain are above the daily limitvalue of 50 µg.m-3
0 100 200 300 400 500 600 700 800 900 1000
West/East (m)
0
100
200
300
400
500
600
700
800
900
1000
Sou
th/N
orth
(m
)
70
80
90
100
110
120
130
140
150
160
0 100 200 300 400 500 600 700 800 900 10000
100
200
300
400
500
600
700
800
900
1000
PM10[µg.m-3]
VADIS results - VADIS results - WindWind and PM10 concentration fields at 9:00 and PM10 concentration fields at 9:00
2828thth of February 2000 of February 20009:009:00
Entrecampos air quality station
Road network
University of AveiroUniversity of Aveiro
! highest values of APEI50 found in schools and faculties
! high APEI50 values in some office buildings in the vicinity of roads
Results and Discussionpopulation exposure modelling
APEI50 field for 9:00 with microenvironments distribution

University of AveiroUniversity of Aveiro
SEMI-EMPIRICIAL MODELS(based on PM measurements)
University of AveiroUniversity of Aveiro
Future work
Continue the review on PM modelling in Europe
Understand the needed data
... ???