modelling steam distillation for essential oil production
TRANSCRIPT

Modelling Steam Distillation
For Essential Oil Production
by
Mitchell Glenister
A thesis submitted to Murdoch University
to fulfil the requirements for the degree of
Bachelor of Engineering (Hons)
in the discipline, of
Instrumentation and Control Engineering
&
Industrial Computer Systems Engineering
Academic Supervisor: Professor Parisa Arabzadeh Bahri
January 2017


iii
Author’s Declaration
I declare that this thesis is my own account of my research and contains as its main
content work which has not previously been submitted for a degree at any tertiary
education institution.
Mitchell Glenister


v
Abstract
The production of essential oil has remained unchanged for decades. In the face of
increased competition from low cost suppliers the requirement to reduce the cost of
production is facing many producers. The application of a counter-current system to the
steam distillation of essential oils the transition from traditional production methods to
more efficient methods was evaluated. Modelling a system using existing mathematical
models found in the literature provided a basis for the comparison between the old and
the new.
The question of the conversion of operating principles was met with the findings that the
system is immature in inception. Further research is required to address the technical
issues of introducing and removing plant material from a distillation column without
interrupting the flow of steam. Initial bench tests have confirmed the benefits of moving
to a non-batch system, this research is in its infancy with many further tests required to
cement the findings of this thesis. Substantial portions of this thesis have been redacted
or limited details provided, as large sections of the research are of a confidential nature.


vii
Acknowledgements
Firstly, I would like to thank my academic supervisor Professor Parisa Bahri for taking
on the role of supervising this thesis and the continuous support that you provided
throughout the project. I am forever grateful for your wisdom and advice when dealing
with the difficult situations that arise when dealing with external sources.
To the friends and family that I neglected for my studies. I thank you for your patience
and understanding. I do intend to be present more often in the future.
A big mention to my fellow students. For all the laughs and conversations, we have had
over the years. Hopefully the late nights pay off for us all.
And most importantly of all. My loving girlfriend, Shelby Wilson for putting up with all
the nights that I didn’t come home until late, or not at all. I could not have completed this
without you.


ix
Table of Contents
Author’s Declaration ...................................................................................................... iii
Abstract ............................................................................................................................. v
Acknowledgements ....................................................................................................... vii
Table of Contents ........................................................................................................... ix
List of Figures ................................................................................................................. xi
List of Tables ................................................................................................................ xiii
List of Abbreviations and Notations ............................................................................... 14
Chapter 1 Introduction ............................................................................................... 15
Chapter 2 Review of the Literature ............................................................................ 16
2.1 Essential Oil .............................................................................................. 16
2.2 Extraction Techniques ............................................................................... 16
2.2.1 Solvent Extraction ..................................................................................... 16
2.2.2 Steam Distillation ...................................................................................... 18
2.3 Modelling of Steam Distillation ................................................................ 20
2.4 Non-Batch Processing of Essential Oils .................................................... 21
Chapter 3 Model Development .................................................................................. 22
3.1 Batch Steam Distillation Model ................................................................ 22
3.2 Counter-Current Steam Distillation Model ............................................... 28
3.3 Economic Modelling ................................................................................. 30

x
Chapter 4 Simulation Results ..................................................................................... 34
4.1 Model Initial Testing ................................................................................. 34
4.2 Sensitivity Analysis ................................................................................... 36
4.2.1 Steam Rate Comparison ............................................................................ 36
4.2.2 Material Input Concentration .................................................................... 39
4.2.3 Partial Pressure of Essential Oil ................................................................ 42
4.2.4 Feed Rate of Material ................................................................................ 44
Chapter 5 Economic Analysis Results ....................................................................... 47
5.1 Cost-Revenue Imbalance ........................................................................... 47
5.2 Determination of Ideal Feed Rate ............................................................. 48
5.3 Batch Model with Lower Overheads ........................................................ 53
5.4 Comparison between Systems ................................................................... 57
5.5 Cost of Counter-current ............................................................................. 58
Chapter 6 Conclusion ................................................................................................. 59
6.1 Future Recommendations .......................................................................... 60
Chapter 7 References ................................................................................................. 61
Appendix A 63

xi
List of Figures
Figure 2-1 Steam Distillation Apparatus for Essential Oil Extraction [1] .................... 19
Figure 3-1 Flow Chart of Model Operations [4] ............................................................ 28
Figure 3-2 Simulink Output of Current Profit Output from Model ................................ 32
Figure 3-3 Asymptotic Curve of Yield ........................................................................... 32
Figure 4-1 Generic Model Steam Concentration Output of Batch System .................... 34
Figure 4-2 Generic Model Steam Concentration Output of Batch System .................... 35
Figure 4-3 Material Concentration with 200 kg/hr Steam Flow .................................... 37
Figure 4-4 Material Concentration with 250 kg/hr Steam Flow .................................... 37
Figure 4-5 Steam Concentration Response to Increase in Steam Rate from 200-
250 kg/hr ................................................................................................... 38
Figure 4-6 Comparison of 5 Different Initial Oil Concentrations Over Time................ 40
Figure 4-7 Mass of Oil Remaining Over 20 Hour Period of 5 Starting
Concentrations ........................................................................................... 41
Figure 4-8 Effect on Processing Time of Differing Oil Solubilities in Steam ............... 43
Figure 4-9 Concentration Profiles of Various Feedrates ................................................ 45
Figure 5-1 Graphically Determining the Decrease in Profitability ................................ 53
Figure 5-2 Graphical Determination of Profitability in a Low-Cost Area ..................... 54
Figure 5-3 General Flow Chart of Batch Processes ....................................................... 54
Figure 5-4 Mass of Oil Remaining in System ................................................................ 55


xiii
List of Tables
Table 3-1 Revenue and Cost Breakdown Per Hour ........................................................ 31
Table 4-1 Residence Time and Outlet Data for Varying Mass Flow Rates ................... 46
Table 5-1 Hypothetical Costs for Operation of Plant ..................................................... 47
Table 5-2 Generated Revenue and Cost to Process 1 Ton of Material........................... 48
Table 5-3 Output from Optimization Excel Spreadsheet on basis of 1 Ton at 1.5%
Oil .............................................................................................................. 49
Table 5-4 Run Condition Input for Optimization Spreadsheet...................................... 50
Table 5-5 Time to Process Batch with Proportions ........................................................ 56
Table 5-6 Profit Comparison of Batch and Counter-current Steam Distillation ............ 58

14
List of Abbreviations and Notations
a Specific Mass Transfer Area m2 kg-1
Gs Mass flowrate of Steam kg hr-1
K Overall Mass Transfer Coefficient kg oil h-1 m-2
Mi Mass of Inert part of Material kg
min Rate of Material Input and Output kg hr-1
moil Mass of Oil Contained in Material kg
P0 Partial Pressure of Oil kPa
s In Column Steam
to Material Ration
kg steam kg-1
material
x Material Oil Mass Fraction kg oil kg-1 material
Xin Material Input Concentration kg oil kg-1 material
y Steam Oil Mass Fraction kg oil kg-1 steam
yin Inlet Steam Oil Mass Fraction kg oil kg-1 steam
α Proportionality Parameter kPa-1
ε Column Voidage unit less
ρs Steam Density kg m-3
Ω (m2) Available Surface Area for Mass Transfer m2

15
Chapter 1 Introduction
The rationale for this project is as a response to the Australian Government Rural
Industries and Research Corporation’s (RIRC) publication “New and Emerging Plant
Industries Three-Year RD&E Plan (2015-2018)”. The RIRC aims to increase the
competitiveness of Australian essential oil producers in the face of increased competition
from low cost producers in developing nations, where the cost of labour is substantially
lower than Australia’s own. Improving production techniques to increase profitability and
quality control have been identified within the plan.
To address the needs to improve the current production techniques for essential oil
production, a review of the current production methods was required. During the research
of essential oil production, the use of batch processes has proven to be in widespread use
[1]. A possible solution to improving profitability was identified in the use of a counter-
current system.
A comparison between the proposed counter-current system and the existing batch system
was required. To do this the basic operating conditions of the two would be explored with
a sensitivity analysis of process operating conditions and economic analysis. This is an
area that yielded no information in the literature review of this project in relation to
essential oil production by steam distillation. Research uncovered references to a small
number of non-batch steam distillation systems [1] [2]. These systems are of great
commercial value, and such have limited details available due to confidentiality reasons.
The lack of an apparatus to test the theory led to the formation of a computer simulation
as a substitute. The validation of such simulations requires external data. Upon receipt of
this data comparison can be made based on the production costs of the systems.

16
Chapter 2 Review of the Literature
2.1 Essential Oil
Essential oils are the fragrant oils extracted from plant materials that produce the
characteristic fragrance or essence associated with the plant [3]. Uses for essential oils
and other plant extracts range from perfumery and flavouring to their incorporation in
pharmaceuticals, including traditional medicine [1]. There is documented use of essential
oils in India dating back to 2000 BC, with descriptions of hundreds of aromatic substances
and their uses for religious and medicinal purposes [3]. The produced oil, though as close
as reasonably possible, is altered in composition to the underlying oil in the plant material.
The separation process selected for the oil extraction determines the overall degree of
variation.
2.2 Extraction Techniques
As stated in the previous section the method employed to separate the oil into a useable
state is a major factor in the composition of the extracted oil. Two of the most widely
used techniques are briefly explained in the following sections.
2.2.1 Solvent Extraction
The use of a solvent to extract oil within the solid plant material is a common practice for
the processing of delicate materials that are susceptible to heat damage [4]. The oil within
the material diffuses into the solvent until the concentration of the oil is in equilibrium
between the material and the solvent.

17
The use of hydrocarbon solvents for essential oil processing is the norm in the studied
literature, with hexane being the most frequently mentioned solvent referenced. To isolate
the oil from the solvent, the solvent is evaporated [1]. The solvent extracts the oil soluble
compounds within the plant material. These include the waxes and resins which produce
a semi-solid material known as a concrete.
Separating the oil from the semi-solid concrete involves the dissolution of the concrete
into another solvent. Distillation of the new solution is performed with the more volatile
compounds evaporating and leaving the residual waxes and resins. The use of the solvents
introduces the risk of small traces of the solvent carrying over into the final product [5].
With a trend of environmental and “green” marketing the presence of petroleum based
solvents, such as hexane, in the produced goods reduces the appeal to customers [5]. For
this reason, solvent extraction was not explored in this report.

18
2.2.2 Steam Distillation
Steam distillation is the extraction technique that produces majority of essential oil
production [1]. Steam is introduced into the bottom of the chamber containing the plant
material and moves within the voids of the packed material. The use of steam allows for
the extraction of the oils at temperatures lower than their boiling point [1].
The boiling point of some components of essential oils can be significantly higher than
the temperature at which they are susceptible to thermal degradation [6]. The use of steam
allows for the distillation to be performed at lower temperatures, generally below 100°C.
The vapour pressure of the oil components is what allows the oils to be extracted at lower
temperatures.
Each component exhibits its own vapour pressure at a given temperature, it is the sum of
these partial vapour pressures that make up the system pressure [1]. A mixture will boil
when the sum of these vapour pressures is equal to the atmospheric temperature. The
implication of this is that the mixture will boil at a temperature lower than the temperature
of the pure components. It is for this reason the high boiling temperature components can
be extracted at lower temperatures.
A typical steam distillation setup is presented in Figure 2-1. The still section is filled with
the solid plant material, which is packed using differing methods based on the feed stock,
with steam injected into the bottom section from an external boiler. The steam-oil mixture
exiting the still is fed to a condenser. The role of the condenser is to reduce the
temperature of the steam-oil mixture until the steam returns to a liquid state.

19
Figure 2-1 Steam Distillation Apparatus for Essential Oil Extraction [3]
Upon exiting the condenser in steam distillation, the oil and condensed steam form two
immiscible layers. A separation of the layers is required which is traditionally performed
in a Florentine flask. The Florentine flask allows the two layers to be drawn off separately.

20
2.3 Modelling of Steam Distillation
Several models have been proposed in the researched literature for steam distillation of
essential oils. Each of these models is shown to fit the experimental data to very high
degrees. The issue with these approaches is in the application to only the plant material
that they are investigating and under strict laboratory conditions. Thus, models developed
for specific processes cannot be applied to other processes accurately.
The sterility of the testing, and the various models each closely fitting the experimental
data was an area of concern. Selection of a model from the list of possible models was
therefore complicated. A decision was made to narrow the possible models to two
candidates. The first involved a kinetic model and was presented in the case of the steam
distillation of aniseed [7]. The second available model was based on the diffusion of oil
into steam with members of the Baccharis genus of plants [8].
Selection of the final model to be used in this thesis was based upon the availability of
data. A company was approached for data regarding their oil production; they provided
production data and model parameters which resulted in the kinetic model for aniseed oil
production to be selected.

21
2.4 Non-Batch Processing of Essential Oils
Available information for essential oil production that does not rely upon batch
processing is severely limited. Several different operators are mentioned as having
implemented counter-current systems, these include Texarome in the USA for cedar
wood oil production and BIOLANDES in France for dwarf pine oil production [1] [2].
Specific details of the developed processes are unavailable, as the essential oil market is
very competitive, and so innovation and processing techniques are not widely shared or
reported.
The lack of available details limits the ability to provide cost estimates on the
implementation of new counter-current systems. This is due to uncertainty in the method
of introducing and removing material to the system with no interruption of steam supply.

22
Chapter 3 Model Development
This section of the text demonstrates the formation of a working Simulink model to
simulate the extraction of essential oils from the non-essential oil portion. Several
assumptions have been outlined throughout the process of deriving and implementing the
model into Simulink, most of which have eased the implementation greatly. These
simplifications have allowed a complex problem to be broken down into manageable
parts and assembled into a working simulator that allows for sizing configurations to be
tested and analysed. The analyses of altering the parameters of the process is presented
within this section, with results contained in the sensitivity analysis sections of this report.
3.1 Batch Steam Distillation Model
Development of a model for the extraction of essential oils in a batch process has been
studied by numerous research teams in the past. Each has developed a model that is
believed to accurately represent the mode of extraction taking place. The choice of model
for this project was based on the availability of data provided by an external source, which
for confidentiality reasons will not be presented within this paper. The model was based
upon work to develop a kinetic model for the extraction of anethole from Tunisian aniseed
[7]. As previously stated the data provided was considered confidential resulting in the
model presented to be of a hypothetical essential oil. The benefits of this approach lend
themselves to other essential oils, and it is intended that the application of this model
development can be easily adapted to various essential oils in the future with minimal
model corrections.

23
The model presented considered the oil to be made up of single pseudo-constituent with
the largest component being the modelled oil, which in the case of aniseed is anethole,
constitutes 80-94% of the total essential oil of aniseed [7]. The use of a simplified model
has its benefits in the model development, a single component leads to a single case of
mass transfer, whereas multiple components would lead to several different mass transfer
calculations being required. For the purpose of model simplification, and based on the
available academic literature,the following list of assumptions were made for the steam
extraction model [7];
I. The essential oil is considered as a single component.
II. Constant temperature and pressure along the length of the column.
III. The feedstock was considered to behave like a porous material.
IV. The steam flow has no effect on the movement of the particles of the
essential oil-bearing material.
V. The size and shape of the particles is unaffected by the extraction
process, they remain spherical and do not change in size throughout the
process.
VI. Condensation of steam does not occur in the column.
VII. Diffusion of steam within the pores of the material is negligible.
VIII. Initially, the composition in oil is homogenous.

24
A linear driving force is the main method for determining the rate of extraction of the oil
from the oil bearing material. The use of which plays a major role later in the work of
determining the optimal rate of steam flow to the column. To begin the modelling an
overall mass balance of the oil within the column was taken to be equal to the change in
oil composition of the steam at the boundaries of the column as presented in Equation
3-1.
𝐺𝑠𝑦𝑖𝑛 − 𝐺𝑠𝑦(𝑡) = 𝑑𝑚𝑜𝑖𝑙
𝑑𝑡
Equation 3-1 Column Overall Oil Mass Balance [7]
Where moil is the mass of oil contained within the column, yin (kg oil kg-1 steam) is the
essential oil content of the steam entering the column, y(t) is the essential oil fraction by
mass of the outlet steam (kg oil kg-1 steam) and GS (kg hr-1) represents the rate of steam
addition to the column. For the batch model the steam entering the column is fresh steam
from an external boiler which contained no oil and so was dropped from subsequent
equations. Upon dropping the variable yin and a slight rearrangement Equation 3-1
becomes Equation 3-2. Equation 3-2 relates the outlet steam concentration to the rate of
oil extraction and the steam flowrate.
𝒚(𝒕) = −𝟏
𝑮𝑺
∗𝒅𝒎𝒐𝒊𝒍
𝒅𝒕
Equation 3-2 Fresh Steam Overall Oil Mass Balance [7]

25
The mass of oil contained within the material is equal to the product of the concentration
of the oil, x, (kg oil kg-1 material) and the total mass of plant material in the column (kg).
Combining the mass of oil within the material and the mass of oil entrained with the
steam, the total mass of oil in the column at any given time, t, can be found. The total
mass balance of oil in the column is shown in Equation 3-3, with ε, ρs and Vc representing
the column voidage, density of steam (kg m-3) and the volume of the column (m3)
respectively.
𝑚𝑜𝑖𝑙 = 𝑚𝑚𝑎𝑡𝑒𝑟𝑖𝑎𝑙𝑥(𝑡) + 𝜀𝜌𝑠𝑉𝑐𝑦(𝑡)
Equation 3-3 Mass of Oil in Column [7]
The material can be split into two distinct components, the oil portion and an inert
portion. The mass of the inert portion is unchanged over the length of the distillation
process and is related to the mass of the material by Equation 3-4.
𝑀𝑖 = 𝑚𝑚𝑎𝑡𝑒𝑟𝑖𝑎𝑙 (1 − 𝑥(𝑡))
Equation 3-4 Mass of Inert [7]
Substituting mmaterial with Mi and differentiating Equation 3-3 provides the change in the
mass of oil in the column, represented by Equation 3-5.
𝑑𝑚𝑜𝑖𝑙 = 𝑀𝑖
𝑑𝑥
(1 − 𝑥)2+ 𝜀𝜌𝑠𝑉𝑐𝑑𝑦
Equation 3-5 Mass Balance of Column Oil Content [7]

26
Considering no net change in the total mass of oil, the mass of oil taken up by the steam
is equal to the loss in mass of the material. The final step of the mass balance equations
is to substitute the change in the mass of oil in the column with the rate of oil exiting the
column with the steam. Combining Equation 3-1 and Equation 3-5 yields the mass
balance of oil in the column in terms of the flow of steam through the column and the
steam content sent to the condenser of the system.
−𝐺𝑆𝑦𝑑𝑡 = 𝑀𝑖
𝑑𝑥
(1 − 𝑥)2+ 𝜀𝜌𝑠𝑉𝑐𝑑𝑦
Equation 3-6 Mass Balance in Terms of Steam Flow [7]
The presented mass balance equations have so far provided a relationship between the
flow of steam in the system and the change in the total oil content of the system. The rate
that oil is transferred from the material to the steam is a requirement of the model. The
aniseed reference model was presented using an overall mass transfer coefficient, K (kg
oil h-1 m-2), which relates the rate of oil extraction to the material oil concentration and is
shown in Equation 3-7.
−𝑑𝑚𝑜𝑖𝑙
𝑑𝑡= 𝐾Ω(𝑥 − 𝑥∗)
Equation 3-7 Rate of Extraction [7]
The rate of extraction is dependent on the surface area available for mass transfer, Ω (m2)
and the difference between material oil concentration and a concentration considered to
be in equilibrium with steam, x*. The value for x* was found to be difficult to directly
determine, and was subsequently replaced with a proportionality constant, α (kPa-1) ¸
multiplied by the oil vapour pressure, P0 (kPa), for a given temperature and pressure [7].
The overall mass transfer coefficient, and proportionality constant were found by
combining Equation 3-5 and Equation 3-7 to form and fitting to experimental data [7].

27
𝑀𝑖
(1 − 𝑥)2
𝑑𝑥
𝑑𝑡 + 𝜀𝜌𝑠𝑉𝑐
𝑑𝑦
𝑑𝑡= −𝐾Ω(x − α𝑃0)
Equation 3-8 Overall Mass Transfer Equation [7]
Dividing both sides of Equation 3-8 by the mass of material in the column converts the
available surface area Ω, and the mass of steam in the column to be in terms of the mass
of material. These new variables become; the specific mass transfer area a (m2 kg-1), and
the mass of steam in the column becomes a new variable s (kg steam kg-1 material). The
purpose of this step is to reduce the complexity of the equation by making the coefficient
of the dx/dt term approximated to 1 [9]. The final equation, presented in Equation 3-9,
with the fitting of experimental data to determine the values for K and α, which was
provided by the company that supplied experimental data for this report.
𝑑𝑥
𝑑𝑡 + 𝑠
𝑑𝑦
𝑑𝑡= −𝐾a(x − α𝑃0)
Equation 3-9 Final Mass Transfer Equation [7]

28
3.2 Counter-Current Steam Distillation Model
The determination of the counter-current model relied on the equations presented in
Chapter 3.1, with the column being separated into several sections of equal volume with
the flow of material in the column considered to be in a perfect plug flow. The sections
were arrayed in a formation in which the outputs of each section become the inputs of the
proceeding section as demonstrated in Figure 3-1. The material depleted of oil is removed
at or near the point of steam entry to the column, this ensures the material on exit has
minimal residual oil. The mass of the inert portion of the input and output streams of
material are equal, ensuring no net gain of inert in the plug flow reactor model.
Figure 3-1 Flow Chart of Model Operations [10]
Employing Equation 3-1 with the GS * yin term no longer removed for all sections, barring
the steam entry point, the change in each sections oil content is equal to the change in the
steam oil concentration at the boundaries of the section. The concentration of oil in the
steam can be found at the boundaries of the section through Equation 3-10 [7].
29
𝑦(𝑡) = − 1
𝐺𝑆∗
𝑑𝑚𝑜𝑖𝑙
𝑑𝑡+ 𝑦𝑖𝑛
Equation 3-10 Steam Oil Concentration for Sections
The mass of oil extracted from the column is calculated using the change in the steam oil
concentration between the inlet port of fresh steam and the outlet of the final stage, which
is at the entry point of fresh material to the column.
To account for the constant input and output of material to the system, two new variables
are added to the batch model in Equation 3-9. The new variables are to complete the mass
balance of the system at steady state. The new variables min (kg hr-1) and xin (kg oil kg-1
material) are the mass of material and concentration of input material respectively [11].
The overall mass balance at steady state for the counter-current system is presented in
Equation 3-11.
𝑑𝑥
𝑑𝑡 + 𝑠
𝑑𝑦
𝑑𝑡= −𝐾a(x − α𝑃0) + 𝑚𝑖𝑛 𝑥𝑖𝑛
Equation 3-11 Counter-current Overall Mass Balance [11]

30
3.3 Economic Modelling
Prices of essential oils are extremely variable, and can be very volatile. A recent example
of the volatility of the market is the average price for peppermint oil, in the period between
1994 and 2006 the average price steadily declined from US$42/kg to a low of US$12/kg.
The steady downward trend abruptly reversed at the beginning of 2006 and in the two-
year period ending 2008 the price had risen approximately 600% to US$72/kg [1]. The
variability of the oils is evident in market price differences between differing oils. Orange
oil which is a by-product of the fruit juice industry is produced in copious quantities and
is readily available, the price is evidently very low for essential oils at approximately
US$1.80/kg [12].
Production of essential oils is a labour-intensive operation. This has seen the movement
of essential oil production from high-cost areas such as France to low cost areas,
predominantly China and India [3]. To produce oils in the higher cost areas, the extra cost
of production must be accounted for by either an increase in efficiency or a higher output.
The inclusion of estimated production outputs for the batch and counter-current models
has been used to evaluate the viability of moving away from a batch processing system.
Incorporated into the model is a value for the fixed hourly overhead cost to run the facility.
Overheads have been included to provide a comparison between operating in a high cost
area to a low-cost area and the effect on the operating conditions of the plant. Steam
production is the other major cost included in the model, with the assumption that a
production facility will be retrofitting existing facilities to accommodate a counter-current
capability. The assumption of retrofitting an existing facility is due to envisioned
technical difficulties associated with developing a true counter-current system.

31
Revenue from the sales of produced oil was the only income stream available from all
essential oils investigated. Some essential oils have secondary products which provide a
dual income stream potentially increasing the viability of the project [3]. However, as the
oil considered for this study is considered a hypothetical oil, the assumption of the oil
being the only product of value produced allows the oil to encapsulate a greater number
of actual oils. The breakdown of operating costs and revenue streams is provided in Table
3-1 based on hourly production figures generated.
Table 3-1 Revenue and Cost Breakdown Per Hour
Revenue Generated by Oil Sales Price per kg * Rate of production
Cost of Steam Gs * Unit Price Steam ($/Ton)
Fixed Overhead Cost Cost per hour
The variables presented in Table 3-1 were incorporated into the Simulink model to allow
for an indication of the effect of running conditions on the profitability of a plant. The
outputs from Simulink are shown in Figure 3-2, an extra value is presented which is the
production of hydrosol. Hydrosol is the water-soluble fractions of the essential oil which
form a solution with the condensed steam [1]. The formation of hydrosol was presented
as a major contributor to the loss of oil in steam distillations of essential oils. For the
distillation of aniseed previously presented, the hydrosol comprised 25% of the extracted
oil [7].

32
Figure 3-2 Simulink Output of Current Profit Output from Model
The objective of the economic analysis is to determine the operating point that will
provide the highest profit per unit processed. Figure 3-3 indicates the relationship
between the pursuit of high yield and the required hours to achieve the target yield.
Figure 3-3 Asymptotic Curve of Yield

33
It is the avoidance of achieving a yield from the fed material results in increased
generation of oil, but at rates that do not cover the cost to produce the extra oil. It should
however be reiterated that the oil in this paper, is a hypothetical oil containing only a
single component. To extract a complete essential oil, the distillation must be under the
specific conditions that will generate the complete oil.
Modelling the extraction of essential oils in the past has focused on the mode of extraction
of oil from the bearer material. Moving away from this approach to follow the economics
of the extraction is a key feature in determining the optimal running conditions of the
process. The ability to model the point at which the operation of a batch system is a
powerful tool, for every hour that the system is operating there is a cost associated with
the production of steam, the payment of wages and other factors. The inverse of this is
also true, for every hour that the system is not producing oil there is a loss of opportunity
and overheads continue, this is a fundamental weakness of a batch process.

34
Chapter 4 Simulation Results
4.1 Model Initial Testing
Initial model validation started with testing the model with the parameters initially
provided by the external company against the provided data. The model outputs were
presented to a representative of the company in which it was noted that the oil content in
the steam was out of range. A typical value for the steam oil concentration was provided,
and was incorporated into the model as a limiting factor. The concentration of the steam
at differing heights within the column was recorded to ensure that the modelling of the
limit of steam concentration was operating as intended. A generic model output is
included in Figure 4-1.
Figure 4-1 Generic Model Steam Concentration Output of Batch System

35
The profile shown in Figure 4-1 shows the point of saturation of steam moving towards
the top of the column, or towards the steam outlet over time. The outlet steam
concentration is shown to start reducing at the 40-hour mark in Figure 4-1, at this point it
would be prudent to start evaluating the viability of continuing the extraction. The
simulated concentration of the oil in material for the same simulation is presented in
Figure 4-2. The concentration of the material at the top of the column is shown to be
depleting in the hours before the steam outlet concentration begins to decline.
Figure 4-2 Generic Model Steam Concentration Output of Batch System

36
4.2 Sensitivity Analysis
A sensitivity analysis is a measure of the effect of uncertainty in the inputs of a model on
the outputs of the model. The use of sensitivity analyses allows for greater understanding
of the effect of parameter changes within the model and the magnitude of changes in the
inputs and the outcome of the change throughout the whole system. In this model, the
main objective of sensitivity analysis was performed to determine the viability of using
the steam outlet concentration after the condenser to accurately represent the oil content
of the system.
Another aspect of the sensitivity analysis was to find the oil concentration in the material
that became the point at which operation transitioned from generating revenue to cover
the overhead costs and steam usage of the plant. At this point it would no longer be viable
to extract additional oil from the material as the revenue generated would be less than the
cost of running the facility.
4.2.1 Steam Rate Comparison
The rate of steam addition to the column plays an integral role in determining the rate of
extraction. A comparison between two steam flow rates in the batch system, one at
200kg/hr and the other at 250 kg/hr, are shown in Figure 4-3 and Figure 4-4 respectively.
For the batch process the rate of steam addition plays a key role in determining the length
of the total distillation time. With an increase in steam rate, the upper layers of material
are subjected to unsaturated steam at an earlier stage in the process allowing for transfer
of oil in the material to the flowing steam.

37
Figure 4-3 Material Concentration with 200 kg/hr Steam Flow
Figure 4-4 Material Concentration with 250 kg/hr Steam Flow

38
An increase in the steam rate from 200 kg/hr to 250 kg/hr at the 10-hour mark of the batch
distillation is shown in Figure 4-5. The plot shows that the outlet steam concentration
remains unchanged in the hours following the change in input steam rate. This was
originally considered to be a possible source of monitoring the process, with the model
disproving that measuring the steam concentration would provide an insight into the
conditions within the vessel from an early stage. The ramifications of which were further
realised during the trials of the counter-current model. Figure 4-5 also indicates that the
concentration of the steam at the 25% of residence time drops rapidly. This may happen
in a real system to a degree but would be unmeasurable, in a similar manner to sensing
the concentration on every stage in a trayed distillation column [13].
Figure 4-5 Steam Concentration Response to Increase in Steam Rate from 200-250 kg/hr

39
Initially a Coriolis mass flow meter to measure the concentration of oil in the steam upon
exiting the condenser was hypothesised to be a suitable instrument for determination of
the steam oil content. Taking the density at the outlet of the condenser rather than as a
vapour was projected to be the best location for a steam density measurement, as the
higher density of liquid water, in relation to steam, reduces the uncertainty in the reading.
The rationale for Coriolis flow meters was in their ability to measure density of the fluid,
providing the mass flow of the process fluid [14]. The dismissal of Coriolis as an option
is due to the low flow rates envisioned for the process and the small change in density
that the oil contributes. The maximum accuracy that could be readily found was of an
Endress and Hauser manufactured device, which had an accuracy down to 0.2g L-1, which
gives a 10% uncertainty in the concentration of steam if equilibrium is at 2.0g L-1 [15]
4.2.2 Material Input Concentration
The rate of extraction is dictated by two factors in the model, the availability of steam not
yet saturated with oil traversing past the oil laden material and the concentration of the
oil in the material. As presented in Equation 3-7, the greater the difference between the
current concentration and the equilibrium concentration, x* in Equation 3-7, the greater
the rate of mass transfer. Figure 4-6 shows the effect of differing oil concentrations over
a 50-hour period, at the end of the period the concentration of oil in material for each trial
is approaching the equilibrium point with steam.

40
Figure 4-6 Comparison of 5 Different Initial Oil Concentrations Over Time
To further illustrate the effect of feed concentration on the oil content over time, Figure
4-7 is included to illustrate the mass of oil extracted for a 2-ton batch of material with no
limit to the amount of steam supplied to the column. In a non-theoretical situation, the
flow rate of steam to the column required to achieve this outcome would result in an oil
of inferior quality due to degradation of heat sensitive compounds or charring depending
on the severity [1].

41
Figure 4-7 Mass of Oil Remaining Over 20 Hour Period of 5 Starting Concentrations
The oil concentration for the batch system is typically known before the process begins
for operations on a factory scale [1]. With the starting concentration known, the number
of hours to process the batch can be calculated assuming ideal conditions. For ideal
conditions, sufficient steam is required to ensure saturation occurs at the exit of the
column. The calculation is provided in Equation 4-1 [16].
𝑥(𝑡) = 𝑥0𝑒−𝐾𝑎𝑡
Equation 4-1 Characteristic equation of A Batch Reactor [16]

42
4.2.3 Partial Pressure of Essential Oil
Partial pressure plays a dual role in the model: firstly, it represents the maximum value
that the steam oil concentration can take on, and secondly it is used to determine the
equilibrium point between the steam and the material. The vapour pressure of the oil is
temperature dependent, and with the assumption that the temperature and pressure of the
system is fixed for the length of the column at all steam flow rates, the effect of differing
vapour pressures and the resultant effect on steam requirements and time for extraction
can therefore be analysed. The mass transfer rate for anethole for aniseed was found to
increase sevenfold with an increase in system pressure from 140kpa to 200kpa [7].
A sevenfold increase in the overall mass transfer coefficient significantly increases the
attractiveness of increasing the system pressure. Increasing the system pressure for a
steam system results in higher system temperatures [17]. The ideology of increasing
temperatures is counter to the selection of steam distillation as the method of extraction,
with most essential oils being susceptible to degradation from heightened temperatures
[6]
Manipulation of the saturation limit of oil in steam for the model, with all other variables
unchanged is shown in Figure 4-8. The time between starting the process and the outlet
steam reducing from the upper concentration limit for increased solubility of oil exhibits
a significant decrease in elapsed time. A rise in the maximum vapour pressure of the oil
at the operating conditions is the manipulated variable for the sensitivity analysis of oil
saturation limits.

43
The steam requirements to achieve a target level of extraction are heavily dependent on
the vapour pressure of the oil. Figure 4-8 exhibits this; the different saturation limits were
subjected to the same flow rate of steam, 200 kg hr-1, as discussed earlier the time at which
steam is no longer saturated on exit. The steam requirements are shown to be inversely
proportional to the vapour pressure of the oil. Steam requirements are inversely related to
vapour pressure.
Figure 4-8 Effect on Processing Time of Differing Oil Solubilities in Steam

44
4.2.4 Feed Rate of Material
The application of material feed rate to the batch model does not exist, due to the process
being characterised by the lack of a continual flow of fresh material to the system. Feed
rate plays a major role in the operation of the counter-current model, because if the system
is unbalanced between the mass of oil added and removed there will be a net change in
the column oil content. The rate of material feed governs the residence time of the
counter-current model, for a given flowrate the residence time, τ (hr), can be found
through Equation 4-2.
𝜏 = 𝑉𝑐𝜌𝑚𝑎𝑡𝑒𝑟𝑖𝑎𝑙
𝑚𝑖𝑛
Equation 4-2 Residence Time for Counter-current System
Determination of the residence time of the system can allow for the determination of the
outlet material concentration at steady state, provided the steam rate can remove oil
throughout the column. For a system at steady state, the mass of oil entering the system
with fresh material is equal to the rate of extraction, the left side of Equation 3-11 is equal
to zero at steady state, the rate of addition of oil is therefore equal to the rate of extraction.
This relationship is presented in Equation 4-3.
𝑑𝑚𝑜𝑖𝑙−𝑖𝑛
𝑑𝑡= 𝐾𝑎𝑥(𝑡) − αKa𝑃0
Equation 4-3 Counter-current Oil Balance [11]

45
The effect of differing the feed rate of material to the system creates concentration
gradients within the column. Figure 4-9 indicates the various concentration profiles
generated by the model for the same steam and concentration feeds. The feed rates of
20kg/hr of fresh material reaches the equilibrium point at the highest section in the
column, with the concentrations increasing with increasing feed rates. The characteristic
equation for a plug flow reactor is presented in with x0 representing the material inlet
concentration (kg oil kg-1 material) [16].
𝑥(𝑡) = 𝑥0𝑒−𝐾𝑎𝑡
𝑥(𝑡) = 𝑥0𝑒−𝐾𝑎𝑡
Equation 4-4 Characteristic equation of A Plug Flow Reactor [16]
Figure 4-9 Concentration Profiles of Various Feedrates

46
Using Equation 4-4 the concentration at any point in the reactor can be found, substituting
the residence time into the value of t. This allows the outlet concentration to be
determined in a plug flow reactor and the concentration in a batch system for any given
time after the start of production [16]. Residence time values for the data in Figure 4-9
are presented in Table 4-1. As the concentration of oil in the material approaches
equilibrium with steam the rate of extraction drops significantly.
Table 4-1 Residence Time and Outlet Data for Varying Mass Flow Rates
Mass Flow Rate of
Material Feed
(kg hr-1)
Residence Time in
Column (Hours)
Outlet Material
Concentration
(kg oil kg-1 material)
20 100 0.000106
30 66.67 0.000133
40 50 0.000241
50 40 0.000452

47
Chapter 5 Economic Analysis Results
The results of the economics benefits for operating a batch or counter-current system are
presented in this section. A key area explored is the cost to process a ton of material, a
major factor in establishing a cost competitive industry, with a reduction in the processing
cost of the raw materials, the unit price for oil produced is reduced leading to a possible
competitive advantage.
5.1 Cost-Revenue Imbalance
The example presented in Table 4-1 indicates the degree by which the rate of change of
the mass of oil changes throughout the length of the column in the counter-current model
and the batch model at long residence times. Comparison between the feed rates of 20
and 30 kg/hr of material fed to the reactor, are shown as a 20% increase in material oil
content at the exit of the column. Placing a monetary value on the difference between the
two provides a comparison for the difference between increased yield and the increased
expenditure to achieve that yield. The values for oil revenue, steam cost and fixed over-
head cost are presented in Table 5-1.
Table 5-1 Hypothetical Costs for Operation of Plant
Revenue - Unit Price of Oil ($/kg) $5000
Steam Cost- Unit Price of Steam
Generation ($/ton)
$45
Fixed Overhead Costs ($/hr) $200

48
Table 5-2 shows the difference in the cost of gaining additional yield versus the generated
revenue from the venture. Although an extreme example it highlights the goal of
maximising the profit generated rather than the yield obtained from the material. The
fixed overhead costs are the main source of the difference between the profits of the two
material feed rates.
Table 5-2 Generated Revenue and Cost to Process 1 Ton of Material
Parameter Material Flow = 20 kg/hr Material Flow = 30 kg/hr
Fixed Overhead Costs -$10,000 -$6,667
Steam Consumed *CS -$4,500 -$3,000
Revenue from Extracted
Oil
$74,470 $74,335
Profit $59,970 $64,670
The values generated in Table 5-2, were generated with an unlimited steam flow rate
available. This was described earlier in the sensitivity analysis section as being a situation
not recommended as the increased steam through the column would lead to an increase
in temperature and ultimately a decrease in the quality of oil produced [6].
5.2 Determination of Ideal Feed Rate
To determine the maximum feed rate of material to the column, an Excel spreadsheet was
developed. The Solver add-in was used to determine the maximum rate of profit that could
be generated with limitations on the steam input to the column. The output for limit of
200 kg hr-1 of steam is shown in Table 5-3, with the parameters set in Table 5-4.

49
Table 5-3 Output from Optimization Excel Spreadsheet on basis of 1 Ton at 1.5% Oil
Economics
Mass Oil total hour Oil Recovered per Ton $5000 Oil Revenue/kg
0.800000656 14.72933641 73,646.68
0.004000003
Mass Steam Required Steam per Ton -$45 Steam Cost
200 3682.331081 -165.70
Material Residence time -$200 Fixed Hourly Cost
38.3548855 -7,670.98
64,318.66
Max Oil 14.89479359 74473.96797
Efficiency 86.36%
Percentage Oil Extracted 98.89%

50
Table 5-4 Run Condition Input for Optimization Spreadsheet
Feed Rates
Steam 200
Material 54.31
Material Velocities (m/hr)
Steam 550.7213768
Material 0.126711368
Residence Times (Hours)
Steam 0.008824789
Material 38.35730182
Feed Concentation
Steam 0
Material 0.015
The optimization spreadsheet employed a discrete model of the system with each step
calculated by means of Equation 3-11. The cell specifying the material oil concentration
was the most important factor in the optimization spreadsheet. The role of the spreadsheet
was to generate the material feed rate that would see the steam achieve saturation at the
exit of the column.
Ensuring the steam is on the verge or having just reached saturation at the exit of the
column allows the material within to be subject to mass transfer for the entire length of
the column. This was explored in the sensitivity analysis of the project. Consequently,
this ensures that Equation 4-4 will reliably predict the material exit concentration.

51
For the Solver function, the objective was to maximise the cell labelled; Efficiency. The
purpose of the cell is to quantify generated revenue per ton of material processed in
relation to the maximum revenue that could be generated. The maximum generated value
did not include the costs associated with the extraction of the oil, resulting in the
efficiency being both a measure of the revenue generated and the relative cost to generate
that revenue. For the data in Table 5-4 the efficiency is stated as 86%. This indicates that
the running conditions will result in 86% of the available revenue being converted into
profit.

53
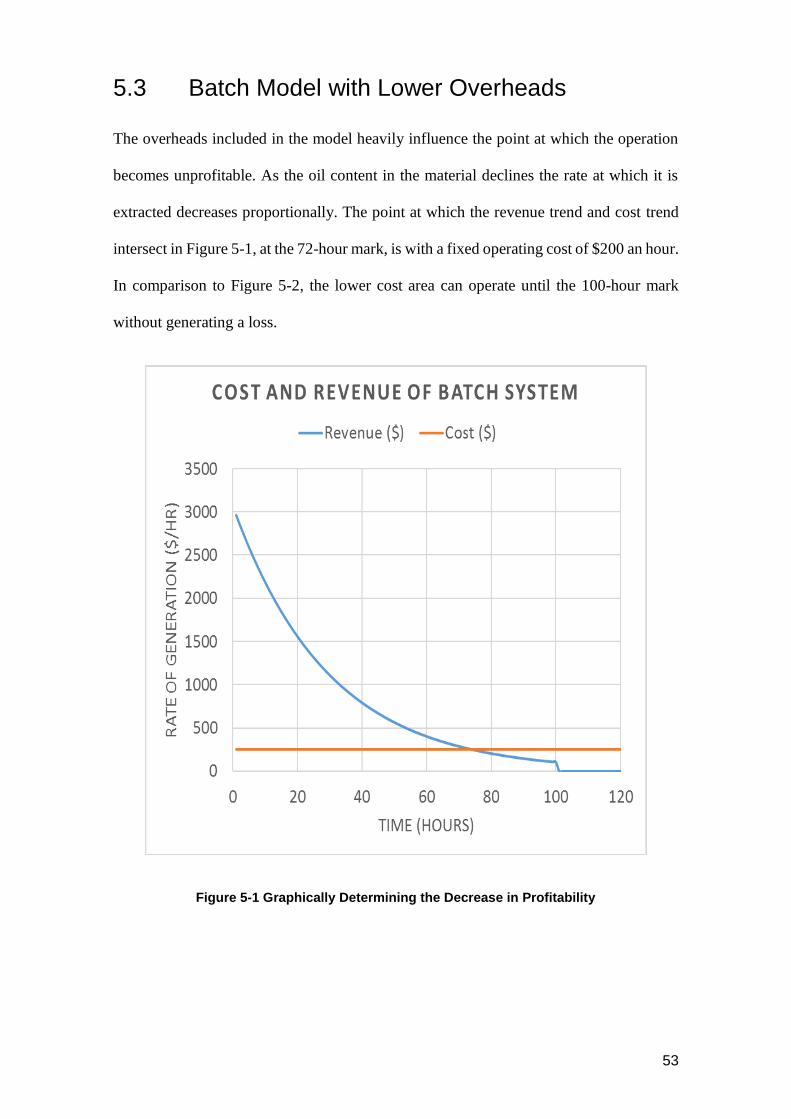
5.3 Batch Model with Lower Overheads
The overheads included in the model heavily influence the point at which the operation
becomes unprofitable. As the oil content in the material declines the rate at which it is
extracted decreases proportionally. The point at which the revenue trend and cost trend
intersect in Figure 5-1, at the 72-hour mark, is with a fixed operating cost of $200 an hour.
In comparison to Figure 5-2, the lower cost area can operate until the 100-hour mark
without generating a loss.
Figure 5-1 Graphically Determining the Decrease in Profitability

54
Figure 5-2 Graphical Determination of Profitability in a Low-Cost Area
As the batch system needs to periodically be emptied and reloaded, the operating cost
continues past the point at which the steam supply is cut to the process, Figure 5-1 and
Figure 5-2 show the cost continuing for 120 hours. It is only with the start of the next
batch that the system generates revenue to balance the operating cost. A general flow
chart of a batch system is shown in Figure 5-3 [1].
.
Figure 5-3 General Flow Chart of Batch Processes

55
The ability to run the process to 100 hours without entering a period of loss generation
provides significant benefits. The higher resource recovery rate, assuming the batch is
switched off at the point of profit being equal to zero, allows for more oil to be extracted
from the same amount of material. A representation of which is included in Figure 5-4.
Another benefit is in the relative time that the process is in the processing stage.
Figure 5-4 Mass of Oil Remaining in System
If the batch is discontinued at the point the profit transitions from positive to negative,
and the turnaround time for the batch is 20 hours. The proportion of time in the processing
stage is altered between the two example states, this is shown in Table 5-5. The low-cost
area will be in the production phase of the batch system for approximately 5% of the total
time longer than the high cost area.

56
Table 5-5 Time to Process Batch with Proportions
Area Low Cost High Cost
Processing Hours (Proportion) 100 (0.83) 72 (0.78) Turnaround Hours (Proportion) 20 (0.17) 20 (0.22)
Total Time for Batch 120 92
The distillation time of the example provided is on the order of 3 – 4 days of actual
running time, a relatively slow process in which the turnaround time does not account for
a large portion. The production of tea tree oil has a distillation time of 2 -3 hours [18]. To
remain profitable, and competitive, the turnaround time for a batch of tea tree oil must
have a maximum turnaround proportionate to 20% of the total batch time. The turnaround
time would be required to be in the range of 30 – 45 minutes. Essential oils with fast
processing times require short turnaround periods to produce oils at meaningful usage of
plant capacity.

57
5.4 Comparison between Systems
The goal of this section is to provide a comparison between the batch and counter-current
processes in terms of their production capabilities. The batch system was run to the point
at which the rate of profit became zero. And the continuous system operated to the
conditions that were determined within Excel to produce the greatest rate of profit per ton
processed.
The use of a counter-current system allows for the processing of material to be performed
with minimal interruption. The objective of developing the system is to process the
material without the requirement of replenishing the material at regular intervals. When
operating at a steady state, the counter-current model will have the same rate of
production over a long period of operation. Contrasting this is the batch system. Initially
the rate of production is high; however, this gradually, over the course of the process,
diminishes to a rate that becomes no longer viable.
To compare the batch system and the counter-current system, the average revenue and
profit rate was taken over the length of operating. This resulted in the profit rate of the
counter-current system being the steady state profit rate. Whereas the batch system
required the profit and revenue rates to be averaged over the length of the distillation
process.
A comparison of a batch and counter-current system is shown in Table 5-6. The rate of
profit for the counter-current system on an hourly basis, is nearly double that of the batch
system. The batch system is at the optimal running condition at the beginning of the
distillation process, shown in Figure 5-1 Conversely, the counter-current system is
operating at the optimal condition for the entirety of the process. This is directly translated
into the higher hourly rate of profit and the higher profit on a tonnage basis.

58
Table 5-6 Profit Comparison of Batch and Counter-current Steam Distillation
Batch Counter-current
Hours in Process 80 50 Revenue ($/Hour) $1,146 $2,002
Cost ($/Hour) $209 $205
Profit ($/Hour) $937 $1,798
Profit ($/Ton) $37,825 $44,938
Comparing the two methods of operations gives for an interesting display on the merits
of converting to a counter-current system. The fundamental problem with this analysis is
in the modelling of the oil as a single component. Essential oils are comprised of
numerous compounds, all which carry over with the steam at different rates. The
production of oil by the counter-current system would need to account for the variation
in volatility of the constituent compounds. With respect to this, the optimal production
rate for the pseudo-oil may produce an oil that is lacking in key distinctive components
of the overall essential oil.
5.5 Cost of Counter-current
Calculating the cost of a counter-current system for essential oils cannot be completed on
a generic basis. Analysis should be carried out on the essential oil of interest with the
results determining the viability of transitioning from batch processing. It has been noted
in the literature that introducing and removing large quantities of solid materials from a
pressurised vessel involves considerable cost [19]. This considerable cost needs to be
justified in the case of the essential oil that the application is intended for.
A consequence of transitioning to a counter-current system is in the loss of process
flexibility. A batch process allows for the processing of several different materials using
the same equipment [20].

59
Chapter 6 Conclusion
The investigation of conversion of a batch system of steam distillation to a counter-current
model has given an insight into the associated cost benefits and production volumes
associated with the transition. Theoretical conversion to the counter-current system, based
on the reduction in processing costs, is a feasible solution to increase the competitiveness
of the essential oil industry. There are however issues surrounding the technical aspects
of the conversion.
The technical aspects, until overcome, bring uncertainty to any estimation of the cost of
both converting an existing plant or the construction of a new plant. This uncertainty
carries through the determining the plant running cost. For this reason, the fixed overhead
running costs were not adjusted in this report as a worst-case scenario. The fixed
overheads would be expected to fall, due to the reduction in restocking requirements of
the vessel translating to a reduction in the required workforce.
The project has identified that the application of counter-current systems for essential oil
extraction must be evaluated on a case by case basis. There is a large time gap between
any reported introduction of non-batch processes, which given the processing cost savings
does not favour the idea that the system is easily implemented.
Models generated within Simulink have provided a method of simulating the extraction
of essential oils from the base plant materials. The accuracy of the model appears to be
adequate based on the single material that data was available for. The Simulink model
requires further testing of different essential oils with confirmed parameters to determine
the robustness of the model.

60
6.1 Future Recommendations
The use of MATLAB/Simulink as simulation software presented numerous challenges,
and would not be recommended in the future. Dedicated modelling software for chemical
process engineering exist, for example ASPEN Plus, developing the system within these
environments are likely to increase the accuracy of the modelling, with additional testing
of a physical process. In addition to the accuracy, the addition of pressure and temperature
drops across the column would further improve the model. These are major factors in the
design of distillation columns and have been disregarded to the detriment of the project.
As there is also little information in the published literature for processing essential oils
by counter-current steam distillation. A bench scale or small pilot scale test to provide
experimental data would allow for improved model development and validation. With the
implementation of a trial plant, there are numerous parameters to monitor. A system to
measure the input and output concentration of the oil in material in near real time would
increase the controllability of the plant.
The Rural Industries Research and Development Corporation of the Australia
Government should be contacted in the future to explore collaboration with future
researchers in Australia.

61
Chapter 7 References
[1] K. Husnu Can Baser and B. Gerhard, Handbook of Essential Oils: Science,
Technology and Applications, 2nd ed., Boca Raton: CRC Press, 2016.
[2] G. Boucard and R. W. Serth, “A Continuous Steam Stripping Process for the
Distillation of Essential Oils,” Perfumer and Flavorist, vol. 16, no. 2, pp. 2-8,
1991.
[3] E. A. Weiss, Essential Oil Crops, New York: CAB International, 1997.
[4] H. Surburg and J. Panten, Common Fragrance and Flavor Materials, Weinheim:
Wiley VCH, 2016.
[5] A. Sahota, Sustainability: How the Cosmetics Industry is Greening Up, London:
John Wiley and Sons, 2014.
[6] M. Routabi, A. Duquenoy and P. Giampaoli, “Extraction Of the Essential Oil of
Thyme and Black Pepper By Superheated Steam,” Journal of Food Engineering,
vol. 78, no. 2, pp. 708-714, 2007.
[7] M. Romdhane and C. Tizaoui, “The Kinetic Modelling of a Steam Distillation
Unit For the Extraction of Aniseed (Pimpinella anisum) Essential Oil,” Journal of
Chemical Technology and Biotechnology, vol. 80, no. 7, pp. 759-766, 2005.
[8] V. Xavier, R. Vargas, E. Cassel, A. Lucas, M. Santos, C. Mondin, E. Santarem, L.
Astarita and T. Sartor, “Mathematical Modelling for the Extraction of Essential
Oil From Baccharis Spp. by Steam Distillation,” Industrial Crops and Products,
vol. 33, no. 1, pp. 599-604, 2010.
[9] S. S. E. H. Elnashaie and P. Garhyan, Conservation Equations and Modeling of
Chemical and Biochemical Processes, New York: Marcel Dekker inc, 2003.
[10] A. J. Dijkstra, “Stripping medium requirement in continuous countercurrent
deodorization,” Journal of the American Oil Chemists' Society, vol. 76, no. 8, pp.
989-993, 1999.
[11] Anon, Interviewee, Operations of Counter Current System. [Interview]. June
2016.
[12] D. Sikdar, R. Menon, K. Duseja, P. Kumar and P. Swami, “Extraction of Citrus
Oil From Orange (Citrus Sinensis) Peels by Steam Distillation and Its
Characterizations,” International Journal of Technical Reseach and Applications,
vol. 4, no. 3, pp. 341-346, 2016.
[13] P. C. Wankat, Seperations in Chemical Engineering: Equilibrium Staged
Seperations, New Jersey: Prentice Hall PTR, 1988.

62
[14] C. Apple, M. Anklin and D. Wolfgang, “Mass Flowmeters, Coriolis,” in
Instrument Engineers' Handbook, Boca Raton, CRC PRESS, 2003, pp. 225-236.
[15] Endress And Hauser, “Technical Information: Proline Promass
80F,80M,83F,83M,” Endress and Hauser, Reinach, 2008.
[16] M. K. Stenstrom, “Fundamentals of Chemical Reactor Theory,” 2003. [Online].
Available: http://www.seas.ucla.edu/stenstro/Reactor.pdf. [Accessed January
2017].
[17] N. P. Chopey, Handbook of Chemical Engineering Calculations, New York:
McGraw-Hill, 2004.
[18] M. R. Johns, J. E. Johns and V. Rudolph, “Steam distillation of tea tree
(Melaleuca alternifolia) oil,” Journal of the Science of Food and Agriculture, vol.
58, no. 1, pp. 49-53, 1992.
[19] G. Brunner, “Counter-Current Seperations,” The Journal of Supercritical Fluids,
vol. 47, no. 1, pp. 574-582, 2009.
[20] P. T. Benavides, J. Salazar and U. Diwekar, “Economic Comparison of
Continuous and Batch Production of Biodiesel Using Soybean Oil,”
Environmental Progress and Sustainable Energy, vol. 32, no. 1, pp. 11-24, 2013.
[21] J. B. Cannon, C. L. Cantrell, T. Astatkie and V. D. Zheljazkov, “Modification of
Yield and Composition of Essential Oils by Distillation Time,” Industrial Crops
and Products, vol. 41, pp. 214-220, 2013.
[22] A. Fleisher and Z. Fleisher, “Water-Soluble Fractions of the Essential Oils,”
Perfumer and Flavorist, no. 16, pp. 37-41, 1991.

63
Appendix A
Appendix Table A-1 Calculation of Costs for Differing Material Flows
Parameter Material Flow = 20 kg/hr Material Flow = 30 kg/hr
Residence Time
Hours * Fixed
overhead rate
100*200 66.67*200
Steam Consumed
*unit cost of steam
200 * 100* 0.045 200* 66.67*0.045
Outlet Material
Concentration
(kg oil kg-1
material)
0.000106 0.000133
Mass of oil
extracted
1000*(0.015 - 0.000106)
*5000
1000*(0.015 - 0.000133) *5000