molybdenum sulphides — efficient and viable materials for ... · molybdenum sulphides —...
TRANSCRIPT

Molybdenum sulphides — efficient and viable
materials for electro — and photoelectrocatalytic
hydrogen evolution
Anders B. Laursen∗ Søren Kegnæs† Søren Dahl ∗
Ib Chorkendorff ∗
November 22, 2011
1 Supplementary information
2 Experimental:
2.1 Equipment:
2.1.1 SEM-EDS
SEM-EDS analysis was done on a FE-SEM (FEI Quanta 200 F SEM) operated at 30
kV, using an Oxford Instruments X-max (51xmx0005) EDS running the INCA Suite
v 4.15 software. Spectra were fitted using program standards and converted to atomic
ratios. For all samples the ratio of Mo to S were close to the stoichiometric, the ratio of
Mo to C was used to calculate the mass loading of MoS2 on the MWCNT. The value
is averaged over six measurements of different area of the pristine, annealed 2 h and
annealed 8 h sample. The averaged loading is 46 wt%.∗Center for Individual Nanoparticle Functionality, CINF, Department of Physics, Technical University of
Denmark, DTU, Kgs. Lyngby. E-mail: [email protected]†Centre for Catalysis and Sustainable Chemistry, CSC, Department of Chemistry, Technical University
of Denmark, DTU, Kgs. Lyngby
1
Electronic Supplementary Material (ESI) for Energy & Environmental ScienceThis journal is © The Royal Society of Chemistry 2012

2.1.2 TEM
The images were obtained by means of a JEOL 3000F microscope operated at an ac-
celerating voltage of 300 kV. For sample preparation, ground powders were dispersed
in ethanol and deposited on a 300 mesh copper grid coated with a holey carbon film.
2.2 Synthesis of MWMoS2@MWCNT:
For the synthesis of the multi-walled MoS2 on multi-walled carbon nanotubes (MW-
CNT), MW-CNTS from Hyperion Catalysis International, Graphite FIBRIL type CC,
consisting of > 90% MWCNT material according to low magnification TEM, were
used. All other reagents were of reagent grade and used without further purifications:
Thioacetamide, Na2MoO4 ·2 H2O, water, 1M HCl(aq), and ethanol.
Figure 1: Reaction scheme for the acid catalysed MoS2 deposition.
In the present work, multi-walled molybdenum(IV) sulfide (MoS2) nanotubes coated
on multi-walled carbon nanotubes (MW-CNT) were synthesized by precipitation of
MoS3 using thioacetamide in the present of carbon nanotubes using aqueous precursor
solutions of sodium molybdate. Followed by high temperature reduction in a flow of
hydrogen (see reaction in figure 1). In a typical synthesis of a precursor solution was
prepared in a 50 ml Schlenk test tube by dissolving Na2MoO4 ·2 H2O (1 mmol, 0.2419
g) in distilled H2O (10 ml) under stirring. To the solution MW-CNT (4 mmol of car-
bon, 0.048 g) was added and the mixture was sonicated at room temperature for 1 h.
Thioacetamide (10 mmol, 0.75 g) together with a solution of HCl (10 ml, 1 M) was
added to the suspension. The test tube was sealed and the suspension was sonicated
for an additional 2 h. After this time, the mixture was left to stand over-night. The
produced MoS3 on MW-CNT was separated from the solution by filtration and washed
with H2O and ethanol. After drying, the MoS3 was reduced to MoS2. This was done
by passing a gentle flow of AGA (90/10) Forming Gas (90% N2, 10% H2) over the
2
Electronic Supplementary Material (ESI) for Energy & Environmental ScienceThis journal is © The Royal Society of Chemistry 2012

sample at 450C for 1 h using a heating ramp of 7C /min. To make the coating layers
of MoS2 on the MW-CNT more homogeneous, the reduced samples were annealed by
heating with 5C /min to 800C in a flow of argon for 2 h or 8 h.
2.3 Electrode preparation
Figure 2: From the top down: A finished electrode, a separate glass tube, a separatecopper wire with the end formed into a coil, a carbon paper electrode before mountingthe connection.
The electrodes are made by depositing a catalyst ink onto a carbon paper (ETEK)
electrode. Prior to deposition the carbon paper where impregnated with a ca. 0.5 cm
brim of dispersed Teflon. A 10 by 3 cm piece of carbon paper was cut and heated
to 90C on a hotplate. Then drops of Teflon dispersion (Dyneon TF5032R PTFE)
was put onto the carbon paper approximately 1 cm from the end that will become the
circuit contact point; making an unbroken line parallel to the wide side of the carbon
paper. The drops was allowed to dry in between addition and the drops was added
until an unbroken white line of Teflon was visible. The purpose of this is to ensure
that electrolyte that was sucked into the electrode do not reach the copper contact point
allowing for copper corrosion to be a parasitic reaction. The strip of Toray paper was
then cut into individual electrodes of 0.5 cm width and 3 cm length (see figure 2).
Contact to the carbon electrode was made by attaching the electrode contact point
to a copper wire with one end formed into a coil (see figure 2); then the contact point
and the coil are painted with Ag-paste (HighPurity Ag paint, SPI Supplies). It was
allowed to dry and the remaining Cu tape was wrapped twice around the electrode and
3
Electronic Supplementary Material (ESI) for Energy & Environmental ScienceThis journal is © The Royal Society of Chemistry 2012
wire junction. A small glass tube was slid onto the copper wire and finally the whole
connection area was wrapped in adhesive tefon tape to make a water-proof seal from
the glass tube to the Teflon brim on the electrode (see figure 2).
The catalyst ink was made by mixing 1.5 mg catalyst in 0.4 ml isopropanol (Sigma-
Aldrich, Laboratory reagent ≥ 99.5%), 0.6 ml milli-Q®water (18.2 MΩ· cm @ 25C),
and 0.004 ml 5 % w/w Perflourosulfonic acid (PTFE) copolymer (Alfa Aesar) solu-
tion. This suspension was sonicated for ca. 200 min in a Branson 8510 ultra-sonicator,
immediately after 50 µL of this suspension was deposited on each electrode, then
they were dried at 80C on a hotplate. Electrodes for the oxidation-experiment was
prepared by the same technique a above, only the suspension was 0.1 wt% in N,N-
dimethylformamide (DMF, Merck) and 5 µL of this suspension was deposited on each
electrode. The difference is due to the easier observation of the oxidation features at
lower loadings of catalyst.
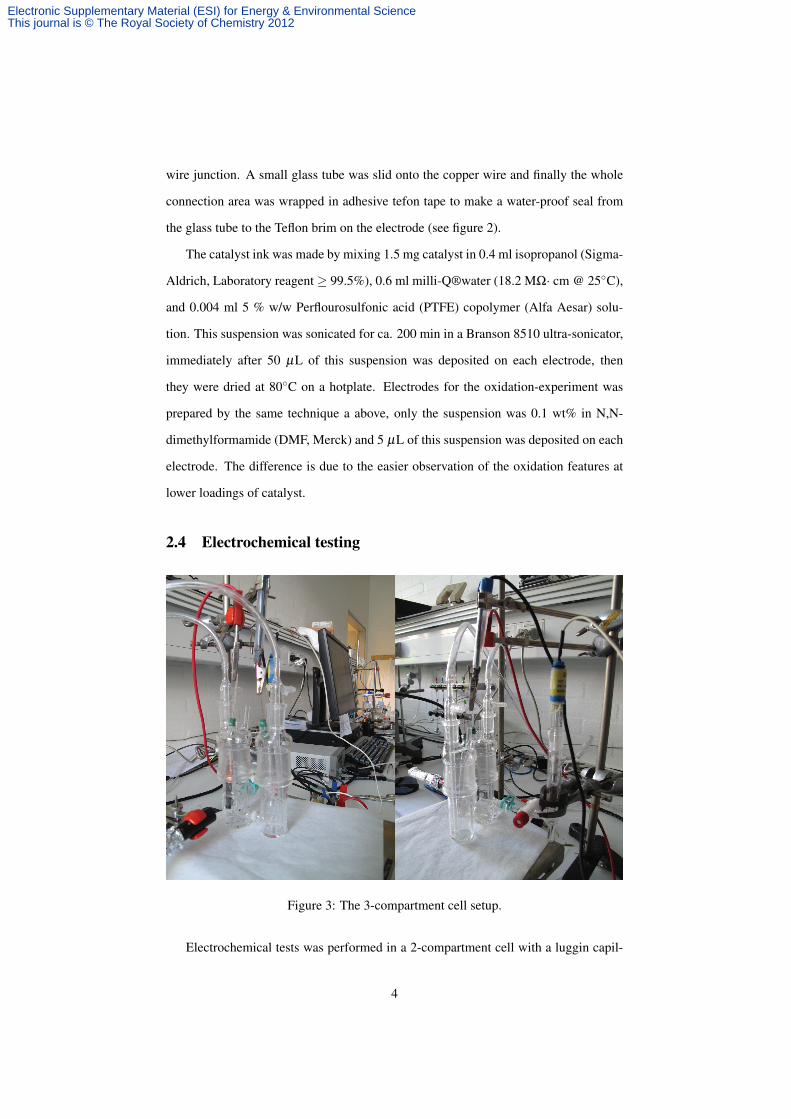
2.4 Electrochemical testing
Figure 3: The 3-compartment cell setup.
Electrochemical tests was performed in a 2-compartment cell with a luggin capil-
4
Electronic Supplementary Material (ESI) for Energy & Environmental ScienceThis journal is © The Royal Society of Chemistry 2012

lary reference electrode compartment (see figure 3) using a BioLogic VSP potentiostat
running EC-Lab v 10.2. All compartments are separated from each other by glass frits.
Any Pt-ions coming from the Pt mesh counter electrode is kept from diffusion to the
working electrode by the aforementioned frit. The luggin was filled with a saturated
sodium chloride (Merck, analysis pure) solution as an ion-bridge. The reference elec-
trode is a saturated calomel electrode (SCE) and all potential were recalculated to refer
to the reversible hydrogen electrode (RHE). A 0.1 M HClO4 (Merck, SupraPur®70%)
in milli-Q®water solution was used as electrolyte, the pH was measured to be 1.24.
Before catalytic testing the cell is purged with Ar for at least 30 min, then with H2 for
5 min. During measurements a steady hydrogen flow was bubbled through both the
working and counter electrode compartments.
The recorded potentials are re-calculated to refer to RHE by the following Eactual =
Emeasured +ESCE + 0.059V · pH −Rohmic · Imeasured so Eactual = Emeasured + 0.244V +
0.059V · 1.24 − Rohmic · Imeasured . This also takes into account the ohmic resistance
of the electrode (Rohmic); this resistance is estimated from impedance spectroscopy
measurements (at -0.6 V vs SCE (pH 1.24) 2 kHz to 5 Hz with a sinusoidal 10 mV
amplitude). From this measurement the ohmic resistance was seen to be less than 11
Ω, which is low. However, the exact resistance could not be resolved. Hence, the
resistance correction is omitted. To lessen the effect of the ohmic resistance on the
Tafel slope, the slope is only evaluated at low currents (and thus low overpotentials) as
the resistance is directly proportional to the current drawn. The error is estimated to be
within 1 percent.
5
Electronic Supplementary Material (ESI) for Energy & Environmental ScienceThis journal is © The Royal Society of Chemistry 2012