moment redistribution in beams_mag concrete research-2005
TRANSCRIPT
8/10/2019 Moment Redistribution in Beams_Mag Concrete Research-2005
http://slidepdf.com/reader/full/moment-redistribution-in-beamsmag-concrete-research-2005 1/12
Moment redistribution effects in beams
R. H. Scott* and R. T. Whittle†
University of Durham; Arup Research and Development
Moment redistribution in beams has traditionally been considered as an ultimate limit state (ULS) phenomenon
closely associated with considerations of reinforcement ductility. This paper demonstrates that a significant propor-
tion of this redistribution will almost always occur at the serviceability limit state (SLS) because of the mismatch
between the flexural stiffnesses assumed when calculating moments for the ULS and those actually occurring at the
SLS due to variations in the reinforcement layout along the member and the influence of cracking. This is
demonstrated analytically in the paper and comments are made concerning the current recommendations in
BS 8110 concerning member stiffness. Tests on 33 two-span beams are then presented, parameters investigated
being values of redistribution, beam depth, reinforcement arrangements, concrete strength and the effect of brittle
reinforcement. The results confirm that there is significant redistribution at the SLS and that there is scope for
increasing the permissible limits for redistribution beyond those currently prescribed in design codes. This is
supported by further modelling although it is shown that considerations of crack width may become a limiting
factor.
Introduction
Normal practice is to use a linear elastic analysis for
calculating the bending moment and shear force distri-
butions in a reinforced concrete structure. This has thevirtue of simplicity as well as permitting results from a
series of analyses to be combined using the principle of
superposition. It is endorsed by ma jor design codes
such as BS 8110,1
EC 22
and ACI 318.3
The assumption of linear elastic behaviour is reason-
able at low levels of loading but it becomes increas-
ingly invalid at higher loads due to cracking and the
development of plastic deformations. Once an element
cracks the behaviour becomes non-linear but it is still
reasonable to assume that the tension reinforcement
and the concrete in compression both behave elastically
up to yield of the reinforcement.
Design codes permit elastic analysis to be used at the
ultimate limit state (ULS) but acknowledge this non-
linear behaviour by allowing a limited amount of mo-
ment redistribution from one part of the structure to
another. The permissible moment redistribution is
linked to the ductility of the reinforcement at the ULS.4
Moment redistribution is useful for practical design
as it allows some flexibility in the arrangement of
reinforcement. It can be used to transfer moment away
from congested areas (e.g. beam–column connections)into less congested areas (e.g. mid-spans of beams) or
help to allow standard reinforcement layouts where
small differences occur in the bending moment distri-
butions for a series of beams, thus avoiding the need to
detail each beam separately. In addition, useful econo-
mies can be achieved when moment redistribution is
applied to different load combinations, resulting in a
smaller bending moment envelope which still satisfies
equilibrium.
Implicit in the current use of moment redistribution
is the assumption that sections possess sufficient ducti-
lity for the requisite plastic deformations to occur. De-
sign codes achieve this by specifying rules which
ensure that the tension steel must have yielded, expli-
citly in the case of ACI 318 (which specifies a mini-
mum reinforcement strain of 7500 microstrain) and
implicitly in the case of BS 8110 and EC 2 (which link
percentage redistribution to neutral axis depth). This
leads to the question of whether an upper strain limit
should be specified in order to avoid rupturing the
reinforcement since, with small neutral axis depths,
very high reinforcement strains can be expected.
BS 81101
imposes a minimum neutral axis depth of
0.11d (where d is the effective depth to the tension
steel) although this was introduced for the practical
Magazine of Concrete Research, 2005, 57, No. 1, February, 9–20
9
0024-9831 # 2005 Thomas Telford Ltd
* University of Durham, South Road, Durham, DH1 3LE, UK
† Arup Research and Development, 13 Fitzroy Street, London, W1T
4BQ, UK
(MCR 1208) Paper received 1 December 2003; last revised 2 March
2004; accepted 5 May 2004
8/10/2019 Moment Redistribution in Beams_Mag Concrete Research-2005
http://slidepdf.com/reader/full/moment-redistribution-in-beamsmag-concrete-research-2005 2/12
reason that the top surfaces of beams and slabs are
often quite rough and, as a consequence, it was deemed
sensible to restrict the lever arm used in design calcula-
tions. However, BS 8110’s limit has the effect of re-
stricting reinforcement strains to a maximum of
28 000 microstrain, when making the usual assumption
of linear strain distribution across the section. In reality,
this value is largely meaningless since gross yield of the reinforcement will have occurred by the time this
neutral axis depth has been reached, leading to strains
greatly in excess of this nominal value. Consequently,
designers have effectively worked on the assumption
that the reinforcement will be able to develop whatever
level of strain is actually required by a specified neutral
axis depth and that failure of a section would always be
initiated by crushing of the concrete in compression.
The above view was challenged in 1987 by the work
of Eligehausen and Langer 5
who investigated the con-
sequences of a finite limit to reinforcement ductility on
the failure mode of a section. They demonstrated that
reinforcement strain at the ULS could be the control-
ling parameter in the more lightly reinforced types of
members, such as slabs. This prompted considerable
discussion concerning the ductility requirements for
steel reinforcement. It also raised the question of what
upper limit to moment redistribution should be per-
mitted in design codes and whether more stringent
limitations should be imposed on the level of reinforce-
ment strains developed at the ULS.
This paper presents the results of an investigation
which aimed to explore the nature of moment redistri-
bution as load is increased on a structure and thus
provide some design guidance on the issues outlined above. The first stage in this process is to examine
some of the assumptions made when using the code
method of elastic analysis to determine bending mo-
ment distributions in a reinforced concrete structure.
Flexural stiffness considerations
Moment redistribution involves adjustment of the
bending moment distribution obtained from a linear
elastic analysis with the difference between the redis-
tributed and initial bending moment diagrams being an
indicator of the amount of redistribution which has oc-
curred. The percentage of moment redistribution at a
section along a beam is calculated as follows:-
% redistribution ¼
moment after redistribution
moment before redistribution
moment before redistribution 3 100 (1)
The initial elastic bending moment diagram thus
forms the baseline for the redistribution calculation and
any assumptions or approximations made in its deter-
mination will directly affect the level of redistribution
calculated using the above expression.
An elastic analysis is controlled by assumptions con-
cerning the value of flexural stiffness (EI) along the
member. Recommendations in design codes vary from,
at one extreme, EC 22 which is non-specific, to
BS 81101 which gives three options for calculating the
EI value at any particular section (clause 2.5.2). Theseare the concrete section (the entire concrete cross sec-
tion, ignoring the reinforcement), the gross section (the
entire concrete cross section with the reinforcement
included on the basis of modular ratio) and the trans-
formed section (the compression area of the concrete
cross section, ignoring the concrete in tension, com-
bined with the reinforcement on the basis of modular
ratio). A further option would be to take the cracked
section properties including tension stiffening effects of
the concrete. Since the reinforcement is not known
until the end of the design process, the most frequently
used, by far, in practical design is the concrete section.
This has the practical virtue of simplicity (for example,
a rectangular continuous beam will have constant flex-
ural stiffness along its entire length) but it also has
implications for moment redistribution which, perhaps,
may not be fully appreciated.
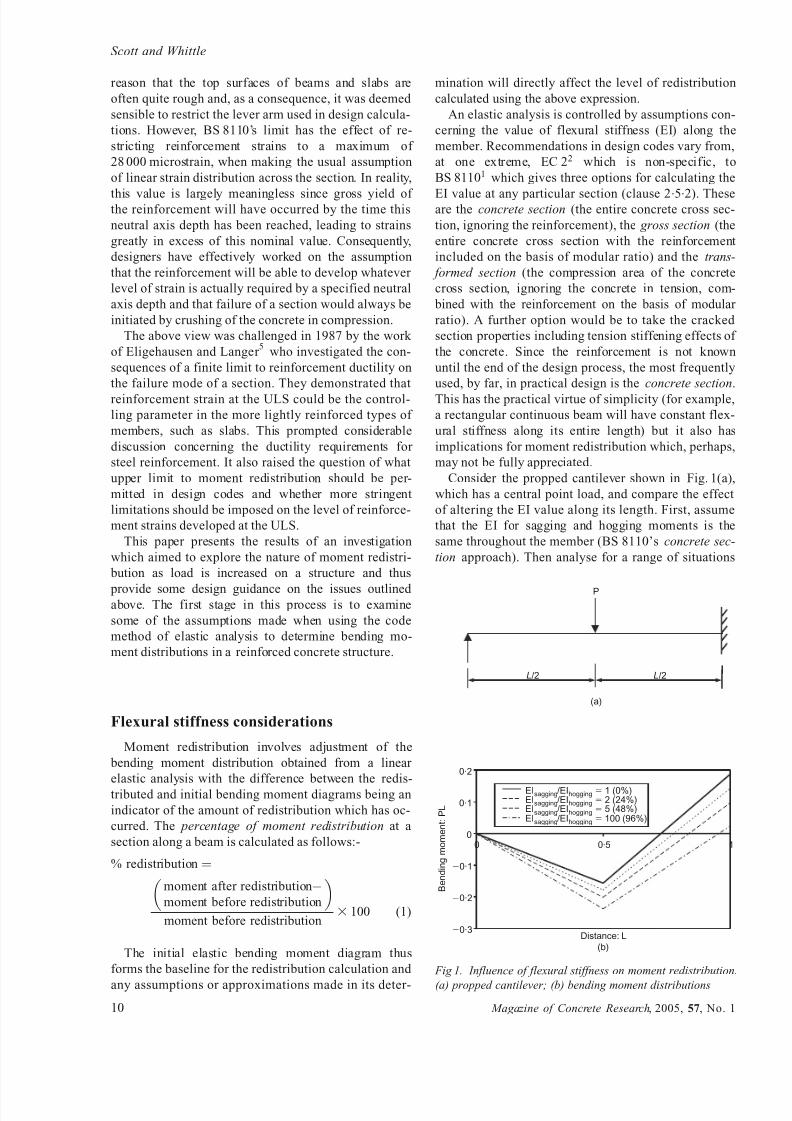
Consider the propped cantilever shown in Fig. 1(a),
which has a central point load, and compare the effect
of altering the EI value along its length. First, assume
that the EI for sagging and hogging moments is the
same throughout the member (BS 8110’s concrete sec-
tion approach). Then analyse for a range of situations
EIsagging/EIhogging 1 (0%)EIsagging/EIhogging 2 (24%)EIsagging/EIhogging 5 (48%)EIsagging/EIhogging 100 (96%)
0·5 10
0·2
0·1
0
0·1
0·2
0·3
B e n d i n g m o m e n t : P L
Distance: L
(b)
P
L/2 L/2
(a)
Fig 1. Influence of flexural stiffness on moment redistribution.
(a) propped cantilever; (b) bending moment distributions
Scott and Whittle
10 Magazine of Concrete Research, 2005, 57, No. 1
8/10/2019 Moment Redistribution in Beams_Mag Concrete Research-2005
http://slidepdf.com/reader/full/moment-redistribution-in-beamsmag-concrete-research-2005 3/12
where the EI for sagging moments differs from that for
hogging moments. To illustrate the point, ratios of
EIsagging/EIhogging of 1, 2, 5 and 100 have been selected
and the resulting bending moment distributions are
plotted in Fig. 1( b). The bending moment distribution
for EIsagging/EIhogging ¼ 1 corresponds, of course, to the
situation of constant EI all along the beam and thus
acts as a reference line for the other distributions.Increasing the sagging stiffness (applicable in the
span) relative to the hogging stiffness (applicable at the
support) has the expected effect of shifting moments
away from the support and into the span. In the extreme
case when a stiffness ratio of 100 is used the behaviour
becomes very close to that for a simply supported
beam. Thus, relative to the bending moment distribu-
tion obtained using the concrete section approach, mo-
ment redistribution has occurred in all the other
bending moment distributions even though all sections
along the member are always behaving in a linearly
elastic fashion. The percentages of redistribution ob-
tained at the support, when calculated relative to the
constant stiffness distribution, are also shown in Fig.
1( b) in order to illustrate this point. Fig. 1( b) empha-
sises that it is the relative values of EI that control the
bending moment distribution, not the absolute values at
any particular section. Any change in the relative EI
values will cause moment redistribution to occur.
The above has consequences for understanding the
behaviour of reinforced concrete beams. If, as is usual,
the concrete section is used for the analysis, then the
bending moment distribution is that for EI constant all
along the beam and this is the situation for which the
reinforcement is normally designed at the ULS. It isalso the bending moment distribution which will actu-
ally be achieved at ultimate. However, in the vast ma-
jority of beams, the resulting reinforcement layout will
vary along the span. This means that actual EI values
based on either the gross or transformed section will
change along the span giving relative EI values which
are no longer unity. Thus the bending moment distribu-
tions actually developed along the beam, even at the
serviceability limit state (SLS), will differ from those
obtained from analyses that use the concrete section
approach. Consequently, moment redistribution will oc-
cur even though none was anticipated in the calcula-
tions. This redistribution will be very small prior to
cracking but after cracking the ratio of EIspan : EIsupport
will normally increase with a corresponding increase in
the level of redistribution, even though the reinforce-
ment behaves elastically. The magnitude of this redis-
tribution can be quite considerable, as will be
demonstrated later. A further complication occurs once
the section cracks as tension stiffening then causes the
EI to vary with the applied moment.
The redistribution which occurs as a result of this
mismatch between the actual and assumed EI values
will be termed elastic redistribution in this paper. It
should be noted that this redistribution is occurring
under SLS conditions and that the reinforcement is
behaving elastically. After the reinforcement yields
further redistribution will occur owing to further
changes in the relative values of EI. This additional,
post-yield, redistribution will be termed plastic redistri-
bution in this paper. Plastic redistribution is the redis-
tribution with which design engineers have traditionally
been familiar and which they implicitly make use of during traditional moment redistribution calculations.
Total redistribution at the ULS will actually be the sum
of the elastic and plastic components. It will not be all
plastic as is commonly assumed at present. Elastic
redistribution can nearly always be expected even
though none may have been anticipated in the design
calculations. This is likely to be inconsistent with the
amount of redistribution for which the beam has actu-
ally been designed and thus the plastic redistribution
that actually occurs will be different from the design
value. Consequently, a beam designed for no moment
redistribution at the ULS will actually have to undergo
plastic redistribution in order to offset the elastic redis-
tribution caused by the supports being more heavily
reinforced than the spans and the effects of cracking.
An apparently attractive alternative is to use for
analysis a distribution of EI which is consistent with
the actual stiffness distribution of the reinforcement
(BS 8110’s transformed section option). To be success-
ful this requires that the reinforcement layout be
known prior to undertaking the analysis so that ‘cor-
rect’ EI values can be determined and thus ensure that
the calculated bending moment diagram is consistent
with the beam’s own moments of resistance. This is
very difficult to achieve so an alternative is to try aniterative approach. For instance, the beam could first
be analysed assuming constant EI (the concrete section
approach). The reinforcement is then calculated but
this will change the actual distribution of EI. The
beam is then re-analysed but the bending moment
distribution will now have changed because of the
changes in EI and the reinforcement layout must now
be adjusted to accommodate the new bending moment
distribution. This again changes the EI distribution
prompting another analysis and another adjustment of
the reinforcement layout. This causes yet another
change in the distribution of EI leading to yet another
analysis and so on. The procedure can become un-
stable and is thus unsuitable for practical design pur-
poses. Similar comments can be made concerning use
of the gross section.
From the above it is suggested that, in spite of the
recommendations of clause 2.5.2 in BS 8110, both the
gross section and transformed section approaches are
unsuitable for design calculation of bending moment
distributions at the ULS. Furthermore, it is suggested
that the only practical approach is to use EI values for
the concrete section when calculating these moments
although it is important to recognise the simplifications
and approximations which result from this. The above
Moment redistribution effects in beams
Magazine of Concrete Research, 2005, 57, No. 1 11

8/10/2019 Moment Redistribution in Beams_Mag Concrete Research-2005
http://slidepdf.com/reader/full/moment-redistribution-in-beamsmag-concrete-research-2005 4/12
is, of course, not true for the analysis of existing
sections where the reinforcement layout is known.
A programme of laboratory tests was undertaken to
investigate the above points in greater detail. The ef-
fects of the following parameters were investigated:
(a) depth of section
(b) different values of design moment redistribution(c) different arrangements of reinforcement (e.g. large
bars versus small bars)
(d ) different concrete strengths (i.e. use of high-
strength concrete for some specimens)
(e) the effect of brittle reinforcement [i.e. glass f ibre
reinforced polymer (GFRP) bars].
Further details are given in the next section.
Specimen details and test procedure
A total of 33 two-span beams, 5.2 m long and
300 mm wide, were tested to investigate moment redis-
tribution effects between the centre support and adja-
cent spans. Depths of 400 mm (series A), 250 mm
(series B) and 150 mm (series C, D and E) were used.
Each span was 2435 mm long and loaded approxi-
mately at its mid-point, as indicated in Fig. 2. The main
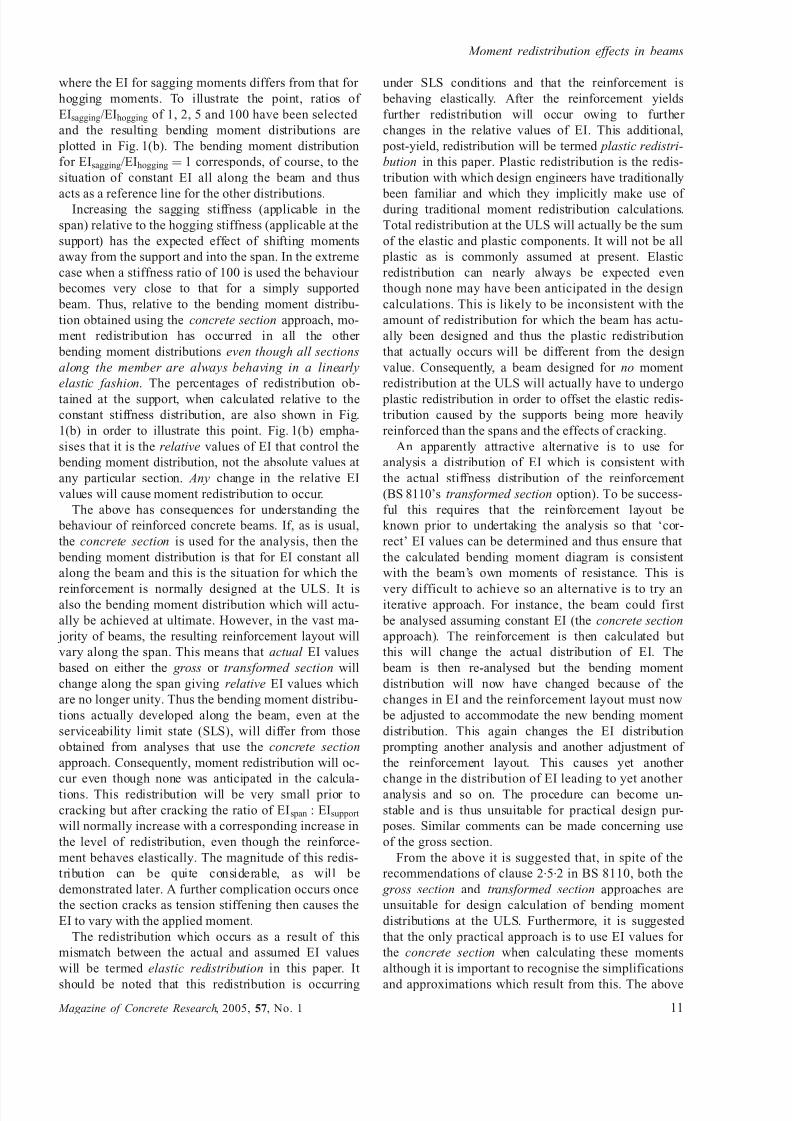
set of 23 specimens, shown in Table 1, was designed
for 30% redistribution from the centre support into the
adjacent spans and will be described first. The remain-
ing ten specimens, which investigated other aspects of
moment redistribution behaviour, are described later.
A consistent coding system was used to reference thespecimens. A typical example is B2T12D where B
indicates high yield bar reinforcement , 2T12 is the
tension reinforcement provided over the centre support
and D shows the specimen belongs to series D. An H
suffix would indicate that the specimen was made with
high-strength concrete e.g. B2T12DH. Other suffices
(typically X) are used when specimens were repeated.
Each series investigated a different percentage of
tension (top) steel at the centre support, values rangingfrom about 0.3% (series E) up to around 1.7% (series
C). However, the several specimens within each series
(with the exception of series A which comprised one
specimen only) achieved this percentage by using dif-
ferent combinations of bar diameters such as 2T20 or
3T16 or 5T12. This enabled bar diameter effects to be
examined since the combinations gave approximately
the same total area of tension steel. All other reinforce-
ment (bottom steel at the centre support and top and
bottom steel in the spans) was the same for all beams
within each series. Some tests were repeated and nom-
inally identical specimens are block shaded in Table 1.
Seventeen specimens were cast using normal strength
concrete and six with high-strength concrete. The nor-
mal strength concrete had a maximum aggregate size
of 10 mm, an aggregate : cement ratio of 5.5 and an
overall water : cement ratio of 0.6. The average com-
pressive cube strength was 51.8 MPa (standard devia-
tion 7.9 MPa) and the average indirect cylinder strength
was 3.0 MPa (standard deviation 0.2 MPa). The high-
strength concrete used 10 mm aggregate and microsili-
ca (in slurry form) in addition to Ordinary Portland
Cement (CEM 1) and sand. The overall water : cement
ratio was 0.25 with adequate workability being achieved
by the addition of admixtures. It was commercially batched and delivered by truck. The average compres-
Load Load
12501250
*
*
*
*
C C′ A
D D′B
2435 2435
All dimensions in mm.
All beams 5200 mm long overall 300 mm wide. Depths vary – see Tables 1 and 2.
For bar diameters see Tables 1 and 2.
Bars at locations A and B all 1500 mm long. Laps all 300 mm.
Bars at A, C, C′ and B, D, D′ all in the same horizontal plane. Bars at C, C ′, D, D′ cranked
on plan at lap positions to achieve this.
30 mm cover to centre of longitudinal bars.
Stirrups: Series A and B: T10s at 200 centres, all other specimens R6s at 100 mm centres.
* indicates normal exit point for wires in gauged bars – see text and Tables 1 and 2.
Fig 2. Diagrammatic layout of test specimens
Scott and Whittle
12 Magazine of Concrete Research, 2005, 57, No. 1
8/10/2019 Moment Redistribution in Beams_Mag Concrete Research-2005
http://slidepdf.com/reader/full/moment-redistribution-in-beamsmag-concrete-research-2005 5/12
sive cube strength was 120.4 MPa (standard deviation
10.0 MPa) and the average indirect cylinder strength
was 4.1 MPa (standard deviation 0.5 MPa). High-
strength specimens have the H suffix, as mentioned
previously, and are also shown in italics in Table 1.
As indicated in Table 1, 15 of the 23 specimens
contained strain-gauged reinforcing bars. Specimens
with normal strength concrete contained four gauged
bars, one each at the locations A, B, C, D shown in
Fig. 1 and referred to as rods 1–4, respectively. Speci-
mens with high-strength concrete contained two gauged
bars, one each at locations A and D and referred to as
rods 1 and 4. Gauged bars had electric resistance strain
gauges installed in a central longitudinal duct having a
cross-section of 4 mm 3 4 mm in bars of 12 mm dia.
and above but which was reduced to 3.2 mm 3 3.2 mm
in 10 mm dia. bars and to 2.5 mm 3 2.5 mm in 6 mm
and 8 mm dia. bars. Typically, 51 strain gauges were
installed in each bar of 10 mm dia. or above but this
number was reduced to 30 gauges in the 6 mm and
8 mm dia. bars. Gauge spacing varied from 12.5 mm in
zones where rapid changes in strain were expected to
50 mm in less critical areas. Gauges generally had a
strain limit of 3% but high elongation gauges having a
strain limit of 10–15% were used in areas where high
strain levels were anticipated. The wir ing normally
exited from one end of each bar (see Fig. 2) except for
the 8 mm and 10 mm dia. bars where both ends were
used. Gauged bars formed part of the main reinforce-
ment in each beam and, wherever possible, the centre
bar in a group of three was gauged to maintain symme-
try of stiffness across the beam width. Obviously this
was not possible in locations where there were only two
bars but the effects of the resulting asymmetry were
believed to be small. Further details of the gauging
technique, which ensures that the bond characteristic
between the reinforcement and surrounding concrete is
undisturbed, have been published elsewhere.6
A further ten specimens, shown in Table 2, were
tested to investigate other aspects of moment redistribu-
tion. Three specimens (prefixed W) used ribbed high-
yield wires instead of bar reinforcement but were other-
wise a repeat of the strain-gauged specimens in series
D. Three specimens with bar reinforcement were rein-
forced for zero redistribution, one for 55% redistribu-
tion and two specimens examined the effects of
Table 1. Specimen details: 30% moment redistribution
Series Specimen code Overall depth: mm Support reinforcement Span reinforcement
Top
(A)
Bottom
(B)
Top
(C, C9)
Bottom
(D, D9)
A B3T16A** 400 3T16 (0.53%) 3T12 3T12 3T20
B B2T20B** 250 2T20 (0.93%) 3T12 3T12 3T20
B3T16B** 3T16 (0.89%)B3T16BL** 3T16 (0.89%)
B3T16BLX 3T16 (0.91%)
B5T12B** 5T12 (0.83%)
B2T20BH* 2T20 (0 .93%)
B2T20BHX 2T20 (0 .95%)
B5T12BH* 5T12 (0 .83%)
B5T12BHX 5T12 (0 .86%)
C B2T20C** 150 2T20 (1.70%) 3T12 3T12 3T20
B3T16C** 3T16 (1.63%)
B5T12C** 5T12 (1.53%)
D B2T12D** 150 2T12 (0.58%) 3T10 3T10 3T12
B2T12DX 2T12 (0.63%)
B2T12DXX 2T12 (0.63%)
B3T10D** 3T10 (0.63%)
B5T8D** 5T8 (0.68%)
B2T12DH* 2T12 (0 .58%)
B2T12DHX 2T12 (0 .63%)
E B2T8E** 150 2T8 (0.26%) 2T8 2T8 3T8
B2T8EX 2T8 (0.28%)
B4T6E** 4T6 (0.30%)
This table should be read in conjunction with Fig. 2. ** indicates four strain-gauged bars. * indicates two strain gauged bars. Details in italics are
for high-strength specimens. Shaded groups of specimens are nominally identical.
Moment redistribution effects in beams
Magazine of Concrete Research, 2005, 57, No. 1 13
8/10/2019 Moment Redistribution in Beams_Mag Concrete Research-2005
http://slidepdf.com/reader/full/moment-redistribution-in-beamsmag-concrete-research-2005 6/12
redistributing moments from the spans back to the
centre support by 30 and 60%, respectively (shown as
negative values in Table 2). The final specimen
(F5F13B) used GFRP bars for the main tension reinfor-
cement with five 13 mm dia. bars over the centre sup-
port and two 25 mm dia. bars in each span (the only
two diameters readily obtainable by the authors at the
time). This gave the closest possible match to specimen
B5T12B with the available materials.
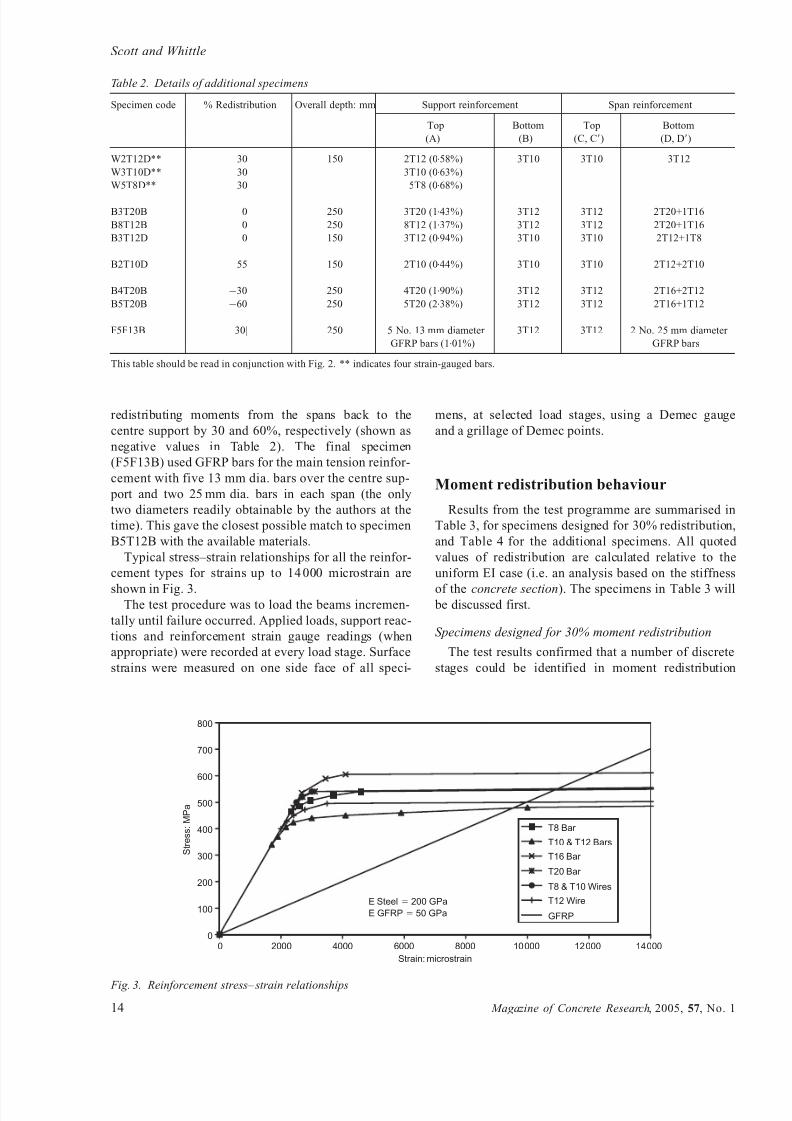
Typical stress–strain relationships for all the reinfor-
cement types for strains up to 14 000 microstrain are
shown in Fig. 3.The test procedure was to load the beams incremen-
tally until failure occurred. Applied loads, support reac-
tions and reinforcement strain gauge readings (when
appropriate) were recorded at every load stage. Surface
strains were measured on one side face of all speci-
mens, at selected load stages, using a Demec gauge
and a grillage of Demec points.
Moment redistribution behaviour
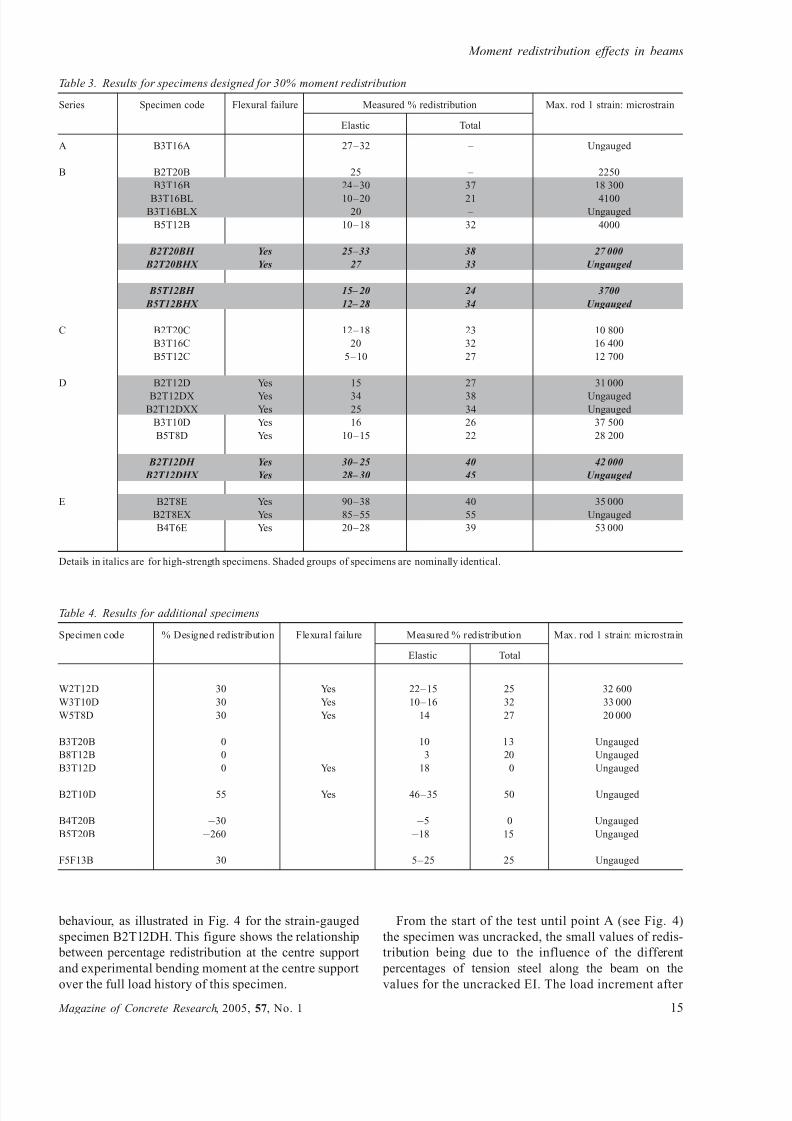
Results from the test programme are summarised in
Table 3, for specimens designed for 30% redistribution,
and Table 4 f or the additional specimens. All quoted
values of redistribution are calculated relative to the
uniform EI case (i.e. an analysis based on the stiffness
of the concrete section). The specimens in Table 3 will be discussed first.
Specimens designed for 30% moment redistribution
The test results confirmed that a number of discrete
stages could be identified in moment redistribution
Table 2. Details of additional specimens
Specimen code % Redistribution Overall depth: mm Support reinforcement Span reinforcement
Top
(A)
Bottom
(B)
Top
(C, C9)
Bottom
(D, D9)
W2T12D** 30 150 2T12 (0.58%) 3T10 3T10 3T12
W3T10D** 30 3T10 (0.63%)
W5T8D** 30 5T8 (0.68%)
B3T20B 0 250 3T20 (1.43%) 3T12 3T12 2T20+1T16
B8T12B 0 250 8T12 (1.37%) 3T12 3T12 2T20+1T16
B3T12D 0 150 3T12 (0.94%) 3T10 3T10 2T12+1T8
B2T10D 55 150 2T10 (0.44%) 3T10 3T10 2T12+2T10
B4T20B 30 250 4T20 (1.90%) 3T12 3T12 2T16+2T12
B5T20B 60 250 5T20 (2.38%) 3T12 3T12 2T16+1T12
F5F13B 30| 250 5 No. 13 mm diameter
GFRP bars (1.01%)
3T12 3T12 2 No. 25 mm diameter
GFRP bars
This table should be read in conjunction with Fig. 2. ** indicates four strain-gauged bars.
T8 Bar
T10 & T12 Bars
T16 Bar
T20 Bar
T8 & T10 Wires
T12 Wire
GFRP
E Steel 200 GPa
E GFRP 50 GPa
0 2000 4000 6000 8000 10000 12000 14000
Strain: microstrain
800
700
600
500
400
300
200
100
0
S t r e s s : M P a
Fig. 3. Reinforcement stress– strain relationships
Scott and Whittle
14 Magazine of Concrete Research, 2005, 57, No. 1
8/10/2019 Moment Redistribution in Beams_Mag Concrete Research-2005
http://slidepdf.com/reader/full/moment-redistribution-in-beamsmag-concrete-research-2005 7/12
behaviour, as illustrated in Fig. 4 for the strain-gauged
specimen B2T12DH. This figure shows the relationship
between percentage redistribution at the centre support
and experimental bending moment at the centre support
over the full load history of this specimen.
From the start of the test until point A (see Fig. 4)
the specimen was uncracked, the small values of redis-
tribution being due to the influence of the different
percentages of tension steel along the beam on the
values for the uncracked EI. The load increment after
Table 3. Results for specimens designed for 30% moment redistribution
Series Specimen code Flexural failure Measured % redistribution Max. rod 1 strain: microstrain
Elastic Total
A B3T16A 27– 32 – Ungauged
B B2T20B 25 – 2250
B3T16B 24– 30 37 18 300
B3T16BL 10– 20 21 4100B3T16BLX 20 – Ungauged
B5T12B 10– 18 32 4000
B2T20BH Yes 25 – 33 38 27 000
B2T20BHX Yes 27 33 Ungauged
B5T12BH 15– 20 24 3700
B5T12BHX 12– 28 34 Ungauged
C B2T20C 12– 18 23 10 800
B3T16C 20 32 16 400
B5T12C 5– 10 27 12 700
D B2T12D Yes 15 27 31 000
B2T12DX Yes 34 38 Ungauged
B2T12DXX Yes 25 34 Ungauged
B3T10D Yes 16 26 37 500
B5T8D Yes 10– 15 22 28 200
B2T12DH Yes 30– 25 40 42 000
B2T12DHX Yes 28– 30 45 Ungauged
E B2T8E Yes 90– 38 40 35 000
B2T8EX Yes 85– 55 55 Ungauged
B4T6E Yes 20– 28 39 53 000
Details in italics are for high-strength specimens. Shaded groups of specimens are nominally identical.
Table 4. Results for additional specimens
Specimen code % Designed redistribution Flexural failure Measured % redistribution Max. rod 1 strain: microstrain
Elastic Total
W2T12D 30 Yes 22– 15 25 32 600
W3T10D 30 Yes 10– 16 32 33 000
W5T8D 30 Yes 14 27 20 000
B3T20B 0 10 13 Ungauged
B8T12B 0 3 20 Ungauged
B3T12D 0 Yes 18 0 Ungauged
B2T10D 55 Yes 46– 35 50 Ungauged
B4T20B 30 5 0 Ungauged
B5T20B 260 18 15 Ungauged
F5F13B 30 5– 25 25 Ungauged
Moment redistribution effects in beams
Magazine of Concrete Research, 2005, 57, No. 1 15

8/10/2019 Moment Redistribution in Beams_Mag Concrete Research-2005
http://slidepdf.com/reader/full/moment-redistribution-in-beamsmag-concrete-research-2005 8/12
point A caused a crack to form at the centre support
and the strains in the top tension bars at this location
then increased with succeeding load stages until point
D was reached. The measured strain distributions in
rod 1 over the centre support (location A in Fig. 2) for
these load stages are shown in Fig. 5, with curves A to
D in Fig. 5 corresponding to points A to D in Fig. 4.
Fig. 5 clearly shows how the crack developed between
load stages A and D, causing a significant reduction in
the support EI relative to that in the span and hence the
step change in redistribution behaviour observable in
Fig. 4.
The span cracked at point D which reduced the span
EI of the beam. Between D and E a stable crack pattern
developed, with all reinforcement strains elastic, and
this zone corresponded to the SLS. Point E marks the
onset of yield (i.e. initial deviance from linear behav-
iour) in the reinforcement at the centre support and at
point F a similar situation occurred in the span, bywhich time the strain in rod 1 had reached around 5000
microstrain. F to G was a region of rapid strain
development in both locations leading to plastic hinges
being formed. The resulting flexural failure was char-
acterised by an inability to maintain applied loads due
to the excessive deflections which occurred as a result
of the mechanism action. Strains had reached around
42 000 microstrain and 18 000 microstrain at the sup-
port and span locations respectively (rods 1 and 4) by
the end of the test. The final strain distribution in rod 1
at the centre support is shown in Fig. 6. This indicates
the very localised nature of the gross yield associated
with plastic hinge development.
Specimen B2T12DH achieved around 40% redistri-
bution by the end of the test. However, it is important
to note that some 25% redistribution was achieved
when the reinforcement was still behaving elastically;
that is, of the 40% total, 25% was elastic redistribution
and only 15% was plastic redistribution.
A similar pattern of behaviour was observed with the
five specimens of series D designed for 30% redistribu-
tion, which are all plotted in Fig. 7. These specimens
all achieved the designed 30% redistribution at the
ULS (albeit only just with B2T12D but comfortably so
with the others) with the elastic contribution ranging
from around 15% up to about 35%, this spread of
values being caused by variations in the nature of the
crack patterns in the individual specimens. These speci-
mens all exhibited flexural failures.
Ductility limitations were not an issue at any stage
during the test programme. None of the reinforcing bars, which were all of UK origin, failed in spite of the
very high strain levels reached in some instances.
High levels of redistribution were also achieved even
when the reinforcement was still behaving elastically at
failure. B2T20B failed in shear with a peak strain in
rod 1 of only 2250 microstrain yet it achieved 25%
redistribution at failure, all of which was elastic. The
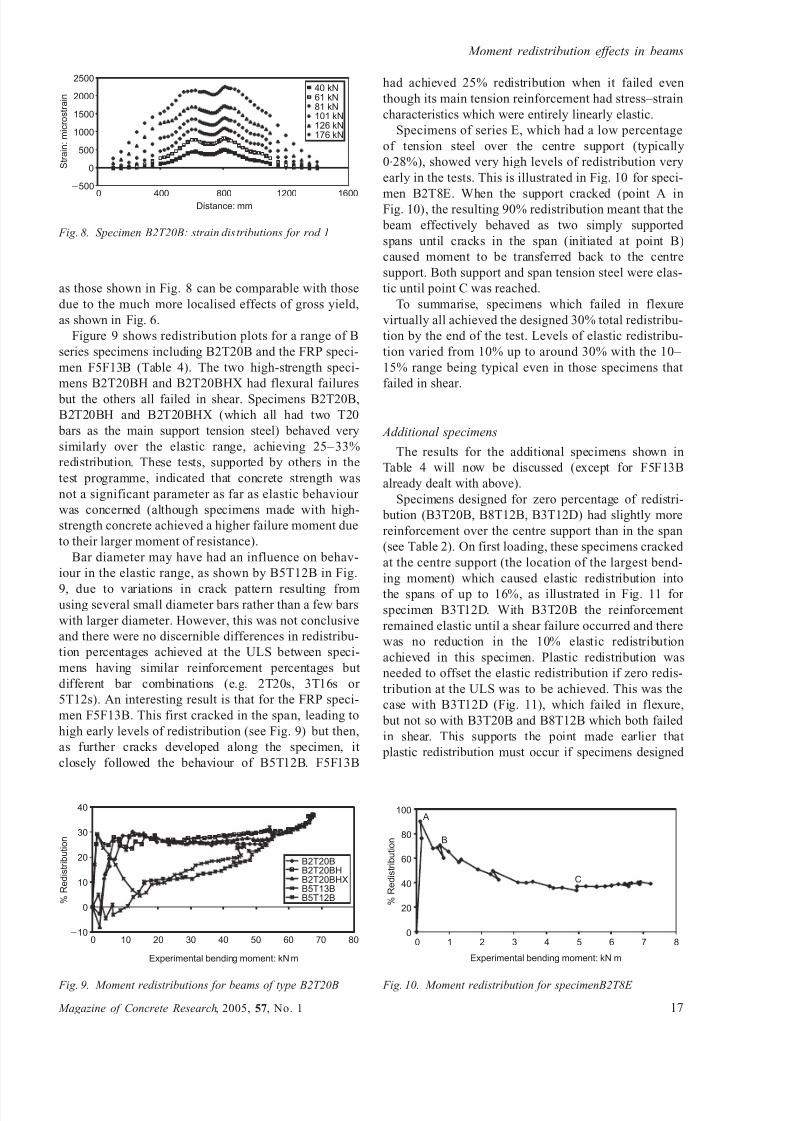
strain d istributions for rod 1 in this specimen, shown in
Fig. 8, indicate the flatter spread of strains resulting
from the absence of gross yield. As Beeby has pointed
out,4
rotations associated with strain distributions such
A
B
C
D
E
F
G
2 4 6 8 10 12 14 16 18
Experimental bending moment: kNm
45
40
35
30
25
20
15
10
5
0
% R
e d i s t r i b u t i o n
Fig. 4. Development of moment redistribution in specimen
B2T12DH
ABCD
0 400 800 1200 1600
Distance: mm
1000
800
600
400
200
0
200
S t r a i n : m i c r o s t r a i n
Fig. 5. Specimen B2T12DH: early strain distributions along
rod 1
0 400 800 1200 1600
Distance: mm
50000
40000
30000
20000
10000
0
10000
S t r a i n : m i c r o s t r a i n
Fig. 6. Specimen B2T12DH: ultimate strain distribution
along rod 1
B2T12DB2T12DXB2T12DXXB2T12DHB2T12DHX
2 4 6 8 10 12 14 16 18
Experimental bending moment: kNm
50
40
30
20
10
0
% R
e d i s t r i b u t i o n
Fig. 7. Moment redistributions for beams of type B2T12D
Scott and Whittle
16 Magazine of Concrete Research, 2005, 57, No. 1
8/10/2019 Moment Redistribution in Beams_Mag Concrete Research-2005
http://slidepdf.com/reader/full/moment-redistribution-in-beamsmag-concrete-research-2005 9/12
as those shown in Fig. 8 can be comparable with those
due to the much more localised effects of gross yield,
as shown in Fig. 6.
Figure 9 shows redistribution plots for a range of B
series specimens including B2T20B and the FRP speci-
men F5F13B (Table 4). The two high-strength speci-
mens B2T20BH and B2T20BHX had flexural failures
but the others all failed in shear. Specimens B2T20B,
B2T20BH and B2T20BHX (which all had two T20
bars as the main support tension steel) behaved very
similarly over the elastic range, achieving 25– 33%
redistribution. These tests, supported by others in the
test programme, indicated that concrete strength was
not a significant parameter as far as elastic behaviour
was concerned (although specimens made with high-
strength concrete achieved a higher failure moment due
to their larger moment of resistance).
Bar diameter may have had an influence on behav-
iour in the elastic range, as shown by B5T12B in Fig.
9, due to variations in crack pattern resulting fromusing several small diameter bars rather than a few bars
with larger diameter. However, this was not conclusive
and there were no discernible differences in redistribu-
tion percentages achieved at the ULS between speci-
mens having similar reinforcement percentages but
different bar combinations (e.g. 2T20s, 3T16s or
5T12s). An interesting result is that for the FRP speci-
men F5F13B. This first cracked in the span, leading to
high early levels of redistribution (see Fig. 9) but then,
as further cracks developed along the specimen, it
closely followed the behaviour of B5T12B. F5F13B
had achieved 25% redistribution when it failed even
though its main tension reinforcement had stress–strain
characteristics which were entirely linearly elastic.
Specimens of series E, which had a low percentage
of tension steel over the centre support (typically
0.28%), showed very high levels of redistribution very
early in the tests. This is illustrated in Fig. 10 for speci-
men B2T8E. When the support cracked (point A inFig. 10), the resulting 90% redistribution meant that the
beam effectively behaved as two simply supported
spans until cracks in the span (initiated at point B)
caused moment to be transferred back to the centre
support. Both support and span tension steel were elas-
tic until point C was reached.
To summarise, specimens which failed in flexure
virtually all achieved the designed 30% total redistribu-
tion by the end of the test. Levels of elastic redistribu-
tion varied from 10% up to around 30% with the 10–
15% range being typical even in those specimens that
failed in shear.
Additional specimens
The results for the additional specimens shown in
Table 4 will now be discussed (except for F5F13B
already dealt with above).
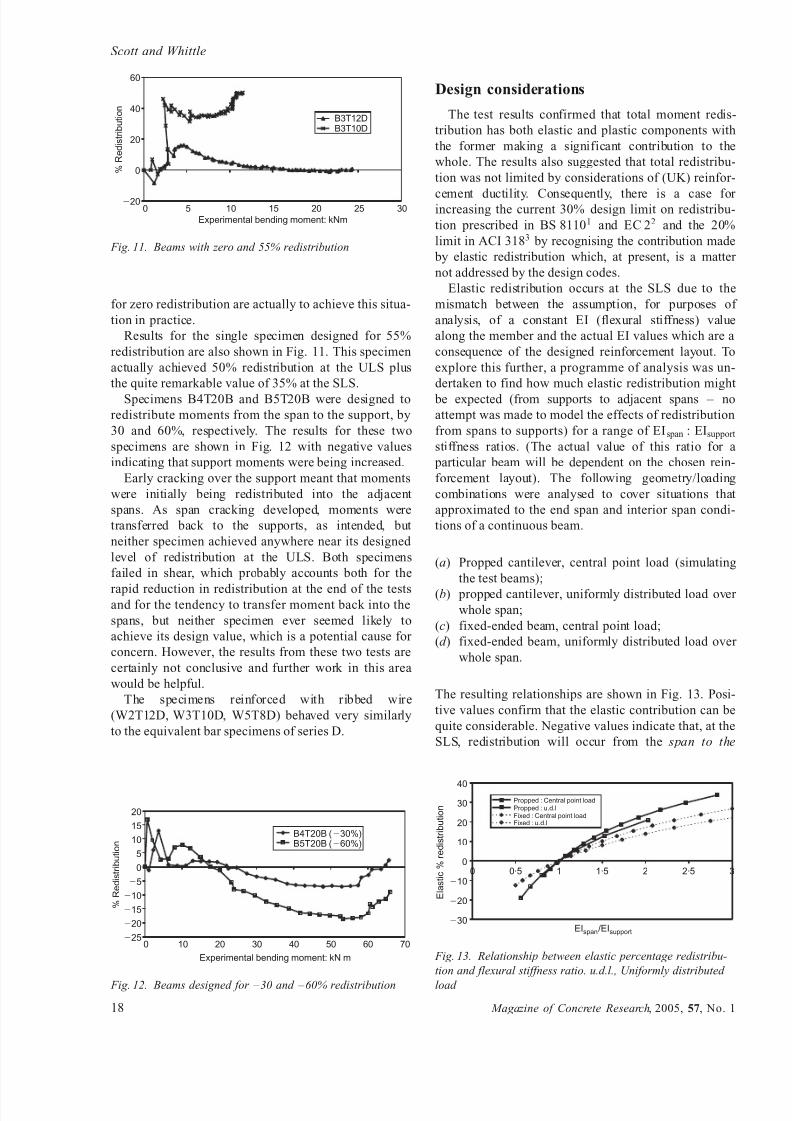
Specimens designed for zero percentage of redistri-
bution (B3T20B, B8T12B, B3T12D) had slightly more
reinforcement over the centre support than in the span
(see Table 2). On first loading, these specimens cracked
at the centre support (the location of the largest bend-
ing moment) which caused elastic redistribution into
the spans of up to 16%, as illustrated in Fig. 11 for
specimen B3T12D. With B3T20B the reinforcement
remained elastic until a shear failure occurred and there
was no reduction in the 10% elastic redistribution
achieved in this specimen. Plastic redistribution was
needed to offset the elastic redistribution if zero redis-
tribution at the ULS was to be achieved. This was the
case with B3T12D (Fig. 11), which failed in flexure,
but not so with B3T20B and B8T12B which both failed
in shear. This supports the point made earlier that
plastic redistribution must occur if specimens designed
40 kN
81 kN61 kN
101 kN126 kN176 kN
0 400 800 1200 1600Distance: mm
2500
2000
1500
1000
500
0
500
S t r a i n : m i c r o s t r a i n
Fig. 8. Specimen B2T20B: strain distributions for rod 1
B2T20BB2T20BHB2T20BHXB5T13BB5T12B
0 10 20 30 40 50 60 70 80
Experimental bending moment: kNm
40
30
20
10
0
10
% R
e d i s t r i b u t i o n
Fig. 9. Moment redistributions for beams of type B2T20B
A
B
C
0 1 2 3 4 5 6 7 8
Experimental bending moment: kN m
100
80
60
40
20
0
% R
e d i s t r i b u t i o n
Fig. 10. Moment redistribution for specimenB2T8E
Moment redistribution effects in beams
Magazine of Concrete Research, 2005, 57, No. 1 17
8/10/2019 Moment Redistribution in Beams_Mag Concrete Research-2005
http://slidepdf.com/reader/full/moment-redistribution-in-beamsmag-concrete-research-2005 10/12
for zero redistribution are actually to achieve this situa-
tion in practice.
Results for the single specimen designed for 55%
redistribution are also shown in Fig. 11. This specimen
actually achieved 50% redistribution at the ULS plus
the quite remarkable value of 35% at the SLS.
Specimens B4T20B and B5T20B were designed to
redistribute moments from the span to the support, by
30 and 60%, respectively. The results for these two
specimens are shown in Fig. 12 with negative values
indicating that support moments were being increased.
Early cracking over the support meant that moments
were initially being redistributed into the adjacent
spans. As span cracking developed, moments were
transferred back to the supports, as intended, but
neither specimen achieved anywhere near its designed
level of redistribution at the ULS. Both specimens
failed in shear, which probably accounts both for the
rapid reduction in redistribution at the end of the testsand for the tendency to transfer moment back into the
spans, but neither specimen ever seemed likely to
achieve its design value, which is a potential cause for
concern. However, the results from these two tests are
certainly not conclusive and further work in this area
would be helpful.
The specimens reinforced with ribbed wire
(W2T12D, W3T10D, W5T8D) behaved very similarly
to the equivalent bar specimens of series D.
Design considerations
The test results confirmed that total moment redis-
tribution has both elastic and plastic components with
the former making a significant contribution to the
whole. The results also suggested that total redistribu-
tion was not limited by considerations of (UK) reinfor-
cement ductility. Consequently, there is a case for increasing the current 30% d esign limit on redistribu-
tion prescribed in BS 81101 and EC 22 and the 20%
limit in ACI 3183 by recognising the contribution made
by elastic redistribution which, at present, is a matter
not addressed by the design codes.
Elastic redistribution occurs at the SLS due to the
mismatch between the assumption, for purposes of
analysis, of a constant EI (flexural stiffness) value
along the member and the actual EI values which are a
consequence of the designed reinforcement layout. To
explore this further, a programme of analysis was un-
dertaken to find how much elastic redistribution might
be expected (from supports to adjacent spans – no
attempt was made to model the effects of redistribution
from spans to supports) for a range of EIspan : EIsupport
stiffness ratios. (The actual value of this ratio for a
particular beam will be dependent on the chosen rein-
forcement layout). The following geometry/loading
combinations were analysed to cover situations that
approximated to the end span and interior span condi-
tions of a continuous beam.
(a) Propped cantilever, central point load (simulating
the test beams);
(b) propped cantilever, uniformly distributed load over
whole span;
(c) fixed-ended beam, central point load;
(d ) fixed-ended beam, uniformly distributed load over
whole span.
The resulting relationships are shown in Fig. 13. Posi-
tive values confirm that the elastic contribution can be
quite considerable. Negative values indicate that, at the
SLS, redistribution will occur from the span to the
B3T12DB3T10D
0 5 10 15 20 25 30
Experimental bending moment: kNm
60
40
20
0
20
% R
e d i s t r i b u t i o n
Fig. 11. Beams with zero and 55% redistribution
B4T20B (30%)B5T20B (60%)
0 10 20 30 40 50 60 70
Experimental bending moment: kN m
20
15
10
5
0
5
10
15
20
25
% R
e d i s t r i b u t i o n
Fig. 12. Beams designed for –30 and –60% redistribution
Propped : Central point loadPropped : u.d.lFixed : Central point loadFixed : u.d.l
0 0·5 1 1·5 2 2·5 3
EIspan/EIsupport
40
30
20
10
0
10
20
30
E l a s t i c % r
e d i s t r i b u t i o n
Fig. 13. Relationship between elastic percentage redistribu-
tion and flexural stiffness ratio. u.d.l., Uniformly distributed
load
Scott and Whittle
18 Magazine of Concrete Research, 2005, 57, No. 1
8/10/2019 Moment Redistribution in Beams_Mag Concrete Research-2005
http://slidepdf.com/reader/full/moment-redistribution-in-beamsmag-concrete-research-2005 11/12
supports even though the beam was designed for redis-
tribution at the ULS to be in the opposite direction—a
sort of ‘reverse redistribution’ effect. As discussed ear-
lier, even beams designed for zero redistribution will
exhibit elastic redistribution from the spans to the sup-
ports at the SLS and thus must undergo plastic redis-
tribution to achieve the designed 0% at the ULS. This
‘reverse redistribution’ at the SLS could be considered undesirable since the beam is being forced to behave in
different ways at the SLS and the ULS. ‘Reverse redis-
tribution’ can be avoided, or at least reduced, by the
level of designed redistribution which is selected,
should this be considered desirable.
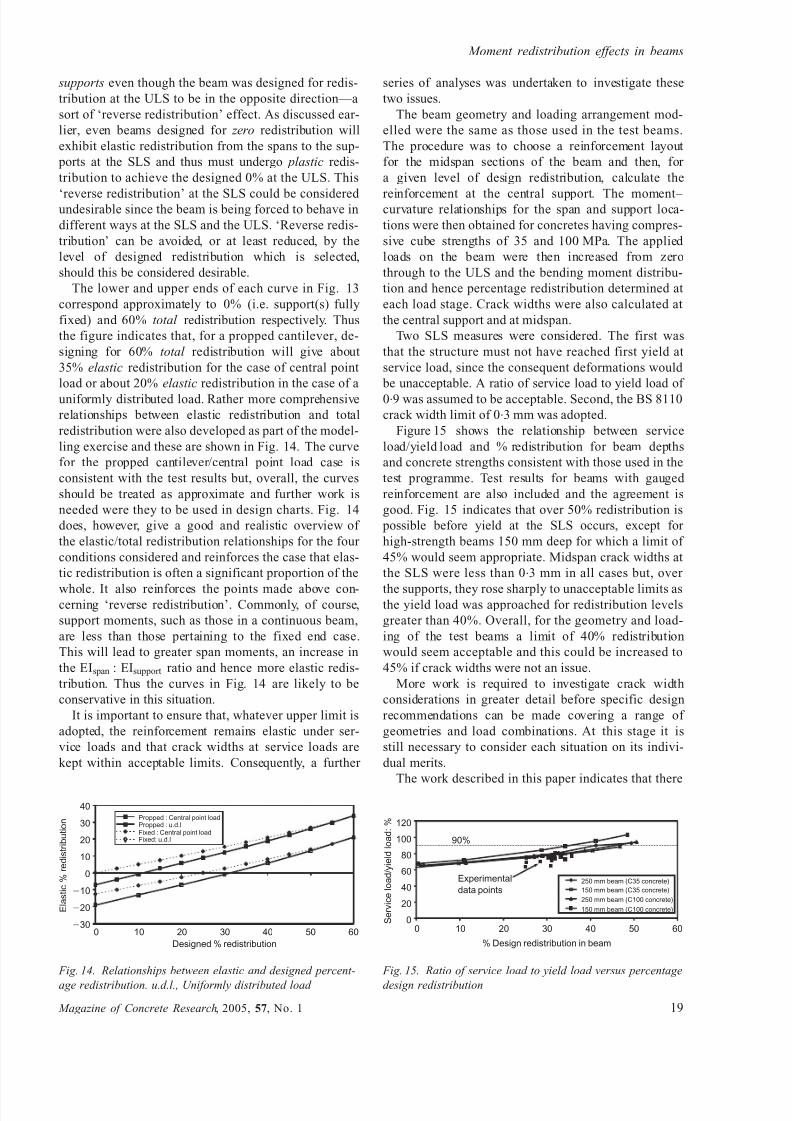
The lower and upper ends of each curve in Fig. 13
correspond approximately to 0% (i.e. support(s) fully
fixed) and 60% total redistribution respectively. Thus
the figure indicates that, for a propped cantilever, de-
signing for 60% total redistribution will give about
35% elastic redistribution for the case of central point
load or about 20% elastic redistribution in the case of a
uniformly distributed load. Rather more comprehensive
relationships between elastic redistribution and total
redistribution were also developed as part of the model-
ling exercise and these are shown in Fig. 14. The curve
for the propped cantilever/central point load case is
consistent with the test results but, overall, the curves
should be treated as approximate and further work is
needed were they to be used in design charts. Fig. 14
does, however, give a good and realistic overview of
the elastic/total redistribution relationships for the four
conditions considered and reinforces the case that elas-
tic redistribution is often a significant proportion of the
whole. It also reinforces the points made above con-cerning ‘reverse redistribution’. Commonly, of course,
support moments, such as those in a continuous beam,
are less than those pertaining to the fixed end case.
This will lead to greater span moments, an increase in
the EIspan : EIsupport ratio and hence more elastic redis-
tribution. Thus the curves in Fig. 14 are likely to be
conservative in this situation.
It is important to ensure that, whatever upper limit is
adopted, the reinforcement remains elastic under ser-
vice loads and that crack widths at service loads are
kept within acceptable limits. Consequently, a further
series of analyses was undertaken to investigate these
two issues.
The beam geometry and loading arrangement mod-
elled were the same as those used in the test beams.
The procedure was to choose a reinforcement layout
for the midspan sections of the beam and then, for
a given level of design redistribution, calculate the
reinforcement at the central support. The moment– curvature relationships for the span and support loca-
tions were then obtained for concretes having compres-
sive cube strengths of 35 and 100 MPa. The applied
loads on the beam were then increased from zero
through to the ULS and the bending moment distribu-
tion and hence percentage redistribution determined at
each load stage. Crack widths were also calculated at
the central support and at midspan.
Two SLS measures were considered. The first was
that the structure must not have reached first yield at
service load, since the consequent deformations would
be unacceptable. A ratio of service load to yield load of
0.9 was assumed to be acceptable. Second, the BS 8110
crack width limit of 0.3 mm was adopted.
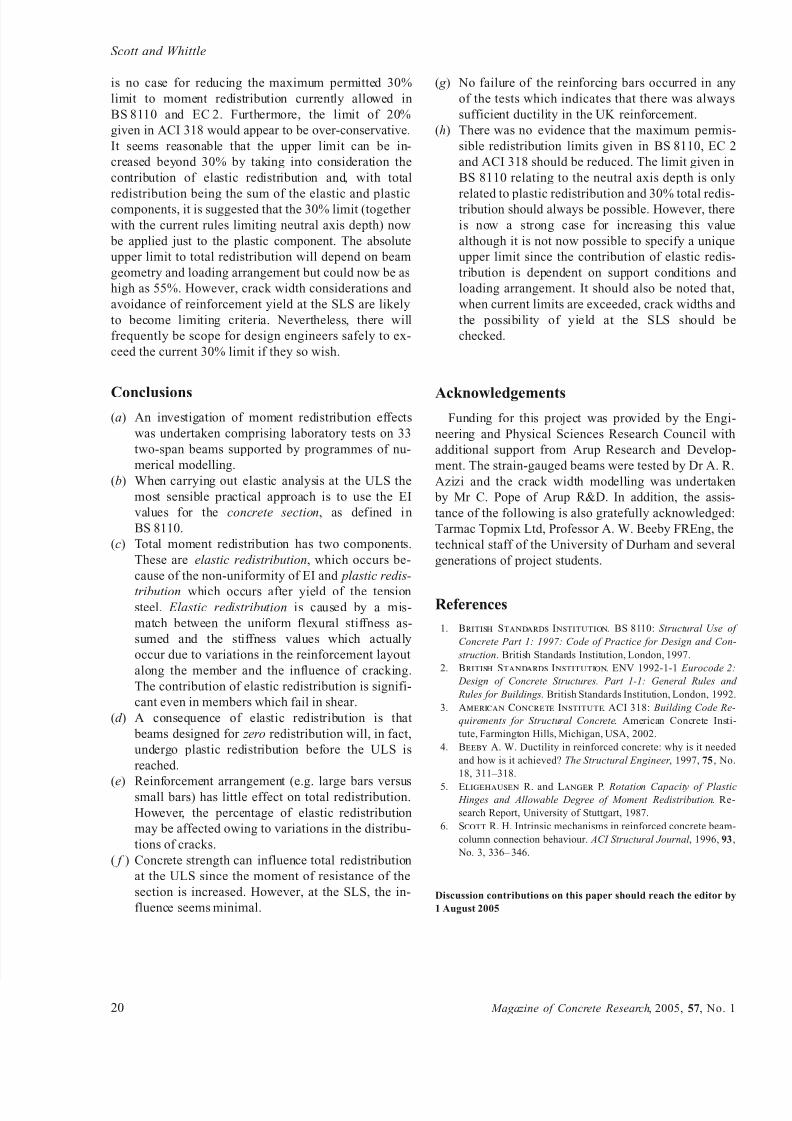
Figure 15 shows the relationship between service
load/yield load and % redistribution for beam depths
and concrete strengths consistent with those used in the
test programme. Test results for beams with gauged
reinforcement are also included and the agreement is
good. Fig. 15 indicates that over 50% redistribution is
possible before yield at the SLS occurs, except for
high-strength beams 150 mm deep for which a limit of
45% would seem appropriate. Midspan crack widths at
the SLS were less than 0.3 mm in all cases but, over
the supports, they rose sharply to unacceptable limits asthe yield load was approached for redistribution levels
greater than 40%. Overall, for the geometry and load-
ing of the test beams a limit of 40% redistribution
would seem acceptable and this could be increased to
45% if crack widths were not an issue.
More work is required to investigate crack width
considerations in greater detail before specific design
recommendations can be made covering a range of
geometries and load combinations. At this stage it is
still necessary to consider each situation on its indivi-
dual merits.
The work described in this paper indicates that there
Propped : Central point loadPropped : u.d.lFixed : Central point loadFixed: u.d.l
0 10 20 30 40 50 60
Designed % redistribution
40
30
20
10
0
10
20
30
E l a s t i c % r
e d i s t r i b u t i o n
Fig. 14. Relationships between elastic and designed percent-
age redistribution. u.d.l., Uniformly distributed load
250 mm beam (C35 concrete)
150 mm beam (C35 concrete)
250 mm beam (C100 concrete)
150 mm beam (C100 concrete)
Experimental
data points
90%
120
100
80
60
40
20
0 S e r v i c e l o a d / y i e l d l o a d : %
0 10 20 30 40 50 60
% Design redistribution in beam
Fig. 15. Ratio of service load to yield load versus percentage
design redistribution
Moment redistribution effects in beams
Magazine of Concrete Research, 2005, 57, No. 1 19
8/10/2019 Moment Redistribution in Beams_Mag Concrete Research-2005
http://slidepdf.com/reader/full/moment-redistribution-in-beamsmag-concrete-research-2005 12/12
is no case for reducing the maximum permitted 30%
limit to moment redistribution currently allowed in
BS 8110 and EC 2. Furthermore, the limit of 20%
given in ACI 318 would appear to be over-conservative.
It seems reasonable that the upper limit can be in-
creased beyond 30% by taking into consideration the
contribution of elastic redistribution and, with total
redistribution being the sum of the elastic and plasticcomponents, it is suggested that the 30% limit (together
with the current rules limiting neutral axis depth) now
be applied just to the plastic component. The absolute
upper limit to total redistribution will depend on beam
geometry and loading arrangement but could now be as
high as 55%. However, crack width considerations and
avoidance of reinforcement yield at the SLS are likely
to become limiting criteria. Nevertheless, there will
frequently be scope for design engineers safely to ex-
ceed the current 30% limit if they so wish.
Conclusions
(a) An investigation of moment redistribution effects
was undertaken comprising laboratory tests on 33
two-span beams supported by programmes of nu-
merical modelling.
(b) When carrying out elastic analysis at the ULS the
most sensible practical approach is to use the EI
values for the concrete section, as defined in
BS 8110.
(c) Total moment redistribution has two components.
These are elastic redistribution, which occurs be-
cause of the non-uniformity of EI and plastic redis-
tribution which occurs after yield of the tensionsteel. Elastic redistribution is caused by a mis-
match between the uniform flexural stiffness as-
sumed and the stiffness values which actually
occur due to variations in the reinforcement layout
along the member and the influence of cracking.
The contribution of elastic redistribution is signifi-
cant even in members which fail in shear.
(d ) A consequence of elastic redistribution is that
beams designed for zero redistribution will, in fact,
undergo plastic redistribution before the ULS is
reached.
(e) Reinforcement arrangement (e.g. large bars versussmall bars) has little effect on total redistribution.
However, the percentage of elastic redistribution
may be affected owing to variations in the distribu-
tions of cracks.
( f ) Concrete strength can influence total redistribution
at the ULS since the moment of resistance of the
section is increased. However, at the SLS, the in-
fluence seems minimal.
( g ) No failure of the reinforcing bars occurred in any
of the tests which indicates that there was always
sufficient ductility in the UK reinforcement.
(h) There was no evidence that the maximum permis-
sible redistribution limits given in BS 8110, EC 2
and ACI 318 should be reduced. The limit given in
BS 8110 relating to the neutral axis depth is only
related to plastic redistribution and 30% total redis-tribution should always be possible. However, there
is now a strong case for increasing this value
although it is not now possible to specify a unique
upper limit since the contribution of elastic redis-
tribution is dependent on support conditions and
loading arrangement. It should also be noted that,
when current limits are exceeded, crack widths and
the possibility of yield at the SLS should be
checked.
Acknowledgements
Funding for this project was provided by the Engi-
neering and Physical Sciences Research Council with
additional support from Arup Research and Develop-
ment. The strain-gauged beams were tested by Dr A. R.
Azizi and the crack width modelling was undertaken
by Mr C. Pope of Arup R&D. In addition, the assis-
tance of the following is also gratefully acknowledged:
Tarmac Topmix Ltd, Professor A. W. Beeby FREng, the
technical staff of the University of Durham and several
generations of project students.
References
1. British Standards Institution. BS 8110: Structural Use of
Concrete Part 1: 1997: Code of Practice for Design and Con-
struction. British Standards Institution, London, 1997.
2. British Standards Institution. ENV 1992-1-1 Eurocode 2:
Design of Concrete Structures. Part 1-1: General Rules and
Rules for Buildings. British Standards Institution, London, 1992.
3. American Concrete Institute. ACI 318: Building Code Re-
quirements for Structural Concrete. American Concrete Insti-
tute, Farmington Hills, Michigan, USA, 2002.
4. Beeby A. W. Ductility in reinforced concrete: why is it needed
and how is it achieved? The Structural Engineer , 1997, 75 , No.
18, 311–318.
5. Eligehausen R. and Langer P. Rotation Capacity of Plastic Hinges and Allowable Degree of Moment Redistribution. Re-
search Report, University of Stuttgart, 1987.
6. Scott R. H. Intrinsic mechanisms in reinforced concrete beam-
column connection behaviour. ACI Structural Journal , 1996, 93,
No. 3, 336– 346.
Discussion contributions on this paper should reach the editor by
1 August 2005
Scott and Whittle
20 Magazine of Concrete Research, 2005, 57, No. 1