monitoring prepare and monitor anaesthesia in animals monitoring
TRANSCRIPT

MONITORING
Prepare and monitor anaesthesia in animals
MONITORING
MONITORING

MONITORING
General GA monitoring rules
• Monitoring continuous
• Recording every 5 mins
• The anaesthetist’s overall judgement is more important than any one parameter reading

MONITORING
Vital Signs for Anaesthesia
• CNS vitals– Consciousness– Reflexes– Responses– Muscle tone
• Other vitals– Cardiovascular – Respiratory– Urinary
Depth of anaesthesiaSee Stages of Anaesthesia

MONITORING
Another classification
• Signs continually present
• Signs evoked by a stimulus– Responses– Reflexes
MONITORING
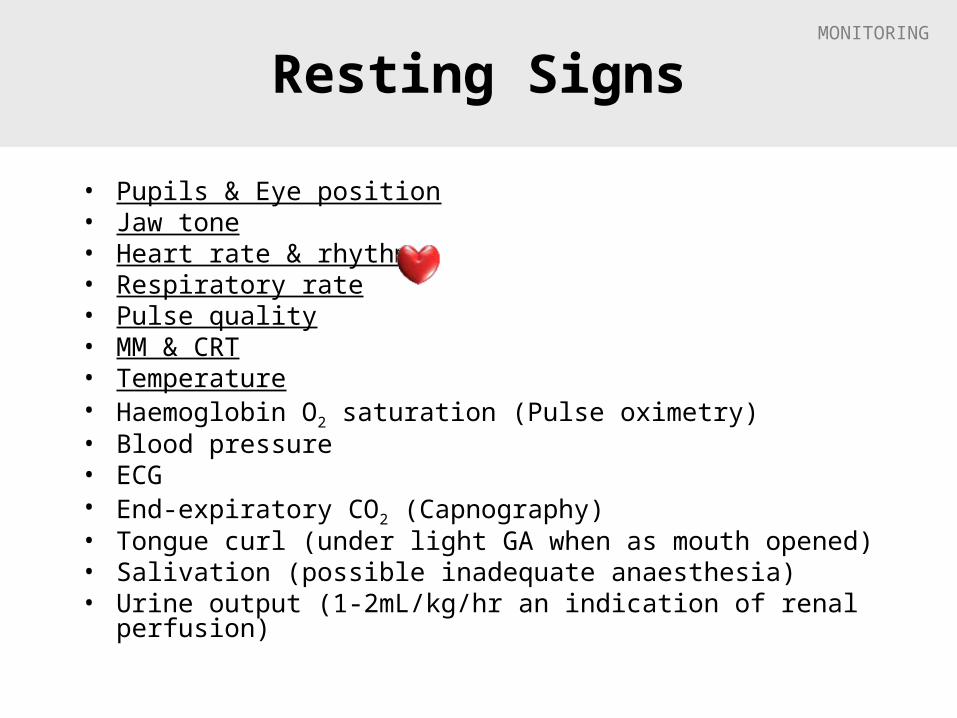
Resting Signs
• Pupils & Eye position• Jaw tone• Heart rate & rhythm• Respiratory rate• Pulse quality• MM & CRT• Temperature• Haemoglobin O2 saturation (Pulse oximetry)• Blood pressure• ECG• End-expiratory CO2 (Capnography)• Tongue curl (under light GA when as mouth opened)• Salivation (possible inadequate anaesthesia)• Urine output (1-2mL/kg/hr an indication of renal perfusion)

MONITORING
Other Signs tested for
• Palpebral reflex• Ear twitch (not a good guide to depth in cats)• Reaction to painful stimulus• Skin pricking• Corneal reflex• Pedal reflex• Anal pinching• PLR• Response to visceral stimulus• Cutaneous reflex• Righting reflex• Pharyngeal reflex• Laryngeal reflex

MONITORING
Surgical ‘stress map’ (timeline)

MONITORING
How often to monitor?
• Ideally check & record vitals every 5 minutes
5 mins5 mins

MONITORING
Monitoring forme.g. ‘AAS’ FORM

MONITORING
MONITORING
Class activity 1
• List 8 signs that can be monitored when a patient is under GA?
MONITORING
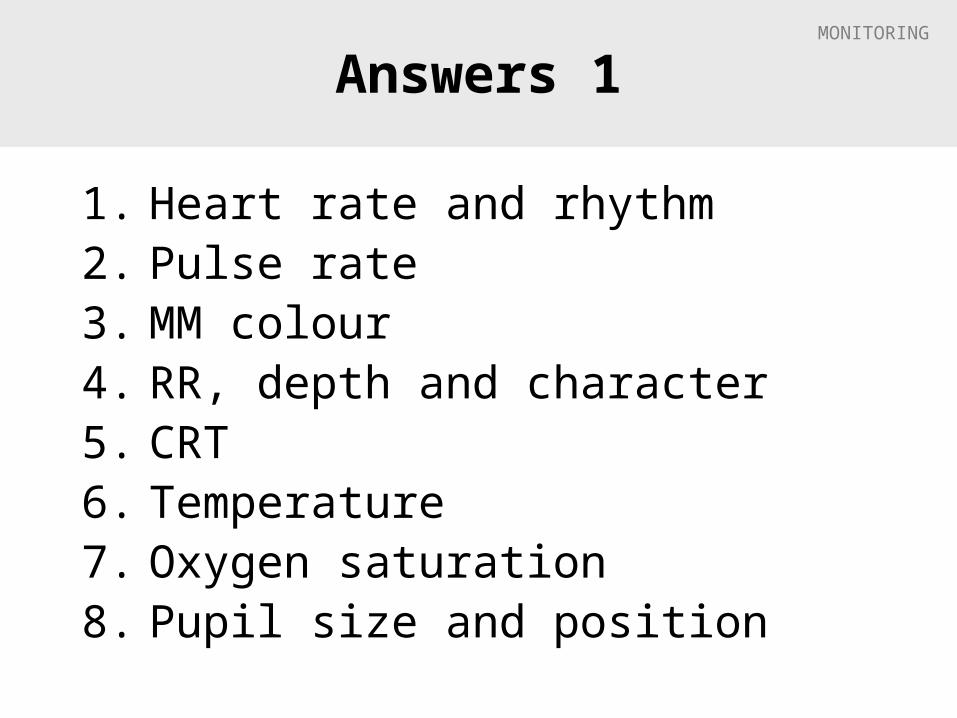
Answers 1
1. Heart rate and rhythm2. Pulse rate3. MM colour4. RR, depth and character5. CRT6. Temperature7. Oxygen saturation8. Pupil size and position

MONITORING
Monitoring depth
• See anaesthesia stages

MONITORING
Anaesthetised Dog & Cat
Dog Cat
HR 80-140 110-140
RR 10-30 20-40
C 38 38
CRT < 2 sec < 2 sec
SpO2 > 95% > 95%
BP (diast) 60-100 mmHg 60-100 mmHg
BP (syst) 110-160 mmHg 110-160 mmHg

MONITORING
Class Activity 2
• List reflexes that can be monitored when a patient is under G/A
MONITORING
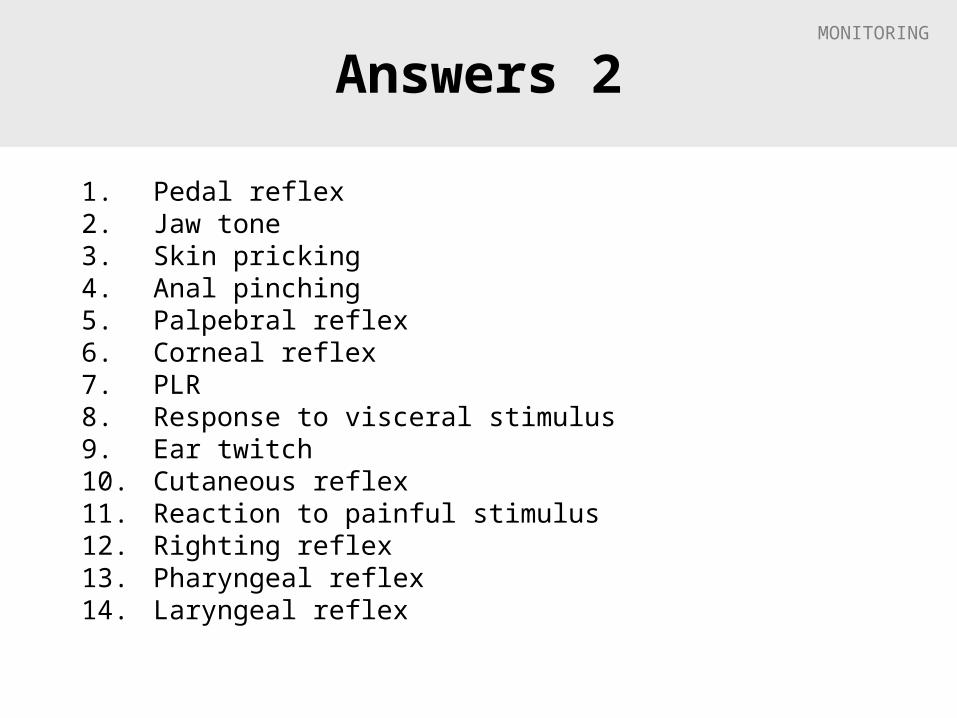
Answers 2
1. Pedal reflex2. Jaw tone3. Skin pricking4. Anal pinching5. Palpebral reflex6. Corneal reflex7. PLR8. Response to visceral stimulus9. Ear twitch10. Cutaneous reflex11. Reaction to painful stimulus12. Righting reflex13. Pharyngeal reflex14. Laryngeal reflex

MONITORING
Class activity 3
• What are some types of monitoring devices?
MONITORING
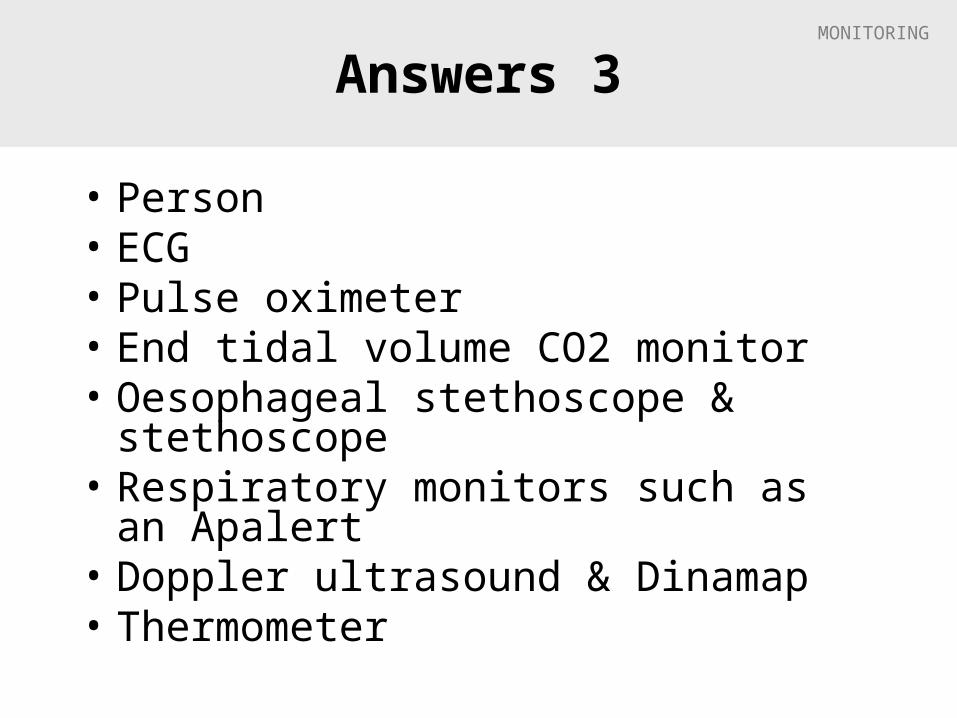
Answers 3
• Person• ECG• Pulse oximeter• End tidal volume CO2 monitor• Oesophageal stethoscope &
stethoscope• Respiratory monitors such as an Apalert• Doppler ultrasound & Dinamap• Thermometer
MONITORING
Heart Rate
• Normal– Dog 80-120
• Report HR <80 to vet
– Cat 100-180
MONITORING
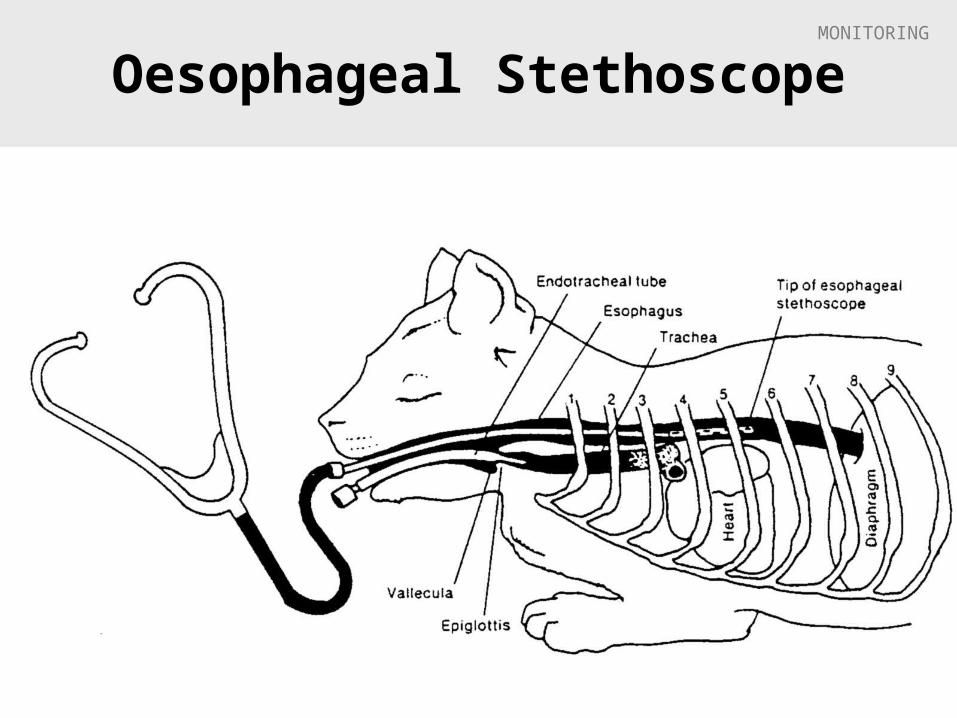
Oesophageal Stethoscope

MONITORING
Pulse rate & quality
• Pulse strength & rate more useful information than HR
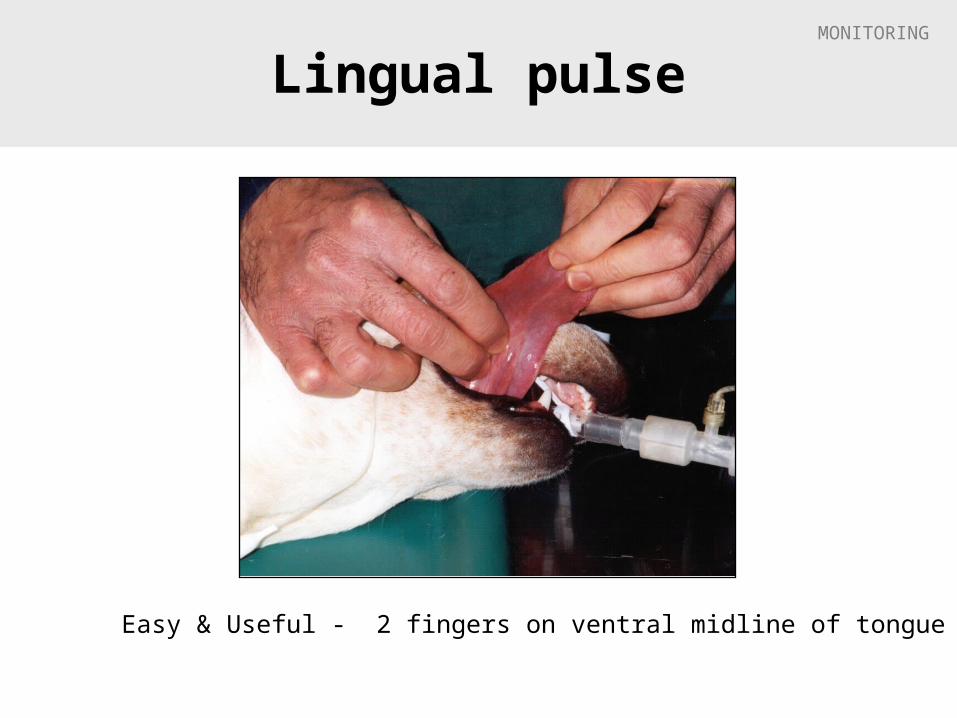
• Measure– Lingual (under tongue, midline)– Femoral– Carotid– Pedal (dorsal)
MONITORING
Lingual pulse
Easy & Useful - 2 fingers on ventral midline of tongue
MONITORING
Pulse rate & quality
• Pulse beat should be felt just after each heart beat– Measure both HR & PR at same time– If not synchronised you have a ‘pulse deficit’
• Strength of pulse gives a rough estimate of blood pressure

MONITORING
Oesophageal Stethoscope
• Tube attached to a regular stethoscope
• Permits auscultation of heart & lungs of draped patient
• Intubate patient
• Lubricate tubing (e.g. K-Y® gel)
• Advance until heartbeat detected
MONITORING
MM & CRT
• Best to assess gingival MM colour– Pallor
• Pain, haemorrhage, hypothermia, shock
– Bluish-purple = cyanosis• Indicates hypoxia / hypoxaemia• Usually caused respiratory failure / airway
obstruction
• CRT– Useful but not reliable
• Can have a good CRT in a euthanased animal!

MONITORING
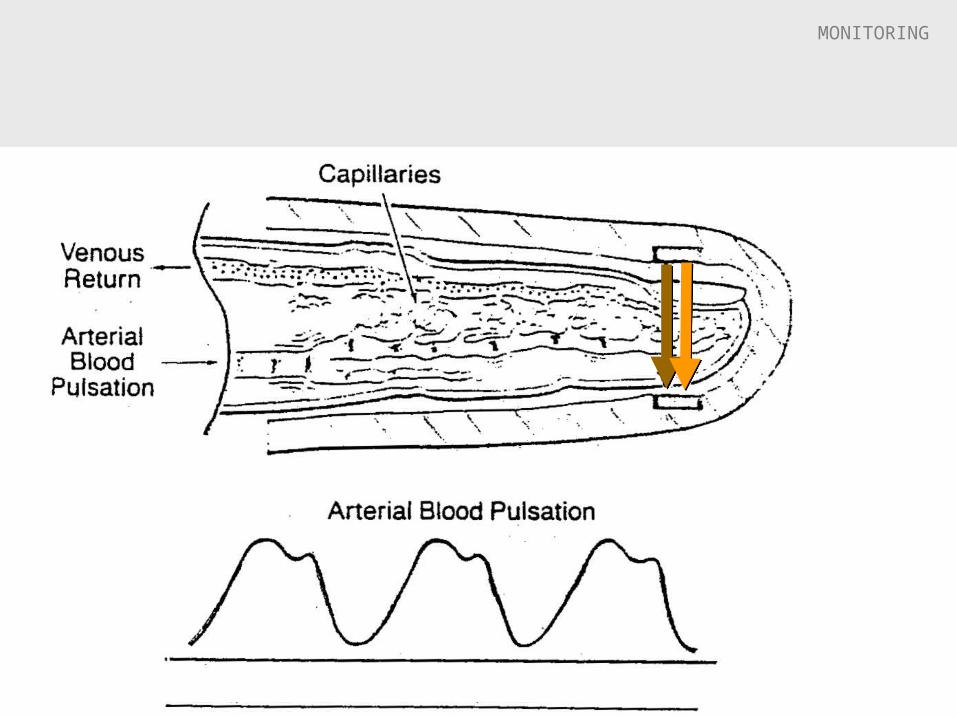
Pulse oximetry

MONITORING
Pulse Oximeters
• How they work– Measure the absorption of infrared
light by haemoglobin in a peripheral tissue bed.
– The light absorption characteristics of haemoglobin vary with SpO2
– Measure the difference in 2 wavelengths (red & blue) of arterial pulsating blood and the fixed signals from skin, tissue and venous blood

MONITORING

MONITORING
MONITORING
MONITORING
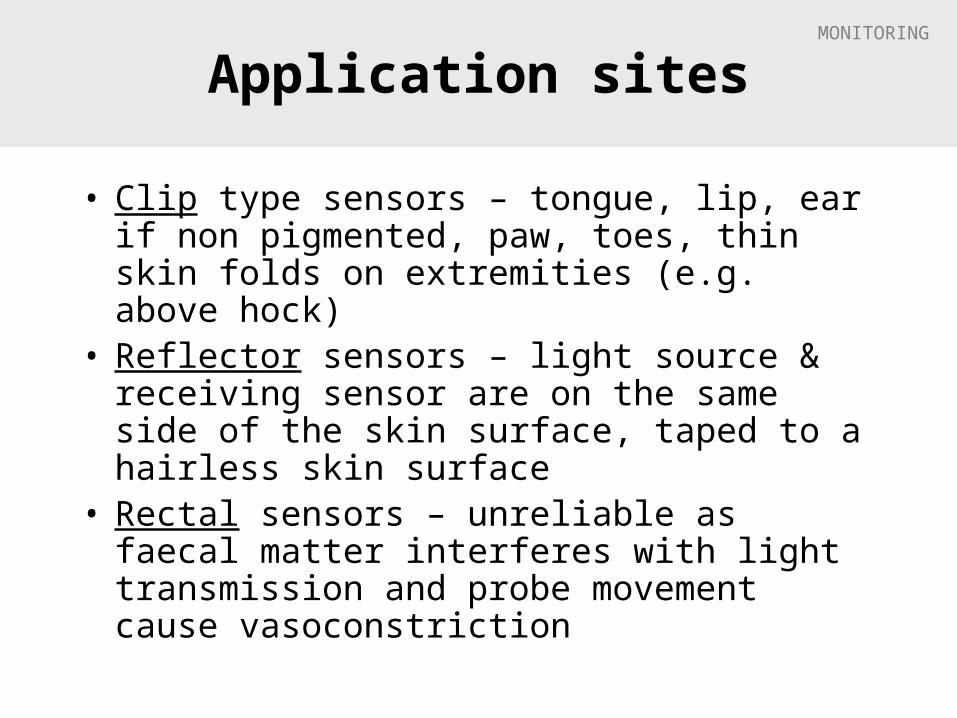
Application sites
• Clip type sensors – tongue, lip, ear if non pigmented, paw, toes, thin skin folds on extremities (e.g. above hock)
• Reflector sensors – light source & receiving sensor are on the same side of the skin surface, taped to a hairless skin surface
• Rectal sensors – unreliable as faecal matter interferes with light transmission and probe movement cause vasoconstriction
MONITORING
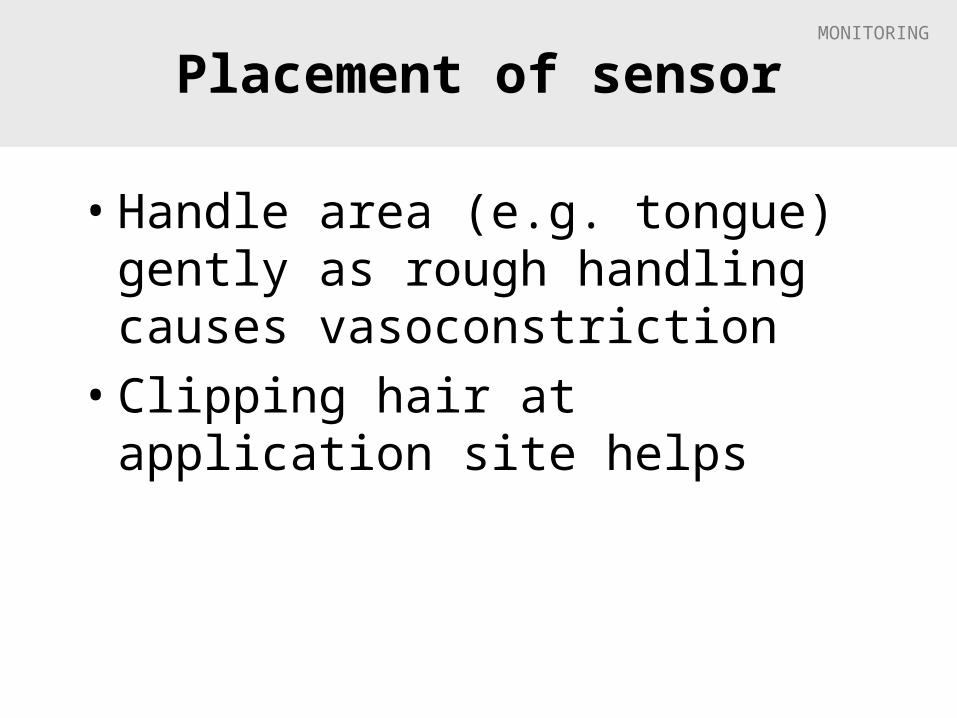
Placement of sensor
• Handle area (e.g. tongue) gently as rough handling causes vasoconstriction
• Clipping hair at application site helps
MONITORING
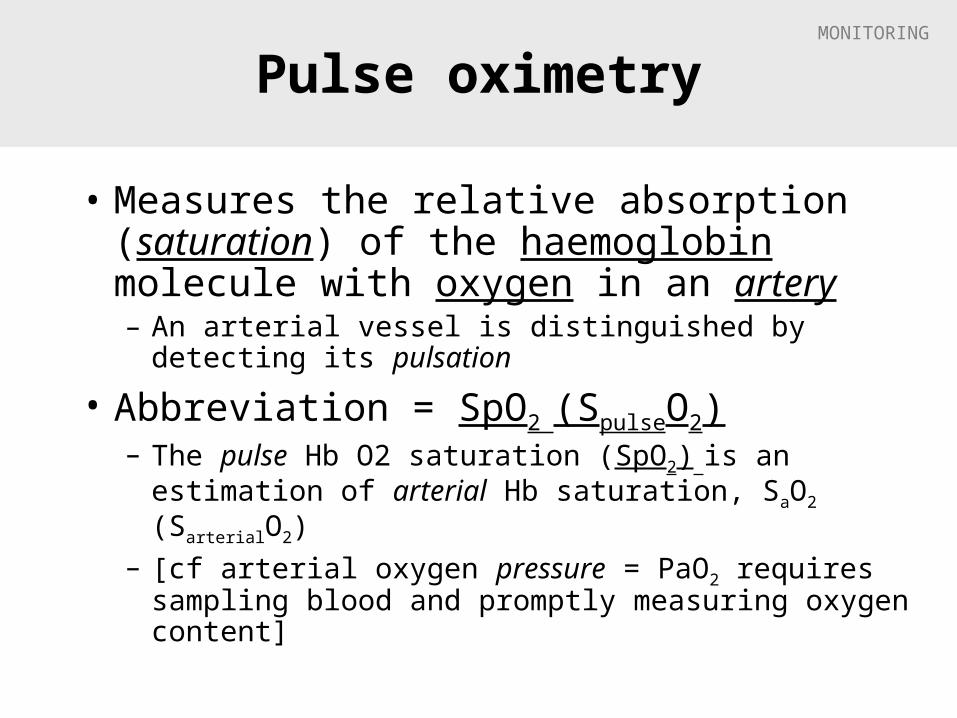
Pulse oximetry
• Measures the relative absorption (saturation) of the haemoglobin molecule with oxygen in an artery– An arterial vessel is distinguished by detecting its
pulsation
• Abbreviation = SpO2 (SpulseO2)– The pulse Hb O2 saturation (SpO2) is an estimation
of arterial Hb saturation, SaO2 (SarterialO2) – [cf arterial oxygen pressure = PaO2 requires
sampling blood and promptly measuring oxygen content]

MONITORING
Haemoglobin with 4 O2
Fe
Fe
Fe
Fe
globin
heme
heme
heme
heme
O2
O2
O2
O2

MONITORING
Haemoglobin with 3 O2
Fe
Fe
Fe
Fe
globin
heme
heme
heme
heme
O2
O2
O2
MONITORING
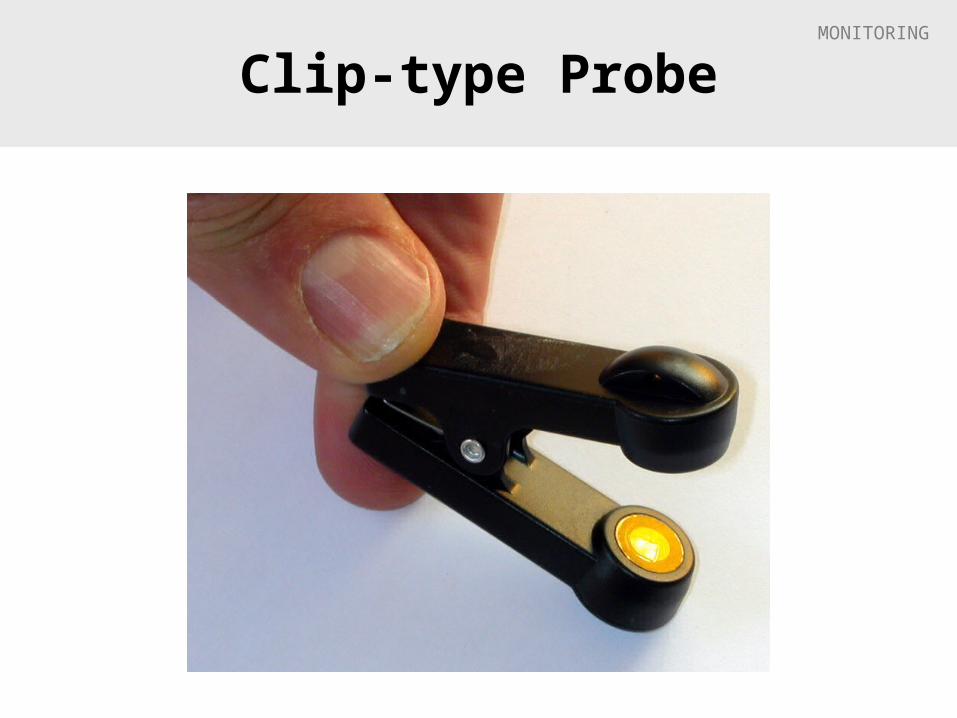
Clip-type Probe

MONITORING
Probe
Clip-type Probe
MONITORING
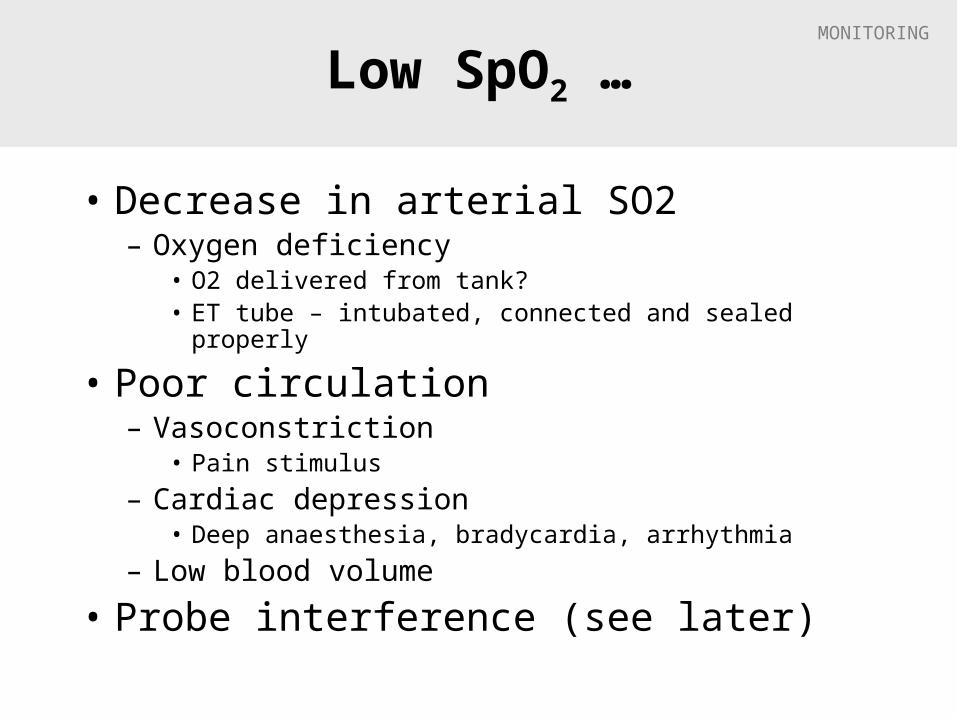
Low SpO2 …
• Decrease in arterial SO2– Oxygen deficiency
• O2 delivered from tank?• ET tube – intubated, connected and sealed properly
• Poor circulation– Vasoconstriction
• Pain stimulus
– Cardiac depression• Deep anaesthesia, bradycardia, arrhythmia
– Low blood volume
• Probe interference (see later)
MONITORING
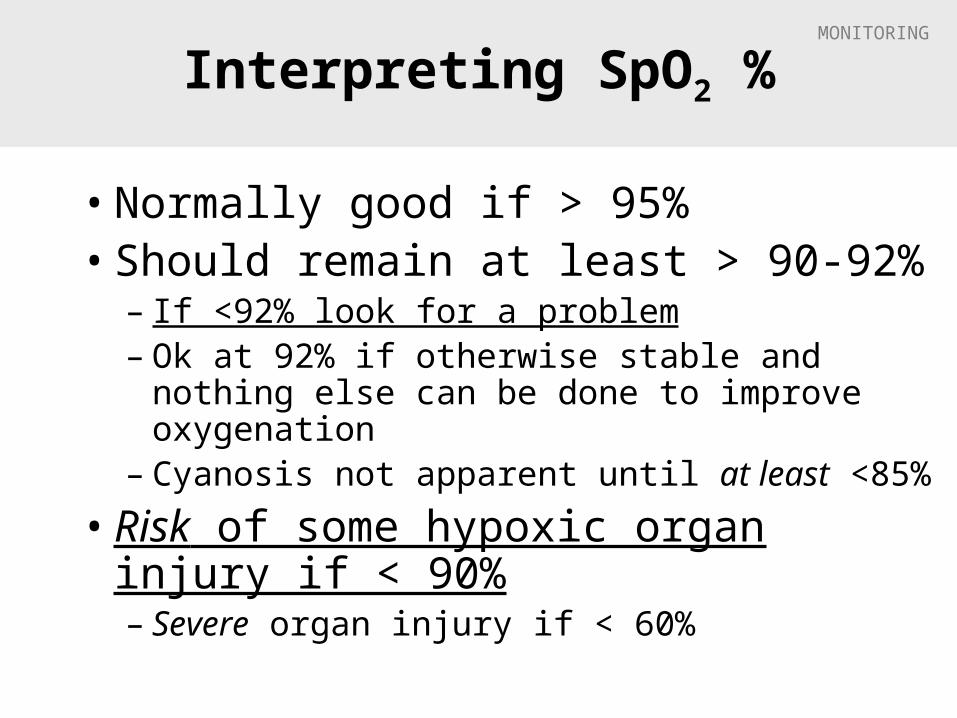
Interpreting SpO2 %
• Normally good if > 95%• Should remain at least > 90-92%
– If <92% look for a problem– Ok at 92% if otherwise stable and nothing else
can be done to improve oxygenation– Cyanosis not apparent until at least <85%
• Risk of some hypoxic organ injury if < 90%– Severe organ injury if < 60%

MONITORING
Probe interference
• Tight clips– Tissue compressed by clips (>no blood)– May need to move periodically, especially in small
animals like cats
• Patient movement• Hair• Tissue pigment• Dry tongue
– Add moisture
MONITORING
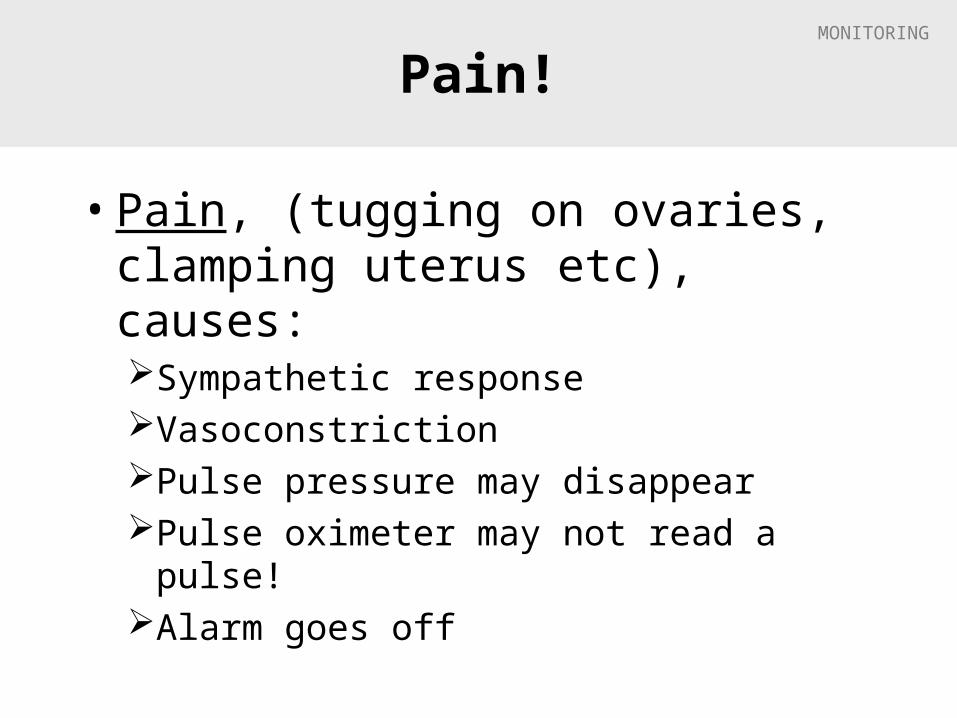
Pain!
• Pain, (tugging on ovaries, clamping uterus etc), causes: Sympathetic responseVasoconstrictionPulse pressure may disappearPulse oximeter may not read a pulse!Alarm goes off

MONITORING
Normal SpO2 …
• Does not mean that blood CO2 is also normal
• Animals regulate their breathing rate mainly according to CO2, not O2
– Why is this so?
MONITORING
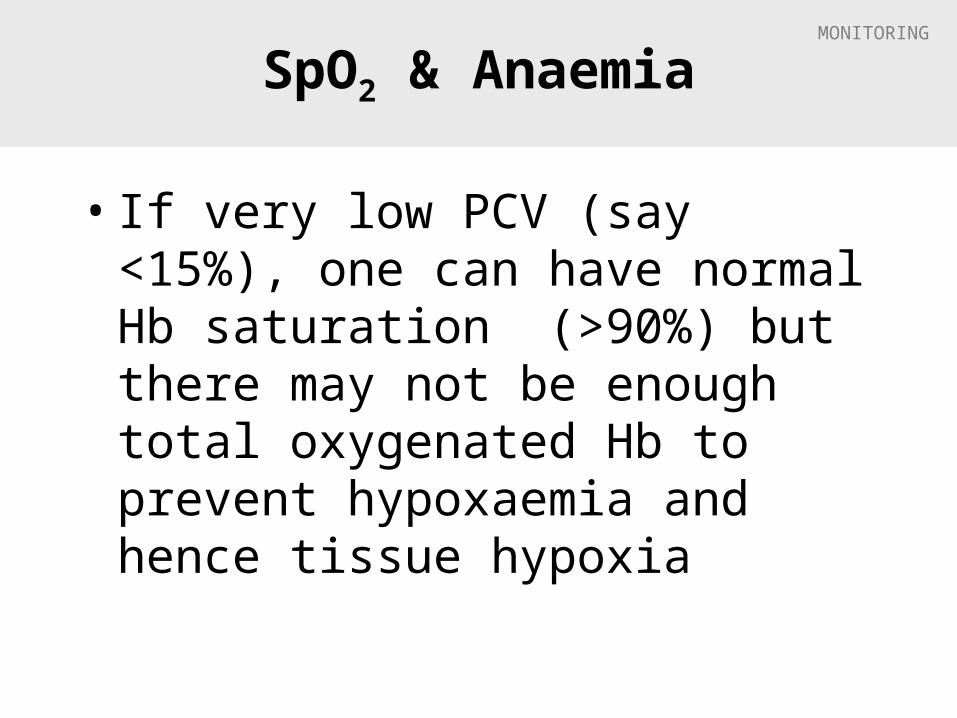
SpO2 & Anaemia
• If very low PCV (say <15%), one can have normal Hb saturation (>90%) but there may not be enough total oxygenated Hb to prevent hypoxaemia and hence tissue hypoxia
MONITORING
Hypoxaemia defined…
• True arterial oxygen saturation (SaO2) < 90% or PCV < 15 %

MONITORING
When is SpO2 too low?
SpO2 Interpretation
95 % Normal
92 % Start looking for a reason
90 % Hypoxaemia present
Try to improve oxygenation
85 % Moderate to severe hypoxaemiaLowest acceptable 85(dogs),87(cats)
80 % Life-threatening hypoxaemia

MONITORING
Blood gases
• Oxygen– Blood sample measuring total O2 in blood
plasma (Normal 85 – 105 mm Hg )• Arterial Oxygen Pressure = PaO2
– Is different from measuring O2 in haemoglobin
– Needs rapid processing– Equipment expensive
• Carbon dioxide

MONITORING
Blood Pressure
• Arterial blood pressure– Systolic
• Heart contraction phase
– Diastolic• Heart relaxation phase
– Mean arterial• A calculated value
= 1/3 systolic pressure + 2/3 diastolic pressure
• Venous blood pressure– Central (Right atrial ~ Deep jugular pressure)– Peripheral
MONITORING
Blood Pressure Units
• Measured by weight of column of fluid– High pressure use heavy liquids like
mercury (Hg)– Low pressure use lighter liquids like water
(H2O)

MONITORING
Normal Blood Pressures
• Systolic (dog & cat)– 100mm Hg
• Diastolic– 80mm Hg
• Problems with organ function if <90/60 for any length of time
i.e. 100/80
MONITORING
Blood Pressure Devices
• Using an occlusive pneumatic cuff– Generally around any accessible artery
• e.g. distal to elbow/hock or on base of tail
– Cuff width should be 40% of circumference
• Types – Doppler ultrasonic device such as the Parks Doppler
• Detects arterial blood flow• Pulse rate• Systolic arterial pressure
– Oscillometric devices –such as the Dinamap• Estimates HR, systolic, diastolic & mean pressures• Very accurate if used in large/medium dogs• Pressure detected by the cuff bladder

MONITORING
Doppler Blood Pressure

MONITORING

MONITORING
Parks Doppler directions
1. Apply cuff so that the portion containing the occlusive bladder is over the artery to be occluded
2. Apply the Doppler transducer crystal over the artery but distal to the cuff & tape it snugly to the appendage
MONITORING
Parks Doppler directions
1. Orientate the crystals so that they are perpendicular to the artery ( the artery must cross both the transmitting and receiving crystals)
2. Turn on the unit and listen for pulsatile blood flow
3. If the sound is not audible reposition the crystal
MONITORING
Parks Doppler directions
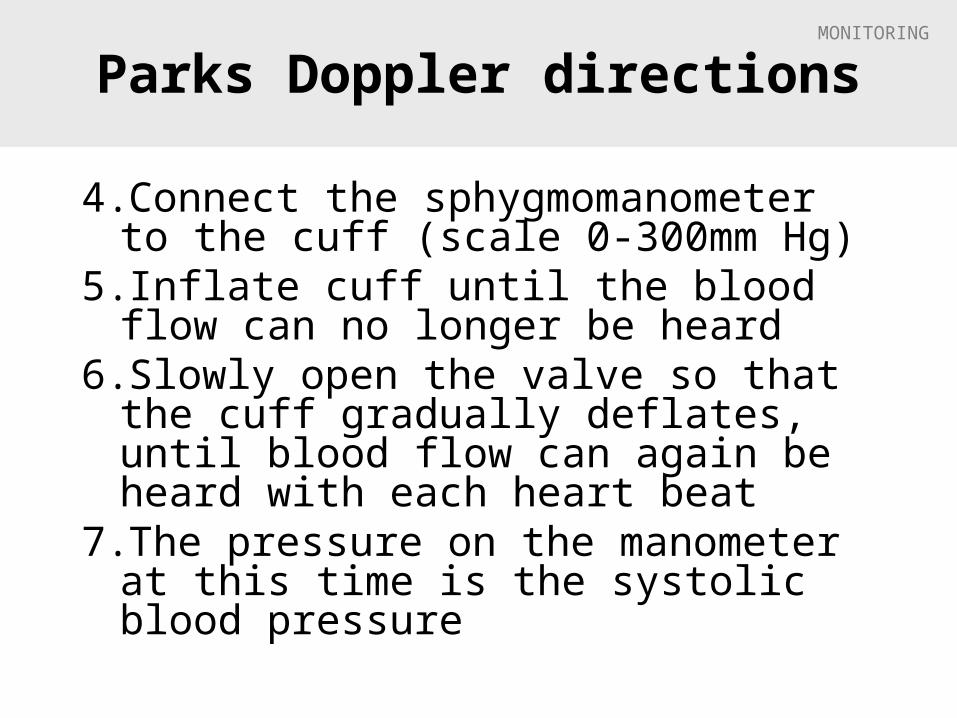
4.Connect the sphygmomanometer to the cuff (scale 0-300mm Hg)
5. Inflate cuff until the blood flow can no longer be heard
6.Slowly open the valve so that the cuff gradually deflates, until blood flow can again be heard with each heart beat
7.The pressure on the manometer at this time is the systolic blood pressure

MONITORING
Parks Doppler
8. Be sure to deflate the cuff so that no pressure remains in it between readings
9. If the cuff remains pressurised it will restrict blood flow to the limb causing catecholamine release and cardiovascular stimulation
10. In cats the Doppler tends to underestimate the systolic blood pressure therefore add 15 mm Hg to the reading
MONITORING
Ventilation Monitors
• Respiratory Rate– Apalert©
• Expired CO2
– Capnograph
• Minute Respiratory Volume– Wrights Respirometer
MONITORING
Monitoring Ventilation
• Movement of thorax
• Movement of rebreathing bag
• Auscultation (e.g. oesoph. stethoscope)
• Condensation within ET tube
• Movement hair/fluff at open end of ET tube
• Respiration/apnoea monitors
MONITORING
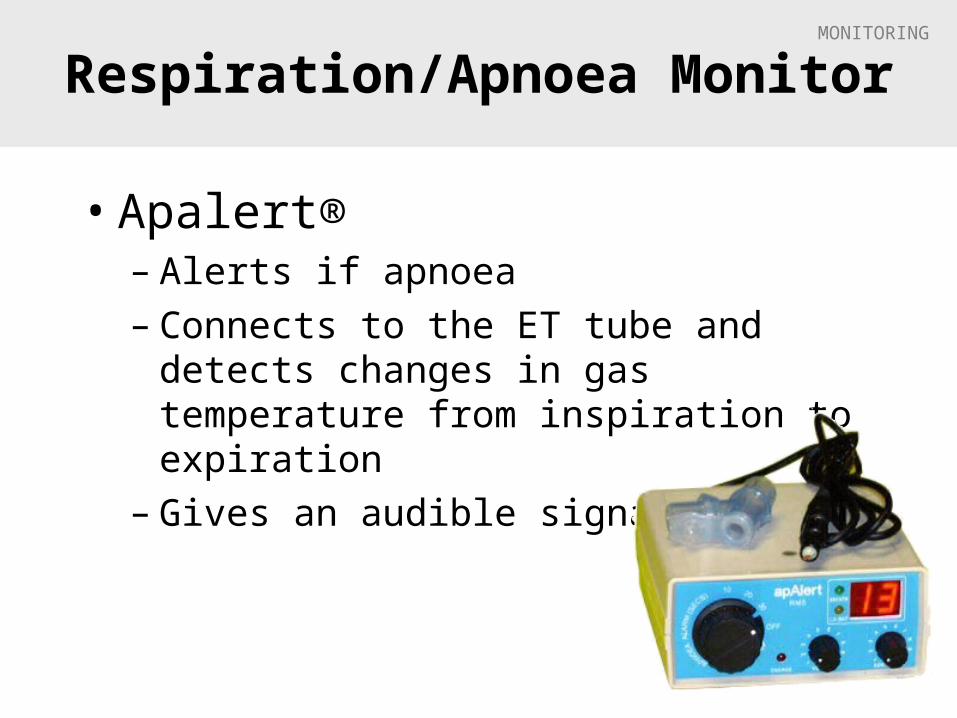
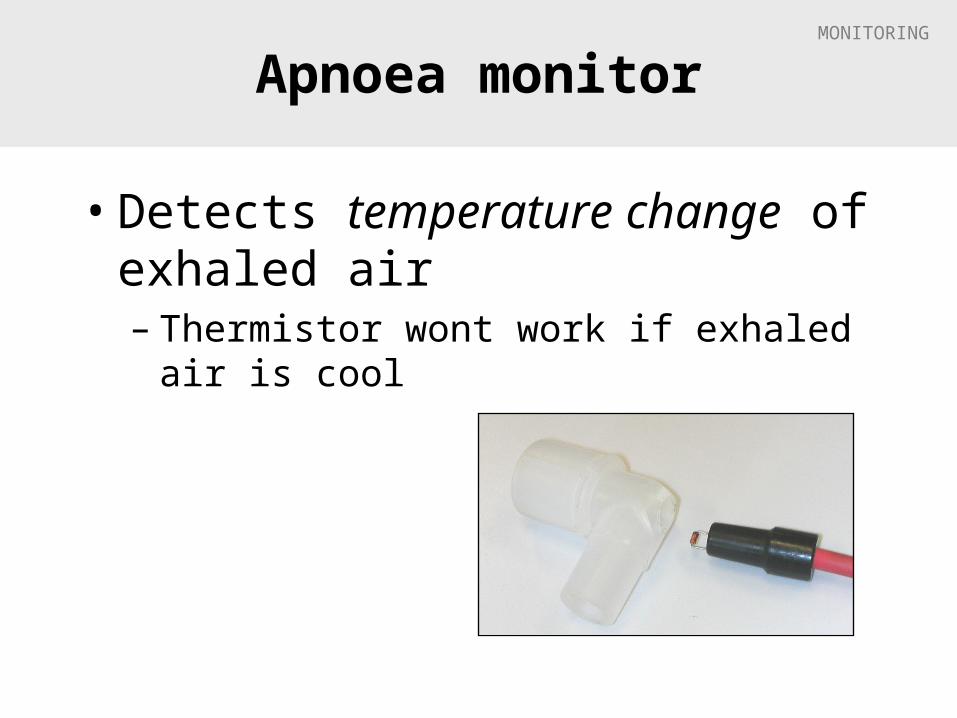
Respiration/Apnoea Monitor
• Apalert®– Alerts if apnoea– Connects to the ET tube and detects
changes in gas temperature from inspiration to expiration
– Gives an audible signal
MONITORING
Apnoea monitor
• Detects temperature change of exhaled air– Thermistor wont work if exhaled air is cool

MONITORING
Respiratory Rates
• To measure RR– Chest rises– Rebreathing bag movements– Apnoea monitor
• Normal: 10-20 breaths/min– If <8 breaths/min look for a problem
• Inform vet
– May need to bag patient to maintain at least 8-12 breaths/min
MONITORING
Normal respiration cycle
• Inspiration 1-1½ sec
• Expiration 2-3 sec
MONITORING
Hyperventilation under GA
• Stimulated by either– Pain of Surgery
• Usually only temporary• Usually self-limiting because patient draws in
more anaesthetic gas
– High CO2, possibly caused by• Poor ventilation• Exhausted soda lime
– Lightening anaesthesia

MONITORING
Apneustic respiration
• Prolonged pauses after inspiration, followed by expiration– Seen with dissociative anaesthetics (like
Ketamine)
MONITORING
Other respiration problems
• Increased effort in inspiration– Upper airway obstruction
• Increased effort in expiration– Lung problem
• Abnormal noises– Whistles– Squeaks– Crackles

MONITORING
Respiratory sighs
• With increasing GA some air sacs may not receive enough air to remain inflated– collapse of air sacs (alveoli) = atelectasis
• Can reinflate these air sacs by gently bagging patient every 5 mins or so– Close pop-off– Squeeze bag gently so chest wall rises slightly– Re-open pop-off valve

MONITORING
Capnography
• Monitoring pulmonary ventilation • Pulmonary ventilation (minute ventilation) =
Respiratory Rate (f) x Tidal Volume (VT)• Normal respiratory rate (f)
– 10 – 20 breaths / min
• Normal tidal volume (VT) – 10 – 20 mL / kg
• Normal minute ventilation – 200 mL / kg / min
• Capnometry – measuring CO2 concentration in a gas mixture
• Capnography– graphical display of changes in CO2 concentration over time
MONITORING
Principles
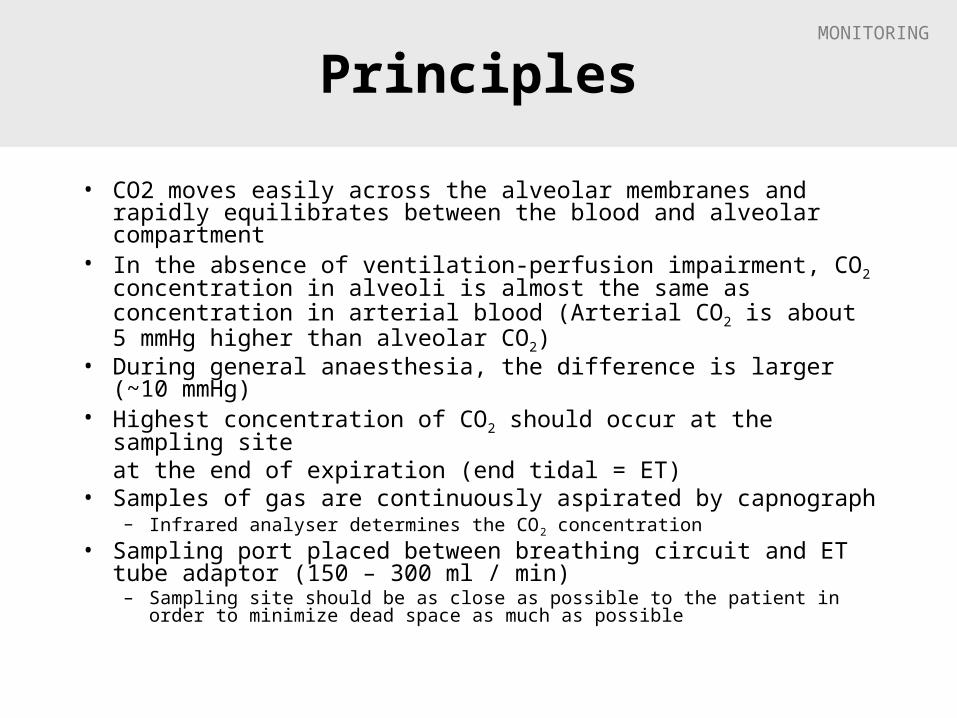
• CO2 moves easily across the alveolar membranes and rapidly equilibrates between the blood and alveolar compartment
• In the absence of ventilation-perfusion impairment, CO2 concentration in alveoli is almost the same as concentration in arterial blood (Arterial CO2 is about 5 mmHg higher than alveolar CO2)
• During general anaesthesia, the difference is larger (~10 mmHg)
• Highest concentration of CO2 should occur at the sampling site at the end of expiration (end tidal = ET)
• Samples of gas are continuously aspirated by capnograph – Infrared analyser determines the CO2 concentration
• Sampling port placed between breathing circuit and ET tube adaptor (150 – 300 ml / min)
– Sampling site should be as close as possible to the patient in order to minimize dead space as much as possible
MONITORING
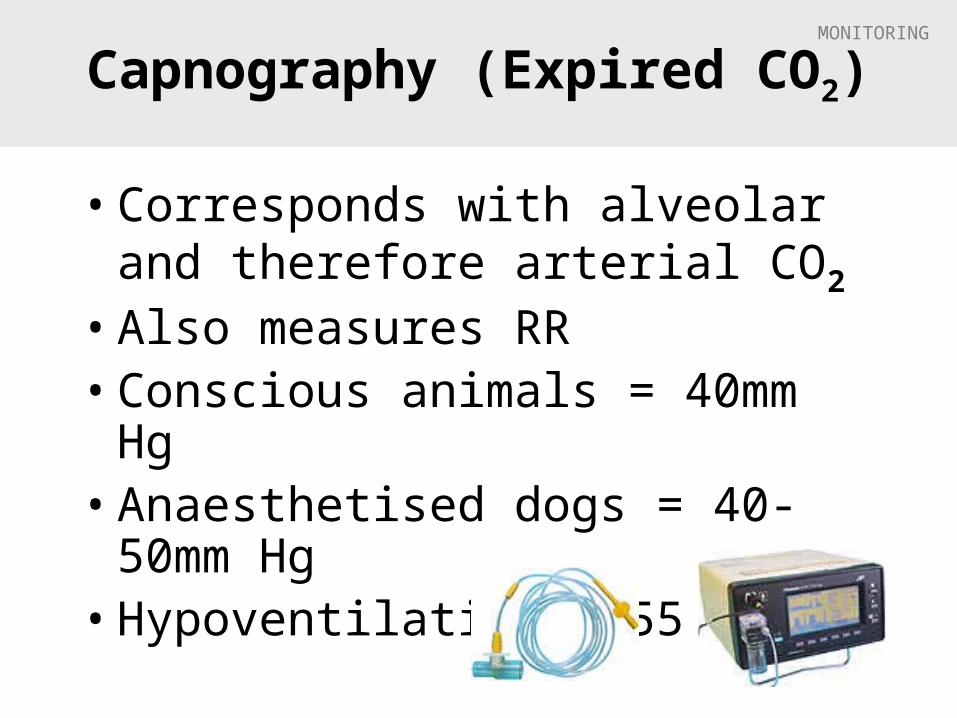
Capnography (Expired CO2)
• Corresponds with alveolar and therefore arterial CO2
• Also measures RR• Conscious animals = 40mm Hg• Anaesthetised dogs = 40-50mm Hg• Hypoventilation > 55 mm Hg

MONITORING
Capnography

MONITORING
Using capnography
• Sampling– Should be done from a site as close as possible to minimize dead space– Sample adaptor is most commonly placed between the ET tube adapter and
breathing circuit– Non-rebreathing circuit with high fresh gas flow
• Dilutes ETCO2 • Sampling via a hypodermic needle inserted through and into the lumen of ET
tube will provide more reliable readings
• Maintenance– After use
• Allow to run for a while so that the tubing can dry out• Clean and dry water traps
• Sampling gases is continuous and also contains anaesthetic gases
– Gases can be routed back into the breathing circuit in order to minimize environmental pollution and loss of gases from breathing circuit
MONITORING
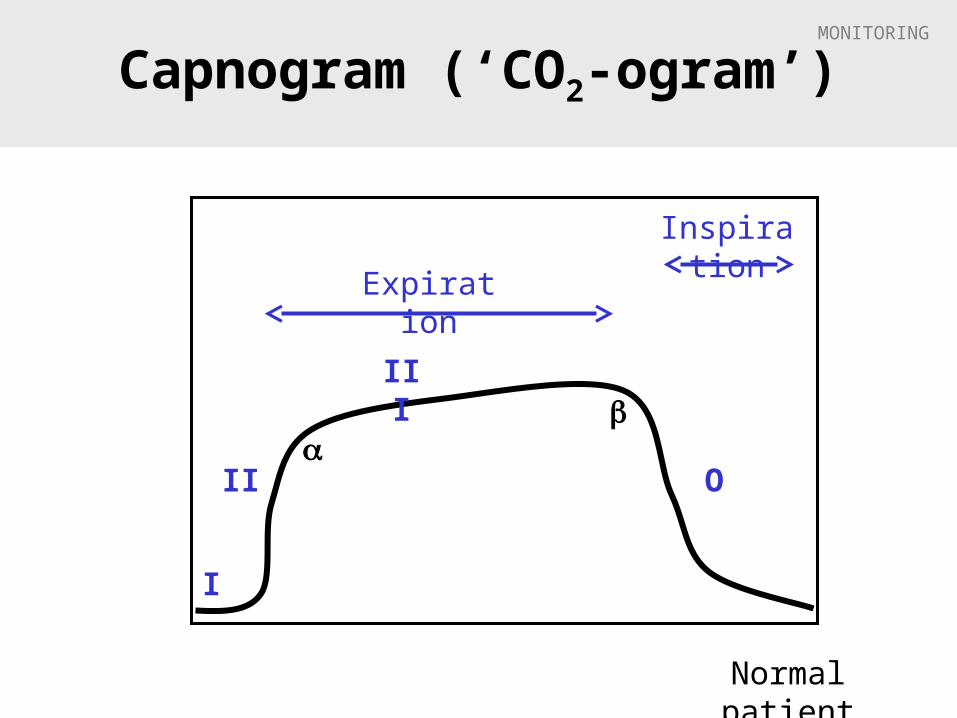
Capnogram (‘CO2-ogram’)
Normal patient
Expiration
Inspiration
II
I
III
O

MONITORING
Capnogram
• I = Inspiratory baseline– Fresh gas containing no CO2 passing through analyse
• II = Expiratory upstroke– Begin of exhalation– Dead space elimination from respiratory tract– CO2 concentration is increasing as alveolar air is reaching
analyse
• III = Expiratory plateau– Exhalation of pure alveolar gas
• O = Inspiratory downstroke– Start of inhalation– Fresh gas “washing away” CO2 of gases from previous
exhalation
Expiration Inspiration
II
I
III
O
MONITORING
High CO2 (hypr-capnia)
• Most common cause-– Inadequate removal, in relation to CO2 production,
of alveolar CO2 due to hypoventilation
• Less common cause– Inadequate removal of CO2 from breathing circuit,
e.g. • Exhausted soda lime• Inadequate fresh gas flows in non-rebreathing circuits
• Rare– Abnormally high CO2 production, e.g.
• Fever • Malignant hyperthermia

MONITORING
Sudden drop in ET-CO2
• Sudden decrease in ETCO2– Apnoea– Patient extubation– Obstruction of ET tube / breathing system– Abnormalities in pulmonary blood flow
• Cardiac arrest• Decrease in cardiac output• Obstruction of pulmonary artery / branches
– Pulmonary embolism– Surgical manipulation – Air embolism
– Water / secretions accumulating within and obstructing sampling tubing

MONITORING
Low CO2 (hypo-capnia)
• Ventilation of alveoli is increased (hyperventilation) removing CO2 at an abnormally high rate and exceeding rate of production
• False low CO2 readings occur in– Tachypnoea
• Alveolar gases are incompletely exhaled and/ or diluted by dead space gases and the response time of the analyser may be too slow
– Use of non-rebreathing circuits using high fresh gas flows
• High fresh gas flows may wash out the end tidal gases and dilute them

MONITORING
Interpreting the curve
• Elevated baseline = Rebreathing of CO2– Partial exhaustion of soda lime– Incompetent expiratory one-way valve
• Slanted upstroke– Slow expiration– Uneven emptying of alveoli– Partially obstructed ET tube / expiratory tube of breathing circuit– Airway narrowing
• COPD• Asthma• Bronchospasm
• Abnormal plateau– Normal height = 35 – 44 mmHg– Elevation
• Hypoventilation • Hyperthermia
– Abnormally low • Hyperventilation • Ventilation perfusion (P/Q) mismatch + elevated arterial CO2
MONITORING
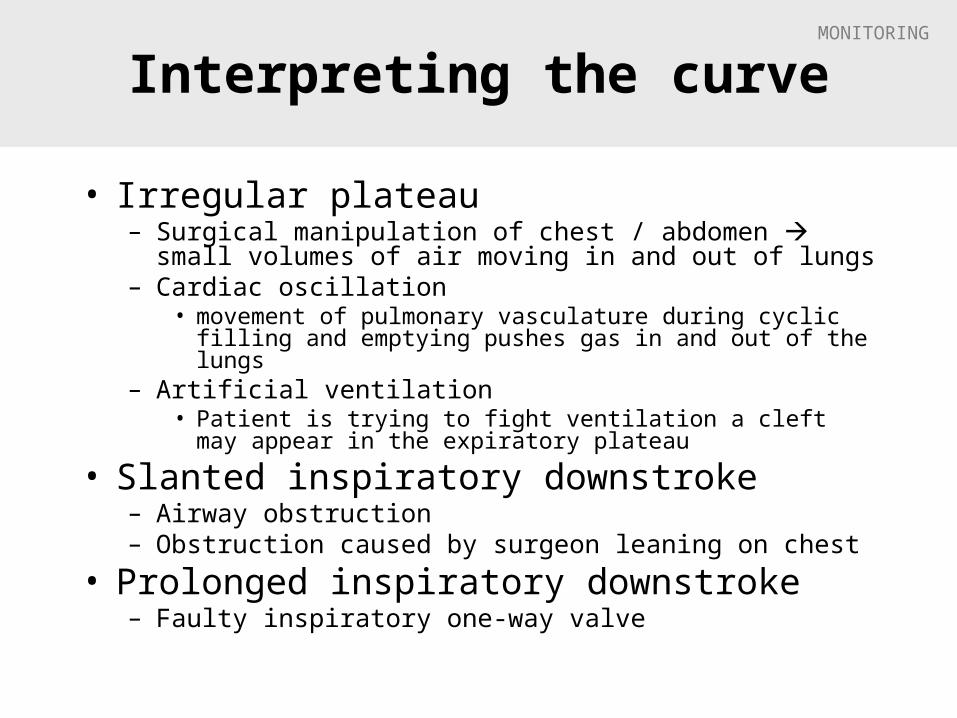
Interpreting the curve
• Irregular plateau– Surgical manipulation of chest / abdomen small volumes
of air moving in and out of lungs– Cardiac oscillation
• movement of pulmonary vasculature during cyclic filling and emptying pushes gas in and out of the lungs
– Artificial ventilation • Patient is trying to fight ventilation a cleft may appear in the
expiratory plateau
• Slanted inspiratory downstroke– Airway obstruction – Obstruction caused by surgeon leaning on chest
• Prolonged inspiratory downstroke– Faulty inspiratory one-way valve

MONITORING
Capnography Summary
• Normal ETCO2 – 35 – 45 mmHg
• High ETCO2 (>55mmHg)– Hypoventilation
• Low ETCO2– Low, abnormally high / normal PaCO2
• Normal capnogram is a “square wave”• Sudden changes in ETCO2 and in the waveform may
be due to problems with– Patient– Endotracheal tube– Breathing circuit– Sampling system

MONITORING
ECG
• Electrical activity of the heart – Cardiac rhythm disturbances
• Ventricular premature contractions (VPCs)• Atrial fibrillation• Ventricular tachycardia• Ventricular fibrillation• Asystole
– But cannot rely on this - can have a normal ECG and not have an effective heart muscle contraction! (EMD=electro-myographic dissociation)
• Electrical interference may be a problem• Expensive?
MONITORING
Electrocardiogram
• ECG (or EKG)
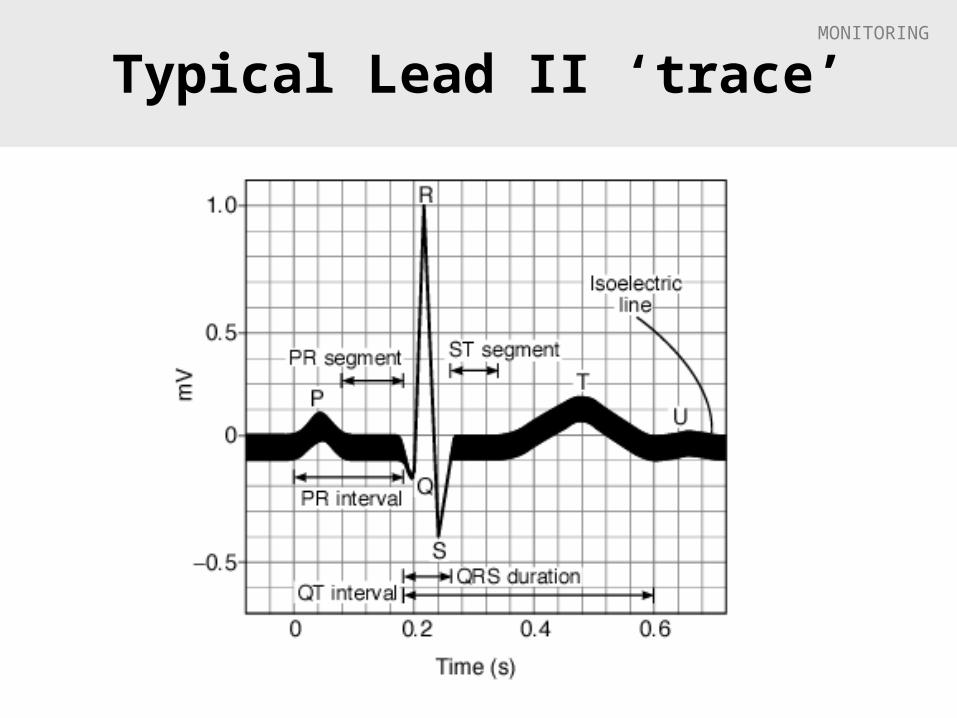
• With each heartbeat atria & ventricles cell membranes depolarise and repolarise – the electrical waves produced are measured on the surface of the body
MONITORING
Electrocardiogram
• The wave is recorded as a voltage difference between 2 electrodes in various positions:Lead I = Left arm to Right arm
Lead II = Right arm to Left leg (MOST USEFUL)
Lead III = Left arm to Left leg
MONITORING
ECG Leads
• All ‘Leads’ are applied at the start– A switch on the machine selects which are being used
to measure voltage– Various clips used to attach to skin
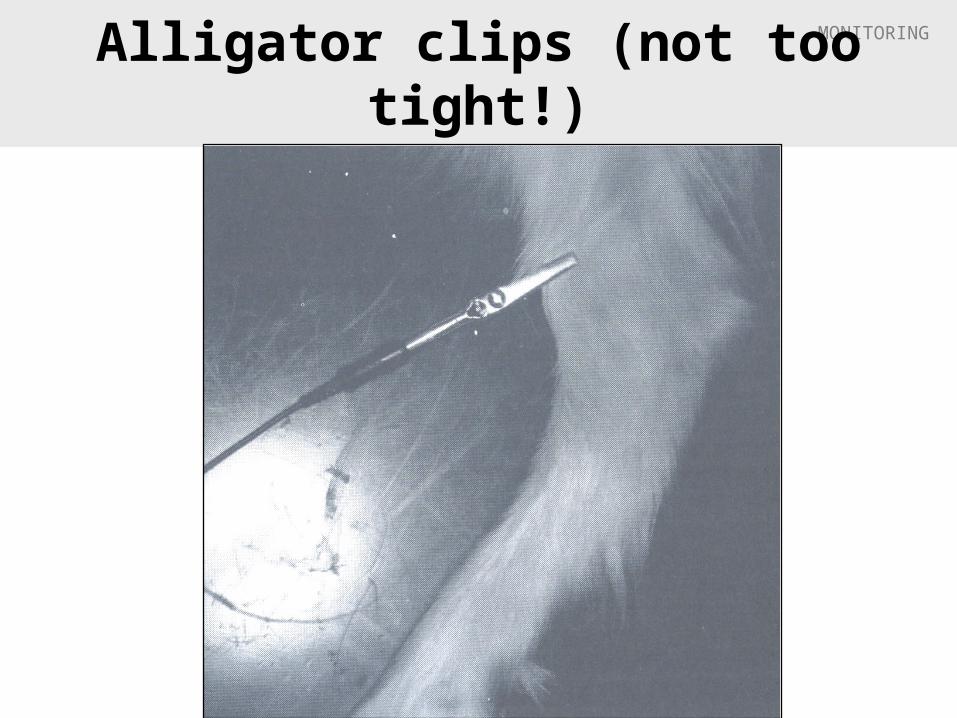
• Alligator • Human
– Various contacts• +/- clip hair• To improve conduction
– ECG gel, or– K-Y gel, or– Methylated spirit
MONITORING
Alligator clips (not too tight!)
MONITORING
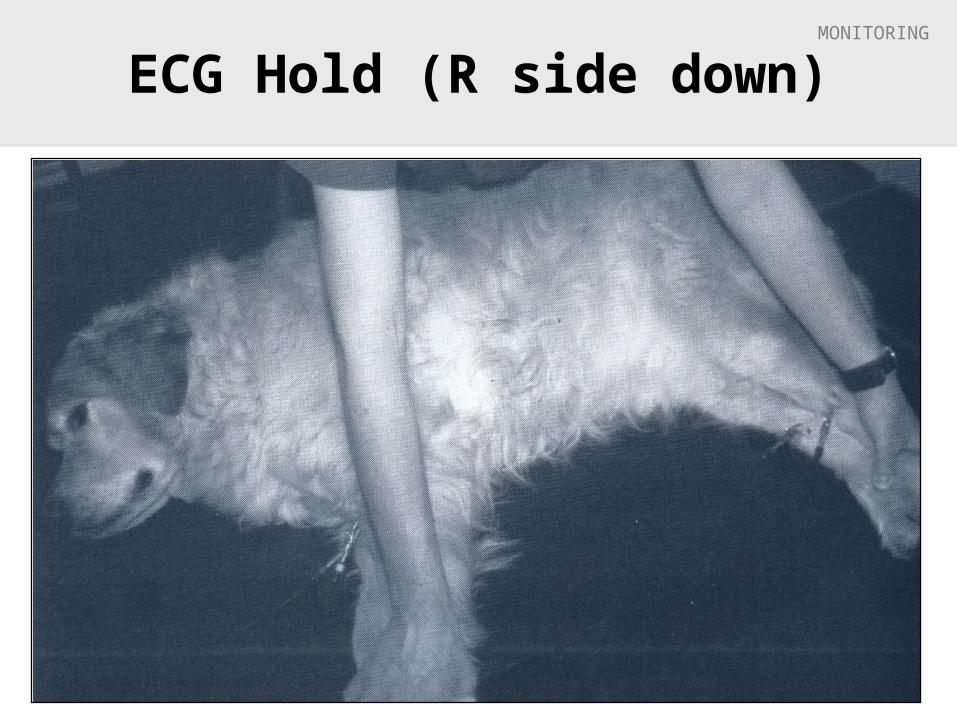
ECG Hold (R side down)

MONITORING4 Cables but 6 ‘Lead’ Combinations
MONITORING
Typical Lead II ‘trace’

MONITORING
Usefulness of ECG in GA
• ECG only gives electrical performance of heart, not the muscular performance and so is not to be relied upon– A heart can have a normal ECG but not be
contracting properly• e.g. in ‘electro-myocardial dissociation (EMD)’

MONITORING
Temperature
• Place a probe oesophageal or rectally for continuous monitoring
• Hypothermia– Causes prolonged recovery from GA– Most heat loss in 1st 20 mins– Small animals most susceptible
• Heat injury– Heating mats – Hot water bottles not wrapped in towel
• Note that a hot wet towel can scald skin
MONITORING
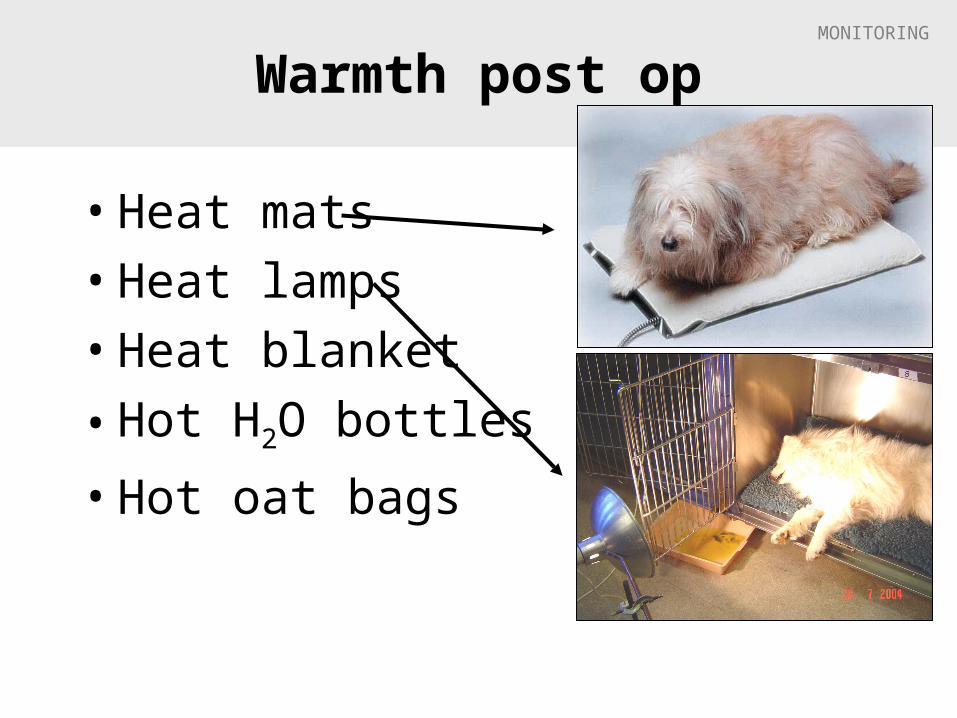
Warmth post op
• Heat mats
• Heat lamps
• Heat blanket
• Hot H2O bottles
• Hot oat bags
MONITORING
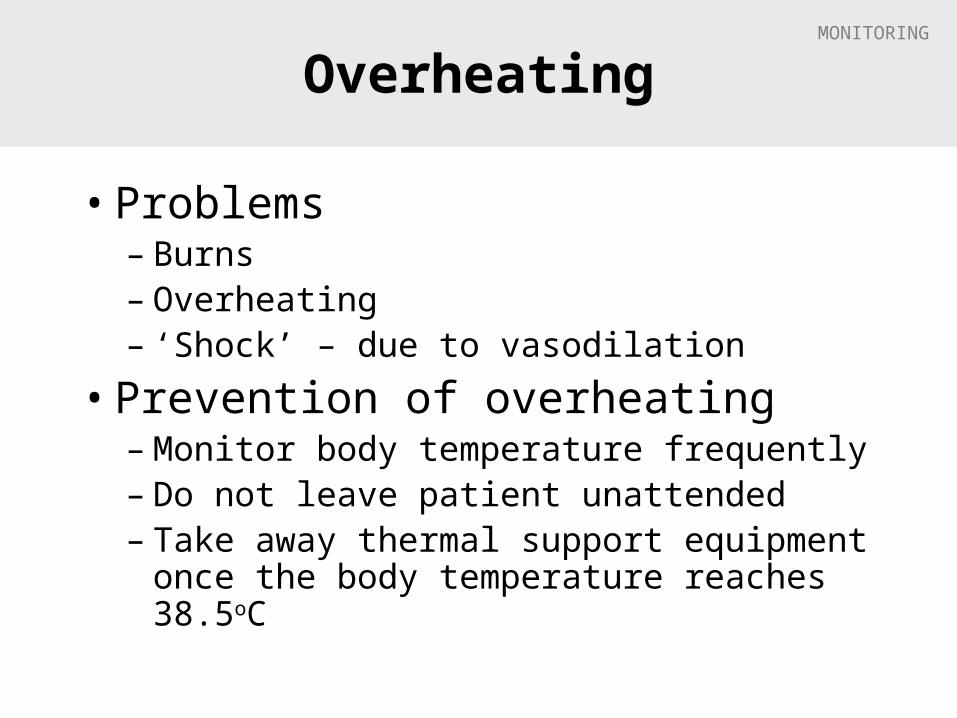
Overheating
• Problems – Burns– Overheating– ‘Shock’ – due to vasodilation
• Prevention of overheating– Monitor body temperature frequently– Do not leave patient unattended– Take away thermal support equipment
once the body temperature reaches 38.5oC

MONITORING
Many reasons to get cold
• Loss of brain thermoregulation
• Vasodilating tranquillisers & anaesthetics
• Cold tables• Skin prep solutions
(alcohol) • Open body cavities• Reduced metabolic rate
MONITORING
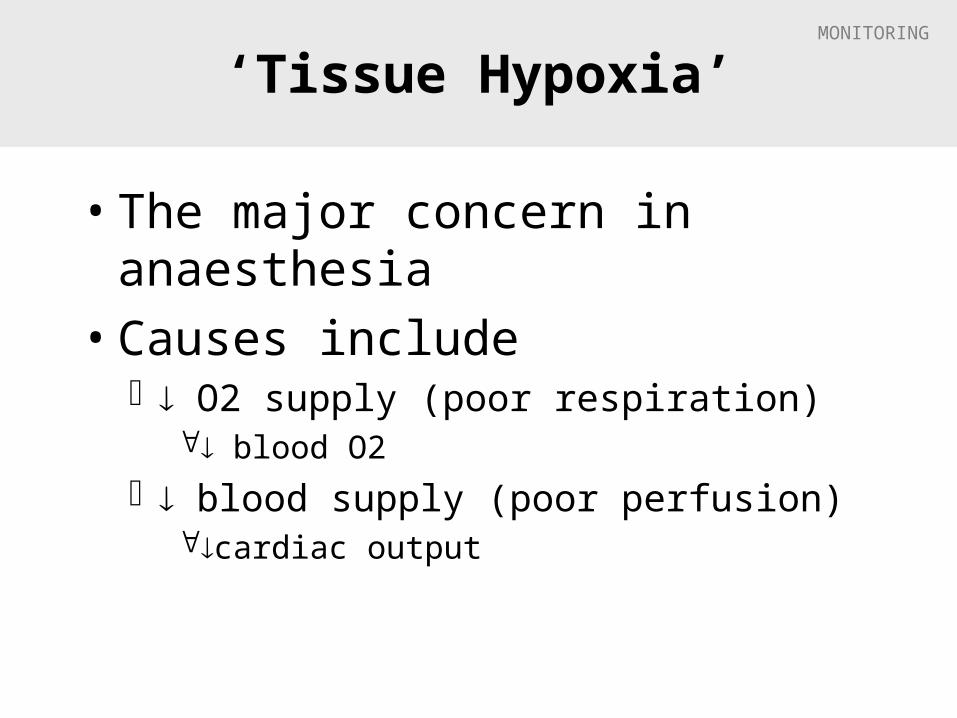
‘Tissue Hypoxia’
• The major concern in anaesthesia
• Causes include O2 supply (poor respiration)
blood O2
blood supply (poor perfusion)cardiac output

MONITORING
Note
• Use as many methods and signs to assess the patient do not rely on one!!!
MONITORING
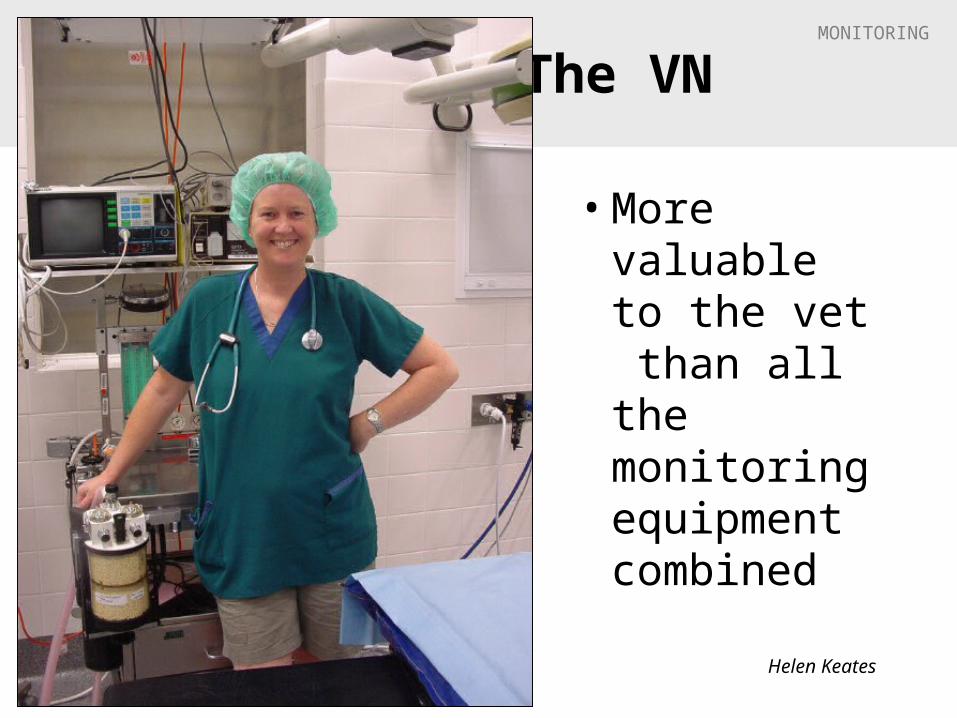
The VN
• More valuable to the vet than all the monitoring equipment combined
Helen Keates

MONITORING
The End