monitoring programme implementation report sumatra province, jalan kapten a. rivai ii, palembang,...
TRANSCRIPT
Selection Criteria and Co-Management Guidelines forHarvest Reserves in Tropical River Fisheries
Monitoring ProgrammeImplementation Report
UK Department for International DevelopmentFisheries Management Science Programme
Project R7043
Central Research Institute for Fisheries, IndonesiaProvincial Fisheries Services, Indonesia
MRAG Ltd, UK
September 1998


Selection Criteria and Co-Management Guidelines forHarvest Reserves in Tropical River Fisheries
Monitoring ProgrammeImplementation Report
Funding: UK Department for International Development (DFID)Renewable Natural Resources Research Strategy (RNRRS)Fisheries Management Science Programme (FMSP)Project R7043
Collaborators:
Central Research Institute for Fisheries, Indonesia (CRIFI),Jalan K.S. Tubun, Petamburan VI, P.O. Box 6650, Slipi, Jakarta 11410 A, Indonesia
Provincial Fisheries Services (Dinas Perikanan)South Sumatra Province, Jalan Kapten A. Rivai II, Palembang, South SumatraJambi Province, Jalan MT. Haryono No. 9, Jambi 36129, JambiWest Kalimantan Province, Jalan Sutan Syahir No. 16, Pontianak 78116 A, West Kalimantan
MRAG Ltd, 47 Prince’s Gate, London SW7 2QA, UK
Report Authors:
Mark Aeron-Thomas; Ashley S. Halls; Daniel D. Hoggarth; Sonny Koeshendrajana; AchmadS. Sarnita; Agus D. Utomo and Samuel
September 1998

CRIFI / Dinas Perikanan / MRAG Monitoring Programme Implementation Report Page i
Monitoring Programme Implementation Report
Table of Contents Page
Executive Summary . . . . . . . . . . . . . . . . . . . . . . . . . . . . . . . . . . . . . . . . . . . . . . . . . . . . . 1
1. Introduction . . . . . . . . . . . . . . . . . . . . . . . . . . . . . . . . . . . . . . . . . . . . . . . . . . . . . . 31.1 The ‘Purpose’ and ‘Goal’ of the Project . . . . . . . . . . . . . . . . . . . . . . . . . . . . 31.2 The difficulties of estimating ‘benefits’ from reserves . . . . . . . . . . . . . . . . . . 31.3 Monitoring Programme Objectives . . . . . . . . . . . . . . . . . . . . . . . . . . . . . . . . 41.4 Monitoring Programme Implementation Team . . . . . . . . . . . . . . . . . . . . . . . 41.5 This Report . . . . . . . . . . . . . . . . . . . . . . . . . . . . . . . . . . . . . . . . . . . . . . . . . 5
2. Monitoring Programme Rationale and Approach . . . . . . . . . . . . . . . . . . . . . . . . 62.1 Comparisons between floodplain study sites . . . . . . . . . . . . . . . . . . . . . . . . 62.2 Selection of study sites to provide insights on floodplain fishery dynamics and
reserve management systems . . . . . . . . . . . . . . . . . . . . . . . . . . . . . . . . . . . 62.3 Study sites to determine approximate impacts of reserves . . . . . . . . . . . . . 72.4 Investigation of local benefits . . . . . . . . . . . . . . . . . . . . . . . . . . . . . . . . . . . . 72.5 Monitoring Programme Components and Schedule . . . . . . . . . . . . . . . . . . . 82.6 Monitoring Programme Study Sites . . . . . . . . . . . . . . . . . . . . . . . . . . . . . . . 8
3. Biological Monitoring Programme . . . . . . . . . . . . . . . . . . . . . . . . . . . . . . . . . . . 123.1 Introduction . . . . . . . . . . . . . . . . . . . . . . . . . . . . . . . . . . . . . . . . . . . . . . . . 123.2 Seasonal variability in fish abundance . . . . . . . . . . . . . . . . . . . . . . . . . . . . 123.3 Estimation of fish abundance using CPUE data . . . . . . . . . . . . . . . . . . . . . 133.4 Biological monitoring programme activities . . . . . . . . . . . . . . . . . . . . . . . . 133.5 Biological monitoring programme staff and training . . . . . . . . . . . . . . . . . . 143.6 Supporting interviews on historical trends . . . . . . . . . . . . . . . . . . . . . . . . . 153.7 Biological data analysis and fish stock indices . . . . . . . . . . . . . . . . . . . . . . 15
4. Socio-economic Monitoring Programme . . . . . . . . . . . . . . . . . . . . . . . . . . . . . . 194.1 Introduction . . . . . . . . . . . . . . . . . . . . . . . . . . . . . . . . . . . . . . . . . . . . . . . . 194.2 Factors affecting socio-economic outcomes . . . . . . . . . . . . . . . . . . . . . . . 194.3 Jambi: Desa Arang-Arang . . . . . . . . . . . . . . . . . . . . . . . . . . . . . . . . . . . . . 20
Patterns of Fishing Activity and Income Flows . . . . . . . . . . . . . . . . 20Implications for Monitoring Programme . . . . . . . . . . . . . . . . . . . . . 21Monitoring Fishing Outside the Leasehold Areas . . . . . . . . . . . . . . 21Monitoring Leaseholder Fishing . . . . . . . . . . . . . . . . . . . . . . . . . . . 23Monitoring the Hari Berkarang (Community Fish Drive) . . . . . . . . . 24Calculation of Incomes from D.Arang-Arang: Summary . . . . . . . . . 24
4.4 Jambi: Dano Lamo . . . . . . . . . . . . . . . . . . . . . . . . . . . . . . . . . . . . . . . . . . . 25Patterns of Fishing Activity and Income Flows . . . . . . . . . . . . . . . . 25Implications for Monitoring Programme . . . . . . . . . . . . . . . . . . . . . 26Proposed Monitoring Programme . . . . . . . . . . . . . . . . . . . . . . . . . . 26Monitoring Fishing Outside the Leasehold Areas . . . . . . . . . . . . . . 26Leaseholder Fishing . . . . . . . . . . . . . . . . . . . . . . . . . . . . . . . . . . . . 27Calculation of Incomes from Dano Lamo: Summary . . . . . . . . . . . . 28
4.5 South Sumatra: Teluk Rasau . . . . . . . . . . . . . . . . . . . . . . . . . . . . . . . . . . 28Patterns of Fishing Activity . . . . . . . . . . . . . . . . . . . . . . . . . . . . . . . 29Implications for Monitoring Programme . . . . . . . . . . . . . . . . . . . . 32Proposed Monitoring Programme . . . . . . . . . . . . . . . . . . . . . . . . . . 32

Page ii Monitoring Programme Implementation Report CRIFI / Dinas Perikanan / MRAG
Monitoring of Individual Fishing . . . . . . . . . . . . . . . . . . . . . . . . . . . 32Self-monitoring of Group Activities . . . . . . . . . . . . . . . . . . . . . . . . . 33Calculation of Incomes for Teluk Rasau: Summary . . . . . . . . . . . . 33
4.6 South Sumatra: Benawa . . . . . . . . . . . . . . . . . . . . . . . . . . . . . . . . . . . . . . 34Patterns of Fishing Activity . . . . . . . . . . . . . . . . . . . . . . . . . . . . . . . 34Implications for Monitoring . . . . . . . . . . . . . . . . . . . . . . . . . . . . . . . 35Proposed Monitoring Programme . . . . . . . . . . . . . . . . . . . . . . . . . . 35
4.7 West Kalimantan: Desa Sekolat . . . . . . . . . . . . . . . . . . . . . . . . . . . . . . . . 35Patterns of fishing activity and income flows . . . . . . . . . . . . . . . . 35Implications for the Monitoring Programme . . . . . . . . . . . . . . . . . . 36Proposed Monitoring Programme . . . . . . . . . . . . . . . . . . . . . . . . . . 37
4.8 West Kalimantan: Meliau Village . . . . . . . . . . . . . . . . . . . . . . . . . . . . . . . . 37Patterns of Fishing Activity and income flows . . . . . . . . . . . . . . . . . 37Implications for the Monitoring Programme . . . . . . . . . . . . . . . . . . 37Proposed Monitoring Programme . . . . . . . . . . . . . . . . . . . . . . . . . . 37
4.9 West Kalimantan: Pulau Majang Village . . . . . . . . . . . . . . . . . . . . . . . . . . 38Patterns of Fishing Activity . . . . . . . . . . . . . . . . . . . . . . . . . . . . . . . 38Implications for the Monitoring Programme . . . . . . . . . . . . . . . . . . 38Proposed Monitoring Programme . . . . . . . . . . . . . . . . . . . . . . . . . . 38
4.10 West Kalimantan: Desa Tengkidap . . . . . . . . . . . . . . . . . . . . . . . . . . . . . 39Patterns of Fishing activity and Income Flows . . . . . . . . . . . . . . . . 39Implications for the Monitoring Programme . . . . . . . . . . . . . . . . . . 39Proposed Monitoring Programme . . . . . . . . . . . . . . . . . . . . . . . . . . 39
4.11 Comparative Analyses . . . . . . . . . . . . . . . . . . . . . . . . . . . . . . . . . . . . . . . . 39
5. Future Inputs to the Monitoring Programme . . . . . . . . . . . . . . . . . . . . . . . . . . . 415.1 Summary of Monitoring Programme Schedules . . . . . . . . . . . . . . . . . . . . . 415.2 Future Inputs and Responsibilities for the Biological MP . . . . . . . . . . . . . . 41
Overall Responsibilities . . . . . . . . . . . . . . . . . . . . . . . . . . . . . . . . . 41Final Activities at Sumsel sites . . . . . . . . . . . . . . . . . . . . . . . . . . . . 42Kalbar Trip . . . . . . . . . . . . . . . . . . . . . . . . . . . . . . . . . . . . . . . . . . . 42Financial Arrangements . . . . . . . . . . . . . . . . . . . . . . . . . . . . . . . . . 42Estimation of Study Site Waterbody Areas . . . . . . . . . . . . . . . . . . . 43Gill Net Data Entry . . . . . . . . . . . . . . . . . . . . . . . . . . . . . . . . . . . . . 43Water Depth Measurements and Data Recording / Entry . . . . . . . . 43Historical Fishing Interview Data - Entry and Analysis . . . . . . . . . . 44Sumsel Partial Biological MP - Lake Sites (Gill netting) . . . . . . . . . 44Sumsel Partial Biological MP - River Sites (Cast netting) . . . . . . . . 44
5.3 Future Inputs and Responsibilities for the Socio-Economic MP . . . . . . . . . 44Setup of SEMP in West Kalimantan . . . . . . . . . . . . . . . . . . . . . . . . 45Test phase of SEMP . . . . . . . . . . . . . . . . . . . . . . . . . . . . . . . . . . . 45Lelang units in South Sumatra . . . . . . . . . . . . . . . . . . . . . . . . . . . . 45
Annex A: Fieldwork Itinerary . . . . . . . . . . . . . . . . . . . . . . . . . . . . . . . . . . . . . . . . . . 46
Annex B: Example of BMP Instruction Manual (before translation) . . . . . . . . . . . 50
Annex C: Example of MP Publicity Poster (before translation) . . . . . . . . . . . . . . 55

CRIFI / Dinas Perikanan / MRAG Monitoring Programme Implementation Report Page 1
Executive Summary
1. The aims of this project are to identify ecological and institutional criteria for theselection and beneficial use of harvest reserves in tropical, artisanal river fisheries; anddevelop guidelines for their co-management in Indonesia. The purpose of theguidelines will be the delivery of economic benefits to fishing communities, derived fromenhanced recruitment to exploited fish stocks.
2. A ‘reserve’ is often understood to mean an area totally closed to exploitation for thepurpose of nature conservation. In contrast, this project defines a harvest reserve asa spatially defined area of water, managed with any specified set of technicalregulations, intended to sustain or increase the potential fish yield available fromexisting, natural fish stocks, for the benefit of fishers.
3. The project will run from November 1997 to March 2000, and involves collaboratorsfrom MRAG Ltd (UK), the Central Research Institute for Fisheries, Indonesia (CRIFI),and three provincial Dinas Perikanan (Fisheries Extension Service) offices in WestKalimantan (Kalbar), Jambi and South Sumatra (Sumsel) in Indonesia.
4. The project includes the following five main phases or activities:Inception and Legal Workshop (project inception and prospects)Regional Reserve Survey (reserve identification and fieldwork planning)Monitoring Programmes (biological, socio-economic and institutional surveys)Analysis of Reserve Benefits (estimation of reserve benefits, and their causes)Dissemination and Training (preparation and presentation of guidelines)
5. This report describes the Monitoring Programme, as finalised and implemented duringfield activities during July and September 1998. This Monitoring ProgrammeImplementation phase was undertaken by seven main collaborators from CRIFI andMRAG, with both biologists and socio-economists from each institute. This team wassupported and guided by locally-experienced Dinas Perikanan officers in each province.
6. The objectives of the Monitoring Programme are to collect data on a range of studysites, as required to (1) approximately estimate the impacts of different types ofreserves (how useful might riverine reserves actually be?), (2) determine what isimportant for the effective management of reserves (the selection and co-managementcriteria), and (3) demonstrate also the broader implications and requirements of othermanagement tools and approaches for floodplain river fisheries, to show how reservesmight be integrated into existing systems.
7. This report is divided into five main sections, plus annexes. The objectives, rationaleand overall approach of the Monitoring Programme (MP) are described in Sections 1.and 2. of the report. Specific details on the survey methodologies are given for thebiological MP in Section 3., and for the Socio-economic MP in Section 4. The timetableof future MP events and the required inputs at each stage is given in Section 5.
8. As described in Section 2. of this report, the MP includes both Biological components(BMP) and Socio-Economic components (SEMP). The ‘BMP’ will investigate the stateof fish stocks inside reserves, and compare them to other non-reserve sites. The SEMPwill investigate the economics of the fisheries in villages with and without reserves toshow the potential socio-economic outcomes of different types of reserves and othermanagement systems. The SEMP will run for a full 12-month period in eight contrasting
Page 2 Monitoring Programme Implementation Report CRIFI / Dinas Perikanan / MRAG
villages, with 4, 2 and 2 in Kalbar, Jambi and Sumsel respectively. Full 12-month BMPstudies will be undertaken on 7 waterbodies, with additional partial studies in 4 moresites for comparisons. The regular monthly studies will be undertaken by enumeratorsemployed by the project in each field site, coordinated by Dinas Perikanan staff. Thedata will be used to generate comparative indices on the state of the fish stocks withinreserves, and on the economic surplus generated by the fisheries within or around thereserves, and its distribution between village members and other stakeholders. Asupporting programme of interviews and institutional analyses in February/March 1999will explore the mechanisms contributing to the successes and failures of management.
9. As described in Section 3. of this report, the BMP is based mainly on samples of fishcatches taken by experimental fleets of multi-mesh gill nets. Eight fleets of nets will befished in each waterbody in each month over a full one year period. The catch data willbe used to estimate fish abundances (measured as relative ‘CPUE’s) and speciescompositions and size compositions of fish inside reserves. These quantitative resultson the present status of fish stocks will be supported by interviews on the historicalchanges in fish stocks within recent decades, as recalled by fishers. The combinedresults will indicate the level of protection given by the different reserve types to the fishinside them. It is assumed that more abundant fish stocks inside reserves wouldproduce more benefits to the fisheries within or around them.
10. As described in Section 4. of this report, the SEMP is gathering data to estimateincome flows from different fishing activities going to different stakeholder groups. Aweekly household monitoring survey (based on a formally selected random sample) andrecords from self-monitoring by fishing groups will be used to estimate revenues. Thesesources will be supplemented by more open-ended interviews to estimate costs.Comparisons will be made of total catch and total economic surplus relative to the areaof the waterbodies, the number of fishermen active and the number of man days spentfishing. Differences identified will not just be due to the characteristics of the localreserves but to the interaction of the entire fisheries management system operated ineach area with the hydrological and environmental characteristics of its river-floodplainsystem. So, while the quantification of the economic impact of reserves is not feasible,the study should provide insights on a range of issues critical to the development of co-management in Indonesia.

CRIFI / Dinas Perikanan / MRAG Monitoring Programme Implementation Report Page 3
1. Introduction
1.1 The ‘Purpose’ and ‘Goal’ of the Project
This project is designed to answer the following two broad questions:
C Which types of reserves provide the greatest benefits in which circumstances (i.e. thereserve selection criteria)?
C What management institutions and arrangements are necessary to achieve a givenobjective or potentially available outcome (i.e. the co-management guidelines)?
Finding the answers to these questions would result in the achievement of the ‘purpose’ of theproject, as specified in the Project Memorandum Logical Framework. At this level, the projectwould thus have produced advice on how to manage floodplain river fisheries. At a higher level,the ‘goal’ of the project is the achievement of actual benefits for the project’s target populationof Indonesian, artisanal river fishing communities. Achievement of this higher goal depends on(1) the guidelines being practically beneficial (i.e. they would give a benefit if implemented),and (2) their subsequent uptake and effective use by the target institutes.
The full objectives of the project may thus be stated in two parts. To achieve the purpose, theproject aims to answer the two questions stated above, as well as possible. To achieve thegoal, the project also aims to provide the target institutes with a good understanding of (1) thebiological and socio-economic dynamics of river floodplain fisheries, (2) how these varydepending on local conditions, and (3) how the project outputs (the ‘Guidelines’) may build onexisting systems to give real benefits to fishing communities. This depth of understandingwould enable the target institutes to implement the project recommendations in the context oftheir existing, local management systems. There is a particular requirement here to indicatehow reserves might be integrated with alternative systems of allocating access to fishing, suchas waterbody auctions or lotteries of fishing positions.
1.2 The difficulties of estimating ‘benefits’ from reserves
As shown below, four alternative experimental approaches may be used to study the benefitsor impacts of reserves. Unfortunately, none of these are entirely appropriate for this project.
C ‘Edge-effect’ studies may be used to compare stocks or benefits in areas close toreserves compared to those further away. These may be appropriate for somerelatively constant habitat types, such as savanna grasslands or large forests, but theyare difficult to use in river systems due to the strong changes in habitat across thefloodplain. A reserve in a floodplain lake may thus have good fish stocks in itssurrounding floodplains because they are deeper than others further away, and notbecause they are closest to the reserve.
C ‘With / without’ studies may compare fish stocks or benefits in those areas withreserves against those areas without them. These comparisons are difficult infloodplain fisheries due to their strong spatial variations in habitat, and the problems offinding sufficiently similar sites to act as ‘controls’ without reserves.
C ‘Before / after’ studies of fish stocks, catches etc. recorded before and after the
Page 4 Monitoring Programme Implementation Report CRIFI / Dinas Perikanan / MRAG
implementation of a reserve are difficult to interpret due to the strong environmentalvariations in flood strengths and resource productivity between years.
C ‘Temporal studies with controls’ offer the best possibilities for assessing reservebenefits, as a combination of the last two study types. In this case, indices of benefitswould be compared before and after a reserve is introduced, relative to the changes inthe same years in nearby, non-reserved control sites. Unfortunately, this approachrequires several years of baseline data and impact data before a reliable result may bedetected.
1.3 Monitoring Programme Objectives
In view of the above comments, the Monitoring Programme described in this report has beendesigned to collect data on a range of study sites, as required to (1) approximately estimate theimpacts of different types of reserves (how useful would riverine reserves actually be?), (2)determine what is important for the effective management of reserves (the selection and co-management criteria), and (3) determine also the broader implications and requirements ofother management tools and approaches for floodplain river fisheries.
As described in Section 2. of this report, the benefits of reserves will be roughly estimated only,by using a ‘with / without’ approach, comparing sites with reserves, with others without. It ishoped that this approach will give sufficient understanding of the potential benefits of reservesor other management measures, to stimulate adoption of the Co-Management Guidelines tobe produced by the project.
1.4 Monitoring Programme Implementation Team
The MPI fieldwork was carried out by a multi-disciplinary team, including the following membersfrom the collaborating institutions:
MRAG: Dr Daniel Hoggarth, Biologist & MRAG Team LeaderMr Mark Aeron-Thomas, Socio-economistDr Ashley Halls, Biologist
CRIFI: Mr Sonny Koeshendrajana, Resource economist & CRIFI Team LeaderDr Achmad Sarnita, BiologistMr Agus Djoko Utomo, BiologistMr Samuel, Biologist, Assistant to Socio-economic team
Diskan: Mr Herman Suherman, Provincial Coordinator (Jambi)Mr Rooslan Saleh, Provincial Coordinator (Sumsel)Mr Asmarajaya, Kabupaten OKI Coordinator (Sumsel)Mr Suasa Dilapanga (Kalbar)
The survey was undertaken over a six week period between 20 July and 4 September, 1998(see Annex A). The Jambi and Sumsel fieldwork was carried out by both MRAG and CRIFIstaff, while the Kalbar fieldwork was carried out by CRIFI after the departure of the MRAGteam.

CRIFI / Dinas Perikanan / MRAG Monitoring Programme Implementation Report Page 5
1.5 This Report
The remainder of this report is divided into four main sections, followed by the annexes. Furtherdetails on the overall rationale of the MP, the sites selected and the proposed comparisons tobe made are given in Section 2. of the report. Full details on the survey methodologies aregiven for the biological MP in Section 3., and for the Socio-economic MP in Section 4. Thetimetable of future MP events and the required inputs at each stage is given in Section 5.

Page 6 Monitoring Programme Implementation Report CRIFI / Dinas Perikanan / MRAG
2. Monitoring Programme Rationale and Approach
2.1 Comparisons between floodplain study sites
As mentioned in the introduction, comparisons between the different reserve types or betweenreserves and ‘control’ sites are complicated by the great local differences between study sites.River fisheries differ extensively in at least the following factors:
! Resource ecology (types of habitats, macrophytes etc. and their productivity)
! River hydrology (flooding patterns, including duration, depths, and areas and theirvariability between years)
! Fish ecology (fish species available, and their present abundance, potential productivity,distribution and migratory behaviour)
! Fishing practices (the intensity of fishing, the gear types used and their seasonality andeffectiveness)
! Historical changes in all the above factors.
Though quantitative measures could be monitored for each of the reserves, local differencesin the above factors would make it impossible to assign any given measure purely to say areserve, or any other factor of interest.
This section describes how these difficulties are partially overcome in this MP, to give bothgeneral insights about the dynamics of floodplain fisheries and their management, and someindication of the possible benefits which may be gained from reserves.
2.2 Selection of study sites to provide insights on floodplain fisherydynamics and reserve management systems
The Regional Reserve Survey (see April 1998 report) developed a ‘reserve categorisationsystem’, which attempted to simplify some of the complexities of floodplain systems. Theidentified reserves were classified on the basis of five variables, selected for their potential togive useful guidance on how to select or manage reserves:
! Intended beneficiaries (local or catchment) ! Catchment position (upland or floodplain) ! Habitat type (river section, or lake) ! Management agencies (established and managed mainly by government or community) ! Management regulations (partial reserves - with 3 sub-categories - or full reserves)
Reserves were selected for the study in as many of the above category combinations asavailable, for the purpose of understanding what factors affect their success or failure. Inaddition to these study sites, some additional sites were also selected to investigate theimplications of the various management systems used in the three study provinces, alongsidethe reserves. These include the mainly community-based lottery systems of access control inKalbar, the government waterbody auction system in Sumsel and the more shared fisherymanagement systems in Jambi.

CRIFI / Dinas Perikanan / MRAG Monitoring Programme Implementation Report Page 7
The monitoring programme is designed to generate indices of ecological and socio-economicbenefits at study sites in each category. To investigate the importance of the differentecological components of the study sites and their overall management systems, the indicesfrom all the study sites will be compared as the outcome of the full eco-social system. Due tothe lack of replicates and the complex interactions between factors, it will not be possible toquantify the contribution of different factors to the observed outcome. Qualitative indicationsand lessons are anticipated instead. In this part of the study, the integrated, interdisciplinaryresults from the monitoring programme will be supported by the more insightful interviews andinstitutional analyses from the February-March field work, with the results presented largely ina case-study approach.
2.3 Study sites to determine approximate impacts of reserves
In addition to those study site selections intended to give a general understanding of reserveselection criteria and management, a number of study sites were also selected deliberately forthe purpose of roughly estimating the impacts of reserves by ‘with / without’ comparisons.Impacts will be estimated by comparisons between sites with reserves and those without,assuming within limits that the reserve and ‘control’ sites are similar in all factors except theexistence of the reserve. To validate this assumption as far as possible, comparisons will belimited to sites close to each other (within the same province), having similar ecological featuresand similar flood strengths in the year of study. The study sites selected for this purpose aredescribed in Section 2.6.
2.4 Investigation of local benefits
The monitoring programme is designed to investigate the impact of reserves on the status offish stocks and on the actual benefits obtained by fishing communities from their overallmanagement strategies. As discussed in the Regional Reserve Survey Report, reserves maybe intended to give benefits to either local communities, or to whole river catchments. Theimpact of a reserve at a catchment level could only be investigated by comparing wholecatchments, some with and some without reserves, and making allowances for the significantecological differences between catchments. Such an approach is well beyond the scope of thepresent project. Instead, the monitoring programme focusses on local impacts of reserves,particularly as perceived by those communities most closely associated with them.
Many of the reserves examined by the RRS fell entirely within the boundaries of a single village,which had some traditional or formal authority to control the fishing activities in their waters.Most of the study sites selected fell into this category. The ecological benefits of reserves willbe investigated by monitoring the state of fish stocks inside the reserve over a full yearly cycle.The socio-economic benefits of fisheries management (including the reserve) willsimultaneously be assessed within the village as a whole, as obtained from all its fishedwaterbodies. This strategy supposes that fish protected within reserves give the maximumbenefits to those waters most adjacent to them, as fished by the local village, and that suchbenefits may be detected in that community.
The three waterbodies established as reserves in upland parts of the Jambi catchment werenot included in the monitoring programme due to difficulties in access, and the problems thesewould cause for managing the sites. These reserves were established by the IndonesianGovernment (Diskan in collaboration with LIPI), mainly for the overall benefit of the Jambicatchment. The sites will however be investigated in the Institutional Analysis phase of theproject (in February / March 1999) to determine their local impacts and the attitude of thecommunities toward them.
Page 8 Monitoring Programme Implementation Report CRIFI / Dinas Perikanan / MRAG
2.5 Monitoring Programme Components and Schedule
The Monitoring Programme includes two main components. A Biological MonitoringProgramme (BMP) will collect samples of fish from inside reserves and other waterbodies usingmulti-mesh gill nets provided by the project. These will show the species composition andabundance of fish inside the reserves, and hopefully reveal the degree of protection whichreserves give to their resident fish stocks. It is assumed that those reserve with high fishnumbers could give more benefits to their local fishing communities. Such benefits would onlybe achieved when enough fish move out from the reserve to be caught in the fished area, orjust enough fishing is allowed inside the reserve to increase catches without depleting reservestocks.
The contribution of the reserve to the village fisheries will be investigated by a Socio-EconomicMP looking also at the productivity and profitability of the fisheries surrounding (or sometimesalso inside) the reserves. The SEMP will determine the catches of fish and the profits and costsof the fisheries in villages with the different types of reserves. Additional samples will be takenin some villages without reserves where these may provide insights on the effects of the variousoverall management patterns.
The BMP and SEMP will be undertaken between the 14 months from the start of August 1998to the end of September 1999. This period should include two dry seasons during which theabundance of fish inside the reserves will be estimated by the BMP. It also includes a full oneyear cycle over which the annual production and profitability of the villages will be estimated bythe SEMP.
Interpretation of the outcome of the MP will be aided by the insights and understanding ofmanagement systems gained during the Institutional Analysis field trip in Feb/March 1999.
2.6 Monitoring Programme Study Sites
As outlined in the previous sections, the MP study sites were selected for various reasons:
C As a first priority, sites were selected where reserves were fully contained within theboundaries of single villages, and fished only by their inhabitants. In these situations,investigations could be made on the relationships between (1) the state of fish stocksinside the reserves, and (2) the productivity and profitability of the fishery in the villagewith the reserve. These sites included Arang Arang in Jambi, Benawa in Sumsel andall three of the Kalbar sites with reserves (see Table 1).
C Study sites were selected in as many as possible of the different reserve categoriesidentified during the RRS. Only the catchment position category could not beinvestigated due the difficulties of working at the Jambi upland sites. Due to the lackof available study sites, and the many different types of reserves, it was not possible toselect several replicates for each reserve type.
C To determine the overall impact of eco-social systems, some study sites were selectedwithout reserves where these were expected to yield useful lessons. Such sitesincluded Desa Dano Lamo in Jambi.
C To determine the impact of reserves by ‘with / without’ comparisons, some study siteswere selected purely for comparison with reserve localities, having similar features andlocated nearby to each other, within the same hydrological system. These sites are

CRIFI / Dinas Perikanan / MRAG Monitoring Programme Implementation Report Page 9
identified as the ‘control’ locations identified for comparisons B, C, D, E, G and H, asgiven in Table 2. Some of these sites will be investigated by full BMPs, while some areinvestigated by Partial BMPs, with samples taken only in certain dry season months(see Section 3.2).
The following notes briefly explain the reasons for the selection of each of the different studysites. These notes are summarised in Tables 1. and 2.
C The two Jambi study sites, (Desa Arang Arang and Desa Dano Lamo) were mainlyselected to study the eco-social impact of their overall management systems, being inbetween the community oriented Kalbar sites and the more government orientedSumsel sites. No suitable water body was available for comparison with the partial lakereserve Danau Arang Arang. The approximate impacts of this water body may onlybe investigated by comparison with the other reserves in the different provinces. TheLubuk Mahligai reserve in Dano Lamo was only implemented this month by Diskan andLIPI. BMP studies were not carried out on this site to give the reserve some time todevelop its fish stocks without any fishing activities.
C Teluk Rasau reserve within the Lempuing system will be studied as an example of agovernment-managed, fully-closed, lake reserve. Data from the full BMP at this site willbe compared with Partial BMP collected by CRIFI staff over the dry season period in anearby, ecologically-similar water body, such as Lebung Sulit. The final choice ofwater body will be decided by CRIFI staff in discussion with Lempuing fishers.Investigations of fishing incomes on adjacent lelang areas will highlight the operationof the leasing system and its effects on different stakeholders.
C The biological effects of riverine reserves will be studied by Partial BMP studies atCRIFI’s Lubuk Lampam auction unit on the River Lempuing. This unit includes somelubuks (deep sections in the river) which are restricted as reserves and some otherswhich are fully fished over the dry season, using ngesar fish drives and other methods.
C Desa Benawa in Sumsel includes a large, remote lake Lebak Nilang identified byDiskan several years ago for eventual use as a reserve. The lake is currently withdrawnfrom the local auction system, but continues to be fished as before by a local ‘manager’on behalf of Diskan. Socio-economic studies at Desa Benawa (without a reserve) willbe carried out to enable comparisons with the results from Teluk Rasau . Biologicalstudies at Lebak Nilang will be compared with the results from a Partial BMP at thenearby, ecologically-similar reserve water body Teluk Gelam. This reserve is not fishedby any local community, and no socio-economic studies will be undertaken at thislocation.
C In Kalbar, studies on the three reserve lakes Danau Seliban, Danau Belaram andDanau Batu will be made to compare the impacts of different types of partial reserveclosures (see Table 1). These study sites are less similar to each other than thecomparison sites in Sumsel, and the comparisons will need to take account of the widereco-social systems at these waterbodies. Danau Seliban, for example was reported tohave serious problems of enforcing its regulations due to the close vicinity of a nearbytown. Fish stocks in Desa Meliau may benefit from its reserve Danau Belaram, but alsofrom its remote upstream position and its low fishing rates in some waterbodies said tobe protected by crocodiles and evil spirits.
C The socio-economic studies in the four Kalbar villages will also be used to demonstratethe levels and distribution of benefits from Kalbar’s strongly community-orientedmanagement systems (in which the participation of village members in the fishery is

Page 10 Monitoring Programme Implementation Report CRIFI / Dinas Perikanan / MRAG
maximised by use of a lottery system for fishing positions).
C Desa Pulau Majang in Kalbar does not have any reserve waterbodies, and many of itsfishing areas are routinely fished by tuba and/or chemical poisons in the dry season.Studies in this village will determine the stock levels and benefits achieved in this localityfrom external recruitment sources only, when virtually all local sources of fish aredestroyed in the dry season. The stock levels and economic benefits in this village maybe qualitatively comparable with the other three study sites in Kalbar.
In addition to these study sites, selected for the main Monitoring Programmes, summaryinvestigations may be conducted during the Institutional Analysis phase (February / March1999) at an additional four sites.
C Desa Jambi Kecil may be investigated as a partial river reserve in Jambi (this site wasnot selected for the main MP due to the lack of clearly suitable candidates for theenumerator positions, and the complexities of local traditional regulations).
C Two of the upland reserves in Jambi, Lubuk Taman Ciri and Danau Teluk Kayu Putimay be investigated in order to determine the local impacts of those reserves intendedmainly for benefits to the wider catchment.
C CRIFI’s ‘Swamp Project’ sites in South Sumatra may also be briefly investigated toconsider the possible application of the project Guidelines at this location.

CRIFI / Dinas Perikanan / MRAG Monitoring Programme Implementation Report Page 11
Table 1. Summary of characteristics of sites selected for socio-economic andbiological studies in the Monitoring Programme
Prov- Village S-E Reserve Biol. Reserve Management Hab-ince MP? MP? itatRegul- Sea- Gears Agen-
ations sons banned cy
Jambi Desa Arang Arang Yes Danau Arang Arang Full PR Dry Some C-C Lake
Desa Dano Lamo Yes ( Lubuk Mahligai ) No FR * G-C River
Sumsel Lelang units near Yes Teluk Rasau Full FR G-G LakeTeluk Rasau Teluk Toman Part. None None Lake
L. Lampam reserve Part. PR Dry Some CRIFI Riverlubuks
L. Lampam fished lubuks Part. None None River
Lebak Nilang Yes ( Lebak Nilang ) Full None ** G-C Lake
(None) No Teluk Gelam Part. FR G-G Lake
Kalbar Desa Tengkidap Yes Danau Seliban Full PR Dry Some C-C Lake
Desa Meliau Yes Danau Belaram Full PR All Some C-C Lake
Desa Sekulat Yes Danau Batu Full PR Dry All C-C Lake
Desa Pulau Majang Yes None Full None C-C LakeNotes: S-E MP = Socio-Economic Monitoring Programme; Biol. MP = Biological Monitoring Programme
Part. = Partial Biol. MP (gill net fishings in selected months only)* Reserve only implemented this year, so Biol. MP not permitted, and too early to detect benefits** Reserve not yet implemented, so only control siteFR = full reserve; PR = partial reserve; C = community; G = government agencies
Table 2. Summary of anticipated comparisons to be made between study sites
Prov- Biological Data Socio-economic Dataince
Comparisons Based on Comparisons Based on
Village Reserve Lake River Eco-social Lake Reserves Reserves System Reserves
Jambi Desa Arang Arang Danau Arang Arang A F
Desa Dano Lamo ( Lubuk Mahligai ) F
Sumsel Lelang units near Teluk Rasau B F GTeluk Rasau Teluk Toman B (control)
L. Lampam reserve Elubuks
L. Lampam fished lubuks E (control)
Lebak Nilang ( Lebak Nilang ) C (control) F G (control)
(None) Teluk Gelam C
Kalbar Desa Tengkidap Danau Seliban D F H
Desa Meliau Danau Belaram D F H
Desa Sekulat Danau Batu D F H
Desa Pulau None D (control) F H (control)Majang
Note: Main comparisons would be made between those sites marked with the same letter (A,B,C,...,H)Assessment of Danau Arang Arang would require overall comparison of groups (A,B,C & D)

Page 12 Monitoring Programme Implementation Report CRIFI / Dinas Perikanan / MRAG
3. Biological Monitoring Programme
3.1 Introduction
The biological monitoring programme was designed to use the simplest possible approachesfor generating useful, quantifiable indices on the states of fish stocks in reserves. Simpleindices (eg fish abundances) were preferred over more complicated ones (eg current spawningstock biomass as a % of the unexploited biomass) to ensure that the results collected wouldbe meaningful to artisanal fishers and fisheries extension staff having relatively little education.
The programme has two main components: a regular sampling survey covering a full 12-monthcycle, and a series of supporting interviews to provide comparative data on historical conditions.
The routine sampling survey will collect quantitative data enabling the following indices to becalculated for the state of fish stocks, for the year of the survey:
! The abundance of fish ! The composition of fish stocks (by species and sizes of fish)
The supporting interviews will collect more qualitative data on the historical trends in the aboveindices over recent years, ie:
! Overall changes in fish abundances over time ! Any particular declines or extinctions of individual species
These components are described in detail in this section of the report. A checklist of therequired activities for the full implementation of the BMP is provided as Table 3.
3.2 Seasonal variability in fish abundance
Fish abundance varies over time in an annual cycle linked to the seasonality of flooding. Mostriver fish species spawn at the beginning of the flood, and the overall abundance of the stockthen rises during the flood season, and falls again as fish die off in the environmentally stressfulconditions of the dry season. In fished rivers, catches are usually particularly high in thedrawdown and dry seasons following the high water growth season. The long-term survival andproductivity of river fish stocks is critically dependent on the survival of enough fish over the dryseason to spawn at the beginning of each new flood season. The ecological benefit of areserve may therefore be particularly measured in terms of the numbers or biomass of fishwhich it sustains over the dry season.
The actual timing of the dry season varies significantly between different localities and betweenyears. This variability prevents the detailed advance planning of monitoring surveys intendedto focus on dry season indices. To ensure that fish stocks are sampled over the unpredictabledry season period, it was decided that data should be collected over the full annual cycle in themain study sites. Comparison sites selected for the Partial BMP would be studied only duringthe dry season period, as identified from the nearby fully-monitored sites.

CRIFI / Dinas Perikanan / MRAG Monitoring Programme Implementation Report Page 13
3.3 Estimation of fish abundance using CPUE data
Indices of fish abundance may be obtained from catch-per-unit-effort (CPUE) data, since agiven unit of fishing gear will generally catch fish in proportion to their availability. The mainconstraint to this approach is that the effectiveness (or ‘catchability’) of fishing gears varies inmany different ways. Catchability varies enormously between different gear types, and alsovaries seasonally and spatially in floodplain fisheries, with their strong hydrological cycles andmorphological features.
To maximise the comparability of abundance indices between the different study sites, CPUEdata were collected from standard fleets of variable-meshed gill nets bought by the project. Gillnets are most effective in relatively open waters at times when fish are relatively mobile, e.g.during the high water and drawdown seasons when fish are foraging for food and thenattempting to emigrate from the drying floodplain. Gill net catchabilities may be lowest in thedry season when trapped fish are relatively sedentary. The high concentrations of fish at thistime are usually caught by other, more active gear types. Recognising, then, that CPUEabundance indices may not be comparable between seasons, this approach is recommendedon the assumption that changes in catchability may be relatively similar between the differentwaterbodies in the study, thereby allowing their comparison.
In addition to varying over the seasons, catchability also varies spatially: some fishing locationsare simply better than others. To minimise bias due to different fishing practices between thestudy sites (each of which will be fished by different fishermen employed by the project), amaster fishermen was employed standardise net setting practices, and provide guidance on themost appropriate fishing locations within each reserve.
3.4 Biological monitoring programme activities
In consideration of the above points, the routine biological gill net sampling activities wereundertaken in each of the selected waterbodies as follows:
! Two fleets of gill nets were purchased by the project for each study location, eachcomprised of 4 sections of 40mx2m monofilament gill nets, with mesh sizes of 1", 2",3.5" and 4.5". To ensure comparability, all gill net materials were purchased from thesame supplier, and rigged in the same way. To minimise the effects of deterioration ofthe nets, two second sets of nets were supplied to be used for the latter half of theprogramme.
! Weighing balances of two appropriate sizes (eg to weigh up to 3kg in 0.01kg units andup to 10 kg in 0.1 kg units) and basket(s) were provided by the project for each village.
! Since the sampling programme will deplete the fish stocks in each reserve, somecompensation (Rp 500,000 - Rp1,000,000) was paid to each village. In some villages,the compensation was contributed to village development funds, via the Kepala Desa.In other villages, the compensation funds were used by Dinas Perikanan to restock fishin the reserves after the study. To avoid any misunderstandings about the legality offishing, both verbal and written publicity materials were distributed among villagemembers, describing the scientific nature of the survey, the objectives of the project andthe compensation paid to the village (see e.g. in Annex C).
! At each site, two gill net fishers were employed by the project and trained to set andhaul the nets. An enumerator was also employed in each village to record the data fromthe nets, as described in Instruction Manuals provided for each village (see e.g. in

Page 14 Monitoring Programme Implementation Report CRIFI / Dinas Perikanan / MRAG
Annex B). Following suitable training, both gill nets were set overnight, on 4 selecteddays in each month, thereby generating 8 samples per month, from which to estimatea mean catch and its standard error. Instructions were given on the positions for settingthe gill nets, intended to give a good coverage of the different parts of the waterbody.Gill net positions were specified on maps provided to the enumerators, as illustrated inAnnex B, and in Figures 1 and 2.
! The programme was implemented for at least a full 12-month cycle starting from thetraining period at each site, and lasting up to 31 September 1999. This sampling periodshould ensure coverage of at least one dry season period, and possibly two.
! The total catch from each night’s sampling was recorded as follows:the total weight of fish caughtthe number and weight of fish caught of each main species (or species group), ineach of two size classes (above or below 30cm)
Such data were recorded on a standard data form (see Annex B).
! Water height gauges were set up to enable measurements of water levels in the reserveand comparison waterbodies.
! Occurrences of ‘air bangar’ low water quality or illegal fishing in the reserve since thelast sample were recorded by the village enumerators. Such factors may be responsiblefor major sudden losses of fish, particularly over the dry season and early flood.
3.5 Biological monitoring programme staff and training
To achieve the above routine fieldwork, the following staff were employed by the project:
! Two locally resident fishermen were employed in each village for the full 12-monthsurvey, and paid a daily salary (at an appropriate government-specified rate) to set andretrieve the gill nets 4 times a month, and land the fish caught.
! One locally-resident ‘enumerator’ or ‘Village Coordinator’ (VC) was employed in eachvillage for the full 12-month survey to meet the fishermen and assist them to weigh andrecord catches on data forms supplied by the project.
! One ‘Provincial Coordinator’ (PC) was employed in each province to provide a liaisonbetween the village enumerators and the project, to ensure that data were collected asrequired, to check data quality, and to send copies of data sheets to the CRIFI projectcoordinator by agreed deadlines.
! One master fisherman was employed for the duration of the MP Implementation phaseto train fishermen in each of the villages to use standard fishing techniques and identifythose localities in the reserve likely to produce the best catches.
The village fishermen and enumerators, and the three provincial coordinators were trained inthe appropriate methods of data collection and recording during this field visit. BiologicalInstruction Manuals were written in Indonesian (see pre-translation draft in Annexes B and C)and provided to the employees.
CRIFI / Dinas Perikanan / MRAG Monitoring Programme Implementation Report Page 15
3.6 Supporting interviews on historical trends
Supporting data on trends in fish stock abundances were collected during the MPI field trip,using the following short interview process. Each interview took not longer than 10-15 minutes.
! A subsample of at least 10 fishermen was selected for interview in each village (with thehelp of the village leaders, and randomised where possible)
! Each respondent was asked to state the number of years he/she had fished in thevillage waterbodies.
! The respondent was then asked to estimate the change in average CPUE over a statedtime period within his memory (NB: this should be CPUE for a specified number of gearunits of a specified, unchanged gear type, and NOT the change in total catch, or catchper fisherman). Since fisherman often tend to overestimate the decline in their fishstocks, some questioning was made to ensure that the respondent had comparedpresent catches with the average historical catches, and not with, say, his best day’scatch in the best ever year in that village.
! The respondents were finally asked to state which fish species had either becomeextinct, or increased or decreased significantly within the period of his/her experience.
3.7 Biological data analysis and fish stock indices
Data from the historical interview survey were recorded by the CRIFI/MRAG staff during thefield visit, and retained by them for subsequent computer analysis.
Data from the routine monitoring survey were initially collected by the employed villageenumerators. The provincial coordinators were requested to collect the data sheets on amonthly basis from all the village enumerators, and to send photocopies of the data sheets toCRIFI for entry.
Data entry should be undertaken in a suitable Microsoft Excel database by CRIFI staff. Datashould be entered as soon as possible after collection to enable ongoing monitoring of results.An up-to-date copy of each month’s database should be e-mailed to MRAG as soon as it is fullyentered, and hard copies of the data sheets sent by post at the same time.
The historical trend interview data should be analysed to produce two visual, qualitativeillustrations of the changes in fish stocks:
! A plot of the ratio (historical catch / current catch) against the year of the historical catch(values consistently over 1, or a negative trend over time would indicate a decline in fishstocks).
! A frequency distribution of the number of times each fish species is reported by arespondent as being significantly declined or extinct (illustrating the degree ofcorrespondence between the different respondents, and identifying those species mostcommonly agreed to have declined).
The gill net data should be analysed to produce the following simple indices on the state of fishstocks within reserves:
! Monthly average total weight of fish caught per 160 m gill net, and its standard error

Page 16 Monitoring Programme Implementation Report CRIFI / Dinas Perikanan / MRAG
(index of seasonal fish abundance)
! Yearly average % of total catch weight of large fish (>30 cm), and its standard error(index of average fish sizes)
! Yearly average % of total catch weight of each species/group, and its standard error(species composition to illustrate abundance of preferred / valuable species)
! Yearly average sizes of fish (3weight / 3numbers) of most common species(index of fish mortality rates by species, assuming equal growth and emigration rates)
When the full year’s data have been collected, the monthly fish abundance indices should beexamined to determine the maximum and minimum fish levels achieved within the reserves,and the month at which they occurred, for comparison with the hydrological cycle.
When calculated, the above indices should be compared between the reserve categories,bearing in mind the caveats mentioned in the introduction about the ecological differencesbetween the selected waterbodies. Explanation of the observed indices will require anintegrated, qualitative analysis of the full suite of data collected. A key explanatory variable, notincluded as a reserve ‘category’ could be the level of fishing activities at each site. A roughindex of fishing intensity (eg fishermen / km of fishing grounds) will be produced by the socio-2
economic monitoring programme. If fishing intensity varies significantly between the study sites(as seems likely from the RRS survey results), this index should be used as a qualitative co-variate for the comparison of results between sites.

CRIFI / Dinas Perikanan / MRAG Monitoring Programme Implementation Report Page 17
Table 3. Checklists of Required Activities for Implementation of the BiologicalMonitoring Programme at Each Study Site
Historical Catch InterviewsC Select at least 10 fishers (randomly if possible)C Conduct interviews on changes in catches in recent times
Gill Net Survey Preparation and TrainingC Discuss hydro-morphology of waterbody with local fishers and master fisherman, and
divide into four fishing areasC Write and provide Biological MP Instruction Manual, to include:
Map / diagram showing where to set nets in reserveInstructions on how and when to fish (ensure ALL catch is recorded)Instructions on maintenance of gear and monitoring of conditionInstructions on how to sort, measure and record catches etc
C Train gill net fishermen (GNF) how / where / when to set gill nets (assisted by masterfisherman, and with reference to Instruction Manual)
C Train GNF to sort and measure fish catchesC Train GNF to maintain gill netC Train VC to monitor condition of gill netC Train VC to record catches on data forms providedC Provide GNF with necessary equipment (nets, bowls, buckets, balances, rulers etc)C Provide VC with necessary recording equipment (data forms, folders, pens etc)
Monitoring of Water Heights, Air Bangar and PoachingC Provide materials for making depth gauge for placing in reserveC VC to make and set depth gauge in reserveC VC (assisted by GNF) to record and report water depths weekly / twice-weeklyC VC (assisted by GNF) to be instructed to record and report any occurrences of air
bangar, especially where it results in fish mortalities in reserveC VC (assisted by GNF) to instructed to record and report any poaching of fish from
reserve
Data ReportingC VC to be instructed on how / when to deliver data to PC
PublicityC Discuss distribution of sampled fish to village with kepala desaC Pay compensation to village for fishing in reserveC Announce programme at village meetingC Write and distribute publicity posters
Appointment of Project StaffC VC and GNF to be given Letters of Appointment by Dinas Perikanan, including terms
and conditions, rates of pay, and job descriptions, as appropriate

A
D
C
B
E
F
H
G
k b
k b
b
k
b
b
k
k
k
b
k
k
b
b
SungeiAnak Jelo
Saluran dariSungei Komering
Sektor 2(Rawa)
Sektor 1
Sektor 3
Sektor 4
Lebak Nilang, Desa Benawa
Pulau
TelukGapuk
TelukSilumar
TelukCandui
Reservat Teluk Rasau, Desa Pedamaran VI
A
B
k
b
b
k
C
D
k
k
b
E
F
k
b
b
k
G
H
b
k
k
b
Sungei Lempuingke Pedamaran
Saluran keDanau Besar
SungeiLempuingdariLubukLampam
Batas reservat
* Rumah Jaga
b
Page 18 Monitoring Programme Implementation Report CRIFI / Dinas Perikanan / MRAG
Figure 1. Experimental gill net setting positions in Lebak Nilang waterbody, DesaBenawa, Sumsel. Codes b and k indicate the large-meshed and small-meshedends of the gill nets respectively
Figure 2. Experimental gill net setting positions in Teluk Rasau reserve waterbody,Desa Pedamaran VI, Sumsel.
CRIFI / Dinas Perikanan / MRAG Monitoring Programme Implementation Report Page 19
4. Socio-economic Monitoring Programme
4.1 Introduction
The harvest reserves studied by the project form only one part of the fisheries managementsystem operated in each area. In addition, there are numerous rules relating to fisheries accessand conduct that affect pressure on local stocks and the distribution of the proceeds fromfishing activity. While some of these rules, such as the ban on the use of poisons, are nationallyapplicable there are many local differences. These are particularly apparent at the Provinciallevel. A study of the socio-economic outcomes from each fishery will deepen understanding theinteraction of these different sets of rules with the different sets of hydrological and biologicalconditions in each area.
An evaluation of the differences in the magnitude and distribution of fisheries benefits betweensites will complement the results of the biological monitoring programme. It will also providea clearer insight into who benefits from different types of fishing activity, the effect of differentsets of allocation rules, and the likely winners and losers from particular changes in themanagement regime. These insights are critical to developing any dialogue with fishingcommunities - the essential first step to co-management.
With these ends in view, the socio-economic monitoring programme (SEMP) is gathering datato estimate income flows from different fishing activities going to different stakeholder groups.A weekly household monitoring survey (based on a formally selected random sample) andrecords from self-monitoring by fishing groups will be used to estimate revenues. Thesesources will be supplemented by more open-ended interviews to estimate costs. The SEMPthus has three main components: weekly household monitoring of individual fishing activities,self-monitoring of major group activities and supplementary surveys of costs. The combinationof these elements and the criteria used to select respondents varied from site to site dependingon the characteristics of its fishery, its management system and the number of waterbodies tobe covered.
The rationale for, and details of, the approach adopted for each site is given in the followingsections. Before these details, section 4.2 looks briefly at factors affecting socio-economicoutcomes. The chapter concludes with an outline of the issues that may be explored furtherusing the results collected.
4.2 Factors affecting socio-economic outcomes
Socio-economic outcomes - the flow of incomes to different stakeholder groups - areinfluenced by both the physical and biological characteristics of the fishery and the rules whichdetermine access to it.
The level of economic surplus derived from the fishery is a determined by the returns (the sizeof catch and fish prices) and costs (of gears used, labour time etc.) of fishing. The distributionof this surplus between different stake holding groups is determined by who does the fishingand under what financial conditions of access.
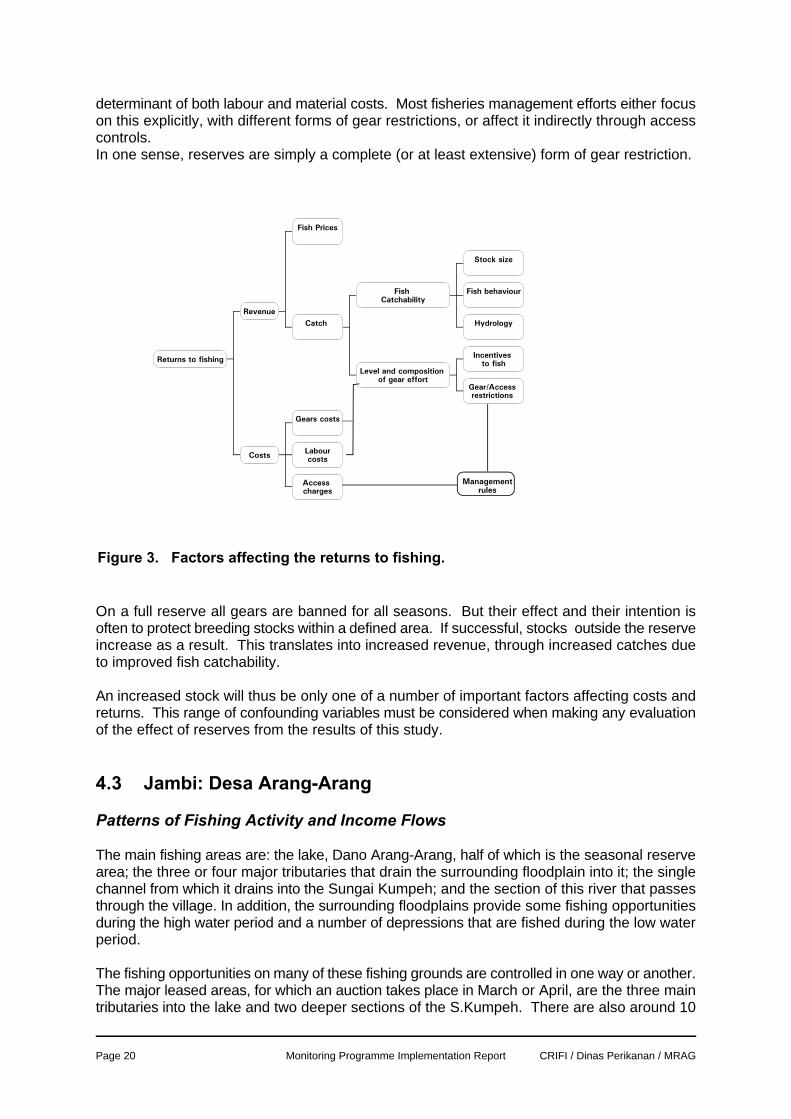
The principal factors determining the returns to fishing are illustrated in Figure 3 below. Theinfluences on costs and returns are identified. In this, the level and composition of gear effortis of central importance, affecting returns, through its influence on catch, and as a prime
Access charges
Labourcosts
Gears costs
Costs
Gear/Access restrictions
Incentives to fish
Level and composition of gear effort
Hydrology
Fish behaviour
Stock size
Fish Catchability
Catch
Fish Prices
Revenue
Returns to fishing
Managementrules
Page 20 Monitoring Programme Implementation Report CRIFI / Dinas Perikanan / MRAG
Figure 3. Factors affecting the returns to fishing.
determinant of both labour and material costs. Most fisheries management efforts either focuson this explicitly, with different forms of gear restrictions, or affect it indirectly through accesscontrols.In one sense, reserves are simply a complete (or at least extensive) form of gear restriction.
On a full reserve all gears are banned for all seasons. But their effect and their intention isoften to protect breeding stocks within a defined area. If successful, stocks outside the reserveincrease as a result. This translates into increased revenue, through increased catches dueto improved fish catchability.
An increased stock will thus be only one of a number of important factors affecting costs andreturns. This range of confounding variables must be considered when making any evaluationof the effect of reserves from the results of this study.
4.3 Jambi: Desa Arang-Arang
Patterns of Fishing Activity and Income Flows
The main fishing areas are: the lake, Dano Arang-Arang, half of which is the seasonal reservearea; the three or four major tributaries that drain the surrounding floodplain into it; the singlechannel from which it drains into the Sungai Kumpeh; and the section of this river that passesthrough the village. In addition, the surrounding floodplains provide some fishing opportunitiesduring the high water period and a number of depressions that are fished during the low waterperiod.
The fishing opportunities on many of these fishing grounds are controlled in one way or another.The major leased areas, for which an auction takes place in March or April, are the three maintributaries into the lake and two deeper sections of the S.Kumpeh. There are also around 10

CRIFI / Dinas Perikanan / MRAG Monitoring Programme Implementation Report Page 21
floodplain depressions leased for sums of around Rp.50,000, which is equivalent to the valueof around 10-20 kg of fish at point of first sale. Rules relating to exploitation of the lake restrictaccess earlier in the year, before throwing it open for a one day fish drive, known as the HariBerkarang, during August. Members of the community may participate for a nominal fee. Forfishermen from other villages the fee is higher. Invited dignitaries are not required to pay. Allmonies raised, both from the auction of leases and from the Hari Berkarang, go to village funds.
Leased areas tend to be operated by groups of two to four fishermen, depending on size. Thecurrent leaseholders of the two sections of the S.Kumpeh reported that they do not plan to fishthese areas at all until water levels have dropped sufficiently to mount a series of large fishingoperations. An empang barrier is set diagonally across the river. This is joined to a U shapedcompartment adjacent to the bank at the up-stream boundary of the leased area. Fish are thendriven upstream towards the empang using a gill net hauled by a group of labourers, hired fora daily wage. When the fish are concentrated in the compartment, its open side is closed off.The fish are then removed using small lift nets. The proceeds from the sale of the fish are thendivided among the leaseholding group. There can be up to 11 such operations on these leasedunits.
Similar operations are mounted on the channels feeding into the lake. Though undertaken lessfrequently (around 4 times), their catches per operation tend to be high (1-3 tonnes). In addition,members of the leaseholding group may fish individually using a variety of common gearsduring the period of falling water. Catch revenues are shared only from the large fishingoperations.
Outside the leased areas, fishing is predominantly on an individual basis using active gearssuch as a tangkul (lift nets) and jala (cast nets). For much of the year, however, passive gears- pukat (gill nets), pancing (hooks), bubu and tembilar (traps) - are very important. Mostfishermen are resident in the village, though there are some from outside.
Implications for Monitoring Programme
The objective of the socio-economic monitoring programme is to estimate the flow of incomesfrom fisheries and evaluate the impact of access control on its distribution between differentstakeholder groups: the community at large, individual fishermen and leaseholders. It istherefore critical that the flows of income from the open access areas can be differentiated fromthose coming from areas in which fishing is controlled in one way or another.
The flows of income to the village from the lease auction and the fees from the Hari Berkarangare simple to calculate, being a matter of public record. Income earned by individual fishermenare relatively continuous. This will have to be estimated from weekly monitoring. Leaseholderincomes are hard to estimate from routine monitoring, as their group operations areconsiderably more complex and intermittent. Fishing by members of the leaseholding groupthat is undertaken on an individual basis and is spread over a longer period, however, shouldbe covered by weekly monitoring.
The resulting components and scheduling of the SEMP are explained in the following sections.
Monitoring Fishing Outside the Leasehold Areas
Sample frameThe Buku Indah Penduduk, the official record of households in the village, was not complete,having details of only 134 of an estimated 175 households. A list of all recorded householdswas compiled from the official record. A group of key informants, including the Kepala Desa,the Sekretaris Desa and four to five experienced fishermen were then asked to divide all listed

Page 22 Monitoring Programme Implementation Report CRIFI / Dinas Perikanan / MRAG
households into two groups: those that fished (76) and those that did not (58).
Respondent selectionThe names of fifteen household heads were needed: twelve for the survey and three to act asreserves if any of these were unable to participate.
Two options were considered. First, for the computer to assign a random number to eachhousehold by the computer, sort the records on this number and then take the required numberfrom the top of the new list. Second, to conduct an open lottery in view of members of thevillage.
It was decided that the latter option was preferable as it provided greater transparency to theselection process, reducing the possibility of resentment over inclusion or exclusion from thesurvey.
To avoid counting households twice within the overall estimation of fisheries benefits, it wasnecessary to exclude the 12 households with members of leaseholding groups (i.e. those takinga share of group catches or fishing individually on the leased areas) from the sample frame.Ideally, their names (or that of their household head) should have been removed from the list.This was not possible due to ambiguities in the information available about which householdssome group members belonged to. By conducting a public lottery to select respondents, it waspossible to ensure that such households were not wrongly included in the survey. In the eventthat their name was selected it was dropped and the draw was repeated. (See below fordetails of sampling of and within leaseholding groups.)
Information collectedInformation will be collected on time spent fishing and the magnitude and value of catch,together with a series of more detailed interviews relating to fishing costs other than labour. Theweekly monitoring will be undertaken by the Village Co-ordinator, using a questionnaire formthat has been kept as simple as possible. (This form and the english version of the noteswritten to accompany it are to be found in Annex X.)
Data is collected most easily on Fridays and Sundays, when fishermen are free. The numberof days fished within the previous week (Friday-Thursday) will be recorded but data on activitieswill relate to the last day on which fishing took place. This will bias the sample towards fishingdays that occur towards the end of the week - fishing on a Friday will only be recorded if it wasthe only day in the week on which fishing took place. This is less than ideal. Variousalternatives were considered. Recording catches relating to all days fished separately wasthought to result in too long an interview and too much work for both data entry and the VillageCo-ordinator (VC). Summarising was thought to be too difficult for the VC, who might have toaggregate data across days in which a variable number of fishermen were working together.Asking fishermen to record their catch on all days and then choosing the day entered by lotterybetween days was also thought to be too confusing.
This method will have the advantage of easing recall for fishermen. The fact that they tend notto fish at all on either Friday (holy day) or Sunday (leisure), rather than fish for a shorter period,reduced the chances of an upward bias to estimates due to under-representation of low catchdays occurring towards the beginning of the week. (This will be tested for.)
Cost information is to be collected from respondent households separately by CRIFI/MRAGstaff. This is considerably harder to estimate and enumerate accurately using routinemonitoring, as it requires a more flexible interaction with the respondent.

This can be allocated to months by splitting the income of weeks that include days from1
consecutive months pro rata to the number of days in each and adding this to the other weeksin the month.
CRIFI / Dinas Perikanan / MRAG Monitoring Programme Implementation Report Page 23
Calculation of open access fishing income Gross fishing income from each sampled household can be calculated for each week by takingthe number of days fished and multiplying this by the value of fish sold plus an imputed valueof fish consumed. Costs for the gear used, based on the more detailed respondent interviews,can then be deducted to give net fishing income per week . 1
Calculating the income to the village will require that the estimates from the sample are scaledup. The multiplication factor used is determined by the sampling procedure used.
Only 134 of the 175 households in the village are covered in the initial list used. Of these, 76fish. There is a high probability that some of the 41 households omitted also fished. If theproportion is similar to that of those included, there would be around 99 fishing households(76*175/134). There were 12 households with members of leaseholding groups. This impliesthe sample of 12 households represent 75 non-leasing fishing households. The multiplicationfactor is the inverse of the sampling ratio (75/12). This means the results from the samplesurvey need to be multiplied by 7.25.
Approximate estimates of income earned by fishermen from other villages will be based onmore detailed questioning of key respondents. Issues covered will be numbers involved, periodand gears used. Results of household monitoring within the village will be used to calculateincome from this data.
Monitoring Leaseholder Fishing
Sample frameEstimation of income flows from lelang (leased) areas is based on sampling the leased unitsand the households that control them. The main units in Arang-Arang are given in Table 4below. The first three are channels that drain the floodplain into the lake. The last two sectionsof the S.Kumpeh.
Table 4. Leased Waterbodies in D.Arang-Arang
No. Name of Waterbody Lelang Winner Lelang Value(Rp.)
1 Sungai Parit Muhtar + 2 others 1,823,500
2 S.Gelam Asnawi + 4 others 1,400,500
3 S.Buluram Maknur + others from same HH 850,000
4 Teluk (section of S.Kumpeh) Younus + others from same HH 499,995
5 Paro (section of S.Kumpeh) Sa’ad + 1 other 360,000
Respondent selectionIt would have been feasible to gather information on all units. However, with resources for thesurvey limited, it would then have been necessary to reduce the size of the survey of fishermenoperating in the open access areas. Sampling was therefore desirable.

Page 24 Monitoring Programme Implementation Report CRIFI / Dinas Perikanan / MRAG
Lelang auction values differ considerably. It is assumed that this reflects to some degree theincome that each can be expected to generate. As a result, simple random sampling of lelangunits would produce estimates with a high variance. Three units were chosen. One unit wasselected from S.Parit and S.Gelam, by tossing a coin. The same exercise was repeated tochoose between Paro and Teluk. In both cases the pairing was determined by the similarity inboth habitat and auction value. S.Buluram was chosen as the third site.
Information collectedIn initial interviews the current leaseholders indicated that they were willing to keep simplerecords of group operations for the project. Like the weekly monitoring of individual fishermen,the information recorded will include the size and value of catch and the number of additionallabourers hired. They will be encouraged to keep records of each operation, rather than asample of them. This will involve more work for the section of the S.Kumpeh, where operationsare more frequent.
This information will be supplemented later by detailed interviews on these operations and thecosts involved conducted by an DP/CRIFI/MRAG team at a later date.
Information on individual fishing on the leased area by one member of each of the three groupswill be collected using the weekly household monitoring form, as described above. ComplicationsThe leased units will be auctioned again during the sampling period. In the past control hasoften passed from one group to another. This is likely to happen here. This auction, unlikethat held in OKI in South Sumatera, does not take place on a fixed date each year. A returnvisit by CRIFI staff or very close co-ordination with Dinas Perikanan will be needed to persuadenew leaseholders to conduct self-monitoring and to include members of each group in regularweekly monitoring.
Monitoring the Hari Berkarang (Community Fish Drive)
Monitoring such a large operation in which so many participate on an individual basis is likelyto be difficult. Scientifically rigorous estimates are clearly not possible. A well reasonedapproach should, however, produce a credible figure that would contribute significantly towardsthe study. Fortunately, all those involved in the monitoring programme (VC and PC) are likelyto participate. This year, if water levels allow the event to happen, they should use theopportunity to devise a monitoring plan for next year’s event, which falls in the monitoring periodproper.
A record of the numbers buying tickets to participate (and an estimate of how many participatewithout tickets) might be combined with additional questions on the weekly monitoring or moreinformal questioning of participants at the time.
Calculation of Incomes from D.Arang-Arang: Summary
Fishing incomes generated within the village boundary area can be calculated as follows.
CRIFI / Dinas Perikanan / MRAG Monitoring Programme Implementation Report Page 25
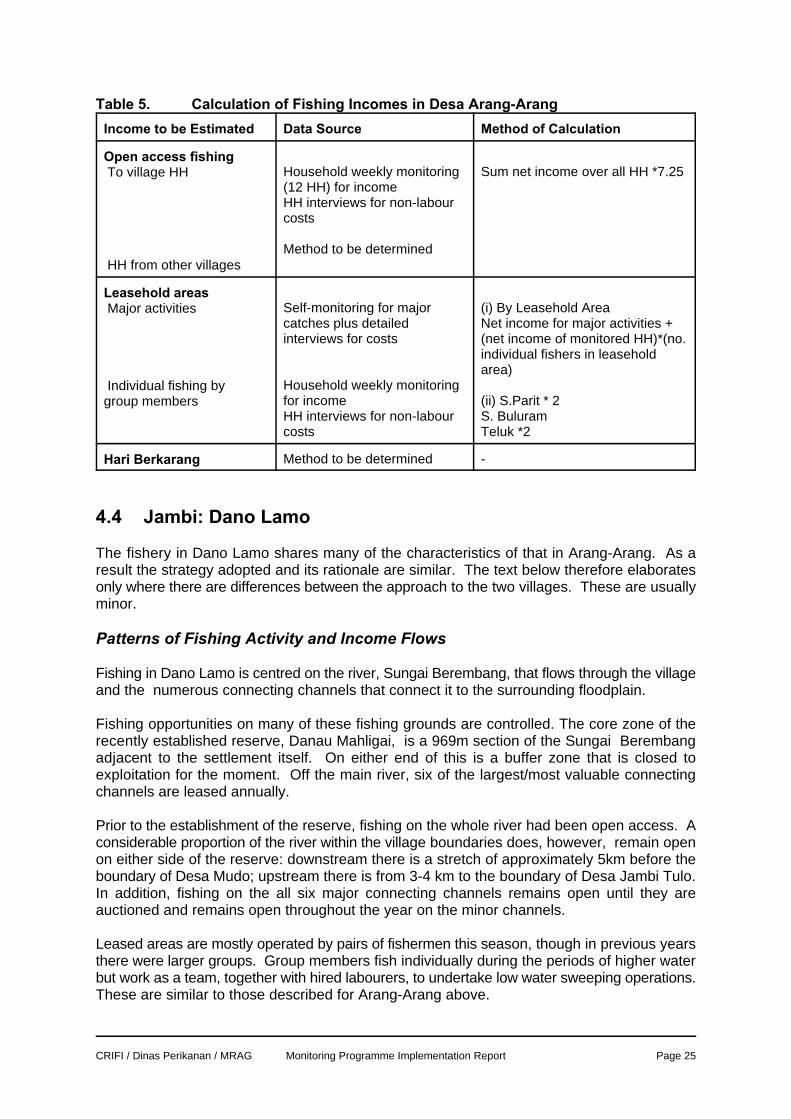
Table 5. Calculation of Fishing Incomes in Desa Arang-Arang
Income to be Estimated Data Source Method of Calculation
Open access fishing To village HH
HH from other villages
Household weekly monitoring Sum net income over all HH *7.25(12 HH) for incomeHH interviews for non-labourcosts
Method to be determined
Leasehold areas Major activities
Individual fishing by group members
Self-monitoring for major (i) By Leasehold Areacatches plus detailed Net income for major activities +interviews for costs (net income of monitored HH)*(no.
Household weekly monitoringfor income (ii) S.Parit * 2HH interviews for non-labour S. Buluramcosts Teluk *2
individual fishers in leaseholdarea)
Hari Berkarang Method to be determined -
4.4 Jambi: Dano Lamo
The fishery in Dano Lamo shares many of the characteristics of that in Arang-Arang. As aresult the strategy adopted and its rationale are similar. The text below therefore elaboratesonly where there are differences between the approach to the two villages. These are usuallyminor.
Patterns of Fishing Activity and Income Flows
Fishing in Dano Lamo is centred on the river, Sungai Berembang, that flows through the villageand the numerous connecting channels that connect it to the surrounding floodplain.
Fishing opportunities on many of these fishing grounds are controlled. The core zone of therecently established reserve, Danau Mahligai, is a 969m section of the Sungai Berembangadjacent to the settlement itself. On either end of this is a buffer zone that is closed toexploitation for the moment. Off the main river, six of the largest/most valuable connectingchannels are leased annually.
Prior to the establishment of the reserve, fishing on the whole river had been open access. Aconsiderable proportion of the river within the village boundaries does, however, remain openon either side of the reserve: downstream there is a stretch of approximately 5km before theboundary of Desa Mudo; upstream there is from 3-4 km to the boundary of Desa Jambi Tulo.In addition, fishing on the all six major connecting channels remains open until they areauctioned and remains open throughout the year on the minor channels.
Leased areas are mostly operated by pairs of fishermen this season, though in previous yearsthere were larger groups. Group members fish individually during the periods of higher waterbut work as a team, together with hired labourers, to undertake low water sweeping operations.These are similar to those described for Arang-Arang above.

Page 26 Monitoring Programme Implementation Report CRIFI / Dinas Perikanan / MRAG
Fishing by individuals is also similar to that undertaken in Arang-Arang, with a variety of activeand passive gears in use, each having a comparative advantage in different seasons,depending on fish behaviour and hydrology. Catches vary significantly through the year andare both lower and subject to more day to day variability in the high water period.
Fishermen from the village tend to fish outside its boundaries to a greater degree thanfishermen from elsewhere come in. The ratio was thought to be around 2:1. Most of the fishingwas done within the village.
Implications for Monitoring Programme
The objective of the socio-economic monitoring programme is to estimate the flow of incomesfrom fisheries and evaluate the impact of access control on its distribution between differentstakeholder groups: the community at large, individual fishermen and leaseholders. It istherefore critical that the flows of income from the open access areas can be differentiated fromthose coming from areas in which fishing is controlled in one way or another. Unlike Arang-Arang, where the Hari Berkarang gave some access to the reserve, the fishermen from DanoLamo are to be excluded permanently. This issue therefore reduces to a comparative analysisof income flows to leaseholding and non-leaseholding households.
Proposed Monitoring Programme
Methods for data collection and analysis proposed for Dano Lamo are similar to that for Arang-Arang: a survey of households doing open access (bebas) fishing is to be accompanied by asimilar survey of lelang group members undertaking individual fishing and self-monitoring ofmajor group operations.
The components and scheduling of the SEMP are as follows.
Monitoring Fishing Outside the Leasehold Areas
Sample frameThe Buku Indah Penduduk indicated that there were 182 households in the village. A list of allrecorded households was compiled from the official record. All listed households were thendivided into two groups: those that fished (77) and those that did not (105).
Respondent selectionThe names of fifteen household heads were needed: eleven for the survey and four to act asreserves if any of these were unable to participate.
Selection was undertaken by drawing numbers from a bag. This ensured transparency ofselection, reducing the possibility of resentment over inclusion or exclusion from the survey.
To avoid counting households twice within the overall estimation of fisheries benefits, it wasnecessary to exclude the households with members of leaseholding groups (i.e. those takinga share of group catches or fishing individually on the leased areas) from the sample frame.Ideally, their names (or that of their household head) should have been removed from the list.This was not possible due to ambiguities in the information available about which householdssome group members belonged to. By conducting a public lottery to select respondents, it waspossible to ensure that such households were not wrongly included in the survey. In the eventthat their name was selected it was dropped and the draw was repeated. (See below fordetails of sampling of and within leaseholding groups.)

CRIFI / Dinas Perikanan / MRAG Monitoring Programme Implementation Report Page 27
Information collectedThe information collected will be identical to that for Arang-Arang, see above for details.
Calculation of open access fishing income Calculation will be similar to that for households in Arang-Arang, though with a different raisingfactor, due to differences in the numbers of households in the village, fishing and in the sample.
The raising factor is derived as follows:
Fishing households in village 77Leaseholding households 10Non-leaseholding fishing HH 65Sample size 11
Raising factor=(77-10)/11=6.1
Leaseholder Fishing
Sample frameEstimation of income flows from lelang (leased) areas is based on sampling the leased unitsand the households that control them. In Dano Lamo, all leased areas are connectingchannels. Their names, sizes, auction values and the names of those that won the most recentauction are given below.
Table 6. Lelang Areas in Dano Lamo
No. Name of Waterbody Lelang Winner Length Lelang Value(Rp.)
1 Sungai Bayur Manaf and Bakar 200 m 1200000
2 Sungai Lampur Hadan Hasan 200 m 200000
3 S. Pematang and channel Samsudin and Muslai 50 m 40000connecting to S.Bayur
4 S.Keliling and S.Medak Muh. Saleh 500 m 60000
5 S.Lebar Muaro, S.Batang and M.Safri and M.Zen — 500000S.Sangko
6 S.Bungur and S.Puding Manan and Helmi 200 m 600000
Respondent selectionIt would have been feasible to gather information on all units. However, with resources for thesurvey limited, it would then have been necessary to reduce the size of the survey of fishermenoperating in the open access areas. Sampling was therefore desirable.
Lelang auction values differ considerably. It is assumed that this reflects to some degree theincome that each can be expected to generate. As a result, simple random sampling of lelangunits would produce estimates with a high variance. Four units were chosen. One unit was selected from waterbodies S. Pematang Kebun (no.3) and S.Keliling (no.4)above, by tossing a coin. The same exercise was repeated to choose between waterbodiesS.Lebar Muaro (no.5) and S.Bungur and Puding (no.6). In both cases the pairing wasdetermined by the similarity in auction value. S.Bayur (no.1) and S.Lampur (no.2) were chosenby default, as there was no other water body similar to either.

Page 28 Monitoring Programme Implementation Report CRIFI / Dinas Perikanan / MRAG
Information collectedThis will be similar to that collected to the auction units operated in Arang-Arang as describedabove. ComplicationsLike Arang-Arang, auctions during the survey period may well require that different householdsare substituted for those selected, so that estimates can be made of income from these areasover a 12 month period.
Calculation of Incomes from Dano Lamo: Summary
Fishing incomes generated within the village boundary area can be calculated as follows.
Table 7. Calculation of Fishing Incomes in Dano Lamo
Income to be Data Source Method of CalculationEstimated
Open access fishing To village HH Household weekly monitoring Sum net income over all HH *6.1
(12 HH) for incomeHH interviews for non-labourcosts
Leasehold areas Major activities
Individual fishing by group members
Self-monitoring for major areacatches plus detailed Net income for major activities + (netinterviews for costs income of monitored HH)*(no.
Household weekly monitoringfor income (ii) Raising factors for leasehold HH interviews for non-labour areascosts S.Pematang Kebun *2
(i) For each monitored leasehold
individual fishers in leasehold area)
S.Lebar Muaro * 2S.Bayur*1S.Lampur*1
4.5 South Sumatra: Teluk Rasau
The lake reserve selected for biological monitoring was Teluk Rasau. This is one componentof a large mosaic of lakes, swamps and flood forests that is drained by the Komering river thatruns north into Pedamaran, the principal desa within the kecamatan (sub-district). The area,which covers more than xx km , is deeply flooded for much of the year and supports a large and2
locally valuable fishery. Apart from a small section of the river running into Pedamaran, allfishing areas are leased for a full 12 month period.
Estimation of total income flows to Pedamaran was far beyond the scope of the funds availablefor the site and would have covered an area far larger than for the other reserves studied withinthe project. It was therefore decided to cover only the area adjacent the reserve itself.
Patterns of Fishing Activity
Fishing in this area is undertaken both by fishing groups and by individuals actingindependently. Broadly, groups operate barrier gears and undertake sweeping operations in

CRIFI / Dinas Perikanan / MRAG Monitoring Programme Implementation Report Page 29
the more open waterbodies, while individual fishermen operate smaller gears - traps, hooks andgill nets - in the more densely vegetated fringes. Where the swamp areas drain into moredefined channels, fishermen otherwise operating individually can jointly operate small barrierstogether with traps.
Barrier gearsThe tuguk is a barrier across the main channel, with one or two 3-4m gaps to allow thepassage of boats. It is solidly constructed of piles driven vertically into the riverbed supportedon either side by more slender poles set at an angle. On the downstream side of each sectionof the barrier, a massive log is horizontally mounted above the waterline on these poles, firmlyanchoring the structure. On the upstream side, the poles support a series of mats that preventthe fish passing through the barrier, except at the openings. A submerged bag net is set at themouth of each opening. This net is formed by sections of decreasing mesh size (from 4" atthe mouth, to 1" at its apex), and must be winched in. It is operational for 10-11 months in theyear but catches vary significantly. They peak between April and June, as fish are movingdownstream during the period of falling water. In this period tuguk can take between 100kg and1t per day, with the net being hauled hourly. During the rising flood, usually in November,catches of 70kg per day are common. Between these peaks, there are no migrationalmovements of fish and catches are very low (1kg/day).
The very solid construction of the barrier implies substantial capital costs (particularly in labourtime).
Another barrier gear is the kilung. These can be set either on the main channels, like the tuguk,or on smaller connecting channels. Empang are used to channel the fish to the mouth of thenet, which has a long box like shape and extends around 10m downstream from the fence. Thenet is supported in the water by bamboo poles driven into the river bed. Fish accumulating atthe downstream end of the net are scooped out. Its function and objective is identical to that oftuguk. The only difference lies in its frailer construction, making it more suited to river/channelsections with weaker flows. The timing of its catches are therefore identical.
In areas with even slower flows another means of taking advantage of fish movements is theuse of pengilar traps in conjunction with an empang. The latter blocks the fish, which then takerefuge in the traps.
Sweeping operations (Ngesar)The ngesar is a sweeping operation using kerakat (seine nets) and empang (movable bamboofence), when water levels permit. The ngesar is usually being conducted in August andSeptember; however, it may change from year to year depending on the period of dry season.The activity can also be undertaken either in river sections or in floodplain depressions, withslight variations in procedure.
In rivers it is often done from boats, and the operation becomes feasible when the water depthis around 2.5m. The empang is erected diagonally across the upstream end of the channel,with a three sided enclosure (rumah ikan) adjacent to the bank at the top. A seine net is thensecured to block the downstream end of the channel. Around 15m upstream, a second net issimilarly installed but with a small gap at one end. From the opposite corner of the chamber,fishermen in boats then advance driving the fish in front of them by thumping the river bed withlong bamboo poles. Once the chamber is clear, the gap at the end of the second seine isclosed and the first net is moved to form a new chamber and the process is repeated. Thiscontinues until the fish have been driven into the prepared enclosure at the upstream end ofthe section. Fish are then removed as required for passing traders. There will usually be 1 or2 such ngesar operations each year. Total catch from the first operation can reach 12t (LubukLampam, 1994); 4t is common. Total catch from the second operation is usually much lower,

Page 30 Monitoring Programme Implementation Report CRIFI / Dinas Perikanan / MRAG
around 1t.
In the floodplain depressions, the fish are often driven by people on foot, so water depths above1.5m make the operation difficult. Otherwise the procedure is similar, with the area beingdivided into sections, each being cleared sequentially before all the fish are finally driven intothe empang enclosure.
Gear investment depends on the size of the structures required but is clearly substantial. Onerespondent indicated that his group had used around 100 empang panels (4m x 2.5m), eachof which would have taken one man around two days to make and last only three years. Thekerakat now cost over Rp.600,000 for a 100m section.
Individual fishingMost individual fishing took place in the more heavily vegetated areas. The most commongears were pengilar (traps) and tajur (hooks), though gill nets were also used. Catches wereoften taken from gears set overnight. The amount caught varied through the year but 2-3kgwas often cited as the normal range. Income distributionThere was some individual fishing on the main river sections. One fisherman concentrated oncatching baung using three rawai (long lines), set at the edges of the river. Each was composedof around 100 hooks set 2m apart and baited with small fish. He fished from March toDecember. It was estimated that he might catch 2-3kg/night.
As the entire area surrounding Teluk Rasau is leased, none of the fishing described above isopen access, everyone has to pay to fish in one way or another. Leases are given for distinctareas, lelang units. These may be discrete river sections, lakes or floodplain depressions.Often, however, a single unit will consist of one principal type of habitat together with smallerfragments of other habitat types. For instance, a lelang unit on a river section may includefringing areas of swamp and any former meander bends that have formed oxbow lakes. It iscommon practice for lelang units to be subdivided by the lessee, with each being operatedindependently and often differently, according to habitat type. Teluk Rasau is connected to S. Lempuing at the boundary of two lelang units, Sungai Aur(downstream) and Laut Sekampung (upstream). A third unit Pulau Benawo, which is anadjacent floodplain area, is also thought to be sufficiently closely connected to Teluk Rasau tobenefit significantly from the enhancement of local fish stocks by the reserve. Summaryinformation on these units and the sub-units into which they have been divided for operationalpurposes this season are given in Table 8 below.

CRIFI / Dinas Perikanan / MRAG Monitoring Programme Implementation Report Page 31
Table 8. Lelang Units Adjacent to Tuluk Rasau, and their Sub-divisions Water body Sub water body and Operating Group & Licenced Individuals &
cost Gear Gears UsedSungai Aur Lebung Sungai Aur 8 members 1 individualRp.16m (river section) kilung, tuguk rawai
Rp.13m kerakat , jala Fee Rp.300,000/yrLebung Kumpai and 7 members 8 individualsSelebar Utang kerakat Sengkirai, jaring, tajur, jaring(river section) empang pendek (roket)Rp. 4m Fee Rp.400,000/f/yr
Laut Lebak Leaseholding fish trader 14 individualsSekampung (floodplain No group fishing tembilar,jaring,tajurRp.9m depression)
Rp.4.5m Fee Rp.400,000/f/yrBatanghari Ulu 5 members No individuals(river section) krakat, empangBatanghari Ilir 4 members No individuals(river section) tuguk ,krakat,Rp.4m empang, jala
Pulau Lebak 8 members 7 individuals (also groupBenawo, (floodplain empang members)Rp.2.6 depression) pengilar pengilar, tajur,
Rp.200,000/f/yr(ad hoc)
Groups obtain complete control over a lease unit or sub-unit. The amounts paid for each areindicated in the Table above. The type of fishing that will take place is largely determined bythe opportunities made possible by the habitat type and water depth. River sections with limitedfringing vegetation may only be suited to group operations, barrier gears and/or ngesar.Repayment of the lease then has to be made entirely from the proceeds of these activities.Where a unit has areas of denser vegetation, particularly away from the main river, individualfishing is more advantageous. A group may therefore allow some fishermen to operate therein return for a fixed annual fee. In some cases this will be a small supplement to their mainincome, in Lebung Sungai Aur, the fee paid by the single individual would represent only 2.3%of the lease cost. In contrast in the lebak area of Laut Sekampung, only individual fishing tookplace, with licence fees generating 20% more than the lease cost (the sub-leaseholder alsobenefited from trading the fish caught). As an intermediate position, individual licence feesgenerated 80% of the lease cost on Lebung Kumpai, with the group’s ngesar generating furtherrevenue.
For operating groups the high capital outlays on both the lease and for barrier gears and ngesaroperations mean that the final distribution of income between group members has to wait to theend of the fishing season. Poorer members of the group will usually require loans from theleaseholder to support their families during the season. All accumulated debts, share of leasecosts and other operating costs must then be deducted from any share of receipts. A detailedset of records is kept to do this.
Where the group needs additional assistance for ngesar, casual fishing labour may be hired.This can be on a profit share basis. On Batanghari Ilir, eight additional labourers were needed.These shared 50% of the profits between them, with the balance being split equally betweenthe four group members.
One respondent indicated that his share from fishing a river section last year was Rp.5m, afigure with which he was very happy. But overall profit share will vary significantly with thesuccess of fishing due to the high capital costs. Other respondents, encountered on a previousvisit, claimed to have remained in debt to the leaseholder at the end of the season.

Page 32 Monitoring Programme Implementation Report CRIFI / Dinas Perikanan / MRAG
Implications for Monitoring Programme
The types of income flows from fishing activities in this area are generally similar to those inJambi, with the exception of the barrier gears. These are more complex as they combine highlevels of capital expenditure with extended periods of daily catch that show sharp seasonalvariations. As a result, the division of profit takes place at the end of the season. The recordskept for this purpose may prove particularly valuable, if they are made available. Leaders ofthe fishing groups generally indicated a willingness to co-operate with the project and to eitherensure that their own records included all the information needed or to keep a separate record.Complications will arise, however, as the survey period (October 98 - September 99) does notmatch the period over which records are kept (February-October/November).
Monitoring of the catches of licenced individuals will be similar to Jambi, except that there willbe no single sample frame. In Jambi, the frame was all the households thought to fish withinthe village. Here, each sub-unit in which individual fishermen operate will require its own frame. Proposed Monitoring Programme
To assess the income flows from the area adjacent to Tuluk Rasau it will be necessary to deriveindividual estimates of all the sub-units of the three leased areas. As in Jambi, this requires acombination of self-monitoring by (sub-)leaseholders and weekly household monitoring ofhouseholds operating on an individual basis. The overall programme is summarised below.
Table 9. Proposed Socio-Economic Monitoring Programme for Tuluk Rasau AreaWater body Sub water body and Group Activities Individual Fishing
cost Sungai Aur Lebung Sungai Aur Self-monitoring by group WHM of only fisherman
record keeper
1
Lebung Kumpai and Self-monitoring by group WHM of 3 of the 8Selebar Utang leader fishermen
Laut Lebak No group activities EITHERSekampung Records of leaseholder
ORWHM of 4 of the 14fishermen
Batanghari Ulu Group leader unable to No individuals operatingco-operate
Batanghari Ilir Self-monitoring by group No individuals operatingleader
Pulau Lebak Self-monitoring by group WHM of 3 of the 7Benawo, leader fishermenWHM indicates weekly household monitoring1
Monitoring of Individual Fishing
For all sub-units where individuals operate income will be estimated using weekly householdmonitoring(WHM), except possibly in the Lebak section of Laut Sekampung. In this area theleaseholder, to whom all the individuals sell their catch, was keen be part of the programme andto make his records available. If problems arise with this arrangement, four individuals of the14 operating group fisher in his area will be included in the WHM.
Sample framesA separate frame was constructed for each of the relevant sub-units. This was a list of theindividuals licenced to operate this year in each.

CRIFI / Dinas Perikanan / MRAG Monitoring Programme Implementation Report Page 33
Respondent selectionIt was not possible to return to each sub-unit to draw the names openly, as had been done forthe villages in Jambi. Instead, every third name was taken from the list for each sub-unit.
This process will have to be repeated at the start of next year, if the individuals permitted to fishchange following the auction.
Information collectedThis will be slightly simpler than that collected in Jambi, as questions relating to group sizehave been eliminated. The enumeration procedure will be identical.
Calculation of individual fishing incomesTotals will be calculated for each sub-unit, using the inverse of the sampling fraction as theraising factor.
Self-monitoring of Group Activities
Lease and sub-leaseholders will be asked to maintain records in the a way similar to Jambi andto make their own records available where possible. Due to the more continuous catchescoming from tuguk and kilung maintenance of records will be more a matter of routine than anoccasional task. To assist them in maintaining this routine, regular contact with the Village Co-ordinator is to be encouraged by the collection of the form every two weeks.
The form to be used is attached. It is more complex than the one devised for Jambi, but it willbe emphasised to the group leaders that it is only the first columns relating to amount and valueof sales that are critical. Calculation of Incomes from Fishing in the Area of Teluk Rasau: Summary
The WHM and the self-monitoring by leaseholders/groups will produce detailed information onthe revenues from fishing. The WHM will also generate information on time spent fishing. Costestimates will also be needed.
A full breakdown of costs will have to be determined by further interviews aided, whereverpossible, by the groups own records. It is important that these interviews are done well. Inparticular, the first interviews covering the use of any gear or operation should be verythorough, so that no hidden labour costs are omitted. This can easily happen for any of themajor operations requiring structures that have to be prepared in advance. Time spentassembling gears, such as seine nets, can also be easily forgotten.Once the process is fully understood a checklist can be prepared and subsequent interviewsconducted much more swiftly.
Total income flows should be estimated for each sub-unit before aggregating to the unit andthen to the total area.

Page 34 Monitoring Programme Implementation Report CRIFI / Dinas Perikanan / MRAG
Table 10. Calculation of Incomes for Teluk RasauLease Unit Sub-unit and Group Activities Individual Fishing
cost Sungai Aur Lebung Sungai Self-monitoring record of WHM less costs derived
Aur income less estimates of costs from detailed interviewfrom detailed interview
Lebung Kumpai As above As above * Raising factor ofand Selebar 2.66Utang
Laut Lebak No group activities. EITHERSekampung But possible recording of Records of leaseholder
individual catches ORAs above * Raising factor of3.5
Batanghari Ulu Possible extrapolation from -ngesar elsewhere
Batanghari Ilir Self-monitoring record of -income less estimates of costsfrom detailed interview
Pulau Lebak As above As above * Raising factor ofBenawo, 2.33
4.6 South Sumatra: Benawa
Benawa village is the closest settlement to Lebak Nilang, the waterbody chosen for monitoring.It is a large village with over thousand households and its fishermen also operate across a largenumber of other waterbodies. The earlier survey identified these as the river Komering, thedesa canal and a series of lakes of varying size: Air Hitam, Anak Jele, Anak Kemang, LebakCanduy, Teluk Netani, Lebak Kalup and Muaro Duo. This fishery was operated by a complexmixture of leasing, sub-leasing, licencing and open-access fishing. Providing a comprehensiveassessment of income flows to the village from fishing appeared over-ambitious, particularlyas the locally recruited village co-ordinator was untested in his commitment to the project. It wastherefore decided simply to assess the value of fishing incomes from the lake itself.
Patterns of Fishing Activity
Lebak Nilang is large and its dry season depth is 5m and vegetation cover make it difficult tofish out by any co-ordinated operation, such as ngesar. Most fishing activity in the lake isundertaken by individual gill net fishermen. Tajur (hooks) are used to catch fish in the fringingvegetation. Two different estimates of the number of households involved put the figure at 40and 25.
There are two kilung operated by groups on channels leading from the lake. One of thesechannels connects to an area that has recently been turned into an oil palm estate. It isreported that the kilung catches in the channels have been declining significantly since.
The lake was originally operated under the lelang system. This was suspended when it wasdecided thatit would become a reserve. It now has an unusual intermediate status beingmanaged by the head of the desa adjacent to Benawa. The gill net fishermen and the kilunggroups operate under licence from him. The fishermen using tajur in the adjacent vegetationdo so without legal status.

CRIFI / Dinas Perikanan / MRAG Monitoring Programme Implementation Report Page 35
Implications for Monitoring
Fishing with hooks by individual fisher is illegal in Lebak teluk Nilang; however, many individualfisher still fish in that area by using such the gear. This fact poses problems as householdsasked about such fishing may be evasive or misleading. The fact that such fishing may berelatively widespread means that an important component of overall catch may be missed asa result.
The virtues of weekly household monitoring and means of providing alternative estimates of thenumbers of illegal fishermen were actively considered. The bias introduced by the technicalillegality of fishing was of uncertain strength. Individual fishing with hooks was widelyacknowledged and accepted within the village and there had been no recorded prosecutions.It was concluded that weekly monitoring could be attempted for these households but thatcross-checking of some sort on the number of man days would be essential.
Methods of introducing such cross-checks of the levels of tajur fishing into the weeklyhousehold monitoring form used by the gill net fishermen were considered. While both typesof fishermen set their gear and collected their catch at the same time, it was felt that muchactivity on the lake margins would not be visible due to the height and density of the vegetation.
Proposed Monitoring Programme
A combination of weekly household monitoring is proposed for three of the eight gill netfishermen and a sample of 12 of the 40 households fishing with tajur on the lake. Estimatesof the level of tajur fishing will be cross-checked at a later stage using alternative interviewtechniques. The final estimate will be used together with any information on catch rates toprovide an approximate indication of total catch.
Both kilung groups will be asked to undertake self-monitoring.
4.7 West Kalimantan: Desa Sekolat
The lake reserve selected for biological monitoring is Danau Batu. It is believed that benefitsof the reserve may be enjoyed by Sekulat people. The area has approximately xx km2, whichalmost contains water for the whole year and supports widely and locally valuable variety of fish.Water floods into the village waterbodies from Kapuas river during wet season, bringing newlyspawned fish caught in traps. In the dry season, water drains from lake into Belitung river, thenvia Tawang river back to Kapuas river. Adjascent area to Danau Batu is germinated by manytrees, such as mangrove forest (rawang forest) which is believed as a buffer zone. Fishingactivities surrounding those areas (outside of Danau Batu) were done by many fishers,especially for those coming from Desa Sekulat.
Patterns of fishing activity and income flows
There are two types fishers in Sekolat village, namely individual and group fishers. Mostindividual fishing took place in the more heavily vegetated and rawang forest areas, adjacentof reserve, also in the river and lake that is not functioned as reserves. The most commongears used were jala (cast net), pancing/utas (hooks), pukat (gillnet), rambai (hook and lines),bubu (traps), jermal (partial barrier traps), tembilar (portable traps), tabung (traps forornamental fish) and pesat/anco (lift net). On the other hand, group fishers mostly use jermalto catch variety of fishes (consumed and ornamental fishes). Individual fisher usually operatetheir gears in the fishing ground of Belitung river and many small lakes, such as D. Sekolat, D.

Page 36 Monitoring Programme Implementation Report CRIFI / Dinas Perikanan / MRAG
Genali and D. Semangit. Group fishers operate their traps in the main river, that is, Belitungriver. There are 32 locations for groups of jermal for catching the ornamental fish, the namesof those locations are as follows : 1) No name, 2) No name, 3) Tanah Pak Dayat, 4) Tanah PakDayat, 5) Lubuk keramat, 6) Makam Keramat, 7) Tanjung Gamang, 8) Tanjung Karet, 9)Tanjung Asam, 10) No name, 11) Teluk Ara, 12) Timbak Tawang, 13) Karet Sadan, 14) TelukJambul, 15) Lubuk Tanggalan, 16) PT Yunus, 17) Tanah Haji Fei, 18) Nanga beban, 19)Senentang Nanga, 20) Seberang Tamang, 21) Tanjung Bedil, 22) Tanjung Sawal, 23)Marbakung Besar, 24) PT Anam, 25) Tanjung Belantik, 26) Marbakung Kecil, 27) Bulu Tikus,28) Tanjung Bekakak, 29) Kawit Semang, 30) Kawit semang, 31) Lebak Mutung and 32) LebakMutung. Lottery system for fisher of jermal was conducted in 6 times/year (3 times in dryseason and 3 times in rainy season). There are 2 steps in lottery system: the 1st step choicethe back numbers (nomor punggung) and the second taking the number of locations (nomorlokasi) given the name to determine who will be leaseholder of jermal ornamental fish catch.The lottery winner pays Rp.15,000,- for location numbers of 1 and 2, another locations from3 to 32 pays Rp.1,500,- respectively. Number of locations 1 and 2 located at the upper-streamof the village and the way of setting jermal at the edges of river. If fisher loss in the lotterysystem, his money was returned to the fishermen.
Sharing from fishing activities by using jermal was divided to become ratio 40% for owners and60% for hired fishermen. Example for this case : The owner of jermal hired 3 fisher, fromcatchs, they got 100 fish (ulang uli), the system use to share the fish catchs was owner : 3hired fisher : owner as functioned hired fisher = 20% : 60% : 20%. For consumptive fish, therewere 11 locations for setting jermals, the names of those location are follows : 1) TanjungTamang, 2) Marbakung besar, 3) Marbakung kecil, 4) Keramat, 5) Mutun, 6) Nanga Sekolat,7) Nanga benali, 8) Duben, 9) Pintas sebuya, 10) Pintas sekali and 11) Pinanga Bayau.
Implications for the Monitoring Programme
The objective of the socio-economic monitoring programme is to estimate the flow of incomefrom fisheries and evaluate the impact of access control on its distribution bet ween differentstakeholder groups. The community at large are individual fisher and lease holder of jermalfrom lottery system. It is therefore critical that the flows of income from the open access areascan be differentiated from those coming from areas in which fishing is controlled in one wayor another. The flows of income to the village from the lease lottery system. Income earnedby individual fishermen are relatively continuus. Both activities will have to be estimated fromweekly monitoring. A longer period of toman or betutu cage culture would be covered byweekly monitoring.
Proposed Monitoring Programme
Sample FrameAccoding to Ketua Nelayan, the number of household recorded was about 167 KK (household),however, detail information about the number of fisher could not be found. It is believed thatan approximately 95% of the household are fishers of which using various types of fishinggears.
Respondent SelectionFifteen fisher households representing individual and group of fishers were randomly selected.The names and code of fifteen household who participated as respondent was presented inAnnex 1. They (respondents) were selected based on the lottery system.
Information collected Information from free individual fisher - Agus Sumarno, He used jala (castnet) and rabai (longlines) for fishing. Fishing activity by using jala ussually took place in dry season (May, June and

CRIFI / Dinas Perikanan / MRAG Monitoring Programme Implementation Report Page 37
July), start fishing from 08.00 (morning) to 15.00 (afternoon), total time spent fishing used 7haurs and the amount caught varied through the 3 months lest than 8-12 kg/day. Rabai (200hooks) also took place in dry season, its activities was started to looking for the baits andsetting 06.00-14.00 = 8 hours, and then checking tomorrow afternoon from 14.00 to 16.00 = 2hours, sothat total times spent fishing = 10 hours, the average fish caught varied from 15 to 16kg/day. Information from the leaseholder of jermal for catching the consumptive fish (BapakIbrahim). He operated 2 jermal in dry season of the 1997 the fish caught from fishing activitiesusing 2 set jermal = 50 kg/day, pukat (20 bal) = 20 kg/day, takan/tajur (200 hooks) = 10 kg/day,tembilar (100 traps) = 10 kg/day and bubu (8 traps) = 20 kg/day.
4.8 West Kalimantan: Meliau Village
Patterns of Fishing Activity and income flows
It is believed that lake which is functioned as reserve in this village is Danau Balaiaram in whichall fishing activities were banned. Fishers were only allowed fishing outside the reserve, i.e.,: Danau Lukuh, Danau Tujuh and other waterbodies (floodplain forest adjascent reserve andin the small channel connecting the Laboyan River that passes through the village. Thesurrounding flodplain closely at the reserve provide some fishing opportunities during the highwater period, and also a number of it that are fished during the low water period. Fishingregulation was affirmed by "Hukum Adat" fully obeyed by local communities, mainly by fishers.Fishing gears operated in some waterbodies (except Danau Balaiaram) were : pukat (gillnet),jala (castnet), pancing (hooks), rabai (long lines) and bubu (traps).
Implications for the Monitoring Programme
As indicated earlier, socio-economic monitoring programme aimed at estimating the flows ofincome from fisheries and evaluating the impact of access control on its distribution betweendifferent stakeholder groups. In the case of Meliau, the term of stakeholder is straight forward,hence selection of sample responden would be simple.
Proposed Monitoring Programme
Sample FrameAccording to village record, total number of household in the Meliau Village was approximately36 KK (household) of which considered as fishers. It was previousely observed that fishing wereapproximately only 25 per cent of their total annual household work, but it approximatelyproduced 40 per cent of income.
Respondent SelectionFifteen household were randomly selected from the total household. The selected respondentsparticipated in the monitoring programme were presented in Annex 2. They were selectedbased on the lottery system.
Information collectedInformation will be collected on the basis of time spent for fishing and the magnitude and valueof catch, together with series or more detailed interview relating to fishing cost and fishing gearsused. For example: information from Pak Lajang mentioned that time spent fishing for rabai(300 hooks) was about 10 hours (06.00-16.00) and value of catch was varied 20-30 kg/day.Pukat-180 meters length (setting : 06.00-08.00), (checking : 14.00-16.00), total time spentfishing = 4 hours and fish catchs = 25-40 kg/day. Jala (2 sets) was ussually used to look forthe baits (08.00-10.00) = 2 hours and fish catchs = 5 kg/day and bubu (10 traps) from 06.00 to
Page 38 Monitoring Programme Implementation Report CRIFI / Dinas Perikanan / MRAG
16.00 (10 hours)- fish catchs = 20-30 kg/day.
4.9 West Kalimantan: Pulau Majang Village
Patterns of Fishing Activity
Condition of waterbodies at Desa Pulau Majang is more specific compared to others (Sekolat,Meliau and Tengkidap). Imformation from Kades and some fishers indicated that water will onlybe existed on the channels (main river) in dry season and flood in rainy season. Fishing gearscommonly used by fishers are jala , pukat, rabai, bubu, tabung, takan/tajur and sauk (scoopnet). Jala, pukat, takan, rabai and sauk can be used in all season (dry and wet/rainy), but thesegears is often used in dry season from May to August. Tabung is usually used in flood/ highwater level taken place in the months of December up to February. Bubu was settled duringdry season using empang made from bamboo. Locations for setting bubu had to be lottery(lottery system) and the winners would had to pay Rp.10,000,- per dry season.
Implications for the Monitoring Programme
Socio-economic monitoring programme intended to investigate the flow of income from fisheriesand evaluate the impact of access control on its distribution between different stakeholdergroups. Consequently, individual and group of fishers in the village will be treated asrespondent candidates for monitoring purposes. Incomes earned by individual fishermen arerelatively continuous. This will be estimated from weekly monitoring.
Proposed Monitoring Programme
Sample FrameThe numbers of household in the Pulau Majang Village was around 175 KK + 22 KK of DusunEmpaik. However, only 150 KK could be classified as fishers, and only 50% of 150 KK workedon fishing regularly and actively.
Respondent SelectionThe names and code of fifteen household (respondent) that participated at Pulau MajangVillage was presented in Annex 3. They were randomly selected based on the lottery system.
Information CollectedInformation will be collected on time spent fishing and the magnitude and value of catch,together with a series or more detailed interview relating to fishing cost and fishing gears used.Information about the gears exsisted and time spent for fishing came from Kades and somefisher. For example : 1) pukat (setting 04.00 early morning - 07.00 morning) and (checking10.00-11.00), time spent fishing was 4 hours. 2) tajur/takan (300 hooks) - time activities from06.00 to 12.00 (6 hours). Bubu- time activities (setting 07.00-08.00 and checking next day inmorning from 06.00 to 07.00, total time spent fishing 2 hours. 3) rabai (200 hooks) setting forlooking the baits 07.00-11.00 in the morning and checking 05.00-10.00 the next day in themorning, sothat total time spent fishing 9 hours.
4.10 West Kalimantan: Desa Tengkidap
Patterns of Fishing activity and Income Flows
Tengkidap Village was a small village which could be called a "temporary fishers’ village". They

CRIFI / Dinas Perikanan / MRAG Monitoring Programme Implementation Report Page 39
lived there just for fishing. Waterbodies functioned as reserve was Danau Seliban, that locatedat the right side of the village through the Tengkidap River and via Batang Seliban Channel.The Seliban lake can be reached approximately an hour by using motor boat. The patterns offishing activity and condition adjascent of reserve was almost the same as the reserve of DanauBalaiaram. However, the Seliban lake has terrestrial land (small island) in the core side. Fishinggears operated in various waterbodies, mainly in Batang Seliban, S. Tengkidap and smalltributaries were : jala, pukat, bubu and rabai.
Implications for the Monitoring Programme
The objective of the socio-economic monitoring programme is to estimate the flow of incomefrom fisheries and evaluate the impact of access control on its distribution bet ween differentstakeholder groups. The community at large and to individual fishermen. It is therefore criticalthat the flows of income from the open access areas can be differentiated from those comingfrom areas in which fishing is controlled in one way or another. Income earned by individualfishermen are relatively continuous. The activities will have to be estimated from weeklymonitoring. A longer period of toman or betutu cage culture could be covered by weeklymonitoring.
Proposed Monitoring Programme
Sample FrameThe numbers of household at the Tengkidap Village was approximately 44 KK. All KKs wereconsidered as fishers and only stay there for the purpose of fishing.
Respondent SelectionThe names and code (Number Seri KK) of fifteen household that participated as respondentwas presented in Annex 4. They were randomly selected as respondent based on lotterysystem.
Information CollectedInformation about the gears and time spent fishing came from Ketua Nelayan and some fisherscaught in open waters at Tengkidap Village. Compared to three observed village before(Sekolat, Meliau and Pulau Majang), the time spent for fishing using the same gears weresimilar.
4.11 Comparative Analyses
The results of the surveys will provide a breakdown of costs and returns to fishing and thedistribution of economic surplus between stakeholder groups in the eight villages/areas.Comparisons will be made of total catch and total economic surplus relative to the area of thewaterbodies, the number of fishermen active and the number of man days spent fishing.
Clearly, it would inappropriate to attribute the differences identified simply to the characteristicsof the local reserves. Rather, these comparisons will help document differences in outcomesfrom the interaction of the fisheries management system operated in each area with thehydrological and environmental characteristics of its river-floodplain system. So, while thequantification of the economic impact of reserves is not feasible, the study should provideinsights on a range of issues critical to the development of co-management in Indonesia. These issues include :
C the influence of access control on the type and timing of gear effortC the influence of access control on outcomes for stakeholders (individual fishermen,
Page 40 Monitoring Programme Implementation Report CRIFI / Dinas Perikanan / MRAG
leaseholders, government)C the influence of current management arrangements on the incentives to conserve fish
stocksC the influence of the management system on the range of alternative management
measures that are feasible and the likelihood of their acceptance C the dependence and vulnerability of different stakeholder groups to alternative changes
in management rulesC alternative co-management models appropriate in each area

CRIFI / Dinas Perikanan / MRAG Monitoring Programme Implementation Report Page 41
5. Future Inputs to the Monitoring Programme
5.1 Summary of Monitoring Programme Schedules
The timetable of activities for the Monitoring Programmes are summarised in Table 11. Boththe BMP and SEMP will begin in August 1998, and continue up until the end of September1999. August and September 1998 will be considered training periods for both programmesbefore the main 12-month annual cycle from October 1998 up to September 1999. The BMPmay also generate important dry season data in these early months though.
The BMP will be supported by the Partial BMP at the Sumsel study sites during both the dryseasons in 1998 and 1999. The overall programmes will be supported by the InstitutionalAnalysis phase, planned for February / March 1999.
Table 11. Timetable of Monitoring Programme and other remaining project activities
Activities 1998 1999 2000AM J J A S O N D J F M A M J J A S O N D J F M
Biological Data Collection Survey design & field staff training Interviews etc Gill net fish abundance survey Partial Biology MPs in SumselSocio-economic Data Collection Survey design & field staff training Respondent interviews Interviews etcInstitutional Analysis Interviews etcData Analysis Data entry & analysis Joint MRAG / CRIFI AnalysisDissemination & Training Preparation of guidelines X Translation of guidelines Dissemination / training activities
5.2 Future Inputs and Responsibilities for the Biological MP
The following notes summarise the additional inputs required to implement and manage theBMP at all the study sites, and the responsibilities allocated to different project personnel.
Overall Responsibilities
Sonny Ensure that all inputs by various Indonesian staff are fully implemented as listed below
Agus Ensure that data sheets etc are received successfully from Herman (Jambi) and Asmara/ Rooslan (Sumsel)
Page 42 Monitoring Programme Implementation Report CRIFI / Dinas Perikanan / MRAG
Sonny Ensure that data sheets etc are received successfully from Andi (Kalbar)
Final Activities at Sumsel sites
Agus Monday 10 - Wednesday 12 August: Do second gill net fishing / training for GNF / VCsth th
Deliver Instruction manuals + 112 data forms (8/month * 14 months)Ensure all job requirements fully understood
Sonny Write & deliver publicity materials (not amended for biology, since same as at Arang Arang,apart from compensation - it was agreed that the project would give Rp1m to Diskan forthem to use to restock the reserves after the study)
Asmara Friday 14 : Announce programmes at Pedamaran / Benawa mosques (delay one week toth
allow finalisation of Socio-economic programmes and inclusion in publicity material)
Agus Do 4 more historical biology interviews at Laut Sekampung, or other nearby waterbody
Kalbar Trip
Team Implement MP at 4 study sites, using checklists (Table 3) to ensure all complete
Agus Train Andi in gill net data entry using project spreadsheet, and give copies of spreadsheettemplate / format
Achmad Arrange to set up water height gauge in Meliau village only, and instruct to use gauge atDSWR field station for other three villages.
Achmad At end of trip, send copies of Instruction Manuals given to each village to DH at MRAG,including maps of gill net positions in each waterbody.
Financial Arrangements
Dan Discuss additional funding requirements with Novenny (from MRAG or CRIFI budget dueto increased exchange rate?)
C Additional Rp0.5m committed for compensation payments (2 Sumsel sites, + 4 Kalbar sites)
C Additional Rp0.2m required for depth gauge at Meliau sites in Kalbar
C Additional Rp0.1m required for depth gauge at Lebak Nilang (0.1m already paid up front)
C Additional Rp17.28m required to implement Partial BMP in SumselBudget breakdown: 3 field days per week for 8 weeks (gill nets) & 1 week (cast nets)Programme to be implemented in both 1998 and 1999 dry seasonsper diems of Agus (Rp130,000/day), Herman (Rp90,000/day) and Andri (70,000/day)Transport allowances of Rp30,000 per week each
C Additional ??? for improvement of DFID-supplied computer at Mariana
Sonny Prepare final budget revision at end of MPI field trip to Kalbar indicating requirements fordifferent programmes in each site. Send to Novenny & DH for discussion.
Dan Request Novenny to inform Sonny when compensation budgets will be sent from CRIFI toDiskan, for their delivery to the villages.
Sonny Ensure that funds are paid to Diskan and that compensation payments are received byvillages as agreed.

CRIFI / Dinas Perikanan / MRAG Monitoring Programme Implementation Report Page 43
Estimation of Study Site Waterbody Areas
Sonny Contact WI-IP to request information about (or copies of?) any satellite images which mayhelp to determine the water areas at the study sites (in high water and/or low waterseasons)
Herman Obtain kecamatan / desa maps from Bappeda, showing (1) village boundaries, (2) land useand (3) water features of Arang Arang and Dano Lamo; send to Sonny
Agus Obtain kecamatan / desa maps from Bappeda, showing (1) village boundaries, (2) land useand (3) water features of Desa Pedamaran VI and Benawa; send to Sonny
Andi Provide village maps for Kalbar sites from DSWR studies, showing waterbody areas etc.
Gill Net Data Entry
Sonny Train Agus how to send emails with attachments
Sonny Train Agus how to make backup copies of the database spreadsheets
Agus Develop coding system for fish species names, record in SppCode spreadsheet, and onlyuse one code for each species in gill net spreadsheets!
Agus Obtain all gill net data from Herman (Jambi) and Asmara (Sumsel), enter into spreadsheetdatabases. Send files after end of every three months (ie. after September 98, December98, March 99, June 99, September 99) as email attachments to Sonny, DH and AH. Alsosend copies of data sheets to AH at MRAG by post.
Agus Make backup copies every day of the database spreadsheets
Sonny Obtain all gill net data from Kalbar. Arrange for data entry (by Andi / Bogor assistant?)Send quarterly files and data sheet copies to Loka-PLM, DH and AH.
Water Depth Measurements and Data Recording / Entry
Herman Ensure depth gauge set up in Arang Arang, and depth information being collected
Agus Ensure depth gauge set up in Lebak Nilang (by PPL Rahman) by 10 August, pay extrath
Rp100,000 when complete
Agus Receive regular depth information from Arang Arang, Teluk Nilang, Teluk Rasau and enterinto gill net databases (check with Sonny that Herman will send data to Agus directly)
Agus Obtain depth information from Lubuk Lampan, and enter into special spreadsheet (with justcolumn of dates & column of water heights)
Agus Send Lubuk Lampan water height spreadsheet as email attachment to Sonny, DH & AH atsame times as gill net data (see below)
Historical Fishing Interview Data - Entry and Analysis
Agus Enter historical data for 4x Kalbar sites, Lebak Nilang and extra respondents from LautSekampung into spreadsheet format demonstrated by Ashley
Agus Send spreadsheets to DH & AH by email, and copies of data sheets by post

Page 44 Monitoring Programme Implementation Report CRIFI / Dinas Perikanan / MRAG
Sumsel Partial Biological MP - Lake Comparison Sites (Gill netting)
Achmad Make five more gill nets, using same materials as before. Distribute gill nets - 4 to each of7 main BMP sites, plus 4 to CRIFI Mariana for Partial BMP sites in Sumsel
Agus Discuss waterbodies in Lempuing River close to Teluk Rasau with Andri and other fishers,and decide which one is most suitable for comparison with Teluk Rasau (e.g. Lebung Sulit).Comparison site should have similar dry season water depth, area, and ecology to TelukRasau.
Agus Set 2 gill nets in Lebung Sulit, and other 2 gill nets in Teluk Gelam, for four nights per monthin each of September and October of 1998. Record data on standard gill net data formsand enter into spreadsheets SULITBS.XLS and TGELAMBS.XLS. Set nets on followingnights:
Lebung Sulit September 9, 16, 23, 29 October 7, 14, 21, 28 1998
Teluk Gelam September 10, 17, 24, 30 October 8, 15, 22, 29 1998
Agus If the flood arrives before October 29, finish the programme early
Agus Repeat the exercise in months August and September 1999
Sumsel Partial Biological MP - River Comparison Sites (Cast netting)
Agus Find out when Andri is fishing Ngubek Lubuk in Lubuk Lampam river sites, and go to LubukLampam to record catch from Ngubek Lubuk in normal fishing areas. Record catches usingstandard data form, from Lubuk Genali as ‘Posisi A’ in spreadsheet LLFLbBS.XLS and fromLubuk Bengkuang as ‘Posisi B’ in the same spreadsheet.
Agus Request Andri to also fish in CRIFI reserve Lubuk Gunung Isam, using exactly the samefishing effort as in the other two lubuks (e.g. both with same team of 7-10 cast netters fishingfor same length of time with the same nets). Record the catch from Gunung Isam inspreadsheet LLRLbBS.XLS.
Agus Send spreadsheet files by email to DH and AH, and copies of data sheets by post.
Agus Do cast netting programme in both 1998 and 1999, depending on water levels
5.3 Future Inputs and Responsibilities for the Socio-Economic MP
Setup of SEMP in West Kalimantan
Sonny Identify any differentiating issues (toman culture). Revise questionnaire. Identify sampleframe for each village. Stratify if necessary (jermal ownership?). Select respondents. TrainVCs and PC in data collection procedures, checking, reporting etc.
Test phase of SEMP
Sonny Develop data entry, back-up and file maintenance procedures.
Samuel Ensure that reporting schedules are not allowed to slip. Check and enter data as soon asit arrives, sending back queries as quickly as possible. Ensure that PCS are following upon group self-monitoring.
CRIFI / Dinas Perikanan / MRAG Monitoring Programme Implementation Report Page 45
Lelang units in South Sumatra
Samuel At the end of the season, attempt to obtain record books of self-monitoring groups. Ensurethat you understand the accounting system and contents as far as possible.
Sam/Son Analyse the record books of self-monitoring groups to develop a clearer understanding offinancial flows - revenues, expenditures, debts and repayments - which they document.
Samuel Return to enlist new lelang winners in self-monitoring programme following the auction.Obtain as much information as possible about the outcome of the auction.

Page 46 Monitoring Programme Implementation Report CRIFI / Dinas Perikanan / MRAG
Annex A: Fieldwork Itinerary
Wed 22 Jul Introductory meeting with CRIFI collaborators, CRIFI HQ, JakartaDiscussion of field activities and programme
Flight to Jambi
Thu 23 Jul Introductory meeting with Diskan Jambi collaborators, fieldwork planning
Fri 24 Jul Biological Monitoring Programme Implementation (BMPI) at Desa Arang Arang(Selecting and training enumerators; visiting waterbody; 1 gill net setting)st
Socio-economic Monitoring Programme Implementation (SEMPI) at Desa Arang-Arang.Fishermen interviews.
Sat 25 Jul BMPI at Desa Arang Arang (Hauling 1 gill nets; catch recording; historical interviews)st
SEMPI at Desa Arang-Arang. Obtaining HH lists. Leaseholder information. Sun 26 Jul Team meeting on MPI requirements and coordination
Mon 27 Jul Meeting with LIPI & Diskan to discuss studies in new Desa Dano Lamo reserve
BMPI at Desa Dano Lamo (discussing new reserve with villagers; historical interviews)
BMPI at Desa Arang Arang (2 gill net setting)nd
SEMPI at Desa Arang-Arang. Questionnaire design.
Tue 28 Jul BMPI at Desa Arang Arang (2 gill net hauling and catch recording; historicalnd
interviews)
SEMPI at Desa Arang-Arang. Questionnaire testing.
Team meeting on MP design and data analysis
Wed 29 Jul Write and translate Arang Arang Instruction Manuals, data forms and publicity posters
SEMPI at Desa Arang-Arang. HH sample selection. Questionnaire testing. Manualwriting.
Thu 30 Jul BMPI finalisation (deliver manuals etc) at Desa Arang Arang
SEMPI at Desa Arang-Arang. Fish trader interviews. Initial VC training.
Biological team travel to Sumsel by bus
BMPI Activities in Sumsel
Fri 31 Jul Introductory meeting with Diskan Sumsel collaborators, fieldwork planning
Sat 1 Aug Introductory meeting with Diskan OKI collaborators, fieldwork planning
BMPI at Teluk Rasau reserve, Pedamaran (selecting & training enumerators; visiting
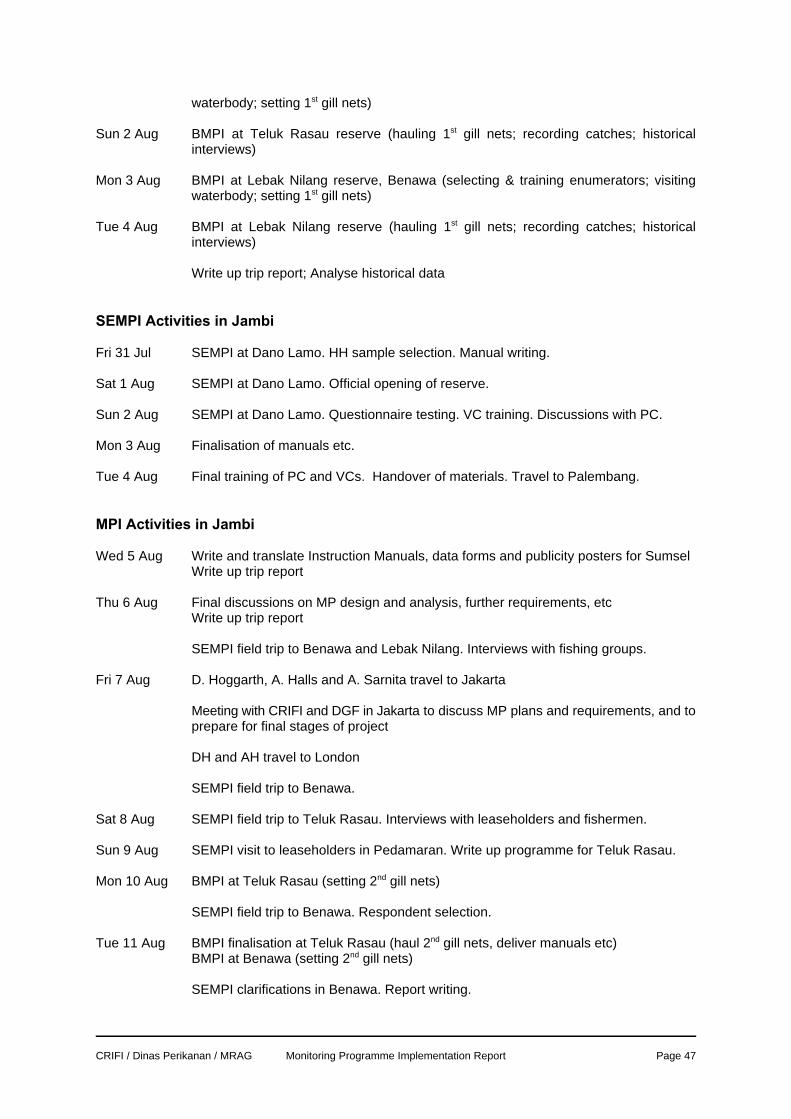
CRIFI / Dinas Perikanan / MRAG Monitoring Programme Implementation Report Page 47
waterbody; setting 1 gill nets)st
Sun 2 Aug BMPI at Teluk Rasau reserve (hauling 1 gill nets; recording catches; historicalst
interviews)
Mon 3 Aug BMPI at Lebak Nilang reserve, Benawa (selecting & training enumerators; visitingwaterbody; setting 1 gill nets)st
Tue 4 Aug BMPI at Lebak Nilang reserve (hauling 1 gill nets; recording catches; historicalst
interviews)
Write up trip report; Analyse historical data
SEMPI Activities in Jambi
Fri 31 Jul SEMPI at Dano Lamo. HH sample selection. Manual writing.
Sat 1 Aug SEMPI at Dano Lamo. Official opening of reserve.
Sun 2 Aug SEMPI at Dano Lamo. Questionnaire testing. VC training. Discussions with PC.
Mon 3 Aug Finalisation of manuals etc.
Tue 4 Aug Final training of PC and VCs. Handover of materials. Travel to Palembang.
MPI Activities in Jambi
Wed 5 Aug Write and translate Instruction Manuals, data forms and publicity posters for SumselWrite up trip report
Thu 6 Aug Final discussions on MP design and analysis, further requirements, etcWrite up trip report
SEMPI field trip to Benawa and Lebak Nilang. Interviews with fishing groups.
Fri 7 Aug D. Hoggarth, A. Halls and A. Sarnita travel to Jakarta
Meeting with CRIFI and DGF in Jakarta to discuss MP plans and requirements, and toprepare for final stages of project
DH and AH travel to London
SEMPI field trip to Benawa.
Sat 8 Aug SEMPI field trip to Teluk Rasau. Interviews with leaseholders and fishermen.
Sun 9 Aug SEMPI visit to leaseholders in Pedamaran. Write up programme for Teluk Rasau.
Mon 10 Aug BMPI at Teluk Rasau (setting 2 gill nets)nd
SEMPI field trip to Benawa. Respondent selection.
Tue 11 Aug BMPI finalisation at Teluk Rasau (haul 2 gill nets, deliver manuals etc)nd
BMPI at Benawa (setting 2 gill nets)nd
SEMPI clarifications in Benawa. Report writing.

Page 48 Monitoring Programme Implementation Report CRIFI / Dinas Perikanan / MRAG
Wed 12 Aug SEMPI report writing. Manual finalization and translation.
Thur 13 Aug SEMPI training of provincial staff and VCs. Travel to Jakarta.
Fri 14 Aug Meeting at CRIFI. Final briefing. MAT travels to London
MP Activity in Kalbar
Tue, 18 Aug Kalbar MP preparation in JakartaLeave Jakarta for PontianakArrival and book Hotel
Wed, 19 Aug Meet Kepala Diskan Kalbar Province, discuss brief plan of the Kalbar MPDiscuss Kalbar MP plan with Diskan Kalbar Province TeamArrange an appointment with KSDA
Thu, 20 Aug Preparing Biological and Socioeconomic QuestionnairesPreparing Biological and Socioeconomic ManualsDiscussion with KSDA (Erwin, should be Director of KSDA instead), for using
KSDA staff as VC and possibility of using KSDA facilities
Complete team arrival, preliminary discussion
Fri, 21 Aug Presentation at the Diskan Kalbar Province, discuss detail plan of who will do what andhowLeave Pontianak for Semitau
Sat, 22 Aug Arrive at SemitauPreliminary discussion with VCs (Bambang DW, KSDA staff, and Andi Erman)Arrangement of transportation to each selected siteOvernight in Semitau
Sun, 23 Aug Leave Semitau to KSDA TakenangPreliminary training to PC and VCsLeave Takenang to SekulatIntroductory meeting with Kepala DusunBiological and Socioeconomic MP in Sekulat
Mon, 24 Aug Continuing Biological and Socioeconomic MP in SekulatLeave Sekulat for Meliau
Tue, 25 Aug Introductory meeting with Kepala DusunBiological and Socioeconomic MP in Meliau
Wed, 26 Aug Continuing Biological and Socioeconomic MP in Meliau
Thu, 27 Aug Leave for Pulau MajangIntroductory meeting with Kepala Dusun, Ketua Adat and FishersBiological and Socioeconomic MP in Pulau Majang
Fri, 28 Aug Continuing Biological and Socioeconomic MP in Pulau MajangLeave for TengkidapIntroductory meeting with VC and GNFs of TengkidapBiological and Socioeconomic MP in Tengkidap
Sat, 29 Aug Continuing Biological and Socioeconomic MP in TengkidapLeave for Semitau
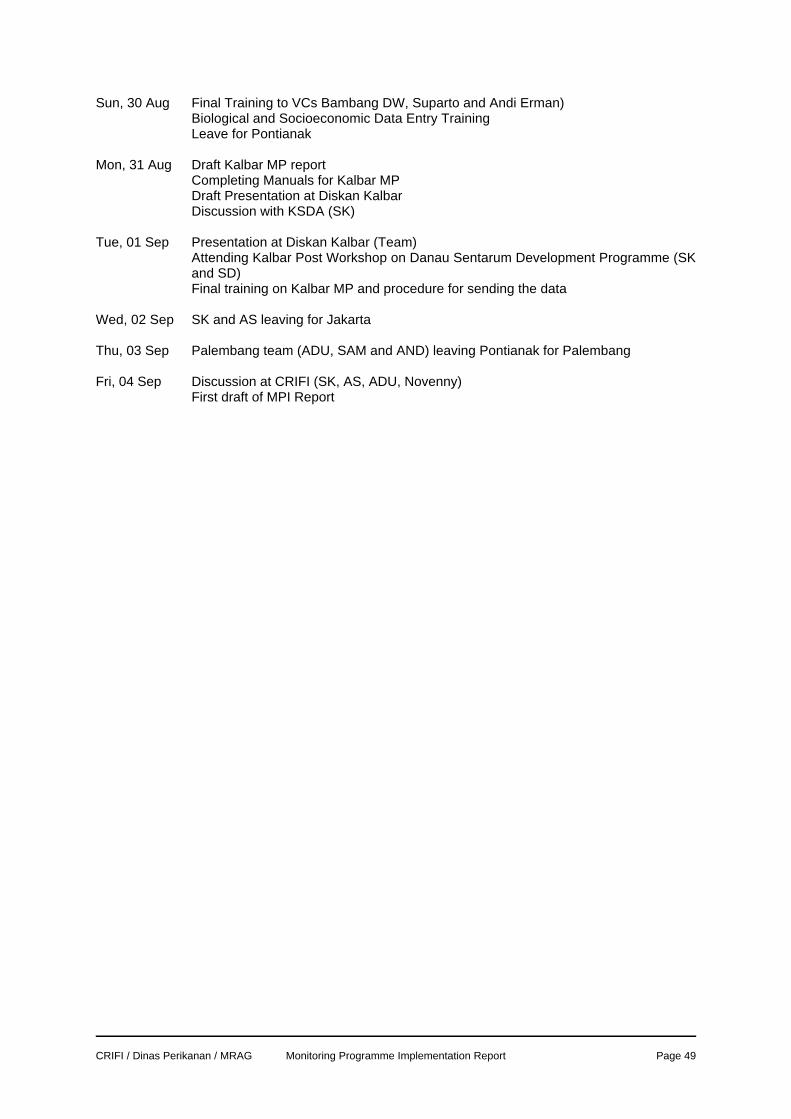
CRIFI / Dinas Perikanan / MRAG Monitoring Programme Implementation Report Page 49
Sun, 30 Aug Final Training to VCs Bambang DW, Suparto and Andi Erman)Biological and Socioeconomic Data Entry TrainingLeave for Pontianak
Mon, 31 Aug Draft Kalbar MP reportCompleting Manuals for Kalbar MPDraft Presentation at Diskan KalbarDiscussion with KSDA (SK)
Tue, 01 Sep Presentation at Diskan Kalbar (Team)Attending Kalbar Post Workshop on Danau Sentarum Development Programme (SKand SD)Final training on Kalbar MP and procedure for sending the data
Wed, 02 Sep SK and AS leaving for Jakarta
Thu, 03 Sep Palembang team (ADU, SAM and AND) leaving Pontianak for Palembang
Fri, 04 Sep Discussion at CRIFI (SK, AS, ADU, Novenny)First draft of MPI Report

Page 50 Monitoring Programme Implementation Report CRIFI / Dinas Perikanan / MRAG
Annex B: Example of BMP Instruction Manual (beforetranslation)
CRIFI / Dinas Perikanan / MRAG
DFID Project R7043:Selection Criteria and Co-Management Guidelines for
Harvest Reserves in Tropical River Fisheries
BIOLOGICAL MONITORING PROGRAMME
INSTRUCTION MANUAL
(DESA ARANG ARANG, JAMBI)
Objectives
The biological sampling programme is designed to provide simple indices of the state of fishstocks in reserves over a full 12 month hydrological cycle:
• The abundance of fish • The composition of fish stocks (by species and sizes of fish)
The abundance of fish (particularly during the dry season period) provides a measure of howeffective a particular reserve is at protecting brood stocks - a major factor determining catchesin the next year. The composition of the fish stocks and the average size of fish also providemeasures of the ‘health’ or state of fish stocks. The presence of large, high value species inthe catch indicates relatively low rates of exploitation compared to catches dominated by small,low value species.
These indices, together with the results of the interviews conducted on historical fishing trendsand the socio-economic survey will be used to roughly determine which types of reserve givethe greatest benefit to fishing communities.

CRIFI / Dinas Perikanan / MRAG Monitoring Programme Implementation Report Page 51
Sampling fish abundance
Fish abundance will be sampled in the reserves each month for a full year. Abundance will bemeasured by the average gillnet catch per night.
Setting the gill nets (and recording water height data)
Two fleets of gill nets (each comprising four sections of 40m x 2m gill nets with mesh sizes 1",2", 3.5" and 4.5" arranged in ascending order) should be set in the reserve on four days eachmonth, for the duration of the field study (approximately one year). Nets should be set at17.00hrs in the evening, and hauled the following morning at 0600hrs. The nets should be seton the 3 , 10 , 18 and 25 days of the month. If for any reason, the gill nets cannot be setrd th th th
on the specified day, then they should be set on the closest possible day before or after.
To ensure that the entire area of the reserve is sampled with the various mesh sizes, thereserve should be divided into 4 approximately equal size sampling sectors (Areas1- 4 in Figure1). At the start of each month (or every 4 weeks) the two fleets of gill nets should be setdiagonally across the reserve in Area 1 from opposite sides of the reserve banks. One of thefleets should be set in Position A with its smallest (S) mesh (1") net closest to the bank and thelargest (L) mesh net (4.5") furthest from the bank. The other fleet should be set with theopposite orientation (Position B) so that the largest mesh (L) is closest to bank and the smallestmesh (S) is furthest from bank (Figure 1).
Figure 1. Schematic map illustrating the position of the reserve in Danu Arang Arang, the foursampling sectors of the reserve, and the orientation and position (A,B,C...H) of fleets of gillnets.S-small (1") mesh net, L- large (4.5") mesh net.

Page 52 Monitoring Programme Implementation Report CRIFI / Dinas Perikanan / MRAG
In the second week the fleets of gill nets should be set in Area 2 in positions C and D, in thethird week in Area 3 in positions E and F and in the fourth week in Area 4 in positions G andH (Figure 1). This sampling procedure should be repeated in every month or four week period.
NB: Fish caught in each fleet of gill nets must be kept separate in the two plastic containersprovided before sorting, weighing and recording.
Before returning to village, the height of water within the reserve should be recorded from thegauge by the gillnet fishermen.
Sorting, measuring and recording gill net catches
Fish caught from each fleet of gillnets should be returned to the village and sorted by fishspecies or species group and size (above or below 30cm). For each fleet, species (or speciesgroup) and size group, the number of fish should be counted and the total weight measured bythe gillnet fishermen and recorded on the ‘Gillnet Catch Survey Form’ (Annex A) by the villagecoordinator, together with the following details: Date of sampling Village NameWaterbody nameTime gillnet setTime gillnet hauledGill net number (1 / 2)The position and orientation of the gill net (position A,B,C,....,H)Water height in reserve (m)
The village coordinator will also be responsible for collecting and recording (on the same form)the following additional information regarding recent weather and limnological conditions andfishing activities:
Rain during night of gill netting (yes/no)Wind during night of gill netting (none, light, strong)Fish kills due to ‘air banger’ since the last sample (yes/no)Illegal fishing in reserve since last sample (yes/no)
Gear monitoring and maintenance
It is the responsibility of the gillnet fishermen to remove weed and other debris from the netsafter each haul and to check for any damage or tares. Minor damage should be repaired bythe gillnet fishermen, but major damage should be reported to the village coordinator as soonas possible so that a replacement net can be arranged if necessary. The village coordinatoris also responsible for monitoring the condition of the nets each week.
Summary of duties and responsibilities
Gillnet fishermen
• Setting and hauling gillnets (and recovering catches) • Sorting, counting and weighing gillnet catches • Measuring water height in reserve • Removing weed and debris from gillnets and monitoring overall condition of gear

CRIFI / Dinas Perikanan / MRAG Monitoring Programme Implementation Report Page 53
• Minor repairs to gear • Reporting major damage to village coordinator
Village Coordinator
• Ensure that gillnet catches are correctly sorted, counted and weighed. • Recording gillnet catches and related climatic, limnological and illegal fishing activities. • Monitoring the condition and repair of fleets of gillnets
Provincial Coordinator
• Collection of 8 data sheets (2 nets, fished 4 times per month) from Village Coordinatorat end of month
• Checking of data quality and completion of form (no missing data etc) • Photocopying of data sheets • Posting copies of data sheets to CRIFI by 10 day of following monthth

Page 54 Monitoring Programme Implementation Report CRIFI / Dinas Perikanan / MRAG
Biological Monitoring Programme - Instruction Manual - Annex A
CRIFI / Dinas Perikanan / MRAG - River Fishery Reserves Project - 1998/99Biological Monitoring Programme - Gill Net Catch Survey Data Form.
Date: _________, Village: _______________, Waterbody: _____________
Gill Net Number: ____ (1 / 2), Setting Position in Reserve: _____ (A / B / C / D / E / F / G / H)
Time Gill Net Set: __________, Time Gill Net Hauled: ___________
Water Height in Reserve: ___________ (cm),
Rain Overnight?: ______ (Yes / No), Wind Overnight?: ___________ (None / Light / Strong)
Occurrence of fish kills due to ‘air bangar’ in reserve since last sample?: _______ (Yes / No)
Illegal fishing in reserve since last sample?: _______ (Yes / No)
Fish Species Fish caught (per night, per 1 x 160m of gill net)
Small fish (<30cm) Large fish (>30cm)
Number Weight (g) Number Weight (g)

CRIFI / Dinas Perikanan / MRAG Monitoring Programme Implementation Report Page 55
Annex C: Example of MP Publicity Poster (before translationinto Indonesian)
FISHING STUDY IN DESA ARANG ARANG
Over the next year, there will be a small study offishing in Desa Arang Arang. Once each week,two gill nets will be used in Danau Arang Arang,and around 15 households will be interviewedabout their catches. Outsiders will visit thevillage in July 1998 to set up the study. Theywill come again early next year to ask somemore questions about fishing.
How will this affect the village?
The village will be given a payment of households will be picked by lottery toRp1,000,000 at the start the study for using the be interviewed about their catches andreserve. Fish caught in the gill nets will be fishing costs each week. The resultsmade available for village people to eat. Two will show whether the village gets largefishermen from Arang Arang will be employed or small catches and profits from itsto set the gill nets in the lake. The weekly fishery. This may help to show whichinterviews with fishermen will be short and reserves are most useful to localsimple. people.
Why is this study being done? Who is doing the study?
The study will provide guidance on how to The study is being done by a collaborationmanage river fisheries in Indonesia to ensure between Indonesian fishing communities (you!),high catches. In particular, the project will CRIFI, Dinas Perikanan and MRAG (London).determine what is most important for the In Desa Arang Arang, a local person will beselection and management of river reserves to employed by the project as a ‘Villageensure the maximum long-term benefits to Coordinator’. Funding for the study wasfishing communities. provided by the United Kingdom Government’s
Where is the study being done?
The study will examine up to nine reserves inthree provinces: Kalimantan Barat, Jambi and When the study is completed, the results will beSumatra Selatan. In Jambi, studies will be analysed, and a set of guidelines will be written.made at Arang Arang and Dano Lamo villages These will help Dinas Perikanan to managein Kabupaten Batanghari. Some of the river fisheries using reserves and otherreserves were set up by government, while approaches, both in this area and otherothers were set up by local communities. Some provinces.are in lakes and some in rivers. Some ofreserves allow some types of fishing, whileothers are fully closed all year. The study willtry to find out what is important to make thesedifferent types of reserves most effective.
When is the study being done? village, or write to the Study Coordinator, Sonny
The Arang Arang studies will be conductedbetween August 1998 and September 1999. C Instalasi Penelitian Perikanan Air Tawar,
How will the study be done?
The study is in two parts:
C Two small scientific gill nets will befished inside the reserve once a week.The catches will show what types offish (and how many fish) live in eachtype of reserve.
C A group of around 15 fishing
Department For International Development.
After the study?
Your comments or ideas?
The researchers would welcome any commentsor ideas you may have about the study. Youmay either talk to the local Coordinator in your
Koeshendrajana at:
Jl. Sempur No. 1, Bogor